Article

Invasion of Winter Moth in New England: Effects of Defoliation and Site Quality on Tree Mortality

1
Department of Natural Resources and the Environment, University of New Hampshire, 114 James Hall, Durham, NH 03824, USA
2
USDA Forest Service, Northeastern Area State & Private Forestry, 271 Mast Road, Durham, NH 03824, USA
*
Author to whom correspondence should be addressed.
Forests 2014, 5(10), 2440-2463; https://0-doi-org.brum.beds.ac.uk/10.3390/f5102440
Submission received: 29 July 2014 / Revised: 15 September 2014 / Accepted: 28 September 2014 / Published: 13 October 2014

Abstract

:
Widespread and prolonged defoliation by the European winter moth, Operophtera brumata L., has occurred in forests of eastern Massachusetts for more than a decade and populations of winter moth continue to invade new areas of New England. This study characterized the forests of eastern Massachusetts invaded by winter moth and related the duration of winter moth defoliation estimated using dendrochronology to observed levels of tree mortality and understory woody plant density. Quercus basal area mortality in mixed Quercus and mixed QuercusPinus strobus forests in eastern Massachusetts ranged from 0–30%; mortality of Quercus in these forests was related to site quality and the number of winter moth defoliation events. In addition, winter moth defoliation events lead to a subsequent increase in understory woody plant density. Our results indicate that winter moth defoliation has been an important disturbance in New England forests that may have lasting impacts.

1. Introduction

Winter Moth in Massachusetts

Numerous invasions by forest pests have occurred in the north-eastern United States [1] and these invasions can have dramatic ecological [2] and economic [3] effects. Insect invasions in New England include European gypsy moth, Lymantria dispar L. [4], hemlock woolly adelgid, Adelges tsugae Annand [5], and Asian longhorned beetle, Anoplophora glabripennis Motschulsky [6], among several others. Winter moth, Operophtera brumata L. (Lepidoptera: Geometridae), is a recent addition to this suite of exotic pests and little is known about its impacts to invaded forests in New England.
Native to Europe, winter moth is an early-season, hardwood defoliator that feeds within expanding buds and on young, newly emerged leaves [7,8,9]. Winter moth was identified in Massachusetts in 2003 but is presumed to be responsible for high levels of defoliation in the region since the 1990s [10]. Populations of winter moth have been detected in Rhode Island, Connecticut, eastern Long Island New York, New Hampshire, and Maine [10] and outbreaks of defoliation have been noted within these areas. The expanding winter moth invasion is now similar to the escalating invasion of European gypsy moth in New England during the early 1900s [11]. In eastern Massachusetts, winter moth may now dominate the spring defoliator complex that includes fall cankerworm (Alsophila pometaria Harr), spring cankerworm (Paleacrita vernata Peck), Bruce spanworm, (O. bruceata Hulst), forest tent caterpillar (Malacosoma disstria Hübner), and European gypsy moth (Lymantria dispar L.).
In its native range, winter moth occurs as an outbreak species responsible for elevated levels of defoliation on a cyclic basis [9,12]. Winter moth has a history of invasion in North America, with accidental introductions into Nova Scotia, Canada in the 1930s [7] and British Columbia, Canada and Oregon and Washington, USA in the 1970s [13,14]. Although winter moth is a polyphagous feeder, host preference and defoliation intensity are influenced by the level of synchrony between egg hatch and budburst [8,15,16]. In Nova Scotia, Quercus rubra L. has been cited as a principal host [17] and this trend has been observed in Massachusetts as well. Winter moth has been an important defoliator of Quercus forests in England [8,18] and Nova Scotia [19] and outbreaks have recently occurred in mixed hardwood forests of eastern Fennoscandia [20].
Winter moth defoliation reduced host tree radial growth in Europe [18,20] and Nova Scotia [19] and also increased mortality of Q. rubra trees in Nova Scotia [7,19]. In eastern Massachusetts, winter moth defoliation caused a reduction in radial growth of individual Q. rubra and Q. velutina Lam. trees [21]. Radial growth [22,23] and defoliation [24] can be used as predictors of tree mortality, indicating that winter moth defoliation may increase tree mortality in forest stands. Insect defoliation may alter the trajectory of forest stand dynamics through the creation of canopy gaps via tree mortality [25,26]. Canopy disturbance and gap formation following insect defoliation can facilitate understory plant establishment and/or growth. For example, defoliation outbreaks by forest tent caterpillar, Malacosoma disstria Hübner, and spruce budworm, Choristoneura fumiferana Clemens, have contributed to the establishment of multiple cohorts of tree species in mixed-Populus tremuloides Michx. forests [26]. Likewise, gypsy moth defoliation has facilitated understory growth [25,27,28].
To date, invaded forests in New England have not, as yet, been characterized as to tree species composition and structure and no studies have documented the impact of winter moth defoliation on forest stand level mortality in New England. In this study, we used tree core analysis of host and non-host tree species in several forests in eastern Massachusetts to document stand-level effects of this novel winter moth invasion. The specific objective of this study was to relate tree radial growth chronologies, stand-level tree mortality, and understory plant density to winter moth defoliation and site quality. Specific research questions addressed included: (1) Does winter moth defoliation influence mortality of dominant/codominant Quercus? (2) Is mortality of dominant/codominant Quercus mitigated by increased site quality (i.e., Quercus site index)? (3) Does winter moth defoliation influence understory plant density?

2. Methods

2.1. Study Region

The tree species composition and climate of eastern North America offer suitable habitat for winter moth [10,29]. Eastern Massachusetts represents the oldest and best documented case of winter moth infestation in the eastern United States. One of the most developed portions of New England [30], eastern Massachusetts is a heterogeneous landscape of urban areas, undeveloped private lands, and state, municipal, and private forests. These forests are most often on post-agricultural land and dominated by Quercus spp., Acer spp., and Pinus spp. [31]. Soil orders of this region include Inceptisols and Entisols formed on sedimentary and granitic bedrock ranging from mafic to acidic [31].

2.2. Study Sites

In 2010 we used aerial detection survey (ADS) maps (years 2004–2010) to locate areas in Massachusetts known to have been defoliated in recent years. We also conferred with personnel from the Massachusetts Department of Conservation and Recreation (MA-DCR) and University of Massachusetts-Amherst to identify areas of known winter moth defoliation. Once sites with a history of winter moth presence were identified, we selected 13 sites that met the following criteria: (1) were located on state or municipal forests; (2) were on upland soils; (3) had a major hardwood component; (4) were discreet forest stands with clear boundaries; and (5) collectively assured representation of all geographic areas within the defoliated region.

2.3. Vegetation Sampling

Forest stand surveys were conducted within each site. Fixed-radius (12 m) plots were established to sample forest stand composition and structure. Tree species, status as live or dead, and diameter at breast height (dbh, 1.4 m) were recorded for each tree ≥7.5 cm dbh. In order to roughly age mortality at each site, standing dead trees (i.e., snags) were classified using the five-class decay models presented by Thomas [32]. Nested 1 m circular plots, located in the four cardinal directions at six meters from the plot center, were established to sample tree and shrub saplings (<7.5 cm dbh) and seedlings (<1.4 m tall). These tree and shrub estimates were combined for one total measure of understory woody plant density in each 12 m plot.
Total live and dead basal area, basal area by species per hectare, and total stem density by species per hectare were calculated. In addition, the percentages of live and dead canopy trees were calculated. The combined percentage of Q. rubra and Q. velutina basal area in dead stems was calculated for each site as a potential metric of winter moth defoliation impact. These two species were chosen based on our observations that they were the primary species fed upon by winter moth in forested settings. Our study focused on defoliation impacts to trees in the dominant/co-dominant canopy stratum. To capture this, we used percentage of basal area in dead stems as a metric of tree mortality instead of percentage of total trees in dead stems as the former is more heavily weighted towards larger diameter trees typical of mature overstory strata.

2.4. Determination of Winter Moth Presence

Winter moth trapping studies were implemented in late fall/early winter 2010/2011 to confirm the presence of winter moth at the study sites. Two sticky band traps (Bug Barrier Tree Band; Envirometrics Systems, Inc. Victor, NY, USA) were placed around the bole at approximately 1.0 and 1.3 m above the ground on one to three overstory (dominant or codominant) trees within each site to trap adult females as they emerged from the soil organic layer and migrated up tree boles for oviposition. The occurrence in the late-fall of these flightless females in the sticky band traps confirms the presence of winter moth within the stand during the previous growing season. Due to similarities in life history, these traps are also effective at trapping native members of the spring defoliator guild including fall cankerworm and Bruce spanworm, and the presence of these insects was noted as well.

2.5. Dendrochronology

Tree core analysis was used to relate radial growth chronologies to winter moth defoliation and to estimate the frequency of winter moth activity in each site. At each study site, one radial increment core was extracted from each of 30 overstory (dominant or codominant crown classes) host trees (Q. rubra/Q. velutina), and 30 overstory non-host trees (P. strobus L.), when available. Non-host P. strobus were cored to serve as a reference in the assessment of winter moth effects on host species radial growth. Trees were selected systematically such that the core samples provided an accurate stand-level representation of tree radial growth. Cores were labeled in the field and returned to the lab for preparation and analysis. In total, 787 (Q. rubra = 227; Q. velutina = 167; P. strobus = 311) trees were cored from the 13 study sites. As per Simmons et al. [21], Q. rubra and Q. velutina were combined for radial growth analyses and are herein referred to as Quercus when applied to tree core and mortality results, as these two species are both in the Erythrobalanus subgenus and can hybridize [33]. Although Q. alba L. was present at some of the study sites, this species did not occur in sufficient numbers across all sites to be included in radial growth analyses.
Increment cores were dried, glued to wooden mounts and, to facilitate reading, smoothed with increasingly finer sandpaper, finishing with a 600-grit. Cores were aged and measured to the nearest 0.001 mm using a dissecting microscope in combination with a Velmex measurement system (Velmex, East Bloomfield, NY, USA) and Measure J2X v. 4.1.2 software (VoorTech Consulting, Holderness, NH, USA). Cores were subsequently cross-dated using event years [34,35] displayed on scatterplots created in MS Excel® (Microsoft Inc., Redmond, WA, USA). Cross-dating and measurement accuracy were assessed using the program COFECHA [36].
A ring-width index (RWI) was calculated for each tree so as to remove any growth trends associated with tree age, following procedures outlined by Bunn [37]. A modified negative exponential curve was fit to the raw ring width data for each core series using the dplR computer package [37] within the R statistical program [38]. Data were then detrended within dplR by dividing the annual raw ring widths by the predicted values estimated by the modified negative exponential curve. Quercus and P. strobus radial growth chronologies were constructed for each site using the average of all the RWI values for each species per site. Region-wide Quercus and P. strobus chronologies were constructed by pooling all Quercus and P. strobus RWI chronologies from all sites.
Dendrochronology was also used to age individual Quercus mortality at one of the 13 study sites. For this, we selected the site with the highest percentage of Quercus basal area in dead stems and felled 10 snags and extracted a cross-sectional disk at 1.3 m above the ground. These disks were dried and sanded with progressively finer sandpaper, as above. Three radii per disk, at least 60° from each other, were selected for measurement of annual radial growth ring widths using a Velmex measurement system and Measure J2X software. These three radii were not averaged, but served as replicates to assist in cross-dating.
Once measured, the three radii per tree were visually “cross-dated” based on within-tree growth patterns using scatterplots in Microsoft Excel®. Next, we assigned calendar years to the radial growth measurements of the radii by cross-dating them with event years determined by the live tree core analysis at the study site in order to assign a year of mortality for the tree from which the disks were extracted. Correlation analysis (JMP® Pro 10.0.0 software; SAS Institute Inc., Cary, NC, USA) was used to investigate the relationship between snag class and years since mortality. Four of the 10 disks were excluded from analysis due to ambiguity in cross-dating.

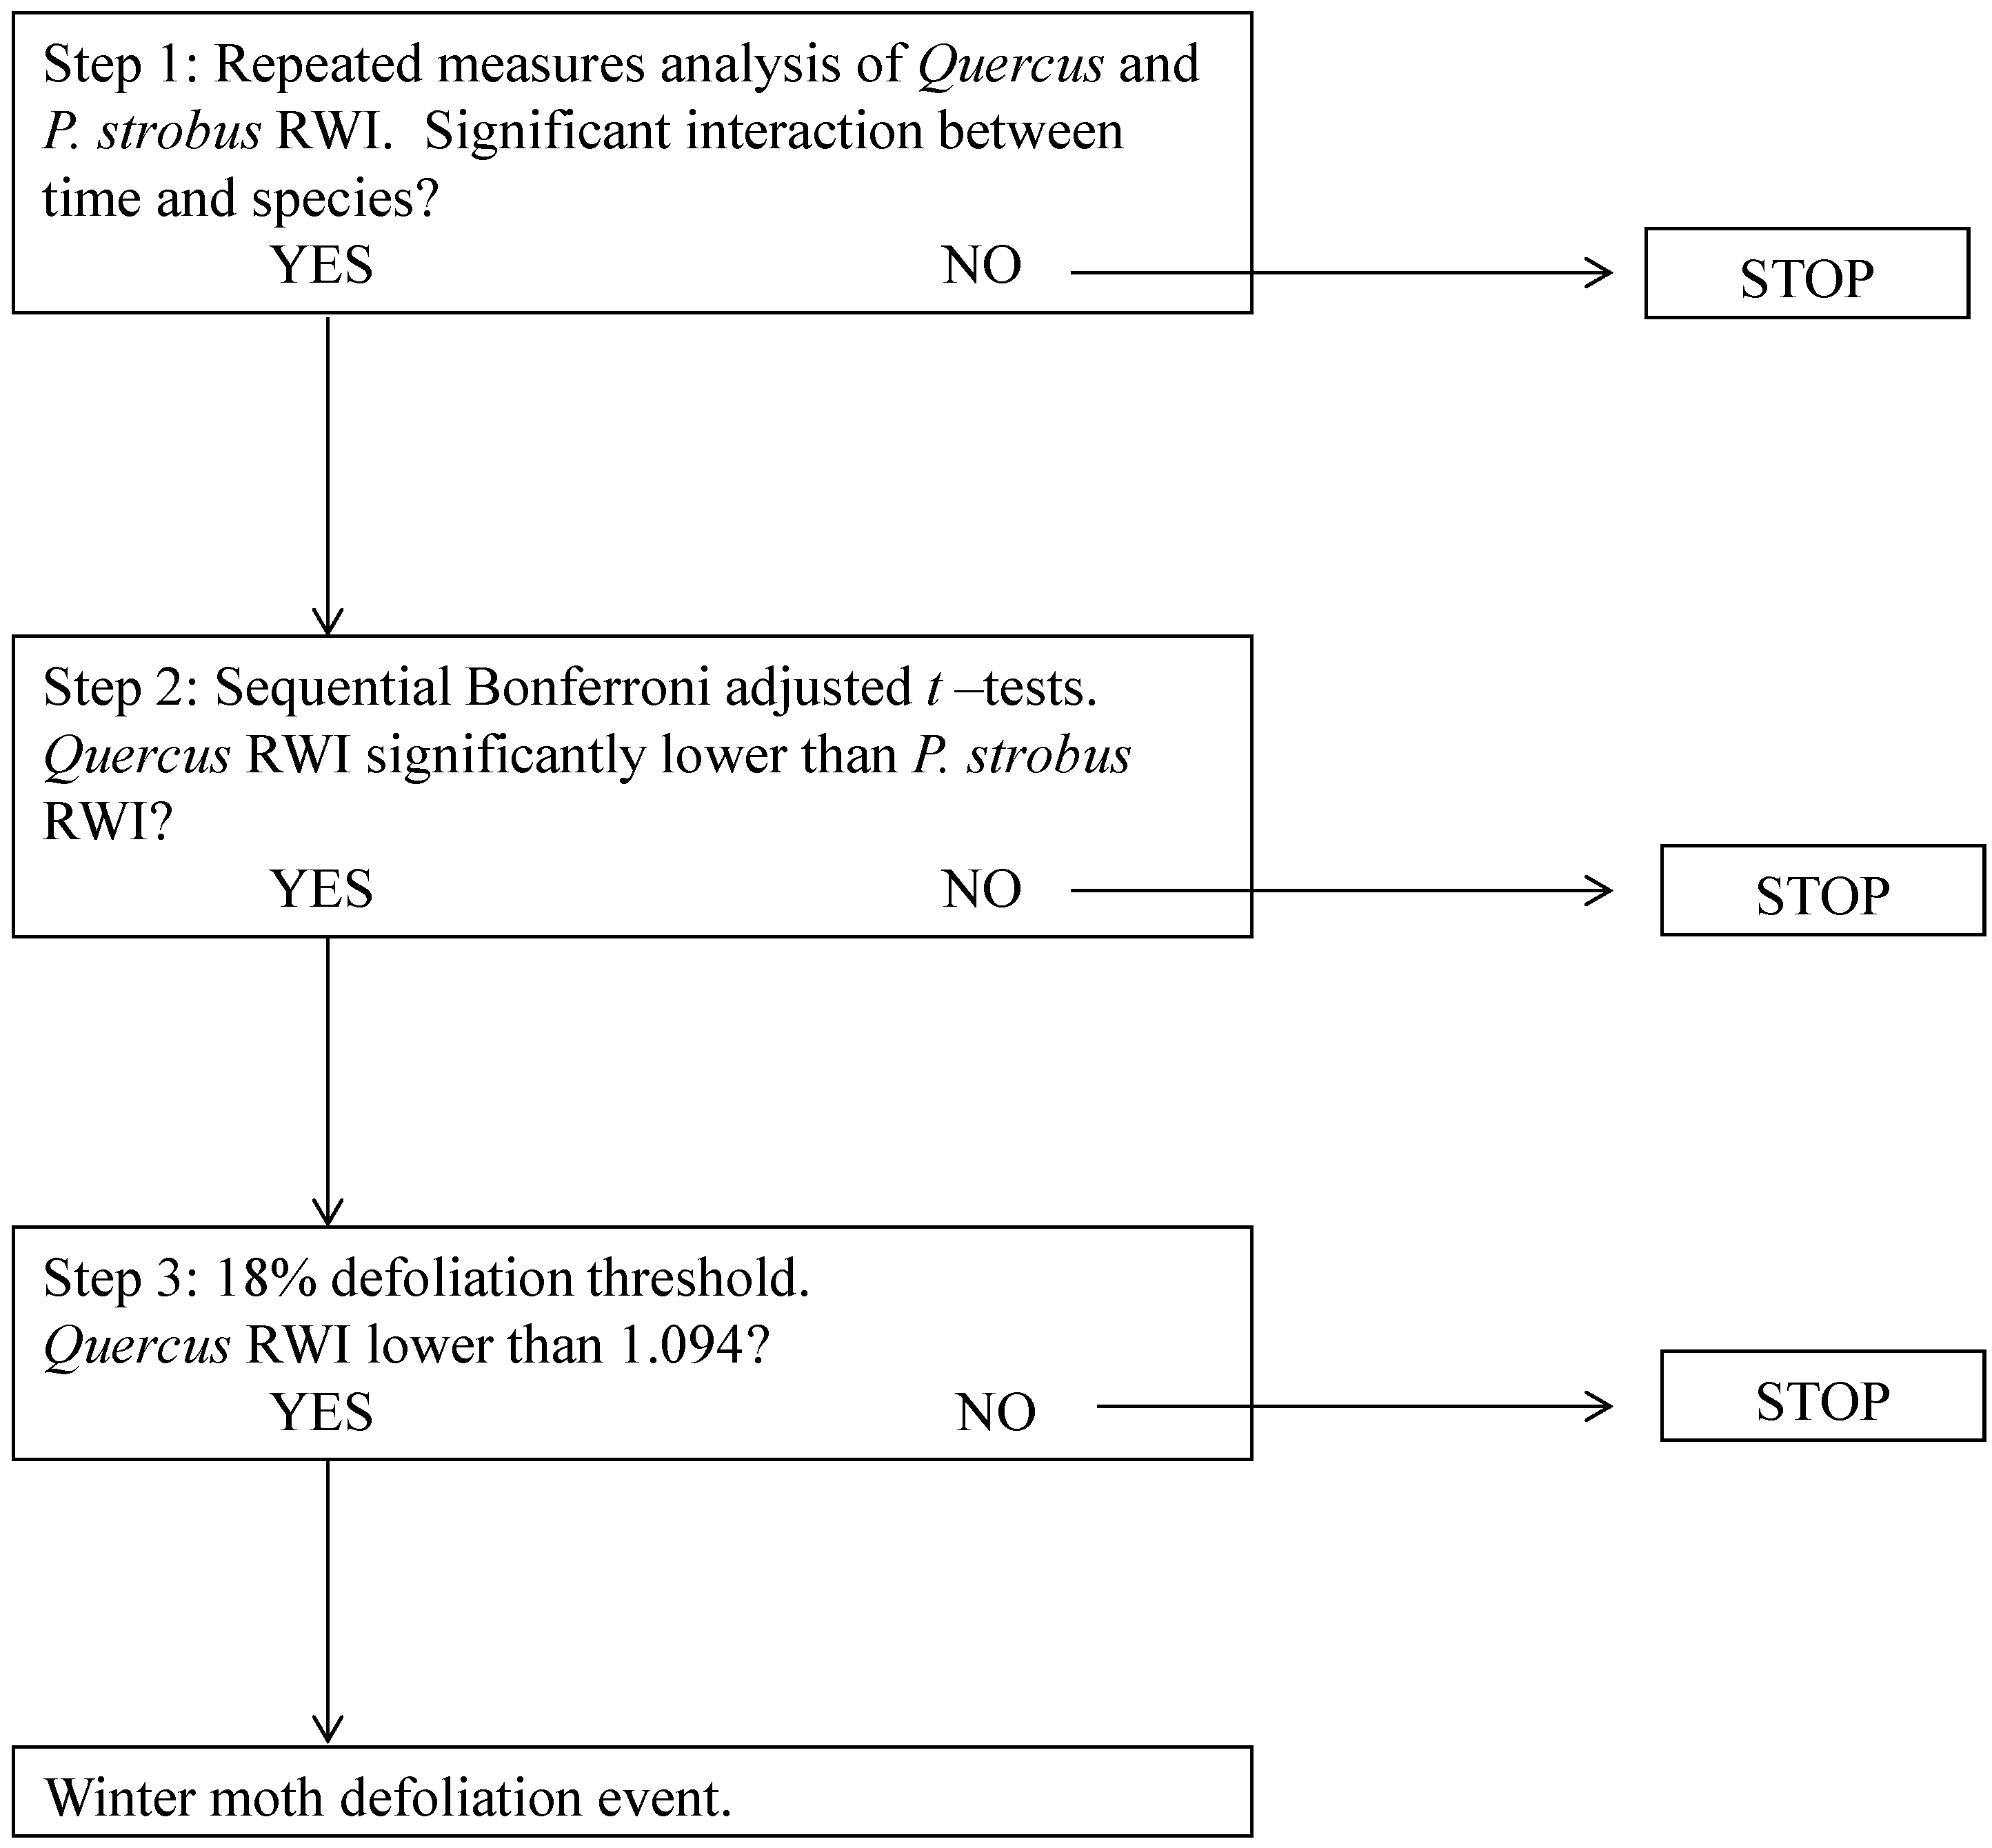
2.6. Defining Winter Moth Activity

Similar to Tikkanen and Roininen [20], three criteria (Figure 1) were used to identify winter moth activity region-wide (all 13 sites) and at individual sites. First, repeated measures analysis was used to test for divergence between Quercus and P. strobus RWI chronologies across all 13 sites (region-wide) and within each individual site from the years 1980–2010, as indicated by the Greenhouse-Geisser Epsilon univariate test of the interaction between time (year) and species (JMP® Pro 10.0.0 software; SAS Institute Inc.). For the region-wide chronologies, we pooled all Quercus and P. strobus RWI chronologies by species for each of the 13 sites. For the individual site analyses, we pooled and tested the individual tree chronologies for each species by site. The year 1980 was chosen as the starting point of analysis due to the widespread gypsy moth defoliation event that occurred in 1981 in which both Quercus and P. strobus were heavily defoliated. By incorporating this event into the radial growth analyses of winter moth activity, we were able to start the analyses from a point at which both species were affected by the same limiting factor.
As the second criterion of determining winter moth activity, one-sided t-tests were used to identify individual years of divergence in which Quercus RWI was significantly lower than P. strobus RWI; these tests were performed a posteriori on Quercus and P. strobus RWI chronologies that differed significantly, as determined by the above repeated measures analysis. The significance level (α) of these t-tests was calculated using the sequentially rejective, Bonferroni-adjustment [39,40]. As the winter moth invasion is believed to have initiated in the early- to mid-1990s, the domain of the t-tests was from the years 1995–2010, inclusive. The year 1995 was chosen as the beginning of individual year analyses as this year incorporates much of the (presumed) early winter moth invasion. As such, the adjusted alpha for each set of divergences was calculated, beginning with the lowest p-value and working successively towards the highest p-value, as: α/n; α/(n−1); α/(n−2);…α/1, where alpha (α) = 0.05 and n = the number of individual t-tests (n = 16 for the years 1995–2010).
Figure 1. Winter moth defoliation event criteria decision tree.
Forests 05 02440 g001
Finally, the third criterion of winter moth activity required that the Quercus RWI value fall below a critical threshold of 1.094 in the individual years in which Quercus RWI was significantly lower than P. strobus RWI. This threshold was determined using the regression equation for current year winter moth defoliation and Quercus RWI provided in Simmons et al. [21], as follows. The defoliation level at which the upper 95% confidence interval of Quercus RWI was equal to the y-intercept value of the regression was calculated using JMP® Pro 10.0.0 software. This value (17.0%) represents the threshold above which Quercus RWI was negatively affected by winter moth defoliation; below this value Quercus RWI was not significantly different from the y-intercept value of 1.202 (the expected RWI value of Quercus not influenced by winter moth defoliation). This value was calculated as approximately 17.0%; thus, a threshold defoliation percentage for identifying winter moth activity was set at 18%, which equals a RWI threshold value of 1.094. Thus, criterion three was satisfied when individual year Quercus RWI values fell below 1.094.
Individual years that met these three criteria (Figure 1) were defined as years of elevated winter moth defoliation. Subsequently, winter moth activity (per site and across all 13 sites) was quantified by the number of elevated defoliation events within the 1995–2010 period and these were entered as a covariate predictor into multiple regression models explained below.

2.7. Percentage of Quercus Basal Area Consisting of Dead Stems

We hypothesized that the percentage of Quercus basal area consisting of dead stems estimated from our vegetation surveys was positively related to number of elevated winter moth defoliation events (Number of WM Defoliation Events), Stand Relative Density (RD, a surrogate for competition), and Quercus Site Index (SI, a metric of site quality). Stand relative density estimates were calculated for each site using the method developed and outlined by Ducey and Knapp [41] for mixed species forests of the northeastern US. Specifically, relative density (RD) was calculated per hectare by the summation of individual, live tree relative density values as calculated by:
RD = Σ (0.00015 + 0.00218SGi) (DBHi/25)1.6
where SG = the specific gravity of individual tree species, as provided in Ducey and Knapp [41].
Quercus site index (SI) for each stand was calculated by plotting total height estimates of dominant and/or co-dominant crown class Quercus trees from the vegetation surveys versus Quercus age, as estimated from tree core analyses, on the Upland Oaks Site Index Curves by Olson [42] (in Carmean [43]).
Multiple regression was used to determine which explanatory variables (Number of WM Defoliation Events; Stand Relative Density; Quercus Site Index) had the greatest effect on the response variable Percent of Quercus Basal Area in Dead Stems (i.e., the percentage of Quercus basal area consisting of dead stems, as defined above). Variance inflation factors (VIF) were used to test for multicollinearity of regressors and Studentized residuals were calculated and plotted to test for normality of variables and the presence of outliers. Subsequently, Percent of Quercus Basal Area in Dead Stems (in proportional form) was arcsin square root transformed. Statistical analyses were performed using JMP® Pro 10.0.0 software (SAS Institute Inc., Cary, NC, USA).
To evaluate the strength of the potential relationships between the above variables, model selection for Percent of Quercus Basal Area in Dead Stems (arcsin square root) was performed using the corrected Akaike Information Criterion (AICc) value [44]. The model with the lowest AICc value was considered the “best” model, however, models with ΔAICc values less than or equal to four (relative likelihood ≥0.135) were considered candidate models. Evidence ratios were calculated for each model within the set of candidate models and were used to evaluate and identify the model(s) that best explained Percentage of Quercus Basal Area in Dead Stems [44].

2.8. Understory Density

Multiple regression was also used to test the influence of Stand Relative Density and Number of WM Defoliation Events on the density of understory tree and shrub seedlings and saplings, as estimated from the vegetation surveys. Tree and shrub seedling and sapling densities from all plots in each stand were pooled together for one overall understory density variable which is herein referred to as Understory Density.

2.9. Drought

To evaluate the suitability of P. strobus as a control species and to test if drought events influenced radial growth during the 1980–2010 time period, bootstrapped correlation and response functions were calculated (individually) between the region-wide Quercus and P. strobus chronologies and the monthly (May through September) Massachusetts statewide Palmer Drought Severity Index (PDSI) values from the National Oceanic and Atmospheric Administration (NOAA) [45] using the DENDROCLIM2002 software package [46]. DENDROCLIM2002 calculates, and tests the significance (α = 0.05) of correlation and response coefficients using 1000 bootstrapped samples [46]. Bootstrapped correlation and response functions were calculated for the entire time period from 1980–2010 and the (presumed) pre-winter moth time period (1980–1995). For comparative purposes, a PDSI value of 0.0 is considered normal moisture conditions; a PDSI of −2.0 suggests moderate drought conditions and PDSI of +2.0 suggests moderately wet conditions [47].

3. Results

3.1. Study Sites

All 13 study sites were dominated by Q. rubra, Q. velutina, P. strobus, and Acer rubrum L. in various mixtures and size classes (Table 1). Sites varied in total live and dead stem densities and basal area, as well as percentage of overstory trees characterized as live or dead. Total stem density of live and dead Quercus varied between sites and Quercus quadratic mean diameter ranged from 23.5 (± 0.8) to 39.6 (± 1.8) cm (Table 1). Understory woody plant density ranged from 11,306–261,313 stems per hectare (Table 1). The topography of most sites was flat to gently rolling. Size-class (diameter) distribution varied among sites, with sites demonstrating either uni-modal, bi-modal, right-skewed, or rotated-sigmoidal distributions.
Table 1. Name, location, Quercus density and quadratic mean diameter (DBH), and understory woody plant density of 13 winter moth study sites, eastern Massachusetts; TF = town forest; SR = state reservation; SP = state park; TP = town park; CA = conservation area; SF = state forest.
SiteLocationQuercus Density (stems/ha)Quercus Mean DBH (cm)Understory Plant Density
Amesbury TF42°51′ N; −70°58′ W 315.232.3 ± 1.335,230
Blue Hills SR42°13′ N; −71°07′ W 245.325.9 ± 1.1261,313
Borderland SP42°04′ N; −71°10′ W344.423.5 ± 0.8136,943
Bradley Palmer SP 42°39’N; −70°54′ W114.933.7 ± 2.895,226
Centennial Park42°18′ N; −71°16′ W237.435.9 ± 1.342,794
Great Brook Farm SP42°33′ N; −71°21′ W177.037.0 ± 1.551,524
Iron Rail42°36′ N; −70°51′ W271.032.7 ± 2.248,168
Lockwood TF42°38′ N; −70°59′ W141.436.5 ± 1.860,830
Profile Rock SP41°48′ N; −71°03′ W140.039.5 ± 2.9112,795
Turkey Hill CA42°41′ N; −70°52′ W78.739.6 ± 1.859,600
Wildcat CA42°41′ N; −71°01′ W309.427.8 ± 0.711,306
Willowdale SF42°40′ N; −70°54′ W201.537.2 ± 2.1155,749
Wompatuck SP42°13′ N; −70°52′ W248.429.3 ± 0.892,554
Across all 13 sites, the age of Quercus in the overstory ranged from 59–106 years and P. strobus ranged from 53–107 years (Table 2). Quercus site index (SI) and stand relative density (RD) values differed among sites, as did the percentage of Quercus basal area in dead stems. Quercus site index values ranged from 46–77; stand relative density values ranged from 0.60–0.88 (60%–88%) (Table 2). The percentage of Quercus basal area in dead stems ranged from 0%–30% among the 13 study sites (Table 2). Of this mortality, seven sites had greater than 60% of the snags in more recent snag classes 1–3 (Figure 2).
Table 2. Quercus site index values, stand relative density, Quercus and P. strobus mean age, percentage of Quercus basal area in dead stems, and number of winter moth defoliation events, as determined by dendrochronology at 13 study sites, eastern Massachusetts; SI = site index; RD = relative density.
SiteQuercus SIStand RDQuercus AgeP. strobus Age% Quercus in Dead StemsYears and # of WM Def. Events
Amesbury TF770.8376866%1999; 2001 (2)
Blue Hills SR450.76858418%2008–2010 (3)
Borderland SP500.691066812%2006; 2008-2010 (4)
Bradley Palmer SP 660.848910728%2007–2010 (4)
Centennial Park650.8689654%0
Great Brook Farm SP710.7495812%1996; 2005 (2)
Iron Rail TP720.7159535%0
Lockwood TF620.6089780%2001; 2010 (2)
Profile Rock SP600.8194643%2005 (1)
Turkey Hill CA650.7167844%0
Wildcat CA660.6072857%0
Willowdale SF680.8890894%2008-2010 (3)
Wompatuck SP460.61978930%2000; 2008 (2)
Figure 2. Percentages of dead trees grouped by snag classes 1–3 (black bars) and snag classes 4 and 5 (gray bars) at all 13 sites in eastern Massachusetts; ATF = Amesbury Town Forest; BH = Blue Hills State Reservation; BSP = Borderland State Park; BP = Bradley Palmer State Park; CP = Centennial Park; GBF = Great Brook Farm State Park; IR = Iron Rail Town Park; PR = Profile Rock State Park; TH = Turkey Hill Conservation Area; WDC = Wildcat Conservation Area; WIL = Willowdale State Forest; WOM = Wompatuck State Park.
Forests 05 02440 g002
Presence/absence trapping studies were conducted at nine of the study sites and winter moth was present at each of these sites in varying abundances. Bruce spanworm was not trapped at any site and a limited number of fall cankerworm individuals were present on traps at five sites. Winter moth presence was confirmed at the additional four sites by interviews with Massachusetts DCR personnel and/or previous/tangential trapping studies [11].

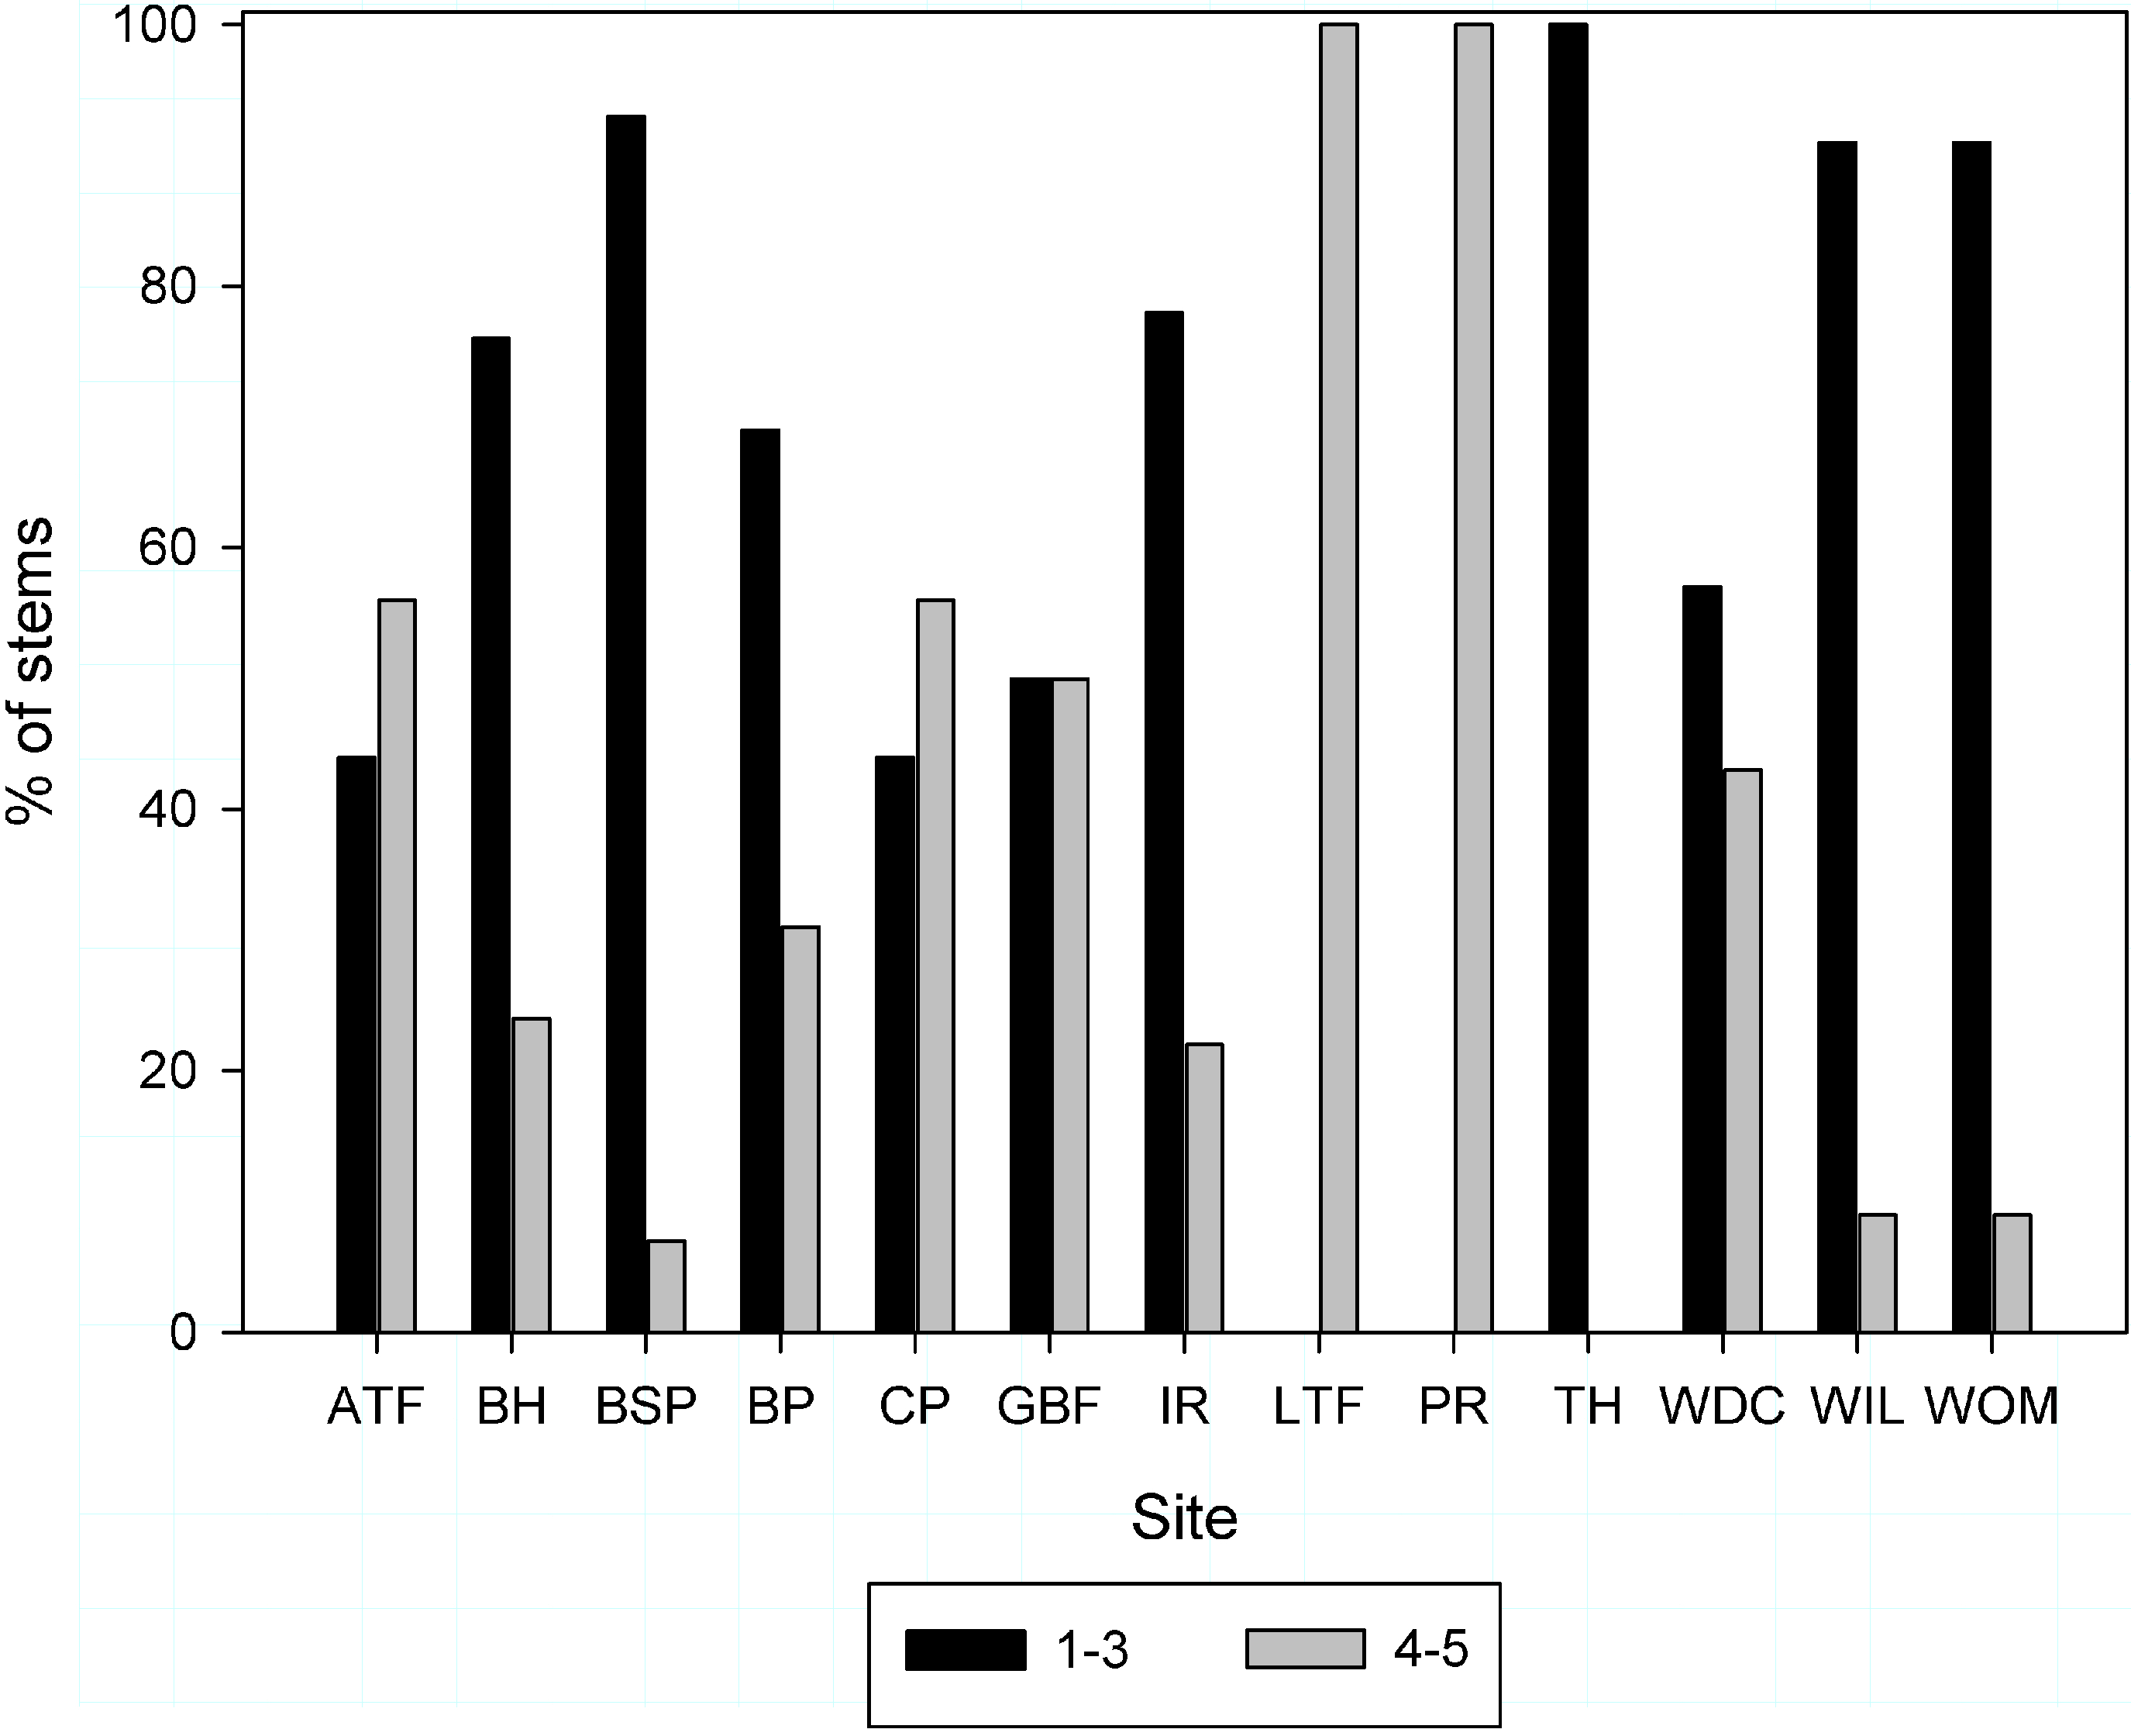
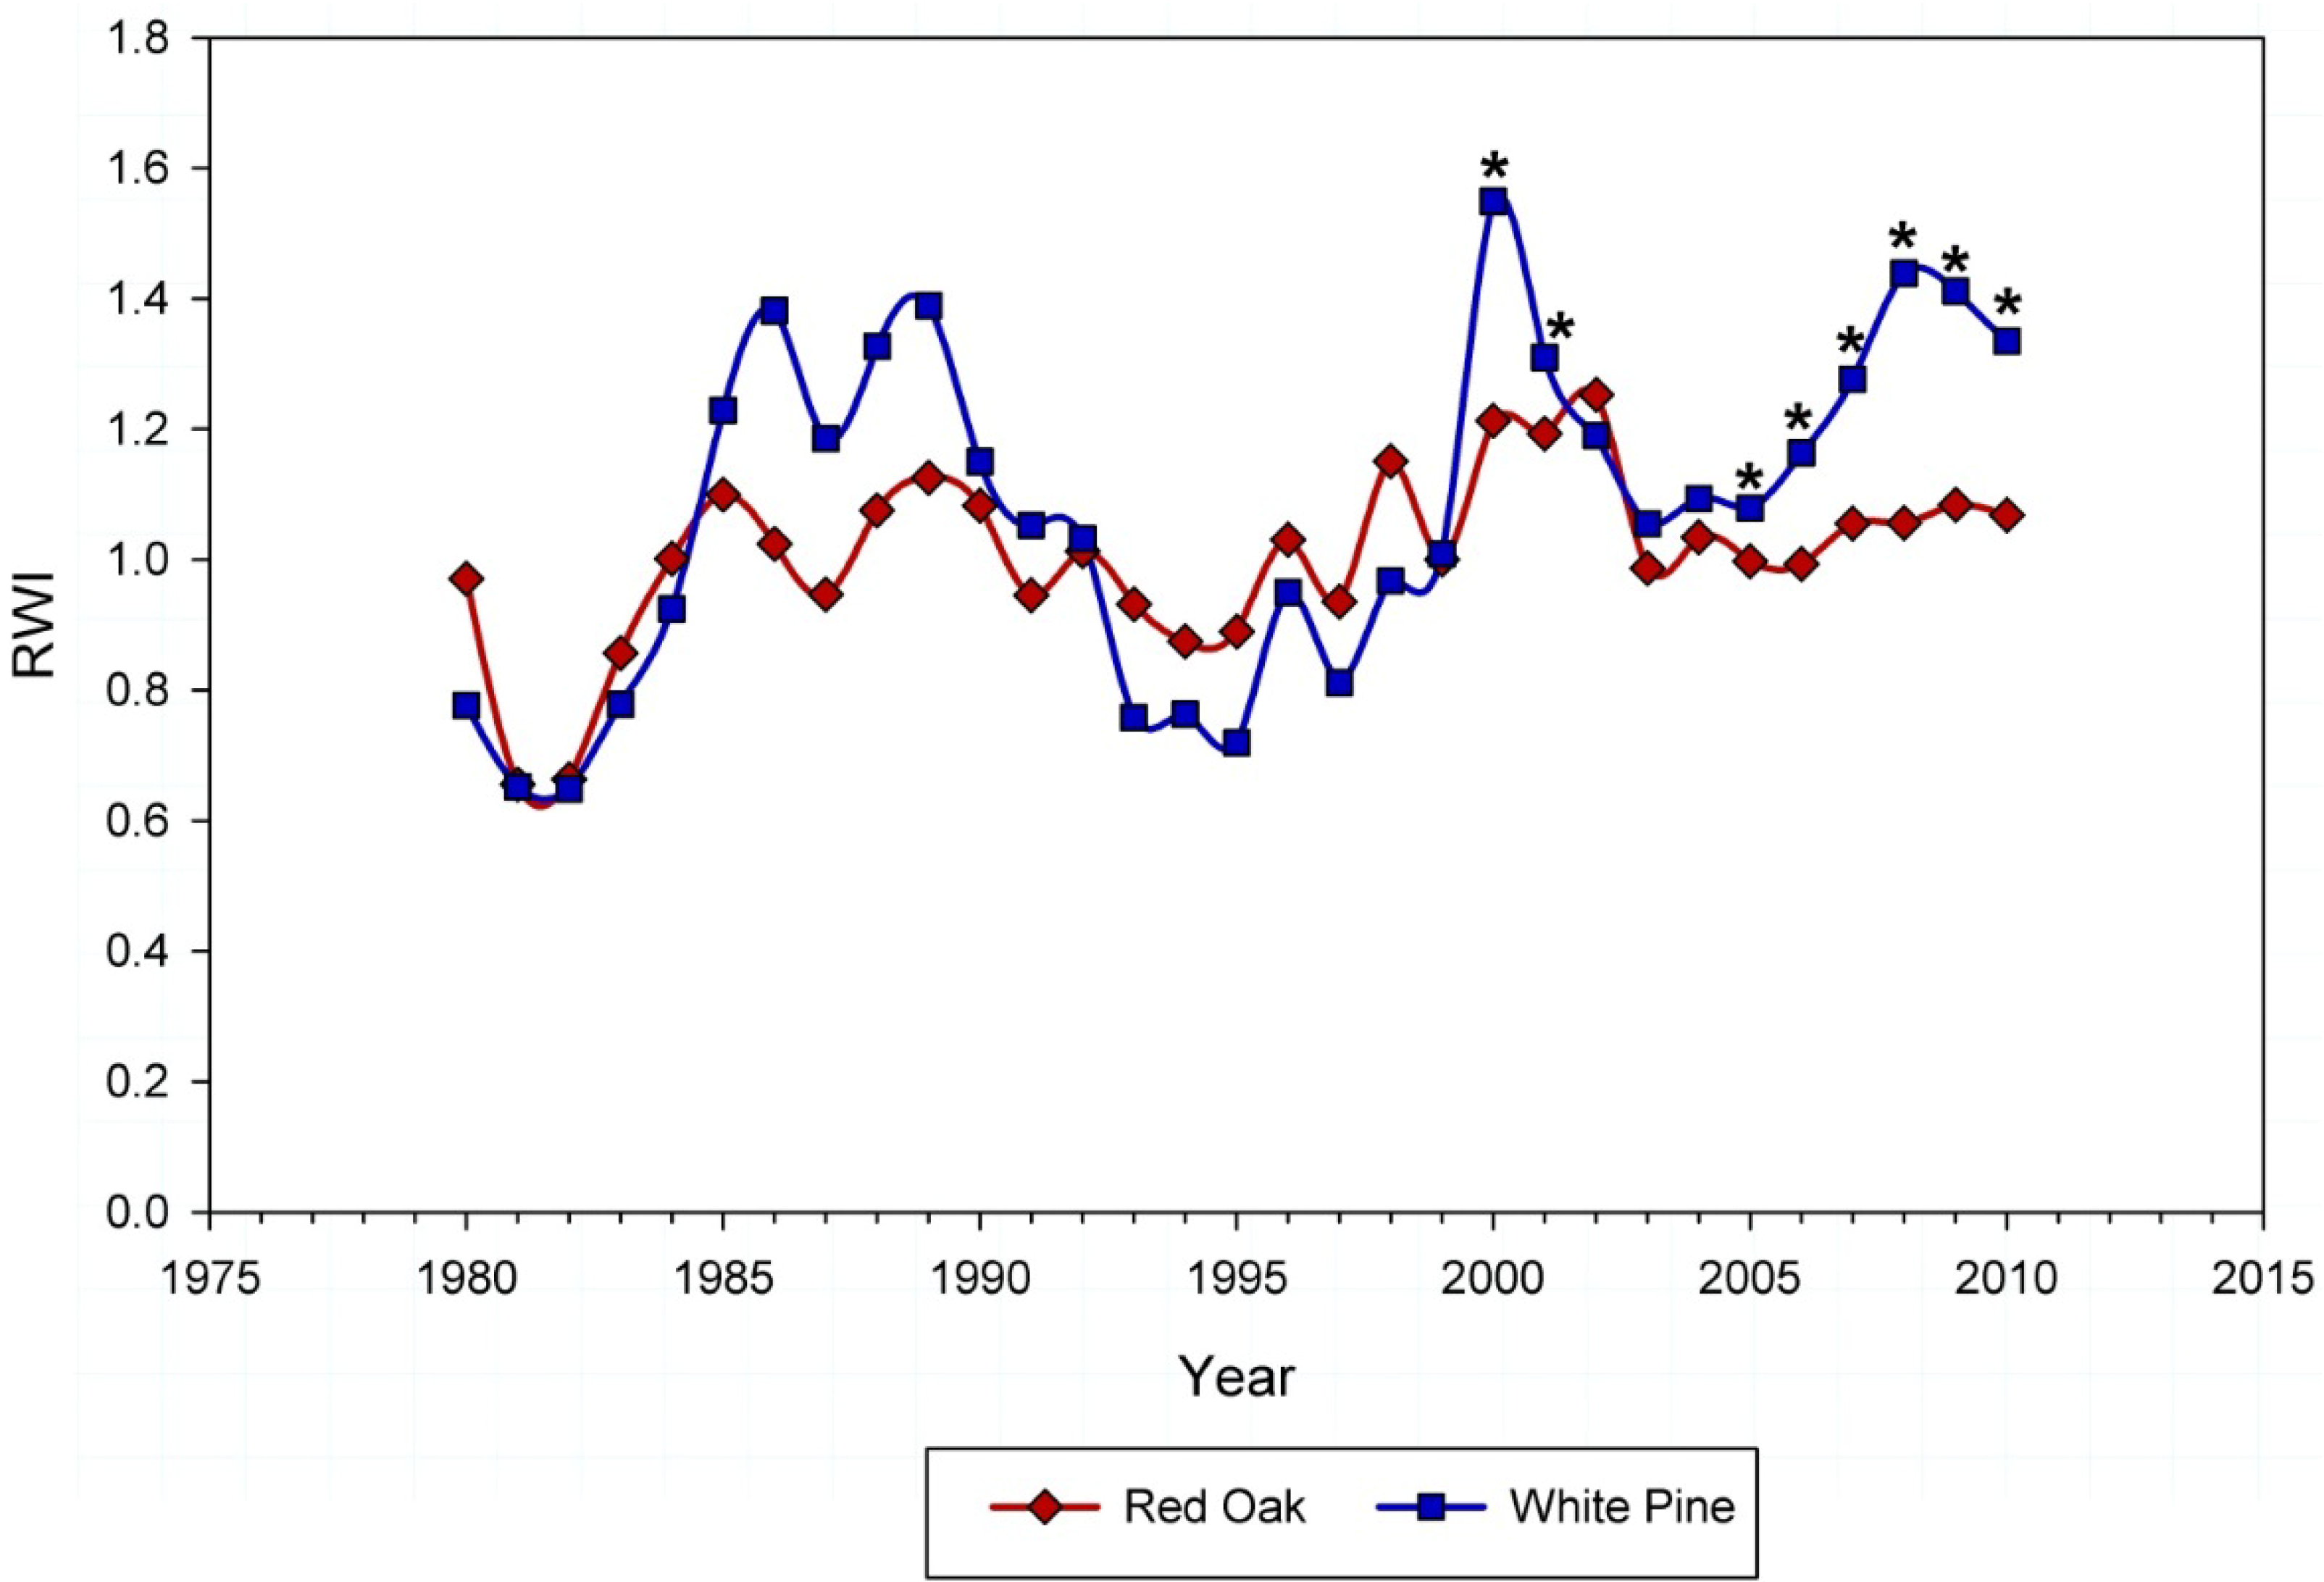
3.2. Dendrochronology

Across all 13 sites, repeated measures analysis of Quercus and P. strobus annual RWI values from 1980–2010 revealed a significant interaction between time and species (univariate Greenhouse-Geiser Epsilon p < 0.0001; Figure 3). Two periods of divergence (1985–1990 and 2005–2010) may have influenced the significance of the interaction between time and Quercus RWI and P. strobus RWI. Although the 1985–1990 divergence was outside the focus of the present study, and thus did not receive further analysis, a possible contributing factor for this divergence may include gypsy moth defoliation during the early 1980s. Post hoc t-tests of Quercus and P. strobus RWI from 1995–2010 revealed a significant divergence in Quercus radial growth compared to P. strobus from 2000–2001 (p < 0.0001 and p = 0.0005, respectively), 2003 (p = 0.0449), and 2005–2010 (p = 0.0130; p < 0.0001; and p < 0.0001; p < 0.0001; p < 0.0001, p < 0.0001, respectively). Of these years, the Quercus RWI values fell below the 18% defoliation threshold of 1.094 in 2006–2010, indicating five years of region-wide growth divergence between Quercus and P. strobus RWI.
Figure 3. Region-wide Quercus and P. strobus ring width index (RWI) dendrochronologies pooled from 13 sites in eastern Massachusetts from 1980–2010; distinct divergence trends exist from 1985–1990 and 2003–2010; * indicates years in which Quercus RWI is significantly lower than P. strobus RWI (using t-tests from 1995–2010.)
Forests 05 02440 g003
At the individual site level, repeated measures analysis showed a significant interaction between time and species (Quercus vs. P. strobus) from 1980–2010 at each of the 13 sites. Post hoc tests from 1995–2010 revealed that nine sites contained winter moth defoliation events as defined by individual years in which the Quercus RWI value was significantly lower than the P. strobus RWI value and fell below the defoliation threshold of 1.094, with the earliest event occurring in 1996 (Table 2). Eight of the study sites showed multiple winter moth defoliation events; one (Bradley Palmer State Park) showed a prolonged radial growth reduction from 2007–2010 and three (Blue Hills State Reservation, Borderland State Park, and Willowdale State Forest) showed a reduction from 2008–2010 (Table 2). Thus, Number of WM Defoliation Events at the 13 study sites ranged from 0–4 years (Table 2).
Dendrochronological analysis of snag tree disks (n = 6) at the site of maximum Quercus mortality (Wompatuck State Park) indicated that this mortality occurred from 1987 through 2008 (Table 3), but five of the six trees died after 1995. Years since mortality was highly correlated (r = 0.9163) with snag class (Table 3). Of the four disks that were unable to be cross-dated, one was in snag class 2, one in snag class 3, and two were in snag class 4.
Table 3. Diameter at 1.4 m (DBH), snag class, year of mortality and years since mortality (calculated from 2010) of six snag trees at Wompatuck State Park, Massachusetts.
TreeDBH (cm)Sang ClassYear of MortalityYears Since Mortality
130.5220082
227.3220064
335.82199911
425.63199713
532.53199614
624.04198723

3.3. Drought

Based on the bootstrapped correlation coefficients, P. strobus RWI was significantly positively correlated with July (correlation coefficient = 0.38), August (0.50), and September (0.41) Massachusetts statewide PDSI from 1980–2010. Quercus RWI was not significantly correlated with any of the PDSI values tested during this time period. However, during the 1980–1995 period, both P. strobus and Quercus RWI were significantly positively correlated with August (P. strobus correlation coefficient = 0.61; Quercus = 0.52) and September (P. strobus = 0.58; Quercus = 0.36) Massachusetts statewide PDSI.
Based on the bootstrapped response coefficients, P. strobus RWI responded positively to August PDSI during the 1980–2010 and 1980–1995 time periods (response coefficients = 0.23 and 0.34, respectively). Quercus did not respond significantly to any PDSI values during either time period.

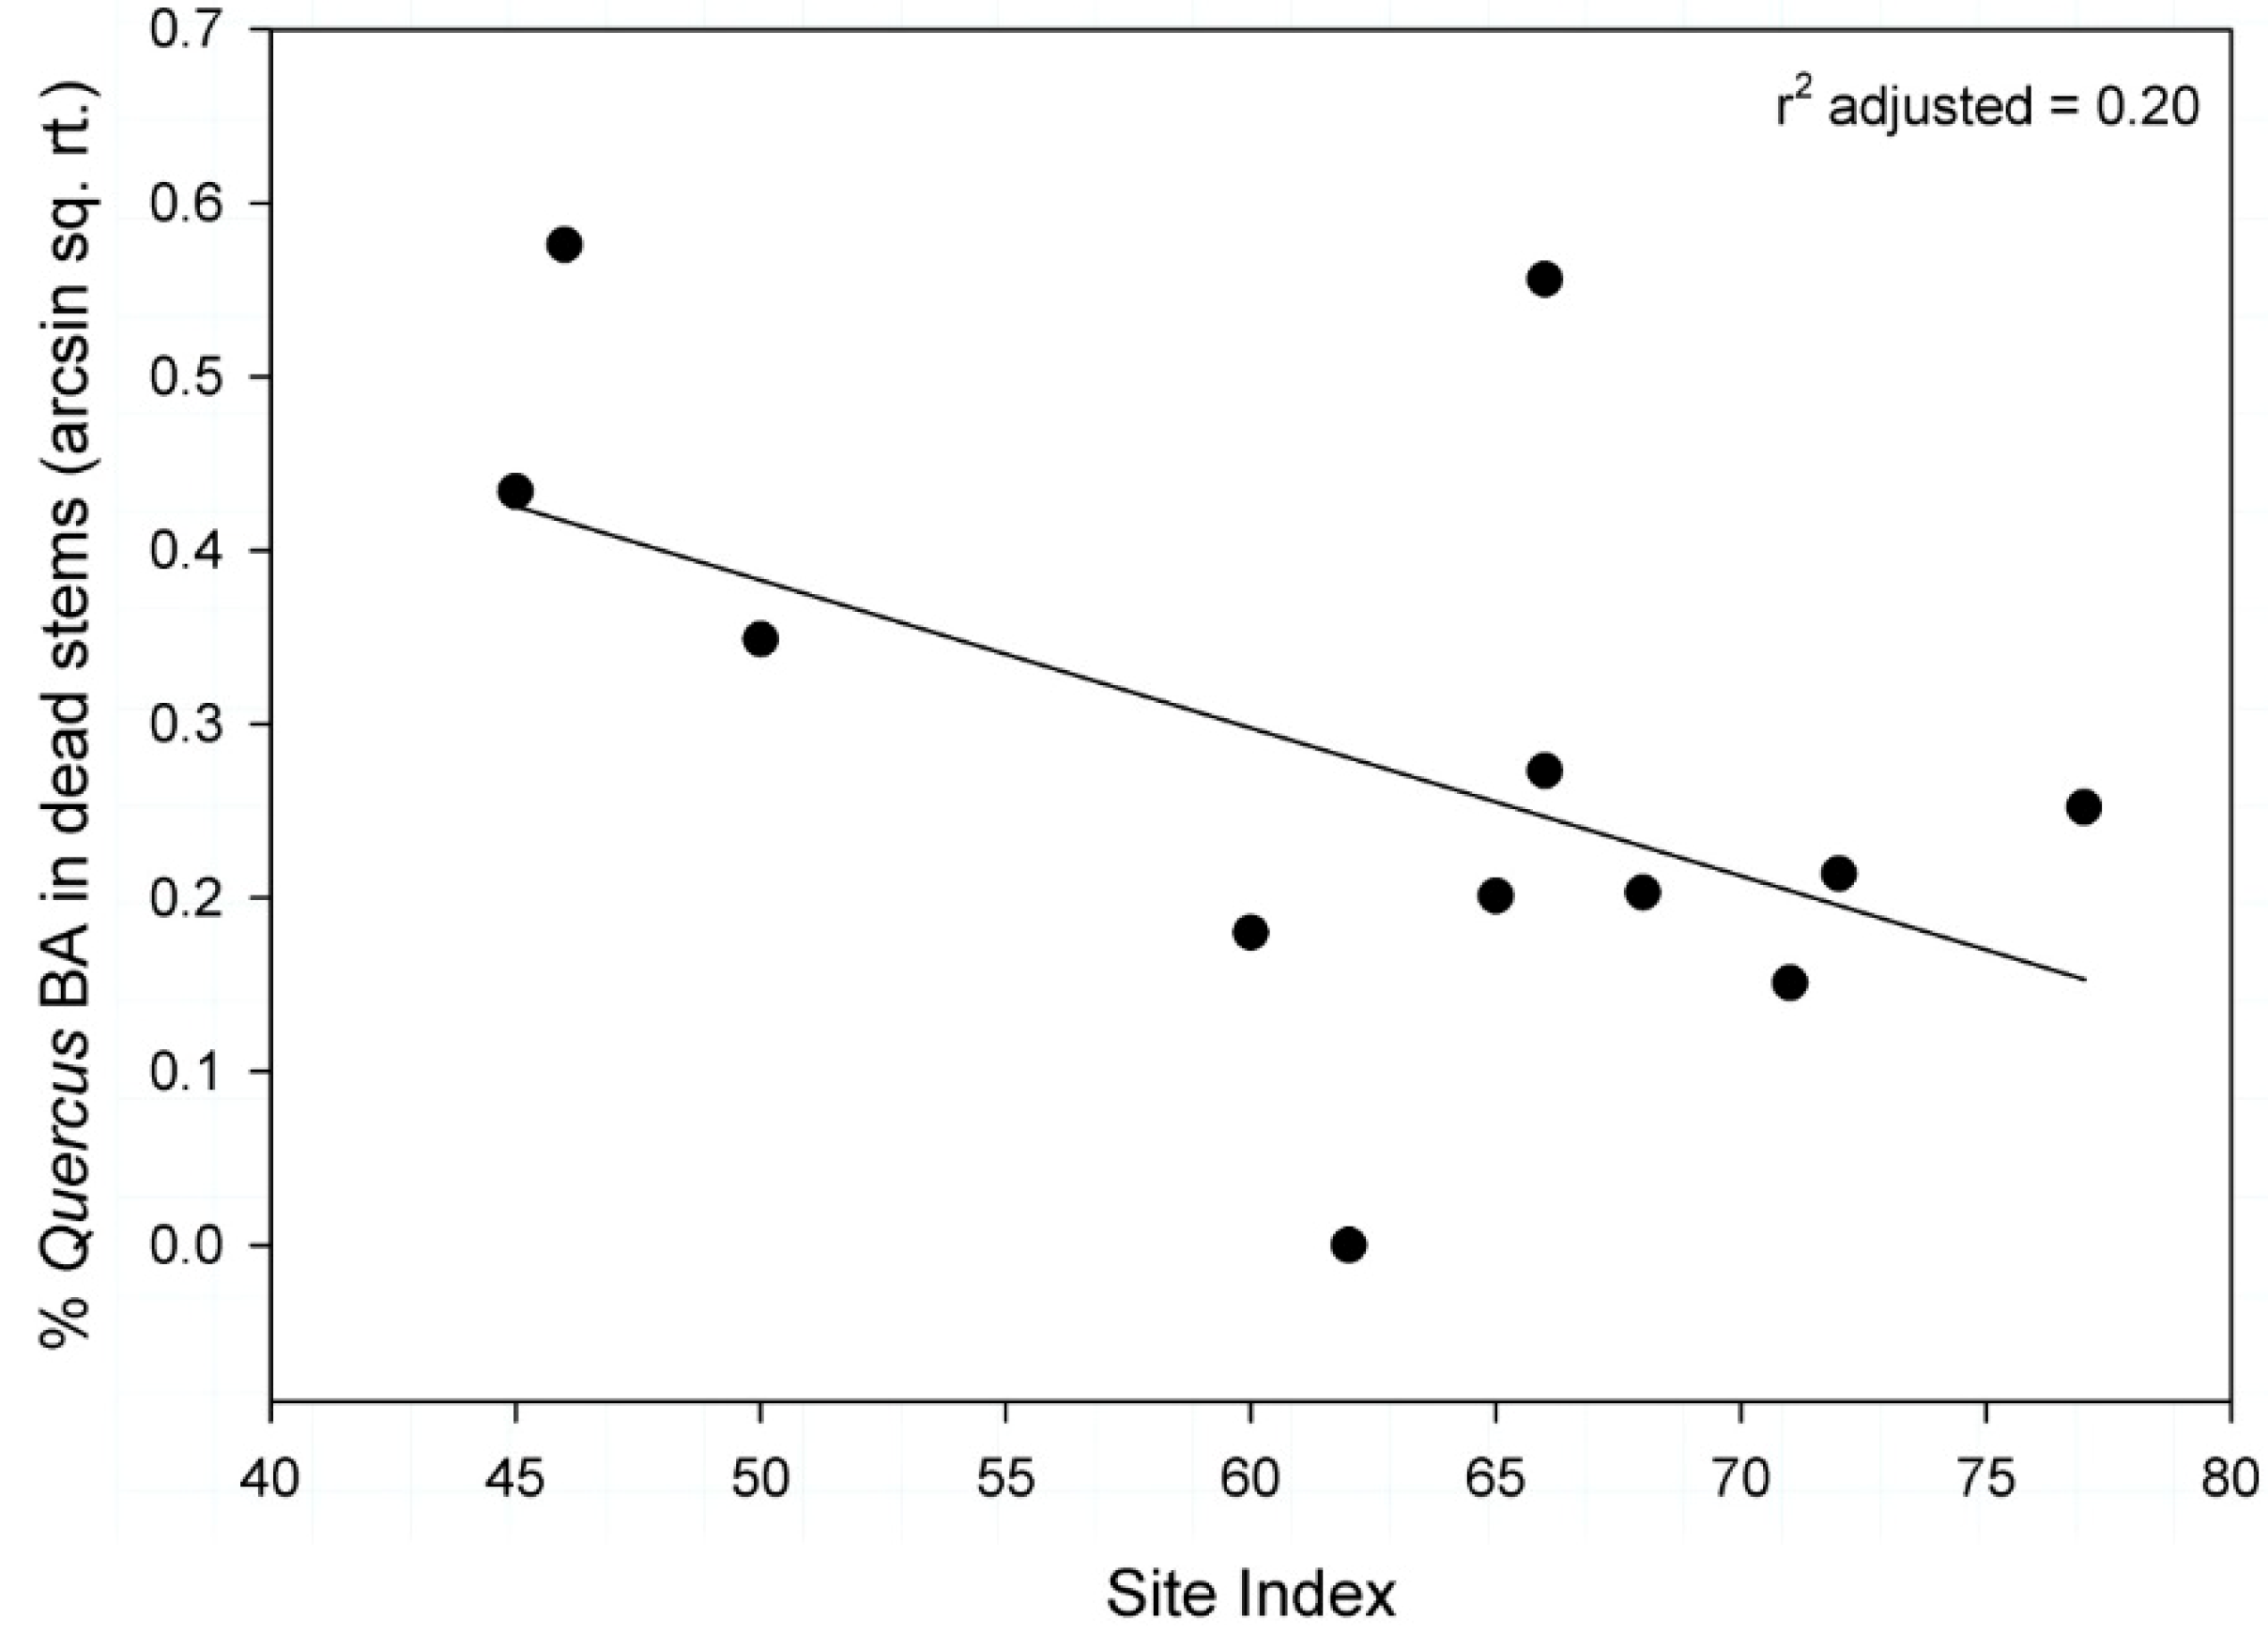
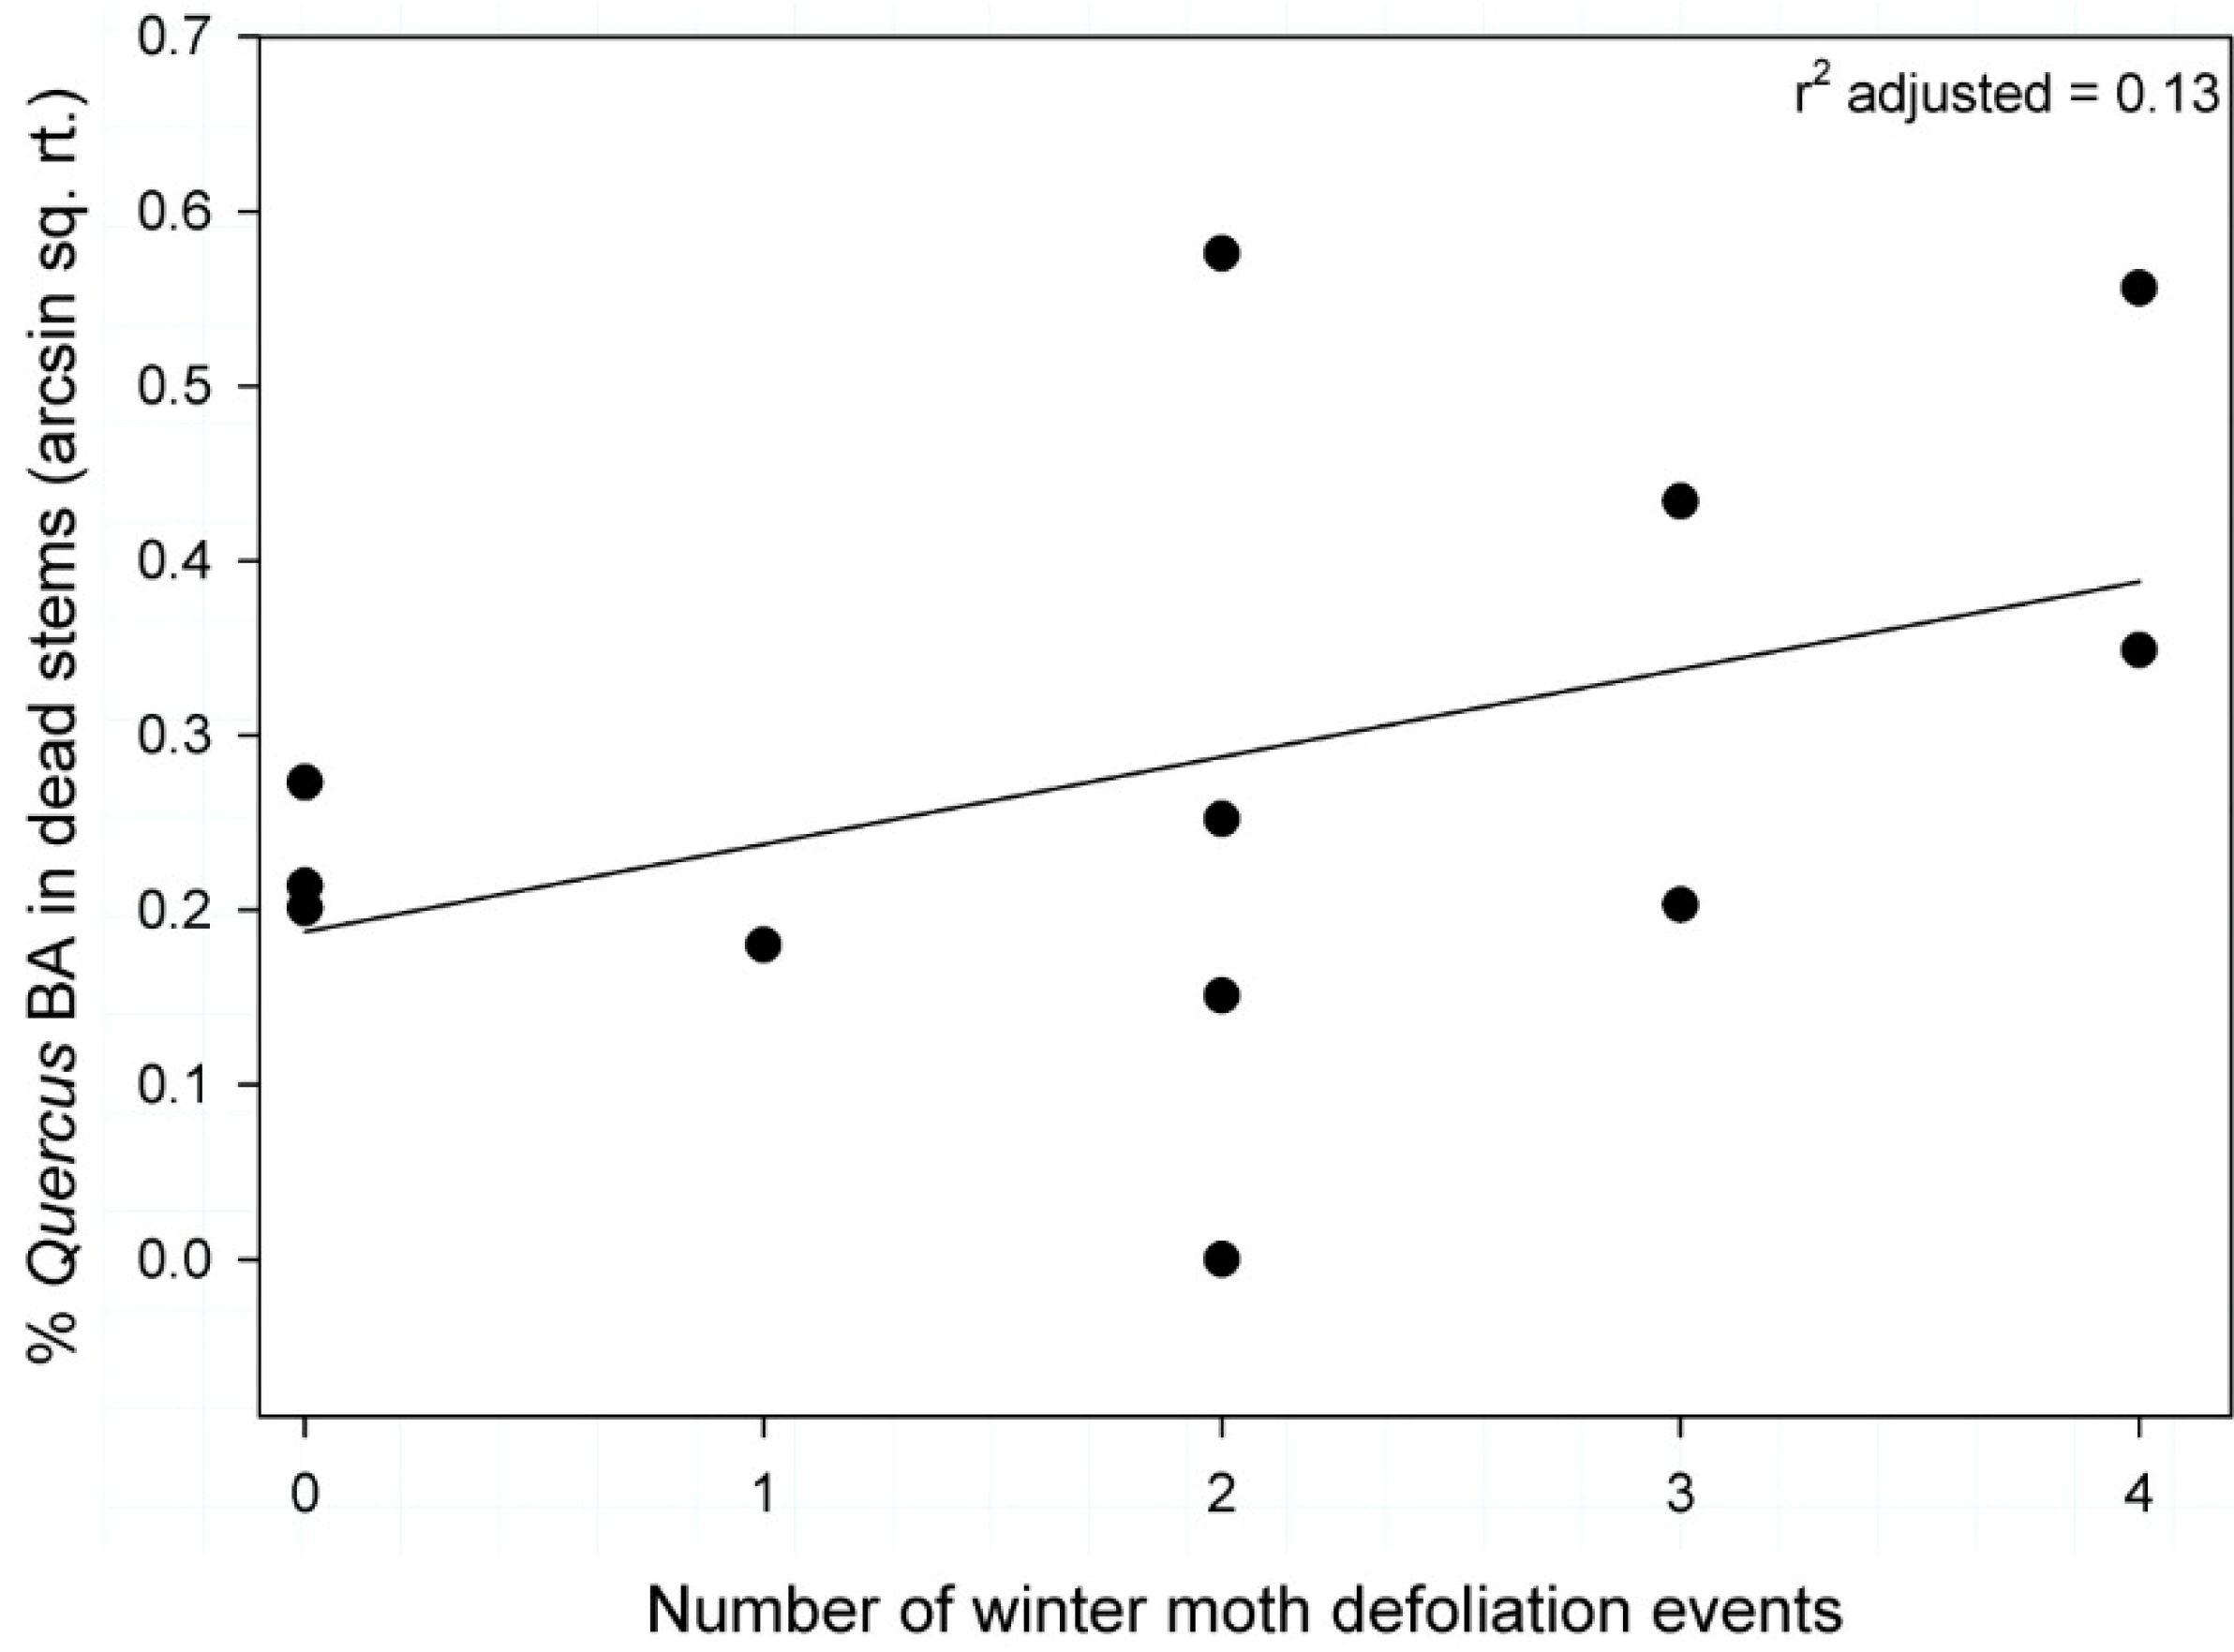
3.4. Percentage of Quercus Basal Area Consisting of Dead Stems

We evaluated 12 models to predict the relationship between the response variable Percentage of Quercus Basal Area in Dead Stems and the explanatory variables Number of WM Defoliation Events, Quercus Site Index, and Stand Relative Density. These models included the global model (Percentage of Quercus Basal Area in Dead Stems, Number of WM Defoliation Events, Quercus Site Index, and Stand Relative Density, and the interactions between each variable) and each nested iteration. Five candidate models (ΔAICc ≤ 4.00) were identified and, from these, variation in Percentage of Quercus Basal Area in Dead Stems (following arcsin square root transformation) was best explained by two competing models (Table 4). Based on the “best” model (ΔAICc = 0.0; r2adj = 0.20), variation in Percentage of Quercus Basal Area in Dead Stems was most strongly related to Quercus Site Index (parameter estimate = −0.009; standard error (SE) ± 0.004). In this model, percentage of Quercus Basal Area in Dead Stems declined as Quercus Site Index increased (negative parameter estimate, Figure 4). Conversely, a highly competitive model (ΔAICc = 1.04; r2adj = 0.13) indicated that variation in Percentage of Quercus Basal Area in Dead Stems was positively related to Number of WM Defoliation Events (parameter estimate = 0.050; SE ± 0.030; Figure 5). A third, albeit less competitive, model (ΔAICc = 2.78; r2adj = 0.22), explained Percentage of Quercus Basal Area in Dead Stems as a function of both Quercus Site Index (parameter estimate = −0.007; SE ± 0.005), and Number of WM Defoliation Events (parameter estimate = 0.034; SE ± 0.030).
Figure 4. % Quercus BA in Dead Stems (arcsin square root) by Site Index; % Quercus BA in Dead Stems = 0.8086 + −0.0085 × Site Index.
Forests 05 02440 g004

3.5. Understory Density

Four models evaluated the relationship between Understory Density, Stand Relative Density and Number of WM Defoliation Events (Table 5). In the best model (ΔAICc = 0.00; r2adj = 0.31), variation in Understory Density was positively related to Number of WM Defoliation Events (parameter estimate = 27,121.03; SE ± 10,759.48); none of the other three models competed strongly (ΔAICc ≤ 4.00) with this “best” model (Table 5).
Figure 5. % Quercus BA in Dead Stems (arcsin square root) by # of years of winter moth defoliation; % Quercus BA in Dead Stems = 0.1876 + 0.0501 × # of years of winter moth defoliation.
Forests 05 02440 g005
Table 4. Results of multiple regression on Percent of Quercus Basal Area in Dead Stems at 13 sites in eastern Massachusetts; ΔAICc = corrected Akaike Information Criterion differences; SE = standard error.
Model ParametersΔAICcr2adjParameter EstimateSELog LikelihoodAkaike WeightEvidence Ratio
Stand RD4.03−0.090.0300.4970.130.067.51
Site Index3.480.18−0.0100.0050.180.085.69
Stand RD 0.3810.463
Site Index2.780.22−0.0070.0050.250.124.02
# WM defoliation events 0.0340.030
# WM defoliation events1.040.130.0500.0300.590.281.68
Site Index0.000.20−0.0090.0041.000.461.00
Table 5. Results of multiple regression on Understory Density at 13 sites in eastern Massachusetts; ΔAICc = corrected Akaike Information Criterion differences; SE = standard error.
Model ParametersΔAICcr2adjParameter EstimateSELog LikelihoodAkaike WeightEvidence Ratio
Stand RD9.420.1977,065.34178,423.800.010.01110.89
# WM defoliation events 26,524.8711,992.21
Stand RD * # WM defoliation events −50,165.78135,010.40
Stand RD5.17−0.03159,237.48196,194.800.080.0613.27
Stand RD4.040.2680,855.00170,282.200.130.117.55
# WM defoliation events 26,031.1411,393.15
# WM defoliation events0.000.3127,121.0310,759.481.000.821.00

4. Discussion

Quercus species are important components of forests in the eastern United States [48]. Mixed—Quercus and P. strobus—Quercus forest communities are abundant throughout Massachusetts [49] and were the focus of our study. Winter moth was present in the forests we sampled and dead Quercus basal area at these sites was positively associated with the number of winter moth defoliation events, although Quercus site index was a stronger predictor. Although our study was limited to upland forest sites, the polyphagous winter moth is likely present and active in a variety of additional habitats in eastern Massachusetts that were not studied.
Winter moth may be responsible for a reduction of Quercus radial growth in some of the 13 studied forest stands. Annual radial growth (RWI) of Quercus, a winter moth host, and P. strobus, a non-host species, showed similar patterns between 1980 and 2010, but Quercus RWI was lower during two periods: 1985–1990 and 2003–2010. Figure 3 incorporates the widespread gypsy moth outbreak of 1981 and it is evident that both Quercus and P. strobus radial growth was influenced negatively by this event. Quercus and P. strobus both appeared to recover in the years following this outbreak; however, in 1985–1990 P. strobus RWI exceeded that of Quercus. Although the radial growth trend from 1985–1990 is somewhat consistent between the two species groups, some factor or combination of factors reduced Quercus radial growth in relation to P. strobus.
In the period 1995–2010, radial growth of Quercus was significantly lower than P. strobus in 2000 and 2001, 2003, and from 2005–2010 (Figure 3). The radial growth divergence between these species groups in the years 2000 and 2001 is more reflective of an increase in P. strobus radial growth than of a decrease in Quercus radial growth. However, the trend that initiated in 2003 and continued from 2005–2010 is indicative of a stagnation of Quercus radial growth and a concomitant increase in P. strobus radial growth. These patterns, and the reduction of Quercus RWI below the 18% winter moth defoliation threshold from 2006–2010 suggest that some factor specific to Quercus was active during this time period.
Our analysis of Quercus and P. strobus correlation function to PDSI suggests that P. strobus was a suitable control species and that drought did not limit Quercus RWI during the presumed winter moth period (1995–2010). The bootstrapped correlation coefficients indicate that both Quercus and P. strobus were similarly associated with PDSI from 1980–1995. However, after 1995, while P. strobus RWI remained significantly positively correlated with PDSI, the relationship between Quercus RWI and PDSI was not retained. Although the two species demonstrated a different response function to PDSI, with Quercus showing no response to PDSI and P. strobus responding positively to August PDSI, these relationships were retained throughout the entire period tested (1980–2010) and were not altered during the presumed winter moth period. Michelot et al. [50] found that radial growth of P. sylvestris L. was sensitive to August climate, while that of Q. petraea Matt. and Fagus sylvatica L. was not. The positive response of P. strobus, and lack of response of Quercus, to August PDSI in the present study is consistent with Michelot et al. [50] and may highlight physiological differences between these species.
While the radial growth of different tree species may vary in response to climate factors [50] and drought [51], our result that P. strobus and Quercus RWI were similarly correlated with PDSI prior to, but not after, 1995 suggests that some limiting factor specific to Quercus weakened the relationship between this species and PDSI during the winter moth period (1995–2010). Moreover, the positive growth trend of P. strobus suggests that this species was experiencing favorable growing conditions during the same time period. When considering the positive relationship between winter moth defoliation (as defined by dendrochronological analysis) and the percentage of Quercus basal area in dead stems, these patterns suggest that P. strobus RWI may have been positively affected by preferential winter moth defoliation on Quercus through reduced competition for canopy space (dead Quercus) and possibly reduced competition for soil water and nutrients. Although Tikkanen and Roininen [20] found that winter moth defoliation did not positively influence radial growth of non-host tree species, increased radial growth of non-host species during defoliation outbreaks, presumably due to increased light, moisture, and/or nutrients, has been documented in other studies [52,53].
While many factors likely influence the radial growth of Quercus at our study sites, several pieces of evidence point to winter moth as an important causal agent of relatively low radial growth at some sites since 2000. The significant radial growth divergence between Quercus and P. strobus RWI from 2005–2010 suggests the presence of a stressor that is specific to Quercus. Radial growth analyses of individual trees throughout this region (including at some of the study sites of the present study) found that winter moth defoliation was a strong predictor of radial growth of Quercus trees defoliated by winter moth, when tested concurrently with site and year as random covariates [21]; however, other factors (e.g., other defoliators, pathogens, physical stressors) were not tested. According to Massachusetts aerial detection survey (ADS) data, winter moth defoliation occurred throughout much of eastern Massachusetts from 2004–2011 [11]. Winter moth was the dominant defoliator in, or in close proximity (4.8 km) to, our study sites since this species was first incorporated into ADS beginning in 2004 and was responsible for 100% of the defoliation events within 4.8 km of our study sites from 2008–2010 [54]. It is likely that winter moth was also active within our study area prior to 2004, as winter moth was confirmed in 2003 to be responsible for a prolonged outbreak of defoliation in eastern Massachusetts in the 1990s and early 2000s [10]. However, it is important to note that other Quercus defoliators (including gypsy moth and forest tent caterpillar) were active from 2000–2007 [54], and that, in some years, multiple defoliators were present within the study region and could have overlapped in our study sites with winter moth. The correlative nature of this study does not allow us to differentiate between the effects of different defoliator species or necessarily make inferences on the combined effects of multiple defoliators in one season, but what is clear is that winter moth was the primary species defoliating trees in our study sites during much of our period of interest.
Our results suggest that winter moth may have also induced tree mortality. We used percentage of Quercus basal area in dead stems as a measure of mortality, and as this variable is just a snapshot in time, it is not necessarily representative of rates of mortality. Thus, caution must be exercised when interpreting the impact of winter moth defoliation on tree mortality. However, the snag data provide insight into the utility of “percentage of Quercus basal area in dead stems” as a metric of winter moth induced tree mortality. Snag class distributions showed that greater than 60% of the Quercus standing dead trees at more than half of our sites were in snag classes 1–3. Dendrochronological analysis of snag trees at one site (Wompatuck State Park) revealed that snags in classes 2 and 3 died within the last 2–14 years (as dated from 2010). This suggests that much of the mortality at our study sites occurred between 1995 and 2010, the presumed period of winter moth activity in the study region. However, there is great error variation in aging standing and fallen dead trees [55] and snag longevity can be influenced by geographic region and site conditions [56]. As such, there may be limitations in assigning age to snag classes across all 13 study sites with a sample of six trees at one site; this warrants caution with the assumption that percent Quercus basal area in dead trees is reflective of recent stand mortality. However, our sites were confined to a relatively small geographic region and our snag data were solely from Quercus species. In addition, Garber et al. [57] found that snag half-times of several species in a New England forest (central Maine) ranged from 6–10 years. This supports our inference that much of the observed mortality may have occurred in the last 2–14 years.
The percentage of Quercus basal area in dead stems at the 13 study sites was best predicted by Quercus site index and the number of winter moth defoliation events. Stand-level tree mortality likely involves multiple factors that occur at different temporal and spatial scales and, therefore, is difficult to predict [58,59,60]. To model mortality, very large datasets are typically required and even with the existence of such datasets, predictive accuracy at the stand level may be low [61,62,63]. The introduction of a novel disturbance agent (i.e., pest or disease outbreak) further complicates this modeling [60]. Site index and/or winter moth defoliation may contribute to the presence of dead trees at our study sites, but other influential variables likely exist. While site index and winter moth defoliation only explained 20% and 13%, respectively, of the mortality across our sites, the lack of relationship between stand relative density and % Quercus in dead stems suggests that some density-independent factor may have contributed to some of the mortality noted in our stands. Although we cannot be certain that Quercus mortality was attributable to winter moth and not some other defoliator, pathogen, or physical disturbance, the abundance of winter moth in eastern Massachusetts over the last decade, the known relationship between percent winter moth defoliation and radial growth [21], and the dominance of dead Quercus trees in snag classes 1–3 (and thus the assumption of tree mortality occurring within the 1995–2010 period) collectively implicate winter moth as an important contributor to Quercus mortality in these forests.
Quercus mortality at the 13 study sites was associated with site quality and winter moth defoliation. The lack of a clear “best” model explaining percent Quercus basal area in dead stems indicates the interrelationship between the variables Quercus site index and the number of winter moth defoliation events. At some sites the combination of low Quercus site index and multiple, consecutive winter moth defoliation events were associated with high levels of Quercus mortality, relative to other sites. Although there may be variation among sites, across all 13 study sites Quercus mortality increased with increasing number of winter moth defoliation events. Moreover, site quality influenced Quercus mortality, with mortality increasing on poor quality Quercus sites. On more productive Quercus sites, high Quercus site index may have compensated for winter moth defoliation and reduced mortality.
Winter moth defoliation contributing to Quercus mortality in Massachusetts is consistent with reports of novel winter moth defoliation in Nova Scotia, as Cuming [7] and Embree [19] observed deterioration and mortality of Q. rubra following repeated winter moth defoliation. In addition, the relationship between winter moth defoliation, site quality, and tree mortality are similar to the effects reported for other defoliators, including European gypsy moth, Lymantria dispar L. [64]. Consistent with our inferences on winter moth, consecutive years of defoliation [25,65] and low site index [65] contribute to increased gypsy moth-induced tree mortality.
Canopy disturbance and gap formation following insect defoliation can facilitate understory plant establishment and/or growth [25,26,27,28]. The density of understory tree and shrub seedling and saplings increased with the number of winter moth defoliation events. This increase in understory woody plant establishment and/or growth was likely caused by (1) increased understory light conditions from canopy gaps caused by tree mortality and, (2) increased diffuse understory light conditions provided by partially defoliated tree crowns. Exotic forest insects can contribute to “invasional meltdown” (sensu [66]) in which canopy gaps created by the invasion of exotic forest insects can facilitate the success of exotic invasive plants in the understory [2]. Frangula alnus (glossy buckthorn), an exotic invasive shrub that is well established in eastern North America [67] and facilitated by canopy gap formation [68], was present in the understory of eight of our 13 study sites, often in high densities (MJS, unpublished data). Although we did not specifically test for this phenomenon, our result that understory density increases with winter moth defoliation and the presence of F. alnus in several of our study sites suggests that winter moth defoliation could contribute to invasional meltdown in eastern Massachusetts forests.
It is likely that winter moth defoliation is not the sole contributor to mortality noted at our sites. Winter moth likely initiates a sequence of decline that involves a suite of factors. Armillaria fungi have been documented as important pathogens in mixed Quercus forests in western and central Massachusetts [69,70]; areas spatially adjacent to our study region. Given the proximity of our study region to these areas, it is likely that Armillaria species play a similar role in the forests of eastern Massachusetts. The relationship between insect defoliation and subsequent attack by secondary agents, notably the wood boring two-lined chestnut borer, Agrilus bilineatus Weber, and Armillaria species decay fungi, is well established in Quercus forests [71,72]. This decline complex (sensu [73]) progresses as an inciting factor (e.g., insect defoliation; drought) stresses a forest stand and facilitates invasion by either A. bilineatus or Armillaria spp., or both [74]. Mortality attributable to this decline complex can occur up to three years following prolonged defoliation (2–3 years of consecutive defoliation events) [72]. This suggests a lag-time between winter moth defoliation and tree mortality and may partially explain residual variation in Quercus mortality not explained in our regression models and temporal variation in our estimates of year of snag mortality.

5. Conclusions

Winter moth has successfully invaded mixed species forests in northeastern U.S. and is associated with increased levels of tree mortality in these stands. While the correlative nature of this study precludes specific assumptions, some general patterns on the ecology of winter moth invasion in this region emerged. First, winter moth has invaded mixed—Quercus and P. strobusQuercus forests of varying age and structure. Second, winter moth defoliation caused a region-wide (eastern Massachusetts) reduction in Quercus radial growth, comparable to non-host P. strobus. Third, winter moth defoliation events may increase Quercus mortality in infested forests and influence understory plant density. Finally, complex interactions among competition, site quality, and duration of winter moth activity may, ultimately, determine the severity of effects associated with winter moth defoliation. As the winter moth invasion continues to spread in the northeastern United States [11], the findings of this study have broad application to Quercus forests within this region.

Acknowledgments

We thank Maria Vasta and Audrey Perkins from the University of New Hampshire, Nick Day from Paul Smith’s College, and Angie Hammond, Ryan Hanavan, and Justin Williams from U.S. Forest Service Forest Health Protection Durham Field Office (DFO) for assistance in tree core collection and preparation. In addition, we thank Maria Vasta (UNH and DFO) again for her steadfast measurement of tree cores. We also thank Molly Heuss, Garret Dubois, and Angie Hammond from the USFS Durham Field Office for assistance with vegetation surveys and Rebecca Lilja, Tom Luther, and Bill Frament, also USFS DFO, for assistance with ADS data. We thank Ken Gooch with the Massachusetts Department of Conservation and Recreation and the municipal forest commissions that provided access to study sites, Joe Elkinton and Jeff Boettner with the University of Massachusetts-Amherst for providing critical information on winter moth biology and history in Massachusetts, and Richard Hallett (USFS NRS) for assistance with mortality data. Finally, we thank three anonymous reviewers whose helpful comments and suggestions greatly improved the paper. Part of this research was funded by a U.S. Forest Service Northeastern Area State & Private Forestry grant to the University of New Hampshire (cooperative agreement 10-CA-11420004-309). This research was conducted as part of a master’s of science (M.Sci.) thesis submitted to the University of New Hampshire Graduate School by Michael J. Simmons.

Author Contributions

All authors contributed to the design, implementation, analysis, and reporting of this research.

Conflicts of Interest

The authors declare no conflict of interest.

References

  1. Liebhold, A.M.; McCullough, D.G.; Blackburn, L.M.; Frankel, S.J.; Von Holle, B.; Aukema, J.E. A highly aggregated geographical distribution of forest pest invasions in the USA. Divers. Distrib. 2013, 19, 1208–1216. [Google Scholar] [CrossRef]
  2. Gandhi, K.J.K.; Herms, D.A. Direct and indirect effects of alien insect herbivores on ecological processes and interactions in forests of eastern North America. Biol. Invasions 2010, 12, 389–405. [Google Scholar] [CrossRef]
  3. Aukema, J.E.; Leung, B.; Kovacs, K.; Chivers, C.; Britton, K.O.; Englin, J.; Frankel, S.J.; Haight, R.G.; Holmes, T.P.; Liebhold, A.M.; et al. Economic impacts of non-native forest insects in the continental United States. PLoS One 2011, 6, 7. [Google Scholar] [CrossRef]
  4. Baker, W.L. Effect of gypsy moth defoliation on certain forest trees. J. For. 1941, 39, 1017–1022. [Google Scholar]
  5. Orwig, D.A.; Foster, D.R. Forest response to the introduced hemlock woolly adelgid in southern New England, USA. J. Torrey Bot. Soc. 1998, 125, 60–73. [Google Scholar] [CrossRef]
  6. Dodds, K.J.; Orwig, D.A. An invasive urban forest pest invades natural environments—Asian longhorned beetle in northeastern US hardwood forests. Can. J. For. Res. 2011, 41, 1729–1742. [Google Scholar] [CrossRef]
  7. Cuming, F.G. The distribution, life history, and economic importance of the winter moth, Operophtera brumata (L.) (Lepidoptera: Geometridae) in Nova Scotia. Can. Entomol. 1961, 93, 135–142. [Google Scholar] [CrossRef]
  8. Feeny, P. Seasonal changes in oak leaf tannins and nutrients as a cause of spring feeding by winter moth caterpillars. Ecology 1970, 51, 565–581. [Google Scholar] [CrossRef]
  9. Varley, G.C.; Gradwell, G.R.; Hassell, M.P. Insect Population Ecology: An Analytical Approach; University of California Press: Berkeley, CA, USA, 1974. [Google Scholar]
  10. Elkinton, J.S.; Boettner, G.H.; Sermac, M.; Gwiazdowski, R.; Hunkins, R.R.; Callahan, J.; Scheufele, S.B.; Donahue, C.P.; Porter, A.H.; Khrimian, A.; et al. Survey for winter moth (Lepidoptera: Geometridae) in northeastern North America with pheromone-baited traps and hybridization with the native Bruce spanworm (Lepidoptera: Geometridae). Ann. Entomol. Soc. Am. 2010, 103, 135–145. [Google Scholar] [CrossRef]
  11. Elkinton, J.S.; Liebhold, A.; Boettner, G.H.; Sremac, M. Invasion spread of Operophtera brumata in northeastern United States and hybridization with O. bruceata. Biol. Invasions 2014, 16, 2263–2272. [Google Scholar] [CrossRef]
  12. Wesolowski, T.; Rowinski, P. Tree defoliation by winter moth Operophtera brumata L. during an outbreak affected by structure of forest landscape. For. Ecol. Manag. 2006, 221, 299–305. [Google Scholar] [CrossRef]
  13. Gillespie, D.R.; Finlayson, T.; Tonks, N.V.; Ross, D.A. Occurrence of winter moth, Operophtera brumata (Lepidoptera: Geometridae), on southern Vancouver Island, British Columbia. Can. Entomol. 1978, 110, 223–224. [Google Scholar] [CrossRef]
  14. Roland, J. Decline in winter moth populations in North America—Direct versus indirect effect of introduced parasites. J. Anim. Ecol. 1988, 57, 523–531. [Google Scholar] [CrossRef]
  15. Tikkanen, O.P.; Lyytikainen-Saarenmaa, P. Adaptation of a generalist moth, Operophtera brumata, to variable budburst phenology of host plants. Entomol. Exp. Appl. 2002, 103, 123–133. [Google Scholar] [CrossRef]
  16. Tikkanen, O.P.; Julkunen-Tiitto, R. Phenological variation as protection against defoliating insects: The case of Quercus robur and Operophtera brumata. Oecologia 2003, 136, 244–251. [Google Scholar] [CrossRef] [PubMed]
  17. Embree, D.G. The winter moth Operophtera brumata in eastern Canada, 1962–1988. For. Ecol. Manag. 1991, 39, 47–54. [Google Scholar] [CrossRef]
  18. Varley, G.C.; Gradwell, G.R. The effect of partial defoliation by caterpillars on the timber production of oak trees in England. In Proceedings of the 11th International Congress of Entomology, Vienna, Austria, 17–25 August, 1960; pp. 211–214.
  19. Embree, D.G. Effects of winter moth on growth and mortality of red oak in Nova Scotia. For. Sci. 1967, 13, 295–299. [Google Scholar]
  20. Tikkanen, O.P.; Roininen, H. Spatial pattern of outbreaks of Operophtera brumata in eastern Fennoscandia and their effects on radial growth of trees. For. Ecol. Manag. 2001, 146, 45–54. [Google Scholar] [CrossRef]
  21. Simmons, M.J.; Lee, T.D.; Ducey, M.J.; Elkinton, J.S.; Boettner, G.H.; Dodds, K.J. Effects of invasive winter moth defoliation on tree radial growth in eastern Massachusetts, USA. Insects 2014, 5, 301–318. [Google Scholar] [CrossRef]
  22. Monserud, R.A. Simulation of forest tree mortality. For. Sci. 1976, 22, 438–444. [Google Scholar]
  23. Wyckoff, P.H.; Clark, J.S. Predicting tree mortality from diameter growth: A comparison of maximum likelihood and Bayesian approaches. Can. J. For. Res. 2000, 30, 156–167. [Google Scholar] [CrossRef]
  24. Gottschalk, K.W.; Colbert, J.J.; Feicht, D.L. Tree mortality risk of oak due to gypsy moth. Eur. J. For. Pathol. 1998, 28, 121–132. [Google Scholar] [CrossRef]
  25. Campbell, R.W.; Sloan, R.J. Forest stand responses to defoliation by gypsy moth. For. Sci. 1977, 23, 1–34. [Google Scholar]
  26. Reinikainen, M.; D’Amato, A.W.; Fraver, S. Repeated insect outbreaks promote multi-cohort aspen mixedwood forests in northern Minnesota, USA. For. Ecol. Manag. 2012, 266, 148–159. [Google Scholar] [CrossRef]
  27. Fajvan, M.A.; Wood, J.M. Stand structure and development after gypsy moth defoliation in the Appalachian Plateau. For. Ecol. Manag. 1996, 89, 79–88. [Google Scholar] [CrossRef]
  28. Jedlicka, J.; Vandermeer, J.; Aviles-Vazquez, K.; Barros, O.; Perfecto, I. Gypsy moth defoliation of oak trees and a positive response of red maple and black cherry: An example of indirect interaction. Am. Midl. Nat. 2004, 152, 231–236. [Google Scholar] [CrossRef]
  29. Macphee, A.W. Winter moth, Operophtera brumata (Lepidoptera: Geometridae), a new pest attacking apple orchards in Nova Scotia and its coldhardiness. Can. Entomol. 1967, 99, 829–834. [Google Scholar] [CrossRef]
  30. Foster, D.R.; Donahue, B.M.; Kittredge, D.B.; Lambert, K.F.; Hunter, M.L.; Hall, B.R.; Irland, L.C.; Lilieholm, R.J.; Orwig, D.A.; D’Amato, A.W.; et al. Wildlands and Woodlands: A Vision for the New England Landscape; Harvard University Press: Petersham, MA, USA; Cambridge, MA, USA, 2010. [Google Scholar]
  31. Hall, B.; Motzkin, G.; Foster, D.R.; Syfert, M.; Burk, J. Three hundred years of forest and land-use change in Massachusetts, USA. J. Biogeogr. 2002, 29, 1319–1335. [Google Scholar] [CrossRef]
  32. Thomas, J.W. Wildlife Habitats in Managed Forests: The Blue Mountains of Oregon and Washington; Wildlife Management Institute: U.S. Department of Interior, Bureau of Land Management: U.S.G.P.O.: Washington, DC, USA, 1979.
  33. Burns, R.M.; Honkala, B.H. Silvics of North America: Vol. 2. Hardwoods; U.S. Department of Agriculture, Forest Service: U.S.G.P.O.: Washington, DC, USA, 1991.
  34. Yamaguchi, D.K. A simple method for cross-dating increment cores from living trees. Can. J. For. Res. 1991, 21, 414–416. [Google Scholar] [CrossRef]
  35. Tardif, J.C.; Conciatori, F. A comparison of ring-width and event-year chronologies derived from white oak (Quercus alba) and northern red oak (Quercus rubra), southwestern Quebec, Canada. Dendrochronologia 2006, 23, 133–138. [Google Scholar] [CrossRef]
  36. Holmes, R.L. Computer-assisted quality control in tree-ring dating and measurement. Tree Ring Bull. 1983, 43, 69–78. [Google Scholar]
  37. Bunn, A.G. A dendrochronology program library in R (dplR). Dendrochronologia 2008, 26, 115–124. [Google Scholar] [CrossRef]
  38. Team, R.D.C. R: A Language and Environment for Statistical Computing; R Foundation for Statistical Computing: Vienna, Austria, 2009. [Google Scholar]
  39. Holm, S. A simple sequentially rejective multiple test procedure. Scand. J. Stat. 1979, 6, 65–70. [Google Scholar]
  40. Rice, W.R. Analyzing tables of statistical tests. Evolution 1989, 43, 223–225. [Google Scholar] [CrossRef]
  41. Ducey, M.J.; Knapp, R.A. A stand density index for complex mixed species forests in the northeastern United States. For. Ecol. Manag. 2010, 260, 1613–1622. [Google Scholar] [CrossRef]
  42. Olson, D.J. Site Index Curves for Upland Oak in the Southeast; Southeastern Forest Experiment Station, Forest Service, U.S. Department of Agriculture: Asheville, NC, USA, 1959. [Google Scholar]
  43. Carmean, W.H.; Hahn, J.T.; Jacobs, R.D. Site Index Curves for Forest Tree Species in the Eastern United States; U.S. Department of Agriculture, Forest Service, North Central Forest Experiment Station: Saint Paul, MN, USA, 1989. [Google Scholar]
  44. Burnham, K.P.; Anderson, D.R. Model Selection and Multimodel Inference: A Practical Information Theoretic Approach; Springer: New York, NY, USA, 2002. [Google Scholar]
  45. National Oceanic and Atmospheric Administration, National Climatic Data Center. Massachusetts Palmer Drought Severity Index. Available online: http://www.ncdc.noaa.gov/cag/time-series/us (accessed on 31 August 2014).
  46. Biondi, F.; Waikul, K. DENDROCLIM2002: A C++ program for statistical calibration of climate signals in tree-ring chronologies. Comput. Geosci. 2004, 30, 303–311. [Google Scholar] [CrossRef]
  47. Palmer, W.C. Meteorological Drought; Research Paper No. 45. U.S.; Weather Bureau. U.S.; Government Printing Office: Washington, DC, USA, 1965; p. 58. [Google Scholar]
  48. Abrams, M.D. Distribution, historical development and ecophysiological attributes of oak species in the eastern United States. Ann. Sci. For. 1996, 53, 487–512. [Google Scholar] [CrossRef]
  49. Swain, P.C.; Kearsley, J.B. Classification of the Natural Communities of Massachusetts; Natural Heritage & Endangered Species Program, Massachusetts Division of Fisheries and Wildlife: Westborough, MA, USA, 2001. Volume 1.3. Available online: http://www.mass.gov/eea/agencies/dfg/dfw/natural-heritage/natural-communities/classification-of-natural-communities.html# (accessed on 8 October 2014).
  50. Michelot, A.; Breda, N.; Damesin, C.; Dufrene, E. Differing growth responses to climatic variations and soil water deficits of Fagus sylvatica, Quercus petraea and Pinus sylvestris in a temperate forest. For. Ecol. Manag. 2012, 265, 161–171. [Google Scholar] [CrossRef]
  51. Orwig, D.A.; Abrams, M.D. Variation in radial growth responses to drought among species, site, and canopy strata. Trees Struct. Funct. 1997, 11, 474–484. [Google Scholar] [CrossRef]
  52. Muzika, R.M.; Liebhold, A.M. Changes in radial increment of host and nonhost tree species with gypsy moth defoliation. Can. J. For. Res. 1999, 29, 1365–1373. [Google Scholar] [CrossRef]
  53. Wickman, B.E. Increased growth of white fir after a douglas-fir tussock moth outbreak. J. For. 1980, 78, 31–33. [Google Scholar]
  54. Lilja, R.L.; Simmons, M.J.; (USDA Forest Service, Forest Health Protection, Durham, NH, USA.). Compilation of Massachusetts Insect and Disease Detection Survey Data from 1997–2010. Extracted from the Forest Health Technology Enterprise Team database of annual Insect and Disease Detection Surveys (IDS) conducted by Massachusetts Department of Conservation and Recreation and USDA Forest Service. Unpublished work. 2014.
  55. Daniels, L.D.; Dobry, J.; Klinka, K.; Feller, M.C. Determining year of death of logs and snags of Thuja plicata in southwestern coastal British Columbia. Can. J. For. Res. Rev. 1997, 27, 1132–1141. [Google Scholar] [CrossRef]
  56. Yamasaki, M.; Leak, W.B. Snag longevity in managed northern hardwoods. North. J. Appl. For. 2006, 23, 215–217. [Google Scholar]
  57. Garber, S.M.; Brown, J.P.; Wilson, D.S.; Maguire, D.A.; Heath, L.S. Snag longevity under alternative silvicultural regimes in mixed-species forests of central Maine. Can. J. For. Res. 2005, 35, 787–796. [Google Scholar] [CrossRef]
  58. Lee, Y.J. Predicting mortality for even-aged stands of lodgepole pine. For. Chron. 1971, 47, 29–32. [Google Scholar] [CrossRef]
  59. Hamilton, D.A. A logistic model of mortality in thinned and unthinned mixed conifer stands of northern Idaho. For. Sci. 1986, 32, 989–1000. [Google Scholar]
  60. Fortin, M.; Bedard, S.; DeBlois, J.; Meunier, S. Predicting individual tree mortality in northern hardwood stands under uneven-aged management in southern Quebec, Canada. Ann. For. Sci. 2008, 65, 12. [Google Scholar] [CrossRef]
  61. Monserud, R.A.; Sterba, H. Modeling individual tree mortality for Austrian forest species. For. Ecol. Manag. 1999, 113, 109–123. [Google Scholar] [CrossRef]
  62. Eid, T.; Tuhus, E. Models for individual tree mortality in Norway. For. Ecol. Manag. 2001, 154, 69–84. [Google Scholar] [CrossRef]
  63. McGarrigle, E.; Kershaw, J.A.; Ducey, M.J.; Lavigne, M.B. A new approach to modeling stand-level dynamics based on informed random walks: Influence of bandwidth and sample size. Forestry 2013, 86, 377–389. [Google Scholar] [CrossRef]
  64. Davidson, C.B.; Gottschalk, K.W.; Johnson, J.E. Tree mortality following defoliation by the European gypsy moth (Lymantria dispar L.) in the United States: A review. For. Sci. 1999, 45, 74–84. [Google Scholar]
  65. Fosbroke, D.E.; Hicks, R.R., Jr. Tree Mortality Following Gypsy Moth Defoliation in Southwestern Pennsylvania. In Proceedings of the 7th Central Hardwood Conference, Carbondale, Illinois, USA, 1989; Rink, G., Budelsky, C.A., Eds.; USDA Forest Service: Carbondale, IL, USA; pp. 74–80.
  66. Simberloff, D.; Von Holle, B. Positive interactions of nonindigenous species: Invasional meltdown? Biol. Invasions 1999, 1, 21–32. [Google Scholar] [CrossRef]
  67. Frappier, B.; Eckert, R.T.; Lee, T.D. Experimental removal of the non-indigenous shrub Rhamnus frangula (glossy buckthorn): Effects on native herbs and woody seedlings. Northeast. Nat. 2004, 11, 333–342. [Google Scholar] [CrossRef]
  68. Burnham, K.M.; Lee, T.D. Canopy gaps facilitate establishment, growth, and reproduction of invasive Frangula alnus in a Tsuga canadensis dominated forest. Biol. Invasions 2010, 12, 1509–1520. [Google Scholar] [CrossRef]
  69. Brazee, N.J.; Wick, R.L. Armillaria species distribution on symptomatic hosts in northern hardwood and mixed oak forests in western Massachusetts. For. Ecol. Manag. 2009, 258, 1605–1612. [Google Scholar] [CrossRef]
  70. Brazee, N.J.; Marra, R.E.; Wick, R.L. Genotypic diversity of Armillaria gallica from mixed oak forests in Massachusetts. Mycologia 2012, 104, 53–61. [Google Scholar] [CrossRef] [PubMed]
  71. Staley, J.M. Decline and mortality of red and scarlet oaks. For. Sci. 1965, 11, 2–17. [Google Scholar]
  72. Wargo, P.M. Consequences of environmental stress on oak: Predisposition to pathogens. Ann. Sci. For. 1996, 53, 359–368. [Google Scholar] [CrossRef]
  73. Houston, D.R. A Host-Stress-Saprogen Model for Forest Dieback-Decline Diseases. In Forest Decline Concepts; Manion, P.D., Lachance, D., Eds.; APS Press: St. Paul, MN, USA, 1992. [Google Scholar]
  74. Wargo, P.M. Armillariella mellea and Agrilus bilineatus and mortality of defoliated oak trees. For. Sci. 1977, 23, 485–492. [Google Scholar]

