Article

Genetic Diversity and Population Structure of Toona Ciliata Roem. Based on Sequence-Related Amplified Polymorphism (SRAP) Markers

1
College of Biological Sciences and Technology, Beijing Forestry University, Beijing 100083, China
2
College of Forestry and Landscape Architecture, South China Agricultural University, Guangzhou, Guangdong 510642, China
3
State Key Laboratory for Conservation and Utilization of Subtropical Agro-bioresources, Guangzhou, Guangdong 510642, China
4
Guangdong Key Laboratory for Innovative Development and Utilization of Forest Plant Germplasm, Guangzhou, Guangdong 510642, China
*
Author to whom correspondence should be addressed.
Submission received: 17 December 2014 / Revised: 13 March 2015 / Accepted: 1 April 2015 / Published: 8 April 2015

Abstract

:
Sequence-related amplified polymorphism (SRAP) markers were used to investigate the genetic diversity among 30 populations of Toona ciliata Roem. sampled from the species’ distribution area in China. To analyze the polymorphism in the SRAP profiles, 1505 primer pairs were screened and 24 selected. A total of 656 SRAP bands ranging from 100 to 1500 bp were acquired, of these 505 bands (77%) were polymorphic. The polymorphism information content (PIC) values ranged from 0.32 to 0.45, with an average of 0.41. An analysis of molecular variance (AMOVA) indicated that the most significant variation was attributable to differences among the populations and that variation within the populations was small. STRUCTURE analysis divided the 30 populations into two parts. The unweighted pair group method of arithmetic averages (UPGMA) clustering and principal coordinates analysis (PCoA) showed that the 30 populations could be classified into four types. The results demonstrate a clear geographical trend for T. ciliata in China and provide a theoretical basis for future breeding and conservation strategy of T. ciliata.

1. Introduction

Toona ciliata Roem. (family Meliaceae) is a deciduous or semi-deciduous tree. It is one of the precious timber species in China and listed as a level II national key protected wild plant in the China Plant Red Data Book [1]. The flowers are small and hermaphroditic, with the pollen spread primarily by wind. The seeds are light with wings, dispersed mainly by wind also. Propagation by seed is most common. T. ciliata is mostly distributed in hilly and mountainous areas, and its vertical distribution range is extensive [2]. Commonly known as Chinese mahogany, the tree grows with straight trunk and produces red wood with beautiful grains [3]. Low natural regeneration and over-exploitation have resulted in the continual decline of T. ciliata leading to it being classified as an endangered species. It is also listed on China’s reference list of cultivated rare species [4]. Given the huge developmental potential of this species, it has become the focus of a development and utilization program targeting the planting of fast-growing timber species in southern China [5,6,7]. In addition, the China’s State Forestry Administration strictly controls the cutting of T. ciliata in order to protect and manage well. [8]. An in-depth study of the species, focusing on understanding its traits to improve breeding and cultivation, will be of great significance and value in forestry production and industrial development [9]. As a rare and endangered species, analyses of the genetic diversity and structure in T. ciliata are particularly important for species conservation, exploration of genetic resources, and development of breeding programs.
Molecular markers are useful and effective for assessing genetic diversity and population structure of plant species. Molecular markers that can be directly estimated from DNA are the most widely used type of genetic marker in forestry studies for several reasons. They can be obtained from plants of any growth stage and are not influenced by environmental or seasonal factors [10,11]. Of the various molecular marker techniques available, sequence-related amplified polymorphism (SRAP) is a novel third-generation technique. The SRAP protocol is a polymerase chain reaction (PCR) based marker system designed to amplify open reading frames (ORFs) [12,13]. The protocol is simple, efficient, and has a high production rate. It has been used successfully in genetic diversity analysis and construction of genetic maps of many plant species [14,15,16,17,18,19,20,21,22,23].
Due to the sporadic natural distribution of T. ciliata, its genetic diversity has not been investigated systematically; this has seriously hampered further study on the development and utilization of this species. In this study, SRAP was used for the first time to assess the genetic diversity of 30 populations of T. ciliata in China to define the level of genetic diversity and the relationships among different populations. The data further provide a theoretical and experimental basis for future breeding, evaluation, management, and conservation of the species.

2. Materials and Methods

2.1. Plant Material

Samples from 30 populations of T. ciliata were collected from distribution range in 11 provinces of in China. Information regarding the plant materials is provided in Table 1. The number of parent trees representing each population was 30; a few had less due to small population size. The distance between mother trees was at least 50 m in order to reduce the probability of sampling trees that were closely related. Young, healthy leaves were collected, dried with silica gel, then stored at −80 °C until DNA extraction.
Table 1. Location of 30 populations of T. ciliata used in this study.
No.CodeProvinceLatitude (°′ N)Longitude (°′ E)Sample Number
1YFGuangdong22°46′111°34′15
2LCGuangdong25°07′113°20′20
3JXAnhui30°41′118°24′30
4HSAnhui30°16′118°08′6
5CHGuizhou24°59′105°48′30
6GLGuizhou25°52′105°3730
7WMGuizhou25°10′106°05′30
8LDGuizhou25°25′106°44′30
9XYGuizhou25°06′104°54′30
10PPYunnan25°04′99°06′30
11PEYunnan22°46′100°58′30
12PWYunnan22°23′101°04′30
13YRYunnan25°01′101°32′30
14GSJiangxi27°19′115°26′30
15JLSJiangxi24°54′114°47′30
16JGSJiangxi26°44′114°17′30
17WYSJiangxi28°18′117°42′30
18MTSJiangxi27°41′117°03′30
19HPSHunan29°01′111°41′30
20CBHunan27°14′111°28′30
21XNHunan28°18′109°44′32
22TLGuangxi24°17′106°13′30
23LLGuangxi24°46′105°20′30
24XLGuangxi24°29′105°05′30
25XJZhejiang28°45′119°92′30
26SCZhejiang28°59′119°25′30
27NPFujian26°38′118°10′30
28SPHubei30°17′109°28′30
29HDSichuan27°23′102°09′30
30DCSichuan26°40′102°32′30

2.2. DNA Extraction

About 100 mg dried leaves were used for DNA extraction using EZNA® High-Performance DNA Mini Ki (Omega Bio-Tek Inc., Norcross, GA, USA) and the quality of DNA was tested by 0.8% (w/v) agarose gel electrophoresis. DNA concentrations were measured with an ultraviolet spectrophotometer, adjusted to 50 ng μL−1, and stored at −20 °C for PCR amplification.

2.3. SRAP Analysis

The SRAP technique followed a combination of two primers with arbitrary sequences: a forward primer of 17 bases and a reverse primer of 18 bases. Pairs of primers with AT- or GC-rich cores were used to amplify intragenic fragments for polymorphism detection. Both the forward and reverse primers contained three elements: a 5’ 10–11-base filler of different but no specific sequence, a CCGG sequence in the forward primer and AATT in the reverse primer, and a 3’ three-nucleotide selective sequence. Variation in these three selective nucleotides generated a set of primers sharing the same core sequence [13].
Eight individual plant materials from different populations were used for the initial screening. In a subsequent test of material from 16 individuals, 24 different combinations of primers, including 14 forward and 15 reverse primers, were employed. The SRAP primer sequences are listed in Table 2. For SRAP analysis, PCR amplification was carried out in a total volume of 25 μL, containing 1 μL 50 ng μL−1 template DNA, 2.5 μL 10 × PCR buffer (100 mM Tris-HCl, pH 8.3, 500 mM KCl), 2 μL 2.5 mM each deoxy-ribonucleoside triphosphate (dNTP), 0.75 μL 10 mM each primer, 2.5 μL 25 mM MgCl2, and 2 U Taq DNA polymerase (TaKaRa). PCR amplification began with a 5-min denaturation at 94 °C followed by five cycles of three steps (1 min of denaturing at 94 °C, 1 min of annealing at 35 °C, and 1 min of elongation at 72 °C). The next 35 cycles used the same three steps, but with an annealing temperature of 50 °C, and were followed by a final elongation step of 10 min at 72 °C. PCR products were separated on 6% denatured polyacrylamide gels and detected by silver staining. Gels were photographed or dried for the following analysis.
Table 2. Primer sequences used in SRAP analysis of T. ciliata.
PrimerPrimer Combination Sequences
Me17Em21F:5’TGA GTA CAA ACC GG TAG 3’R:5’GAC TGC GTA CGA ATT TCG 3’
Me19Em13F:5’TGA GTA CAA ACC GG TTG 3’R:5’GAC TGC GTA CGA ATT CTA 3’
Me19Em15F:5’TGA GTA CAA ACC GG TTG 3’R:5’GAC TGC GTA CGA ATT CTT 3’
Me19Em27F:5’TGA GTA CAA ACC GG TTG 3’R:5’GAC TGC GTA CGA ATT CCA 3’
Me22Em21F:5’TGA GTA CAA ACC GG GTC 3’R:5’GAC TGC GTA CGA ATT CCA 3’
Me22Em27F:5’TGA GTA CAA ACC GG GTC 3’R:5’GAC TGC GTA CGA ATT CCA 3’
Me23Em22F:5’TGA GTA CAA ACC GG AGT 3’R:5’GAC TGC GTA CGA ATT GTC 3’
Me23Em31F:5’TGA GTA CAA ACC GG AGT 3’R:5’GAC TGC GTA CGA ATT CTCA 3’
Me27Em28F:5’TGA GTA CAA ACC GG GAT 3’R:5’GAC TGC GTA CGA ATT TGA 3’
Me27Em7F:5’AGC GAG CAA GCC GG GAT 3’R:5’GAC TGC GTA CGA ATT GAG 3’
Me28Em18F:5’GAC CAG TAA ACC GG TGG 3’R:5’GAC TGC GTA CGAATT AGC 3’
Me31Em24F:5’TGA GTA CAA ACC GG ATG 3’R:5’GAC TGC GTA CGA ATT CAG 3’
Me32Em17F:5’GAG CGT CGA ACC GG GAA 3’R:5’GAC TGC GTA CGAATTCAG 3’
Me32Em26F:5’GTA CAT AGA ACC GG GAA 3’R:5’GAC TGC GTA CGA ATT CAG 3’
Me34Em13F:5’GTA CAT AGA ACC GG TAT 3’R:5’GAC TGC GTA CGAATT CAG 3’
Me35Em13F:5’GTA CAT AGA ACC GG ATG 3’R:5’GAC TGC GTA CGAATT CAG 3’
Me35Em14F:5’TAC GAC GAA TCC GG ATG 3’R:5’GAC TGC GTA CGAATT CAG 3’
Me35Em32F:5’CAC AGT CAT GCC GG ATG 3’R:5’GAC TGC GTA CGA ATT ATT 3’
Me38Em21F:5’CAC AGT CAT GCC GG AGT 3’R:5’GAC TGC GTA CGAATT ATT 3’
Me38Em24F:5’ATC AGT CGG ACC GG AGT 3’R:5’GAC TGC GTA CGAATT ATT 3’
Me39Em32F:5’GTA CAT AGA ACC GG ACT 3’R:5’GAC TGC GTA CGAATT ATT 3’
Me40Em13F:5’TAC GAC GAA TCC GG ACT 3’R:5’GAC TGC GTA CGA ATT CTA 3’
Me40Em22F:5’CAC AGT CAT GCC GG ACT 3’R:5’GAC TGC GTA CGAATT GTC 3’
Me43Em19F:5’CAC AGT CAT GCC GG ATT 3’R:5’GAC TGC GTA CGAATT ACG 3’

2.4. Data Analyses

Amplified fragments with the same gel mobility were scored as 1 for presence or 0 for absence to generate a binary data matrix. Differences in band strength were ignored. POPGENE1.32 was used to estimate genetic diversity parameters [24,25,26], including Shannon’s information index (I), Nei’s gene diversity (H), effective number of alleles (Ne), observed number of alleles (Na), genetic differentiation (Gst), and Nei’s genetic distance (1978). Pair-wise Nei’s genetic distance estimates were subjected to a cluster analysis by the UPGMA (unweighted pair group method with arithmetic average) method [27]. The degree of genetic relatedness among populations was assessed by principal coordinates analysis (PCoA). Analysis of molecular variance (AMOVA) based on the allele frequency data was performed to explore the genetic differentiation among and within populations [28] using GenAIEx 6.5. STRUCTURE 2.3 was used to analyze the genetic structure [29] using a model based on Bayesian method and genotype data to assign individuals to different clustering. ΔK was calculated through the second order change rate of L (K) between adjacent K value [30].
The polymorphism information content (PIC) was used to evaluate the distinguishing ability of SRAP markers in the assessment of genetic diversity with different primer combinations:
PICi = 2fi (1 – fi)
where PICi is the PIC of marker i, fi is the frequency of present marker fragments, and 1-fi is the frequency of absent marker fragments. The PIC value of each primer combination was the average of the bands [25].

3. Results

3.1. SRAP Fragments Amplified Polymorphism Analysis

Twenty-four primer pairs of 1505 primer combinations tested yielded clear, high-stability polymorphic bands. Table 3 shows the total number of bands, the number of polymorphic bands, the percentage of polymorphic bands (PPB) and PIC obtained from the SRAP primer combinations. A total of 656 bands were amplified, of which 505 (77%) were polymorphic. The number of bands of each primer combination ranged from 19 to 36, with an average of 27. The number of polymorphic fragments ranged from 14 to 29, with an average of 21. Each primer combination amplified multiple fragments and polymorphism bands. Polymorphism was highest for the Me39Em32 primer combination (94.74%), while Me35Em32 had the lowest polymorphism (51.85%).
Table 3. Total number of bands, polymorphic bands, polymorphism and polymorphic information content (PIC) obtained from 24 SRAP primer combinations.
Primer CombinationsTotal No. of BandsPolymorphic BandsPolymorphism (%)PIC
Me17Em21272177.780.38
Me19Em13252184.000.42
Me19Em15262388.460.42
Me19Em27252184.000.41
Me22Em21262180.770.41
Me22Em27282071.430.41
Me23Em22302686.670.44
Me23Em31282175.000.41
Me27Em28252184.000.39
Me27Em7252184.000.44
Me28Em18362775.000.40
Me31Em24362980.560.43
Me32Em17282071.430.43
Me32Em26322887.500.42
Me34Em13251976.000.39
Me35Em13271555.560.42
Me35Em14261557.690.40
Me35Em32271451.850.45
Me38Em21241979.170.39
Me38Em24292172.410.42
Me39Em32191894.740.43
Me40Em13282382.140.42
Me40Em22211571.430.33
Me43Em19332678.790.43
Total6565051850.36
Mean27.3321.0477.100.41
PIC revealed the discriminatory power of the various primer combinations. The highest PIC value, 0.45, was obtained for Me35Em32 combination, followed by 0.44 for Me23Em22 and Me27Em7, and 0.43 for Me31Em24, Me32Em17, Me39Em32 and Me43Em19. The primer combinations with the higher PIC values could be used to develop a rapid detection method [31,32,33]. The primer combination Me17Em27 had the lowest PIC value of 0.32.

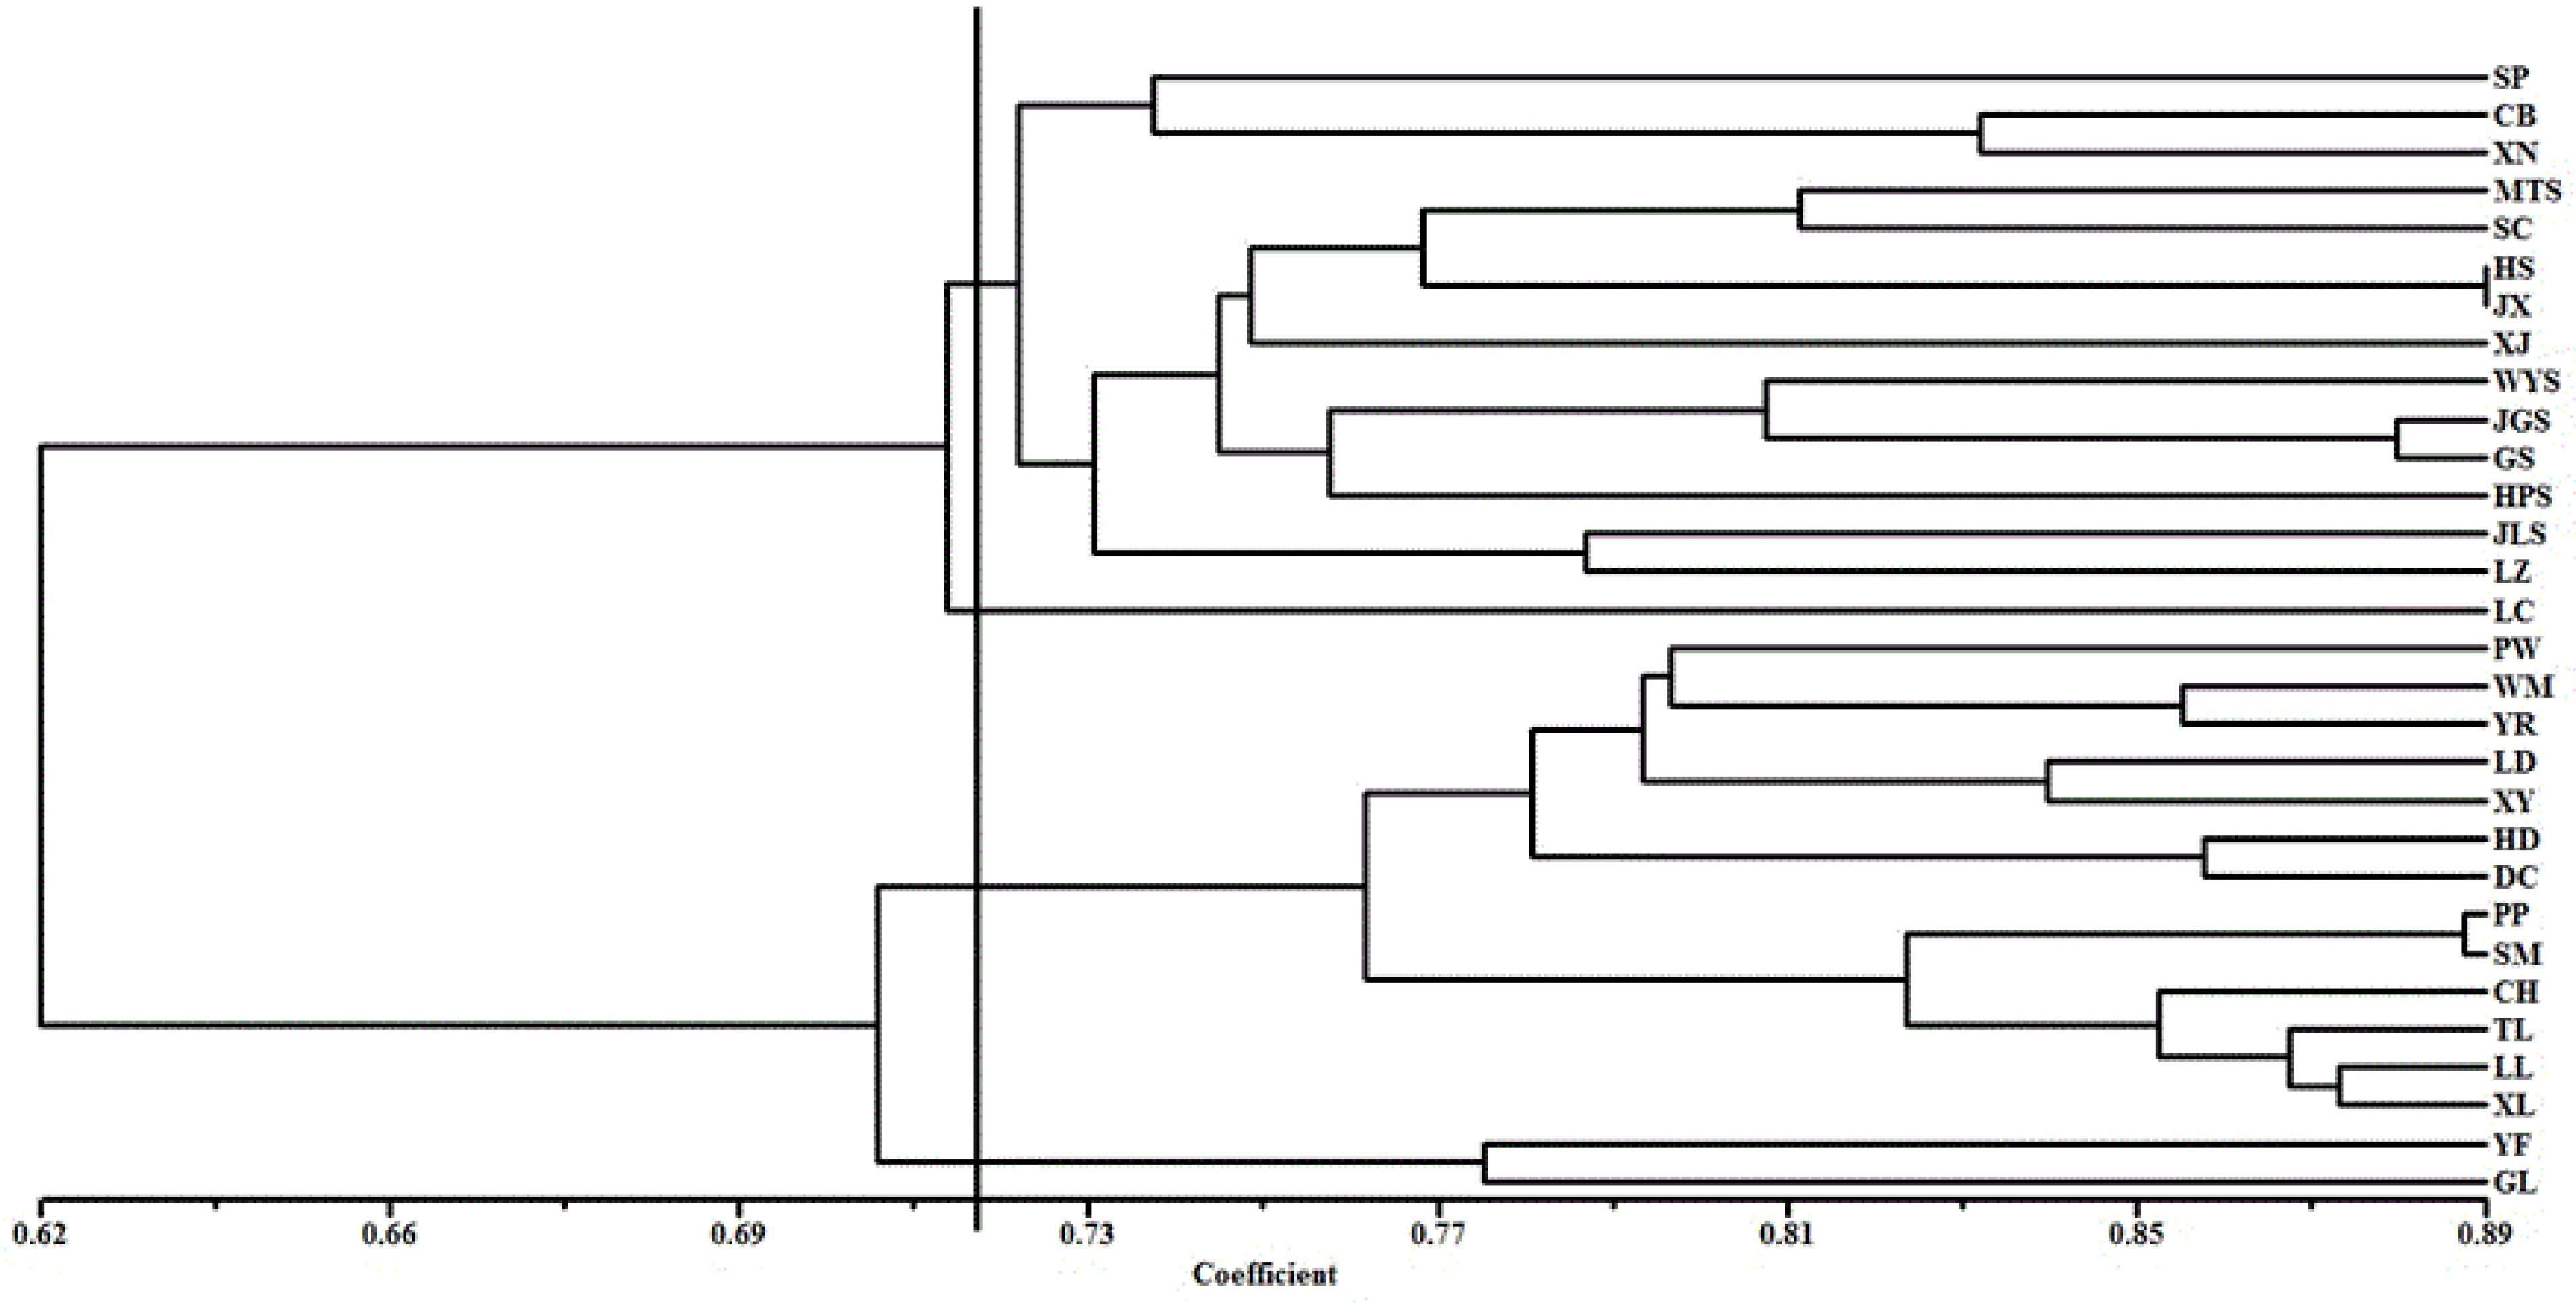
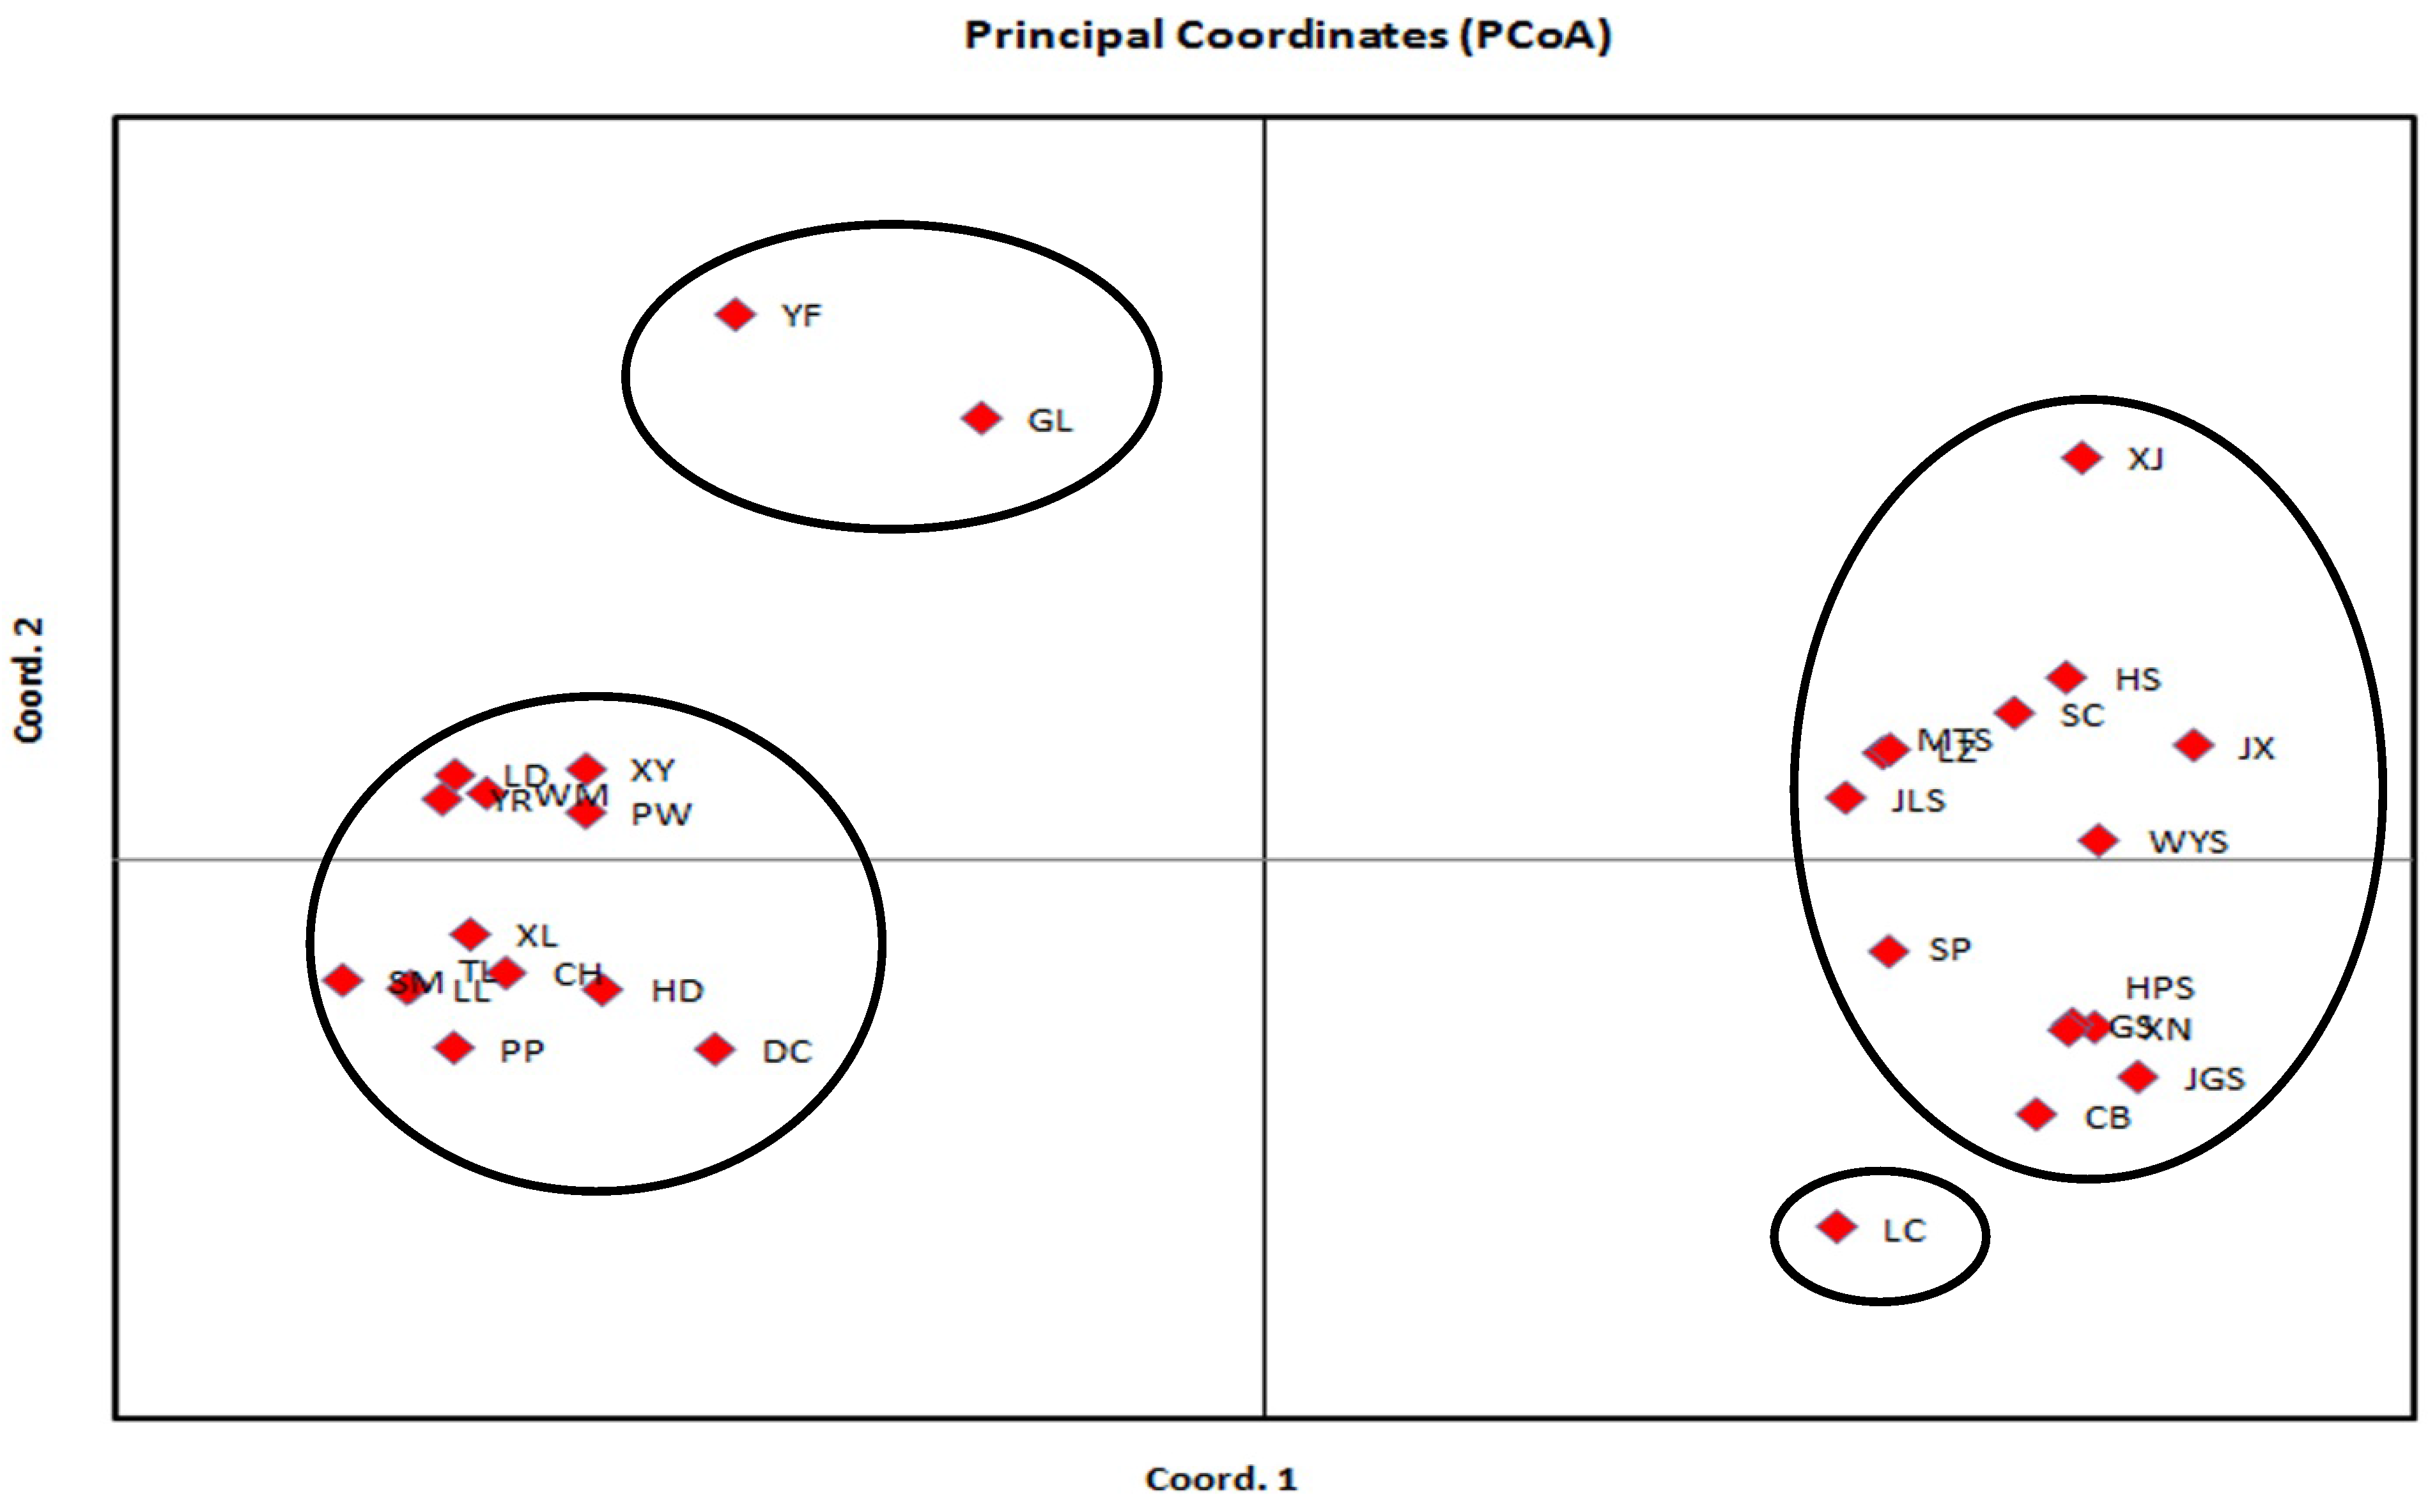
3.2. Genetic Relationship Analysis Based on SRAP

The PPB of T. ciliata was 77.10%. The average value of Nei’s gene diversity index (H) was 0.3775. Shannon’s information index (I) ranged from 0.1748 to 0.4482. The average number of alleles (Na) and effective number of alleles (Ne) were 1.7710 and 1.6587, respectively. According to POPGENE analysis, the total genetic diversity (Ht) was 0.3876, the genetic diversity within populations (Hs) was 0.1237, the coefficient of genetic differentiation (Gst) was 0.6809, and the estimate of gene flow (Nm) was 0.2343.
The dendrogram of genetic relationships based on the UPGMA clustering method is shown in Figure 1. The 30 T. ciliata populations could be classified into four major clusters. The result was consistent with biplot of PCoA analysis shown in Figure 2 (the contribution percentage of the first and second principal components was 52.76% and 60.12%, respectively). The first group consisted of the 14 populations from Hubei, Hunan, Jiangxi, Fujian, Zhejiang and Anhui provinces. The second group had only one accession, LC, which originated from Guangdong Province. The 13 populations from Guizhou (excluding GL), Sichuan and Yunnan were grouped in the third cluster. Group four was composed of populations from YF (Guangdong) and GL (Guizhou). The genetic distances among the four clusters are shown in Table 4.
Figure 1. Phylogenetic dendrogram based on the genetic distance by the UPGMA cluster in the 30 populations of T. ciliata.
Forests 06 01094 g001

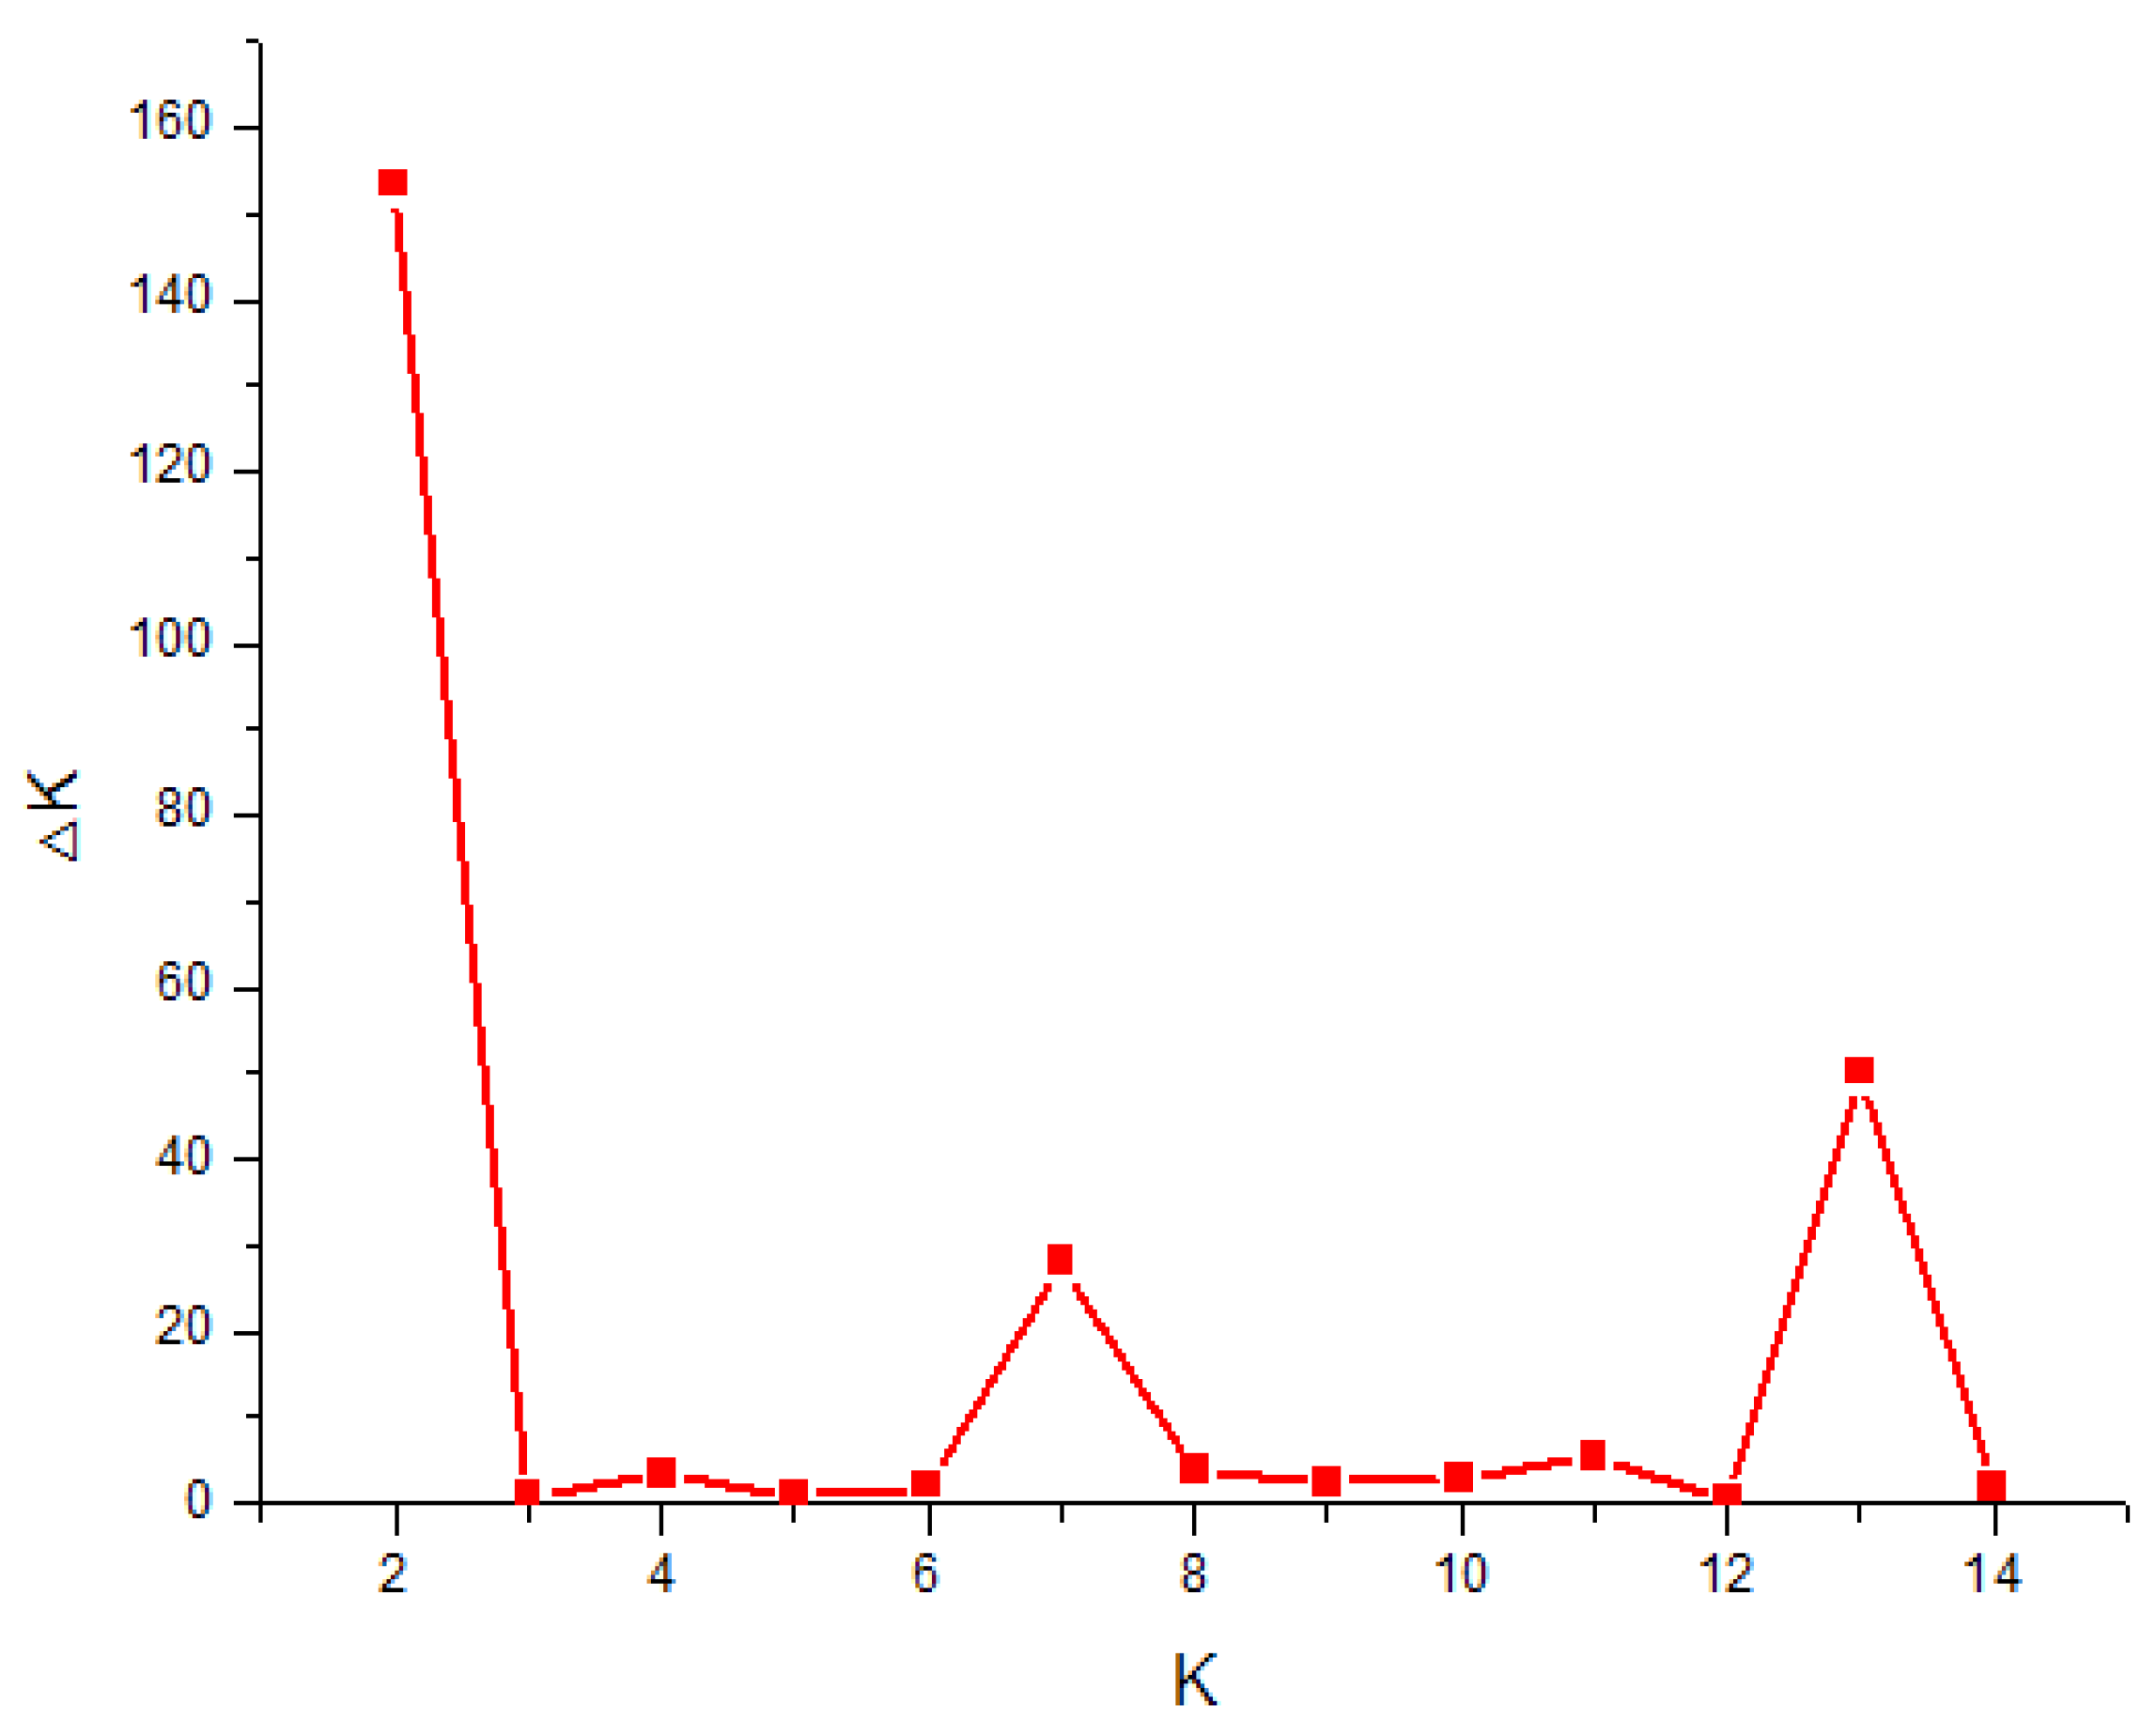
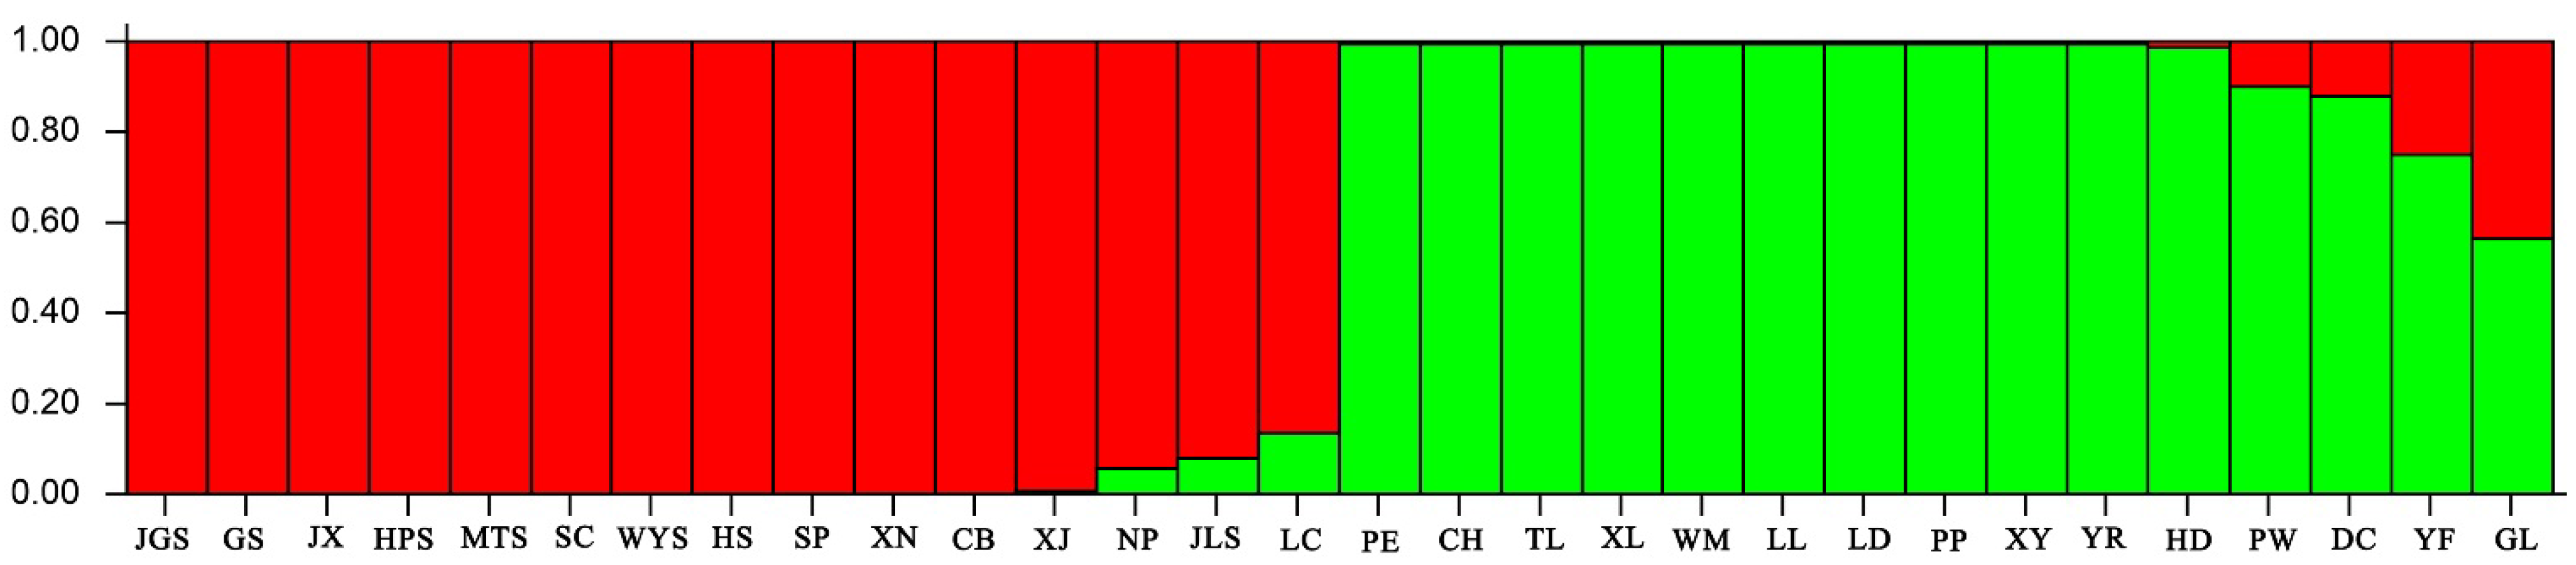
3.3. Genetic Structure Analysis

Results of the model STRUCTURE is showed in Figure 3. The 30 T. ciliata populations were divided into two groups. Group I included the populations from central and eastern China. The populations of southwest and south China formed Group II (Figure 4). NP, JLS and LC were in a state of transition.

3.4. AMOVA Analysis

AMOVA showed that 79.24% of the total variation resided among populations, while the proportion of total variation within populations was 20.76%. (Table 5). These findings are consistent with those from the genetic diversity analysis in this study.
Figure 2. Biplot of the principle coordinates analysis of 30 T. ciliata populations. Codes of populations follow those given in Table 1.
Forests 06 01094 g002
Table 4. The genetic distances among the four clusters of T. ciliata.
1234
1****
20.3347****
30.23210.5383****
40.30380.64080.2070****
Figure 3. Relations between K and ΔK.
Forests 06 01094 g003
Figure 4. Clustering results of 30 T. ciliata populations using STRUCTURE.
Forests 06 01094 g004
Table 5. Analysis of molecular variance (AMOVA) of 30 T. ciliata populations.
SourcedfSum of SquaresMean SquaresVariation ComponentPercentage of Variance (%)ΦstP
Among Pops2940,273.1401388.72981.97979.24%0.7920.001
Within Pops47510,197.63221.46921.46920.76%
Total50450,470.772 103.448100%

4. Discussion

To the best of our knowledge, this study was the first time to use the SRAP molecular marker to evaluate the genetic diversity of T. ciliata. Results show that the novel SRAP marker was suitable for distinguishing T. ciliata.
Polymorphic loci are amplified DNA fragments from sites with a frequency of less than 0.99 [34]. The percentage of polymorphic bands (PPB) is an important indicator of the level of genetic variation in a species and an important parameter for measuring genetic diversity. In general, if the PPB of population is high, the population has strong ability to adapt to the environment. On the contrary, a population that has low PPB is unlikely to adapt to the environment and may be eliminated in the long-term evolution [34]. The PPB was 77.10% in this study, indicating a certain degree of genetic variation among populations. For the PIC, when the PIC > 0.5, 0.25 < PIC < 0.5, or the value < 0.25, loci polymorphism could be classified as high, medium, or low, respectively [31,32,33]. In this study, Me35Em32 was the most informative primer combination for genetic diversity studies among T. ciliata. Twenty-four SRAP primer combinations had an average value of 0.41, indicating that the SRAP markers could be used to identify polymorphic loci for assessment of the genetic variation among T. ciliata. Shannon’s information index (I) indicates the level of genetic diversity; a higher value indicates greater genetic diversity [35]. The I values for the 30 populations in the study ranged from 0.1748 to 0.4482, indicating various levels of genetic diversity. All of Nei’s gene diversity index (H), Shannon’s information index (I) and AMOVA result all showed that the most significant variation was attributed to differences among the populations, which revealed that population selection is important for the breeding of T. ciliata.
Through various studies on perennial woody plants, it is believed that species with longer lives have a broad distribution area spread by animal, possesses abundant genetic diversity [36,37,38]. The higher genetic diversity among populations of T. ciliata and the greater genetic differentiation among populations are closely correlated with their biological characteristics. As a perennial broad-leaf species, T. ciliata has a long life history. In addition, the main strategy of pollen spread is anemophily, and it carries out sexual propagation by virtue of the seeds [39], all of which lay the foundation for preserving the genetic diversity of T. ciliata during adaption to the living environment. Simultaneously, larger differences exist with regards to the natural distribution of T. ciliata, which has a broad natural distribution range [40]. Through long-term natural selection, T. ciliata has established an ability to survive through strong adaptation to the local environments. Its varying flowering period is an important expression of adaptive capacity. Influenced by air temperature, rain and sunshine, the populations close to southwest of China flower from March to June. The flowering period in other regions generally occurs from May to June. The habitat fragmentation that is influenced by constant changes and deterioration of the environment has probably caused the isolation of the species and intensified the genetic differentiation among populations. Additionally, T. ciliata has a long generation, which implies the low frequency of gene exchange.
A combination of mutation, genetic drift, and natural selection promotes both the differentiation of population genetics and the formation of genetic structure. However, gene flow weakens the genetic structure of a population [38,41]. A gene flow (Nm) value <1 indicates a greater degree of isolation between populations; thus gene flow is insufficient to overcome the differentiation caused by genetic drift [35]. In the current study, the Nm value of T. ciliata was 0.2343, revealing that gene flow among populations occurred and the extent of differentiation was moderate. The spread of T. ciliata pollen is limited, and seed dispersal spread is restrictive, so geographic isolation hindered gene exchange among populations, resulting in a lower and gene flow.
According to the genetic diversity (based on coefficient of 0.72), the 30 populations could be divided into four types that are essentially identical to those determined by PCoA analysis. LC population is from furthest north of Guangdong and formed its own cluster (Cluster II) separately. Its geographical isolation is due to the complex environment with mountain and hills and it is located close to Hunan and Jiangxi provinces. The genetic distance between LC and Cluster I was less than that between LC and Cluster III (Table 4), suggesting that LC is more closely related to the populations from central and eastern China. Cluster IV included two populations from YF (Guangdong) and GL (Guizhou). The YF population was later found to have been introduced from Nanyang (now known as Southeast Asia) in the process of seed investigation. After clustering based on SRAP, YF grouped only with GL (Guizhou). These findings suggest the conclusion that the populations of YF and GL populations may be from the same original source, and the genes they carry may be different from those carried by other populations, which should be further researched in the future. Genetic diversity and population structure data based on SRAP are a theoretical basis for more in-depth study and research on T. ciliata breeding. Additionally, in the process of breeding selection, growth indices, such as tree height, diameter and wood quality should be included to determine breeding materials in the same groups.
At present, the distribution of T. ciliata is scattered in China, and its natural regeneration is weak. Additionally, excessive development of the land and man-made interference increases geographic and genetic isolation, further hindering regeneration. To protect its economic value and guarantee sustainable development of its biodiversity, the protection and management should be strengthened. The conservation generally includes in situ (on-farm or wild) and ex situ (gene or field bank) approaches. The achieving complementary in situ and ex situ holdings is great important for perennial species [42]. As for the broad-leaf species, which has a longer life history, extant natural forests of T. ciliata exist in the form of ancient trees. Consequently, to protect the species, it is necessary to maintain the original living environment and alleviate the intensification of habitat fragmentation. Natural protection areas have been established in some natural distribution areas, providing local protection (in situ) for T. ciliata. In this study, the populations of Jiangxi were collected from natural protection areas, revealing the excellent effects of protection and management. While carrying out protection of the original habitat, we should take corresponding measures to cultivate and collect seeds for directive breeding (ex situ). Moreover, we should reinforce the technology of artificial reproduction. We will collect all current genetic resources and expand the range of collection as far as possible, especially those populations which have lower genetic diversity. Furthermore, we will carry out extensive research, combining pest control, biological studies, and breeding in various ways to develop and expand the directions for both protection and application.

Acknowledgments

This study was supported by the grants from public welfare projects of the National Forestry Bureau (201004020), People’s Republic of China.

Author Contributions

Pei Li designed and conducted the experiments, analyzed the data, and wrote the manuscript. Pei Li, Xin Zhan and Xiaomei Deng carried out the population collection. Quemin Qing, Wenting Qu, Juncheng Li, Junjie Zhang and Boyong Liao for DNA extraction and data analysis. Mingqian Liu and Ruiqi Pian for techbical assistance. Kunxi Ouyang and Xiaoyang Chen for their valuable comments to improve the initial manuscript. All authors read and approved the final manuscript.

Conflicts of Interest

The authors declare no conflict of interest.

References

  1. Chen, L.W.; Shi, Q.; Liang, G.; Cai, L.; He, G.Z. Tissue culture of precious timber species Toona ciliata Roem. Subtrop. Plant Sci. 2014, 43, 164–167. [Google Scholar]
  2. Liu, J.; Sun, Z.X.; Chen, Y.T.; Jiang, J.M. Isolation and characterization of microsatellite loci from an endangered tree species, Toona ciliata var. pubescens. Genet. Mol. Res. 2012, 11, 4411–4417. [Google Scholar] [CrossRef] [PubMed]
  3. Liang, R.L.; Liao, R.Y.; Dai, J. Endangered causes and protection strategy of Toona ciliata. Guangxi For. Sci. 2011, 40, 201–203. [Google Scholar]
  4. Wen, W.H.; Wu, J.Y.; Chen, M.G.; Chen, J.F.; Cheng, Y.; Wang, X.J.; Liu, Q. Seedling growth performance of Toona ciliate elite trees progeny. Chin. Agric. Sci. Bull. 2012, 28, 36–39. [Google Scholar]
  5. Zhou, G.S. The study of introdution and cultivation on valuable fast-growing species of Toona ciliata and Toona ciliata var. J. Fujian Coll. For. 1994, 14, 271–276. [Google Scholar]
  6. Liu, J.; Jiang, J.M.; Chen, Y.T. Genetic diversity of central and peripheral populations of Toona ciliata var. pubescens, an endangered tree species endemic to China. Genet. Mol. Res. 2014, 13, 4579–4590. [Google Scholar] [CrossRef] [PubMed]
  7. Huang, H.L.; Zhang, L.; Liao, C.K. Seed rain, soil seed bank, and natural regeneration of natural Toona ciliata var. pubescens forest. Ying Yong Sheng Tai Xue Bao 2012, 23, 972–978. [Google Scholar] [PubMed]
  8. Zhang, Z.R. Studied on Essential System of Forest Law of China. Master’s Thesis, Northeast Foresty University, Harbin, China, March 2004. [Google Scholar]
  9. Cheng, D.S.; Cui, T.L. Utilization Value and Cultivation Techniques of Toona sureni. For. Prod. Spec. China 2010, 4, 39–40. [Google Scholar]
  10. Jones, N.; Ougham, H.; Thomas, H.; Pasakinskiene, I. Markers and mapping revisited: Finding your gene. New Phytol. 2009, 183, 935–966. [Google Scholar] [CrossRef] [PubMed]
  11. Agarwal, M.; Shrivastava, N.; Padh, H. Advances in molecular marker techniques and their applications in plant sciences. Plant Cell Rep. 2008, 27, 617–631. [Google Scholar] [CrossRef] [PubMed]
  12. Sun, S.; Gao, W.; Lin, S.; Zhu, J.; Xie, B.; Lin, Z. Analysis of genetic diversity in ganoderma population with a novel molecular marker SRAP. Appl. Microbiol. Biotechnol. 2006, 72, 537–543. [Google Scholar] [CrossRef] [PubMed]
  13. Li, G.; Quiros, C. Sequence-related amplified polymorphism (SRAP), a new marker system based on a simple PCR reaction: Its application to mapping and gene tagging in Brassica. Theor. Appl. Genet. 2001, 103, 455–461. [Google Scholar] [CrossRef]
  14. Feng, N.; Xue, Q.; Guo, Q.; Zhao, R.; Guo, M. Genetic diversity and population structure of celosia argentea and related species revealed by SRAP. Biochem. Genet. 2009, 47, 521–532. [Google Scholar] [CrossRef] [PubMed]
  15. Yin, Y.; Liu, Y.; Li, H.; Zhao, S.; Wang, S.; Liu, Y.; Wu, D.; Xu, F. Genetic diversity of pleurotus pulmonarius revealed by RAPD, ISSR, and SRAP fingerprinting. Curr. Microbiol. 2014, 68, 397–403. [Google Scholar] [CrossRef] [PubMed]
  16. Jing, Z.B.; Wang, X.P.; Cheng, J.M. Analysis of genetic diversity among chinese wild vitis species revealed with SSR and SRAP markers. Genet. Mol. Res. 2013, 12, 1962–1973. [Google Scholar] [CrossRef] [PubMed]
  17. Alghamdi, S.; Al-Faifi, S.; Migdadi, H.; Khan, M.; EL-Harty, E.; Ammar, M. Molecular diversity assessment using sequence related amplified polymorphism (srap) markers in Vicia faba L. Int. J. Mol. Sci. 2012, 13, 16457–16471. [Google Scholar] [CrossRef] [PubMed]
  18. Aneja, B.; Yadav, N.R.; Chawla, V.; Yadav, R.C. Sequence-related amplified polymorphism (SRAP) molecular marker system and its applications in crop improvement. Mol. Breed. 2012, 30, 1635–1648. [Google Scholar] [CrossRef]
  19. Huang, C.; Liu, G.; Bai, C.; Wang, W. Genetic analysis of 430 Chinese cynodon dactylon accessions using sequence-related amplified polymorphism markers. Int. J. Mol. Sci. 2014, 15, 19134–19146. [Google Scholar] [CrossRef] [PubMed]
  20. Mokhtari, N.; Rahimmalek, M.; Talebi, M.; Khorrami, M. Assessment of genetic diversity among and within carthamus species using sequence-related amplified polymorphism (SRAP) Markers. Plant Syst. Evol. 2013, 299, 1285–1294. [Google Scholar] [CrossRef]
  21. Youssef, M.; James, A.C.; Rivera-Madrid, R.; Ortiz, R.; Escobedo-GraciaMedrano, R.M. Musa genetic diversity revealed by SRAP and AFLP. Mol. Biotechnol. 2011, 47, 189–199. [Google Scholar] [CrossRef] [PubMed]
  22. Ren, N.; Liu, J.; Yang, D.; Chen, J.; Luan, M.; Hong, J. Sequence-related amplified polymorphism (SRAP) marker as a new method for identification of endophytic fungi from Taxus. World J. Microbiol. Biotechnol. 2012, 28, 215–221. [Google Scholar] [CrossRef] [PubMed]
  23. Polat, I.; Kacar, Y.A.; Yesiloglu, T.; Uzun, A.; Tuzcu, O.; Gulsen, O.; Incesu, M.; Kafa, G.; Turgutoglu, E.; Anil, S. Molecular characterization of sour orange (Citrus Aurantium) accessions and their relatives using SSR and SRAP markers. Genet. Mol. Res. 2012, 11, 3267–3276. [Google Scholar] [CrossRef] [PubMed]
  24. Yu, J.; Jing, Z.B.; Cheng, J.M. Genetic diversity and population structure of stipa bungeana, an endemic species in Loess Plateau of China, revealed using combined ISSR and SRAP markers. Genet. Mol. Res. 2014, 13, 1097–1108. [Google Scholar] [CrossRef] [PubMed]
  25. Shen, J.; Jia, X.; Ni, H.; Sun, P.; Niu, S.; Chen, X. AFLP Analysis of genetic diversity of jatropha curcas grown in Hainan, China. Trees 2010, 24, 455–462. [Google Scholar] [CrossRef]
  26. Zhuang, F.M.; Ge, S. Data analysis in population genetics.I. analysis of RAPD data with AMOVA. Biodivers. Sci. 2002, 10, 438–444. [Google Scholar]
  27. Rohlf, F.J. NTSYSpc, Numerical Taxonomy and Multivariate Analysis System; Version 2.1; Exeter Publication Ltd Setauket: New York, NY, USA, 2000. [Google Scholar]
  28. Peakall, R.; Smouse, P.E. GenAlEx 6.5: Genetic analysis in Excel. Population genetic software for teaching and research—An update. Bioinformatics 2012, 28, 2537–2539. [Google Scholar] [CrossRef] [PubMed]
  29. Falush, D.; Stephens, M.; Pritchard, J.K. Inference of population structure using multilocus genotype data: Linked loci and correlated allele frequencies. Genetics 2003, 4, 1567–1587. [Google Scholar]
  30. Pritchard, J.K.; Stephens, M.; Donnelly, P. Inference of population structure using multilocus genotype data. Genetics 2000, 155, 945–959. [Google Scholar] [PubMed]
  31. Wang, S.; Liu, Y.; Ma, L.; Liu, H.; Tang, Y.; Wu, L.; Wang, Z.; Li, Y.; Wu, R.; Pang, X. Isolation and characterization of microsatellite markers and analysis of genetic diversity in Chinese jujube (Ziziphus Jujuba Mill.). PLoS ONE 2014, 9, e99842. [Google Scholar] [CrossRef] [PubMed]
  32. Xie, W.; Zhang, X.; Cai, H.; Liu, W.; Peng, Y. Genetic diversity analysis and transferability of cereal EST-SSR markers to orchardgrass (Dactylis Glomerata L.). Biochem. Syst. Ecol. 2010, 38, 740–749. [Google Scholar] [CrossRef]
  33. Botstein, D.; White, R.L.; Skolnick, M.; Davis, R.W. Construction of a genetic linkage map in man using restriction fragment length polymorphisms. Am. J. Hum. Genet. 1980, 32, 314–331. [Google Scholar] [PubMed]
  34. He, X.Y. Studied on Genetic of Zenia insignis Provenances and Their Resistance to Low Temperature Stress. Ph.D. Thesis, Central South University of Forestry and Technology, Changsha, China, July 2007. [Google Scholar]
  35. Huang, Y. Analysis of camellia meiocarpa genetic diversity based on srap markers. Sci. Silv. Sin. 2013, 49, 43–50. [Google Scholar]
  36. Hamrick, J.K; Godt, M.J.W.; Sherman, S.L. Factors influencing levels of genetic diversity in woody plant species. New For. 1992, 6, 95–124. [Google Scholar] [CrossRef]
  37. Xu, B.; Zhang, F.Q.; Pan, W. Genetic diversity and genetic structure in natural populations of castanopsis hysitrix from its main distribution in China. Sci. Silv. Sin. 2013, 49, 162–166. [Google Scholar]
  38. Li, C. Investigation on Adaptive Genetic Variation of Castanopsis Fargesii Using EST-SSR Molecular Markers. Master’s Thesis, South China Botanical Garden of Chinese Academy of Sciences, Guangzhou, China, May 2012. [Google Scholar]
  39. Liu, J.; Chen, Y.T.; Sun, Z.X. Spatial Genetic Structure of Toona ciliata var .pubescens Populations in Terms of Spatial Autocorrelation Analysis. Sci. Silv. Sin. 2008, 44, 45–52. [Google Scholar]
  40. Kong, C. Genentic Response of Toona ciliata var. Pubescens Families to Soil Nitrogen and Phosphorus Level. Master’s Thesis, China Academy of Forestry, Changsha, China, July 2012. [Google Scholar]
  41. Slatkin, M. Gene flow and the geographic structure of natural populations. Science 1987, 236, 787–792. [Google Scholar] [CrossRef] [PubMed]
  42. Greene, S.L.; Kisha, T.K.; Yu, L.X. Conserving plants in gene banks and nature: Investigating complementarity with Trifolium thompsonii Morton. PLoS ONE 2014, 9, e105145. [Google Scholar] [CrossRef] [PubMed]

