Article

Comparative Transcriptomics Analysis of Phytohormone-Related Genes and Alternative Splicing Events Related to Witches’ Broom in Paulownia

1
Institute of Paulownia, Henan Agricultural University, Zhengzhou 450002, China
2
Forestry Academy of Henan, Zhengzhou 450008, China
*
Author to whom correspondence should be addressed.
Submission received: 25 April 2018 / Revised: 19 May 2018 / Accepted: 31 May 2018 / Published: 2 June 2018
(This article belongs to the Section Forest Ecophysiology and Biology)

Abstract

:
Paulownia is a native fast-growing tree in China that has been introduced into many countries. However, it is often infected by Paulownia witches’ broom (PaWB) disease, which can lead to large declines in yield. PaWB is caused by a phytoplasma that is an obligate biotrophic plant pathogen. Until now, the molecular mechanisms of interactions between the host plants and the phytoplasma have not been clear. In previous studies, it was reported that PaWB-infected Paulownia exhibited healthy morphology after being treated with methyl methane sulfonate (MMS) at the concentration of 20 mg·L−1 (for Paulownia tomentosa (PT) and Paulownia fortunei (PF) or 15 mg·L−1 (for P. tomentosa × P. fortunei) MMS. In this study, the whole transcriptome expression profile of PaWB-infected Paulownia was studied using high-throughput sequencing technology. In total, 74 significantly differentially expressed genes were detected among three species of healthy, PaWB-infected Paulownia, and the Paulownia treated with MMS. We identified and analyzed genes related to the roles of phytohormones and alternative splicing events involved in regulating plant growth. In response to phytoplasma infection, the concentrations of the plants’ phytohormones were altered, leading to morphology transformation. This research will provide valuable information to detect the molecular mechanisms involved in the Paulownia response to phytoplasma infection.

1. Introduction

Paulownia, a native species in China, has been cultivated for more than 2000 years. The trees are fast-growing deciduous hardwood, and have been introduced into other continents, including the Americas, Australia, Europe, and Africa [1]. Paulownia has high, commercial value and the wood is used for furniture, artificial boards, and musical instruments [2]. However, the widespread occurrence of Paulownia witches’ broom (PaWB) disease has led to large economic losses.
PaWB is caused by a phytoplasma, which is an obligate biotrophic pathogen [3]. More than 1000 plant species have been impacted by the phytoplasma all over the world, including jujube, mulberry, sweet potato, and Paulownia [4,5,6,7]. Phytoplasmas are cell wall-less prokaryotes and are highly diverse in genome structure and content. They belong to the class Mollicutes, and primarily inhabit nutrient-rich phloem sieve elements in plants and are transmitted by phloem-feeding Hemiptera insects such as Cicadellidae (leadhoppers), Psylla (psyllids), and Fulgoridae (planthhoppers) [8,9]. The bacteria invasive inhabitants of both plants and insects and require these hosts for dissemination in nature. Phytoplasma was first discovered using an electron microscope in 1967 and named a mycoplasma-like organism [10]. The phytoplasma can invade plants and insects [11]. Subsequently, phytoplasma-infected plants showed yellow symptoms, witches’ broom, virescence in flowers, and phyllody [12]. However, in phytoplasma-infected sap-feeding insects, the phytoplasmas live for 10 days or longer, indicating that the phytoplasma is beneficial to the insect hosts [13]. The first full-scale phytoplasma classification was on the base of Polymerase Chain Reaction (PCR) amplified 16S rDNA Restriction Fragment Length Polymorphism (RFLP) analysis. All known phytoplasmas were classified into 19 groups and over 40 subgroups [8]. The phytoplasmas produce effectors that are encoded in mobile genetic elements, including 46 of the 56 effector genes in the aster yellows witches’-broom (AY-WB) phytoplasma genome. Until recently, only five complete phytoplasma genomes had been assembled, and nine effective draft phytoplasma genome sequences were also available [14,15]. Phytoplasma genomes are generally between 530 kb and 1200 kb in length. The Australian Grapevine Yellows (AUSGY) genome is longer than the AY-WB and onion yellows M (OY-M) genomes, and the Apple Proliferation phytoplasma (AP) genome is the shortest of the known complete phytoplasma genomes, with lots of important metabolically functional genes missing, some of which code for proteins involved in ATP synthases, oxidative phosphorylation, and amino acid biosynthesis [16,17,18]. Thus, phytoplasmas have to acquire their nutrients from the host plants.
The PaWB phytoplasma falls into the category of the Aster Yellow Phytoplasmas (Candidatus Phytoplasma asteris), which genomes were between 600 kb and 1000 kb in length [16]. PaWB-infected Paulownia have small internode lengths, leaf chlorosis, phyllody, witches’ broom, and dieback of branches. Recently, it was reported that in Jujube (Ziziphus jujube) and Paulownia, miRNAs and their corresponding target genes which were involved in witches’ broom were identified [19]. In Paulownia, proteins encoded by genes of folate and fatty acid synthesis, phytohormone signal transduction, carbohydrate metabolism, secondary metabolism, photosynthesis, and ribosomes have been reported to be related to PaWB disease [3,20,21].
Our research team discovered that PaWB disease could be cured or the morphology changes could be decreased by increasing the DNA methylation levels in infected seedlings. PaWB-infected Paulownia can be recovered through the MMS treatment at appropriate concentrations [22]. A previous study showed that PaWB-infected Paulownia tomentosa × Paulownia fortunei exhibited relatively healthy morphology after treatment with 15 mg·L−1 MMS, although there were still phytoplasmas present, which were detected by nested PCR. However, when the MMS concentration was 20 mg·L−1, the morphology of P. tomentosa and P. fortunei infected by PaWB returned to normal [23].
The expression patterns of the genes which encode proteins associated with alternative splicing and plant hormones were researched in our former study. The parent relationships among the three Paulownia species (P. tomentosa, P. fortunei, and P. tomentosa × P. fortunei) used in this study are also discussed. The molecular mechanisms in these three species have been reported separately in previous studies [3,20,24]. Moreover, we analyzed the gene expression across all three species to identify genes related to PaWB. Our study provides a comprehensive genomic resource for investigating genes related to PaWB by studying the changes among healthy and infected seedlings, and infected seedlings treated with MMS using Illumina sequencing technology.

2. Materials and Methods

2.1. Plant Materials

All tissue-cultured seedlings were from the Institute of Paulownia, Henan Agricultural University, Zhengzhou, Henan Province, China. The tissue-cultured seedlings of healthy P. tomentosa (PT), P. fortunei (PF), and P. tomentosa × P. fortunei (PTF), and PaWB-infected P. tomentosa (PTI), P. fortunei (PFI), and P. tomentosa × P. fortunei (PTFI) were used in this study. The seedlings were cultured on 1/2 MS in triangular flasks. After 30 days, terminal buds from PFI and PTI seedlings were transferred into 1/2 MS and 0 mg·L−1 MMS (controls) or 20 mg·L−1 MMS (PFI-20 and PTI-20) was added. The PTFI terminal buds were transferred into 1/2 MS and 0 mg·L−1 MMS (control) or 15 mg·L−1 MMS (PTFI-15) was added. All the seedlings were cultured in a controlled chamber in the dark for five days at 20 °C, followed by 25 ± 2 °C with a photon flux intensity of 130 μmol·m−2·s−1. After 30 days, 1.5 cm terminal buds were collected from each seedling group, and the same numbers were then mixed separately to obtain pooled samples for each group. Following this, the specimens were frozen in liquid nitrogen, before being stored at −80 °C.

2.2. Total RNAs Extraction and cDNA Library Construction

Total RNAs were extracted from the terminal buds of PT, PF, PTF, PTI, PFI, PTFI, PTI-20, PFI-20, and PTFI-15 samples with TRIzol reagent (Invitrogen, Carlsbad, CA, USA). RNA was then purified by an RNeasy Mini Elute Clean Kit (Qiagen, Dusseldorf, Germany) based on the manufacturer’s protocols. The total RNA was treated with DNaseI (TaKaRa, Dalian, China) to avoid genomic DNA contamination. The eukaryotic mRNA was enriched by oligo (dT) magnetic beads. Then, the mRNA was broken into small fragments which were used as templates to synthesize the first-strand of cDNA by SuperScript II reverse transcriptase (Life Technologies, Carlsbad, CA, USA). DNA polymerase I and RNase H were used to synthesize the second-strand cDNA. Then, the double-stranded cDNAs were cleaned and washed for end reparation using EB butter. A single adenosine (A) nuclotide was connected with adapters to the 3’ ends. Next, PCR was amplified using the suitable fragments as templates. Following this, the resultant cDNA libraries were qualified using an Agilent 2100 Bioanalyzer (Agilent Technologies, Inc., Santa Clara, CA, USA) and the quality was assessed using an ABI StepOnePlus Real-Time PCR System (ABI, New York, NY, USA). Next, cDNA libraries were sequenced using the Illumina HiSeqTM 2000 platform (Illumina, San Diego, CA, USA) based on the manufacturer’s protocol.

2.3. Obtaining Clean Reads, and Transcript Annotation

Primary sequencing data (raw reads) produced by Illumina sequencing were filtered to obtain high-quality clean reads by getting rid of reads containing poly-N or adapter sequences low quality reads using SolexaQA’s DynamicTrim.pl (http://solexaqa.sourceforge.net/). The clean reads were mapped to the P. fortunei reference genome by SOAPaliner/SOAP2 [25,26]. In addition, the clean reads that mapped to the reference genome were searched against the National Center for Biotechnology Information (NCBI) nonredundant protein sequence database (Nr) (http://0-www-ncbi-nlm-nih-gov.brum.beds.ac.uk/), the gene ontology (GO) with Blast2GO program [27], and the Kyoto Encyclopedia of Genes and Genomes (KEGG) databases (http://www.genome.jp/kegg/) using BLAST.
All the sequencing data generated in this study is available from the SRA-Archive (http://0-www-ncbi-nlm-nih-gov.brum.beds.ac.uk/sra) of NCBI under the study accession SRP067302, SRP028911, SRP068599, and SRP057771.

2.4. Differentially Expressed Genes among the Nine Libraries

Differentially expressed genes (DEGs) among the nine libraries were confirmed by the Audic strict algorithm [28]. The p-value threshold in multi- hypothesis analysis was identified using the false discovery rate (FDR) value [29]. Gene expressions were considered to be significantly different when the FDR was ≤0.001 and the absolute value of the log2Ratiol was ≥1. The gene expression level was calculated using the FPKM method [30]. The DEGs were then annotated in the KEGG database.
To identify differences in the expression profiles of genes among the nine libraries, we performed six pairwise comparisons (PF vs. PFI, PFI vs. PFI-20, PT vs. PTI, PTI vs. PTI-20, PTF vs. PTFI, PTFI vs. PTFI-15). To identify significant DEGs related to PaWB, the common genes with opposite co-regulation patterns between PF vs. PFI and PFI vs. PFI-20 (CF), PT vs. PTI and PTI vs. PTI-20 (CT), and PTF vs. PTFI and PTFI vs. PTFI-15 (CTF) were selected. We identified 74 common DEGs among the CF, CT, and CFT comparisons, as shown in Figure 1.

2.5. Quantitative Real-time PCR (qRT-PCR) Analysis of DEGs

Total RNA was extracted from the nine samples using TRIzol (Sangon, Shanghai, China). The iScript™ cDNA Synthesis Kit (Bio-Rad, Hercules, CA, USA) was used to synthesize first-strand cDNA according to the manufacturer’s protocol. The specific primers were designed with Beacon Designer, version 7.7 (Premier Biosoft International, Palo Alto, CA, USA). The PCR amplification primers were designed as previously reported [31]. The qRT-PCR experiment was carried out by the Taq SYBR® Green qPCR Premix kit (Yugong Biolabs, Lianyungang, China) and run on the CFX96™ Real-Time System (Bio-Rad, Hercules, CA, USA). Analysis conditions were as follows: 94 °C for 3 min, followed by 40 cycles of 94 °C for 15 s and 60 °C for 1 min. The results were analyzed by the 2−ΔΔCt method [32]. The 18S rRNA was chosen as the reference gene.

3. Results

3.1. Transcriptome Sequencing

We obtained a total of 637,352,656 raw reads and 605,317,226 clean reads from the nine libraries (PT, PTI, PTI-20, PF, PFI, PFI-20, PTF, PTFI, PTFI-15) using Illumina (paired-end) sequencing technology. The proportion of the clean reads which mapped to the reference genome is shown in Table S1. Among the nine libraries, the percentage of adapter reads was smallest (0.00%) in the PF, PFI, and PFI-20 libraries and highest (1.55%) in the PTF library. The highest and lowest percentages of low quality reads were 8.41% and 2.21% in the PFI-20 and PTI libraries, respectively (Table 1). The highest percentage of clean reads and the lowest percentage that mapped to the reference genome were from the PFI library and PTI-20 library, respectively.

3.2. Functional Annotation of DEGs

We found 810, 1227, 2069, 838, 1896, and 1438 DEGs in PT vs. PTI, PTI vs. PTI-20, PF vs. PFI, PFI vs. PFI-20, PTF vs. PTFI, and PTFI vs. PTFI-15, respectively. Among them, the reads numbers (and percentages) mapped to NR were 802 (99%), 1211 (97%), 2046 (99%), 820 (98%), 1877 (99%), and 1409 (98%). In addition, 519, 769, 1159, 536, 1149, and 842 DEGs were annotated to KEGG pathways in the above six pairwise comparisons, respectively. Some of the genes did not match sequences in any of the public databases because the obtainable genomic information may be limited.

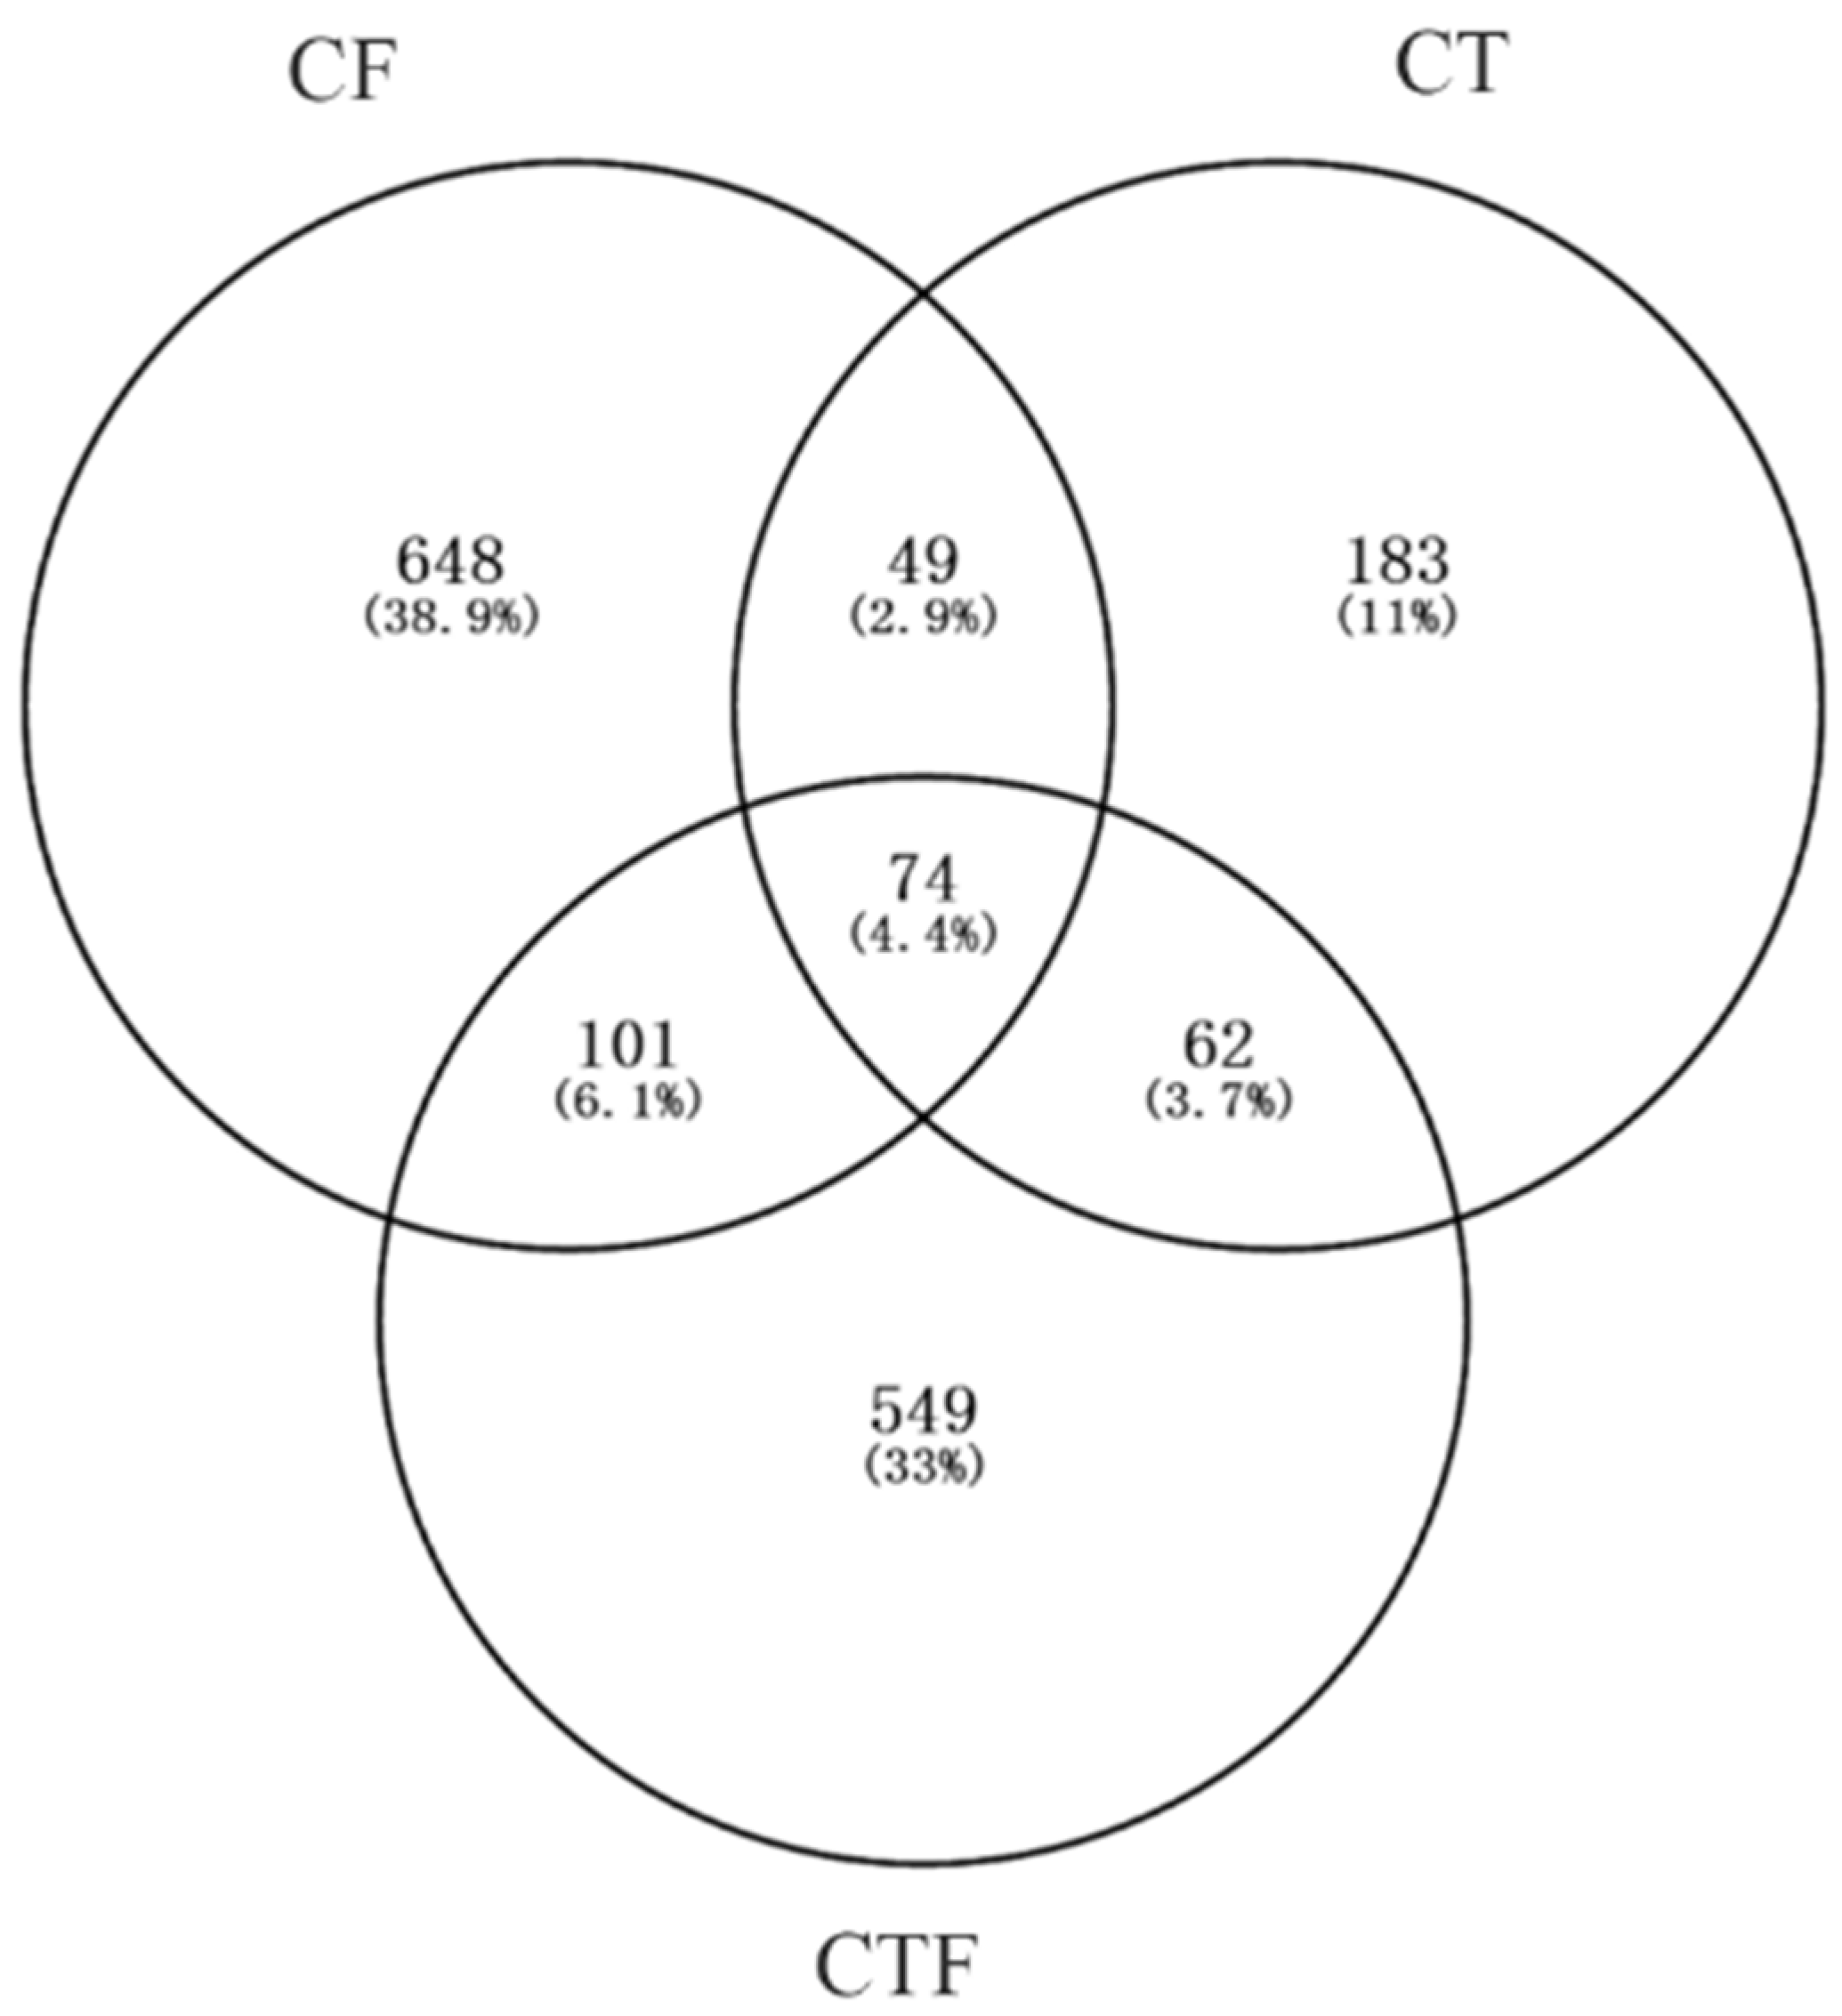
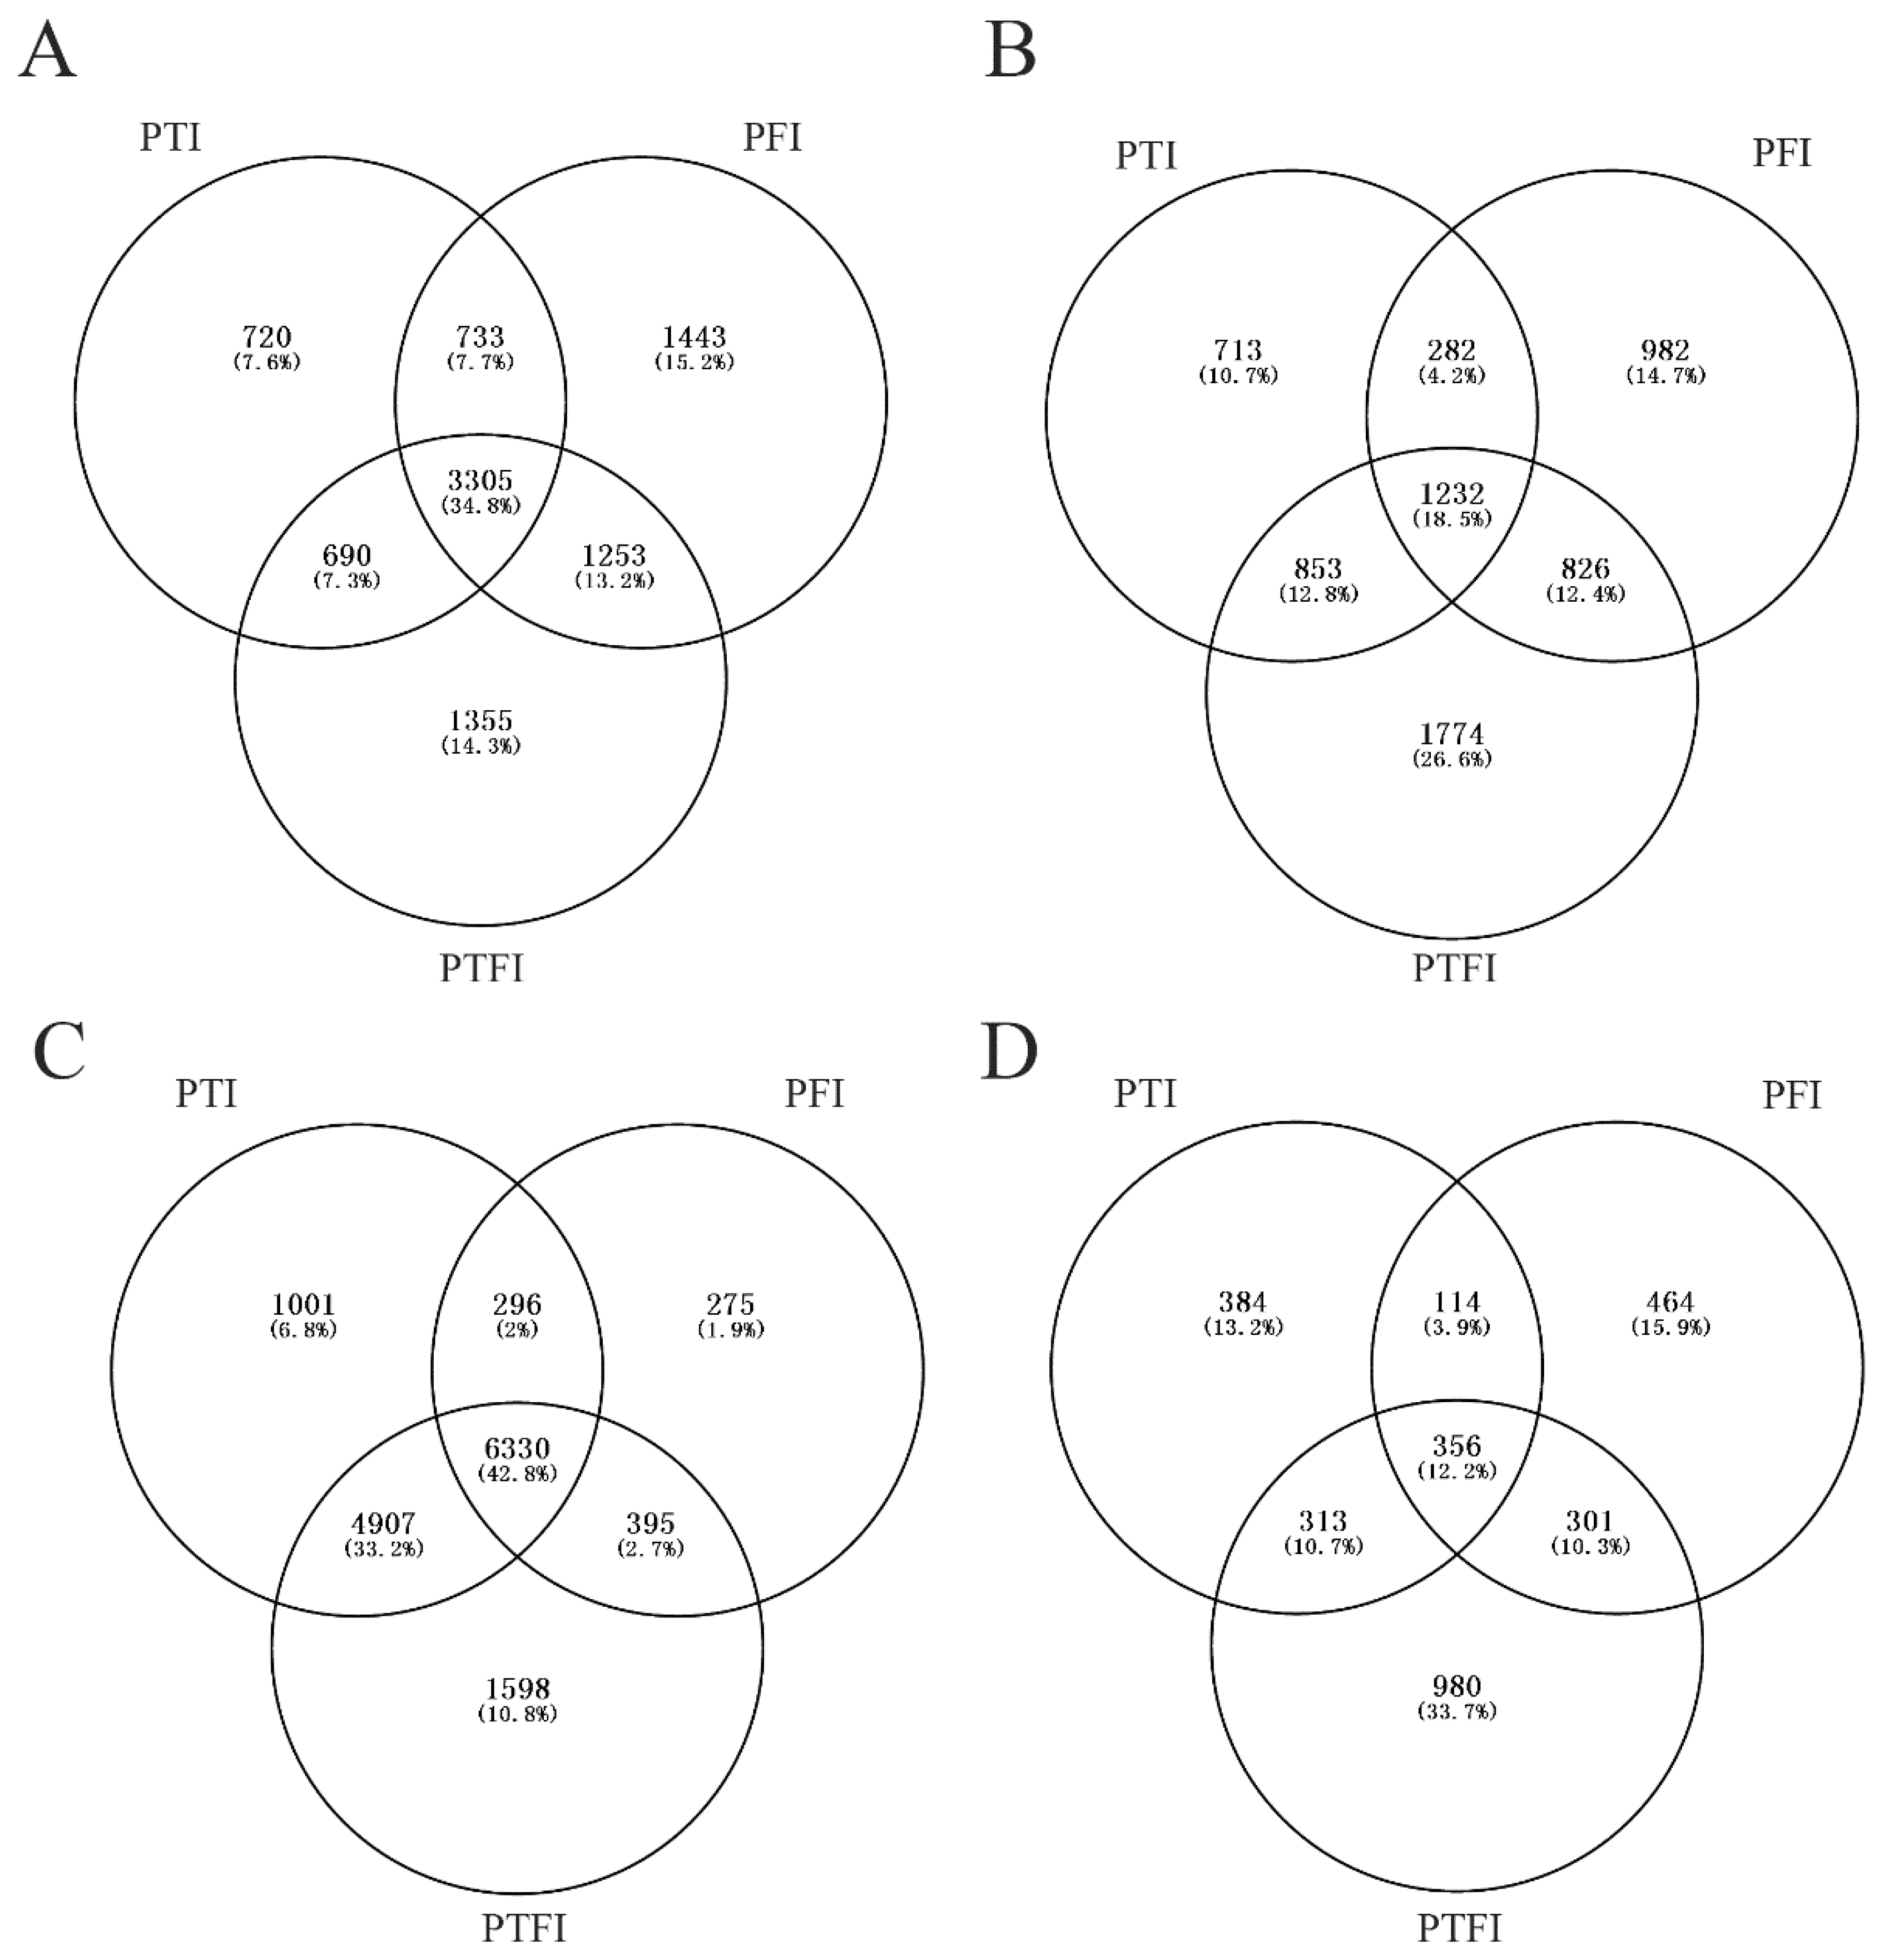
3.3. Analysis of the Common DEGs

The 74 common DEGs were annotated using the KEGG database. Among them, 40 genes were assigned to 12 KEGG pathways (Figure S1). DEGs related to the “biosynthesis of other secondary metabolites” formed the largest group (25%), followed by the “metabolism of terpenoids and polyketides” and “amino acid metabolism” (15%). In addition, the relative expression of 74 DEGs lg(FPKM) is shown in Figure 2.
Some of the DEGs encoded proteins associated with the fatty acid synthesis pathway, such as acyl-ACP thioesterase, 3-ketoacyl-CoA synthase, and arginine decarboxylase-like. In addition, several DEGs encoded proteins related to phytohormone signal transduction involving jasmonic (JA) and gibberellins (GA), including gibberellin receptor GID1, and transcription factors MYC2 and PIF3. Meanwhile, the DEGs which encoded proteins including flavonoid 3′-monooxygenase (HCT) and flavonoid 6-hydroxylase (CYP71D9) were related to flavonoid biosynthesis.

3.4. Alternative Splicing Analysis between Healthy and PaWB-Infected Plants

Alternative splicing (AS) is a crucial regulator in photosynthesis and the defense reaction and plays crucial roles in regulating functional differences and genetic expression [33]. AS can increase the complexity of transcriptomes and produces a number of different transcripts from pre-mRNA [34,35]. In this study, we classified the AS events into four categories based on the RNA sequencing data: alternative 3′ splice site, exon skipping, intron retention, and alternative 5′ splice site. The common AS genes among the three PaWB-infected libraries (PFI, PTI, and PTFI) are shown in Figure 3. In total, 8529 common AS genes resulting in 11,152 transcripts were detected in the three libraries (Table S2). Intron retention was the most common of the four AS categories, which is consistent with previous studies [36]. Moreover, we found that 13 of the DEGs participated in AS events, showing that AS events may be related to the Paulownia tolerance response to environmental stresses.

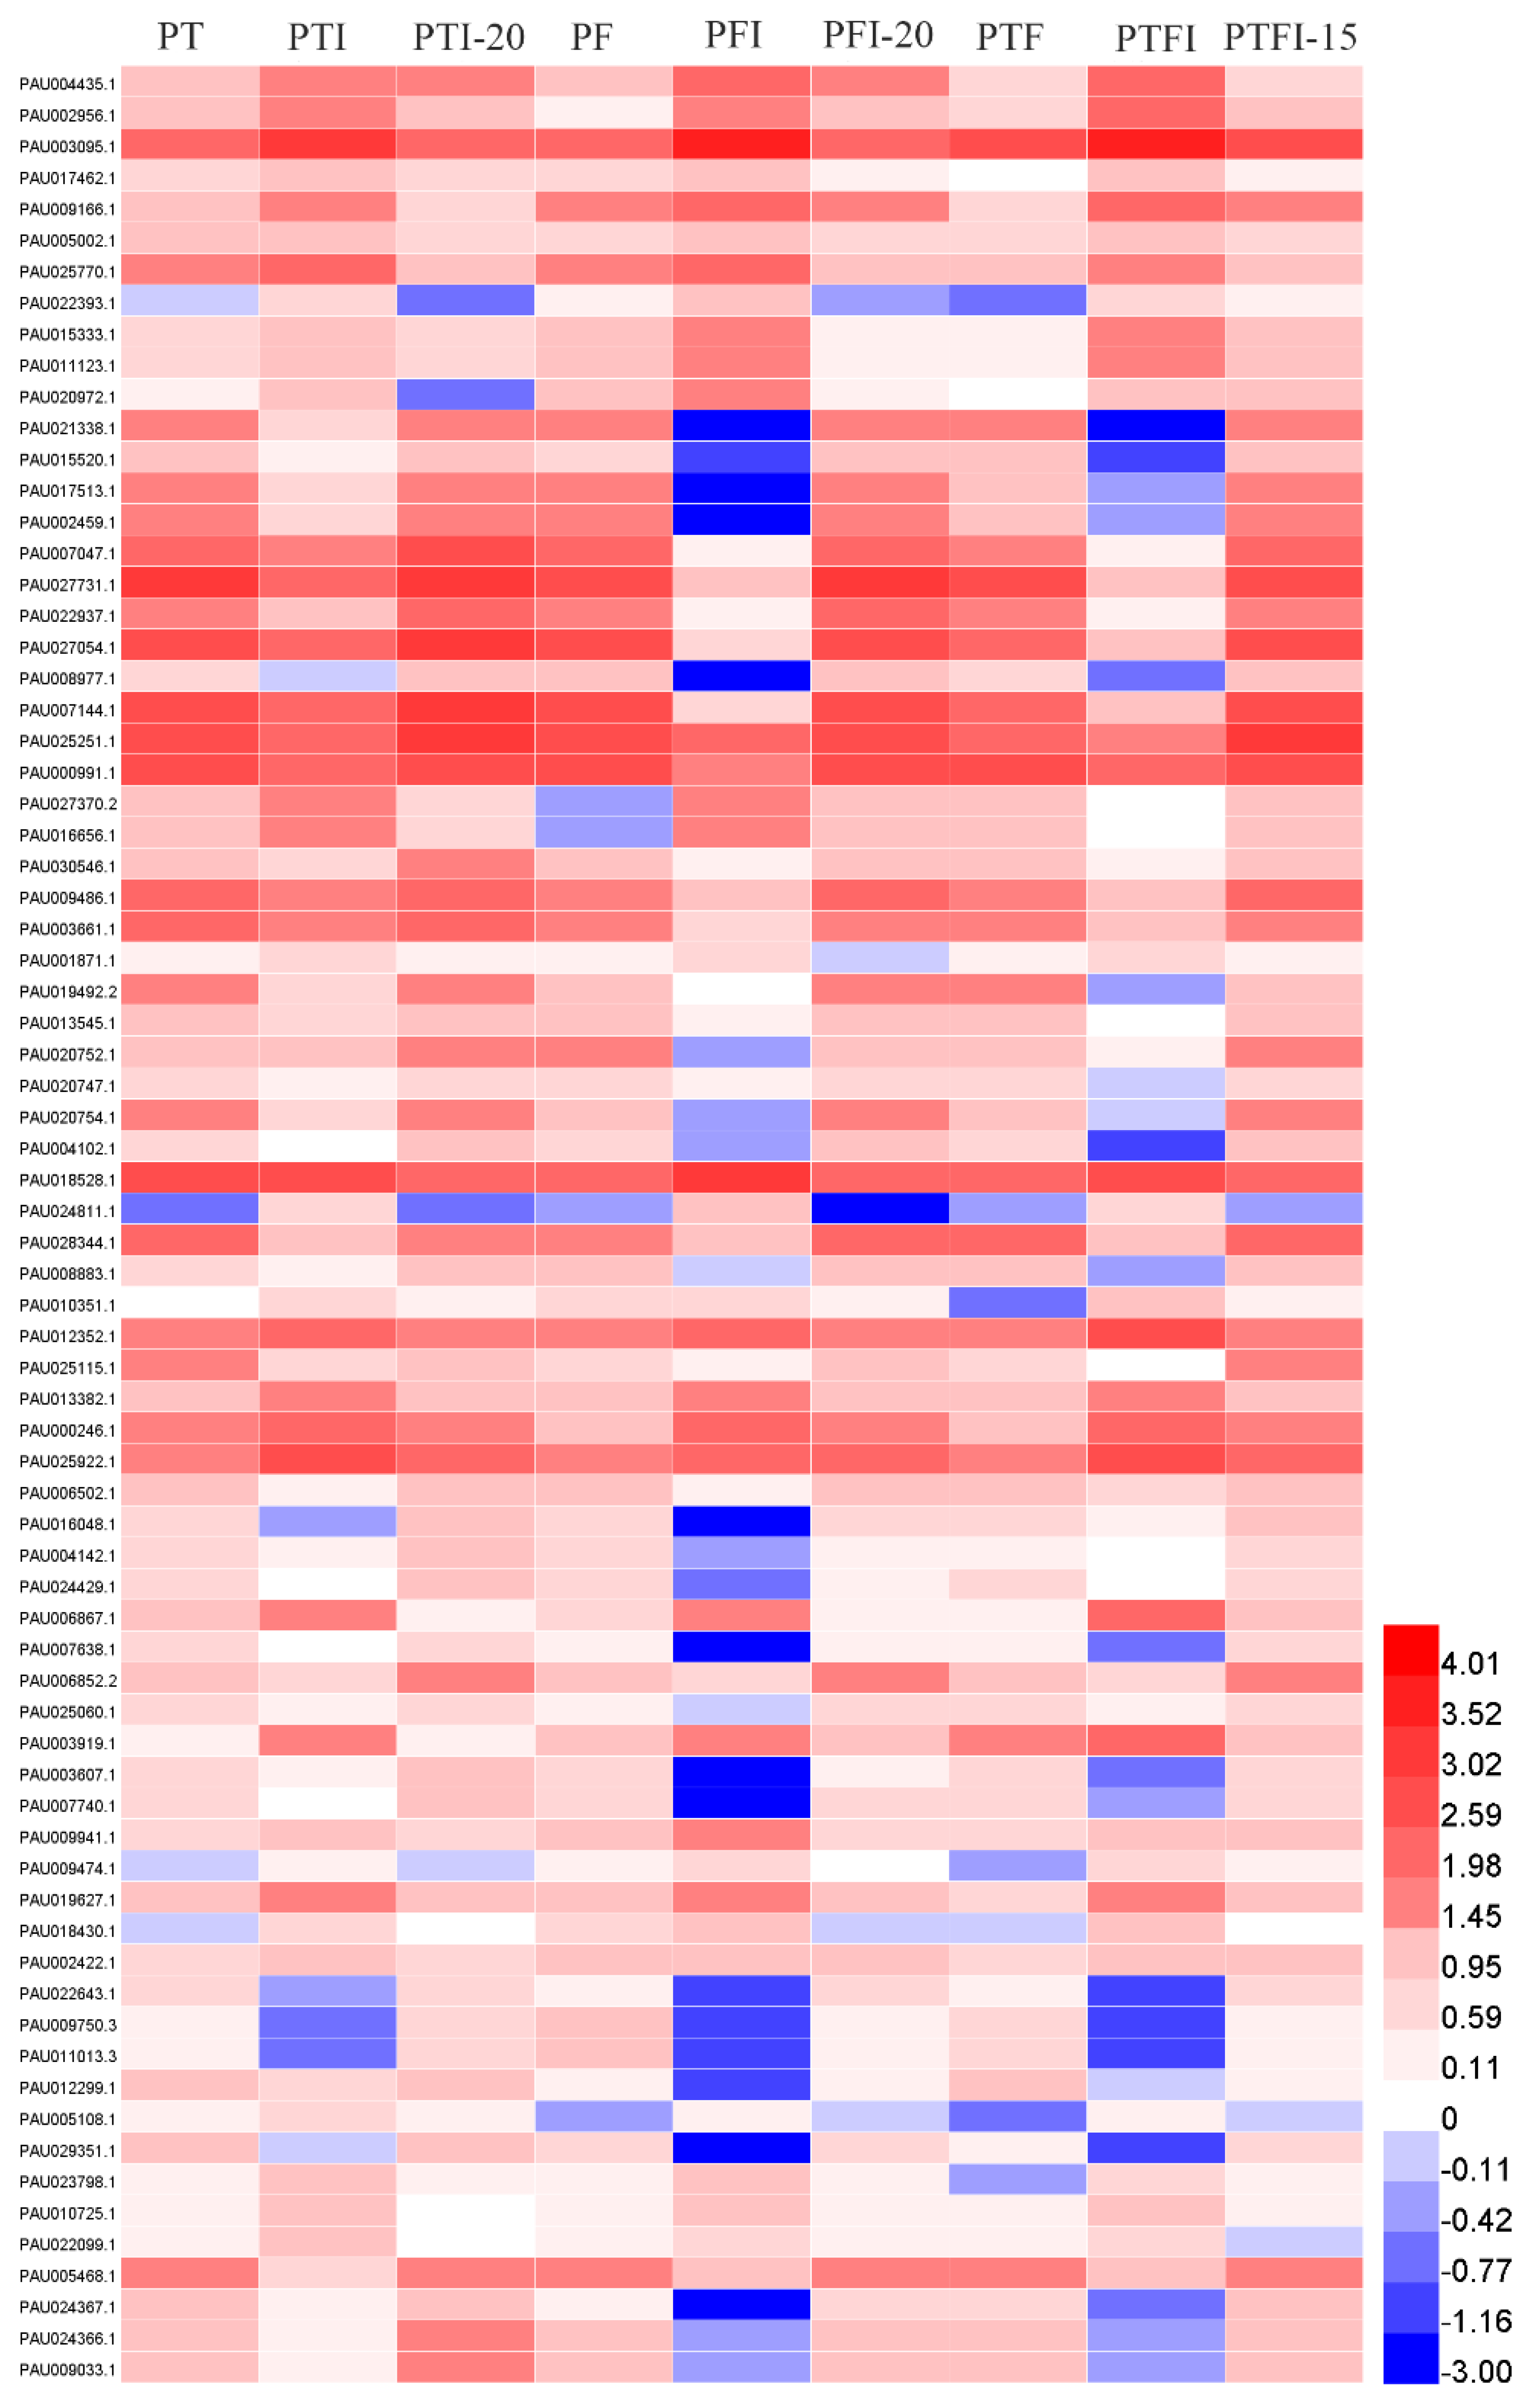
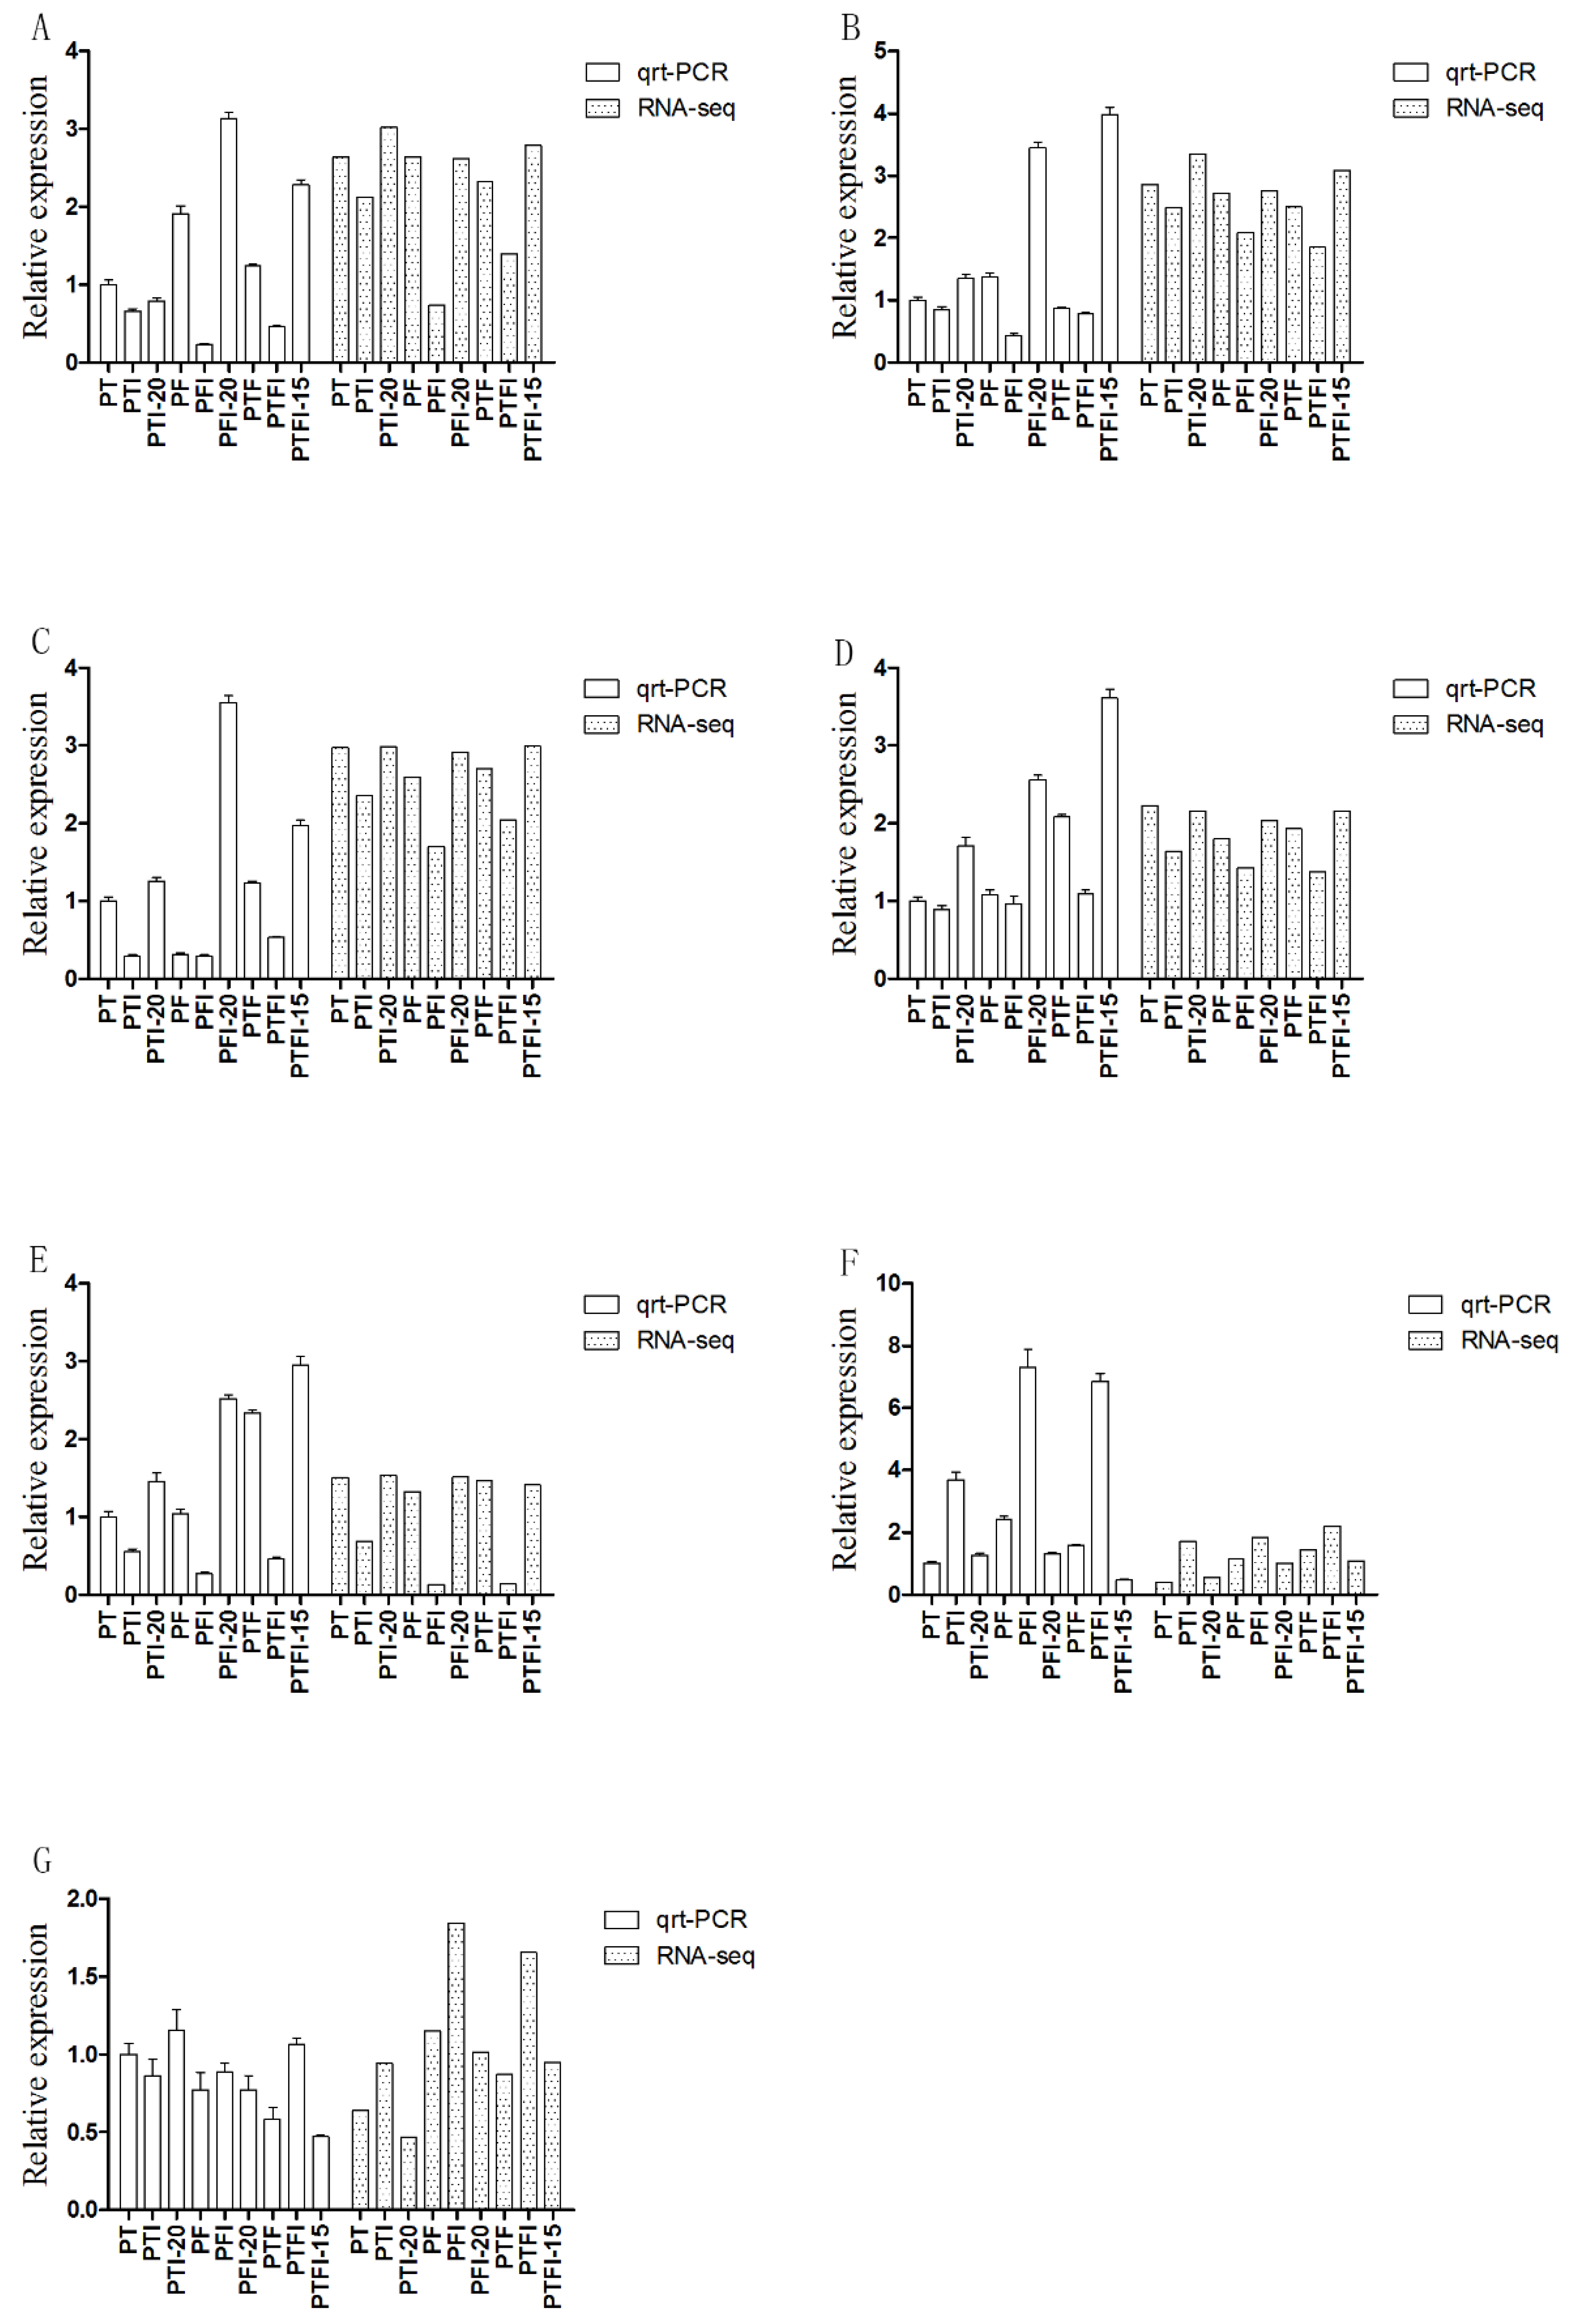
3.5. Verification of Candidate Genes by qRT-PCR

The seven DEGs for qRT-PCR assays were selected from the 74 DEGs to verify the accuracy of the transcriptome data and the relative expression and FPKM are shown in Figure 4 and Table 2. The results revealed that the five genes expressions from the seven DEGs were down-regulated in PT vs. PTI, PF vs. PFI, and PTF vs. PTFI, and up-regulated in PTI vs. PTI-20, PFI vs. PFI-20, and PTFI vs. PTFU-15. Additionally, two DEGs were up-regulated in PT vs. PTI, PF vs. PFI, and PTF vs. PTFI, and down-regulated in PTI vs. PTI-20, PFI vs. PFI-20, and PTFI vs. PTFI-15. Some non-DEGs such as genes related to peroxidase 31 (Per31), carotenoid cleavage dioxygenase 4 (CarCD), and polyphenol oxidase (PolO) et al., have been confirmed through qRT-PCR in previous studies [3,20,24]. These genes expression levels were similar to the expected expressions through transcriptome analysis, indicating that this transcriptome data was enough to be used to assess transcriptome variations involved in the morphological variations in PaWB.

4. Discussion

Paulownia yield is adversely affected by PaWB, the most severe disease in Paulownia cultivating regions of China. However, the molecular mechanisms of Paulownia are not clear. In this study, genes related to PaWB were identified by transcriptome sequencing, which enabled the absolute measurement of gene expression and generated useful data with great accuracy. Variations in gene expression levels between healthy and infected plants will promote detecting the molecular mechanisms of the infected Paulownia.

4.1. Differences among the P. tomentosa × P. fortunei and Parental Responses to Phytoplasma

The transcriptome of a hybrid species P. tomentosa × P. fortunei with its maternal P. tomentosa and paternal P. fortunei transcriptomes was compared. The results showed that the common genes between P. tomentosa × P. fortunei and P. fortunei were more than the common genes between P. tomentosa × P. fortunei and P. tomentosa. Moreover, the percentage of genes in the P. tomentosa genome that mapped to the P. fortunei reference genome was far lower than the percentages of genes in the P. fortunei and P. tomentosa × P. fortunei genomes that were mapped. Previous studies have indicated that the genetic relationships of hybridized plants are usually closer to the female parent in normal situations. Furthermore, most cells derived from the hybridization in Angiospermae were of unilinear descent and resulted from the female parent. Hence, the female parent deeply influences the hybridization [37]. The results are not in keeping with previous studies for the following possible reasons. In the hybrid, most of the genes derived from P. fortunei (paternal plant) mapped to the reference genome and were not lost, whereas fewer genes derived from P. tomentosa (maternal plant) mapped to the reference genome, indicating that more P. tomentosa may have been lost. Because the reference genome is derived from P. fortunei, the distant relationships between the P. fortunei and P. tomentosa may account for the smaller number of P. tomentosa genes that were mapped. Hence, further research is required to verify this result.

4.2. DEGs Related to Phytohormones

Phytohormones play significant roles in regulating the growth and development of plants [38]. Plant morphology can be altered by changing phytohormone concentrations and by environmental factors. Phytohormones such as salicylic acid, brassinosteroids, auxins, GAs, and JAs play pivotal roles in biomass production and regulate plant growth processes [39]. In this study, several genes that encode proteins associated with phytohormones were identified, including Myelocytomatosis protein (MYC2), transcription factors related to GA synthesis, and GA receptor gibberellin insensitive dwarf (GID1), which served as a soluble protein localized to both the cytoplasm and nucleus that promoted elongation, leaf expansion, and germination in plants.
JA is a small molecule phytohormone that regulates growth in most plants, including adaptation to stresses and defense against pathogen invasion [40,41]. The JA receptor COI1 is an F-box protein and is part of the Skp1/Cullin/F-box E3 ubiquitin ligase complex (SCF). The JA ZIM-domain (JAZ) is a substrate of SCF and the major molecular link between MYC2 and SCF in the JA-signaling complex as the active form of JA. MYC2 is the positive regulation factor mediated by JA in regulating the inhibition of stem elongation and tolerance of plants to oxidative damage. In previous studies, the MYC2 which was related to plant-pathogen interactions was identified [42]. When the JA concentration is high, JAZs are degraded, leading to MYC2 being released to promote the JA regulation of plant growth. In this study, the FPKM of genes encoding MYC2 in healthy Paulownia was higher than in PaWB-infected Paulownia, implying that changes in MYC2 content influenced the regulation of JA. Hence, alterations in JA content may have led to reduced resistance to stresses in the PaWB-infected Paulownia.
GA is a crucial plant hormone that can promote stem growth and induce germination. DELLA proteins are nuclear transcriptional regulators that are critical negative regulators in the GA-signaling cascade [43]. Phytochrome-interacting factors (PIF), a key transcriptional activator in GA signal transduction, is released when the degradation of DELLA occurs after DELLA and GID1 combine. Then, downstream target genes are expressed to promote the elongation of hypocotyls. The interactions between DELLA and GID1 are an important step in GA-signal transduction, which can promote the production of plant axillary buds. In this study, the FPKM of genes encoding GID1 was signally higher in PaWB-infected plants than in healthy Paulownia among the three species, indicating that the infected plants produced a number of GID1s in response to phytoplasma invasion. In addition, complete or partial functional loss in GID1 will influence GA signaling and alterations in GA balance may lead to changes in the numbers of axillary buds produced.
In addition, GA pathways may participate in JA signal transduction to regulate the stress responses and development of plants [44]. A previous study indicated that DELLA, which plays a crucial role in the GA signal pathway, and MYC2, compete for binding to JAZ, leading to MYC2 being released. Thereby, downstream gene expression of MYC2 which related to JA-responsive was promoted by DELLA in response to JA. In this study, genes ending the DELLA protein were found in the six comparisons, indicating that the GA and JA may together regulate Paulownia growth.
In a previous study, some genes that encoded the protein related to flavonoid biosynthesis were detected. The flavonoids were the products of the low molecular weight of secondary metabolism. It participated in various stages of growth and development in plant and resisted phytoplasma invasion [45]. Fan et al. [3] discovered several genes which were related to flavonoid biosynthesis through transcriptome analysis. The flavonoid compounds were primarily accumulated in infected-PaWB Paulownia compared with healthy seedlings in order to respond to the disease. They speculated that the leaf color altering was caused by expression level variations of key genes related to flavonoid biosynthesis. In addition, Xia Ye et al. [46] discovered the 20 genes related to flavonoid biosynthesis in Ziziphus jujube Mill through iTRAQ proteomics and RNA-seq transcriptomics analysis. Meanwhile, the 3-ketoacyl-CoA synthase that was related to fatty acid synthesis was discovered in the DEGs of this study. Fatty acids play an important role in cell membrane composition. Additionally, several genes related to the fatty acid biosynthesis were discovered. The expression of four genes was in keeping with 3-ketoacyl-CoA [24]. The above results suggest that the obtained data were reliable.

4.3. Relationship between AS and the Paulownia Plants Responses to PaWB

AS, a pivotal regulatory mechanism, participates in many physiological processes, controls plant development, and increases the complexity of proteomes and transcriptomes [34]. Moreover, AS plays crucial roles in defense responses and photosynthesis in plants. Among the 74 common DEGs, 13 involved in amino acid metabolism, casein kinase, and plant hormone signal transduction underwent AS events. To identify the relationship between AS and PaWB, the genes involved in AS events in the PaWB-infected Paulownia were studied. PIF3 is the foundation PIF member and plays a crucial role in mediating early steps in light-induced chloroplast development by regulating photoresponsive nuclear genes. Leaf color is related to chloroplast development, the size and number of chloroplasts, and the production of photosynthetic pigments. Fan et al. [42] also found the genes which encode PIF3 involved in light signal transduction. PIF3 takes effect in the response of Paulownia in abiotic stresses and is involved in biosynthesis and signaling pathways of hormones including brassinosteroids, GA, and abscisic acid [47]. Previous researches revealed that the over-expression of PIF3 could improve the tolerance of plants to abiotic stresses. Gene encoding PIF3 was up-regulated in healthy vs. infected Paulownia seedlings and down-regulated in infected vs. infected seedlings treated with MMS in this study. The up-regulated PTF3 in PaWB-infected Paulownia has an impact on chloroplast development, leading to altered leaf color compared with healthy seedlings. Furthermore, the results indicated that healthy seedlings may have a great capacity to respond to abiotic stresses compared with infected Paulownia.
The gene encoding F-box also participated in AS events. As part of the SCF complex subunit, the F-box plays a significant role in phytohormone signal transduction and regulating the development and growth in plants. JA can regulate the growth in most plants, including their ability to adapt to stresses and their defense against pathogen invasion. In addition, SCFCOI1 can mediate core JA-dependent responses. The SCF complex can degrade JAZ, leading to MYC2 release, so the genes that respond to JA are expressed [48]. In conclusion, the F-box protein may participate in regulating Paulownia growth to improve its capacity to adapt to stresses. This speculation needs to be verified by further research because of the lack of reliable data. The plant-specific Neutrophil-activating protein (NAP) transcription factor participates in the regulation of plant growth in plants. The NAP subfamily can respond to cold, salt, and drought stresses. In earlier studies, the FPKM of genes encoding NAP was higher in PaWB-infected seedlings than in healthy plants. We speculate that the infected Paulownia could produce plenty of NAPs in order to survive.
Together, our results reveal the significant roles of AS in regulating growth in Paulownia plants and provide new insights to study transcriptome complexity in Paulownia.

5. Conclusions

In this study, comparative transcriptomics analysis for PT, PTI, PTI-20, PF, PFI, PFI-20, PTF, PTFI, and PTFI-15 was performed. To further study the molecular mechanisms of the PaWB-infected Paulownia, the genes related to PaWB were identified. Results showed that the common genes between P. tomentosa and P. tomentosa × P. fortunei were less than the genes between the P. fortunei and P. tomentosa × P. fortunei. Such phenomena may be attributed to the fact that the reference genome was derived from P. fortunei and the relationships between P. fortunei and P. tomentosa were distant according to the sequence results. Meanwhile, we found several genes in 74 DEGs, which encode proteins including MYC2, transcription factors involved in GA synthesis, and GA receptor GID1. These results will help us to understand the interactions between the plants and phytoplasmas and make a difference for future studies of Paulownia responses to phytoplasma infections.

Supplementary Materials

The following are available online at https://0-www-mdpi-com.brum.beds.ac.uk/1999-4907/9/6/318/s1, Table S1. The relative numbers situation of total reads, clean reads, and reads mapped to genes in PF, PFI, PFI-20, PT, PTI, PFI-20, PTF, PTFI, and PTFI-15, respectively, Table S2. The alternative 3′ splice site genes, alternative 5′ splice site genes, intron retention genes and exon skipping genes in PTI, PFI, and PTFI, Figure S1. The KEGG annotation of DEGs.

Author Contributions

Y.D. analyzed the data, wrote the manuscript, and reviewed drafts of the paper; H.Z. performed experiments, analyzed data, and wrote the manuscript; G.F. conceived and designed the experiments and supervised the study; X.Z. analyzed the data and provided funding; Z.W. analyzed the data, and prepared figures and/or tables; Y.C. contributed reagents/materials/analysis tools.

Acknowledgments

This research was supported by the Distinguished Talents Foundation of Henan Province of China (174200510001) and the Natural Science Foundation of Henan Province of China (162300410158).

Conflicts of Interest

The authors declare no conflict of interest.

References

  1. Kalaycioglu, H.; Deniz, I.; Hiziroglu, S. Some of the properties of particleboard made from paulownia. J. Wood Sci. 2005, 51, 410–414. [Google Scholar] [CrossRef]
  2. Wang, J. Genetic and serological analyses of elongation factor EF-Tu of paulownia witches’-broom phytoplasma (16SrI-D). Plant Pathol. 2010, 59, 972–981. [Google Scholar] [CrossRef] [Green Version]
  3. Fan, G.; Xu, E.; Deng, M.; Zhao, Z.; Niu, S. Phenylpropanoid metabolism, hormone biosynthesis and signal transduction-related genes play crucial roles in the resistance of Paulownia fortunei to paulownia witches’ broom phytoplasma infection. Genes Genom. 2015, 37, 913–929. [Google Scholar] [CrossRef]
  4. HY, J. ‘Candidatus Phytoplasma ziziphi’, a novel phytoplasma taxon associated with jujube witches’-broom disease. Int. J. Syst. Evol. Microbiol. 2002, 52, 1543–1549. [Google Scholar]
  5. Kawakita, H.; Saiki, T.; Wei, W.; Mitsuhashi, W.; Watanabe, K.; Sato, M. Identification of mulberry dwarf phytoplasmas in the genital organs and eggs of leafhopper hishimonoides sellatiformis. Phytopathology 2000, 90, 909–914. [Google Scholar] [CrossRef] [PubMed]
  6. Lin, C.L.; Tao, Z.; Li, H.F.; Fan, Z.F.; Yong, L.; Chungen, P.; Tian, G.Z. Molecular characterisation of two plasmids from paulownia witches’-broom phytoplasma and detection of a plasmid-encoded protein in infected plants. Eur. J. Plant Pathol. 2009, 123, 321–330. [Google Scholar] [CrossRef]
  7. Wang, Q.C.; Jpt, V. Efficient elimination of sweetpotato little leaf phytoplasma from sweetpotato by cryotherapy of shoot tips. Plant Pathol. 2008, 57, 338–347. [Google Scholar] [CrossRef] [Green Version]
  8. Bertaccini, A.; Duduk, B. Phytoplasma and phytoplasma diseases: A review of recent research. Phytopathol. Mediterr. 2009, 48, 355–378. [Google Scholar]
  9. Weintraub, P.; Beanland, L. Insect vectors of phytoplasmas. Annu. Rev. Entomol. 2006, 51, 91–111. [Google Scholar] [CrossRef] [PubMed]
  10. Doi, Y.; Teranaka, M.; Yora, K.; Asuyama, H. Mycoplasma-or PLT group-like microorganisms found in the phloem elements of plants infected with mulberry dwarf, potato witches’ broom, aster yellows, or Paulownia witches’ broom. Jpn. J. Phytopathol. 1967, 33, 259–266. [Google Scholar] [CrossRef]
  11. Sugio, A.; Maclean, A.M.; Kingdom, H.N.; Grieve, V.M.; Manimekalai, R.; Hogenhout, S.A. Diverse targets of phytoplasma effectors: From plant development to defense against insects. Annu. Rev. Phytopathol. 2011, 49, 175. [Google Scholar] [CrossRef] [PubMed]
  12. Maclean, A.M. Phytoplasma effector SAP54 induces indeterminate leaf-like flower development in Arabidopsis plants. Plant Physiol. 2011, 157, 831. [Google Scholar] [CrossRef] [PubMed]
  13. Nault, L.R. Evolution of an insect pest: Maize and the corn leafhopper, a case study. Maydica 1990, 35, 165–175. [Google Scholar]
  14. Bai, L.J.; Ye, Y.T.; Chen, Q.; Tang, H.R. The complete chloroplast genome sequence of the white strawberry Fragaria pentaphylla. Conserv. Genet. Resour. 2017, 9, 1–3. [Google Scholar] [CrossRef]
  15. Jung, H.Y.; Miyata, S.; Oshima, K. First complete nucleotide sequence and heterologous gene organization of the two rRNA operons in the phytoplasma genome. DNA Cell Biol. 2003, 22, 209–215. [Google Scholar] [CrossRef] [PubMed]
  16. JBayliss, K.L.; Saqib, M.; Dell, B.; Jones, M.G.K.; Hardy, G.S.J. First record of ‘Candidatus phytoplasma australiense’ in Paulownia trees. Australas. Plant Pathol. 2005, 34, 123–124. [Google Scholar] [CrossRef]
  17. Hogenhout, S.A.; Music, M.Š.; Weintraub, P.G. Phytoplasma genomics, from sequencing to comparative and functional genomics—What have we learnt? In Phytoplasmas: Genomes, Plant Hosts and Vectors; CAB International: Wallingford, UK, 2009; Volume 41, pp. 19–36. [Google Scholar]
  18. Sugio, A.; Hogenhout, S.A. The genome biology of phytoplasma: Modulators of plants and insects. Curr. Opin. Microbiol. 2012, 15, 247–254. [Google Scholar] [CrossRef] [PubMed]
  19. Fan, G.; Cao, Y.; Deng, M.; Zhai, X.; Zhao, Z.; Niu, S.; Ren, Y. Identification and dynamic expression profiling of microRNAs and target genes of Paulownia tomentosa in response to Paulownia witches’ broom disease. Acta Physiol. Plant. 2017, 39, 28. [Google Scholar] [CrossRef]
  20. Liu, R.; Dong, Y.; Fan, G.; Zhao, Z.; Deng, M.; Cao, X.; Niu, S. Discovery of genes related to witches broom disease in Paulownia tomentosa × Paulownia fortunei by a De Novo assembled transcriptome. PLoS ONE 2013, 8, 80238. [Google Scholar] [CrossRef] [PubMed]
  21. Wang, Z. Quantitative proteome-level analysis of paulownia witches’ broom disease with methyl methane sulfonate assistance reveals diverse metabolic changes during the infection and recovery processes. PeerJ 2017, 5, e3495. [Google Scholar] [CrossRef] [PubMed]
  22. Cao, X.; Fan, G.; Deng, M.; Zhao, Z.; Dong, Y. Identification of genes related to paulownia witches’ broom by AFLP and MSAP. Int. J. Mol. Sci. 2014, 15, 14669–14683. [Google Scholar] [CrossRef] [PubMed]
  23. Zhai, X.; Cao, X.; Fan, G. Growth of paulownia witches’ broom seedlings treated with methylmethane sulphonate and SSR analysis. Sci. Silvae Sin. 2010, 46, 176–181. [Google Scholar]
  24. Fan, G.; Cao, X.; Zhao, Z.; Deng, M. Transcriptome analysis of the genes related to the morphological changes of Paulownia tomentosa plantlets infected with phytoplasma. Acta Physiol. Plant. 2015, 37, 1–12. [Google Scholar] [CrossRef]
  25. Gu, S.; Fang, L.; Xu, X. Using SOAPaligner for short reads alignment. Curr. Protoc. Bioinform. 2013, 44, 1–17. [Google Scholar]
  26. Li, R.; Yu, C.; Li, Y.; Lam, T.W.; Yiu, S.M.; Kristiansen, K.; Wang, J. SOAP2. Bioinformatics 2009, 25, 1966–1967. [Google Scholar] [CrossRef] [PubMed]
  27. Götz, S. High-throughput functional annotation and data mining with the Blast2GO suite. Nucleic Acids Res. 2008, 36, 3420–3435. [Google Scholar] [CrossRef] [PubMed] [Green Version]
  28. Audic, S.; Claverie, J.M. The significance of digital gene expression profiles. Genome Res. 1997, 7, 986–995. [Google Scholar] [CrossRef] [PubMed]
  29. Benjamini, Y.; Yekutieli, D. The control of the false discovery rate in multiple testing under dependency. Ann. Stat. 2001, 29, 1165–1188. [Google Scholar]
  30. Dalpiaz, D. Statistical Methods for Modeling RNA-Seq Short-Read Data. Ph.D. Thesis, University of Illinois at Urbana-Champaign, Champaign, IL, USA, 2014. [Google Scholar]
  31. Chen, C. Real-time quantification of microRNAs by stem-loop RT-PCR. Nucleic Acids Res. 2005, 33, e179. [Google Scholar] [CrossRef] [PubMed]
  32. Ali, M.; Brian, A.W.; Kenneth, M.C.; Lorian, S.; Barbara, W. Mapping and quantifying mammalian transcriptomes by RNA-Seq. Nat. Methods 2008, 5, 621–628. [Google Scholar]
  33. Mastrangelo, A.M.; Marone, D.; Laidò, G.; De Leonardis, A.M.; De Vita, P. Alternative splicing: Enhancing ability to cope with stress via transcriptome plasticity. Plant Sci. 2012, 185–186, 40–49. [Google Scholar] [CrossRef] [PubMed]
  34. Wang, B.; Brendel, V. Genomewide comparative analysis of alternative splicing in Plants. Proc. Natl. Acad. Sci. USA 2006, 103, 7175–7180. [Google Scholar] [CrossRef] [PubMed]
  35. Zhang, G. Deep RNA sequencing at single base-pair resolution reveals high complexity of the rice transcriptome. Genome Res. 2010, 20, 646–654. [Google Scholar] [CrossRef] [PubMed] [Green Version]
  36. Luo, X.; Xu, L.; Liang, D.; Wang, Y.; Zhang, W.; Zhu, X.; Zhu, Y.; Jiang, H.; Tang, M.; Liu, L. Comparative transcriptomics uncovers alternative splicing and molecular marker development in radish (Raphanus sativus L.). BMC Genom. 2017, 18, 505. [Google Scholar] [CrossRef] [PubMed]
  37. Bartish, I.V.; Jeppsson, N.; Nybom, H.; Swenson, U. Phylogeny of Hippophae (Elaeagnaceae) inferred from parsimony analysis of chloroplast DNA and morphology. Syst. Bot. 2007, 27, 41–54. [Google Scholar]
  38. Fahad, S.; Hussain, S.; Matloob, A.; Khan, F.A.; Khaliq, A.; Saud, S.; Hassan, S.; Shan, D.; Khan, F.; Ullah, N.; et al. Phytohormones and plant responses to salinity stress: A review. Plant Growth Regul. 2015, 75, 391–404. [Google Scholar] [CrossRef]
  39. Ahmad, P.; Bhardwaj, R.; Tuteja, N. Plant Signaling under Abiotic Stress Environment. In Environmental Adaptations and Stress Tolerance of Plants in the Era of Climate Change, 2012; Springer: New York, NY, USA, 2012; pp. 297–323. [Google Scholar]
  40. Browse, J.; Howe, G.A. New weapons and a rapid response against insect attack. Plant Physiol. 2008, 146, 832–838. [Google Scholar] [CrossRef] [PubMed]
  41. Farmer, E.E.; Ryan, C.A. Interplant communication: Airborne methyl jasmonate induces synthesis of proteinase inhibitors in plant leaves. Proc. Natl. Acad. Sci. USA 1990, 87, 7713–7716. [Google Scholar] [CrossRef] [PubMed]
  42. Fan, G.; Dong, Y.; Deng, M.; Zhao, Z.; Niu, S.; Xu, E. Plant-pathogen interaction, circadian rhythm, and hormone-related gene expression provide indicators of phytoplasma infection in Paulownia fortunei. Int. J. Mol. Sci. 2014, 15, 23141–23162. [Google Scholar] [CrossRef] [PubMed]
  43. Achard, P.; Genschik, P. Releasing the brakes of plant growth: How GAs shutdown DELLA proteins. J. Exp. Bot. 2009, 60, 1085–1096. [Google Scholar] [CrossRef] [PubMed]
  44. Grant, M.R.; Jones, J.D.G.; Hines, P.J.; Zahn, L.M. Hormone (dis)harmony moulds plant health and disease. Science 2009, 324, 750–752. [Google Scholar] [CrossRef] [PubMed]
  45. Xing, W.; Jin, X. Recent advances of MYB transcription factors involved in the regulation of flavonoid biosynthesis. Mol. Plant Breed. 2015, 13, 689–696. [Google Scholar]
  46. Ye, X.; Wang, H.; Chen, P.; Fu, B.; Zhang, M.; Li, J.; Zheng, X.; Tan, B.; Feng, J. Combination of iTRAQ proteomics and RNA-seq transcriptomics reveals multiple levels of regulation in phytoplasma-infected Ziziphus jujuba mill. Hortic. Res. 2017, 4, 17080. [Google Scholar] [CrossRef] [PubMed]
  47. Gao, Y.; Jiang, W.; Dai, Y. A maize phytochrome-interacting factor 3 improves drought and salt stress tolerance in rice. Plant Mol. Biol. 2015, 87, 413–428. [Google Scholar] [CrossRef] [PubMed]
  48. Liu, H.; Carvalhais, L.C.; Schenk, P.M.; Dennis, P.G. Effects of jasmonic acid signalling on the wheat microbiome differ between body sites. Sci. Rep. 2017, 7, 41766. [Google Scholar] [CrossRef] [PubMed] [Green Version]
Figure 1. The DEGs were selected from the P. tomentosa, P. fortunei, and P. tomentosa × P. fortunei. The CT, CF, and CTF were the common genes with opposite co-regulation patterns in PF vs. PFI and PFI vs. PFI-20, PT vs. PTI and PTI vs. PTI-20, and PTF vs. PTFI and PTFI vs. PTFI-15, respectively.
Forests 09 00318 g001
Figure 2. The lg(FPKM) of DEGs in nine libraries. The deepest red among all the colors represents the maximum value of lg(FPKM) and the deepest blue represents the minimum value of lg(FPKM).
Forests 09 00318 g002
Figure 3. The common genes of AS occurred in PTI, PFI, and PTFI. (A) The common genes of Alternative 3′ splice in the three species are shown. (B) The common genes of alternative 5′ splice in the three species are shown. (C) The common genes of intron retention in the three species are shown. (D) The common genes of exon skipping in the three species are shown. The figures represent the number of genes.
Forests 09 00318 g003
Figure 4. The qRT-PCR analysis of P. tomentosa, P. fortunei, and P. tomentosa × P. fortunei selective DEGs. The RNA-Seq represents the lg(FPKM). (A) relative expression of phylloplanin; (B) relative expression of Pollen Ole e 1 allergen and extensin family protein; (C) relative expression of lipid transfer protein 2; (D) relative expression of Art v 3 allergen precursor; (E) relative expression of prolyl 4-hydroxylaseprolyl; (F) relative expression of RING finger and CHY zinc finger domain-containing protein 1; (G) relative expression of hydroperoxide dehydratase.
Forests 09 00318 g004
Table 1. The percentage of adapter reads and low-quality reads occupied raw reads.
Adapter (%)Low Quality (%)
PF07.59
PFI07.58
PFI 2008.41
PT1.22.74
PTI1.192.21
PTI 200.74
PTF1.553.22
PTFI1.023.41
PTFI 150.993.43
Table 2. The relative expression and FPKM of genes for qRT-PCR assays.
qRT-PCR Gene IDSpeciesRelative ExpressionFPKMNR
PAU007144.1PF1.906456441.51Phylloplanin
PFI0.2270045.45
PFI-203.138247420.54
PT1436.08
PTI0.656896135.57
PTI-200.7909611049.23
PTF1.239057213.39
PTFI0.46286324.65
PTFI-152.287262617.72
PAU025251.1PF1.373163528.61Pollen Ole e 1 allergen and extensin family protein
PFI0.431665121.54
PFI-203.452324576.49
PT1733.94
PTI0.851032310.94
PTI-201.3509582268.65
PTF0.875457319.26
PTFI0.78623571.28
PTFI-153.9877061231.79
PAU000991.1PF0.312058394.01Lipid transfer protein 2
PFI0.28943850.47
PFI-203.550041826.48
PT1933.68
PTI0.290733228.72
PTI-201.261053972.13
PTF1.238529505.79
PTFI0.533642110.99
PTFI-151.977384979.78
PAU009486.1PF1.08410663.11Art v 3 allergen precursor
PFI0.96848126.91
PFI-202.564913109.42
PT1170.46
PTI0.89063744.06
PTI-201.710442144.07
PTF2.08003485.19
PTFI1.09698924.08
PTFI-153.611348143.97
PAU019492.2PF1.04646621.08Putative prolyl 4-hydroxylase-like
PFI0.2670941.03
PFI-202.51845532.82
PT131.66
PTI0.5577284.88
PTI-201.45367733.94
PTF2.338929.38
PTFI0.4676650.73
PTFI-152.95826826.26
PAU003919.1PF2.40955814.15RING finger and CHY zinc finger domain-containing protein 1
PFI7.32445270.03
PFI-201.32210410.39
PT12.55
PTI3.69529851.49
PTI-201.2709223.65
PTF1.57562928.03
PTFI6.850931159.97
PTFI-150.47722112.32
PAU010351.1PF14.37Allene oxide synthase, chloroplastic
PFI1.1487828.77
PFI-201.0005752.95
PT1.2948571.07
PTI1.1157488.02
PTI-201.5015782.38
PTF0.7571767.46
PTFI1.37792245.4
PTFI-150.6106868.88

