Article

Resource Allocation, Pit Quality, and Early Survival of Seedlings Following Two Motor-Manual Pit-Drilling Options

1
Department of Engineering and Informatics, Faculty of Economics, Informatics and Engineering, “Vasile Goldiş” Western University of Arad, 310414 Arad, Romania
2
Department of Animal Science and AgroTourism, Faculty of Environmental Protection, University of Oradea, 410396 Oradea, Romania
3
Department of Forest Engineering, Forest Management Planning and Terrestrial Measurements, Faculty of Silviculture and Forest Engineering, Transilvania University of Braşov, 500123 Braşov, Romania
*
Author to whom correspondence should be addressed.
Submission received: 14 September 2018 / Revised: 19 October 2018 / Accepted: 21 October 2018 / Published: 24 October 2018
(This article belongs to the Special Issue Forest Operations: Planning, Innovation and Sustainability)

Abstract

:
Afforestation and reforestation operations constitute an important part of the forest management, being crucial for the sustainability of forests. In such operations, there are three options to prepare the planting holes: manual, partly mechanized, and fully mechanized. Given the high cost of mechanized planting and the ergonomic issues of manual planting, one option which is worth exploring is using of augers, because they have the potential to mitigate and/or eliminate intense physical effort and aspects of some of the ergonomic problems. This study examines the early survival of seedlings following the use of augers to prepare the planting pits. Working time, fuel consumption and physical quality of the pits were evaluated on nine sites for two drill types differentiated by their diameter (150 vs. 200 mm). Time consumption was systematically higher when using the larger drill, while fuel consumption was not found to be statistically different. The larger drill systematically produced pits characterized by less physical quality in terms of resistance to penetration and shear strength, but the early survival of seedlings was higher when using this drill size. Survival probability modeled by means of logistic regression showed that pit size was among the factors that may affect the early survival of seedlings. The study concludes that the larger drill would be more appropriate to plant seedlings, but further studies should be arranged to see if long-term survival would be affected in this case.

1. Introduction

Planting new forests and restocking of harvested areas constitute an important part of the forest management, contributing to the global sustainability of forests. Nevertheless, afforestation and reforestation require the commitment of significant resources by forest management agencies and private companies, resulting in substantial costs to support such operations. Seedling planting is one of the most common approaches used to regenerate forests. At the same time, operational options for seedling planting may be categorized as manual, partly mechanized, and fully mechanized [1]. In particular, mechanized planting is used to overcome the shortage and costs of manual labor [2], however, when employing the use of mechanized planting there is a need to ensure that the length of the planting window is wide enough to ensure the cost-effectiveness of the machines used [3], which are expensive [3,4]. Numerous factors, such as the high operational costs of mechanized planting, the need to further develop the machines’ design to improve their cost-effectiveness [4], productivity rates that are comparable to that of manual planting [4,5] (or even less [6]), differences in planting quality [7], and some terrain-related limiting factors which confine the use of most planting machines to flatlands [2], have resulted in the current limited use of mechanized planting [4,8,9]. In addition, the comparability of the planting quality of mechanized and manual operations is still debated, with some results indicating a better quality resulting from the latter option [2].
Manual planting, on the other hand, is physically demanding because the workers are required to carry additional weight generated both by the tools used and the planting material. While commonly used in many parts of the world, including Romania [1], manual planting may result in health impairment. In particular, such workers may expose their spine and hips to a significant biomechanical stress [10], which is sustained by the number of movements and force exertion required to plant a tree [6], and may spend a significant part of their work time in extremely uncomfortable postures coupled with high-effort muscle exertions [11]. However, the productivity of manual planting was evaluated to be rather high, with production rates in the range of 138 [5]–560 [6] seedlings planted per hour.
An intermediate option is that of motor-manually assisted planting operations, which have the potential to overcome the effort required to prepare the holes while preserving the quality of planting. To this end, augers may be used to prepare planting pits, as they are more consistent in producing well-shaped clean holes in a wide range of soil conditions. Given the equipment used, which is based on two-stroke internal combustion engines, auger planting may result, similar to other motor-manual operations [12], in a significant exposure to noise and vibration [13].
Many studies have debated the effect of planting depth on the development and survival of seedlings, concluding that deeper planting may result in increased survival [7,14]. Deep planting can be carried out using both mechanized [15] and manual equipment. However, in manual planting the physical effort required to prepare the planting holes will increase as the planting depth increases; with this in mind, the use of augers could help to eliminate a major portion of such effort. The soil preparation method is commonly referred as the work undertaken to loosen the soil prior to making the planting holes [1]. It affects the planting success [16], but it could be limited in scope to flat, accessible forest lands [1]. At the same time, root development of the planted seedlings, and in some case the survival of planted trees, depends to a large extent on many local and planting technology-related factors. Soil type [8] and its native [17] or altered [18] physical characteristics may restrict root development, especially in naturally or artificially compacted soils. The penetration force that roots may exert is in range of 0.5 to 1.5 MPa [17], while the bulk density that limits root penetration varies with species, soil moisture content, and soil texture [19], being in the range of 1.1 kg L−1 in silty clays to 2 kg L−1 in clay loams, with significant ceasing of root penetration at about 1.7 kg L−1 [17]. This translates in the reduction of root extension at 2.5 MPa (as measured by a penetrometer) in fine textured soils as well as in the ability to penetrate the cervices of coarse textured soils up to 5 MPa [17]. Obviously, motor-manual pit-drilling by augers may alter such physical properties of the soils and therefore may lead to a limitation of root development, which may result in the reduction of the seedling survival rate. Nevertheless, the use of motor-manual augers may also result in an improved hole-making option due to the reduced physical effort and possibility of use in steep terrains, under such conditions in which the time and fuel inputs would be acceptable and the quality of planting work, including the physical characteristics of the planting pits, would result in acceptable survival rates. Planting augers may be equipped with various planting tools (hereafter drills) available on the market. However, very large drills will burden the workers with additional weight, while very small drills will produce insufficient planting space. Therefore, the common options used in auger planting of small-sized seedlings may rest in the range of 150–300 mm. However, the effect of drill diameter on time and fuel consumption, physical quality of the pits, and early survival of the seedlings in unknown. As the drills that are 150 and 200 mm in diameter are often used in planting operations, the goal of this study was to evaluate the differences between the two in terms of quantitative inputs (time and fuel) and qualitative outputs (physical quality of the pits and survival rate).
The main aim of this study was to evaluate to what extent auger pit-drilling affects the early survival rate of seedlings by testing two drill sizes: 150 vs. 200 mm in diameter. The second aim was to evaluate the differences in time and fuel inputs between the two drill sizes in order to see which one is more effective in terms of allocated resources. According to the aims set by the study, comparative studies were designed and implemented to test the differences between the drill sizes in terms of time consumption, fuel inputs, and survival rate of planted seedlings. The probability of seedling survival was estimated using a logistic modelling approach.

2. Materials and Methods

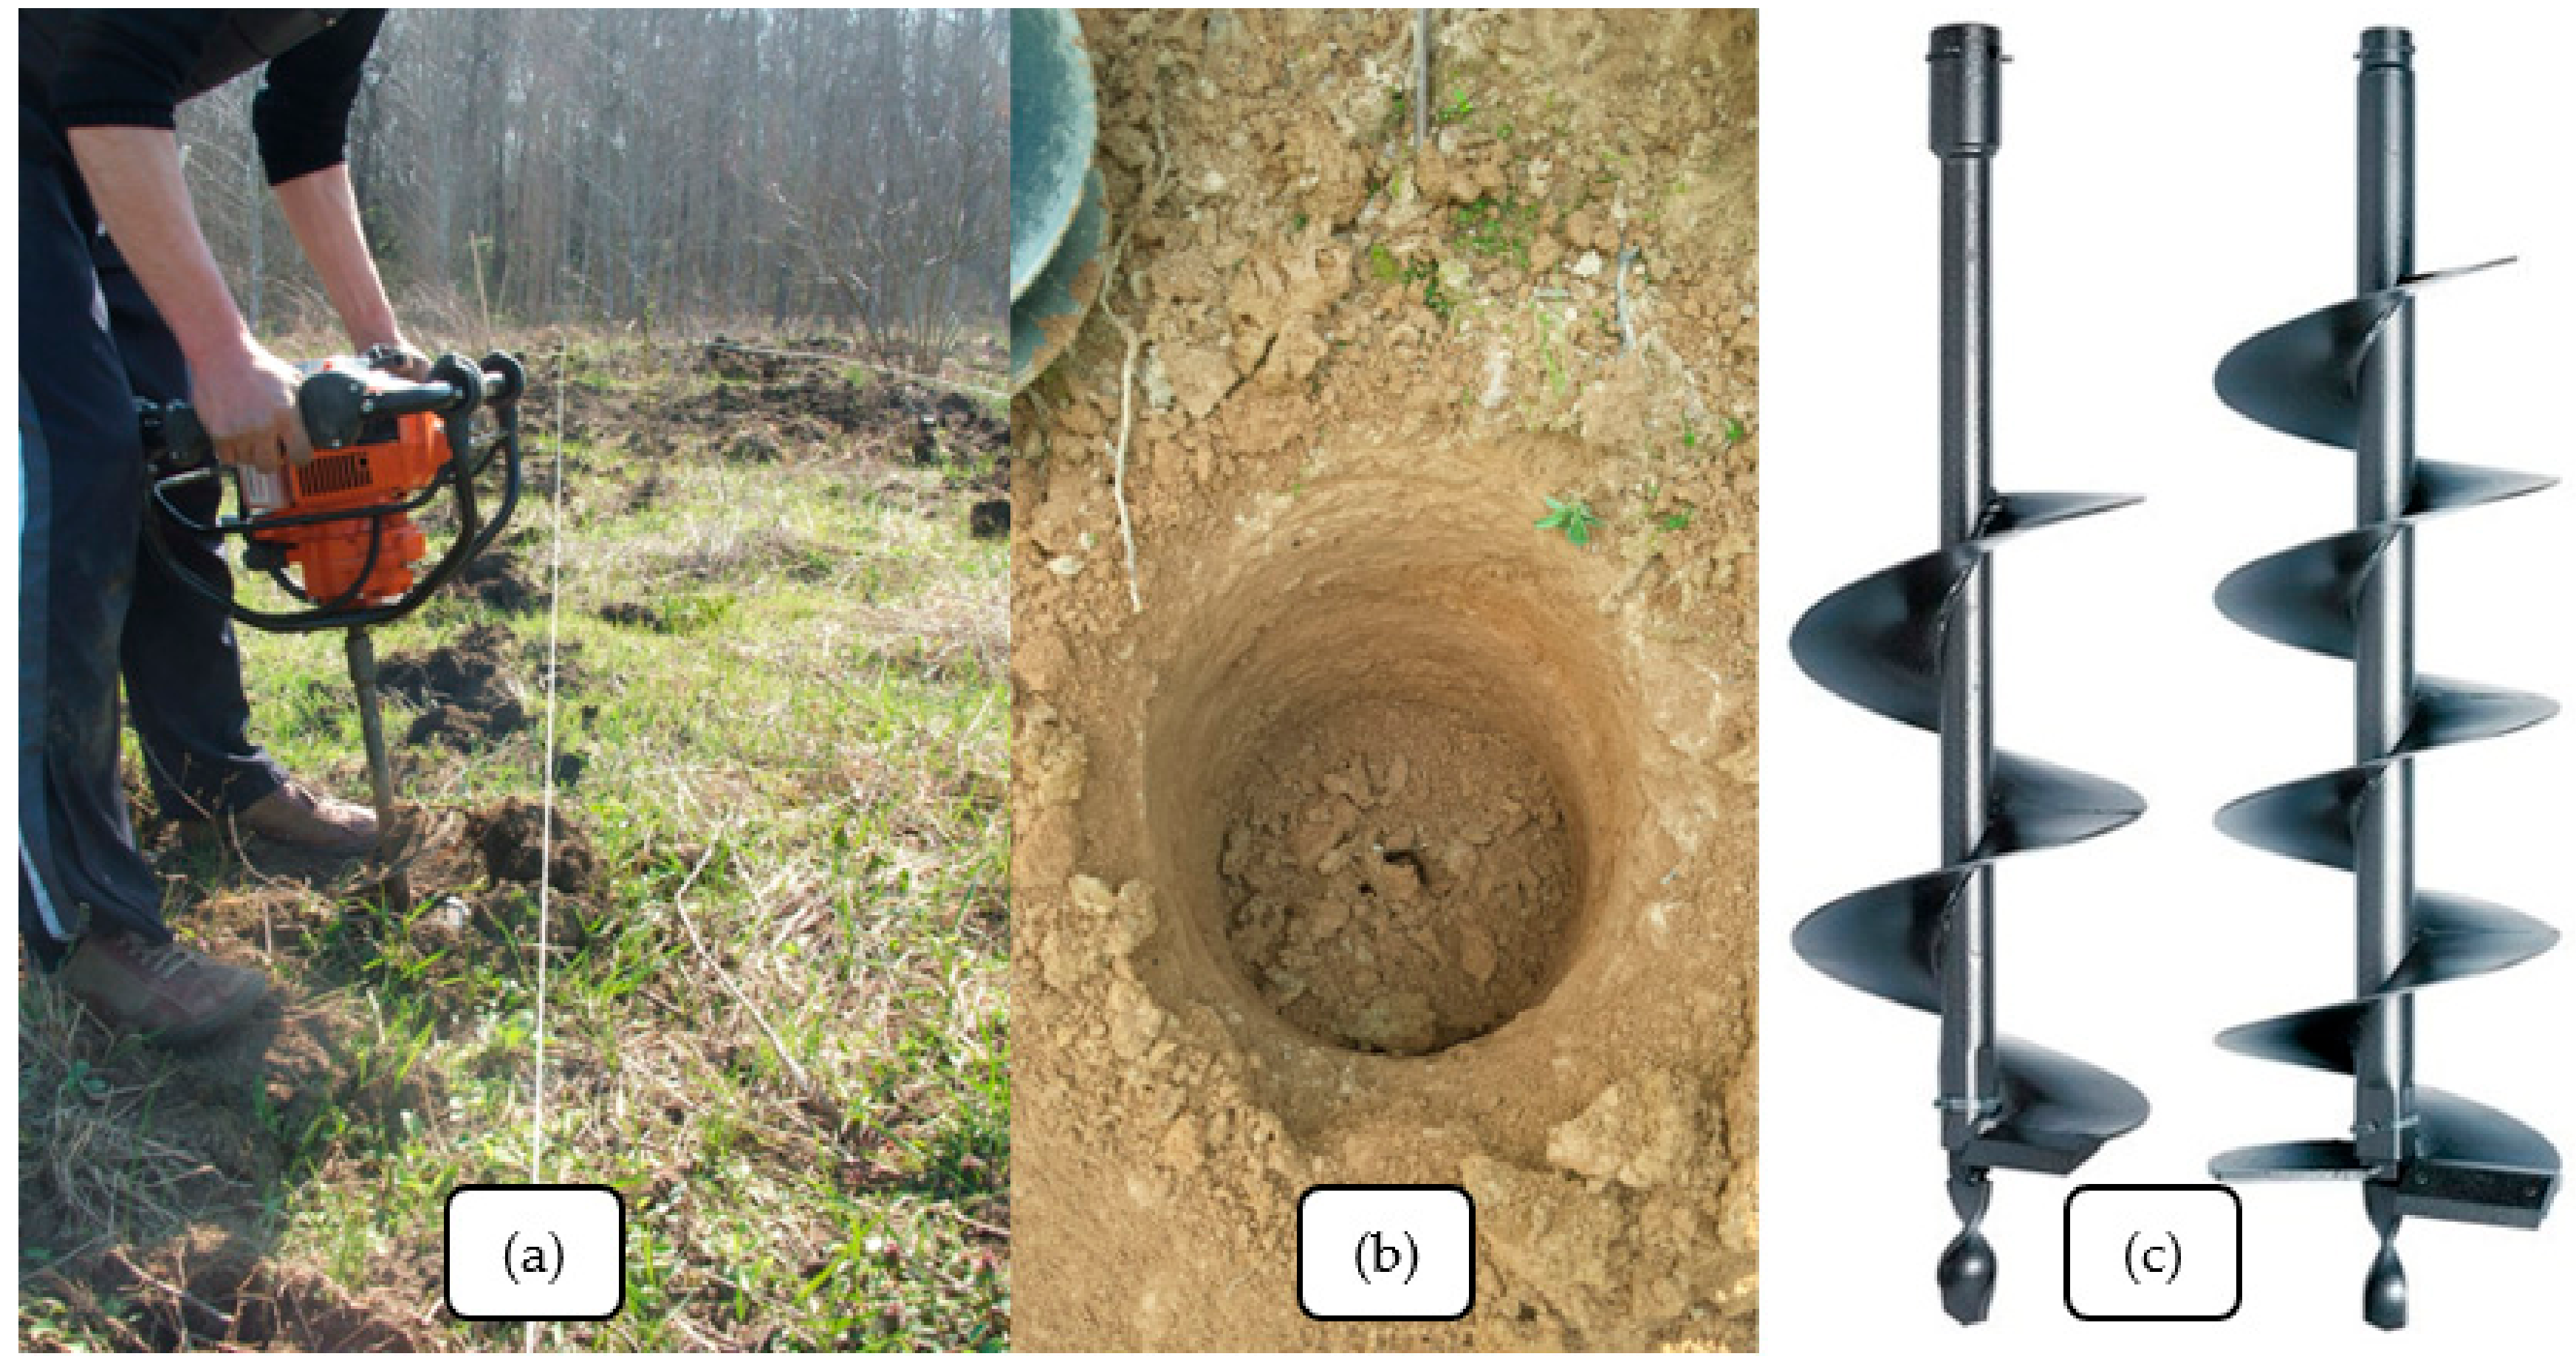
2.1. Study Location, Equipment Description, and Experimental Layout

Nine motor-manual pit-drilling field tests (hereafter FT1–FT9) were carried out in the spring (March–April) of 2015, 2016, and 2017 on nine sites in five forest districts located in the western half of Romania (Figure 1, Table 1). The choice of compartments to be experimented on was based on the specific variability in topography and soil conditions that characterize the plain, hill, and part of the mountainous forested area in Romania. In all of the field tests, small-sized bare-root seedlings were used in planting operations. According to the relevant Romanian standards, such seedlings are characterized by root sizes in range of 20–25 cm, ages of 2–4 years, and diameters at the collar of 5–10 mm [1].
Two drill sizes were experimented on each site, using a 1.3 kW, 9.4 kg Stihl BT 121 (Figure 2) auger (Stihl, Waiblingen, Germany). In the first treatment, a drill that was 150 mm in diameter (hereafter D150) was used to make cylindrical pits with a depth of 300 mm, while in the second treatment a drill that was 200 mm in diameter (hereafter D200) was used to drill at the same depth.
On each site, an experienced worker was used to work with both drills. However, different workers were used on different sites. Given the requirements to plant all of the designated area from each site, it was not possible to establish in advance a balanced planting design in which an equal number of pits were used between the two drill sizes. Instead, an exact number of 50 pits (Table 1) were made using the D150 and the rest were made using the D200.
Irrespective of the site and drill size, the planting scheme was of 2 × 1 m, being in line with the Romanian regulations of planting schemes [1]. On sites characterized by flat terrain, a rope was used to align the drilled pits (Figure 2), a setup that was not possible in steep terrain. The worker planned in advance the location of each pit, irrespective of the slope condition. Tree species to be planted were selected according to the provisions of local forest management plans, which are the regulatory documents describing operations to be implemented by quantitative and qualitative indicators [20] that follow the general principia of such operations [1]. Excepting the Norway spruce, most of the tree species used in the described planting operations are characterized by the development of a prominent radicle, with some of them exhibiting such a behavior starting from their youth [21].

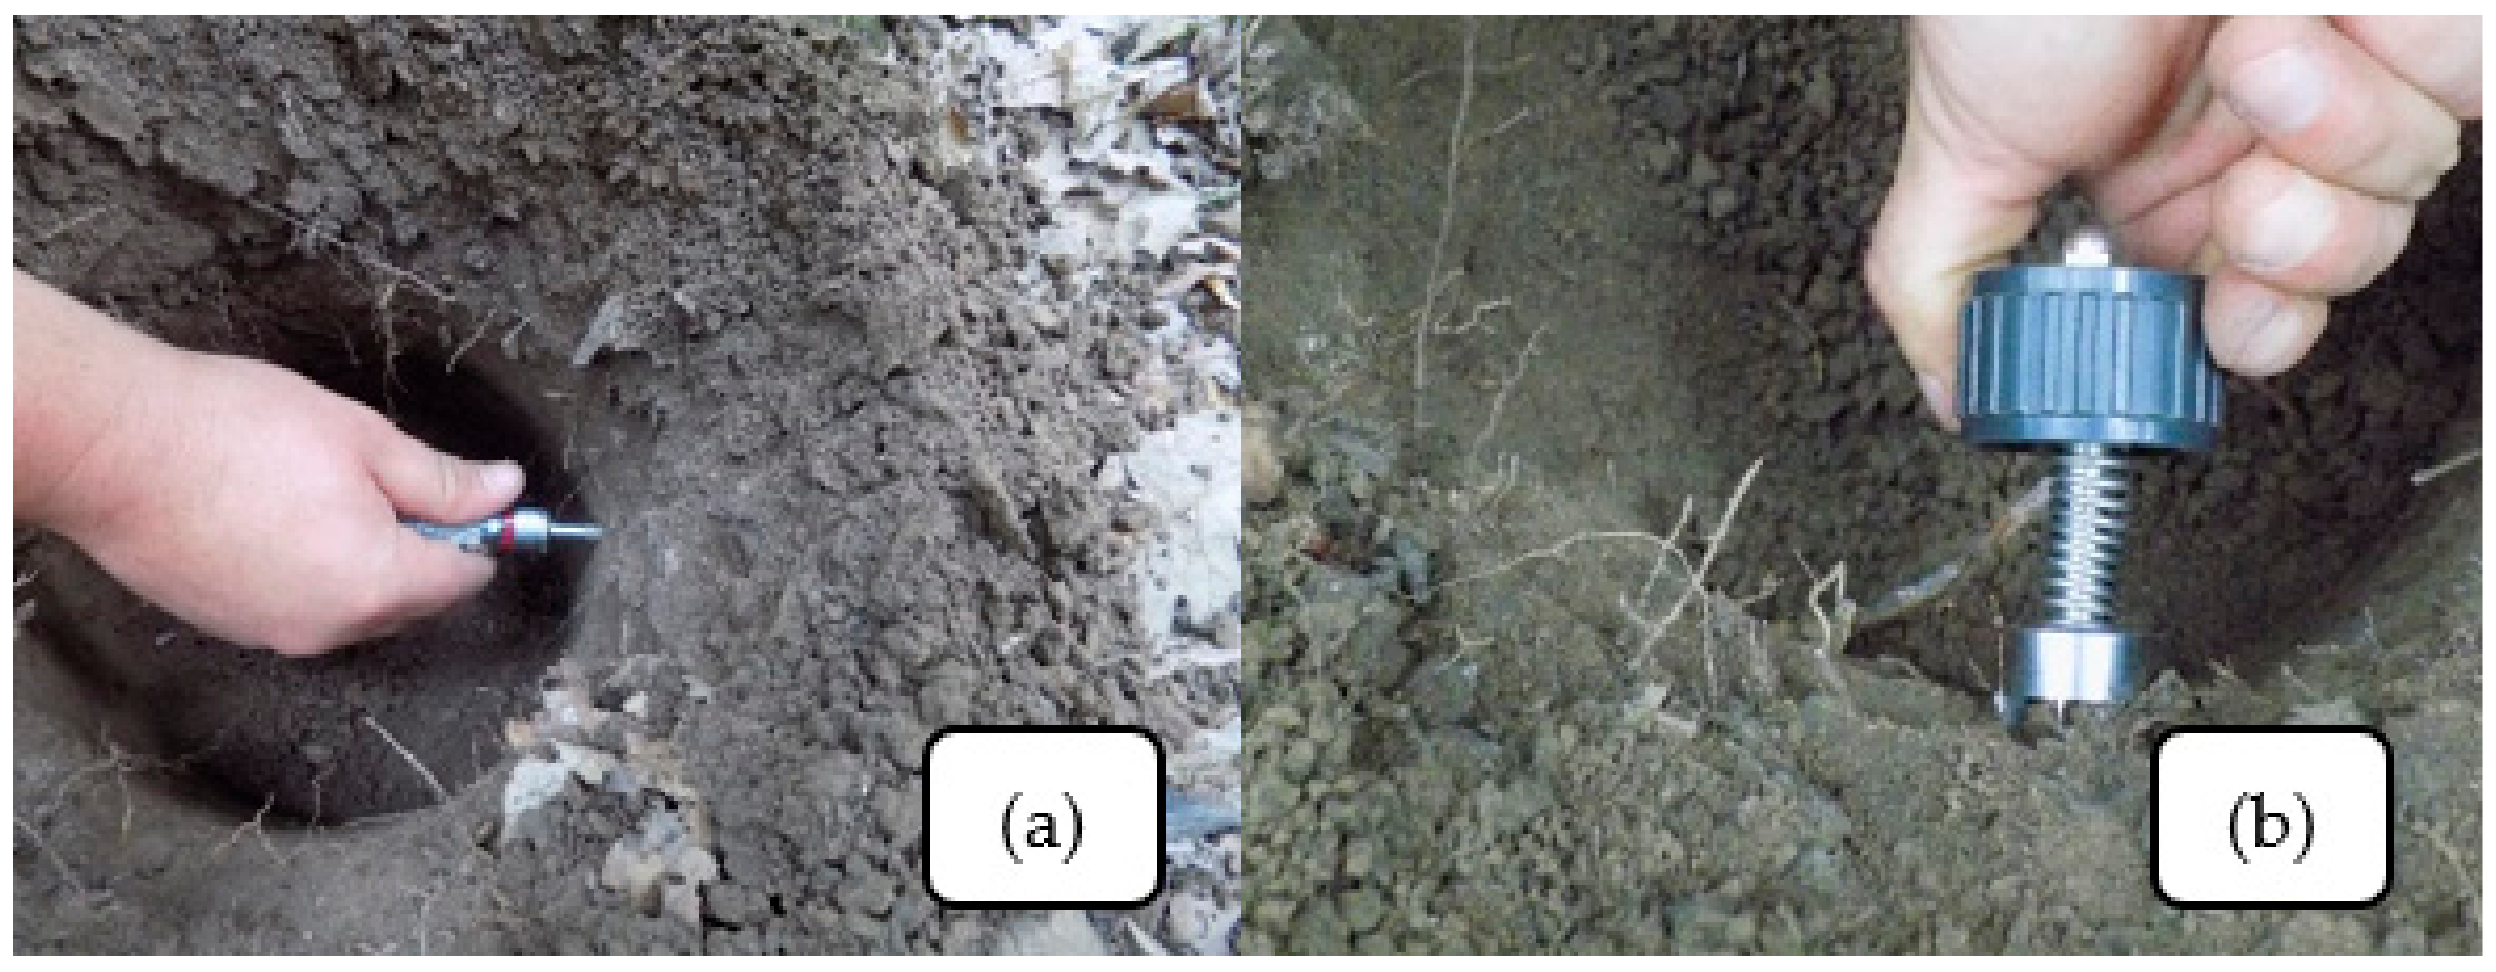
2.2. Data Collection

To evaluate the basic physical properties of the soils, six soil samples were taken from each site at three depths (0–10, 10–20, and 20–30 cm) using the equipment, procedures, and techniques described in Târziu [22]. The samples were used to evaluate the moisture content (SM, %), bulk density (BD, g/cm3), total porosity (TP, %), and granulometric composition (G, %) of each soil type by the regular standardized techniques [22,23]. For each site, soil type was documented from the management plans and cross-validated by observation in the field. All the tests were carried out in the specialized laboratory of agro-pedology of the Arad’s Department of Agriculture.
Time consumption data was collected using the continuous chronometry method [24] due to the equipment that was available for time measuring and the characteristics of the observed operations. Typically, this method can be used when the work elements are less complex and have long durations [25]. Based on the concepts used in comparison studies [26], a digital stopwatch was used to measure the time spent in two events that were considered relevant for the study design: moving time (MT, s), which was the time spent by the worker to move from a drilled pit to the next one, and the pit drilling time (DT, s), which was the time spent to effectively drill a pit. Both MT and DT were assumed to be affected by the drill size. Time consumption data was recorded on paper sheets, then it was transferred, processed, and analyzed into MS Excel (Microsoft Excel 2013, Redmond, WA, USA).
Compared to other studies that accounted for the variability of processed unit size (e.g., [27]), this study assumed less variability in the fuel intake due to the relative homogeneity of drilled pits and moving distances. Therefore, it was assumed that the mean values of fuel consumption would carry enough information to characterize eventual differences between the two tested drill sizes. Fuel consumption was measured as described in Acuna et al. [26] and it covered both the fuel used in effective drilling and the fuel consumed during the idle running of engine.
Physical quality of the pits was described by features such as the resistance to penetration (RP, daN × cm−2) and shear strength (SS, daN × cm−2). These parameters were measured at the bottom (b) of the pits and at depths (h) of 5, 15, and 25 cm from the surface, on a direction perpendicular to each pit’s walls. RP was measured using a HM-500 handheld instrument (Gilson Company Inc., Lewis Center, OH, USA), while the SS was measured using a handheld sampler marketed by IFA Group, Iaşi, Romania (Figure 3). Measurements were done once on each pit.
Since the seedling survival after one year is critical [1,8,19], each site was revisited in the early summer, one year after the plantation, to account for eventual losses. Survival data was collected using dichotomic attributes: survived vs. not survived, and was applied to each planted seedling observed in the first study stage.

2.3. Data Processing and Analysis

Normality tests (Shapiro-Wilk) were carried out to see whether the data used in statistical descriptions, comparisons, and modeling were normally distributed. Following this procedure, statistical tests appropriate to the data type and experimental design were used to compare and find eventual significant differences between the two drill sizes in terms of time and fuel consumption, physical quality of the drilled pits, and survival rate. Statistical modelling techniques by the means of logistic regression were used to evaluate what factors were most likely to affect the survival rate of the seedlings. Given the limited sample size characterizing the soil condition, statistical description was carried out using the regular descriptive statistics such as the mean value and standard deviation (moisture content, bulk density, total porosity) and the share of particle sizes in the case of granulometric analysis. Time consumption data was statistically described using the common procedures [26], while the statistical comparison methods used were those specific mostly to unbalanced designs. Since most of the data showed evident departure from normality, median values were used as statistic descriptors and Mann-Whitney tests were used to compare between the two treatments. Fuel consumption data was proven to be normally distributed. Therefore, the mean values were used as descriptors and regular two-tailed t tests were used for comparison. Physical quality of the drilled pits, expressed as the RP (daN × cm−2) and SS (daN × cm−2) at each pit’s bottom (b) and on its walls at 5, 15, and 25 cm from the soil’s surface, resulted in the statistical analysis of 16 data strings. A normality check resulted in various situations, with data both normally and non-normally distributed. However, in comparing pairs that differed in regard to which drill size was used, there was no such case in which both data strings were normally distributed. Therefore, Mann-Whitney tests were used to compare and median values were used to describe the data. Survival of the seedlings was encoded as a dichotomous variable using “1” for those seedlings that survived and “0” for the rest. Therefore, the data was statistically described using percentages for survival and mortality. Statistical comparison between the two drill sizes was carried out using a Fisher exact test in those cases in which the minimum number of expected events in one category (survived, not survived) was less or equal to 5 [28] and a χ2 test in the rest of cases. The last statistical procedure consisted of using the methods and techniques of logistic regression to predict the survival probability as a function of drill size, soil type, and physical characteristics of the pits. This statistical method was chosen due to its capability to work with dichotomous outcome variables [29]. To this end, the individual outcome in terms of survival was coded the same way as in the survival tests described above. Drill size was coded by 0 in case of D150 and by 1 in the case of D200. Soil type was coded with numbers from 0 to 9, and the physical features of the pits were kept as they came from the field tests. Both comparison and modelling procedures assumed a confidence level of 95% (α = 0.05), as is commonly used in biostatistics [28] and other kind of forestry-related research [26]; probabilities were set at p < 0.05 or p > 0.05 depending on the type of data and statistical tests used. Data processing and statistical analysis was carried on using the MS Excel software fitted with the Real Stats® plugin.

3. Results

3.1. Physical Condition of Soils in the Field Tests

Table 2 shows the basic physical characteristics of the soils. The share of granulometric fractions are given in Figure 4 for each field test. Typically, the pits were drilled in unprepared soils, with moisture contents decreasing as a function of depth and varying between 8.74% and 24.58%. In general, bulk density and total porosity were in line with the soil type and subtype [23], showing a decrement as a function of the soil depth.
Excepting the soil from the first site, which was at the limit of clay content to be classified as a clay, the rest of soils were loams according to Osman [22], with various amounts of both coarse and fine sand, resulting in medium coarse soil conditions. Sites of FT2 and FT4 were characterized by the presence of logging slash at the soil surface.

3.2. Time and Fuel Consumption

The observed time accounted for almost 5 h, out of which MT accounted for approximately 1.3 h and DT accounted for the rest, approximately 3.7 h. There were substantial differences between MTs due to the number of the drilled pits. About 0.4 h were spent as MT in the case of D150 and approximately 0.9 h in the case of D200. DT, on the other hand, accounted for approximately 1.3 h for D150 and for approximately 2.4 h for D200. Figure 5 gives the shares of DT and MT in the motor-manual drilling cycle time (CT) in regard to sites and drill sizes used. As shown, irrespective of the site, DT accounted for the greatest share (more than 60%) in the CT. As a rule, when using D150, the share of DT in CT was always smaller compared to the use of D200, excepting those cases in which the soil showed the presence of logging residues at the surface.
Table 3 gives the main descriptive statistics of the time study. On average, DT was always greater than MT, which in more than half of the cases amounted to less than 4 s. Comparison tests produced no evidence on significant differences between MT as an effect of the drill size (Table 3). This was true, however, only when comparing between drill sizes in the same field test. Excluding FT2 and FT4, the effective drilling time (DT) was systematically different between the two treatments studied in each field test (Table 3), showing also that more time was spent in drilling when using the second drill type (D200). Under the same circumstances, the ratio of D200 to D150 drilling time was in the range of 1.11 to 2.29.
In total, the fuel consumption amounted 7.373 L, resulting in approximately 0.41 L per field test. However, the number of pits drilled by D200 was greater (847) compared to D150 (450). In these conditions, the mean fuel consumption was 6.8 ± 2.78 mL for D150 and 5.2 ± 1.23 mL for D200. Even if not statistically different, compared to D150 (t = 2.20, p = 0.13, α = 0.05), the mean unit fuel consumption was found to be smaller when using D200.

3.3. Physical Quality of the Pits

Data characterizing RP and SS is given in Table 4. As shown, there was a general decreasing trend of RP as the sampling depth increased, with almost systematic differences and greater RPs when using D200. For data summarized at the study level, RP was found to be less at the bottom compared to second (h15) and third (h25) sampling layers and the RP values at the bottom were not statistically different between the drill sizes; they were different, however, on the pit’s wall, with greater RPs attributed to D200. At the field test level, with only two exceptions, differences were specific to all of the sampling depths, including the bottom of the pits; a similar finding indicates that, in general, D200 produced pits characterized by a greater resistance to penetration in the walls.
The only case in which no differences were found in terms of RP was that of FT2, where the soil was characterized by a vertic layer, which typically has characteristics that are mostly affected by its temporary moisture content [30]. Another particular case was that of FT9, where RP was found to be the highest starting from the very first centimeters of soil. SS was also significantly different for most of the compared pairs, excepting the values collected in FT7 and FT9, and some values characteristic to the upper part of the pits and their bottom. It was affected the same way that the resistance to penetration was.

3.4. Survival Rate and Survival Probability

In Romania, the commonly accepted survival rate one year after planting is 85% [1], therefore, the results of this study, excepting FT9, indicated a good survival rate, with values ranging from 84% (one case) to 94% for the seedlings planted in the 150-mm pits and with values ranging from 86.49% to 96.40% for seedlings planted in the 200-mm pits (Table 5).
At the field test level, no significant statistical differences in terms of survival rate were found between the drill sizes used, even if the survival rate was systematically higher for those pits produced by D200; at the study level, the differences were statistically significant, with an overall survival rate of 85.33% for D150 and of 91.03% for D200. FT9 accounted for the lowest survival rates (48% and 63.33%, respectively), a fact that probably relates to the soil type (Table 2), which also affected the physical characteristics of the pits.
Pit size, and therefore the drill size, as well as the physical quality of the pits, may affect the early survival rate, as shown in Table 6. Following the logistic regression analysis, the soil type failed to become a significant factor (p = 0.06) in predicting the probability of survival, while the SSs were far from representing significant predictors. Among the remaining factors, it seems that the pit type (PT) had the greatest effect, with a contribution of more than 10% to the survival probability in the case of D200. Surprisingly, RP seemed to positively affect the survival outcome for depths between 10 and 20 cm, which generally correspond to the space where the roots grow laterally after planting.
A similar outcome characterized the effect of RP at the bottom. The only expected negative contributions of RP were found at 5 and 25 cm in depth. The model included in Table 6 returned correct predictions of the survival probability in 92.4% of the cases, for a cut-off threshold set at 0.5.

4. Discussion

In what concerns the time consumption, and by excluding those field tests in which the results were affected by some particular conditions that are not common to the Romanian practical guidelines [31], this study showed that the CT varied between approximately 8–12 s for D150 and between approximately 11–17 s for D200. These results do not account for the supportive time and for different kinds of delays as described by Björheden et al. [24] and Acuna et al. [26], neither do they account for the effective planting. Instead, they are showing that drilling by D150 took less time, a fact that could be related to the drill size, since no significant differences were found in MT. Assuming a full planting operation, the numbers presented above probably would have reached more than half a minute per planted tree, a fact that still remains open to research. Studies on manual planting, on the other hand, have shown results in the range of 6 [6] to 19–26 [5] seconds spent to plant a tree, while for mechanized planting one could expect values in the range of 15–18 s per tree [4]. However, the performance of both manual and mechanized planting operations depends largely on the operational conditions, tools, and technology used. Fuel consumption was not found to be significantly different between the studied drill sizes, but such an outcome could still be affected, to some extent, by the operational behavior of the worker. Even if not statistically proven, the fuel consumption per pit was 0.8 mL higher in the case of D150, a fact that may count at bigger scales, thereby potentially advocating for the use of D200.
Generalization in the use of D200 is not sustained by the physical quality of pits but, in contrast, the early survival showed better results in this case. Even if different, the RPs and SSs of this study may not be attributed solely to the drill size. In fact, soil type and its natural characteristics are determinants of survival rate [3], while the tree species have different abilities to adapt their root growth to such characteristics [17]. For instance, soils characterized by bulk densities of about 1.7 kg L−1 characterize the point at which roots begin to cease penetration [17]. In this study, only two soils exhibited bulk densities close or greater than 1.7 kg L−1 (FT2 and FT3). However, the survival rates of plants grown in these soils were found to be among the best. The poorest results were those of FT9 (stagnic luvisol), where the use of D150 returned 48% and the use of D200 returned 63% in terms of early survival rate. In this case, the bulk density was evaluated to be close to that where the roots should have been able to develop well [17], but RPs and SSs were found to be the highest. Knowing the fact that sessile oak is less tolerant to difficult soil physical conditions compared to Turkey oak [21], it could be that the smaller survival rate was at the expense of the former. Early survival probability, as modelled by logistic regression, may be affected by two categories of factors that could be related to the drill size: pit size and the physical quality of pits in terms of RP. To this end, the positive contribution of RP measured at the pit’s bottom to the early survival of the seedlings could be seen as contrary to the root development mechanics. In many cases, however, this parameter showed smaller values compared to the pits’ walls, as an effect of the drill’s construction (Figure 2). In addition, one year could be insufficient to capture the effect of RP at this location, since many plants exhibit the so-called opportunism in timing and orientation [32]. Most probably, this was also the case of the RP measured at h15. Only RP measured at h5 and h25 contributed negatively to the probability of early survival, a fact which, most probably, is related to the architecture and development of the roots.
On the other hand, the survival rate may decrease in time due to various reasons. Some studies have shown that the survival rate after one season may vary in the range of 62% to 93% [33,34,35,36], which are figures comparable to that of this study. Having a survival of 89% in the first year, one could expect an additional mortality of 10% in the second season, especially when the drainage of the soil is poor [33]. Depending also on the seedling root treatment, in the third season the survival may decrease by 2%–4% compared to the first year [34]. In Scandinavian forests, the survival rate after five years was evaluated at 57%–78% and it was affected by the soil preparation type, with the poorest results in unprepared soils [37]. Therefore, it seems that one year after plantation may be too short of a period to discriminate the survival gain that was specific to D200. To this end, further research should be arranged to clarify how different drill sizes may affect the medium- and long-term survival.

5. Conclusions

We conclude that, in terms of early survival rate, the use of augers equipped with 200-mm drills contributed significantly to the planting success compared to 150-mm drills. Even if the differences between D200 and D150 were less than 1% in some cases, when thinking at bigger scales, such differences will have significant consequences in terms of resource allocation. In difficult soil conditions, the discrimination between the two drill sizes was evident in terms of survival, as D150 was outperformed by D200 by approximately 30%. In such or similar conditions, sites operated by D150 will require substantial investments to improve the survivability of planted seedlings. The fact that the physical quality of pits drilled by D200 was poorer had no effects on the early survival. Even if not statistically proven, the fuel consumption was higher when using D150 but the time consumption was less. Based on these facts, and at least in terms of early seedling survival, the second option (D200) would fit better in motor-manually assisted planting operations.

Author Contributions

Conceptualization: N.B. and S.A.B.; Data curation: N.B., F.B., A.T., D.V., M.V.M., and C.I.D.; Formal analysis: A.T., D.V., M.V.M., E.I., and C.I.D.; Funding acquisition: N.B., E.I., and C.I.D.; Investigation: N.B., F.B., A.T., and D.V.; Methodology: N.B. and S.A.B.; Resources: F.B., M.V.M., and S.A.B.; Supervision: N.B.; Validation: E.I.; Writing—original draft: S.A.B.; Writing—review and editing: S.A.B.

Funding

This research received no external funding.

Acknowledgments

This work was supported, both logistically and financially, by the Department of Engineering and Informatics, Faculty of Economics, Informatics and Engineering, “Vasile Goldiş” Western University of Arad and by the Department of Forest Engineering, Forest Management Planning and Terrestrial Measurements, Faculty of Silviculture and Forest Engineering, Transilvania University of Braşov. The authors acknowledge the full support of the aforementioned institutions. Funds for covering the costs to publish in open access were provided by the authors.

Conflicts of Interest

The authors declare no conflict of interest.

References

  1. Abrudan, I.V. Împăduriri; Transilvania University Press: Braşov, Romania, 2006; p. 201. [Google Scholar]
  2. Niuwenhuis, M.; Egan, D. An evaluation and comparison of mechanised and manual tree planting on afforestation and reforestation sites in Ireland. Int. J. For. Eng. 2002, 3, 11–23. [Google Scholar] [CrossRef]
  3. Luoranen, J.; Rikala, R. Field performance of Scots pine (Pinus sylvestris L.) seedlings planted in disc trenched or mounded sites over an extended planting season. New For. 2013, 44, 147–162. [Google Scholar] [CrossRef]
  4. Laine, T.; Saarinen, V.-M. Comparative study of the Risutec automatic plant container (APC) and Bracke planting devices. Silva Fenn. 2014, 48. [Google Scholar] [CrossRef]
  5. De Franceschi, J.P.; Steele, T. Labor Productivity for Manual Tree Planting in Manitoba. Available online: http://cfs.nrcan.gc.ca/bookstore_pdfs/22928.pdf (accessed on 13 September 2018).
  6. McDonald, T.P.; Fulton, J.P.; Darr, M.J.; Gallagher, T.V. Evaluation of a system to spatially monitor hand planting of pine seedlings. Comput. Electron. Agric. 2008, 64, 173–182. [Google Scholar] [CrossRef]
  7. Luoranen, J.; Rikala, R.; Smolander, H. Machine planting of Norway spruce by Bracke and Ecoplanter: An evaluation of soil preparation, planting method and seedling performance. Silva Fenn. 2011, 45, 341–357. [Google Scholar] [CrossRef]
  8. Luoranen, J.; Saksa, T.; Lappi, J. Seedling, planting site and weather factors affecting the success of autumn plantings in Norway spruce and Scots pine seedlings. For. Ecol. Manag. 2018, 419, 79–90. [Google Scholar] [CrossRef]
  9. Ersson, B.T.; Laine, T.; Saksa, T. Mechanized tree planting in Sweden and Finland: Current state and key factors for future growth. Forests 2018, 9, 370. [Google Scholar] [CrossRef]
  10. Britto, P.; Silva Lopes, E.; De Laat, E.F.; Fiedler, N.C. Biomechanical evaluation in workers of different statures at planting and fertilizing forest activities. For. Sci. 2014, 42, 191–196. [Google Scholar]
  11. Granzow, F.R.; Schall, M.C., Jr.; Smidt, M.F.; Chen, H.; Fethke, N.B.; Huangfu, R. Characterizing exposure to physical risk factors among reforestation hand planters in the Southeastern United States. Appl. Ergon. 2018, 66, 1–8. [Google Scholar] [CrossRef] [PubMed]
  12. Cheţa, M.; Marcu, M.V.; Borz, S.A. Workload, exposure to noise and risk of musculoskeletal disorders: A case study of motor-manual tree felling and processing in poplar clear cuts. Forests 2018, 9, 300. [Google Scholar] [CrossRef]
  13. Guedes, I.L.; Minette, L.J.; Da Silva, E.P.; Amaury, P.; De Souza, A.P. Assessment of the noise and vibration levels during semi-mechanized pit digging in mountainous region. Engenharia na Agricultura 2010, 18, 9–12. [Google Scholar] [CrossRef]
  14. South, D.B.; Jackson, D.P.; Starkey, T.E.; Enebak, S.A. Planting deep increases early survival and growth of Pinus echinata seedlings. For. Sci. 2012, 5, 33–41. [Google Scholar] [CrossRef]
  15. Luoranen, J.; Viiri, H. Deep planting decreases risk of drought damage and increases growth of Norway spruce container seedlings. New For. 2016, 47. [Google Scholar] [CrossRef]
  16. Heiskanen, J.; Saksa, T.; Luoranen, J. Soil preparation method affects outplanting success of Norway spruce container seedlings on till soils susceptible to frost heave. Silva Fenn. 2013, 47, 17. [Google Scholar] [CrossRef]
  17. Binkley, D.; Fisher, R.F. Ecology and Management of Forest Soils; John Wiley & Sons, Ltd.: Hoboken, NJ, USA, 2013; p. 347. ISBN 9781118422342. [Google Scholar]
  18. Ampoorter, E.; De Frenne, P.; Hermy, M.; Verheyen, K. Effects of soil compaction on growth and survival of tree saplings: A meta-analysis. Basic Appl. Ecol. 2011, 12. [Google Scholar] [CrossRef]
  19. Sutton, R.F. Soil Properties and Root Development in Forest Trees: A Review. Forestry Canada. Information Report O-X-413. Available online: http://cfs.nrcan.gc.ca/pubwarehouse/pdfs/9092.pdf (accessed on 12 September 2018).
  20. Abrudan, I.V. A decade of non-state administration of forests in Romania: Achievements and challenges. Int. For. Rev. 2012, 14, 275–284. [Google Scholar] [CrossRef]
  21. Şofletea, N.; Curtu, L. Dendrologie, 2nd ed.; Pentru Viaţă Publishing House: Braşov, Romania, 2008; p. 418. ISBN 978-973-85874-4-1. [Google Scholar]
  22. Osman, K.T. Forest Soils Properties and Management; Springer: Cham, Switzerland; Heidelberg, Germany; New York, NY, USA; Dordrecht, The Netherlands; London, UK, 2013; p. 210. ISBN 978-3-319-02540-7. [Google Scholar]
  23. Târziu, D. Pedologie și Stațiuni Forestiere; Ceres Publishing House: București, Romania, 1997; p. 488. ISBN 973-40-0391-7. [Google Scholar]
  24. Björheden, R.; Apel, K.; Shiba, M.; Thompson, M. IUFRO Forest Work Study Nomenclature; Swedish University of Agricultural Science, Department of Operational Efficiency: Grapenberg, Sweden, 1995; p. 16. [Google Scholar]
  25. Borz, S.A.; Birda, M.; Ignea, G.; Popa, B.; Campu, V.R.; Iordache, E.; Derczeni, R.A. Efficiency of a Woody 60 processor attached to a Mounty 4100 tower yarder when processing coniferous timber from thinning operations. Ann. For. Res. 2014, 57, 333–345. [Google Scholar] [CrossRef]
  26. Acuna, M.; Bigot, M.; Guerra, S.; Hartsough, B.; Kanzian, C.; Kärhä, K.; Lindroos, O.; Magagnotti, N.; Roux, S.; Spinelli, R.; et al. Good Practice Guidelines for Biomass Production Studies; Magagnotti, N., Spinelli, R., Eds.; CNR IVALSA: Sesto Fiorentino, Italy, 2012. [Google Scholar]
  27. Ignea, G.; Ghaffaryian, M.R.; Borz, S.A. Impact of operational factors on fossil energy inputs in motor-manual tree felling and processing: Results of two case studies. Ann. For. Res. 2017, 60, 161–172. [Google Scholar] [CrossRef]
  28. Zar, J.H. Biostatisical Analysis, 5nd ed.; Prentice-Hall, Inc.: Upper Saddle River, NJ, USA, 2010; p. 931. ISBN 978-0-13-100845-5. [Google Scholar]
  29. Hosmer, D.W.; Lemeshow, S. Applied Logistic Regression, 2nd ed.; John Wiley& Sons, Inc.: Hoboken, NJ, USA, 2000; p. 369. ISBN 0-471-35632-8. [Google Scholar]
  30. Florea, N.; Munteanu, I. Sistemul Român de Taxonomie a Solurilor; Estfalia Publishing House: București, Romania, 2003; p. 182. ISBN 97385841-7-5. [Google Scholar]
  31. Oprea, I. Tehnologia Exploatării Lemnului; Transilvania University Press: Braşov, Romania, 2008; p. 273. ISBN 978-973-598-301-7. [Google Scholar]
  32. Perry, T.O. Tree Roots: Facts and Fallacies. Available online: http://arnoldia.arboretum.harvard.edu/pdf/articles/1989-49-4-tree-roots-facts-and-fallacies.pdf (accessed on 12 September 2018).
  33. Buitrago, M.; Paquette, A.; Thiffault, N.; Bélanger, N.; Messier, C. Early performance of planted hybrid larch: Effects of mechanical site preparation and planting depth. New For. 2015, 46, 319–337. [Google Scholar] [CrossRef] [Green Version]
  34. Harrington, T.B.; Howell, K.D. Planting cost, survival, and growth one to three years after establishing loblolly pine seedlings with straight, deformed or pruned taproots. New For. 1998, 15, 193–204. [Google Scholar] [CrossRef]
  35. South, D.B.; Rakestraw, J.L.; Lowerts, G.A. Early gains from planting large-diameter seedlings and intensive management are additive for loblolly pine. New For. 2001, 22, 97–110. [Google Scholar] [CrossRef]
  36. Anon, V.; Hartley, S.; Wittmer, H.U. Survival and growth of planted seedlings of three native tree species in urban forest restoration in Wellington, New Zealand. N. Z. J. Ecol. 2015, 39, 170–178. [Google Scholar]
  37. Hallsby, G.; Örlander, G. A comparison of mounding and inverting to establish Norway spruce on podzolic soils in Sweden. Forestry 2004, 77, 107–117. [Google Scholar] [CrossRef] [Green Version]
Figure 1. Map of Romania showing the locations of field tests. Legend: FT1–FT9 stand for the field tests 1 to 9.
Forests 09 00665 g001
Figure 2. Example of pit drilling in one of the field tests (a), using either 150-mm drills (D150) or 200-mm drills (D200) (c), and an example of the resulted pit (b).
Forests 09 00665 g002
Figure 3. Example of measurements of resistance to penetration (a) and shear strength (b).
Forests 09 00665 g003
Figure 4. Granulometric distribution of forest soils in the analyzed field tests. Legend: FT1 to FT9 stand for the field tests 1 to 9.
Forests 09 00665 g004
Figure 5. Shares of pit-drilling and moving time in the productive time in regard to field tests and drill sizes. Legend: FT1 to FT9 stand for the field tests 1 to 9; D150 and D200 stand for the two tested drill sizes.
Forests 09 00665 g005
Table 1. Basic description of the field tests.
Field Test Date of Field Tests
Composition
Ground Slope (°)Altitude (m)LocationNumber of Observations
D150D200
FT126 March 20158104N 46°09′22.94′′
E 21°15′46.06′′
50116
70% Common oak
Quercus robur L.
30% Ash
Fraxinus excelsior L.
FT29 March 201510107N 46°09′58.68′′
E 21°15′45.71′′
5087
60% Common oak
Quercus robur L.
20% Sweet cherry
Prunus avium L.
20% Ash
Fraxinus excelsior L.
FT330 March 201618386N 46°02′17.72′′
E 21°48′25.17′′
50105
100% Sessile oak
Quercus petraea (Matt.) Liebl.
FT425 March 201612112N 46°09′47.23′′
E 21°14′34.42′′
50111
100% Black walnut
Juglans nigra L.
FT522 April 2016321280N 45°17′43.72′′
E 22°49′54.53′′
50113
100% Norway spruce
Picea abies (P. excelsa (Lam.) Link.)
FT606.04.201728420N 45°56′24.87′′
E 22°23′26.12′′
5075
60% Beech
Fagus sylvatica L.
40% Sessile oak
Quercus petraea (Matt.) Liebl.
FT728 April 201730360N 45°56′35.00′′
E 22°23′27.50′′
5074
60% Beech
Fagus sylvatica L.
20% Sessile oak
Quercus petraea (Matt.) Liebl.
20% Sweet cherry
Prunus avium L.
FT830 March 201724185N 46°00′29.26′′
E 21°07′59.51′′
50106
70% Common oak
Quercus robur L.
30% Sweet cherry
Prunus avium L.
FT924 April 201722290N 46°55′36.54′′
E 21°59′10.00′′
5060
50% Turkey oak
Quercus cerris L.
50% Sessile oak
Quercus petraea (Matt.) Liebl.
Note: FT–FT9 stand for field tests 1 to 9.
Table 2. Basic physical characteristics of the soils in the field tests.
Field Test and Soil TypePhysical PropertiesSampling Depth
0–10 cm10–20 cm20–30 cm
FT1
(Mollic Gleysol)
Moisture (%)24.11 ± 1.2022.73 ± 1.0020.09 ± 0.80
Bulk density (g/cm3)1.62 ± 0.231.69 ± 0.191.72 ± 0.06
Total porosity (%)37.89 ± 2.5137.43 ± 2.2436.45 ± 1.15
FT2
(Vertic Fluvisol)
Moisture (%)20.75 ± 0.9019.46 ± 0.7017.38 ± 0.50
Bulk density (g/cm3)1.70 ± 0.021.75 ± 0.011.73 ± 0.00
Total porosity (%)36.97 ± 1.3235.73 ± 1.1135.19 ± 0.92
FT3
(Haplic Luvisol)
Moisture (%)22.43 ± 0.8021.10 ± 0.508.74 ± 0.30
Bulk density (g/cm3)1.69 ± 0.051.71 ± 0.031.73 ± 0.01
Total porosity (%)37.43 ± 1.0536.31 ± 0.9636.09 ± 0.53
FT4
(Dystric Fluvisol)
Moisture (%)23.35 ± 0.5021.68 ± 0.3019.54 ± 0.10
Bulk density (g/cm3)1.64 ± 0.011.58 ± 0.011.51 ± 0.00
Total porosity (%)35.54 ± 2.5233.28 ± 2.0131.25 ± 1.85
FT5
(Leptic-entic Podzol)
Moisture (%)23.54 ± 0.8021.37 ± 1.1019.20 ± 0.70
Bulk density (g/cm3)0.82 ± 0.121.16 ± 0.241.51 ± 0.11
Total porosity (%)46.25 ± 1.3142.43 ± 1.1439.88 ± 1.05
FT6
(Endolepti-eutric Cambisol)
Moisture (%)24.58 ± 0.5022.36 ± 0.4020.81 ± 0.40
Bulk density (g/cm3)1.20 ± 0.021.22 ± 0.011.23 ± 0.00
Total porosity (%)61.35 ± 1.0159.30 ± 0.8656.60 ± 0.67
FT7
(Eutric Cambisol)
Moisture (%)22.68 ± 0.420.52 ± 0.2018,05 ± 0.20
Bulk density (g/cm3)1.38 ± 0.031.35 ± 0.041.28 ± 0.03
Total porosity (%)52.48 ± 0.3050.16 ± 0.2048.16 ± 0.20
FT8
(Vertic Chernozem)
Moisture (%)22.68 ± 0.4020.52 ± 0.2018,05 ± 0.20
Bulk density (g/cm3)1.38 ± 0.031.35 ± 0.041.28 ± 0.03
Total porosity (%)52.48 ± 0.3050,16 ± 0.2048.16 ± 0.20
FT9
(Stagnic Luvisol)
Moisture (%)18.84 ± 0.5018.22 ± 0.3017.74 ± 0.20
Bulk density (g/cm3)1.14 ± 0.031.46 ± 0.021.54 ± 0.02
Total porosity (%)58.43 ± 0.5046.19 ± 0.4044.41 ± 0.20
Note: FT1 to FT9 stand for the field tests 1 to 9.
Table 3. Descriptive statistics of effective drilling (DT) and moving (MT) time.
Field Test, Drill Size, and Time Consumption CategoryDescriptive Statistics
NMin (s)Max (s)Range (s)Median (s)Sum (s)
FT1D150DT503.288.214.935.17 *270.35
MT501.194.523.332.32129.73
D200DT1167.0119.5012.4911.84 *1357.07
MT1161.194.923.732.57338.79
FT2D150DT507.8266.3058.4820.32 *1170.99
MT503.345.982.644.91236.13
D200DT878.1926.8018.6111.08 *1043.70
MT872.637.114.484.92420.59
FT3D150DT504.588.093.515.91 *303.86
MT501.354.403.052.48135.91
D200DT1057.4119.0011.5911.54 *1265.82
MT1051.357.706.352.54290.02
FT4D150DT504.3262.8058.4816.82 *995.99
MT503.027.704.684.35219.73
D200DT1116.0416.7810.748.99 *1090.96
MT1112.767.704.944.44506.93
FT5D150DT503.619.595.984.64 *253.68
MT501.804.752.953.18156.87
D200DT1134.8112.848.036.69 *835.20
MT1131.524.783.263.54381.93
FT6D150DT506.028.952.936.77 *352.48
MT502.575.402.834.20211.22
D200DT758.0211.933.919.17 *711.53
MT751.745.984.244.33328.3
FT7D150DT505.217.892.686.67 *333.18
MT501.745.703.964.48217.48
D200DT746.9510.523.578.91 *659.50
MT741.745.984.244.61331.66
FT8D150DT503.7111.157.436.52 *340.61
MT501.244.743.502.86141.02
D200DT1064.9514.869.918.59 *943.96
MT1062.004.742.742.81306.78
FT9D150DT506.1713.347.179.51 *481.37
MT501.336.154.822.45127.11
D200DT608.2218.4910.2712.97 *787.83
MT601.337.716.382.26160.10
Note: * Denotes significant differences between drill sizes in the effective drilling time (DT) according to the two-tailed Mann-Whitney test; FT1 to FT9 stand for the field tests 1 to 9; D150 and D200 stand for the two tested drill sizes; MT stands for the moving time, DT stands for the drilling time.
Table 4. Description and comparison of resistance to penetration (RP) and shearing strength (SS) between field tests and drill sizes.
Field TestTreatmentNumber of ObservationsResistance to Penetration (RP)Shear Strength (SS)
(daN × cm−2)(daN × cm−2)
h5h15h25bh5h15h25b
FT1D150501.301.50 *1.75 *2.00 *1.68 *2.25 *2.40 *2.00 *
D2001161.202.15 *2.55 *1.30 *3.00 *2.95 *2.75 *1.30 *
FT2D150502.052.252.532.602.05 *2.48 *2.53 *2.00 *
D200871.952.502.552.602.80 *3.00 *3.00 *2.50 *
FT3D150500.90 *1.10 *1.30 *0.90 *1.10 *1.50 *1.85 *1.40
D2001051.79 *2.25 *2.55 *1.20 *2.54 *3.15 *3.15 *1.30
FT4D150501.85 *2.15 *2.33 *2.40 *2.20 *2.60 *2.70 *2.15
D2001112.25 *2.85 *2.95 *2.90 *2.34 *2.37 *2.37 *2.25
FT5D150500.83 *1.41 *1.71 *0.79 *1.29 *1.35 *1.14 *0.79 *
D2001130.95 *1.90 *2.30 *1.05 *1.80 *1.75 *1.55 *1.10 *
FT6D150501.13 *1.50 *1.50 *1.61 *1.67 *1.74 *1.76 *1.43 *
D200751.50 *1.95 *2.00 *2.15 *1.90 *2.10 *2.35 *1.85 *
FT7D150501.60 *2.20 *2.30 *2.252.052.152.152.00
D200742.25 *2.50 *2.70 *2.451.902.001.921.70
FT8D150501.90 *2.653.101.50 *2.903.553.45 *1.65 *
D2001062.25 *2.703.001.65 *2.993.603.63 *1.75 *
FT9D150504.15 *4.28 *4.40 *4.15 *3.533.703.703.67
D200604.50 *4.50 *4.50 *4.38 *3.603.803.803.77
ALLD1504501.55 *1.95 *2.10 *1.902.00 *2.32 *2.35 *1.70
D2008471.75 *2.40 *2.65 *1.752.55 *2.82 *2.75 *1.65
Note: * Denotes statistically significant differences in qualitative parameters found between the drill size used, according to the Mann-Whitney test; FT1 to FT9 stand for the field tests 1 to 9, ALL stands for all of the collected data; D150 and D200 stand for the two tested drill sizes; h5, h15, and h25 stand for the sampling depths of 5, 15, and 25 cm, respectively, b stands for the bottom.
Table 5. Description and comparison of survival rate between field tests and drill sizes.
Field TestDrill SizeNumber of Survived SeedlingsNumber of Died
Seedlings
Survival Rate
(%)
Comparison Tests and Diagnose
Fχ2Significant?
FT1D15044688.00p = 0.388χ2 = 0.765, p = 0.382 *no
D200107992.24
FT2D15045590.00p = 0.497χ2 = 0.849, p = 0.357 *no
D20082594.25
FT3D15045590.00p = 0.334χ2 = 0.944, p = 0.331 *no
D20099694.29
FT4D15046492.00p = 0.256χ2 = 1.411, p = 0.235 *no
D200107496.40
FT5D15047394.00p = 1.000χ2 = 0.032, p = 0.859 *no
D200107694.69
FT6D15046492.00p = 1.000χ2 = 0.080, p = 0.778 *no
D20070593.33
FT7D15042884.00p = 0.797 *χ2 = 0.149, p = 0.700no
D200641086.49
FT8D15045590.00p = 0.769χ2 = 0.095, p = 0.758 *no
D20097991.51
FT9D150242648.00p = 0.125 *χ2 = 2.607, p = 0.106no
D200382263.33
ALLD1503846685.33p < 0.001 *χ2 = 22.150, p < 0.001yes
D2007717691.03
Note: * Stands for the results of the comparison tests that were used for interpretation depending on the sample characteristics; FT1 to FT9 stand for the field tests 1 to 9, ALL stands for all of the collected data; D150 and D200 stand for the two tested drill sizes.
Table 6. Results of survival rate probability modeled by logistic regression.
ParameterCoefficients (β)Standard ErrorWaldp-ValueExponential (β)LowerUpper
Intercept3.4970.53043.49<0.00133.025--
PT2.3840.54019.49<0.00110.8513.76531.279
RPh5−2.8330.37158.45<0.0010.0590.0280.122
RPh151.1080.4615.78=0.0163.0271.2267.477
RPh25−0.6240.3064.15=0.0420.5360.2940.977
RPb0.8500.17024.86<0.0012.3381.6753.265
Note: PT stands for pit type; RPh5, RPh15, and RPh25 stand for resistance to penetration sampled at 5, 15, and 25 cm, respectively; RPb stands for resistance to penetration sampled at the bottom.

