Article

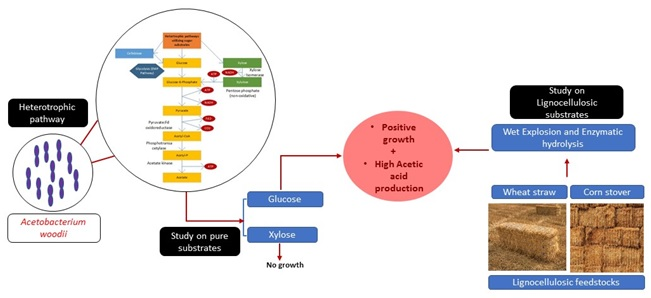
Kinetic Study on Heterotrophic Growth of Acetobacterium woodii on Lignocellulosic Substrates for Acetic Acid Production

by
Supriya C. Karekar
1,
Keerthi Srinivas
1 and
Birgitte K. Ahring
1,2,3,*
1
Bioproducts, Sciences and Engineering Laboratory, Washington State University, Tri-Cities, 2710, Crimson Way, Richland, WA 99354, USA
2
Biological Systems Engineering, L.J. Smith Hall, Washington State University, Pullman, WA 99164, USA
3
The Gene and Linda Voiland School of Chemical Engineering and Bioengineering, Washington State University, Pullman, WA 99163, USA
*
Author to whom correspondence should be addressed.
Submission received: 31 December 2018 / Revised: 28 January 2019 / Accepted: 29 January 2019 / Published: 2 February 2019
(This article belongs to the Special Issue Biomass Conversion: Fermentation Chemicals and Fuels)

Abstract

:
Extensive research has been done on examining the autotrophic growth of Acetobacterium woodii with gaseous substrates (hydrogen and carbon dioxide) to produce acetic acid. However, only limited work has been performed on the heterotrophic growth of A. woodii using pure sugars or lignocellulosic feedstocks-derived sugars as substrates. In this study, we examine the growth kinetics and acetic acid production of A. woodii on glucose and xylose. While good growth was observed with glucose as substrate, no significant growth was obtained on xylose. Kinetic studies were performed in batch culture using different concentrations of glucose, ranging from 5 g/L to 40 g/L. The highest acetate production of 6.919 g/L with a product yield of 0.76 g acetic acid/g glucose was observed with 10 g/L glucose as initial substrate concentration. When testing A. woodii on corn stover hydrolysate (CSH) and wheat straw hydrolysate (WSH) formed after pretreatment and enzymatic hydrolysis, we found that A. woodii showed acetic acid production of 7.64 g/L and a product yield of 0.70 g acetic acid/g of glucose on WSH, while the acetic acid production was 7.83 g/L with a product yield of 0.65 g acetic acid/g of glucose on CSH. These results clearly demonstrate that A. woodii performed similarly on pure substrates and hydrolysates, and that the processes were not inhibited by the heterogenous components present in the lignocellulosic feedstock hydrolysates.

Graphical Abstract

1. Introduction

Acetic acid is one of the most valuable, industrially important chemicals, with a global demand of 13 million tons of virgin acetic acid in the year 2015, which is forecasted to increase to approximately 18 million tons by 2020. The market price of acetic acid in North America in 2014 was around $2.3 billion, which is expected to rise up to 2.8 billion by 2019 [1,2]. This high demand is because of its myriad of applications as a raw material for many products, like paper coatings, latex emulsion resins used in the production of paints, adhesives, cellulose acetate fibers, textile finishing agents, cigarette filter tow, and plastics [3,4]. Currently acetic acid production is predominantly done using petrochemical feedstocks through various processes, of which methyl carbonylation process is the most commonly used process [5]. Other commonly applied approaches of acetic acid production include aerobic fermentation of substrates like ethanol using Acetobacterium species, where ethanol is converted to acetic acid with oxygen, mainly using two types of fermentation processes, a trickling process or a submerged fermentation [6]. However, these processes suffer from high production cost due to the requirement of continuous purging of oxygen to maintain an aerobic environment for obligate aerobic microbes, besides the additional cost of ethanol or any other substrates used for the production of acetic acid, along with the cost for upgrading the acetic acid produced to a higher quality [5,6]. Due to the abovementioned drawbacks of the existing methods and rising environmental concerns, significant interest has been gained for producing acetic acid from renewable sources such as lignocellulosic sugars and syngas from gasification of renewable feedstocks—all by fermentation of these products into acetic acid by microbial bioprocesses [7]. The major group performing this reaction is a specialized group called acetogens [8,9,10].
Acetogens are a diverse group of strictly anaerobic microorganisms which are able to consume a wide variety of substrates, from simple and complex organic sugars—like hexoses, pentoses, acids, and alcohols—to gaseous substrates, like H2, CO, and CO2, to produce acetic acid as the major product [11,12,13]. Until date, there have been more than 100 acetogens described with different metabolic and phylogenetic traits [14,15,16]. The acetogens are divided into around 22 genera, of which the two genera, Acetobacterium and Clostridium are the most widely studied. Of the array of different acetogens, Moorella thermoacetica, Clostridium ljungdahlii, and Acetobacterium woodii are the three mainly studied acetogens, all of which have high product synthesizing capabilities. These acetogens mainly follow two patterns of growth, heterotrophic-utilizing organic substrates and autotrophic-utilizing gaseous substrates like H2, CO2, and CO, for energy and acetate synthesis [9,17,18,19,20,21]. However, less literature is available on the heterotrophic production of acetic acid by acetogens. Some of the reported studies include batch fermentation studies on M. thermoacetica [22] using different sugar substrates, such as glucose and xylose. These studies showed an initial consumption of xylose, followed by glucose, with a product yield of 0.76 g acetic acid/g xylose and 0.65 g acetic acid/g glucose. Similar research further done by Ehsanipour et al. [23] on the growth of M. thermoacetica on different hydrolyzed lignocellulosic substrates showed a product yield of around 0.71 g acetic acid/g sugarcane straw hydrolysate, and around 0.62 g acetic acid/g wheat straw hydrolysate, with no product inhibition by other components in the lignocellulosic feedstock. However, no literature was available on the heterotrophic growth of any of the other two acetogens, C. ljungdahlii and A. woodii. A. woodii has some obvious advantages for production of acetic acid as it is non-spore-forming, mesophilic, and more-or-less solely produces acetic acid during growth [10,24,25,26]. Detailed studies have been conducted on the autotrophic mode of growth of A. woodii using gaseous substrates like, H2 and CO2 [27,28,29,30,31,32,33]. However, the autotrophic growth of A. woodii suffers from some disadvantages, due to poor microbial biomass growth and low solubility of the gaseous substrates, especially hydrogen gas into the liquid phase, demanding specialized fermentation set-ups [34].
In this study, we explore the heterotrophic mode of growth by A. woodii, where ATP synthesis occurs by substrate level phosphorylation (SLP) of carbohydrates and other organic substrates, which are incompletely oxidized to produce acetate as the major end product. For A. woodii, highest ATP production of 4.3 ATP/mol glucose has been reported [35]. Of the 4.3 ATP molecules generated, 2 moles of ATP are synthesized by SLP during conversion of glucose to acetate, 2 moles of ATP by SLP during conversion of pyruvate to acetate, and 0.3 moles of ATP from a chemo-osmotic mechanism via the Na+-dependent Rnf membrane complex [35]. Therefore, the heterotrophic conversion of substrates to acetate has been found to have an efficiency of 61%, making this process thermodynamically interesting and favorable for producing acetic acid [10,36].
Today, only very limited studies have been done on the heterotrophic growth of A. woodii for production of acetic acid using C6 and C5 sugars, such as glucose and xylose, which can be produced from lignocellulosic feedstocks. Lignocellulosic feedstocks, such as agricultural and forest residues, have been extensively studied for production of second-generation biofuels and biochemicals produced from the carbohydrate fraction of the lignocellulosic materials [37]. However, unlike food crops, lignocellulosic feedstocks contain lignin in addition to carbohydrates, which makes them more recalcitrant [38]. Therefore, a thermochemical treatment and enzymatic hydrolysis of the carbohydrate polymer, to create monomeric subunits of glucose and xylose, needs to be applied upfront before the fermentation [39,40,41,42,43].
In this paper, we study growth and product kinetics of A. woodii on two pure sugar substrates, glucose and xylose, which are the two major sugars present in lignocellulosic feedstocks, and further apply these results to study the production of acetic acid by A. woodii on two different pretreated and enzymatically hydrolyzed lignocellulosic substrates, WSH and CSH. The ultimate aim of this study is to establish a bioprocess for production of acetic acid from sugars present in the lignocellulosic feedstocks.

2. Materials and Methods

2.1. Chemicals

All HPLC-grade reagents and calibration standards used in the experiments were obtained from Fisher Scientific (Pittsburg, PA, USA) and Sigma-Aldrich (St. Lois, MO, USA) respectively. D(+)-glucose (99+%) was procured from Fisher Scientific (Fair Lawn, NJ, USA) and D(+)-xylose (99+%) was procured from Acros Organics (Morris, NJ, USA). Yeast extract was purchased from US Biological (Swampscott, MA, USA). Aqueous sodium hydroxide (50 wt %) was purchased from Sigma-Aldrich. A gas cylinder containing a gaseous mixture of N2/CO2 (80:20) was purchased from Oxarc (Pasco, WA, USA) and was predominantly used for degassing purposes. Anhydrous sodium sulfide was obtained from Alfa Aesar (Ward Hill, MA, USA). All the vitamins required to make the vitamin mixture were ordered from Sigma-Aldrich, Alfa Aesar, Acros Organics, or Fisher Scientific.

2.2. Experimental Design

The experiments were designed to accomplish three main objectives: (i) to study the growth of A. woodii on two major sugars present in lignocellulosic feedstocks, glucose, and xylose as substrates; (ii) to study the effect of different substrate (glucose) concentrations (5–40g/L) on the growth kinetics and acetic acid production by A. woodii; and (iii) to compare with lignocellulosic feedstock substrates (WSH and CSH) for the growth of A. woodii and acetic acid production. The estimated and actual concentrations (measured using HPLC as discussed in Section 2.6.1) of sugars and acetic acid in the pure and lignocellulosic hydrolysates is shown in Table 1.

2.3. Inoculum

A pure strain of Acetobacterium woodii DSM 1030 was obtained from DSMZ (Deutsche Sammlung von Mikroorganismen und Zellkulturen) (Braunschweig, Germany).

2.4. Substrate

Two different lignocellulosic feedstock hydrolysates, WSH and CSH, were used for examining the growth of A. woodii. Both feedstock materials were ground and pretreated at 25% dry matter using a wet explosion pretreatment method, as previously described by Biswas et al. [40]. In this treatment, the samples were exposed to a temperature of 190 °C for 30 min with an oxygen loading of 7.5% (w/w) of dry matter, in a pilot scale pressure vessel [40]. The pretreated slurry obtained after the pretreatment was diluted to 15% dry matter, and hydrolyzed using Novozymes Cellic CTec2 at 3.66 g enzyme per kg dry biomass. The process was performed at 50 °C and pH 5 for 4 days. The hydrolysates after enzymatic treatment were centrifuged at 4000 rpm for 60 min and filtered. These hydrolysates were stored at 4 °C until further use. The WSH contained 58.61 g/L glucose, 35.65 g/L xylose, 5.97 g/L cellulose, 2.55 g/L arabinose, 4.81 g/L acetic acid, and 0.86 g/L lactic acid. The CSH, on the other hand, contained 62.10 g/L glucose, 33.65 g/L xylose, 6.50 g/L cellulose, 5.20 g/L arabinose, 7.60 g/L acetic acid, and 1.03 g/L lactic acid. All batch experiments with pure sugars and lignocellulosic substrates were made in basic anaerobic (BA) medium [39] by adjusting the sugar concentrations to predetermined levels. Sodium sulfide (0.25 g/L) was used as reducing agent, while cysteine was omitted. The serum vials containing the BA medium were supplemented with 0.1% yeast extract and 1 vol % vitamin solution (DSMZ, Media 135, 141).

2.5. Batch Fermentation in Serum Vials

Batch fermentations with A. woodii were performed using 150 mL serum vials. BA medium (50 mL) was added into each of the serum vials, respectively. The vials were then purged with (80:20) N2/CO2 gas mixture for 15–20 min and sealed with rubber stopper (20 mm straight plug stopper, Wheaton, Millville, NJ, USA) and aluminum crimp caps. The vials containing the BA medium were sterilized by autoclaving at 121 °C for 20 min. Vitamin solution (DSMZ Media 141) and sodium sulfide (25 g/L stock solution) solution were each added at 1 vol % into the autoclaved serum vials after sterile filtering. To make different concentrations of glucose (5, 10, 20, 30, and 40 g/L) and xylose (10 g/L), respective stock solutions of sugar substrates were added into the autoclaved serum vials containing sterile medium, using sterile 0.45-micron filters. For the media preparation using lignocellulosic feedstocks, the total glucose concentration in the feedstock hydrolysates was diluted to ~15g/L using BA medium. Fifty milliliters of this mixture was added into the serum vials, purged with (80:20) N2/CO2 gas mixture for 15-20 minutes, and autoclaved. Vitamin solution and sodium sulfide solution were added in the same amount as mentioned above. The pH of the medium in the serum vials was adjusted to 7 ± 0.5 using sterile 5 N NaOH. After completing all the BA medium requirements, the serum vials were equilibrated to the incubation temperature of 30 ± 1 °C, before inoculation with 10% inoculum. The serum vials were incubated at 30 °C in a shaker at 150 rpm after culture inoculation. Samples (1 mL) were collected every 24 h using sterile syringes. The decrease in the pH due to acetic acid formation was adjusted daily to pH 7 ± 0.5 by addition of sterile 5 N NaOH. All procedures involving addition or removal from the serum vials were performed under sterile conditions on a clean bench. Samples collected from serum vials containing pure sugar substrates (glucose and xylose) were used to calculate OD and for HPLC analysis, while the samples collected from serum vials containing lignocellulosic feedstock hydrolysates were only sampled for HPLC analysis.

2.6. Analytical Methods

Samples collected from the serum vials at specific time intervals were used to measure pH for adjusting to optimal conditions, measure OD using a spectrophotometer, and to determine the concentrations of substrate and product formation using HPLC.

2.6.1. Measurement of Substrate Utilization and Product Formation Using HPLC Analysis

The samples collected from the batch serum vials were centrifuged at 10,000 rpm for 10 min, filtered using 0.2 µm filters, diluted, and analyzed using an UltiMate 3000 HPLC system (Dionex, Sunnyvale, CA, USA) equipped with Aminex 87H Column 250 × 4.6 mm (BioRad; Hercules, CA, USA) and a Shodex RI-101 refractive index detector. Dilute sulfuric acid (4 mM) in water was used as an eluent, flowing through the column with a constant flow rate of 0.6 mL/min. The column was maintained at a temperature of 60 °C during the analysis time of 30 mins/sample.

2.6.2. OD Measurement and Cell Dry Weight

Cell growth was monitored by measuring the optical density of the culture at 600 nm after specified time interval, using Jenway 6405 UV/Vis spectrophotometer (Jenway, Staffordshire, UK). The OD units were correlated to the dry weight of microbial biomass. Cell dry weight was obtained by serially diluting the microbial biomass, centrifugation at 8000 rpm for 20 min, and drying the centrifuge tubes at 60 °C overnight in a hot air oven. The difference in the centrifuge tubes containing the microbial biomass before and after drying was used to calculate the cell dry weight per unit wet weight. The correlation factor was then used to converted OD units at 600 nm to mg/L.

2.7. Calculations

Determination of Kinetic Constants

The maximum growth rate constant for five different concentrations of glucose were determined by integrating the following Equation (1):
dX dt = e μ t   [ 44 ]
In this equation, X0 is the initial concentration of cells in mg/L, X is the concentration of cells at time t in mg/L, and µg is the growth rate constant in day−1. This equation was used to plot a graph of ln(X/X0) against time to determine the highest growth rate (µg/day) for every glucose concentration tested. The highest growth rate obtained for each of the different glucose concentrations were used to determine the overall kinetic constants, Ks (g/L), µmax (day−1), using Monod’s growth kinetics (Equation (2)) [44]. This was done to estimate the optimal concentration of glucose ideal for achieving highest growth rate and acetic acid production by A. woodii, where µg is the specific growth rate of the microbe, µmax is the maximum specific growth rate and Ks is the half-velocity constant.
μ g = ( μ max S ) ( K s + S )   [ 44 ]
The effect of substrate inhibition, if any, was studied using Equation (3), where the kinetic constants, Ks, Ki (inhibition constant) (mM), and µmax, were estimated by plotting a graph.
μ g = μ max S ( ( K s + S + ( K i 2 S ) )   [ 44 ]
Yield coefficients for gram of product formed per gram of substrate consumed for different concentrations of glucose and lignocellulosic feedstock sugars, WSH and CSH, were calculated using Equation (4), where P0 and S0 are the initial product and substrate concentrations in g/L, while P and S are the product and substrate concentrations at time t in g/L.
Y P / S = ( P P 0 ) ( S 0 S )   [ 44 ]

3. Results

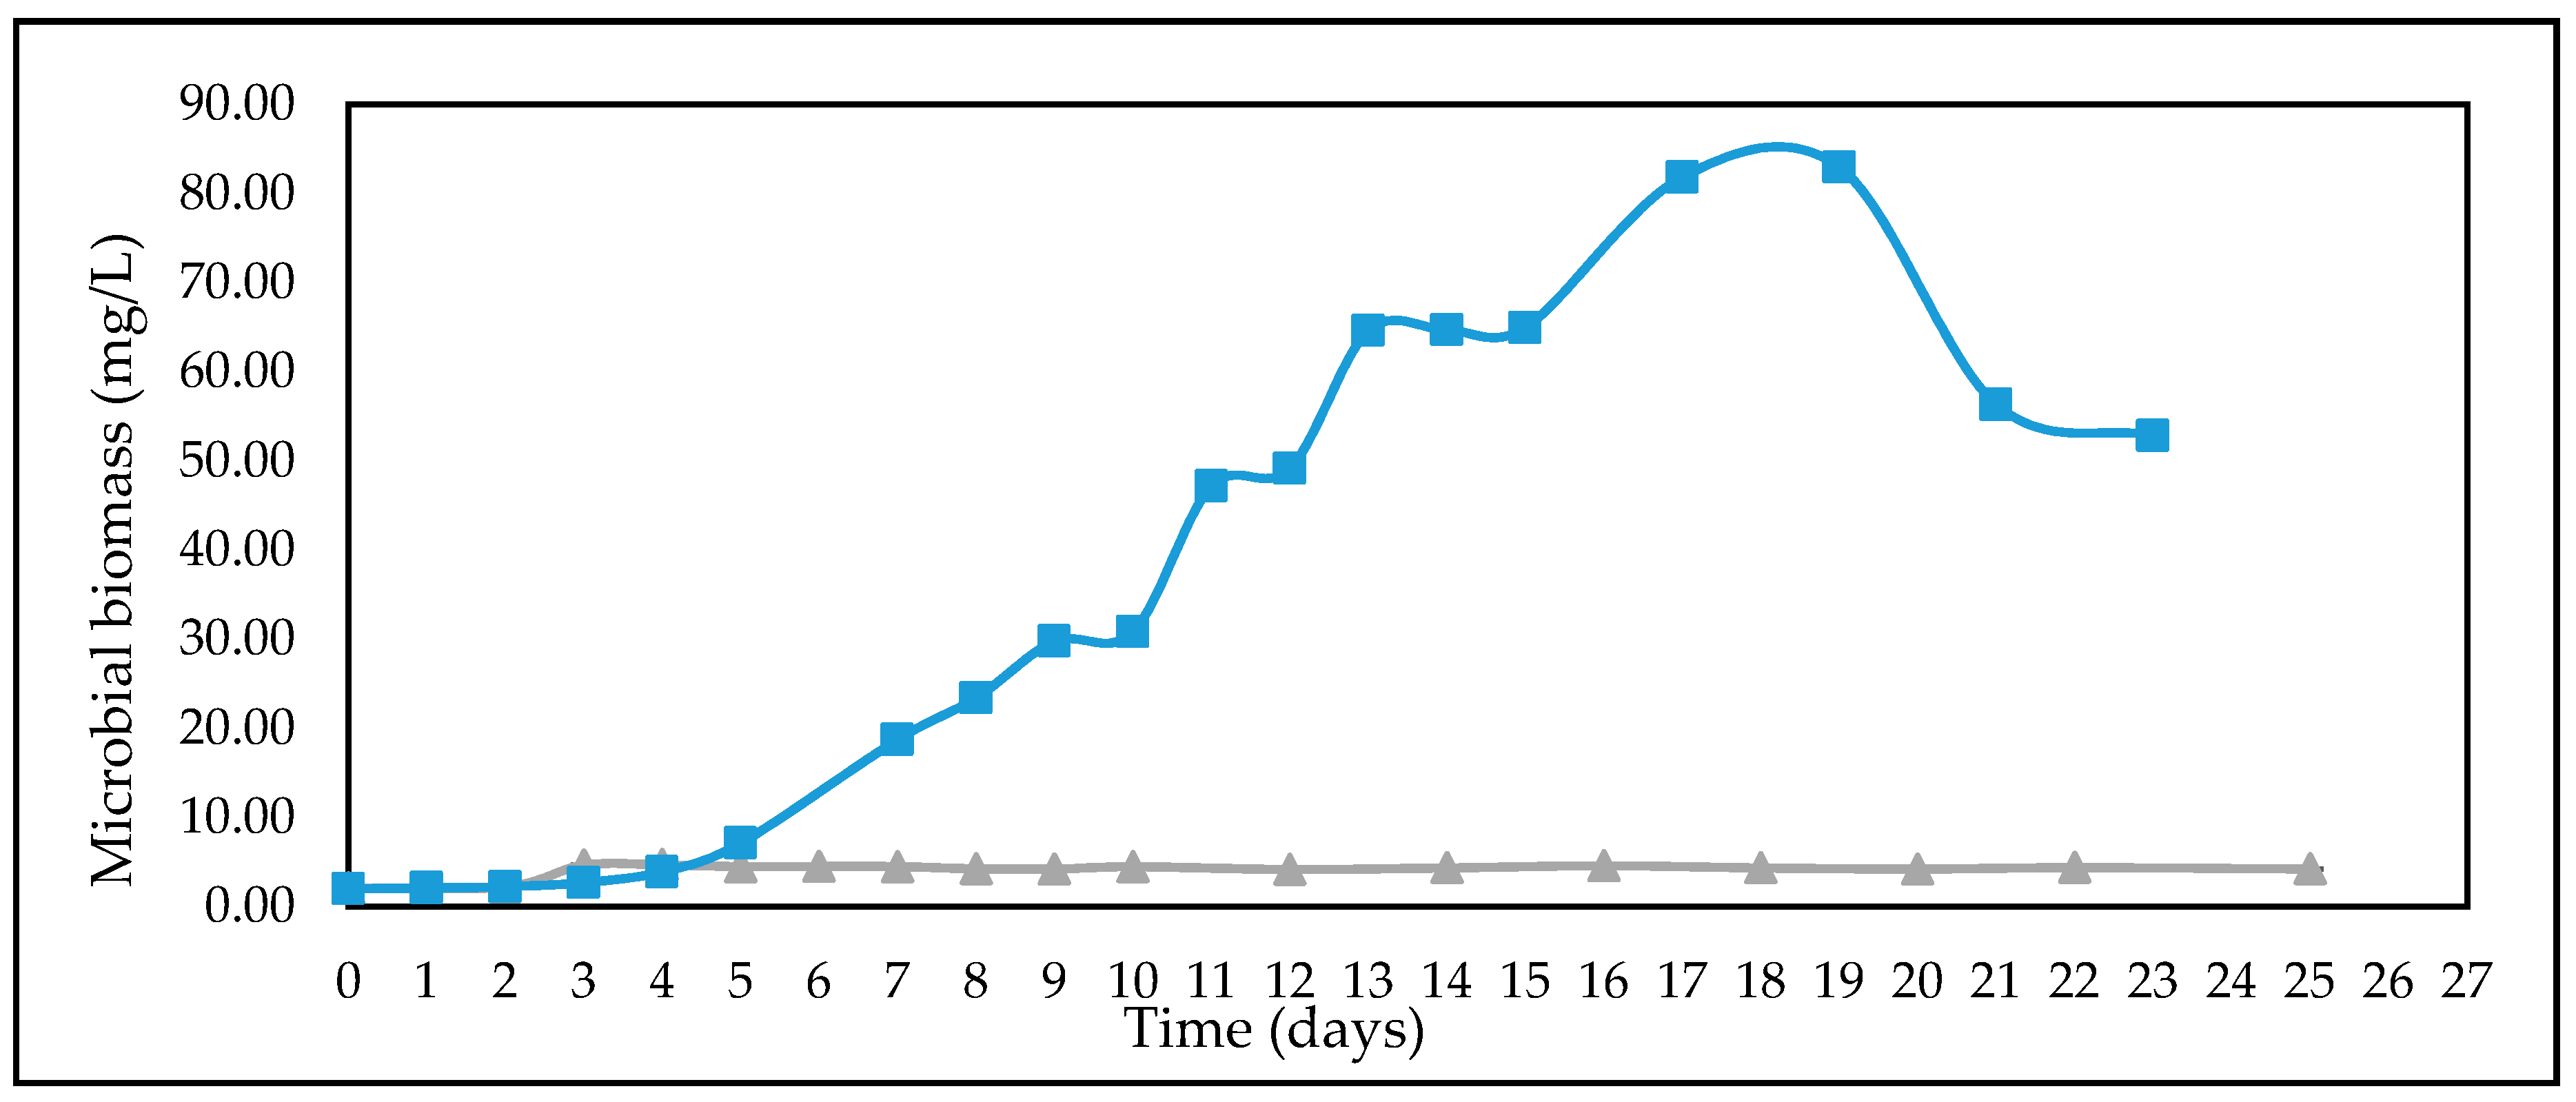
3.1. Growth of A. woodii on C6 (glucose) and C5 (xylose) Sugars

Growth studies of A. woodii on two different sugars, glucose and xylose, respectively, is shown in Figure 1. Microbial biomass growth of 82.95 mg/L was obtained when 10 g/L glucose was used as substrate, while growth on 10 g/L xylose was negligible. The initial increase in the cell growth and acetic acid, when using xylose as substrate, was due to the presence of traces of glucose in the inoculum added to the serum vials, as seen from the control without substrates. The microbe was further studied with different concentrations of glucose ranging from 5 to 40 g/L, to find the optimal glucose concentration for achieving maximum growth and product synthesis.

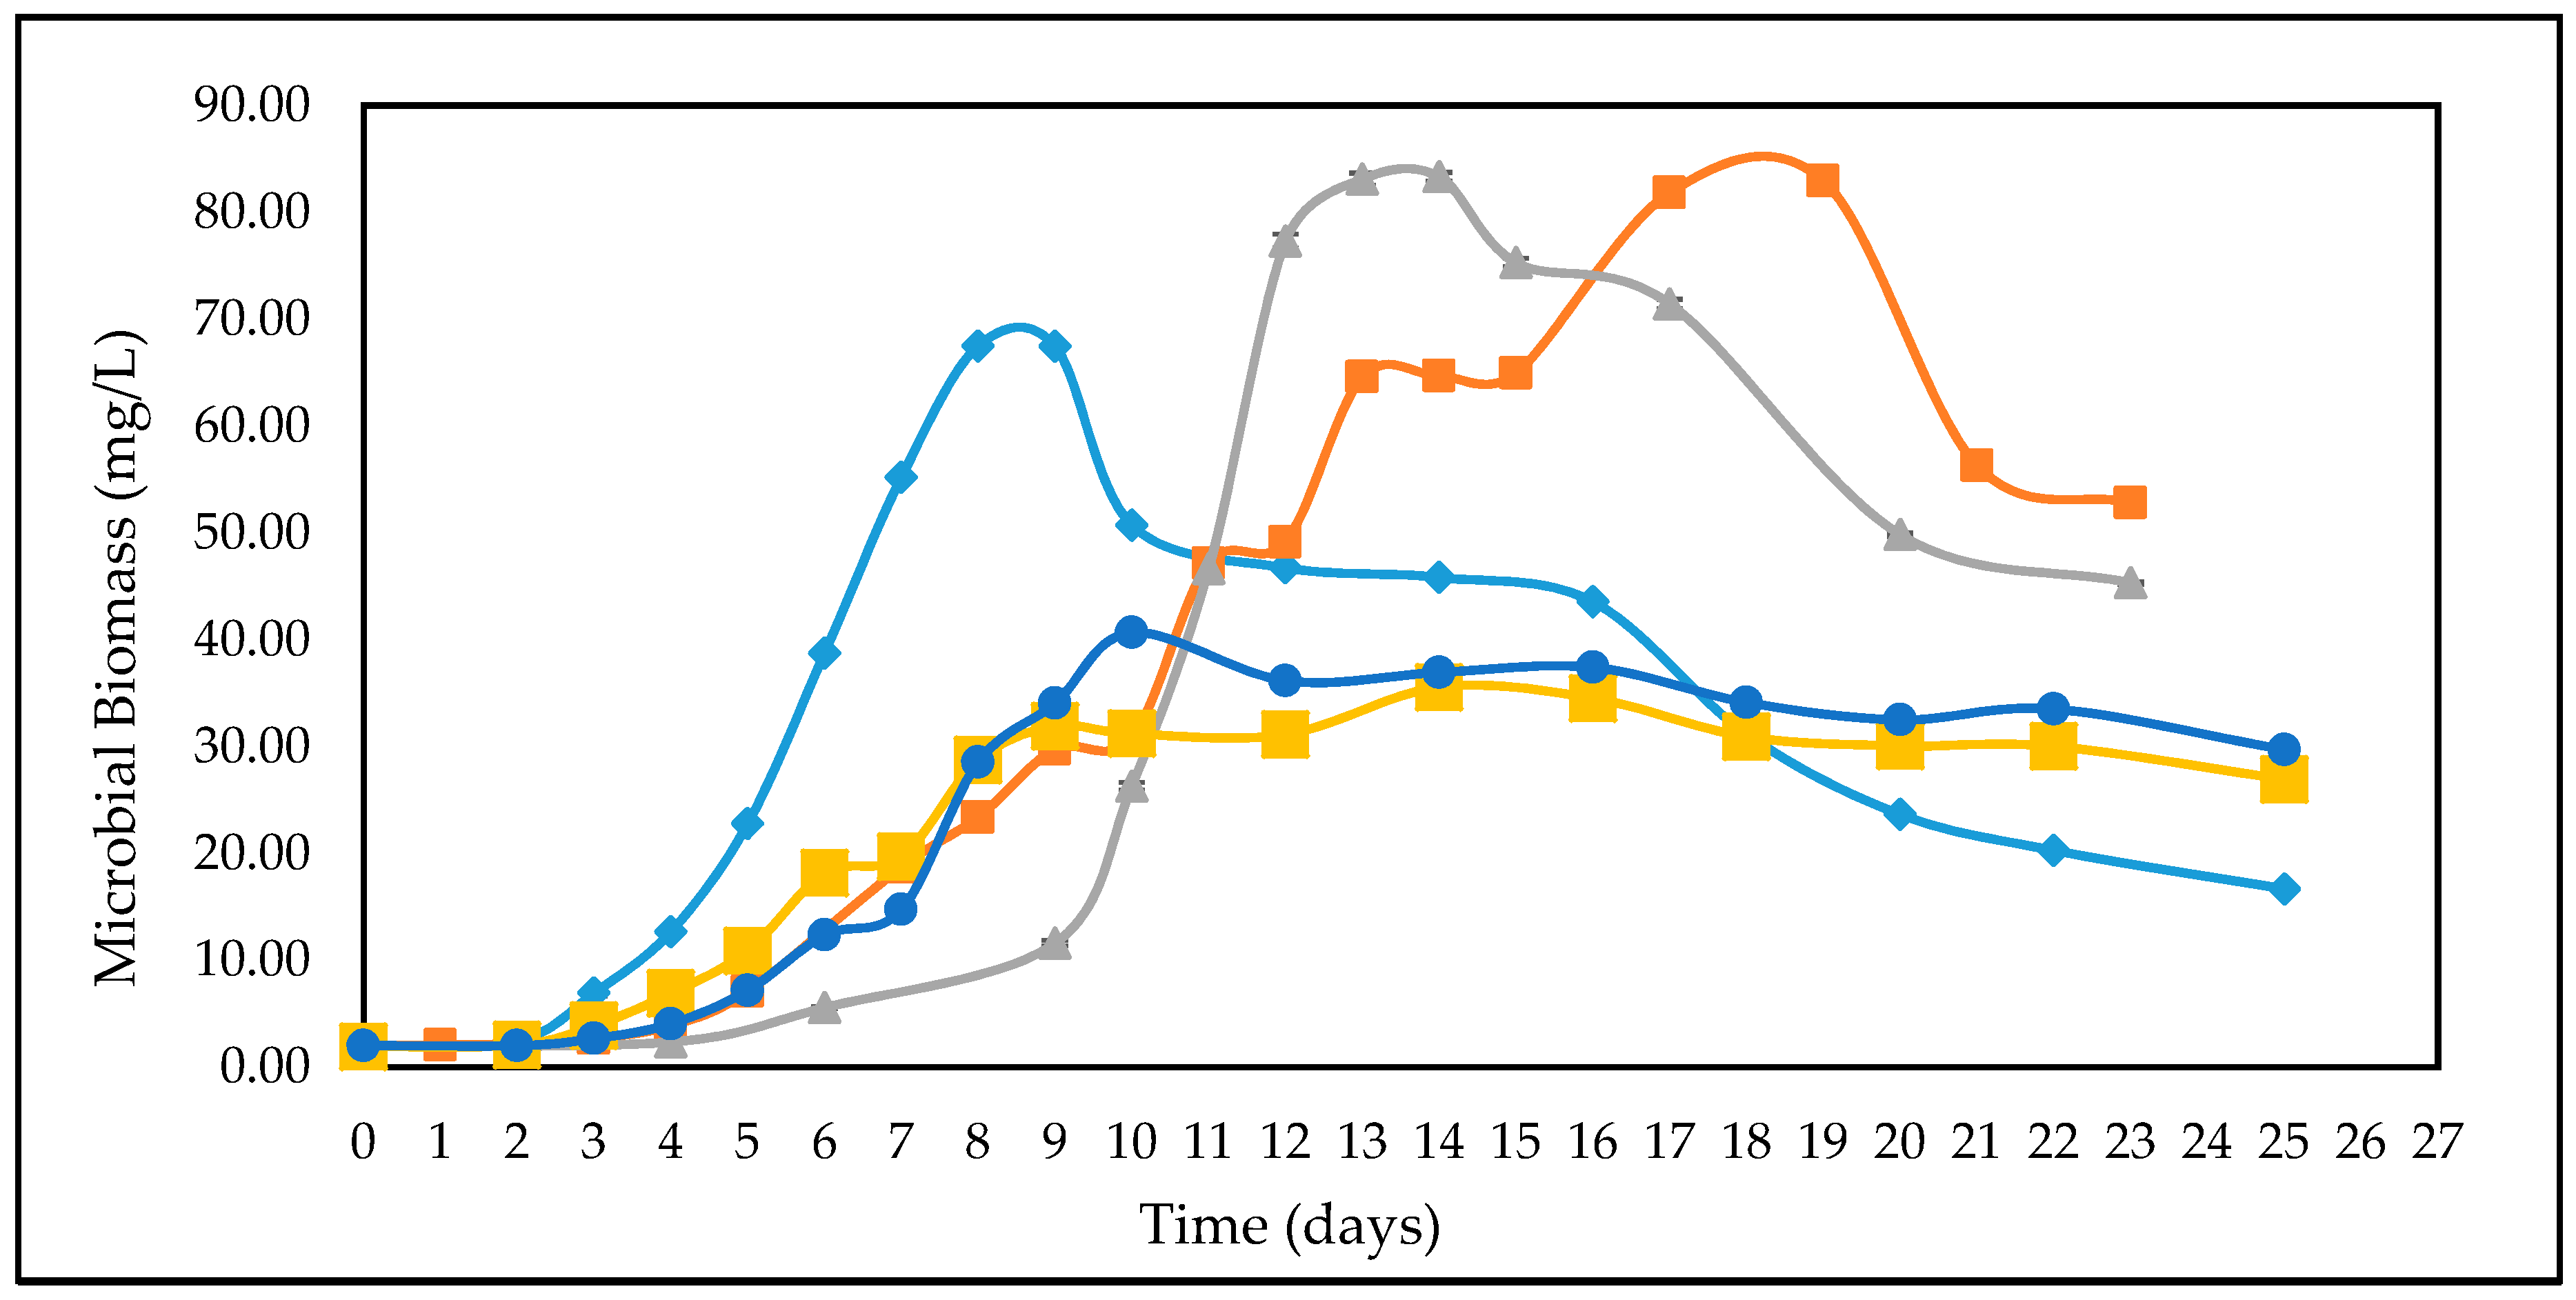
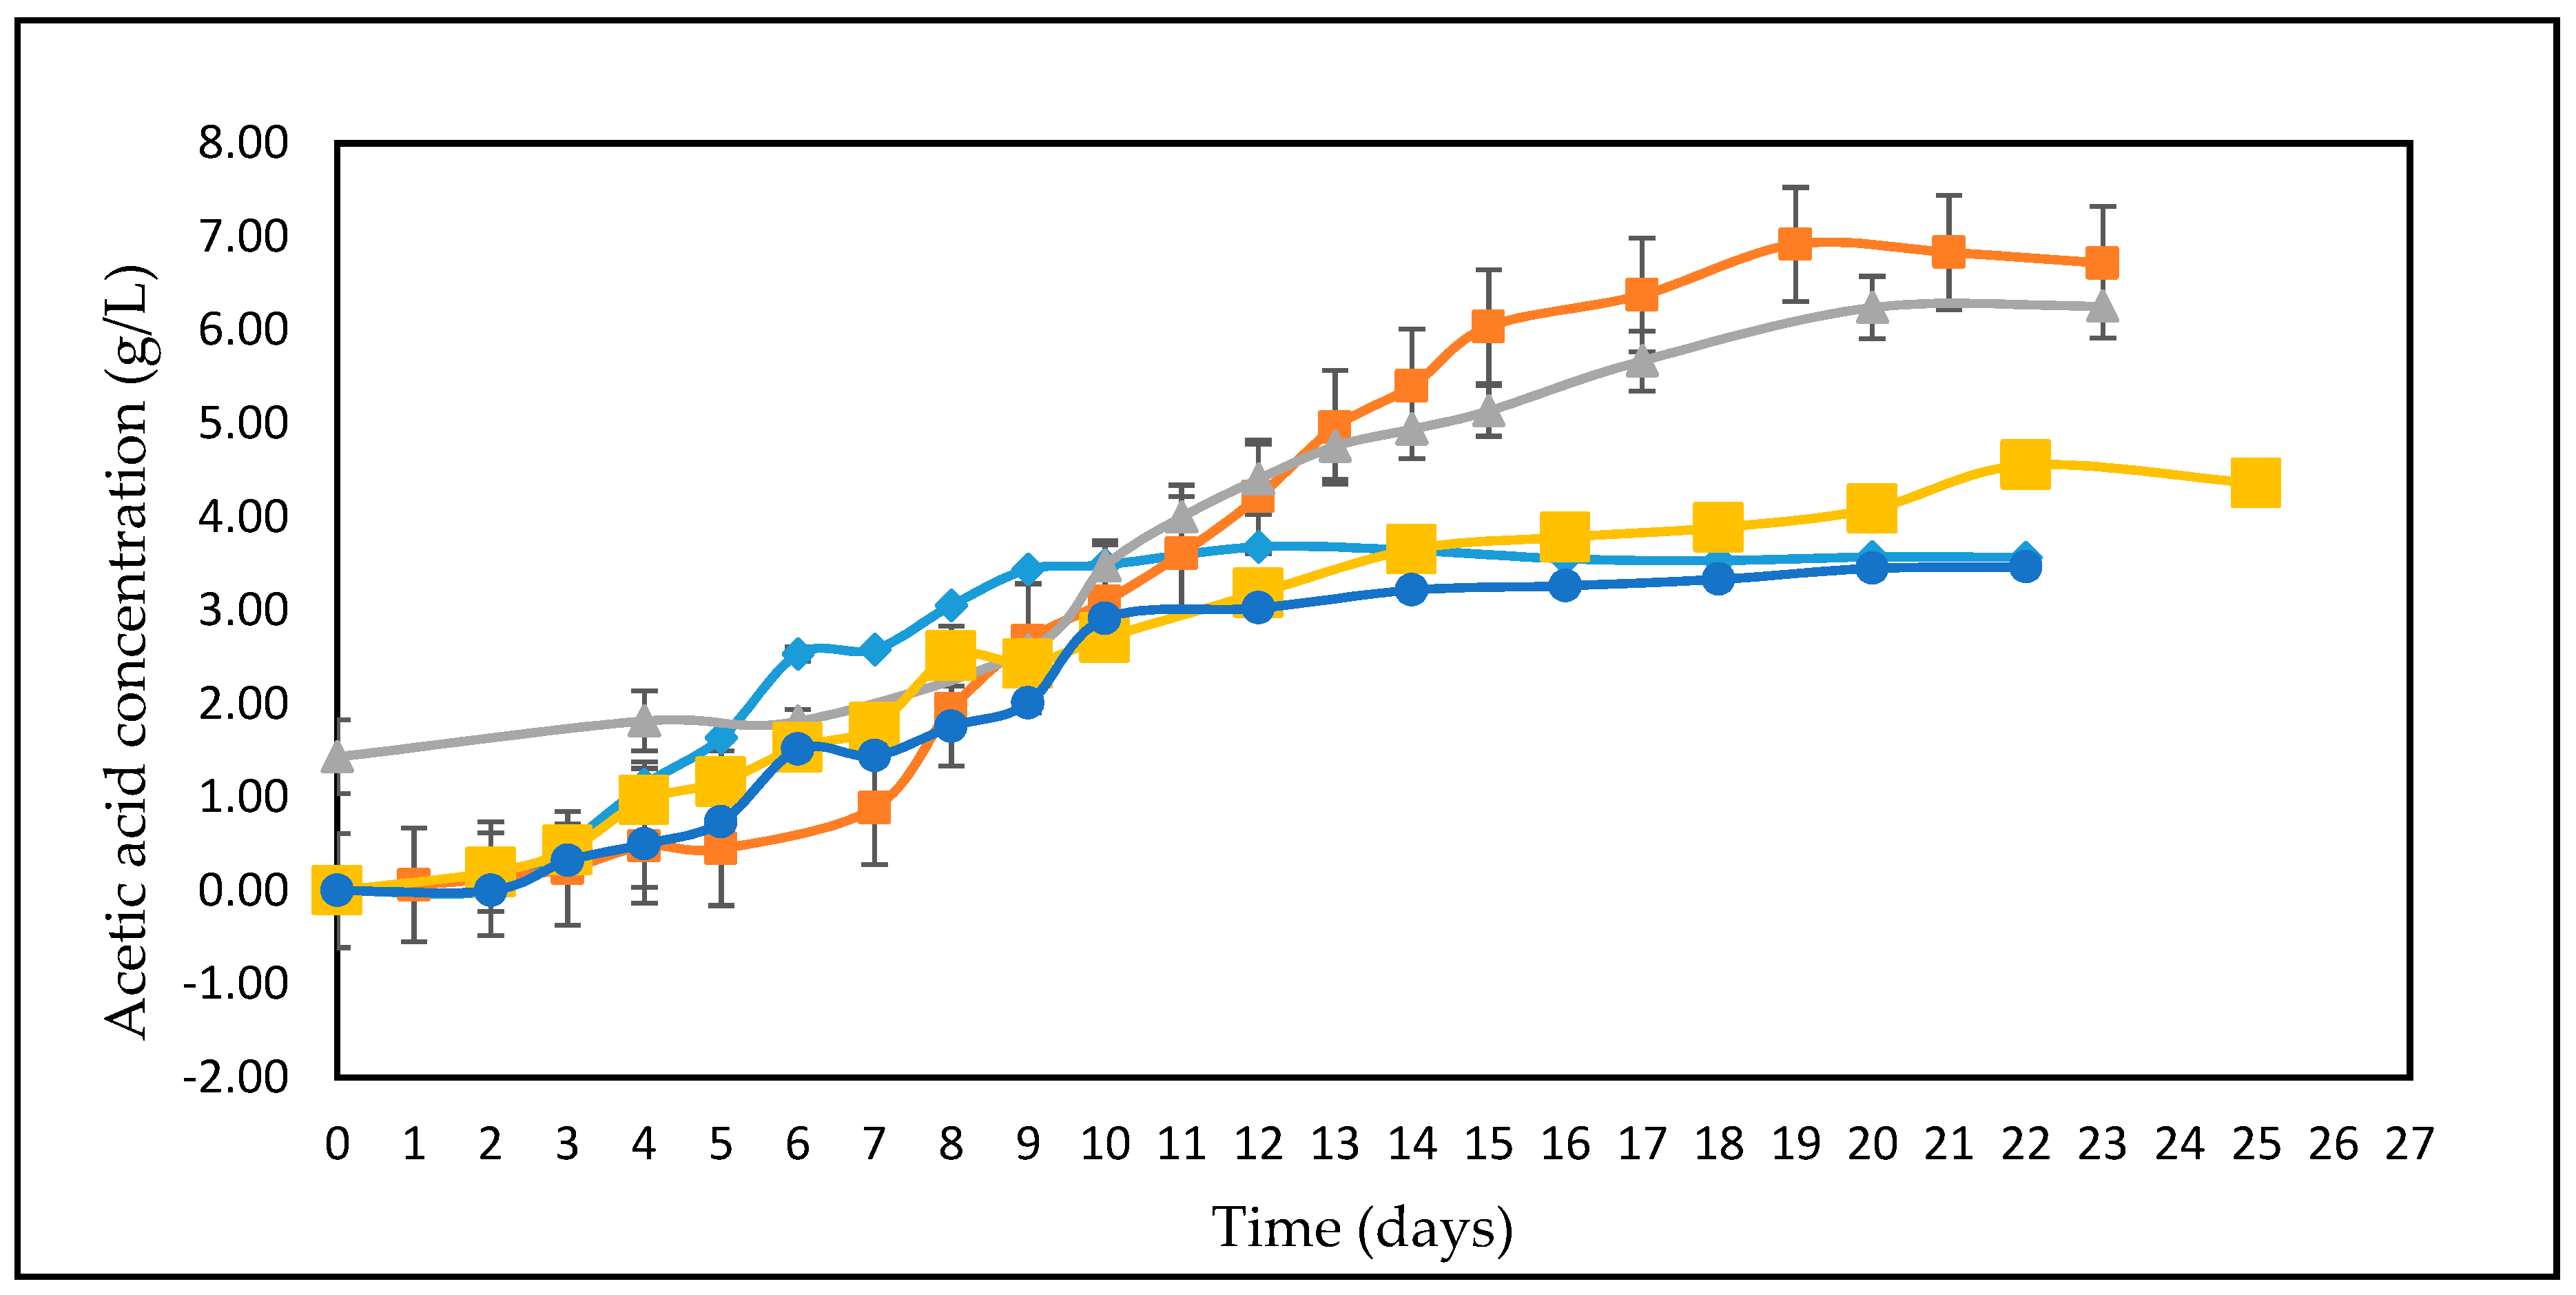
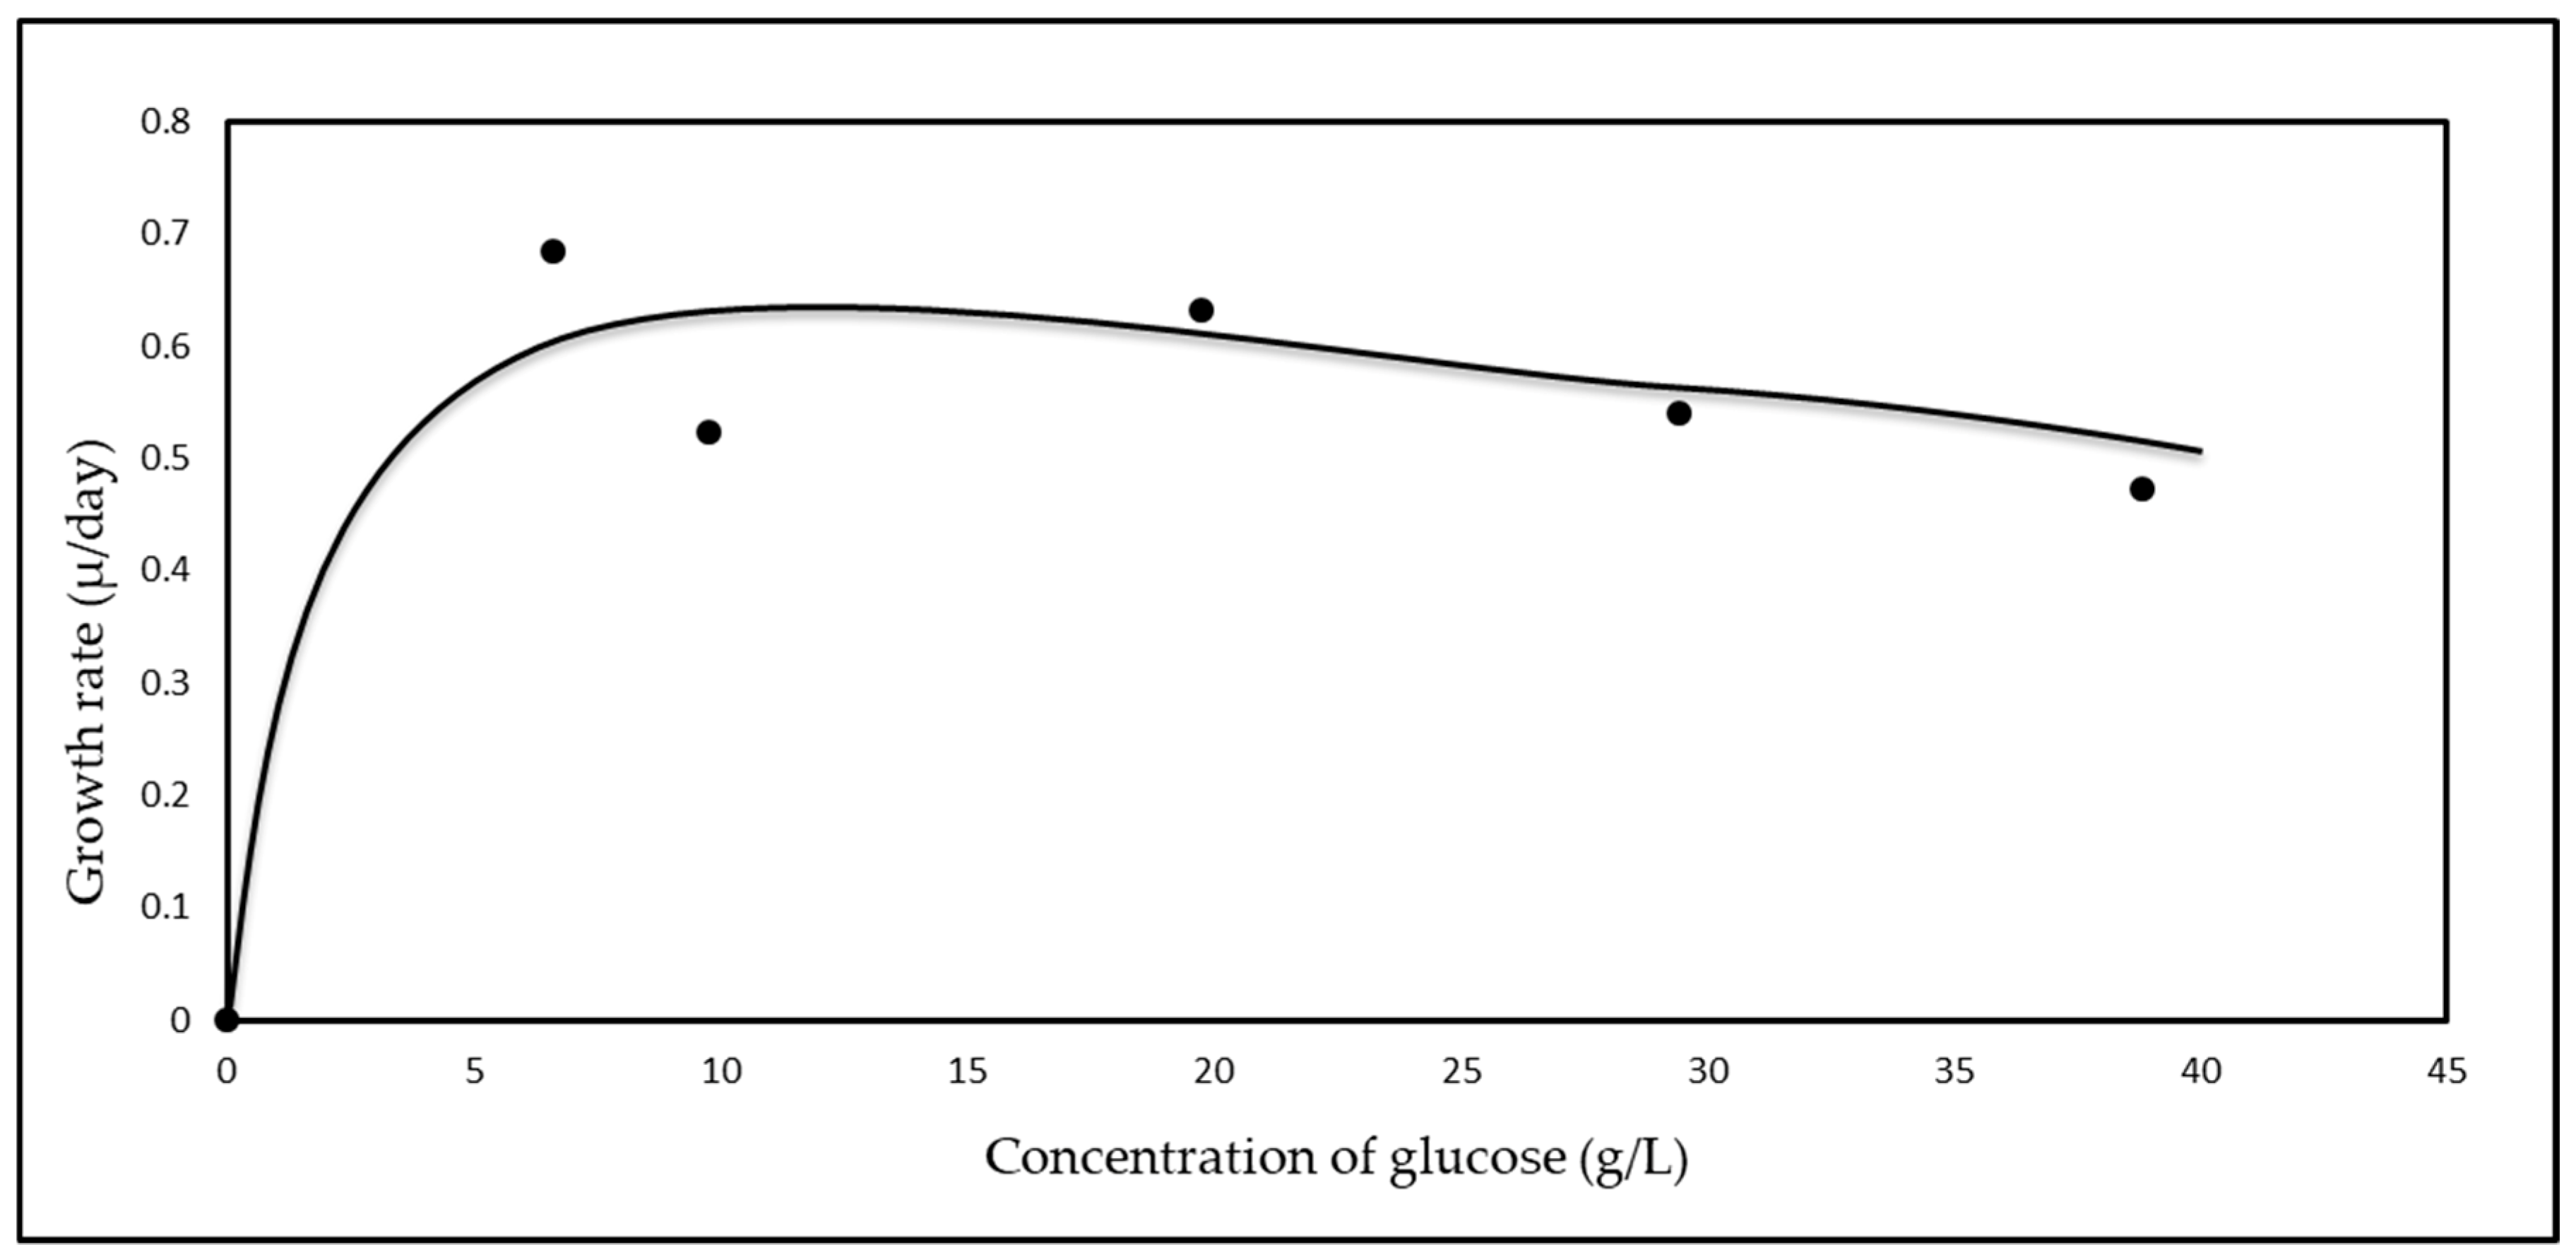
3.2. Effect of Different Glucose Concentrations on the Kinetics of A. woodii

Figure 2 shows the growth of A. woodii on five different increasing concentrations of glucose, i.e., from 5 to 40 g/L glucose. As seen from Figure 2, the biomass concentration (mg/L) increases from 5 to 10 g/L glucose, followed by a gradual decrease in the cell concentration. A concentration of 10 g/L glucose was found to be the optimal concentration yielding highest microbial biomass, while higher concentrations of glucose were found to result in lower microbial growth. Simultaneous studies on the effect of different glucose concentrations on the production of acetic acid (Figure 3) by A. woodii showed similar results. It can be seen in Figure 3, there was an increase in acetic acid produced from 5 to 10 g/L glucose, with the highest acetic acid production of 6.92 g/L and microbial biomass of 82.95 mg/L for 10 g/L glucose, followed by a gradual decrease in the acetic acid produced with an increase in glucose concentrations from 20 to 40 g/L.

3.3. Monod Growth Kinetics

Figure 4 represents the Monod kinetics for the growth of A. woodii on various concentrations of glucose as substrate. Maximum growth rates (µg) during exponential growth were calculated using Equation (1) and have been shown in Table 2 [32]. Equations (2) and (3) were further used to determine the kinetic constants where the maximum growth rates at different concentrations of glucose were plotted against respective glucose concentrations. The maximum growth rate (µmax) was found to be 0.64 day−1 with a Ks value of 1.1 g/L concentration and an inhibition constant Ki of 123 mM (22.25 g/L). It can be observed, from Figure 4, that substrate inhibition occurs with an increase in the concentration of glucose above 20 g/L (111 mM). This is further confirmed by an increase in the value of (S2/Ki) from Equation (3), which increases with concentrations of glucose above 10g/L.

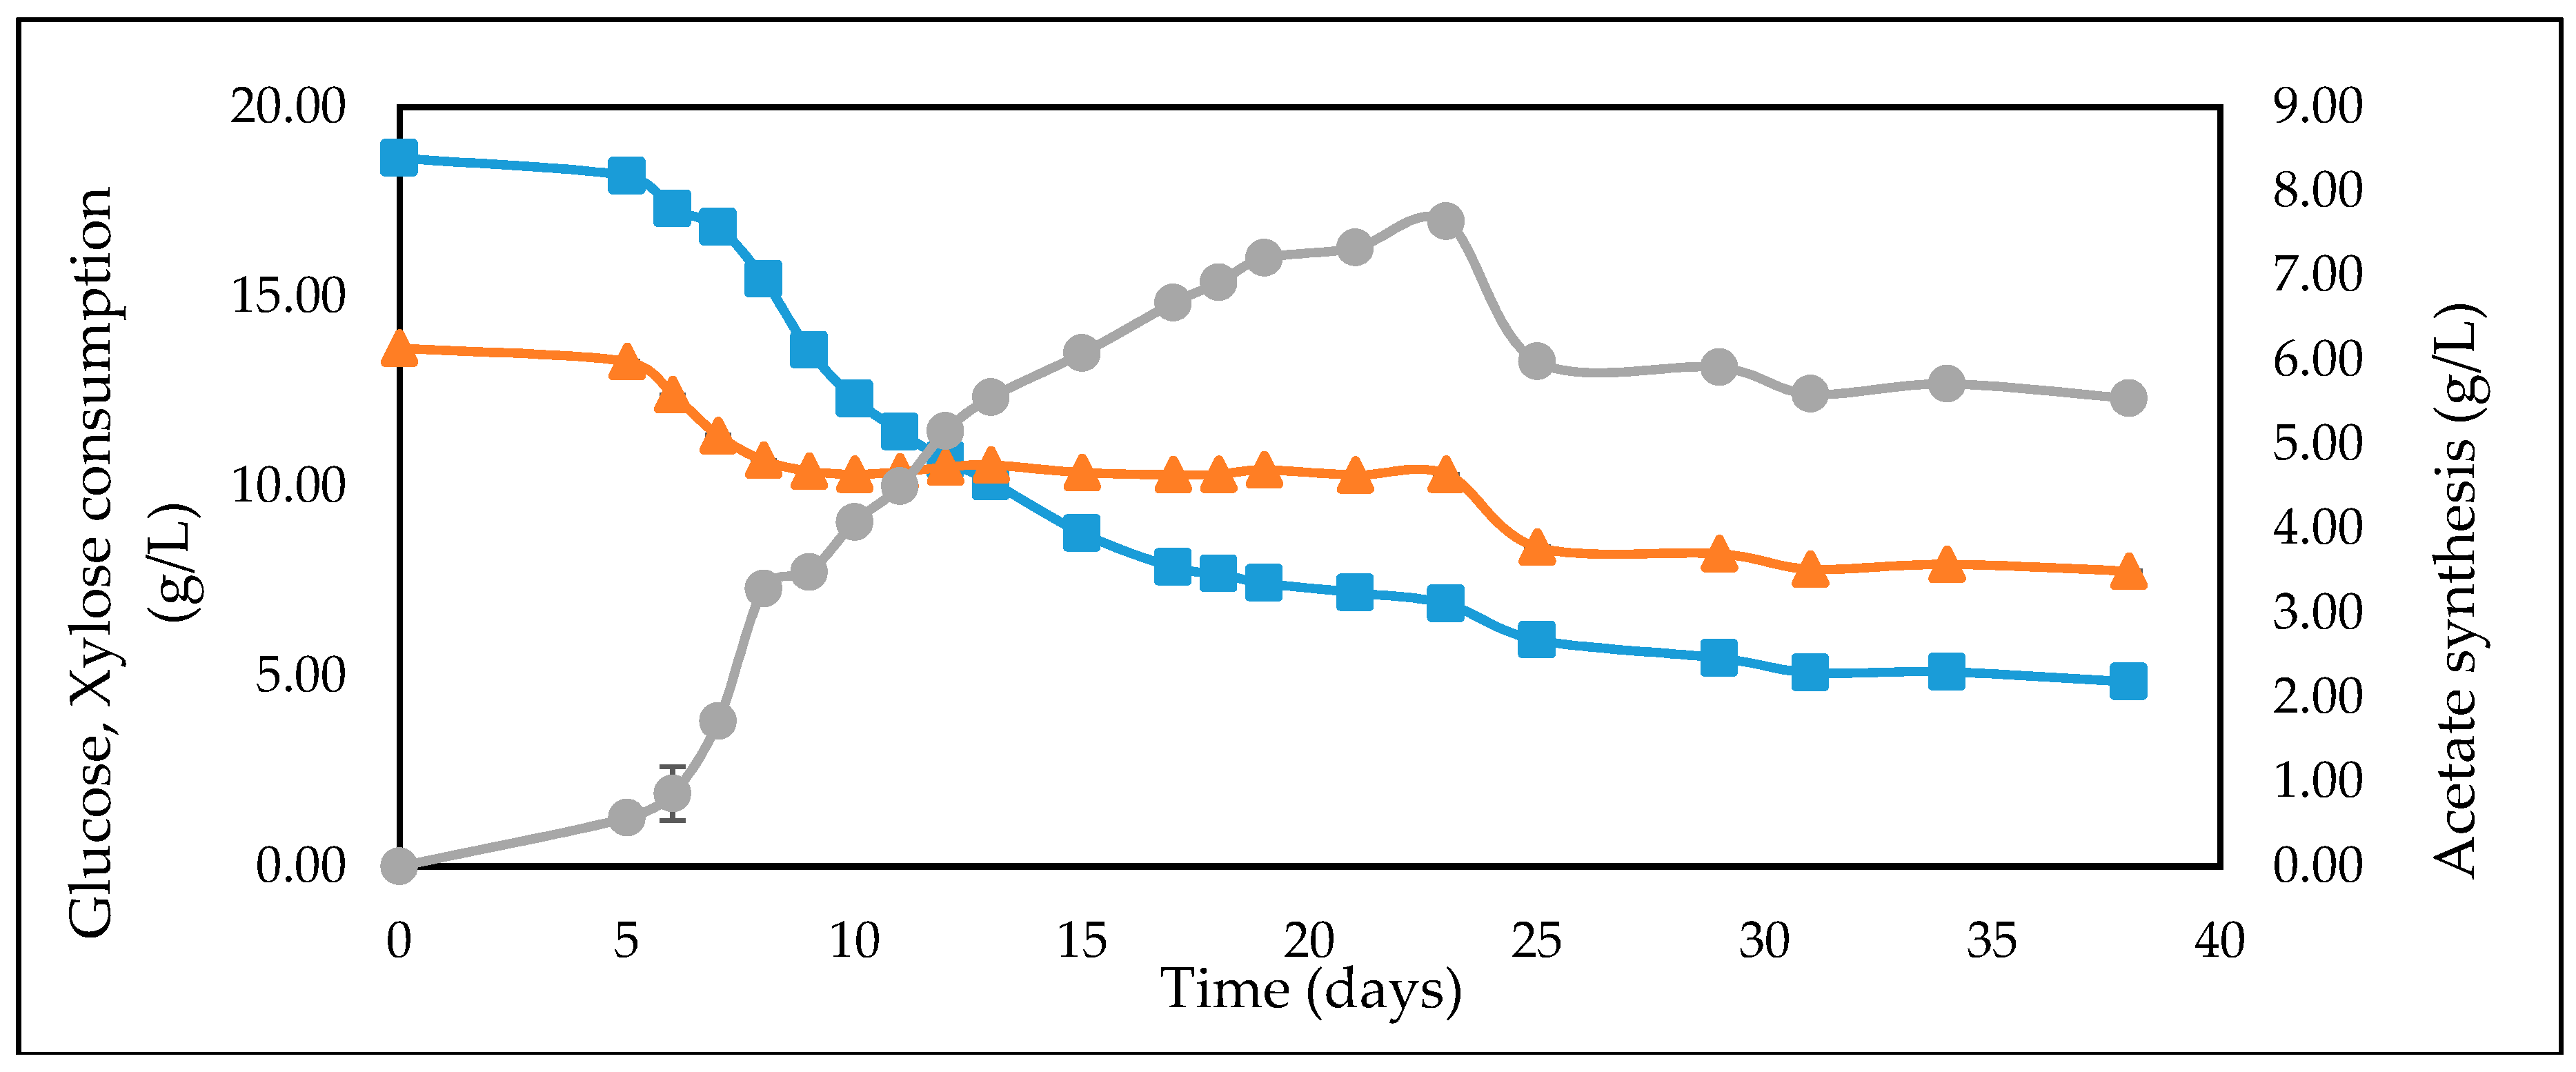
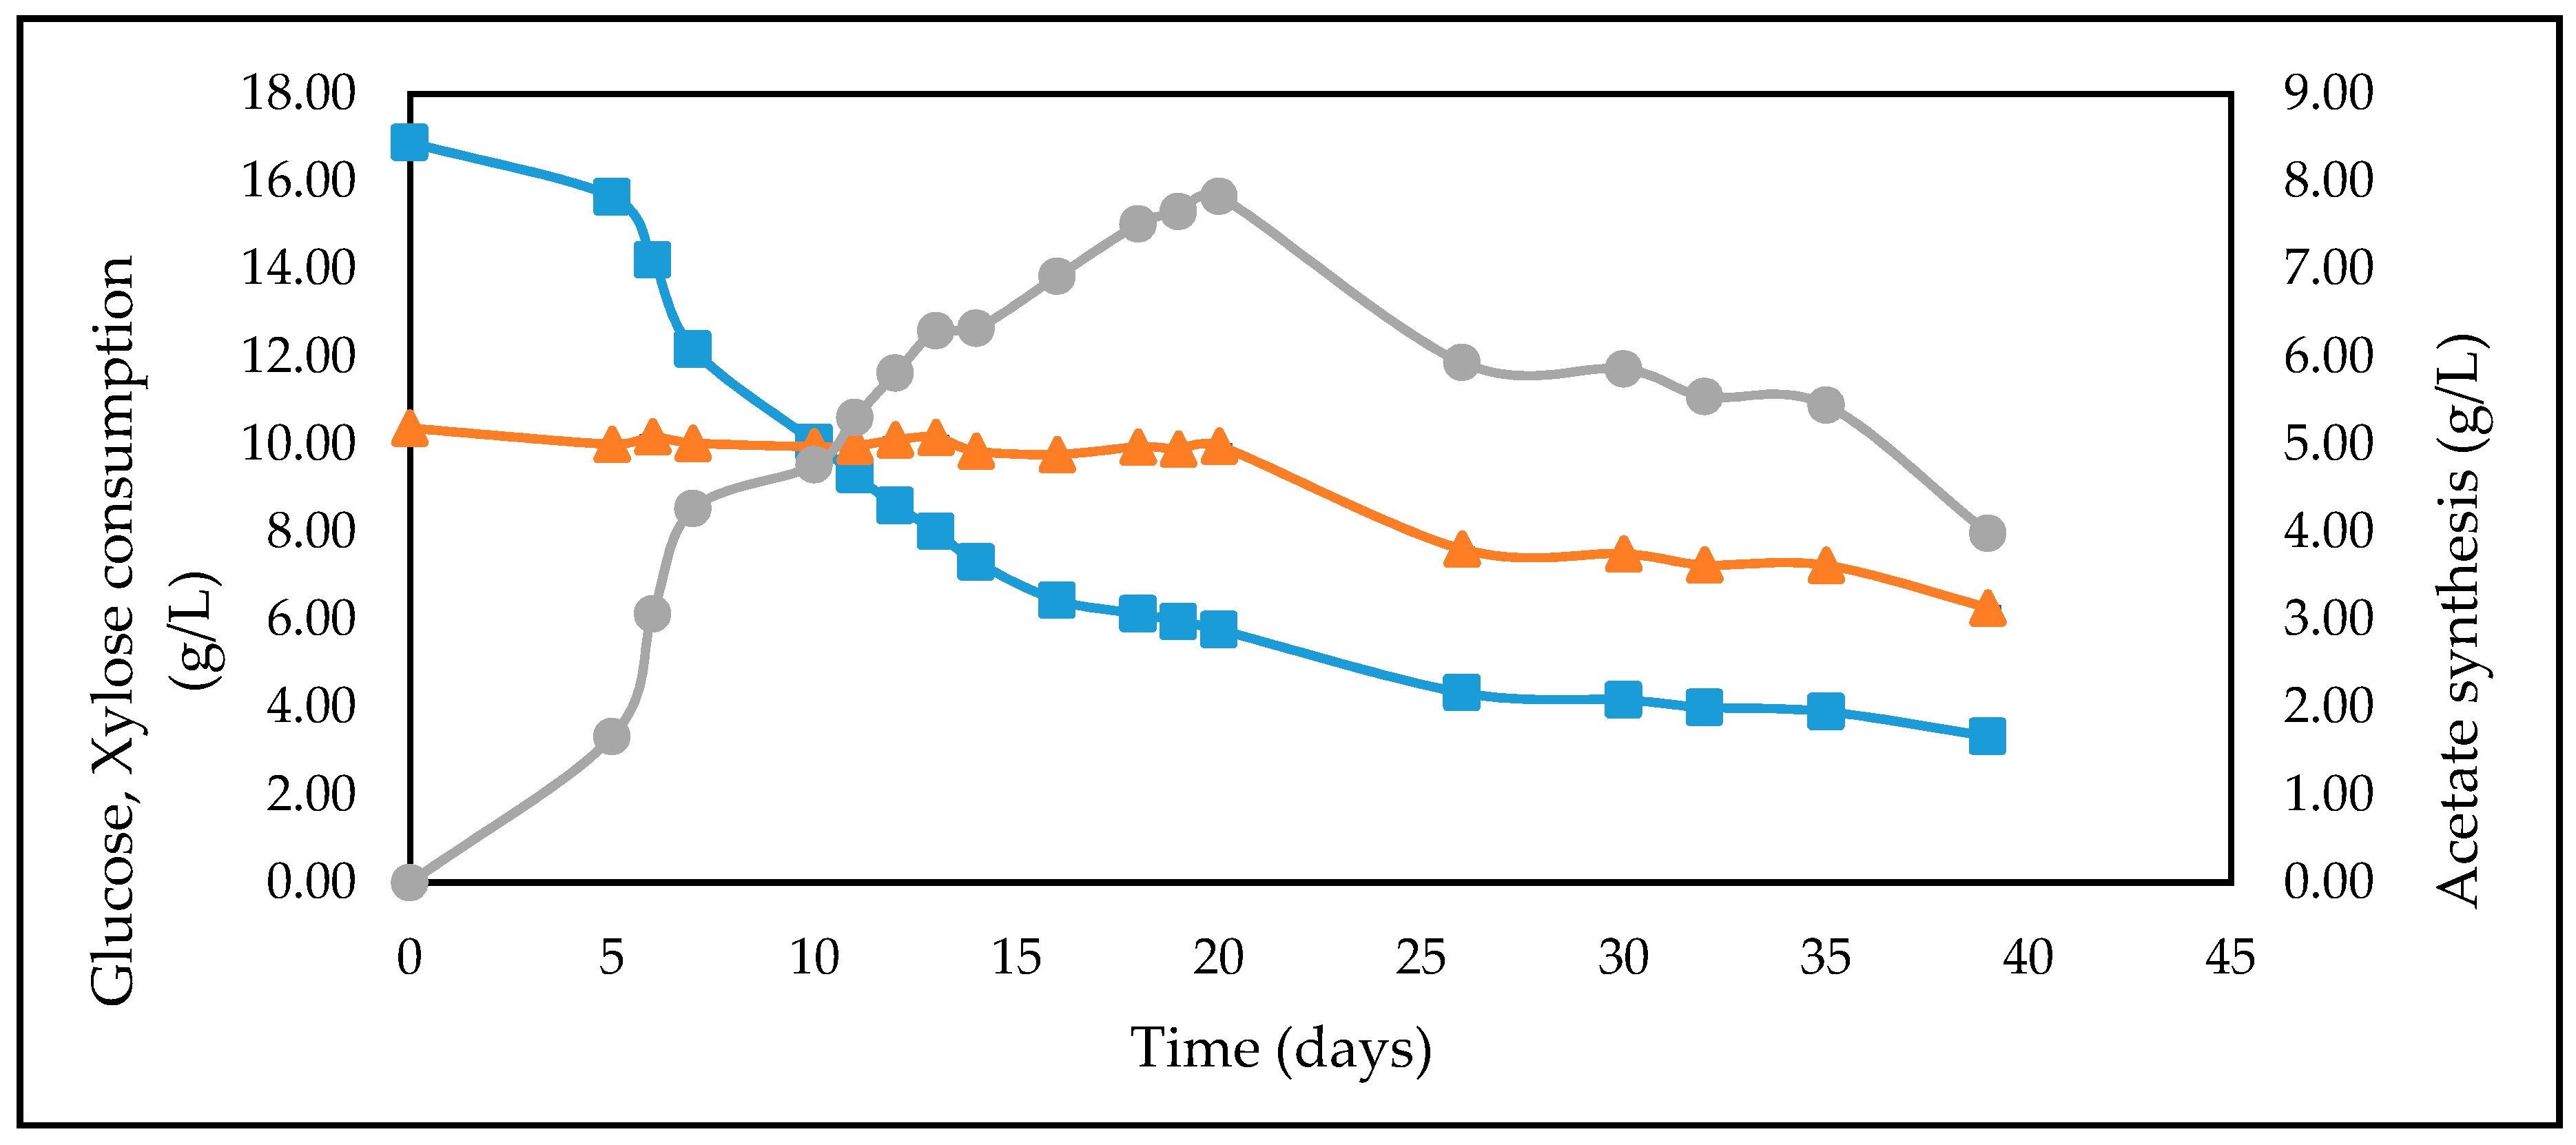
3.4. Studies on Lignocellulosic Feedstock Hydrolysates

The results from the batch experiments performed on different concentrations of glucose were used to determine the ideal glucose concentration for the lignocellulosic feedstock sugars. Both the hydrolysates were diluted to a total glucose concentration between 15 and 20 g/L. After a lag phase of 5 days, an increase in the glucose uptake and acetate production was observed for both the lignocellulosic sugar substrates, which is shown in Figure 5 and Figure 6. Acetic acid production of 7.64 g/L was observed on WSH, and 7.83 g/L was found on CSH. No significant uptake of xylose present in WSH and CSH by A. woodii was observed.

3.5. Calculation of Yield Coefficients

Yield coefficients were calculated using Equation (4). From Table 3, it can be seen that acetic acid production increases from 5 to 10 g/L glucose, after which there is a gradual decrease in the yield with an increase in the concentration of glucose from 20 to 40 g/L. The decrease in the acetic acid production for concentrations at and above 20 g/L might be because the higher concentration of substrate becomes inhibitory to the microbes. The results obtained from the experiments on pure glucose as substrate were used to determine the optimal concentration of glucose in the lignocellulosic substrates, and the amount of hydrolysates was adjusted to have a glucose concentration between 15 and 20 g/L in the final medium, i.e., ~18 g/L WSH and ~16 g/L CSH. A comparable product yield constant, Yp/s, of 0.70 g acetate/g glucose was obtained for WSH and 0.65g acetate/g glucose for CSH, similar to pure substrate of 10 g/L glucose concentration.

4. Discussions

Our studies discuss the potential of A. woodii for producing acetic acid from lignocellulosic feedstocks as substrates. To ensure that the experiments were performed using the right concentrations of substrates, the growth of A. woodii was first checked on pure sugars found in lignocellulosic biomass, i.e., glucose and xylose, to determine the growth kinetics and ideal concentration of sugars suitable for optimal product formation. We found that xylose was not an ideal substrate for growth and energy for A. woodii, in contrast to other studies done with homoacetogens such as M. thermoacetica. It was found that A. woodii showed the highest growth and acetate production at 10 g/L glucose, while glucose concentrations from 20 to 40 g/L were found to have lower yields, indicating an inhibitory effect on the microbe at high substrate concentrations, affecting the product yield. Therefore, when A. woodii was tested on actual lignocellulosic feedstock hydrolysates for its glucose conversion, the growth medium was adjusted to have a concentration between 15 and 20 g/L glucose. Interestingly, we found that growth under these conditions was similar to growth and acetic acid production on pure substrates. Overall, we can conclude that the maximum cell growth of A. woodii is found at a relatively low concentration of glucose (less than 20 g/L). One of the reasons for the substrate inhibition at higher sugar concentrations can be the fact that A. woodii in nature is mainly found in oligotrophic areas deficient in nutrients and, therefore, the strain might not be adapted to high concentrations of nutrients [38,39]. The higher acetic acid production in autotrophic mode, compared to heterotrophic mode, can be attributed to the production of 4.3 moles of ATP by A. woodii when growing heterotrophically, compared to 1.3 moles of ATP in the case of autotrophic growth. Therefore, deficiency of ATP molecules in autotrophic mode of growth might lead to higher rates of conversion when grown on gaseous substrates leading to higher production of acetic acid compared to the conditions during heterotrophic growth.
The results presented in this paper indicate a yield of 0.70 g acetate/g glucose from WSH and 0.65 g acetate/g glucose on CSH by A. woodii. This is comparable to the product yields reported by studies conducted using M. thermoacetica on lignocellulosic sugars under thermophilic conditions. Since A. woodii is a mesophilic, non-spore-forming homoacetogen, unlike M. thermoacetica, using this strain might be more cost effective and advantageous.

Author Contributions

Conceptualization, S.C.K. and B.K.A.; Data curation, S.C.K.; Formal analysis, K.S.; Funding acquisition, B.K.A.; Investigation, B.K.A.; Methodology, S.C.K.; Project administration, B.K.A.; Supervision, B.K.A.; Validation, K.S. and B.K.A.; Visualization, S.C.K.; Writing–original draft, S.C.K.; Writing–review & editing, K.S. and B.K.A.

Funding

This study was funded by a research grant to Ahring from the Danish FORSKEL program.

Conflicts of Interest

The authors declare no conflict of interest.

References

  1. Micromarket Monitor. North America Acetic Acid Market by Application (Vinyl Acetate Monomer (VAM), Purified Terephthalic Acid (PTA), Acetic Anhydride, Ester Solvents & Others) & by Country–Trends & Forecasts to 2019. Report Code AC 1086. 2015. Available online: http://www.micromarketmonitor.com/market/north-america-acetic-acid-9541396535.html?utm_source=NL-NAAAM&utm_medium=NL-NAAAM&utm_campaign=NL-NAAAM (accessed on 25 May 2015).
  2. Renewable Chemicals Market–Alcohols (Ethanol, Methanol), Biopolymers (Starch Blends, Regenerated Cellulose, PBS, bio-PET, PLA, PHA, bio-PE, and Others), Platform Chemicals & Others-Global Trends & Forecast to 2020. Report Code CH 2063. 2015. Available online: http://www.marketsandmarkets.com/Market-Reports/renewable-chemical-274.html (accessed on 1 October 2015).
  3. Christodoulou, X.; Velasquez-orta, S.B. Microbial electrosynthesis and anaerobic fermentation: An economic Evaluation for Acetic Acid Production from CO2 and CO. Environ. Sci. Technol. 2016, 50, 11234–11242. [Google Scholar] [CrossRef] [PubMed]
  4. Sustainable Development Goals. Global Chemicals Outlook—Towards Sound Management of Chemicals. 2013. Available online: https://sustainabledevelopment.un.org/index.php?page=view&type=400&nr=1966&menu=35 (accessed on 14 June 2018).
  5. Raj, P.T. Plant Design for Manufacturing Acetic Acid; Bachelor Project Report; Jawaharlal Nehru Technological University: Kakinada, India, 2014. [Google Scholar]
  6. Gullo, M.; Verzelloni, E.; Canonico, M. Aerobic submerged fermentation by acetic acid bacteria for vinegar production: Process and biotechnological aspects. Process Biochem. 2014, 49, 1571–1579. [Google Scholar] [CrossRef] [Green Version]
  7. Liew, F.M.; Kӧpke, M.; Simpson, S.D. Gas Fermentation for Commercial Biofuels Production Liquid. In Gaseous and Solid Biofuels-Conversion Techniques; Licensee InTech: London, UK, 2013; Chapter 5; pp. 125–173. [Google Scholar]
  8. Müller, V. Energy conservation in acetogenic bacteria. Appl. Environ. Microbiol. 2003, 69, 6345–6353. [Google Scholar] [CrossRef] [PubMed]
  9. Schiel-bengelsdorf, B.; Dürre, P. Pathway engineering and synthetic biology using acetogens. FEBS Lett. 2012, 586, 2191–2198. [Google Scholar] [CrossRef] [PubMed] [Green Version]
  10. Schuchmann, K.; Müller, V. Energetics and application of heterotrophy in acetogenic bacteria. Appl. Environ. Microbiol. 2016, 82, 4056–4069. [Google Scholar] [CrossRef] [PubMed]
  11. Ragsdale, S.W. The eastern and the western branch of the Wood/Ljungdahl pathway: How the east and west were won. Biofactors 1997, 6, 3–11. [Google Scholar] [CrossRef] [PubMed]
  12. Ragsdale, S.W. Enzymology of the acetyl-CoA pathway of autotrophic CO2 fixation. CRC Crit. Rev. Biochem. Mol. Biol. 1991, 26, 261–300. [Google Scholar] [CrossRef] [PubMed]
  13. Schuchmann, K.; Müller, V. Autotrophy at the thermodynamic limit of life: A model for energy conservation in acetogenic bacteria. Nat. Rev. Microbiol. 2014, 12, 809–821. [Google Scholar] [CrossRef] [PubMed]
  14. Fuchs, G. CO2 fixation in acetogenic bacteria: Variations on a theme. FEMS Microbiol. Rev. 1986, 39, 181–213. [Google Scholar] [CrossRef]
  15. Hugenholtz, J.; Ljungdahl, L.G. Metabolism and energy generation in homoacetogenic clostridia. FEMS Microbiol. Rev. 1990, 87, 383–389. [Google Scholar] [CrossRef]
  16. Ljungdahl, L.G. The autotrophic pathway of acetate synthesis in acetogenic bacteria. Ann. Rev. Microbiol. 1986, 40, 415–450. [Google Scholar] [CrossRef] [PubMed]
  17. Drake, H.L.; Gӧßner, A.S.; Daniel, S. Old Acetogens, New Light. Ann. N.Y. Acad. Sci. 2008, 1125, 100–128. [Google Scholar] [CrossRef] [PubMed]
  18. Fontaine, F.E.; Peterson, W.H.; McCOY, E.; Johnson, M.J.; Ritter, G.J. A new type of glucose fermentation by Clostridium thermoaceticum N. sp. J. Bacteriol. 1941, 43, 701–715. [Google Scholar]
  19. Ljungdahl, L.G. The Acetyl-CoA Pathway and the Chemiosmotic Generation of ATP during Acetogenesis; Chapman and Hall Microbiology Series; Drake HL: New York, NY, USA, 1994; pp. 63–87. [Google Scholar]
  20. Ragsdale, S.W.; Pierce, E. Acetogenesis and the Wood-Ljungdahl pathway of CO2 fixation. Biochem. Biophys. Acta 2008, 1784, 1873–1898. [Google Scholar] [CrossRef] [PubMed]
  21. Wieringa, K.T. The formation of acetic acid from carbon dioxide and hydrogen by anaerobic spore-forming bacteria. Antonie Leeuwenhoek 1939, 6, 251–262. [Google Scholar] [CrossRef]
  22. Balasubramanian, N.; Kim, J.S.; Lee, Y.Y. Fermentation of xylose into acetic acid by Clostridium thermoaceticum. Appl. Biochem. Biotechnol. 2001, 91, 367–376. [Google Scholar] [CrossRef]
  23. Ehsanipour, M.; Suko, A.V.; Bura, R. Fermentation of lignocellulosic sugars to acetic acid by Morella thermoacetica. J. Ind. Microbiol. Biotechnol. 2016, 43, 807–816. [Google Scholar] [CrossRef]
  24. Aufurth, S.; Schӓgger, H.; Müller, V. Identification of subunits a, b, and c1 from Acetobacterium woodii Na+-F1F0-ATPase. Subunits c1, c2, and c3 constitute a mixed c-oligomer. J. Biol. Chem. 2000, 275, 33297–33301. [Google Scholar] [CrossRef]
  25. Heise, R.; Müller, V.; Gottschalk, G. Presence of a sodium-translocating ATPase in membrane vesicles of the homoacetogenic bacterium Acetobacterium woodii. Eur. J. Biochem. 1992, 206, 553–557. [Google Scholar] [CrossRef]
  26. Heise, R.; Reidlinger, J.; Müller, V.; Gottschalk, G. A sodium-stimulated ATP synthase in the acetogenic bacterium Acetobacterium woodii. FEBS Lett. 1991, 295, 119–122. [Google Scholar] [CrossRef]
  27. Balch, W.E.; Schoberth, S.; Tanner, R.S. Acetobacterium, a new genus of hydrogen-oxidizing, carbon dioxide-reducing, anaerobic bacteria. Int. J. Syst. Bacteriol. 1977, 27, 355–361. [Google Scholar] [CrossRef]
  28. Groher, A.; Weuster-Botz, D. Comparative reaction engineering analysis of different acetogenic bacteria for gas fermentation. J. Biotechnol. 2016, 228, 82–94. [Google Scholar] [CrossRef] [PubMed]
  29. Jansen, R. Integrated Production and Extraction of Acetic Acid from CO2 Using Microbial Electrosynthesis: Creating Reactor Platform. Master’s Thesis, Gent University, Ghent, Belgium, 2016. [Google Scholar]
  30. Kantzow, C.; Mayer, A.; Weuster-Botz, D. Continuous gas fermentation by Acetobacterium woodii in a submerged membrane reactor with full cell retention. J. Biotechnol. 2015, 212, 11–18. [Google Scholar] [CrossRef] [PubMed]
  31. Kantzow, C.; Weuster-Botz, D. Effects of hydrogen partial pressure on autotrophic growth and product formation of Acetobacterium woodii. Bioprocess Biosyst. Eng. 2015, 39, 1325–1330. [Google Scholar] [CrossRef] [PubMed]
  32. Morinaga, T.; Kawada, N. The production of acetic acid from carbon dioxide and hydrogen by an anaerobic bacterium. J. Biotechnol. 1990, 14, 187–194. [Google Scholar] [CrossRef]
  33. Schmidt, S.; Biegel, E.; Müller, V. The ins and outs of Na+ bioenergetics in Acetobacterium woodii. Biochem. Biophys. Acta 2009, 1787, 691–696. [Google Scholar] [CrossRef] [PubMed]
  34. Wang, Y.Q.; Yu, S.J.; Zhang, F.; Xia, X.Y. Enhancement of acetate productivity in a thermophilic (55 °C) hollow-fiber membrane biofilm reactor with mixed culture syngas (H2/CO2) fermentation. Appl. Microbiol. Biotechnol. 2017, 101, 2619–2627. [Google Scholar] [CrossRef]
  35. Müller, V. Bacterial Fermentation; John Wiley & Sons Ltd.: Chichester, UK, 2008. [Google Scholar]
  36. Biegel, E.; Mu, V. A Na+ translocating pyrophosphatase in the acetogenic bacterium Acetobacterium woodii. J. Biol. Chem. 2011, 286, 6080–6084. [Google Scholar] [CrossRef]
  37. Lange, J.P. Lignocellulose conversion: An introduction to chemistry, process and economics. Biofuels Bioprod. Bioref. 2007, 1, 39–48. [Google Scholar] [CrossRef]
  38. Ahring, B.K.; Biswas, R.; Ahamed, A.; Teller, P.J.; Uellendahl, H. Making lignin accessible for anaerobic digestion by wet-explosion pretreatment. Bioresour. Technol. 2015, 175, 182–188. [Google Scholar] [CrossRef]
  39. Angelidaki, I.; Petersen, S.P.; Ahring, B.K. Effects of lipids on thermophilic anaerobic digestion and reduction of lipid inhibition upon addition of bentonite. Appl. Microbiol. Biotechnol. 1990, 33, 469–472. [Google Scholar] [CrossRef] [PubMed]
  40. Biswas, R.; Uellendahl, H.; Ahring, B.K. Wet Explosion: A universal and efficient pretreatment process for lignocellulosic biorefineries. Bioenerg. Res. 2015, 8, 1101–1116. [Google Scholar] [CrossRef]
  41. Jӧnsson, L.J.; Martín, C. Pretreatment of lignocellulose: Formation of inhibitory byproducts and strategies for minimizing their effects. Bioresour. Technol. 2016, 199, 103–112. [Google Scholar] [CrossRef] [PubMed]
  42. Moreno, A.D.; Olsson, L. Pretreatment of Lignocellulosic Feedstocks, Extremophilic Enzymatic Processing of Lignocellulosic Feedstocks to Bioenergy; Springer: New York, NY, USA, 2017; pp. 31–52. [Google Scholar]
  43. Murali, N.; Srinivas, K.; Ahring, B.K. Biochemical production and separation of carboxylic acids for biorefinery applications. Ferment 2018, 3, 22. [Google Scholar] [CrossRef]
  44. Nielsen, J. Microbial Process Kinetics. In Basic Biotechnology, 2nd ed.; Ratledge, C., Kristiansen, B., Eds.; Cambridge University Press: Cambridge, UK, 2002; Chapter 6. [Google Scholar]
Figure 1. Growth of A. woodii (microbial biomass in mg/L) on 10 g/L glucose (■) and 10 g/L xylose (▲) (all standard deviations were less than 5% and cannot be seen in the graph).
Fermentation 05 00017 g001
Figure 2. Effect of different concentrations of glucose on the growth of A. woodii over time measured in mg/L microbial biomass for: 5 g/L glucose (◆), 10 g/L glucose (■), 20 g/L glucose (▲), 30 g/L glucose (⬛), 40 g/L glucose (⬤). (all the standard deviations were less than 5% and cannot be seen in the graph).
Fermentation 05 00017 g002
Figure 3. Effect of different concentrations of glucose on acetic acid production by A. woodii over time measured in g/L acetic acid produced for: 5 g/L glucose (◆), 10 g/L glucose (■), 20 g/L glucose (▲), 30 g/L glucose (⬛), 40 g/L glucose (⬤). (all the standard deviations were less than 10%).
Fermentation 05 00017 g003
Figure 4. Growth rates of A. woodii at different concentrations of glucose for determination of the maximum growth rate and growth rate constants (Ks and Ki) using Monod kinetics.
Fermentation 05 00017 g004
Figure 5. Time-based profile of: glucose uptake (g/L) (■), xylose uptake (g/L) (▲) and acetic acid production (g/L) (⬤) for WSH. (all the standard deviations were less than 5% and cannot be seen in the graph).
Fermentation 05 00017 g005
Figure 6. Time-based profile of: glucose uptake (g/L) (■), xylose uptake (g/L) (▲) and acetic acid production (g/L) (⬤) for CSH. (all the standard deviations were less than 5% and cannot be seen in the graph).
Fermentation 05 00017 g006
Table 1. Different concentrations of C6 (glucose), C5 (xylose) and lignocellulosic feedstock (WSH, CSH) sugars present in the batch experiments designed to test the growth of A. woodii. * All the experiments were performed in duplicates.
Feedstock* Measured Concentration of Batch Feed before Inoculation (g/L)
GlucoseXyloseAcetic Acid
5 g/L glucose6.63-0
10 g/L glucose9.87-0
20 g/L glucose20.79-0
30 g/L glucose31.23-0
40 g/L glucose41.10-0
10 g/L xylose-10.28-
WSH18.5813.453.31
CSH16.6610.025.16
Table 2. Maximum growth rate constants for different glucose concentrations calculated using Equation (1).
Glucose Concentration (g/L)Maximum Growth Rate (µg) (day−1)
6.630.69
9.870.52
20.790.63
31.230.54
41.100.47
Table 3. Calculation of yield coefficients for different glucose concentrations and lignocellulosic biomass sugars.
Concentration of Glucose (g/L)Yp/s
6.630.59
9.870.76
20.790.44
31.230.40
41.100.33
WSH (18.58)0.70
CSH (16.66)0.65

