Article

Ethanol Production from Olive Stones through Liquid Hot Water Pre-Treatment, Enzymatic Hydrolysis and Fermentation. Influence of Enzyme Loading, and Pre-Treatment Temperature and Time

by
Manuel Cuevas
1,2,*,
Juan F. García Martín
2,3,*,
Vicente Bravo
4 and
Sebastián Sánchez
1,2
1
Department of Chemical, Environmental and Materials Engineering, Campus ‘Las Lagunillas’, University of Jaén, 23071 Jaén, Spain
2
Center for Advanced Studies in Olive Grove and Olive Oils, Science and Technology Park GEOLIT, 23620 Mengíbar, Spain
3
Departamento de Ingeniería Química, Facultad de Química, Universidad de Sevilla, C/Profesor García González, 1, 41012 Seville, Spain
4
Department of Chemical Engineering, Campus ‘Fuente Nueva’, University of Granada, 18071 Granada, Spain
*
Authors to whom correspondence should be addressed.
Submission received: 24 January 2021 / Revised: 12 February 2021 / Accepted: 14 February 2021 / Published: 17 February 2021
(This article belongs to the Special Issue Food Wastes: Feedstock for Value-Added Products: 2nd Edition)

Abstract

:
Olive table industry, olive mills and olive pomace oil extraction industries annually generate huge amounts of olive stones. One of their potential applications is the production of bioethanol by fractionation of their lignocellulose constituents and subsequent fermentation of the released sugars using yeasts. In this work, we studied the influence of temperature (175–225 °C) and residence time (0–5 min) in the liquid hot-water pre-treatment of olive stones as well as the initial enzyme loading (different mixtures of cellulases, hemicellulases and β–glucosidases) in the later enzymatic hydrolysis on the release of fermentable sugars. The Chrastil’s model was applied to the d-glucose data to relate the severity of pre-treatment to enzyme diffusion through the pre-treated cellulose. Finally, the hydrolysate obtained under the most suitable conditions (225 °C and 0 min for pre-treatment; 24 CE initial enzyme concentration) was fermented into ethanol using the yeast Pachysolen tannophilus ATCC 32691. Considering the overall process, 6.4 dm3 ethanol per 100 kg olive stones were produced.

1. Introduction

Olive stones are a lignocellulose biomass that represent around 20% of the olive weight [1]. Olive stones are largely generated not only in the olive table industry, but also in olive oil and olive pomace oil extraction industries after removing the olive stones from the olive pulp to extract olive oil or olive pomace oil, respectively [2]. The table olive industry is responsible for the generation of ca 30,000 t olives stones per year in Andalusia, the main worldwide producer region of table olives [3]. Meanwhile, and taking into account that olive stones account for approximately the same weight as the olive oil extracted from the fruit, and that 1.125 × 10⁶ t olive oil were obtained in the Spanish olive oil mills in the 2019/2020 campaign [4], these facilities would annually process around one million tons of olive stones.
As a lignocellulose material, the main components of olive stones are cellulose, hemicellulose and lignin. Because of this, one of the most promising energetic valorisation alternatives is the production of bioethanol. The production of ethanol from lignocellulose biomass via biochemical pathways has been the subject of numerous studies in recent decades. Most of the proposed schemes are composed of three main stages: pre-treatment of the biomass, enzymatic or acid hydrolysis of the pre-treated biomass and fermentation of the released sugars [2].
With regard to the pre-treatment stage, dilute acid hydrolysis at high temperatures [5,6,7,8], autohydrolysis or liquid hot water (LHW) pre-treatment [8,9,10,11] and steam explosion [1,12,13] are the most common used biomass pre-treatments. LHW is of great interest because, unlike acid hydrolysis, it uses water as the only reagent in a facility that is easier to operate and maintain than steam explosion. When water is heated above 120 °C, ionization processes are promoted so that the H3O+ concentration increases [14]. These ions, along with acetic acid and uronic acids released from hemicellulose by these ions’ action, are responsible for the hemicellulose hydrolysis and partial cellulose (mainly amorphous cellulose) degradation [14,15]. The LHW pre-treatment can solubilize most of the hemicelluloses and extracts of olive stones, making pre-treated cellulose more accessible to enzyme attack in the subsequent hydrolysis stage. If the LHW process is carried out in a non-isothermal way, the treatment severity factor (Log R0) proposed by Overend and Chornet [16], which takes into account the combined effect of temperature and process time, could be applied.
The enzymatic hydrolysis with cellulolytic enzymes allows a selective conversion of cellulose into d-glucose under milder operating conditions (pH 4.8, 50 °C temperature) and with a lower generation of fermentation inhibitors than acid hydrolysis. Notwithstanding, the use of enzymes is complex due to their high cost, polysaccharide selectivity of each type of enzyme and the different inhibitions that they can undergo in their hydrolytic actions [17,18]. Therefore, it is of great importance to assess the effect of enzyme type and enzyme loading to achieve high d-glucose yields at a relatively low enzyme cost.
To describe the behaviour of enzymes when acting on porous solids, the model proposed by Chrastil [19] can sometimes be used, which can describe the production of d-glucose, taking into account the diffusion of the enzymes within the solid (Equation (1)).
P = P·[1 − exp(−kE·CE0·t)]n
The previous expression links the concentrations of products, which diffuse from the interior of the solid substrate at any time (P) and at equilibrium (P), with the initial concentration of enzymes (CE0), the reaction time (t), a specific rate constant (kE) that is proportional to the diffusion coefficient, and a factor of structural resistance to diffusion (n). When the resistance to diffusion of the biocatalyst through the solid is small, the parameter n is close to 1, while when the catalytic action is strongly limited by diffusion, n has lower values, even lower than 0.5. The Chrastil’s model was applied to compare the enzymatic hydrolysis of native cellulose present in wheat straw and that resulting from the pre-treatment of the biomass with NaOH. The alkaline pre-treatment raised the value of n from 0.33 to 0.47, which indicates a better accessibility of the enzymes to the substrate [20].
It is evident that the severity of LHW pre-treatment applied to biomass modifies the ease with which the cellulolytic enzymes act on the pre-treated cellulose. For this reason, it would be expected to find a relationship between the factors Log R0 and n, a relationship that has not been studied previously, and therefore is not available in the literature.
In relation to the fermentation of sugars generated during the LHW pre-treatment and enzymatic hydrolysis stages, the use of non-traditional yeasts, such as Pachysolen tannophilus, would allow fermenting not only hexoses (such as d-glucose) but also pentoses (such as d-xylose) present in the culture [6,7,9,21]. The determination of certain kinetic parameters over fermentation, such as the maximum specific rates of growth, substrate uptake and bioproducts production, as well as the determination of the yields of biomass and bioproducts, could broaden the available information in the literature on the ability of P. tannophilus to produce ethanol from olive stones.
In the present work, LHW pre-treatments under different severity factors (Log R0) were applied to olive stones in order to modify their structure and make them accessible to enzymes. Subsequently, the enzymatic hydrolysis of the pre-treated cellulose was carried out and the characteristic parameters of Chrastil’s equation (kE and n) were determined. The aim was to achieve a relationship between Log R0 and n. Finally, the fermentation of enzymatic hydrolysates using the yeast P. tannophilus was performed to assess the feasibility of the proposed scheme for the production of bioethanol from olive stones.

2. Materials and Methods

2.1. Raw Material

Olive stones (fragmented and moist endocarps) used throughout this research were supplied by an olive oil mill (S.C.A. San Juan, Spain, UTM coordinates: 37°47′58.52″ N, 3°47′09.42″ W). Once at the laboratory, olive stones were dried at room temperature until reaching equilibrium moisture (roughly 8%). Afterwards, the olive stones went through a Vibro blade mill and sieve system (Retsch GmbH, Haan, Germany) to reduce the particle size. The selected particle size selected for this research was that comprised between 0.300 and 0.425 mm.

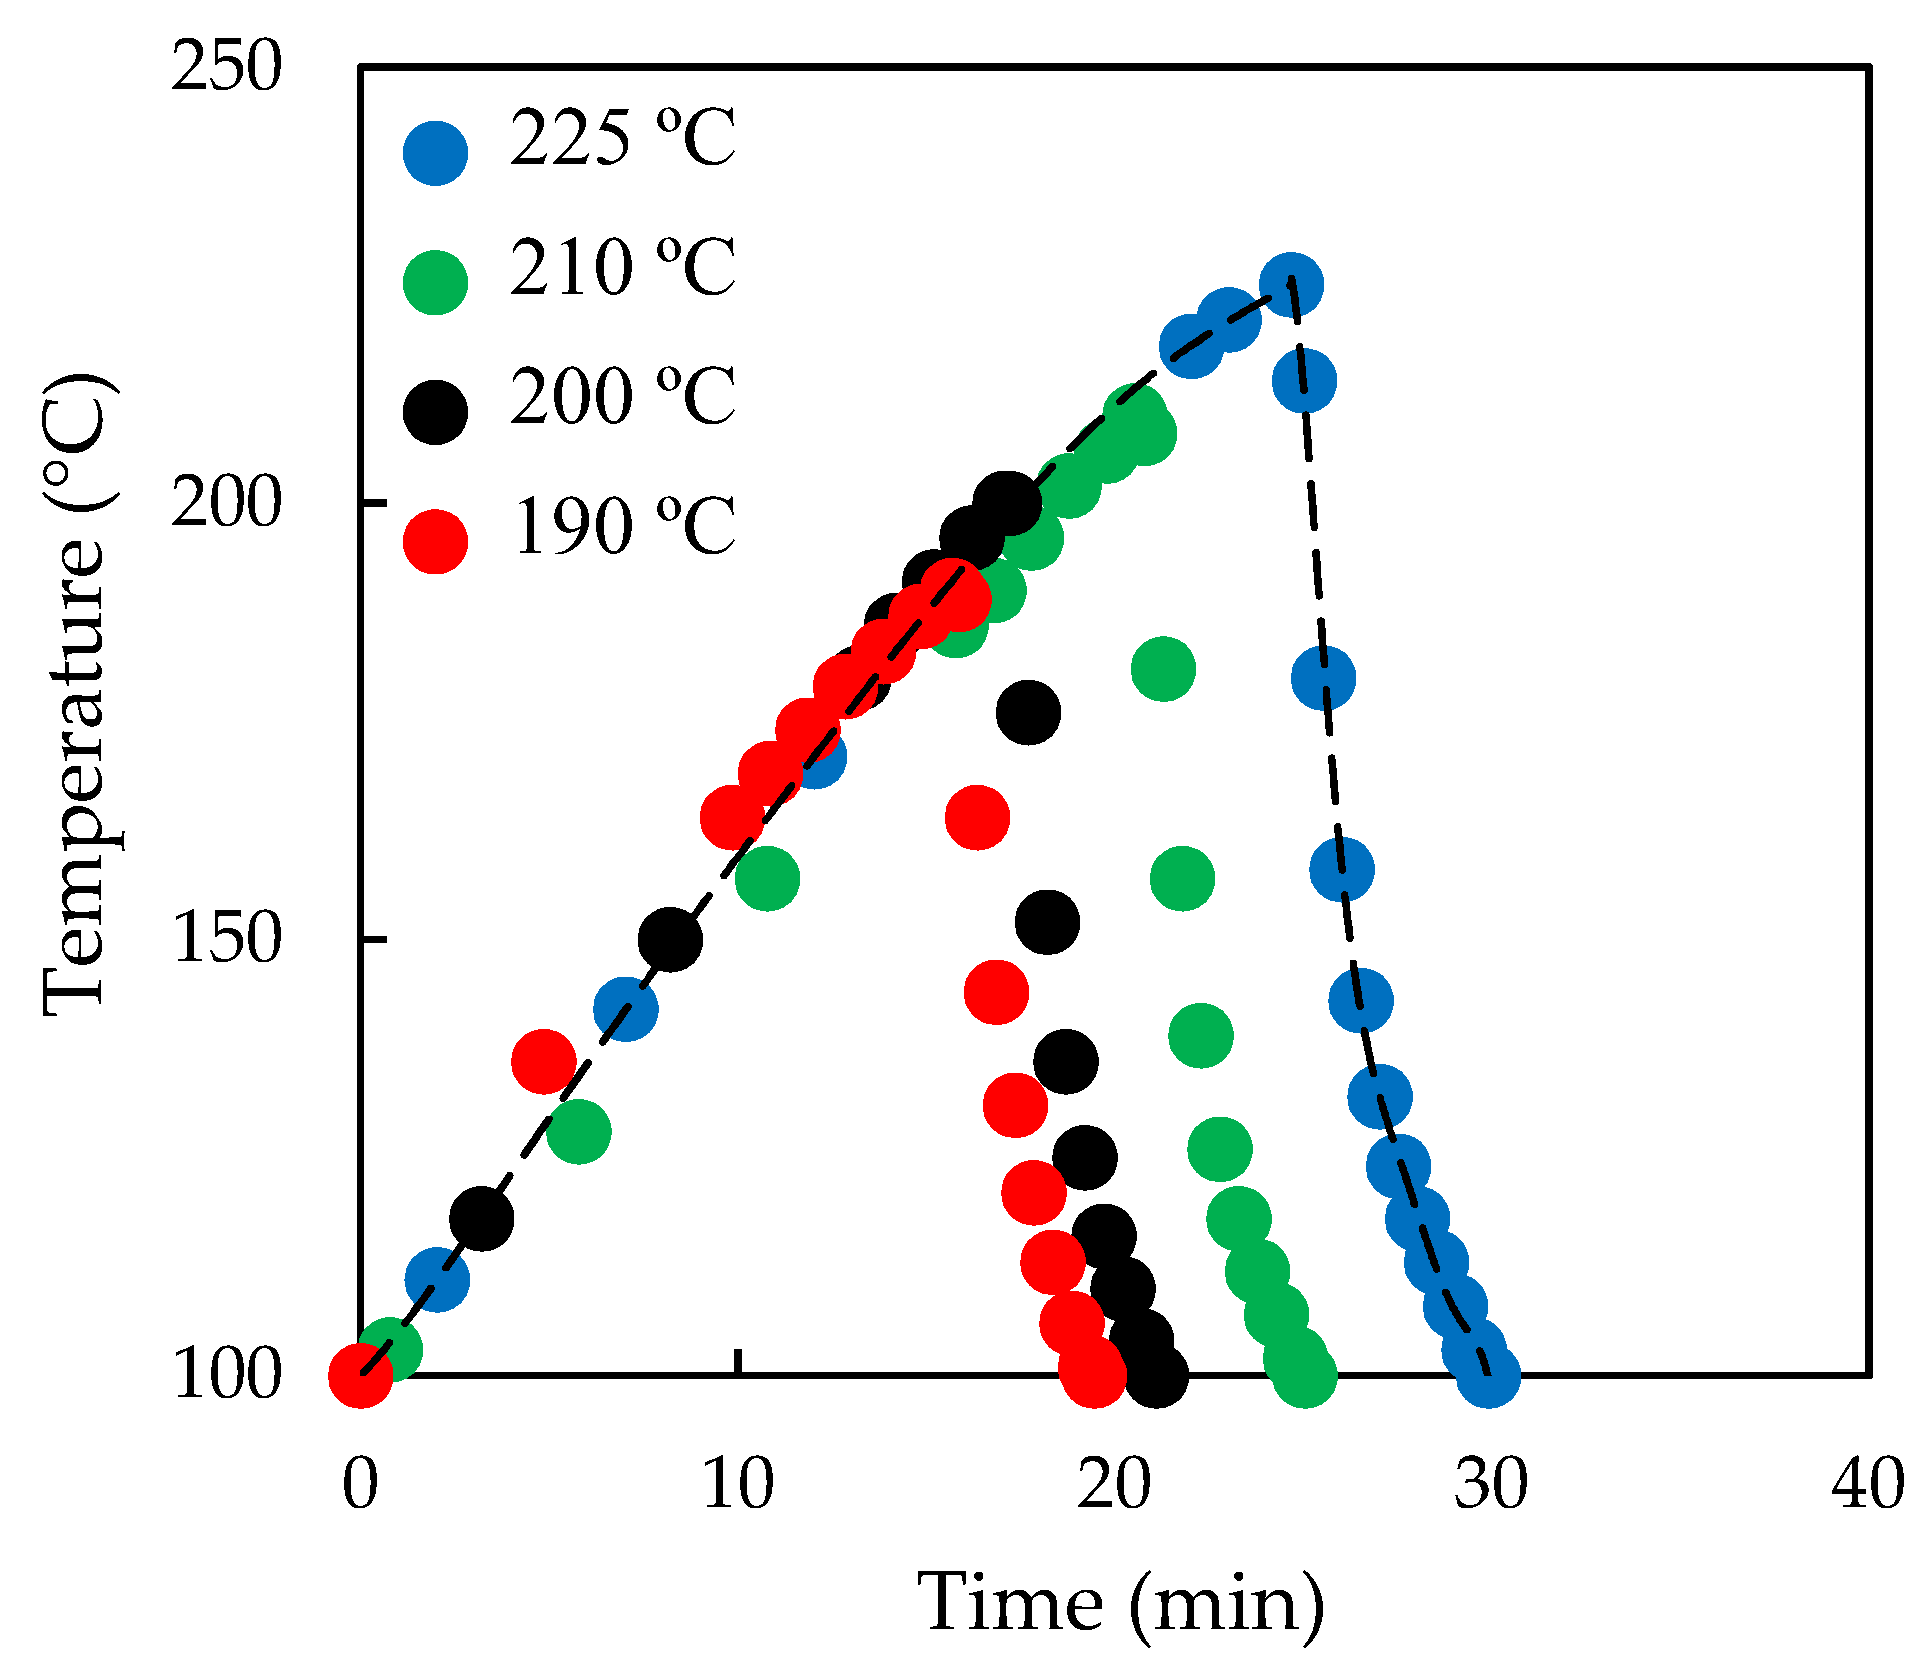
2.2. Liquid Hot Water (LHW) Pre-Treatment

The parameters selected to assess the LHW pre-treatment were the maximum pre-treatment temperature (Tpret, °C) and the maintenance time (tpret, min) at Tpret. To do this, two sets of experiments were performed. In the first one, Tpret varied from 175 to 225 °C, using 0 min as tpret at the given Tpret. In the second one, Tpret was fixed to 220 °C and maintenance times of 1, 2 and 5 minutes were assayed.
In order to perform the LHW pre-treatments, olive stones, once dried and with the selected particle size, were subjected to LHW pre-treatment in a 2-dm3 Parr batch reactor Series 4522 (Moline, IL, USA). Fifty grams of olive stones, along with 300 dm3 distilled water, were loaded inside the reactor, which was then hermetically closed. Once the equipment was closed, the stirring system was set to 250 rpm and the reactor heating–cooling system began to act, achieving three different stages in the biomass pre-treatment: a) the heating stage, which lasts until the mixture reaches Tpret; b) the maintenance stage, in which Tpret is maintained for a selected tpret; c) the cooling stage, in which the temperature of the system is rapidly reduced from Tpret to temperatures below 100 °C. From the evolution of temperatures over pre-treatment (Figure 1), the parameter (Log R0), indicator of the severity of the pre-treatment could be calculated using the procedure described in previous articles [9,22]. Once the system was cooled down, the Parr reactor was opened, and its content (pre-treated liquid and solid phases) was made up to 200 dm3 with distilled water and then transferred to a jacketed reactor for enzymatic hydrolysis.

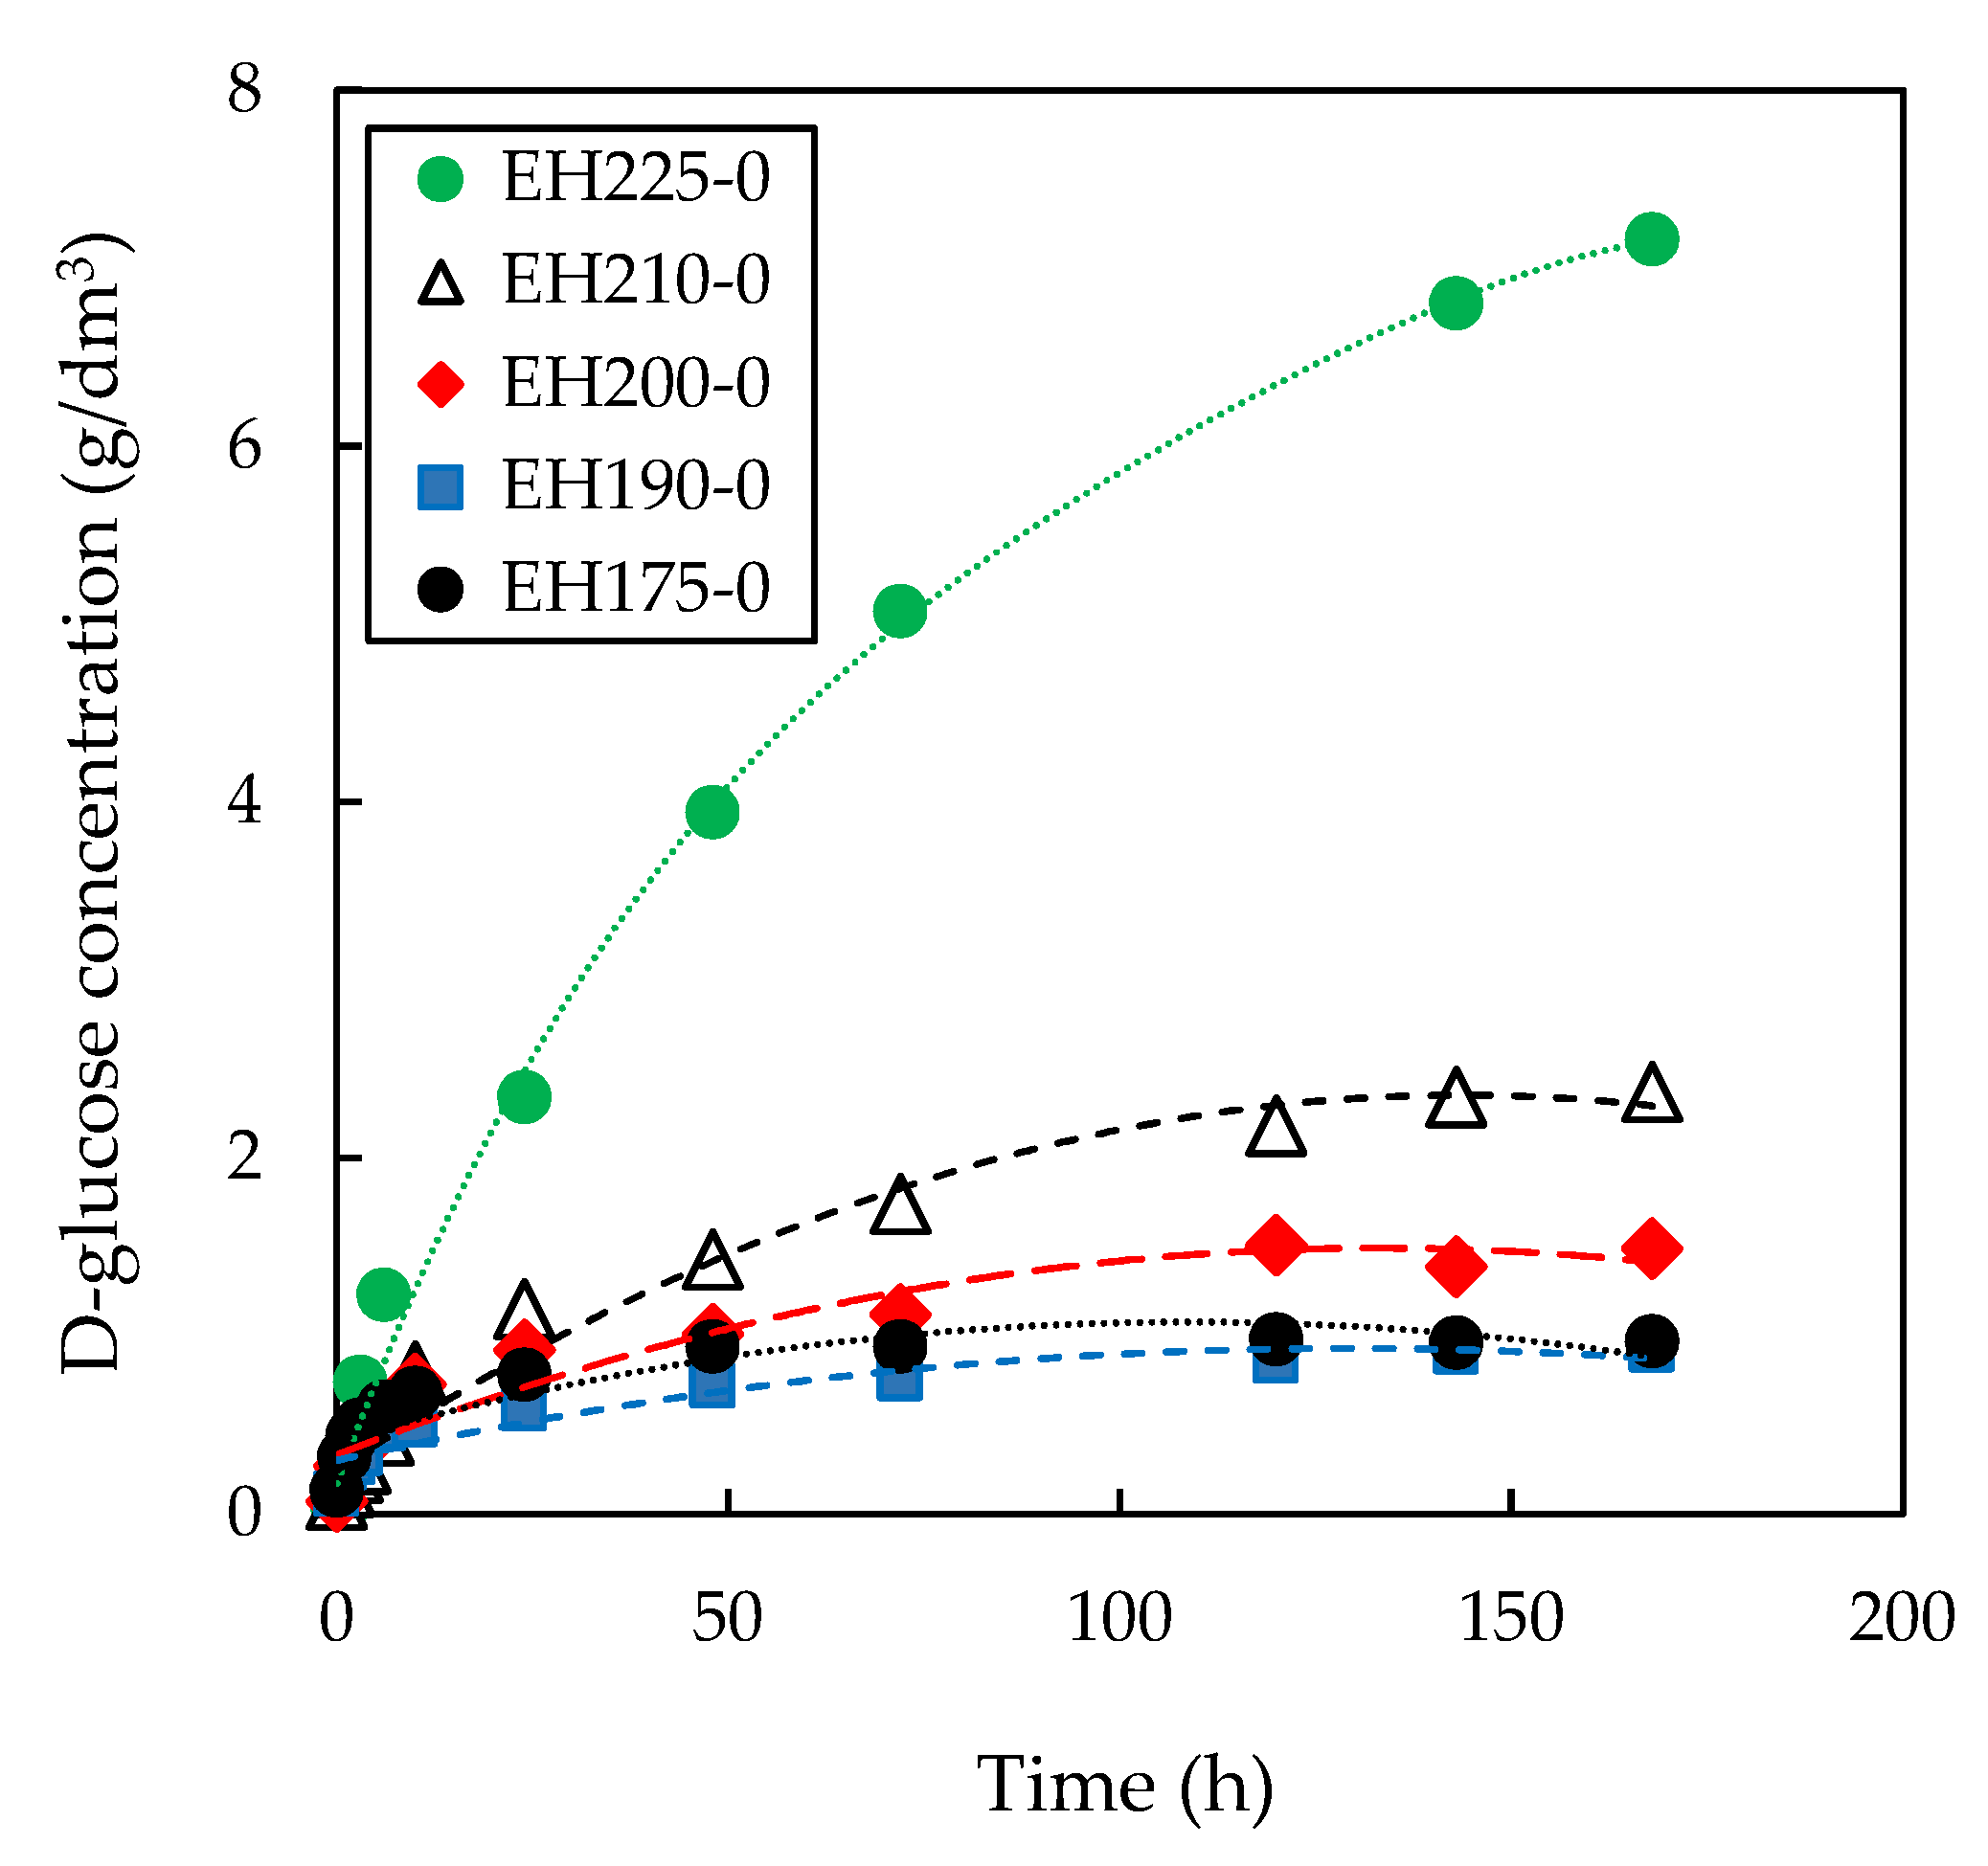
2.3. Enzymatic Hydrolysis

Three commercial enzymes supplied by Sigma Chemical Co. (St. Louis, MO), namely cellulases (EC 3.2.1.4. from Trichoderma viride), β-glucosidases (EC 3.2.1.21. from almonds) and hemicellulases (from Aspergillus niger), were used for the enzymatic hydrolysis of the pre-treated olive stones. The enzymatic hydrolyses were carried out at 45 °C and pH 5.0 in a 1-dm3 Pyrex-glass jacketed reactor. A Teflon anchor rod driven by a RZR-2000 stirrer (Heidolph, Schwabach, Germany) was used to set a stirring of 250 rpm.
Table 1 shows the enzymatic loadings used in the different enzymatic hydrolyses, so that the figures refer to a reference value of enzymatic activity equal to 345 IU. Thus, for example, an amount of cellulases equivalent to a cellulase activity of 6 × 345 = 2070 IU was used for enzymatic hydrolysis EL-1, along with an amount of β-glucosidases equivalent to a β-glucosidase activity of 1 × 345 = 345 UI. Samples were withdrawn from the reactor at fixed time intervals to assess the evolution of hydrolysis over time by determining the content of d-glucose. Once the enzymatic hydrolysis was finished, the liquid and solid phases were separated by filtration. The former was stored at a low temperature (−18 °C) until subsequent fermentation experiments. Regarding the solid, it was washed with distilled water and dried prior to proceeding with its characterization.

2.4. Fermentation of Enzymatic Hydrolysates

The non-traditional yeast Pachysolen tannophilus ATCC 32691 (from the American Type Culture Collection) was used to ferment the enzymatic hydrolysates under microaerobic conditions at 30 °C and pH 4.5. The overall volumetric mass-transfer coefficient at the beginning of the fermentations was 2.9 h−1. A comprehensive description of the procedure can be found elsewhere [9].

2.5. Analytical Methods

The solid biomasses (raw material, pre-treated solids and solids resulting from enzymatic hydrolyses) were characterized according to their contents in moisture (TAPPI T11 m-59 standard), Acid Insoluble Lignin (AIL; TAPPI T222 os-74 standard), Neutral Detergent Fibre (NDF) and Acid Detergent Fibre (ADF). The percentages of hemicellulose (HEM) and cellulose (CEL) in the different solids were calculated from the values of AIL, NDF and ADF by applying Equations (2) and (3)
HEM (%) = NDF (%) − ADF (%)
CEL (%) = ADF (%) − AIL (%)
The concentration of d-glucose (g) in the enzymatic hydrolysates and in the fermentation cultures, as well as the concentrations of acetic acid (AA), ethanol (E) and xylitol (Xy) in the fermentation media, were calculated by enzymatic methods of Trinder [23], Bergmeyer and Möllering [24], Beutler [25] and Beutler and Becker [26], respectively. For the determination of total reducing sugars (TRS) in the fermentation stage, the dinitrosalicylic acid colorimetric method was used. The cell concentration of P. tannophilus (x) was calculated from a calibration line that relates the dry weight of biomass with the absorbance of the cell suspension [27]. All the analytical determinations were performed in duplicate.

3. Results and Discussion

The raw material used in this work contained a low percentage of cellulose (25.3%) along with a high percentage of acid-insoluble lignin (33.5%), which could hindrance the production of d-glucose via enzymatic hydrolysis. On the other hand, hemicellulose stood for 33.9% dry weight of olive stones.

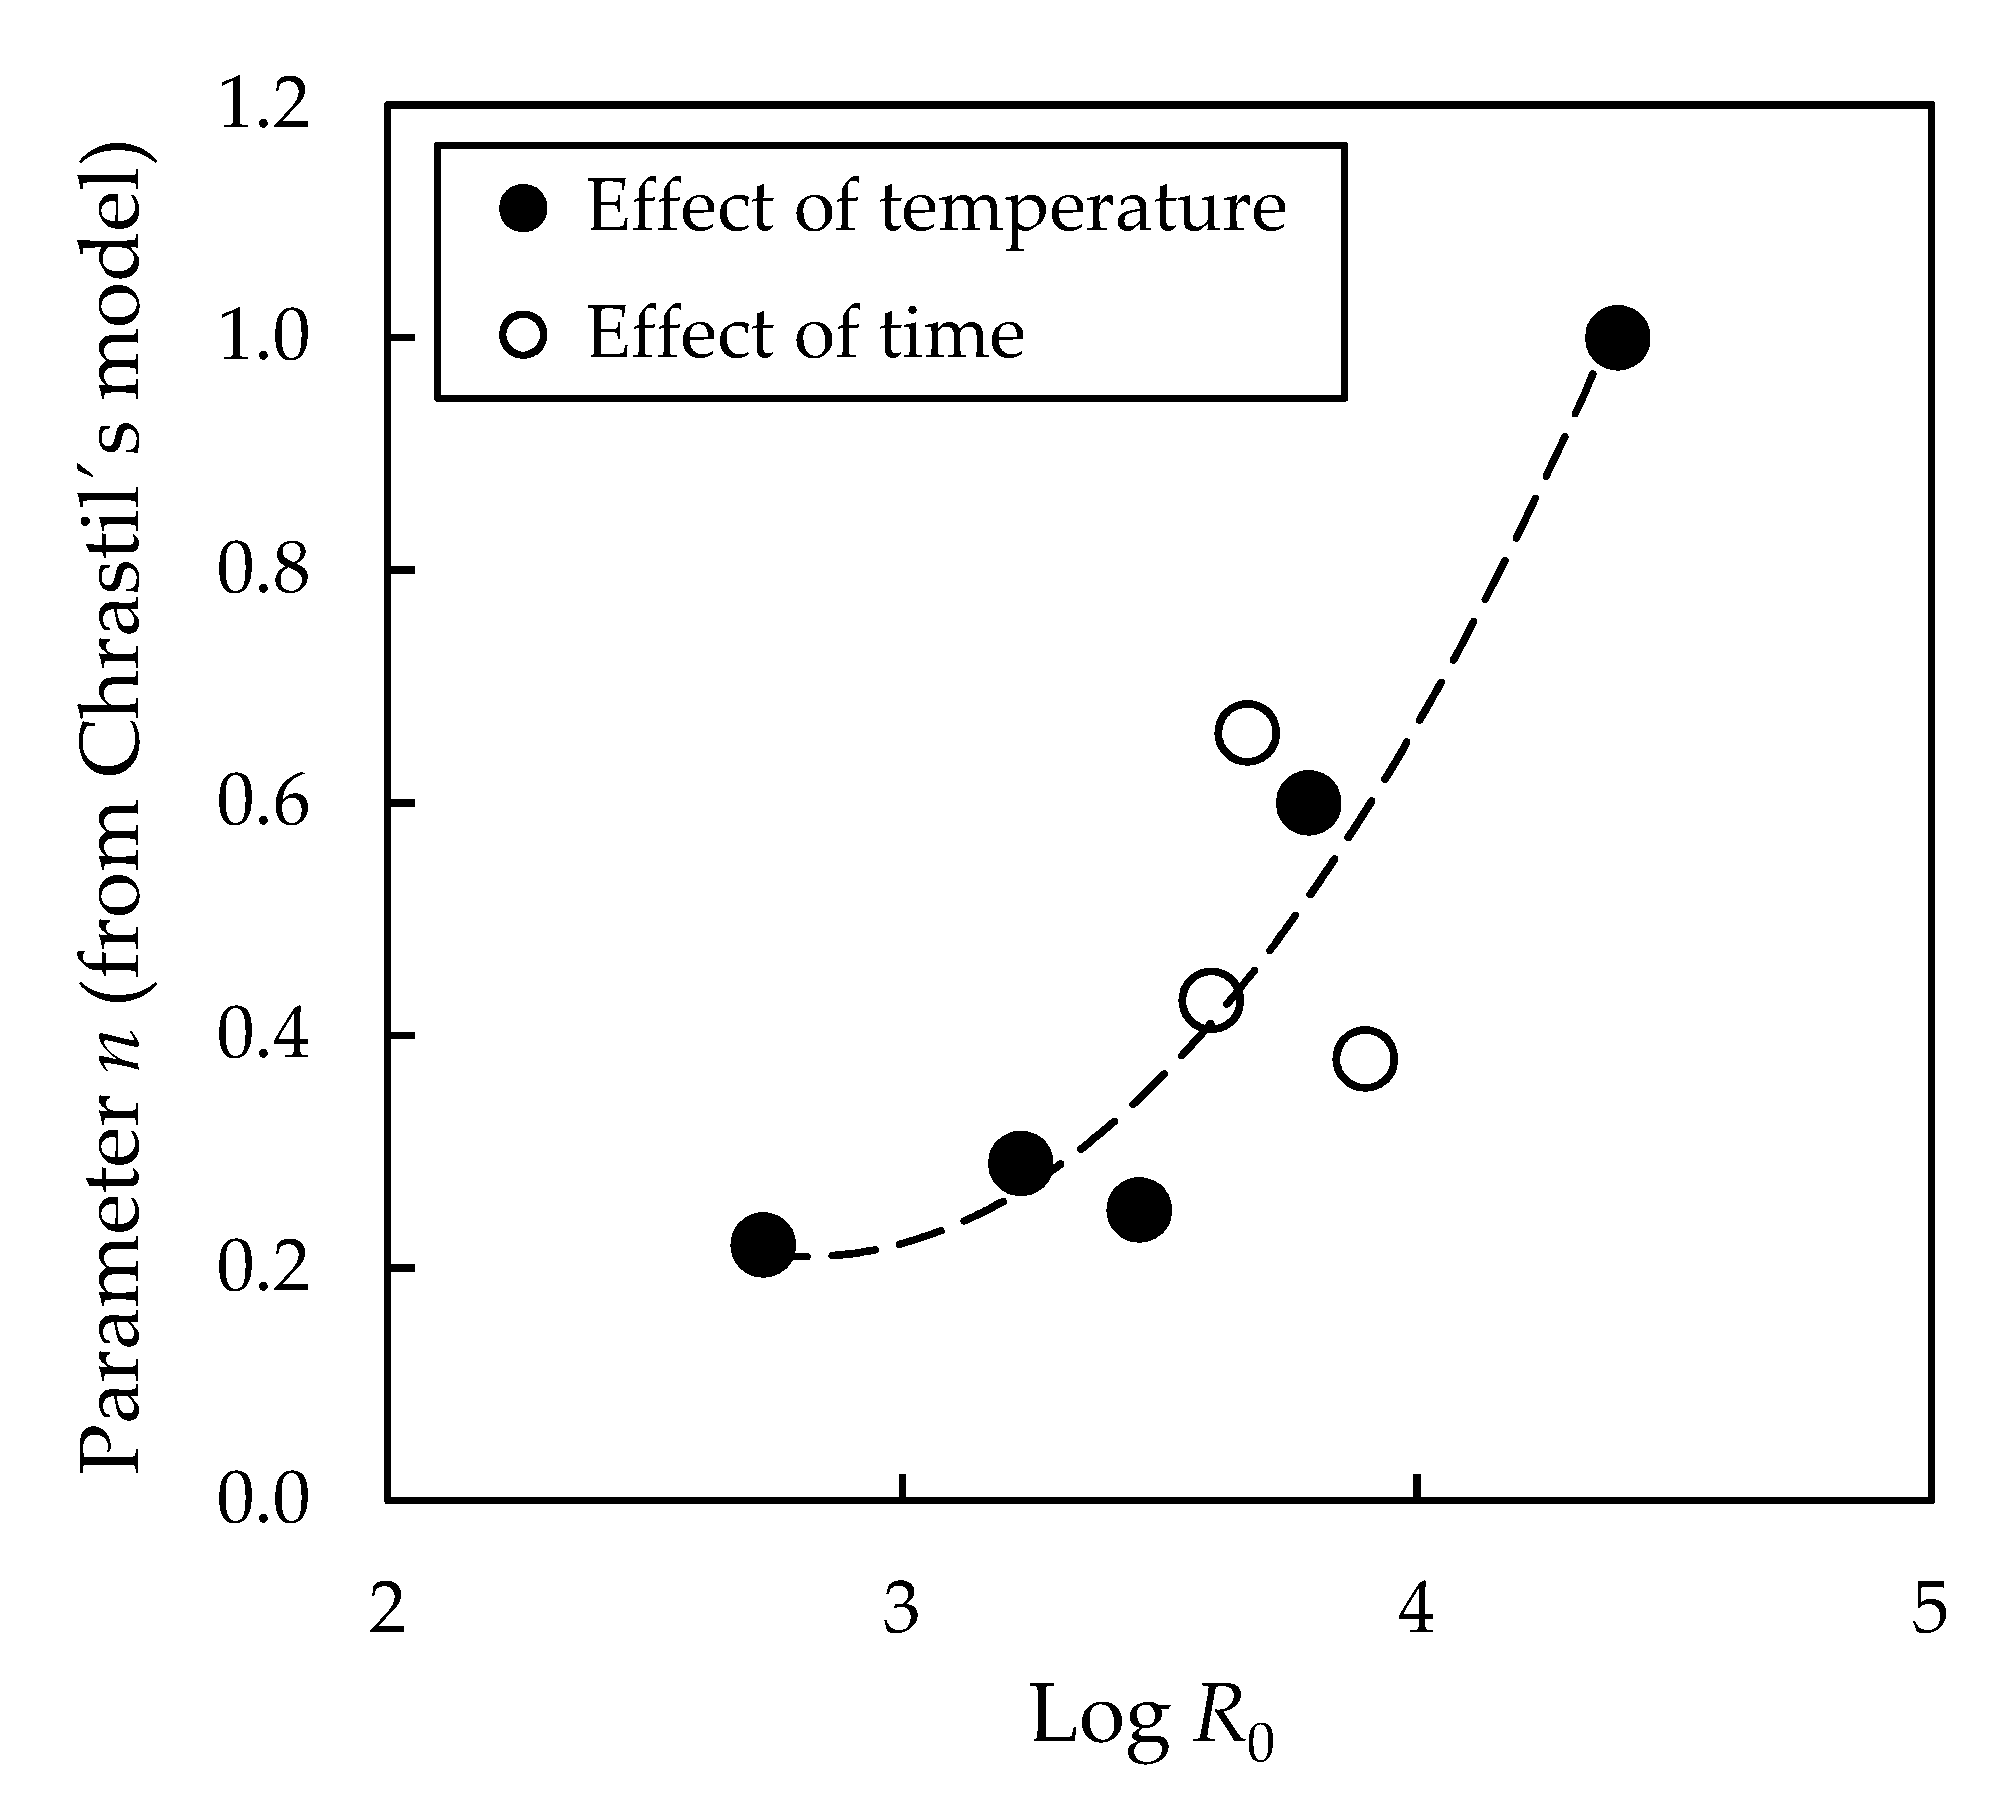
3.1. Effect of Pre-Treatment Temperature on Subsequent Enzymatic Hydrolysis

Five LHW pre-treatments were performed on olive stones at 175, 190, 200, 210 and 225 °C, respectively, with tpret = 0 min, equivalent to applying Log R0 values between 2.73 and 4.39. Table 2 shows, for each LHW pre-treatment, the Log R0 values as well as the fibre composition (cellulose, hemicellulose and acid-insoluble lignin) of the pre-treated solids. As can be observed in this Table, the increase in the severity of pre-treatment resulted in a continuous decrease in the percentage of hemicellulose while, in general, the percentages of cellulose and insoluble acid lignin increased.
The slurries from the previous five pre-treatments (P175-0 to P225-0 LHW pre-treatments) were enzymatically hydrolysed (EH175-0 to EH225-0 enzymatic hydrolyses) with cellulases using 2070 IU enzyme loading (EL-5 in Table 1). The analysis of the solids obtained after the action of the enzymes (data not shown) revealed a low hydrolytic capacity of cellulases, except when it was applied to the solid obtained from P225-0. In this case, enzymatic hydrolysis led to a solid with 8.7% cellulose, a significantly lower percentage than the starting cellulose content (38.2%). From the previous values, the mass balance to the solids before and after the enzymatic hydrolysis EH225-0 resulted in 82.8% pre-treated cellulose removal. Similar values of enzymatic digestibility have been reported from ammonia-pre-treated corn stover [28] and from steam-exploded barley straw [29].
With regard to the evolution of the d-glucose concentration in the liquid hydrolysates over enzymatic hydrolysis, the pre-treatment at 225 °C was the most effective for sugar production (Figure 2).
The generation of d-glucose over enzymatic hydrolysis could be studied by applying the Chrastil’s model. To do this, Equation (1) became the following expression
k E = Ln [ 1 ( g g f ) 1 n ] C E 0 · t
where g and gf stand for d-glucose concentration at a given time t and at equilibrium, respectively.
By representing the numerator of Equation (4) against the denominator, a straight line of slope kE and a y-intercept of zero were obtained. Using an iterative calculation method, using the Microsoft Excel software, the value of the parameter n was determined, for which the best fit of the straight line was obtained. Table 3 shows the kE and n values obtained by applying the Chrastil model. It is observed that the parameter n was very low for the three pre-treatments carried out at the lowest temperatures (175, 190 and 200 °C), which illustrates how the physical transport stages of the enzymes through the solid would limit the overall d-glucose generation rate. Notwithstanding, n values of 0.60 and 1.00 were obtained for solids pre-treated at 210 and 225 °C, respectively.

3.2. Effect of Pre-Treatment Maintenance Time on Subsequent Enzymatic Hydrolysis

To study the effect of tpret of LHW pre-treatment on the enzymatic hydrolysis, three tests were performed in which olive stones were pre-treated at 200 °C for 1, 2 and 5 min, equivalent to applying Log R0 values between 3.60 and 3.90. Table 4 shows the Log R0 value as well as the fibre composition (cellulose, hemicellulose and acid-insoluble lignin) of the pre-treated solids for each pre-treatment. Similar to what was found with the increase in Tpret, there was a strong decrease in the percentage of hemicellulose in the pre-treated solids (from 19.5% to 0%) as tpret increased, which led to mild increases in the percentages of cellulose and acid-insoluble lignin. The slurries resulting from the LWT pre-treatments were enzymatically hydrolysed with 2070 IU cellulase loading (Table 4). The enzymatic hydrolysis of the slurry obtained with the highest tpret (EH200-5) resulted in a solid containing 23.4%, 1.6% and 50.1% cellulose, hemicellulose and AIL, respectively.
The increase of the pre-treatment time from 1 to 5 min led to an increase in the concentration of d-glucose released in the enzymatic hydrolysis step. Thus, the final concentrations of d-glucose were 2.18 g and 2.84 g/dm3 for EH200-1 and EH200-5, respectively. The parameters calculated by applying the Chrastil’s model to the experimental data of this set of experiments are shown in Table 5.
With the values of n calculated both by modifying the temperature and the pre-treatment time, it is possible to assess the evolution of said parameter as a function of Log R0. It was found that the higher the severity of the LHW pre-treatment (Log R0 from 2.73 to 4.39), the higher the n value (from 0.22 to 1.00) (Figure 3). In a study on the use of the Chrastil’s model in the enzymatic hydrolysis of sugarcane bagasse pre-treated by different methods [30], n values between 0.3 (acid pre-treatment) and 0.85 (steam explosion pre-treatment) were achieved, which are in the range of those found for LHW pre-treatment in this research. For the latter pre-treatment (steam explosion), a kE value of 0.2 × 10⁻³ was also obtained in the subsequent enzymatic hydrolysis, a value very close to that determined in the present study for EH210-0 (Table 3) and EH200-1 (Table 5). Therefore, it can be concluded that the most suitable LHW pre-treatment of olive stones for subsequent enzymatic hydrolysis was the one carried out at 225 °C for tpret = 0.

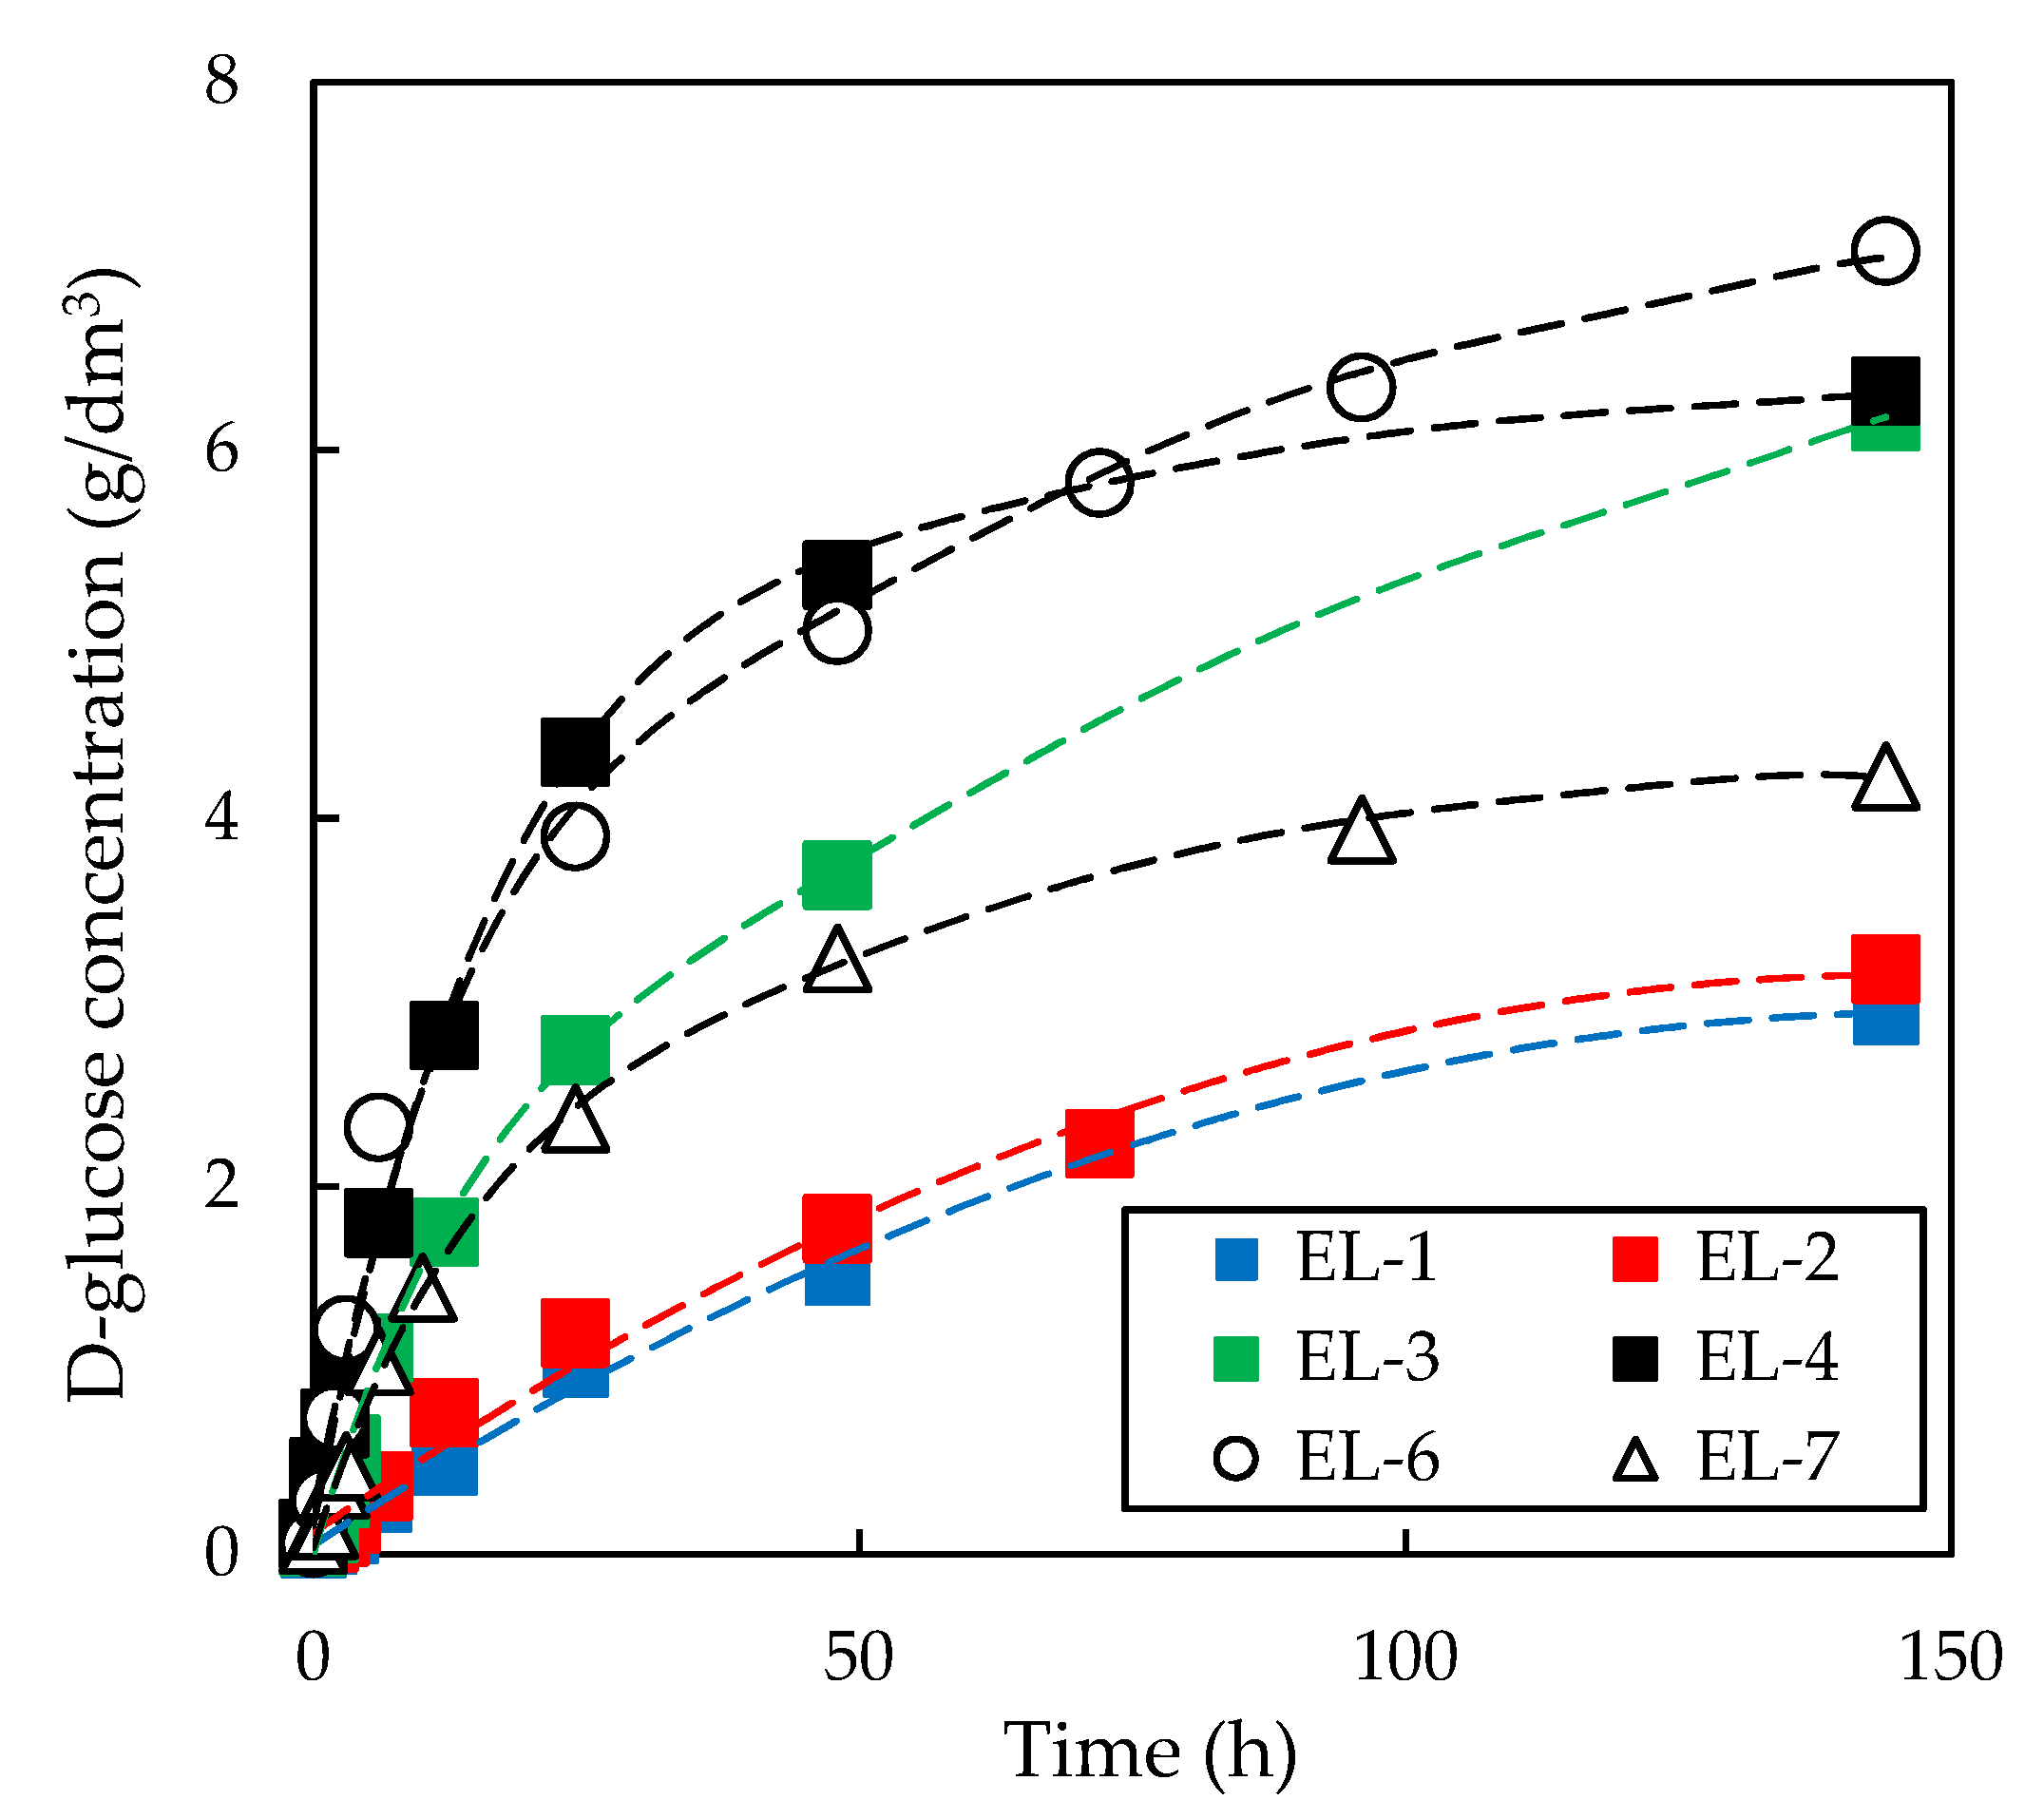
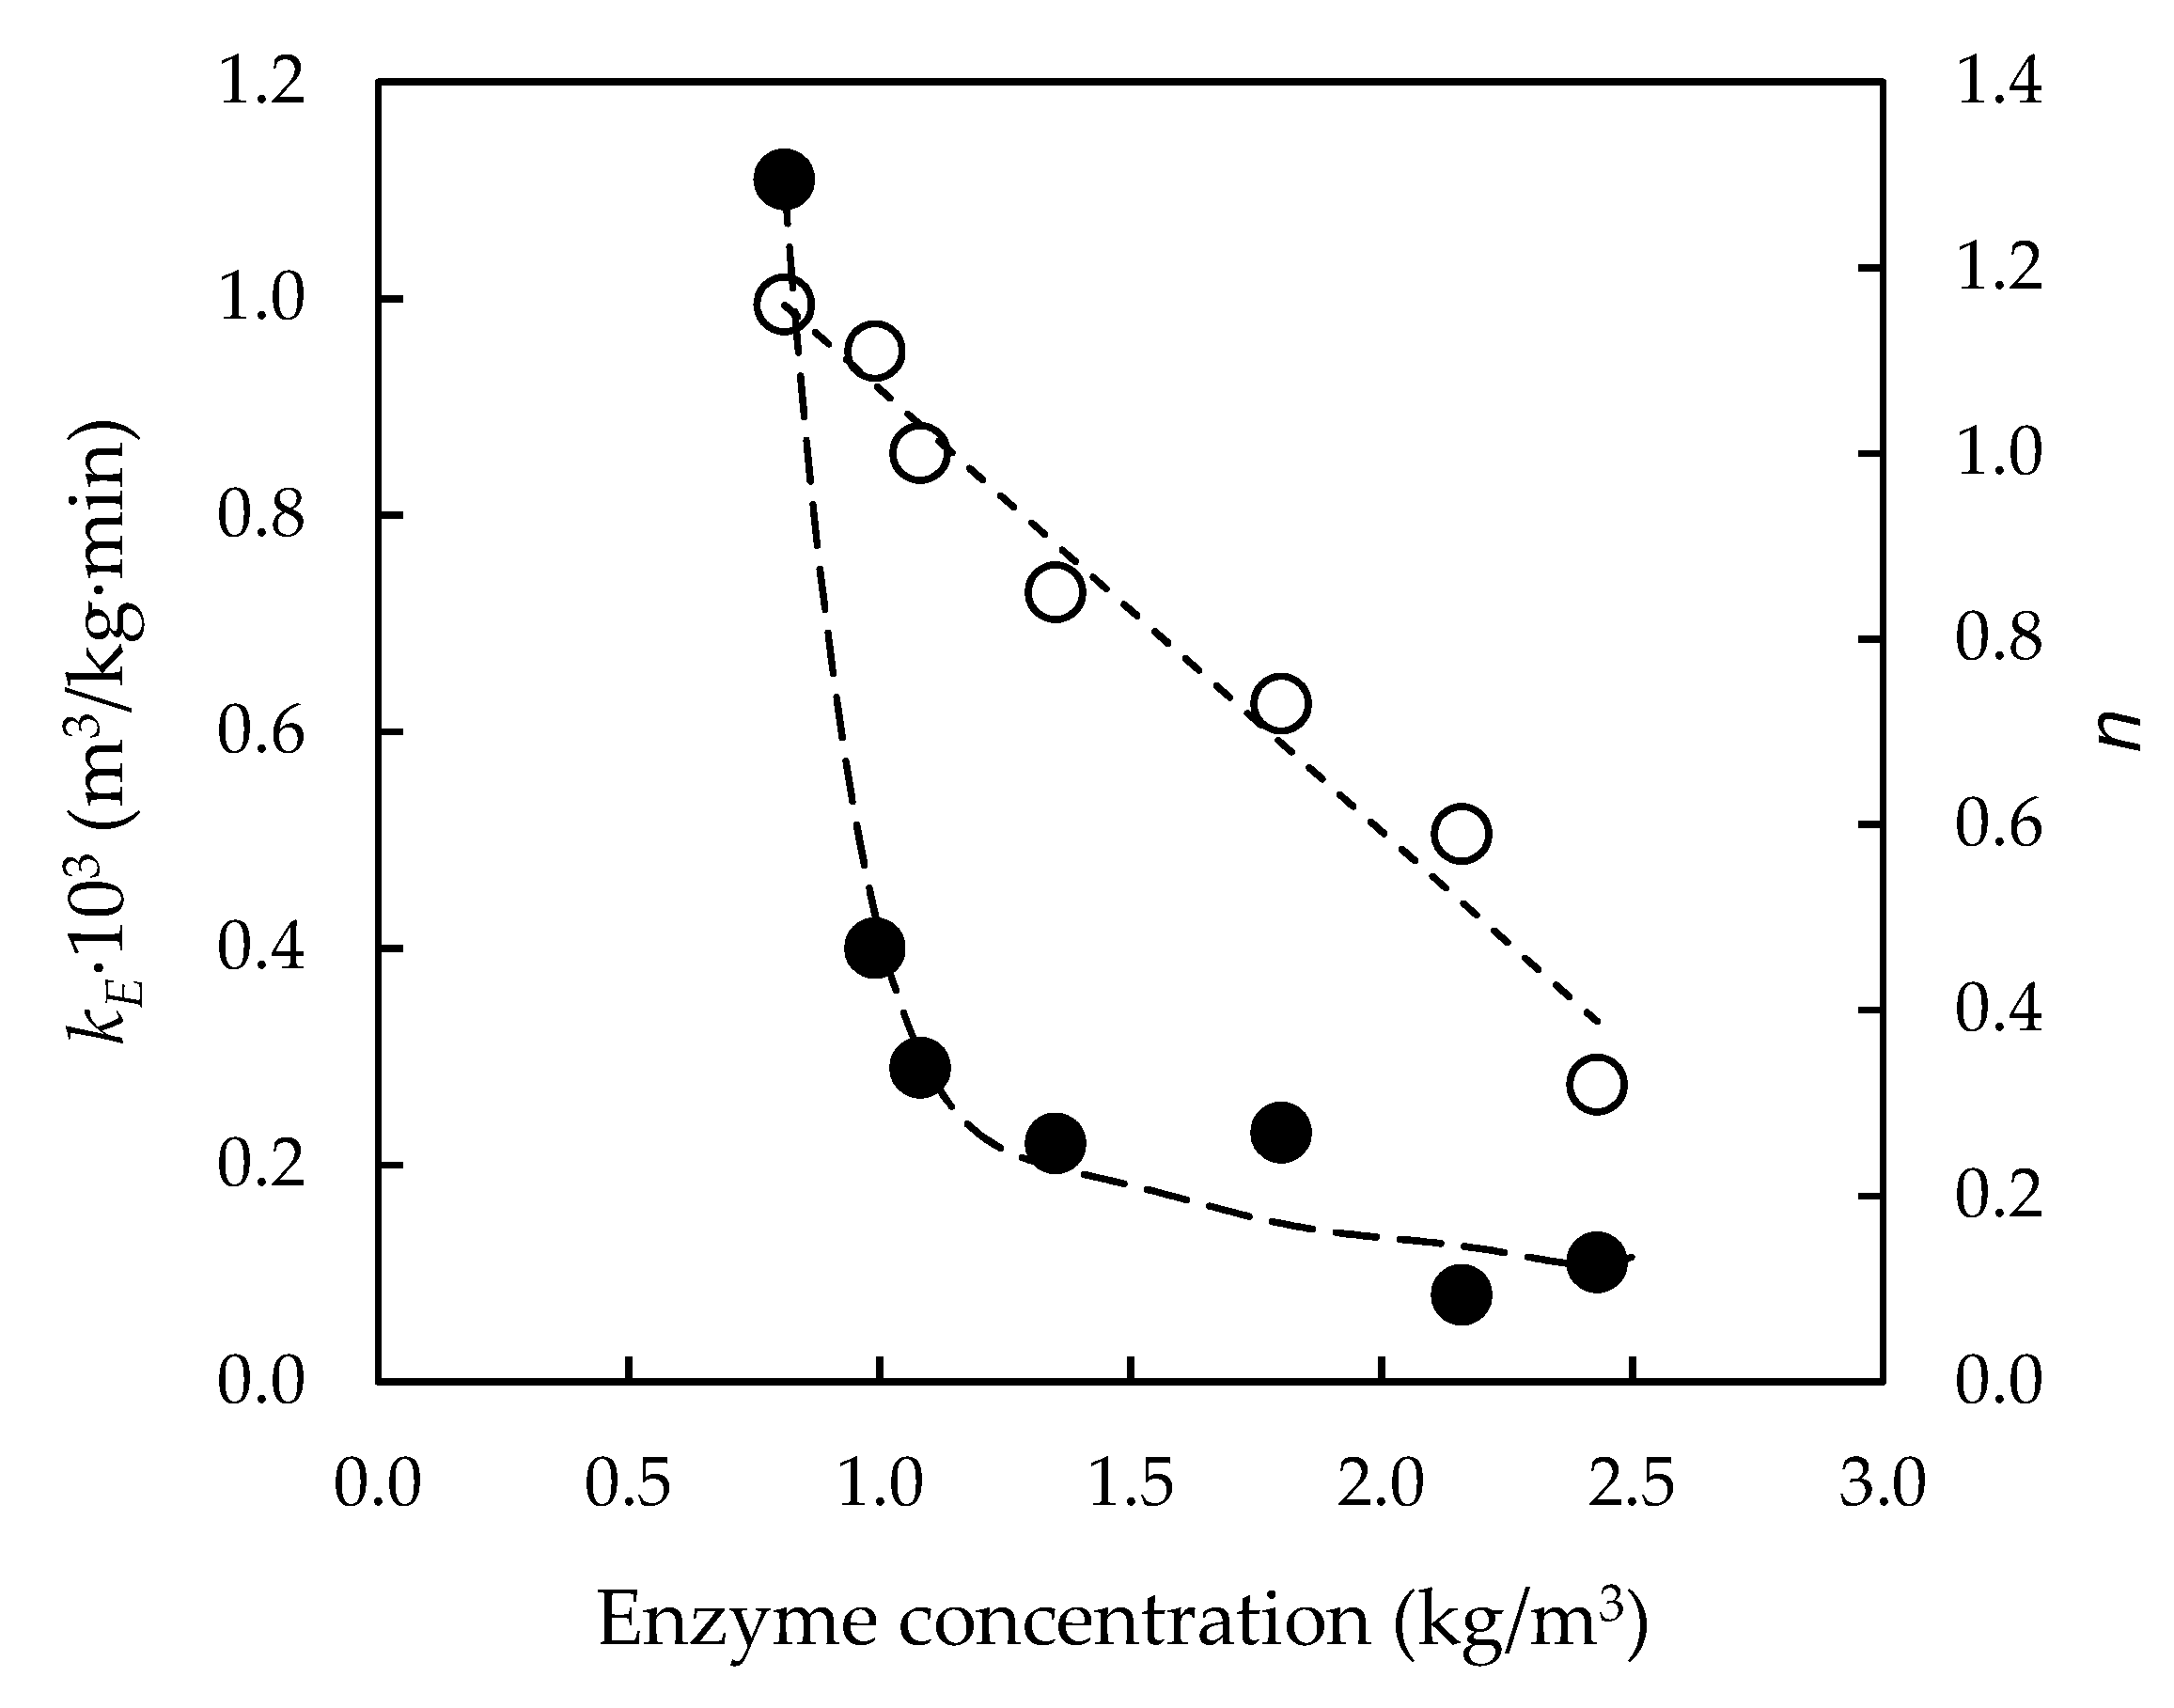
3.3. Effect of Initial Enzyme Concentration on Enzymatic Hydrolysis of Pre-Treated Slurries

Once the effect of the LHW pre-treatment severity on the enzymatic digestibility of pretreated cellulose was studied, a new set of experiments was performed, aiming to determine the effect of the addition of different loadings and types of enzyme (cellulases, β-glucosidase and hemicellulases) on the slurry pretreated at 225 °C for tpret = 0.
The mean value and the standard deviation of Log R0 for the seven LWH pre-treatments carried out in this set of experiments were 4.27 and 0.08, respectively. The enzymatic loadings used were those illustrated in Table 1 (from EL-1 to EL-7), while the d-glucose yields achieved and composition of the resulting solids from the enzymatic hydrolysis step are shown in Table 6. The percentage of hemicellulose in these solids is not shown because it was zero after all the LWH pre-treatments. Data collected from the first four experiments (from EL-1 to EL-4) showed that the increase in the cellulase loading (keeping the β-glucosidase loading constant) was responsible for a continuous increase, from 0.015 to 0.056 kg/kg, in d-glucose yield after 144 h of bioprocess, as a consequence of the hydrolysis of the cellulose fraction. As a result, the percentage of cellulose in the pretreated solid decreased, as a consequence of the enzymatic hydrolysis, from 28.5% to 8.0% and that of AIL increased from 50.8% to 61.4%. However, when comparing the results of EL-3 with those of EL-4, it was detected that a 100% increase in the cellulases loading barely increased the d-glucose yield (from 0.055 to 0.056 kg/kg). A similar impact was observed between EL-5 and EL-6, where a 100% increase in cellulase loading (without the presence of β-glucosidases) caused an increase of 10.1% in the d-glucose yield. On the other hand, Table 6 illustrates that the enzymatic hydrolysis carried out in the presence of cellulases, β-glucosidases and hemicellulases (EL-7) as well as cellulases and β-glucosidases (EL-3), were less effective for the production of d-glucose than those performed solely with cellulases (EL-5). The cellulase inhibition provoked by β-glucosidases and hemicellulases could account for this fact.
The release of d-glucose over 144 h for the enzymatic hydrolyses carried out with different enzyme loadings and types is depicted in Figure 4. Chrastil’s model could be applied to these data in order to modelling the d-glucose production. The parameters kE and n for the seven enzymatic hydrolyses performed are shown in Figure 5 as a function of the enzyme concentration. The increase in enzyme concentration was responsible for a decrease in both kE and n. The decrease in parameter n with the increase in CE0 could be due to steric repulsions produced among the globular structures of the proteins inside the solid biomass [20].

3.4. Fermentation of Enzymatic Hydrolysates with P. tannophilus

The hydrolysate that achieved the highest d-glucose yield from enzymatic hydrolysis (EL-6, YG = 0.065 kg/kg dry raw material) was subjected to fermentation with the non-traditional yeast P. tannophilus. The total reducing sugars’ yield after enzymatic hydrolysis (d-glucose, d-xylose, l-arabinose, etc.) was 0.271 kg per kg dry raw material, of which 0.106 kg/kg corresponded to sugars generated in the enzymatic hydrolysis, while the rest were sugars released in the LHW pre-treatment and which, therefore, were already in the slurry at the beginning of the enzymatic stage.
The evolution of the concentrations of total reducing sugars, d-glucose, acetic acid, ethanol, yeast biomass and xylitol over fermentation is illustrated in Figure 6. In relation to the analysed substrates, a rapid consumption of d-glucose was observed, so that d-glucose was barely detected after 48.5 h. Of note is that TRS uptake within the first 31.5 h (2.31 g/dm3) was very close to the d-glucose uptake in that period (2.01 g/dm3). By contrast, the rest of the sugars (included in the TRS measurement along with d-glucose) and acetic acid were assimilated more slowly by the yeast, and were not completely uptaken after 341.5 h of bioprocess. Other studies have already illustrated the ability of P. tannophilus to assimilate both d-xylose and acetic acid [6,9]. With regard to bioproducts, there was an increase in the concentrations of ethanol, biomass and xylitol over fermentation, although the ethanol began to be uptaken by the yeast after 246.5 h, which resulted in a drastic reduction in cell growth.
By analysing the growth curve of P. tannophilus during fermentation in greater detail, it was possible to verify the existence of a diauxic-type cell development: i.e., in the first stage, up to 31.5 h, the yeast develops through the almost exclusive uptake of d-glucose. The maximum specific growth rate in this phase (µm = 0.036 h−1) was obtained by fitting the experimental data to Equation (5)
x = x0·exp(µm·t)
where x0 stands for the initial biomass concentration and t is the fermentation time (Figure 7). Subsequently, between 48.5 and 126.5 h, the yeast adapted its metabolic system to the uptake of other substrates, which represented a second stage of slower cell growth and could be described by Equation (6)
x = c + b·t
where b stands for the biomass productivity (0.18 × 10⁻² kg/(m3·h)).

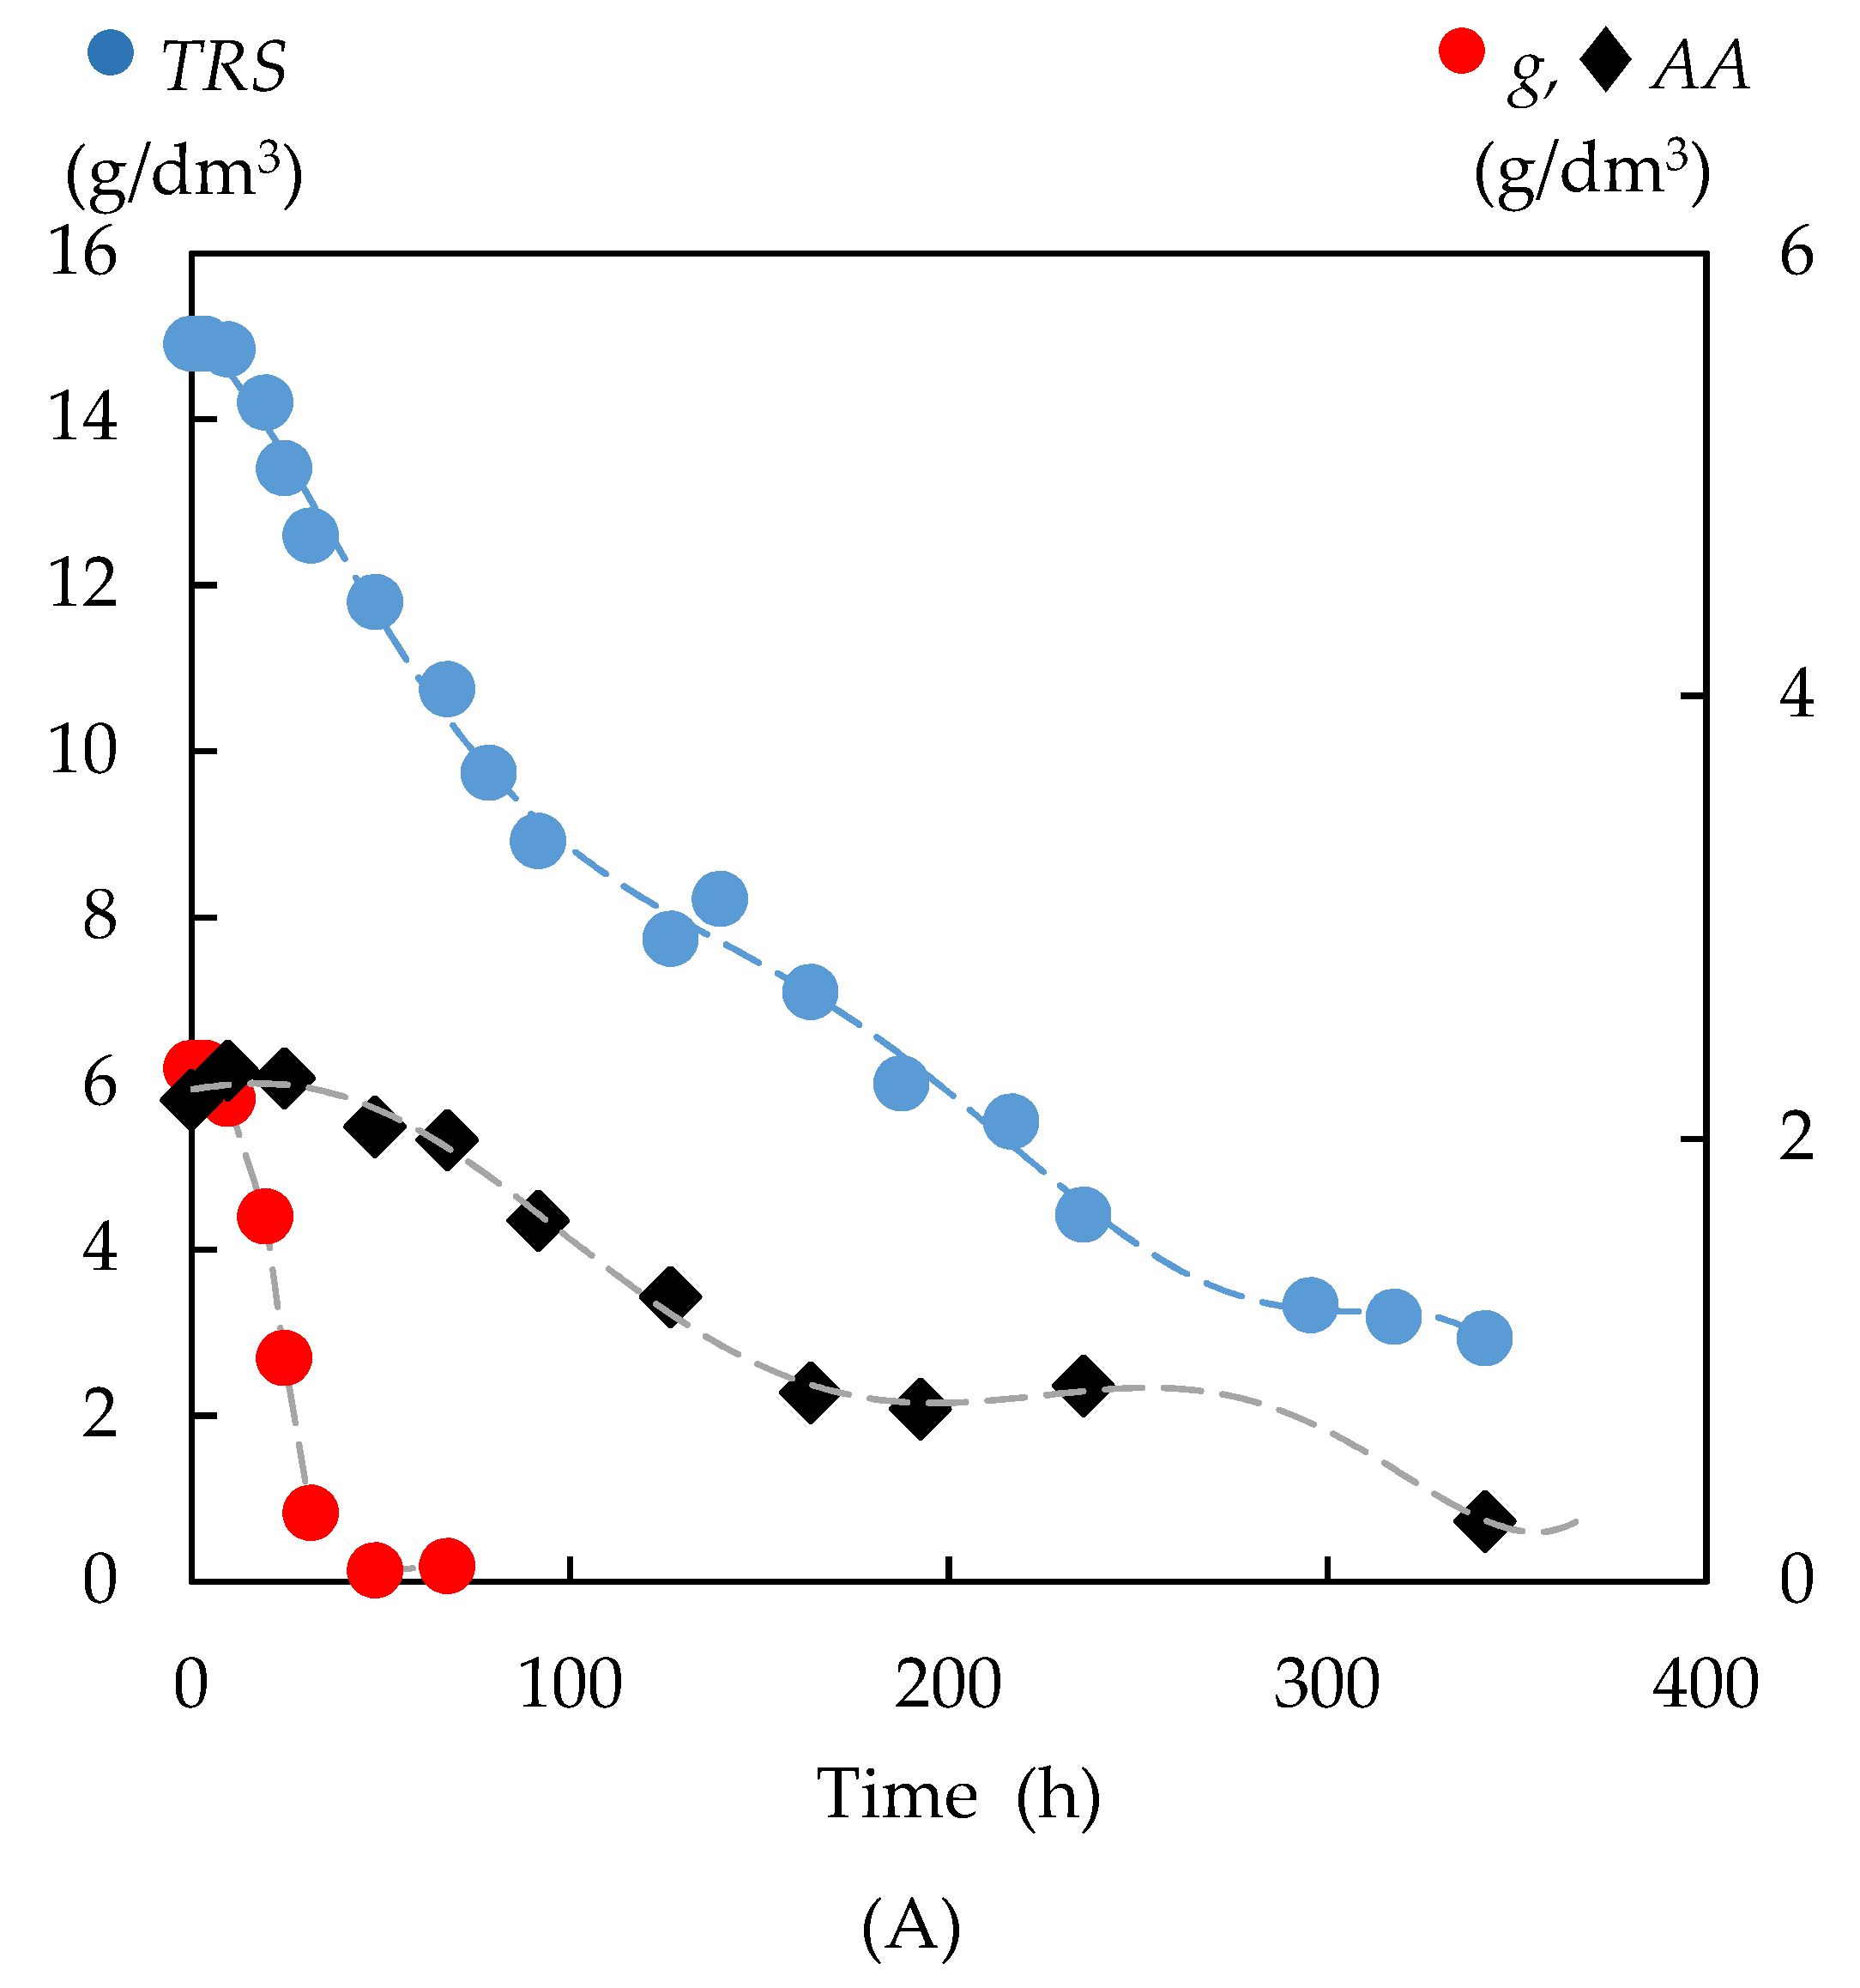
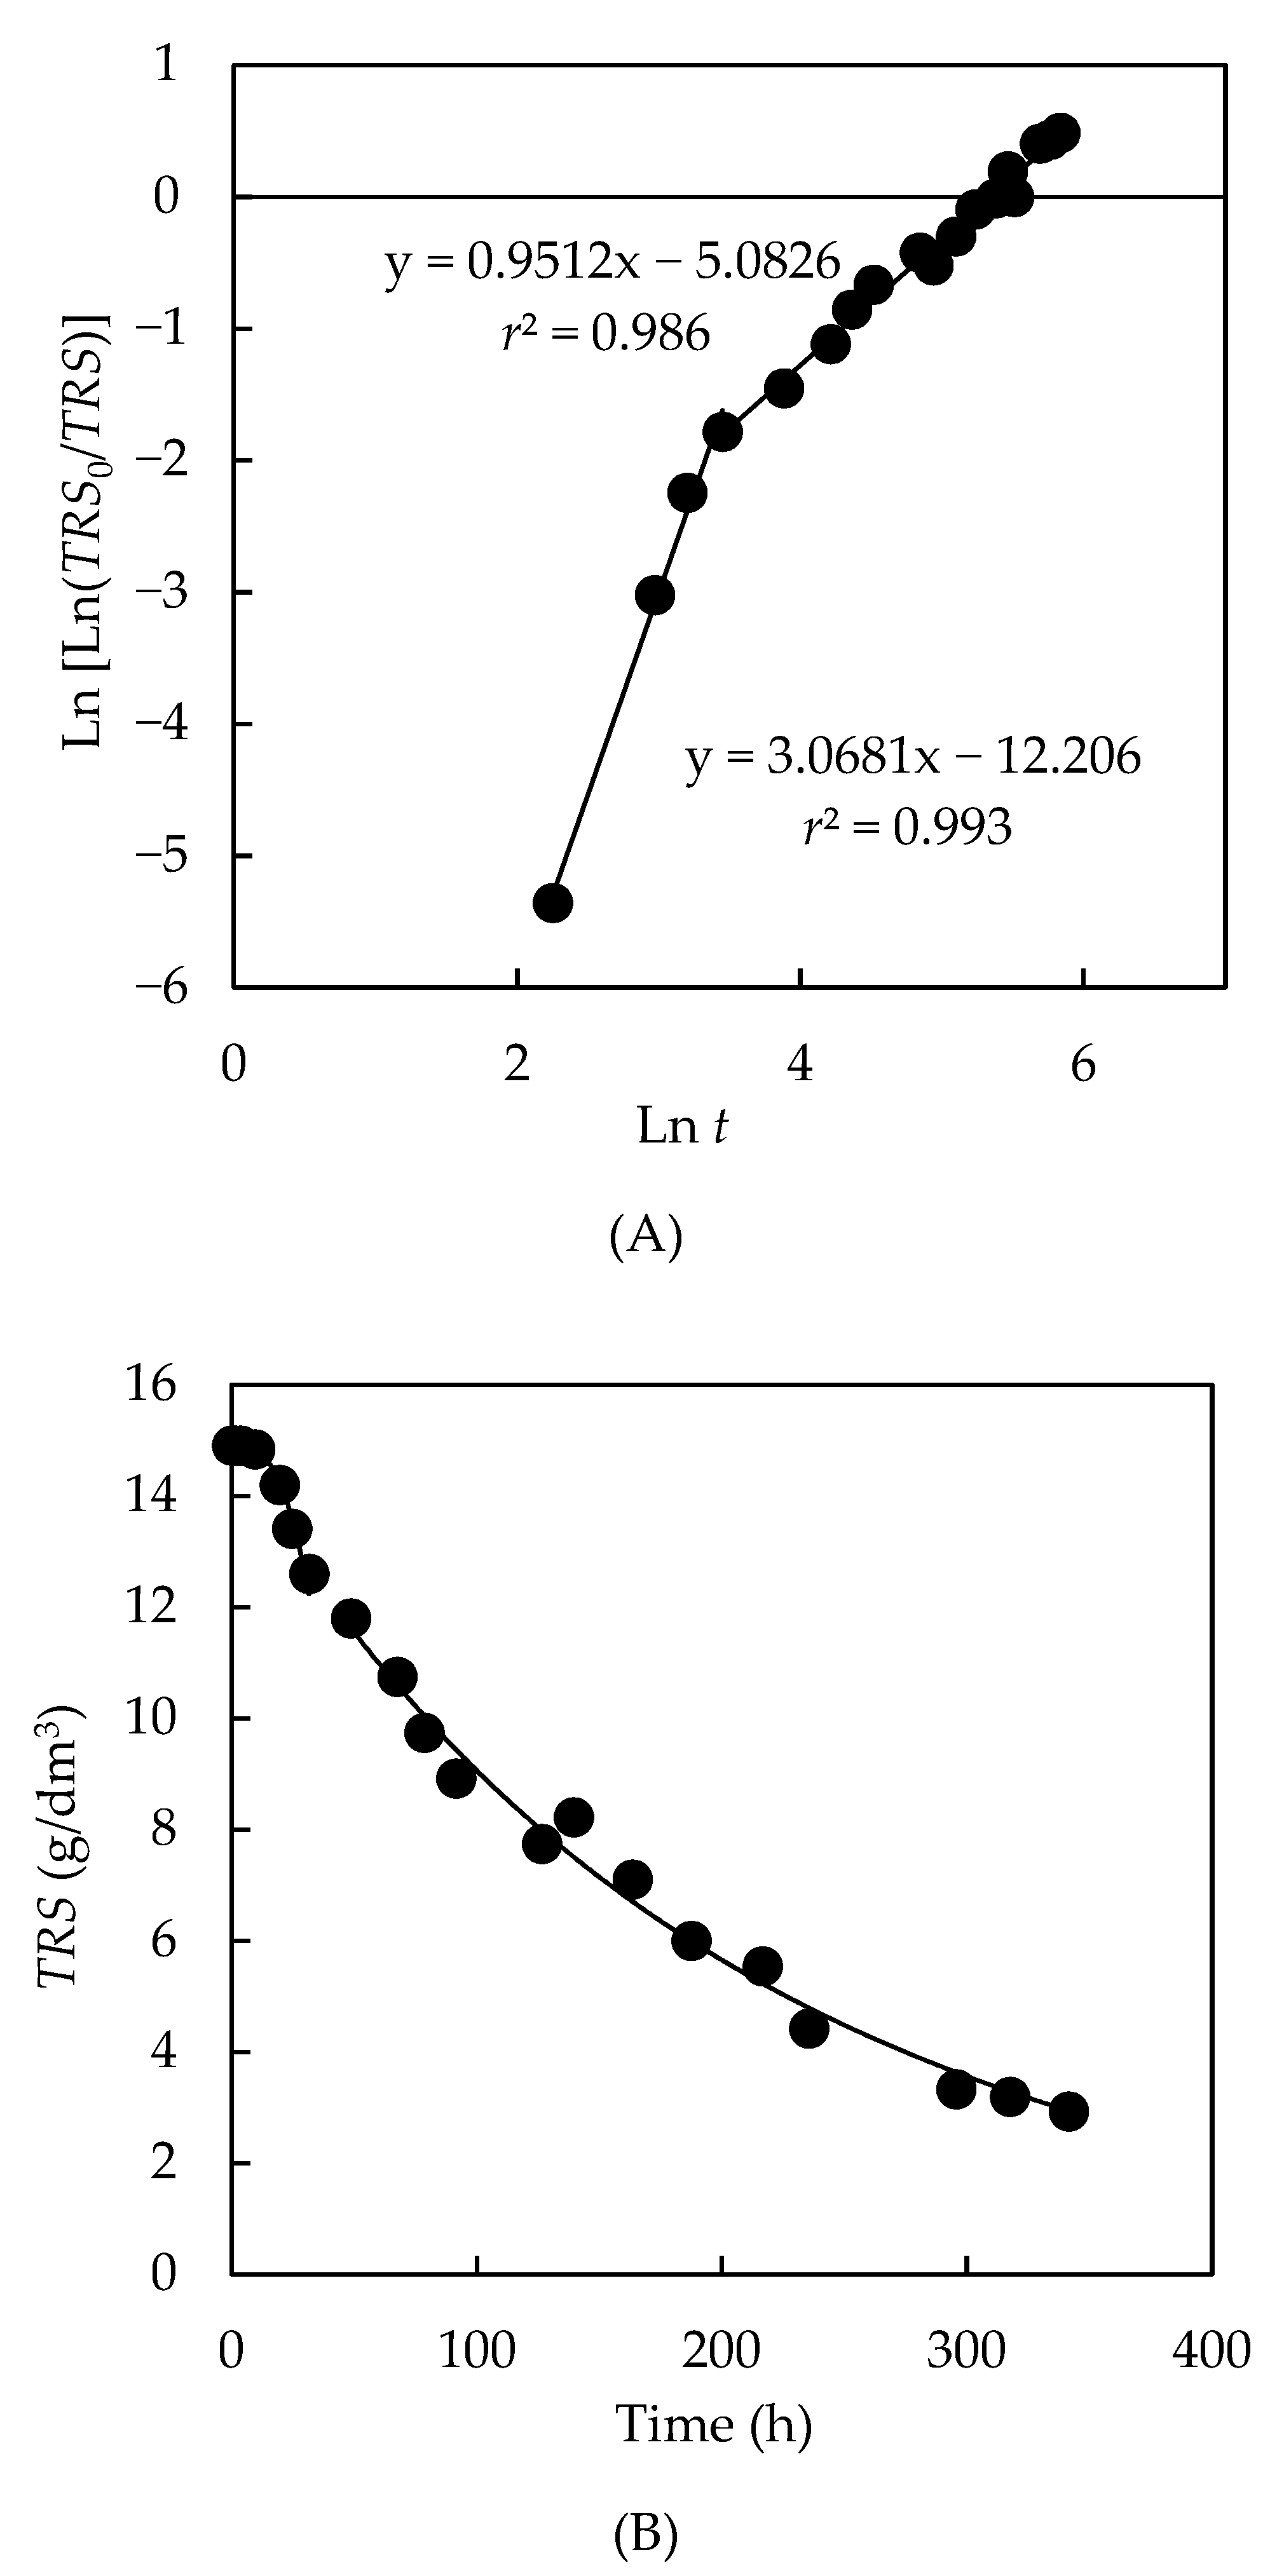
3.4.1. Kinetics of the Total Reducing Sugar Uptake

The differential and integral methods for data treatment were used to assess the kinetics of substrate uptake, as described in previous works [31,32]. To determine the specific substrate uptake rate (qs), it was assumed that the concentration of a substrate s changes over time, according to Equation (7).
s =   s 0 · α t β
where s0 is the initial substrate concentration, t is a given time, and α and β are parameters to experimentally determine. Equation (7) meets the requirement that s = s0 for t = 0.
From this equation, qs can be determined as a function of time. To determine the parameters α and β in Equation (7), the expression can be linearized so that the parameters α and β can be obtained from the representation of the first member against (ln t).
Two straight lines were obtained when plotting Ln (Ln (TRS0/TRS)) vs. Ln t (Figure 8A) in the assayed fermentation because of the sequential substrate uptake. As shown in Figure 8B, Equation (7) allowed for an accurate description of the evolution of TRS uptake over fermentation. The specific uptake rates of d-glucose and those of the rest of the total reducing sugars are illustrated in Table 7. It can be observed that the highest specific d-glucose uptake rate (0.403 kg/kg·h) was obtained at 20 h, while the specific uptake rates of the rest of TRS ranged between 0.091 and 0.027 kg/kg·h.

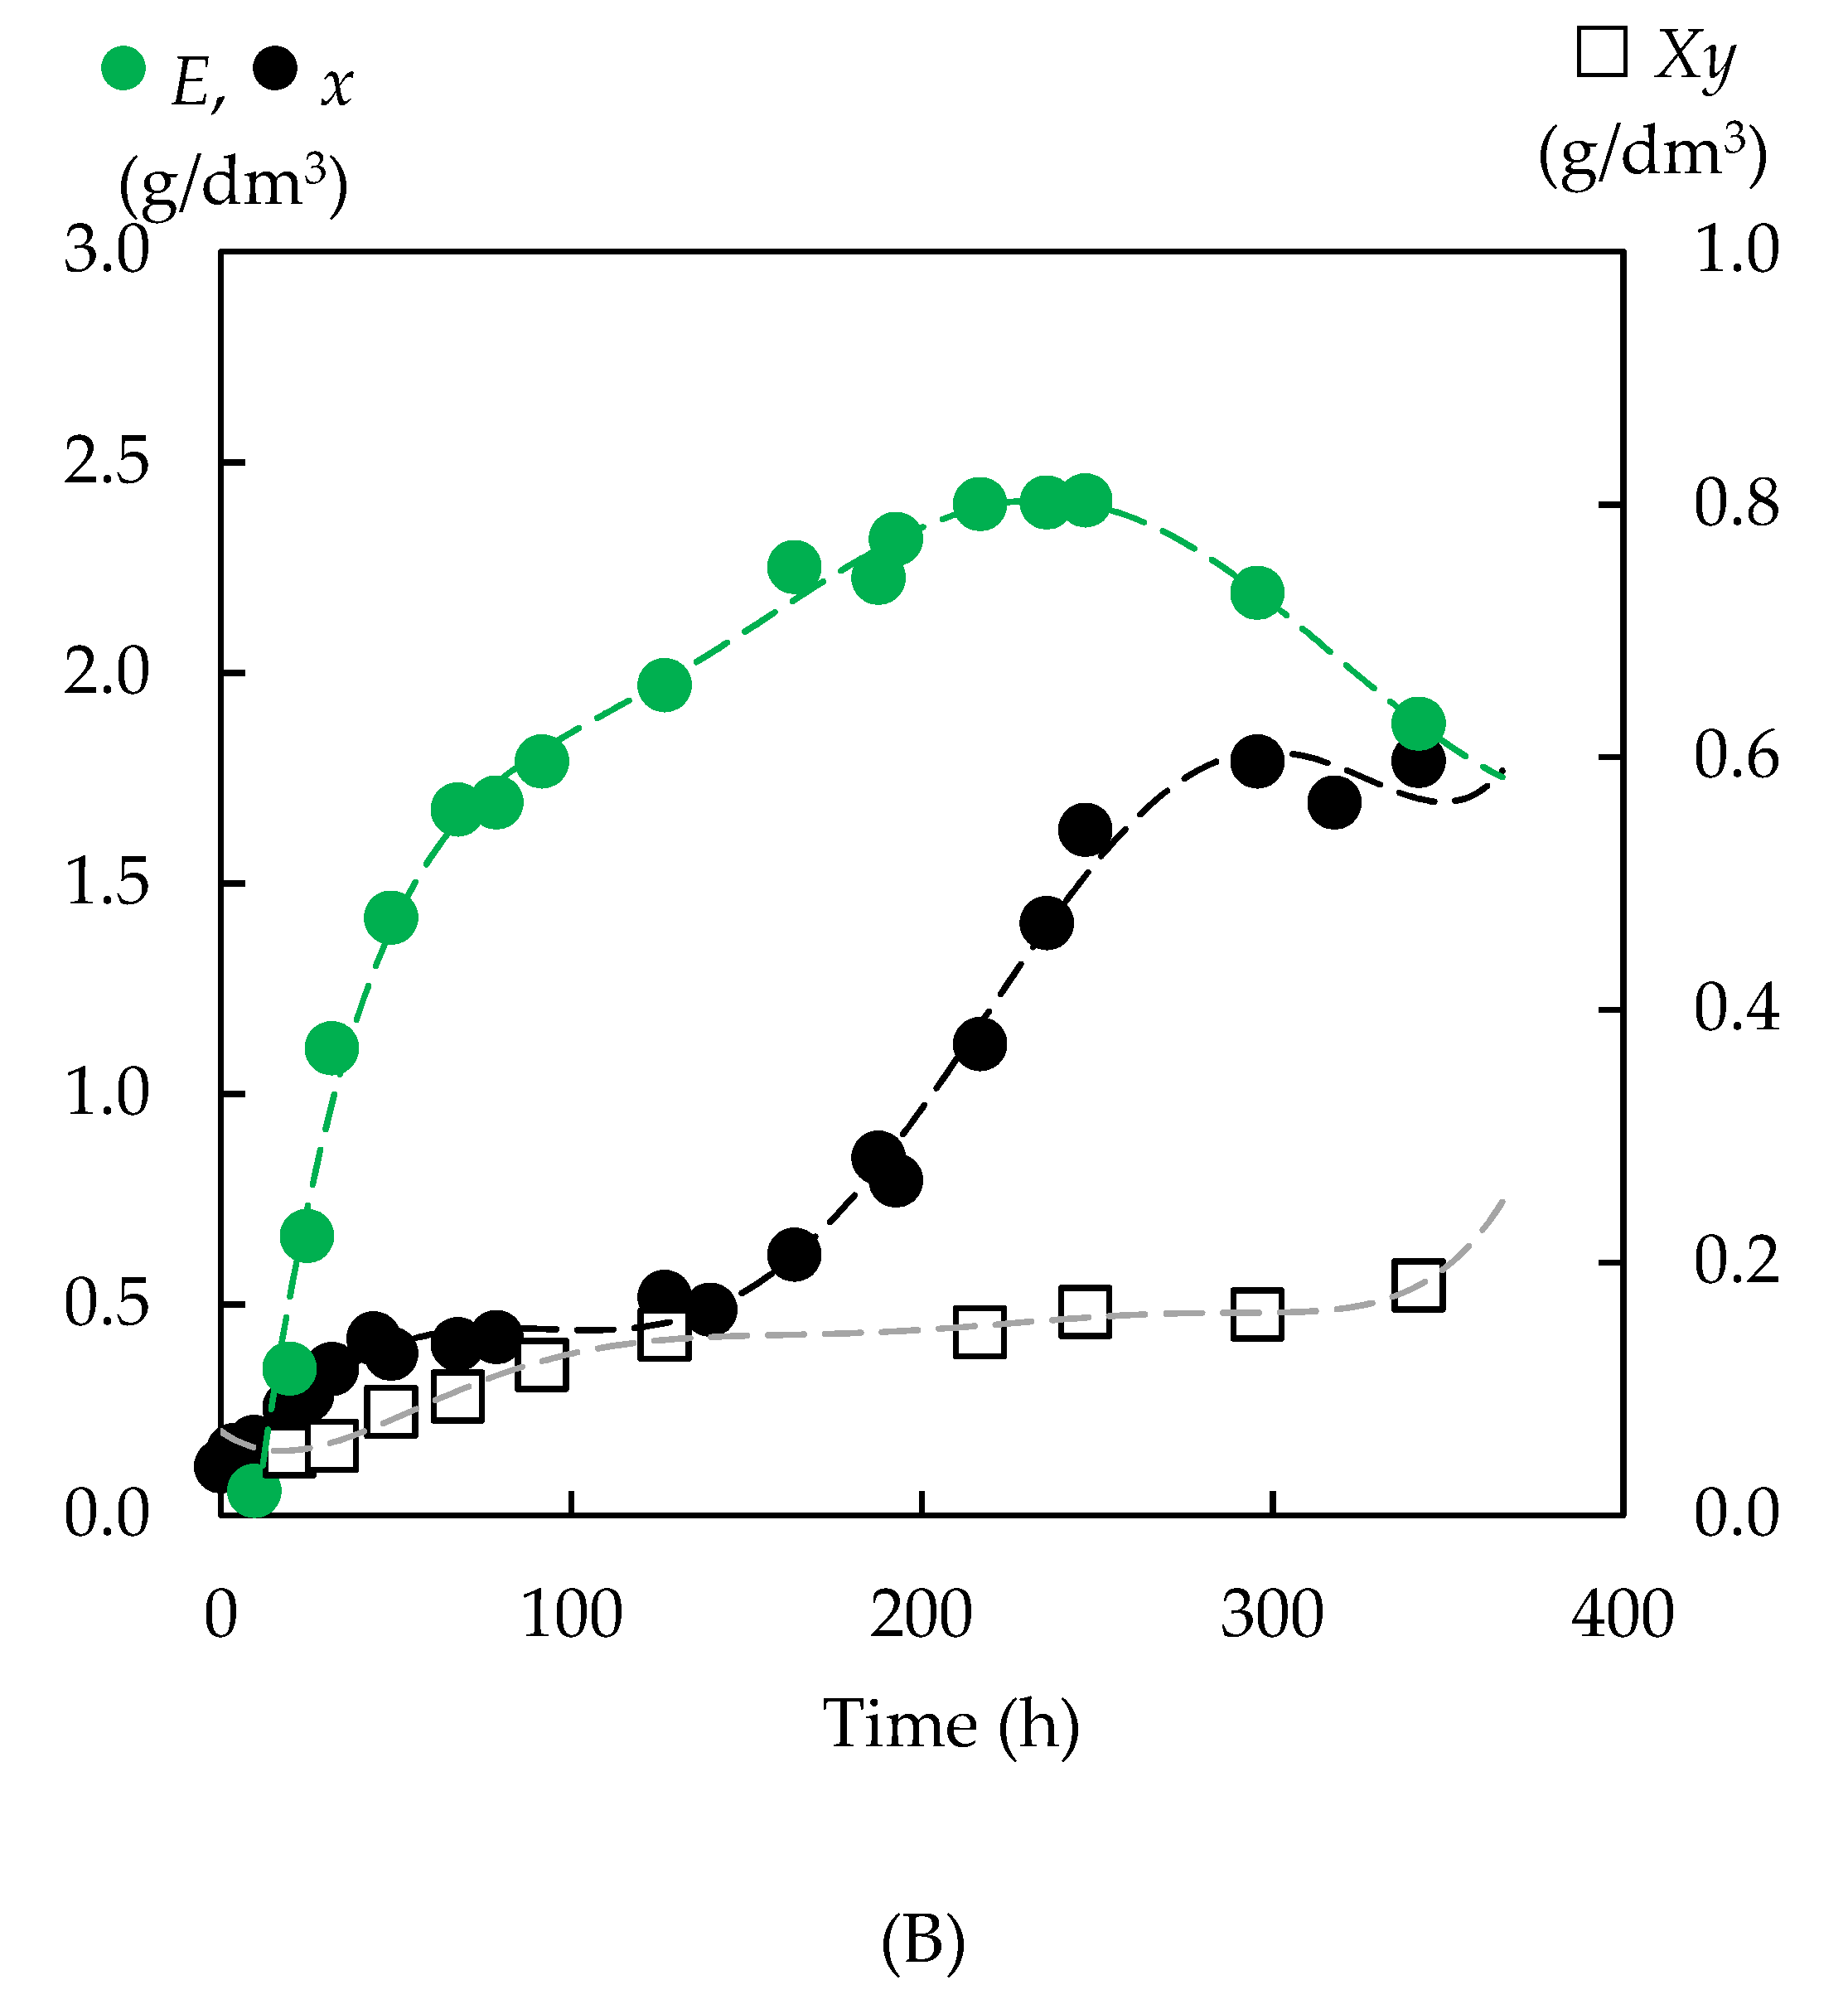
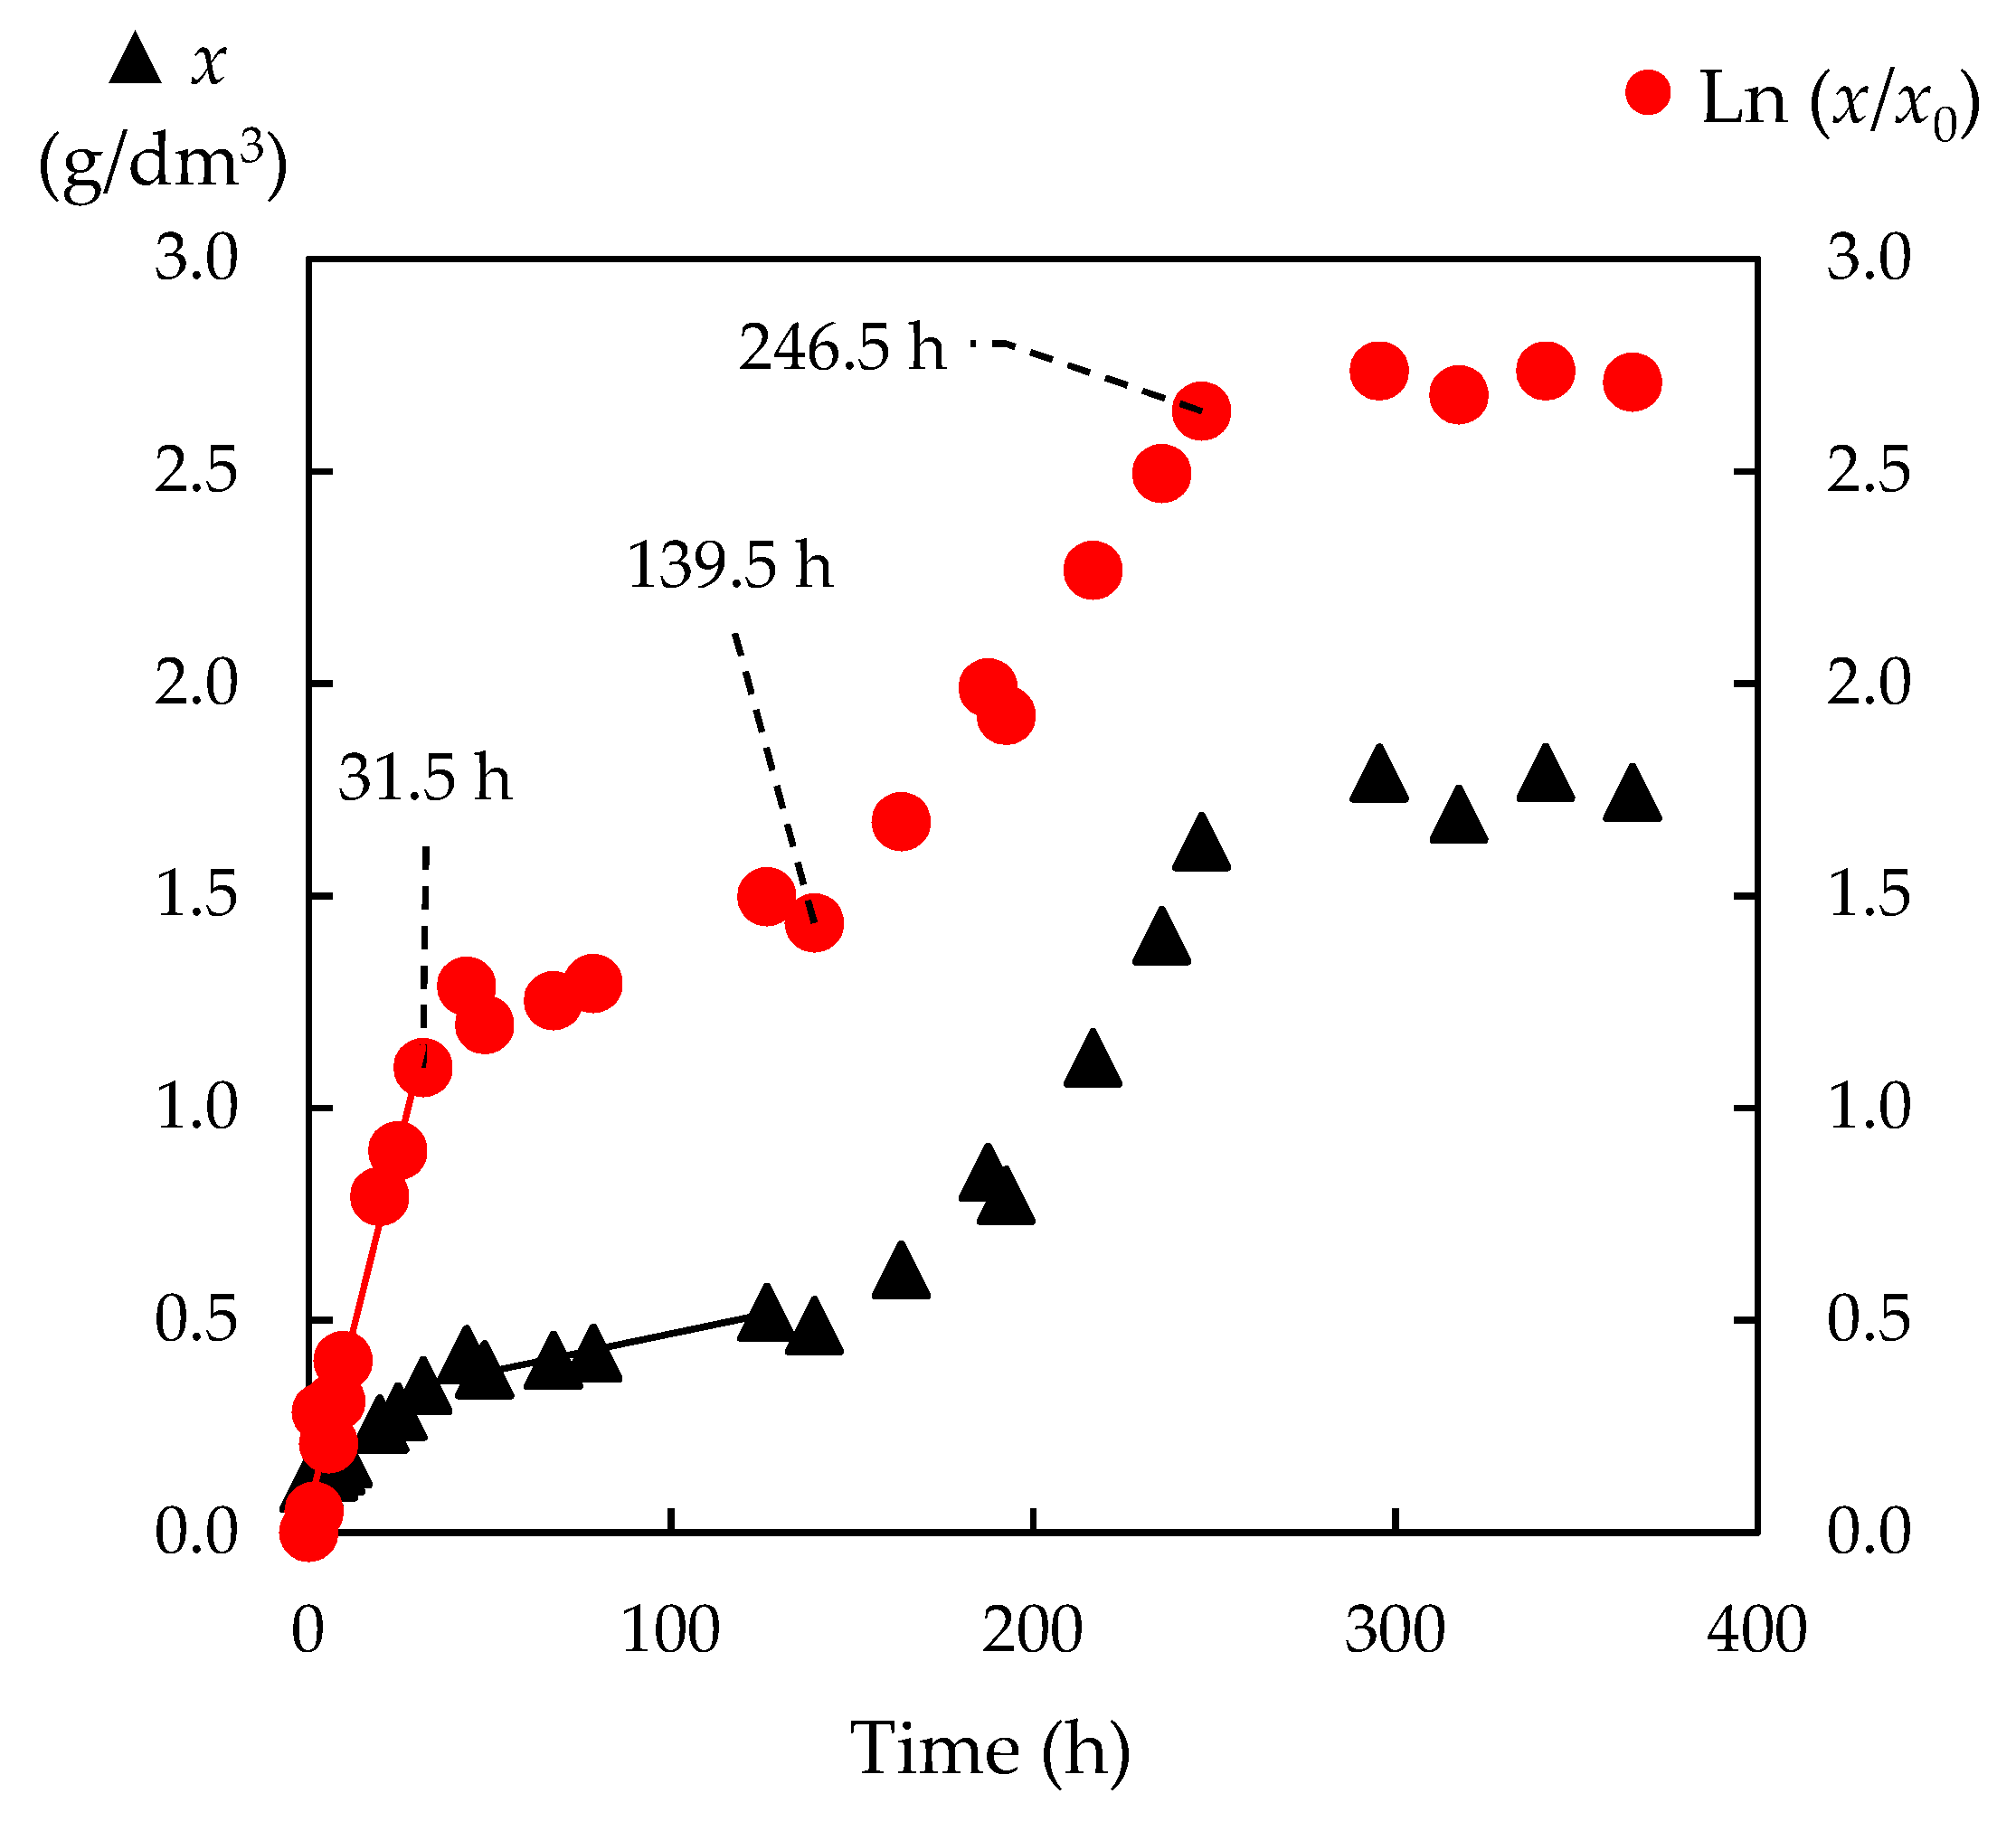
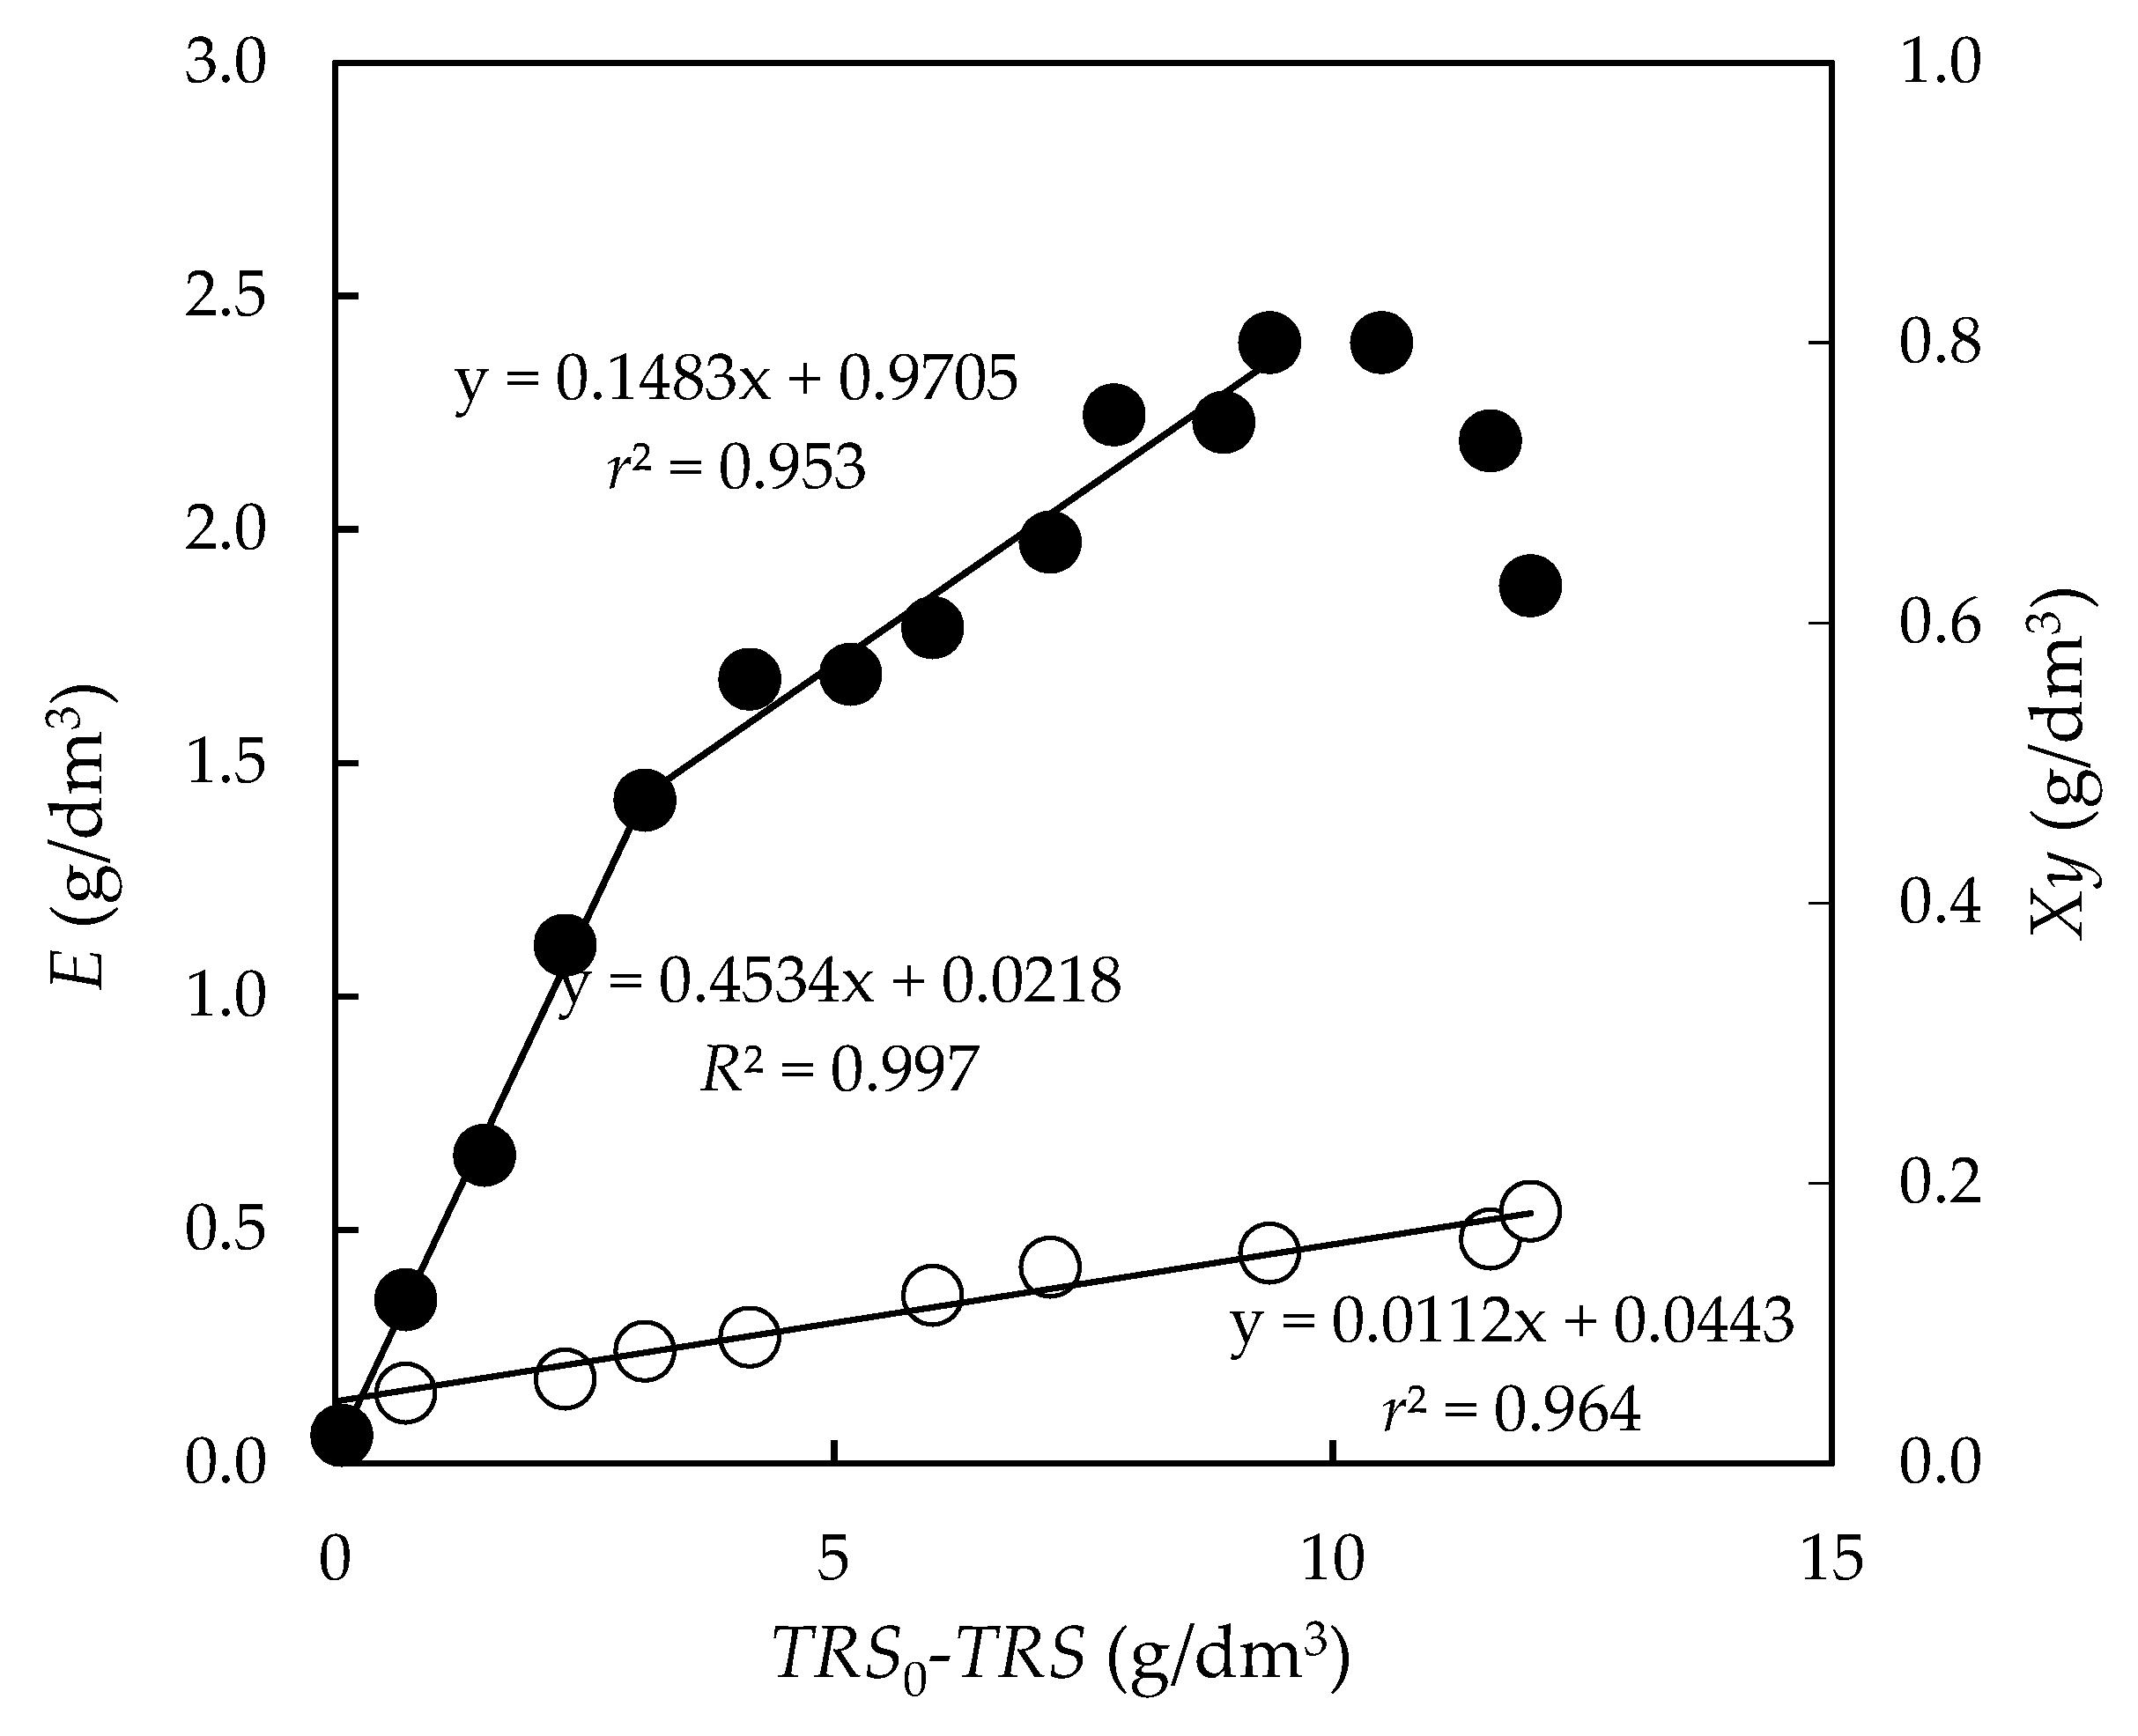
3.4.2. Biomass Yield

The biomass yield parameter expresses the amount of uptaken substrate that is transformed into biomass. Conditions should be sought that simultaneously promote low biomass yields and high bioproduct yields. The global biomass yields in fermentation were calculated, representing the concentration of biomass produced against the concentration of uptaken substrates (Figure 9). In the studied bioprocess, it was possible to calculate global biomass yield values referring to the uptake of total reducing sugars ( Y x / T R S G ) and to the consumption of both total reducing sugars and acetic acid ( Y x / ( T R S + A A ) G ). As seen in Figure 9, two practically coincident lines were obtained at low values of (x-x0) for both the aforementioned biomass yields, which allowed for the determination of a biomass yield referring to the uptake of d-glucose (0.11 kg biomass/kg d-glucose). After the consumption of hexose, two straight lines, practically parallel, were achieved, from which the values of Y x / T R S G = 0.27 kg/kg and of Y x / ( T R S + A A ) G = 0.25 kg/kg were calculated (Figure 9). The biomass yields calculated in the d-glucose uptake phase were considerably lower than those determined during the uptake of the rest of the substrates. This fact was pointed out by other authors when using the same yeast strain for the fermentation of enzymatic hydrolysates from olive-tree pruning [33].

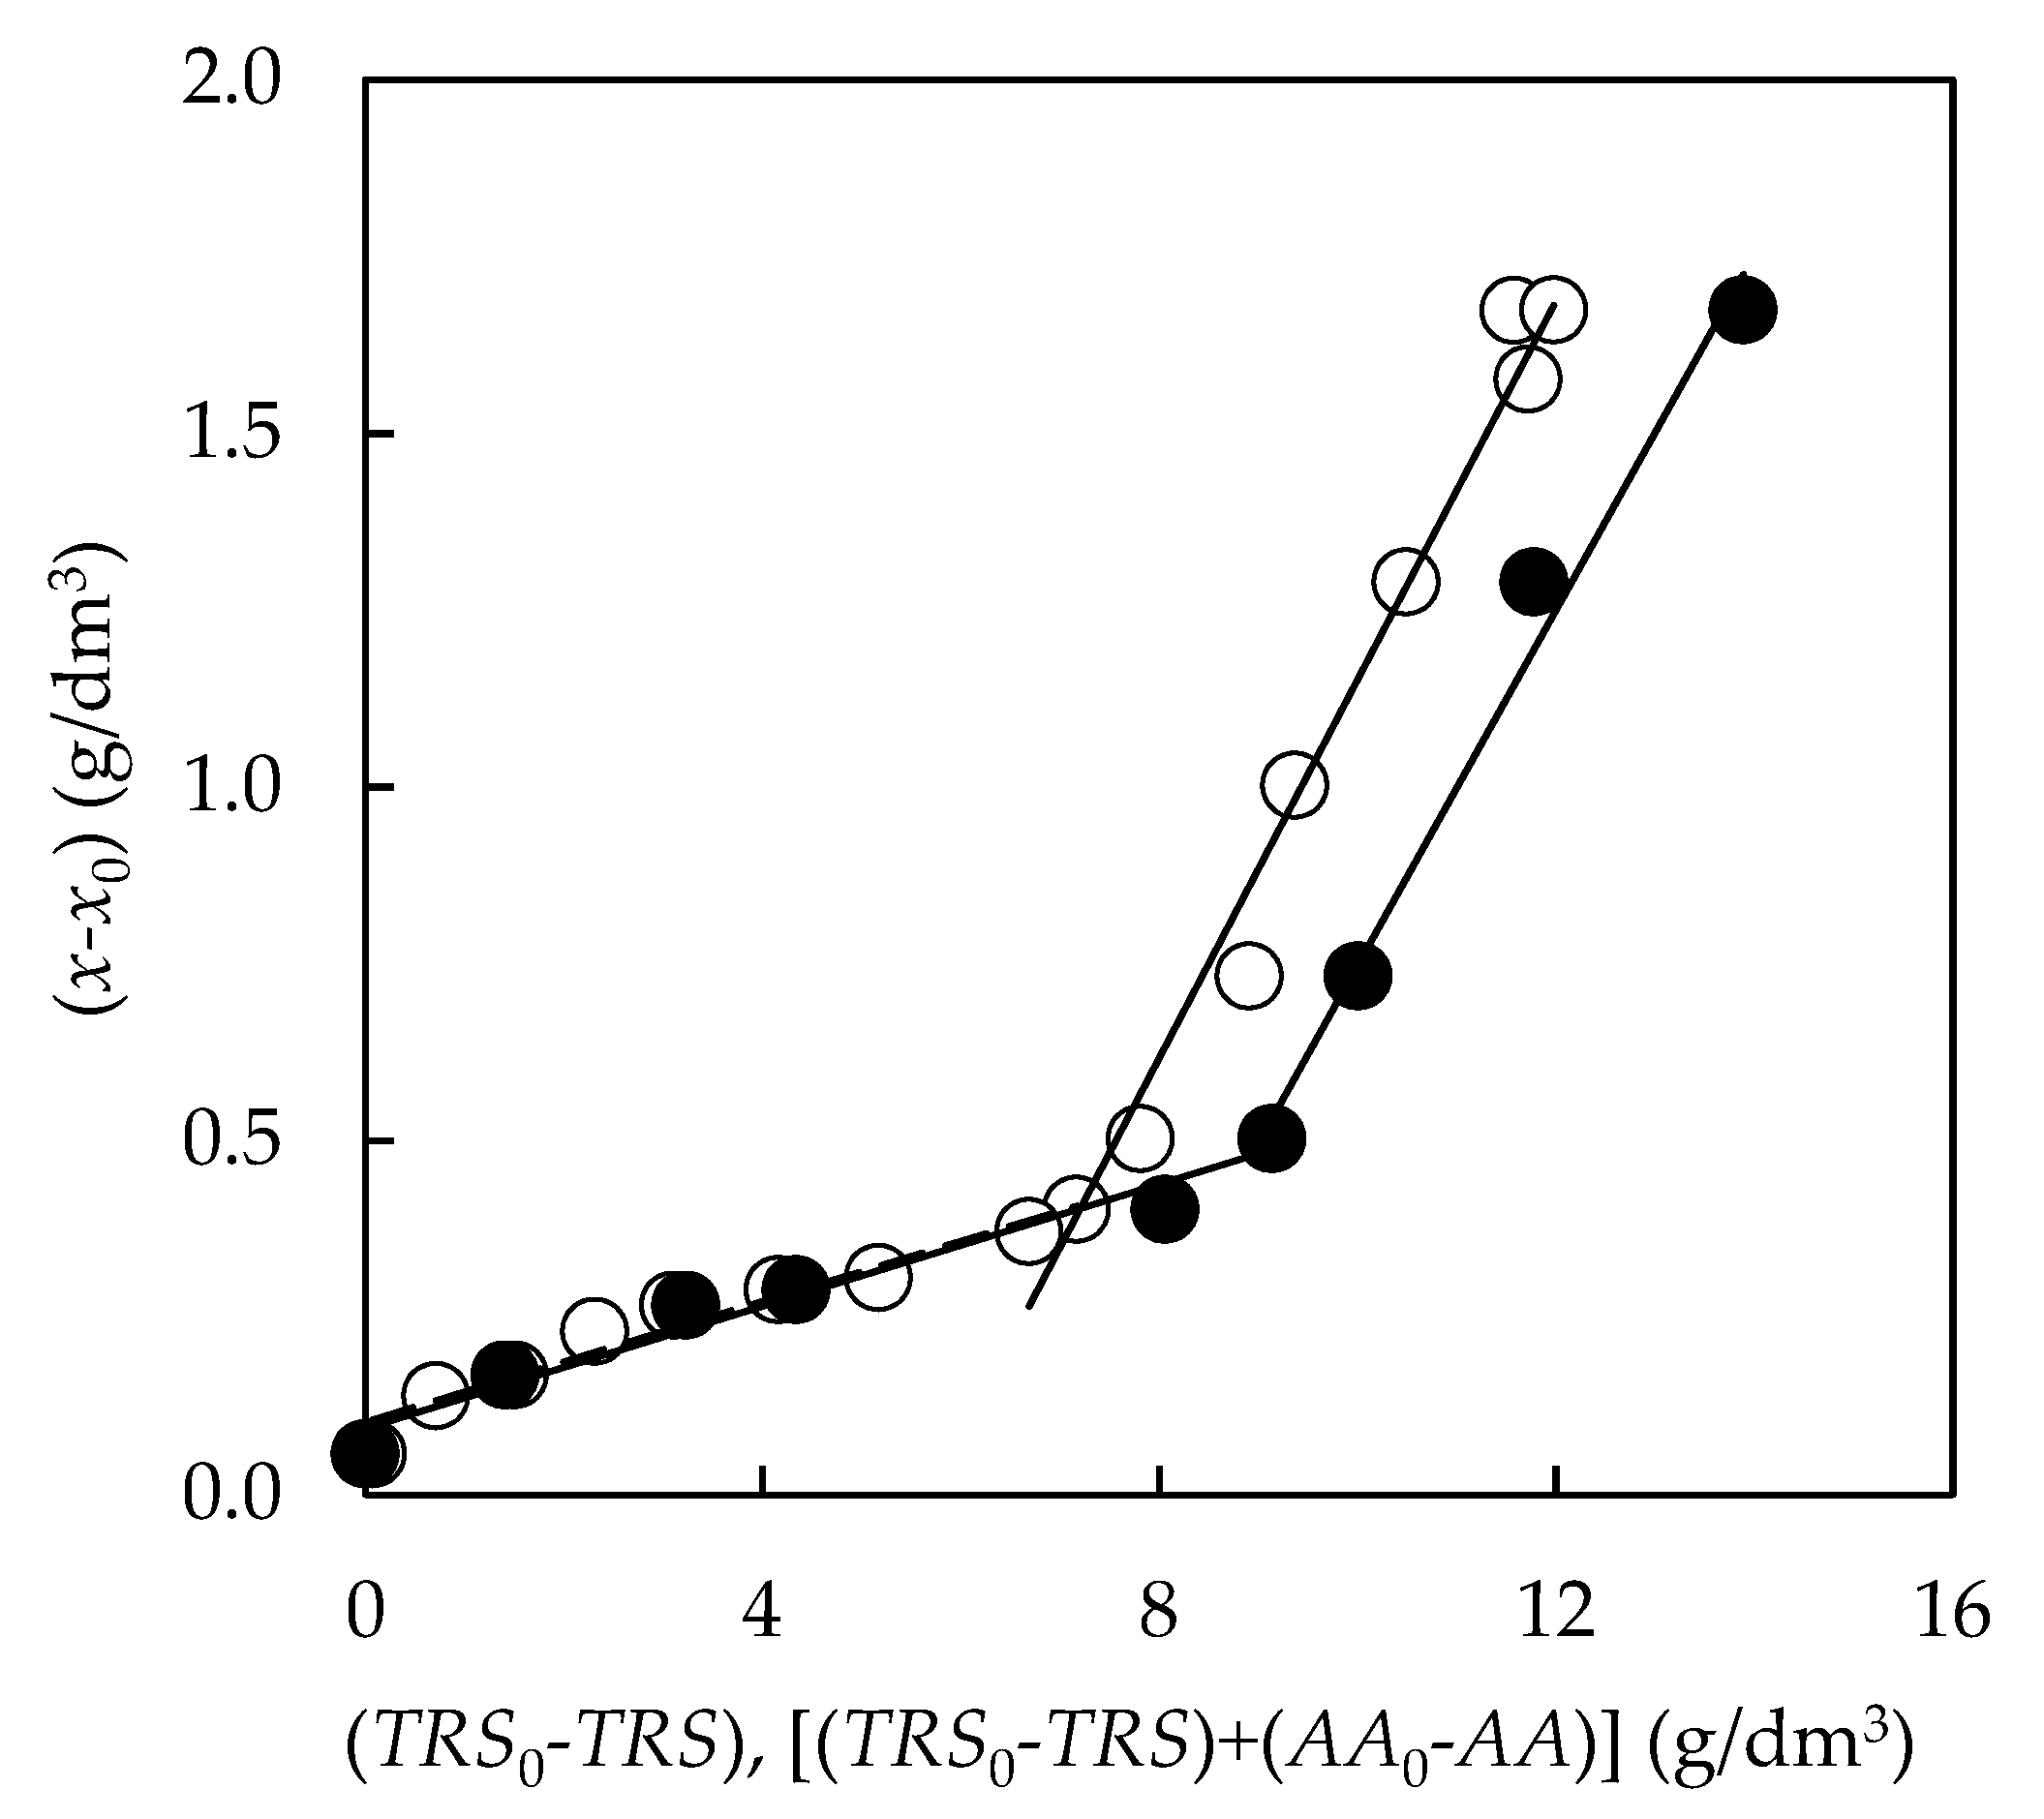
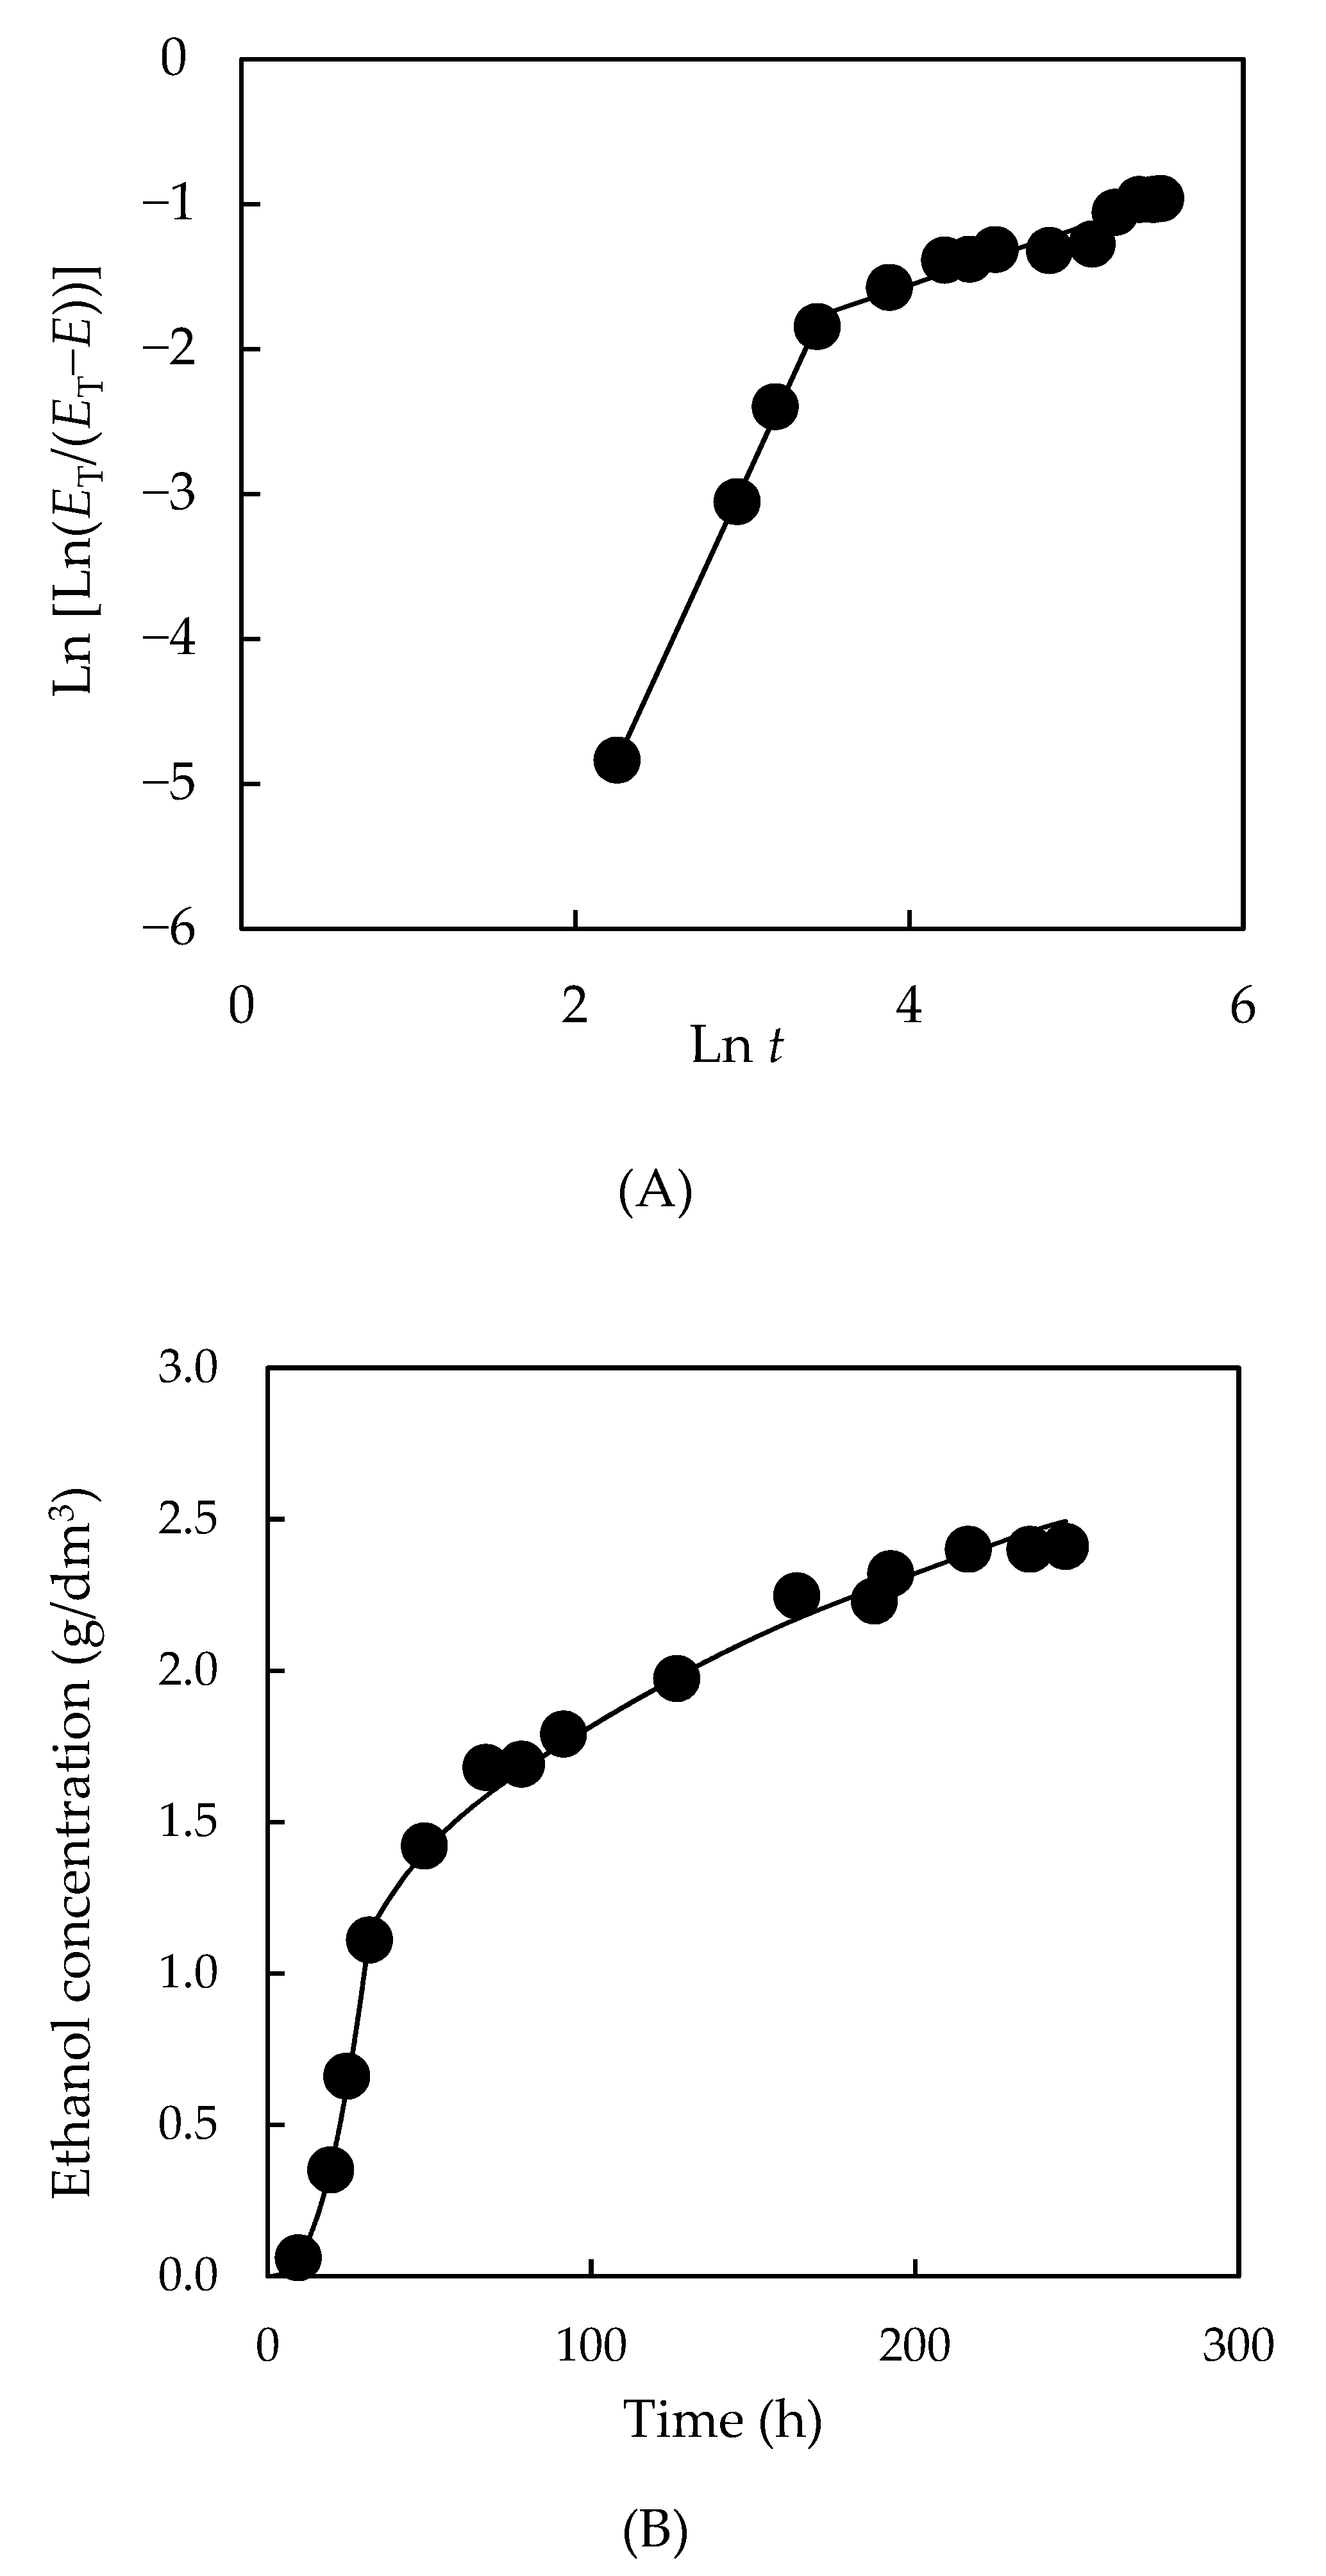
3.4.3. Formation of Bioproducts

To assess the ethanol production, it was considered that the concentration of the bioethanol (E) changed over fermentation according to Equation (8)
E T E T E =   A t B
where ET stands for the maximum attainable ethanol concentration based on the Gay–Lussac yield, while A and B are empirical parameters. From the linearization of Equation (8), Equation (9) is obtained.
L n [ L n ( E T E T E ) ]   = L n ( L n   A ) + ( B · L n   t )
It was observed that ethanol was generated differently depending on whether the yeast uptook d-glucose, which occurred in the first 31.5 h of the bioprocess, or the rest of the substrates (Figure 10A). From the calculated values of A and B, and applying Equation (6), it was possible to mathematically model the evolution of ethanol concentration during fermentation (Figure 10B).
On the other hand, the specific ethanol production rate was determined (differential method) from the values of A and B by applying Equation (10)
q E D = E T · B · L n A · t B 1 · A t B x
where x is the biomass concentration at a given time. The highest specific ethanol production rates calculated by the differential ( q E D ) and integral ( q E ) methods of treatment of kinetic data were quite similar (0.218 and 0.254 kg/kg·h, respectively) and were achieved in the d-glucose uptake stage.
Finally, the overall yields in ethanol ( Y E / s G ) and xylitol ( Y X y / s G ) were calculated from the representation of the concentrations of ethanol and xylitol against the concentration of uptaken substrates (Figure 11). The overall yield in xylitol was 0.01 kg per kg of substrate, while two stages with different yields were observed for the overall ethanol yield. In the first of them, Y E / s G reached 0.45 kg of ethanol per kg of consumed uptake, while in the second, Y E / s G was 0.15 kg of ethanol per kg of substrate. The former ethanol yield (0.45 kg/kg) is similar than those that can be achieved with Saccharomyces cerevisiae, the yeast that best ferments d-glucose to ethanol. S. cerevisiae reaches ethanol yields close to the maximum theoretical ethanol yield (0.51 kg ethanol/kg d-glucose) [2]. Thus, an average ethanol yield of 0.49 kg/kg glucose has been reported using the enzymatic hydrolysate from waste sorghum leaves as a substrate for fermentation with this yeast [34]. Notwithstanding, S. cerevisiae is not able to ferment pentoses (d-xylose and l-arabinose), which is its main hindrance for ethanol production from lignocellulose. These results indicate that while the efficiency in the transformation of d-glucose into ethanol is very high, the rest of the substrates (d-xylose, l-arabinose, acetic acid, etc.) are largely metabolized towards biomass production by P. tannophilus. Taking into account that d-glucose represents, at the beginning of fermentation, 15.5% of the total reducing sugars, an average ethanol yield of 0.20 kg of bioproduct per kg of TRS was obtained, which is equivalent to 6.4 dm3 ethanol for every 100 kg raw material. The yields achieved in this work are similar to those described in previous works when fermenting different lignocellulose hydrolysates with P. tannophilus [21,35].

4. Conclusions

The main conclusions derived from the experimental work carried out are:
(a) The conversion of olive stones into ethanol can be performed by applying a process with the following stages: reduction in the particle size of the biomass, pre-treatment with liquid hot water under pressure (LHW), enzymatic hydrolysis of the pre-treated slurry and, finally, the fermentation of enzymatic hydrolysate with the non-traditional yeast P. tannophilus. In this scheme, the d-glucose production in the enzymatic stage is strongly dependent on the severity of the LHW pre-treatment, as well as on the loading and nature of the enzymes used;
(b) The generation of d-glucose over the enzymatic hydrolysis of the pre-treated cellulose was modelled using the Chrastil’s model, which provides, through parameter n, the resistance of the solid structure to enzyme diffusion. In this sense, a relationship between the pre-treatment severity factor (Log R0) and the value of the parameter n has been established for the first time. In the case of olive stones, n reaches values close to 1 for Log R0 = 4.39;
(c) Two different stages were observed for both substrate uptake and biomass, and ethanol and xylitol production during the fermentation of the enzymatic hydrolysates with P. tannophilus. In the first stage, the yeast quickly assimilated the d-glucose from the culture producing ethanol and cellular material (biomass) with yields of 0.45 (close to the maximum theoretical ethanol yield) and 0.11 kg per kg uptaken substrate, respectively. In the second, slower stage, from 31.5 h of starting the culture, acetic acid and reducing sugars other than d-glucose were consumed, leading to an ethanol yield of 0.15 kg per kg of uptaken substrate, much lower than in the stage of d-glucose uptake.

Author Contributions

M.C. performed the experimental work and the analysis of the data, and contributed to the aspects related to the design of figures and writing the initial draft paper; J.F.G.M. performed the English translation, text and figures formatting and revision of the paper; V.B. contributed to the analysis of the data and revision of the paper. S.S. provided the funding, performed the experimental design, and contributed to the revision of the paper. All authors have read and agreed to the published version of the manuscript.

Funding

This work was funded the projects 01272/2005 and AGR/6509 granted by Andalusia Regional Government (Spain).

Acknowledgments

The authors wish to thank the olive oil mil S.C.A. San Juan (Spain) for providing the olive stones used in this research.

Conflicts of Interest

The authors declare no conflict of interest.

References

  1. Rodríguez, G.; Lama, A.; Rodríguez, R.; Jiménez, A.; Guillén, R.; Fernández-Bolaños, J. Olive stone an attractive source of bioactive and valuable compounds. Bioresour. Technol. 2008, 99, 5261–5269. [Google Scholar] [CrossRef] [PubMed]
  2. García Martín, J.F.; Cuevas, M.; Feng, C.H.; Mateos, P.Á.; García, M.T.; Sánchez, S. Energetic valorisation of olive biomass: Olive-tree pruning, olive stones and pomaces. Processes 2020, 8, 511. [Google Scholar] [CrossRef]
  3. Mata-Sánchez, J.; Pérez-Jiménez, J.A.; Díaz-Villanueva, M.J.; Serrano, A.; Núñez-Sánchez, N.; López-Giménez, F.J. Statistical evaluation of quality parameters of olive stone to predict its heating value. Fuel 2013, 113, 750–756. [Google Scholar] [CrossRef]
  4. Ministerio de Agricultura Pesca y Alimentación. Encuesta Sobre Superficies y Rendimientos Cultivos. Available online: https://servicio.mapama.gob.es/ (accessed on 15 January 2021).
  5. Cuevas, M.; Sánchez, S.; Bravo, V.; García, J.F.; Baeza, J.; Parra, C.; Freer, J. Determination of optimal pre-treatment conditions for ethanol production from olive-pruning debris by simultaneous saccharification and fermentation. Fuel 2010, 89, 2891–2896. [Google Scholar] [CrossRef]
  6. Cuevas, M.; Saleh, M.; García-Martín, J.F.; Sánchez, S. Acid and enzymatic fractionation of olive stones for ethanol production using Pachysolen tannophilus. Processes 2020, 8, 195. [Google Scholar] [CrossRef] [Green Version]
  7. Saleh, M.; Cuevas, M.; García, J.F.; Sánchez, S. Valorization of olive stones for xylitol and ethanol production from dilute acid pretreatment via enzymatic hydrolysis and fermentation by Pachysolen tannophilus. Biochem. Eng. J. 2014, 90, 286–293. [Google Scholar] [CrossRef]
  8. Cuevas, M.; Sánchez, S.; García, J.F.; Baeza, J.; Parra, C.; Freer, J. Enhanced ethanol production by simultaneous saccharification and fermentation of pretreated olive stones. Renew. Energy 2015, 74, 839–847. [Google Scholar] [CrossRef]
  9. Cuevas, M.; Sánchez, S.; Bravo, V.; Cruz, N.; García, J.F. Fermentation of enzymatic hydrolysates from olive stones by Pachysolen tannophilus. J. Chem. Technol. Biotechnol. 2009, 84, 461–467. [Google Scholar] [CrossRef]
  10. Cuevas, M.; García, J.F.; Cruz, N.; Sanchez, S. Generation of d-xylose by hydrothermal treatment of olives endocarps and enzymatic hydrolysis of oligosaccharides. Afinidad 2013, 70, 99–106. [Google Scholar]
  11. Cuevas, M.; García, J.F.; Hodaifa, G.; Sánchez, S. Oligosaccharides and sugars production from olive stones by autohydrolysis and enzymatic hydrolysis. Ind. Crops Prod. 2015, 70, 100–106. [Google Scholar] [CrossRef]
  12. Fernández-Bolaños, J.; Felizón, B.; Heredia, A.; Rodríguez, R.; Guillén, R.; Jiménez, A. Steam-explosion of olive stones: Hemicellulose solubilization and enhancement of enzymatic hydrolysis of cellulose. Bioresour. Technol. 2001, 79, 53–61. [Google Scholar] [CrossRef]
  13. Fernández-Bolaños, J.; Felizón, B.; Heredia, A.; Guillén, R.; Jiménez, A. Characterization of the lignin obtained by alkaline delignification and of the cellulose residue from steam-exploded olive stones. Bioresour. Technol. 1999, 68, 121–132. [Google Scholar] [CrossRef]
  14. Cano, M.E.; García-Martin, A.; Morales, P.C.; Wojtusik, M.; Santos, V.E.; Kovensky, J.; Ladero, M. Production of oligosaccharides from agrofood wastes. Fermentation 2020, 6, 31. [Google Scholar] [CrossRef] [Green Version]
  15. García, J.F.; Sánchez, S.; Bravo, V.; Rigal, L.; Cuevas, M. Acid hydrolysis of olive-pruning debris for d-xylose production. Collect. Czechoslov. Chem. Commun. 2008, 73, 637–648. [Google Scholar] [CrossRef]
  16. Overend, R.P.; Chornet, E. Fractionation of lignocellulosics by steam-aqueous pretreatments. Philos. Trans. R. Soc. London. Ser. A Math. Phys. Sci. 1987, 321, 523–536. [Google Scholar]
  17. Fillat, Ú.; Ibarra, D.; Eugenio, M.E.; Moreno, A.D.; Tomás-Pejó, E.; Martín-Sampedro, R. Laccases as a potential tool for the efficient conversion of lignocellulosic biomass: A review. Fermentation 2017, 3, 17. [Google Scholar] [CrossRef]
  18. Offei, F.; Mensah, M.; Thygesen, A.; Kemausuor, F. Seaweed bioethanol production: A process selection review on hydrolysis and fermentation. Fermentation 2018, 4, 99. [Google Scholar] [CrossRef] [Green Version]
  19. Chrastil, J. Enzymic product formation curves with the normal or diffusion limited reaction mechanism and in the presence of substrate receptors. Int. J. Biochem. 1988, 20, 683–693. [Google Scholar] [CrossRef]
  20. Carrillo, F.; Lis, M.J.; Colom, X.; López-Mesas, M.; Valldeperas, J. Effect of alkali pretreatment on cellulase hydrolysis of wheat straw: Kinetic study. Process Biochem. 2005, 40, 3360–3364. [Google Scholar] [CrossRef]
  21. Converti, A.; Del Borghi, M. Inhibition of the fermentation of oak hemicellulose acid-hydrolysate by minor sugars. J. Biotechnol. 1998, 64, 211–218. [Google Scholar] [CrossRef]
  22. García Martín, J.F.; Cuevas, M.; Bravo, V.; Sánchez, S. Ethanol production from olive prunings by autohydrolysis and fermentation with Candida tropicalis. Renew. Energy 2010, 35, 1602–1608. [Google Scholar] [CrossRef]
  23. Trinder, P. Determination of glucose in blood using glucose oxidase with an alternative oxygen acceptor. Ann. Clin. Biochem. Int. J. Lab. Med. 1969, 6, 24–27. [Google Scholar] [CrossRef]
  24. Bergmeyer, H.U.; Möllering, H. Acid acetic. In Methods of Enzymatic Analysis; Bergmeyer, H.U., Ed.; Verlag Chemie: Weinheim, Germany, 1974; pp. 1520–1528. [Google Scholar]
  25. Beutler, H.O. Ethanol. In Methods of Enzymatic Analysis; Bergmeyer, H.U., Ed.; Verlag Chemie: Weinheim, Germany, 1984; pp. 598–606. [Google Scholar]
  26. Beutler, H.O.; Becker, J. Enzymatische Bestimmung von D sorbit und Xylit in Lebensmitteln. Dtsch. Leb. 1977, 6, 182–187. [Google Scholar]
  27. Bravo, V.; Camacho, F.; Sánchez, S.; Castro, E. Influence of the concentrations of d-xylose and yeast extract on ethanol production by Pachysolen tannophilus. J. Ferment. Bioeng. 1995, 79, 566–571. [Google Scholar] [CrossRef]
  28. Yang, M.; Zhang, W.; Rosentrater, K.A. Anhydrous ammonia pretreatment of corn stover and enzymatic hydrolysis of glucan from pretreated corn stover. Fermentation 2017, 3, 9. [Google Scholar] [CrossRef] [Green Version]
  29. Oliva, J.M.; Negro, M.J.; Manzanares, P.; Ballesteros, I.; Chamorro, M.Á.; Sáez, F.; Ballesteros, M.; Moreno, A.D. A sequential steam explosion and reactive extrusion pretreatment for lignocellulosic biomass conversion within a fermentation-based biorefinery perspective. Fermentation 2017, 3, 15. [Google Scholar] [CrossRef] [Green Version]
  30. Carvalho, M.L.; Sousa, R.; Rodríguez-Zúñiga, U.F.; Suarez, C.A.G.; Rodrigues, D.S.; Giordano, R.C.; Giordano, R.L.C. Kinetic study of the enzymatic hydrolysis of sugarcane bagasse. Braz. J. Chem. Eng. 2013, 30, 437–447. [Google Scholar] [CrossRef] [Green Version]
  31. Sánchez, S.; Bravo, V.; García, J.F.; Cruz, N.; Cuevas, M. Fermentation of d-glucose and d-xylose mixtures by Candida tropicalis NBRC 0618 for xylitol production. World J. Microbiol. Biotechnol. 2008, 24, 709–716. [Google Scholar] [CrossRef]
  32. García, J.F.; Sánchez, S.; Bravo, V.; Cuevas, M.; Rigal, L.; Gaset, A. Xylitol production from olive-pruning debris by sulphuric acid hydrolysis and fermentation with Candida tropicalis. Holzforschung 2011, 65, 59–65. [Google Scholar] [CrossRef]
  33. Romero, I.; Sánchez, S.; Moya, M.; Castro, E.; Ruiz, E.; Bravo, V. Fermentation of olive tree pruning acid-hydrolysates by Pachysolen tannophilus. Biochem. Eng. J. 2007, 36, 108–115. [Google Scholar] [CrossRef]
  34. Rorke, D.C.S.; Kana, E.B.G. Kinetics of bioethanol production from waste sorghum leaves using Saccharomyces cerevisiae BY4743. Fermentation 2017, 3, 19. [Google Scholar] [CrossRef] [Green Version]
  35. Sanchez, G.; Pilcher, L.; Roslander, C.; Modig, T.; Galbe, M.; Liden, G. Dilute-acid hydrolysis for fermentation of the Bolivian straw material Paja Brava. Bioresour. Technol. 2004, 93, 249–256. [Google Scholar] [CrossRef] [PubMed]
Figure 1. Temperature profiles for LHW pre-treatments performed at four different maximum temperatures and 0 min maintenance time at these temperatures.
Fermentation 07 00025 g001
Figure 2. Evolution of the d-glucose concentration in the enzymatic hydrolyses carried out on the pre-treated slurries obtained at different temperatures (175–225 °C).
Fermentation 07 00025 g002
Figure 3. Effect of LHW pre-treatment severity parameter (Log R0) on the parameter n of the Chrastil’s model.
Fermentation 07 00025 g003
Figure 4. Evolution of d-glucose concentration over time for the enzymatic hydrolyses performed with different enzyme loadings.
Fermentation 07 00025 g004
Figure 5. Effect of initial enzyme concentration on Chrastil’s model parameters (kE, black circles; n, open circles).
Fermentation 07 00025 g005
Figure 6. Fermentation with P. tannophilus of olive stones hydrolysates. Evolution over time of (A) substrates: total reducing sugars (TRS), d-glucose (g) and acetic acid (AA); and (B) bioproducts: ethanol (E), biomass (x) and xylitol (Xy).
Fermentation 07 00025 g006aFermentation 07 00025 g006b
Figure 7. P. tannophilus growth curve under microaerobic conditions at 30 °C and pH 4.5.
Fermentation 07 00025 g007
Figure 8. Total reducing sugar uptake over fermentation with P. tannophilus. (A) Fit of the experimental data to equation (5). (B) Comparison of the experimental concentrations (black points) with those predicted by model (line).
Fermentation 07 00025 g008
Figure 9. Biomass yield of the culture considering as substrate the total reducing sugars (TRS) (black points) or the sum of total reducing sugars and acetic acid (AA) (open points).
Fermentation 07 00025 g009
Figure 10. Ethanol production over fermentation with P. tannophilus. (A) Fit of the experimental data to Equation (8). (B) Comparison of the experimental concentrations (black points) with those predicted by model (line).
Fermentation 07 00025 g010
Figure 11. Overall ethanol (black circles) and xylitol (open circles) for the fermentation with P. tannophilus.
Fermentation 07 00025 g011
Table 1. Relative enzymatic activities * assayed for enzymatic hydrolysis.
Enzyme LoadingRelative Enzymatic Activity
Cellulasesβ-GlucosidasesHemicellulases
EL-1610
EL-2810
EL-31210
EL-42410
EL-51200
EL-62400
EL-71211
* A relative enzymatic activity of 1 stands for 345 UI enzymatic activity.
Table 2. Effect of liquid hot-water (LHW) pre-treatment temperature (Tpret) on the composition of pre-treated solids.
Pre-Treated Solids’ Composition
LHW
Pre-Treatment
Tpret
(°C)
tpret
(min)
Log R0CEL
(%)
HEM
(%)
AIL
(%)
Enzymatic
Hydrolysis
P175-017502.7326.535.434.7EH175-0
P190-019003.2327.119.843.7EH190-0
P200-020003.4624.126.039.6EH200-0
P210-021003.7929.86.845.5EH210-0
P225-022504.3938.20.042.3EH225-0
tpret: pre-treatment time; CEL: cellulose; HEM: hemicellulose; AIL: acid-insoluble lignin.
Table 3. Effects of LHW pre-treatment temperature on Chrastil’s model parameters.
Enzymatic HydrolysisCE0 (g/dm3)kE 103 (dm3/g·min)nr2
EH175-01.080.330.220.978
EH190-01.080.200.290.995
EH200-01.080.080.250.993
EH210-01.090.200.600.995
EH225-01.080.291.000.994
Table 4. Effect of LHW pre-treatment time (tpret) on pre-treated solids.
Solid Composition
LHW
Pre-Treatment
Tpret (°C)tpret (min)Log R0CEL (%)HEM (%)AIL (%)Enzymatic
Hydrolysis
P200-120013.6028.719.539.9EH200-1
P200-220023.6732.213.840.7EH200-2
P200-520053.9034.40.040.2EH200-5
Tpret: pre-treatment temperature; CEL: cellulose; HEM: hemicellulose; AIL: acid-insoluble lignin.
Table 5. Effects of LHW pre-treatment time on Chrastil’s model parameters.
Enzymatic HydrolysisCE0 (g/dm3)kE 103 (dm3/g·min)nr2
EH200-11.070.220.430.991
EH200-21.070.410.660.997
EH200-51.080.160.380.995
Table 6. d-glucose yields (YG) and composition of the resulting solids from the enzymatic hydrolyses performed with different enzyme loadings.
Enzymatic HydrolysisYG·102
(kg/kg)
CEL
(%)
AIL
(%)
EL-11.528.550.8
EL-22.813.254.3
EL-35.510.756.5
EL-45.68.061.4
EL-55.98.759.1
EL-66.510.857.1
EL-73.917.653.9
HEM = 0% for all the experiments. CEL: cellulose; AIL: acid-insoluble lignin; HEM: hemicellulose.
Table 7. Specific substrate uptake and ethanol production rates.
Substrates UptakeEthanol Production
t
(h)
q g D
(kg/kg·h)
q g
(kg/kg·h)
q s D
(kg/kg·h)
q s
(kg/kg·h)
t
(h)
q E D
(kg/kg·h)
q E
(kg/kg·h)
100.2370.319----100.1000.254
200.4030.319----150.1530.254
100----0.0910.090250.2180.254
150----0.0620.042500.0280.034
200----0.0270.042750.0190.013
q g D and q g : Specific d-glucose consumption rates determined by differential method and by integral method, respectively. q s D and q s : Specific substrate (different to d-glucose) consumption rates determined by differential method and by integral method, respectively. q E D and q E : Specific ethanol production rates determined by differential method and by integral method, respectively.
Publisher’s Note: MDPI stays neutral with regard to jurisdictional claims in published maps and institutional affiliations.

