1. Introduction
In 2005, Brazil [
1] and the USA [
2] produced about 15.8 million m
3 and 14.8 million m
3 of ethanol, respectively. By 2019, Brazil had more than doubled its production to 35.6 million m
3 [
1], while the United States almost quadrupled its production, to 59.8 million m
3 [
3]. The Renewable Fuel Standard (RFS) is a federal program in the USA that originated with the Energy Policy Act of 2005 and expanded by the Energy Independence and Security Act of 2007. This program requires that the amount of renewable fuel blended into transportation fuel should increase each year until 2022, emitting lower levels of GHGs [
4,
5] and using the Renewable Identification Numbers (RINs) as credits for renewable fuels producers [
6]. These initiatives led to an increase in corn (
Zea mays) ethanol produced in the USA. In Brazil, the corn ethanol demand is expected to grow with the federal program RenovaBio [
7]. In the RenovaBio, biofuel producers will receive one financial title equivalent to carbon credits called CBIO, which corresponds to one ton of CO
2 that is no longer emitted due to the biofuel production. Fuels distributors will have an obligation to buy CBIOs, and it will also be available to any interested investor [
8,
9].
For the RenovaBio program, a system’s energy balance is an important indicator. Energy balance is the ratio of the energy released by burning the biofuel to the energy used in its production process. In the sugarcane (
Saccharum spp.) ethanol produced in Brazil, bagasse is generated and used for cogeneration of energy, of which 40% is enough to supply the plant’s demand and 60% is the commercialized surplus [
10]. In the US, corn is the most common feedstock for ethanol production and, according to different studies, has shown a range of energy balances from slightly negative to slightly positive balance. One of the main differences between ethanol production systems from sugarcane and corn is that by employing sugarcane, it is possible to use the sugarcane bagasse for energy generation. As for the corn, no vegetable biomass becomes available for that purpose and fossil fuels such as coal and natural gas are commonly employed to supply the plant energy demand, which decreases its energy balance. The energy balance of the Brazilian sugarcane ethanol is from 8.3 to 10.6 whereas the American corn ethanol is from 1.3 to 1.6 [
11,
12,
13].
Brazil is the third-largest corn producer in the world. In 2019, aggregated maize production in Brazil was forecasted at a near-record level of 95.2 million tons [
14]. The state of Mato Grosso represented about one-third of the Brazilian production and almost half of the “safrinha” corn (second-crop corn) in 2017/2018. Since it is in the center of South America, the corn produced in Mato Grosso faces logistical challenges to be transported to ports and then exported. As a consequence, corn prices in this region are lower when compared to other states, being an alternative to be used as a feedstock for ethanol production [
7]. Currently, corn ethanol corresponds to 2% of Brazilian ethanol. In 2017, 305 million liters were produced in 4 plants in Goias and Mato Grosso states. These states increased the production to 830 million liters in 2018, and 6 new plants are expected to start operation in these states by 2021 [
15]. In the corn ethanol production process the ground corn is diluted with water until 32–35% of dry matter [
16,
17]; thus, for each ton of corn, two cubic meters of water are used, which is usually supplemented with nutrients to promote yeast growth and stimulate fermentation [
18].
Recently, researchers and sugarcane producers are becoming more interested in a type of cane known as energy cane (
Saccharum spp.). If the energy cane is harvested with leaves and the top, it can increase the total biomass by 100%, however, with a loss of 25% to 35% of sucrose [
19,
20]. In Brazil, the sugarcane stem yield is about 80 tons per hectare [
21], generating 250 kg of bagasse per ton of sugarcane stem processed, that is, about 20 tons of bagasse per hectare. The energy cane can produce four times more bagasse and potential energy for cogeneration per hectare than the sugarcane [
22,
23]. The energy cane juice is mainly composed of water and has a lower purity and sugar and minerals content than sugarcane juice, however, due to its high yields, provides more sugars per hectare than the traditional sugarcane [
24,
25].
The concentration of corn production in Mato Grosso and the logistics challenges improve the economic viability of ethanol production in the region, bringing companies that are investing in new plants. Several crops are well adapted and used as biomass for energy generation in Brazil, and due to its high biomass yield, energy cane has been gaining more prominence. In this context, we hypothesized that the energy cane would be a viable option to be integrated with the corn ethanol production in Brazil because (i) its bagasse can supply the industry energy demand, and (ii) its juice could replace the water in the corn dilution, providing sugars and reducing the amount of corn and enzymes used in the industry. However, in the literature, there are few studies on the fermentation of energy cane juice [
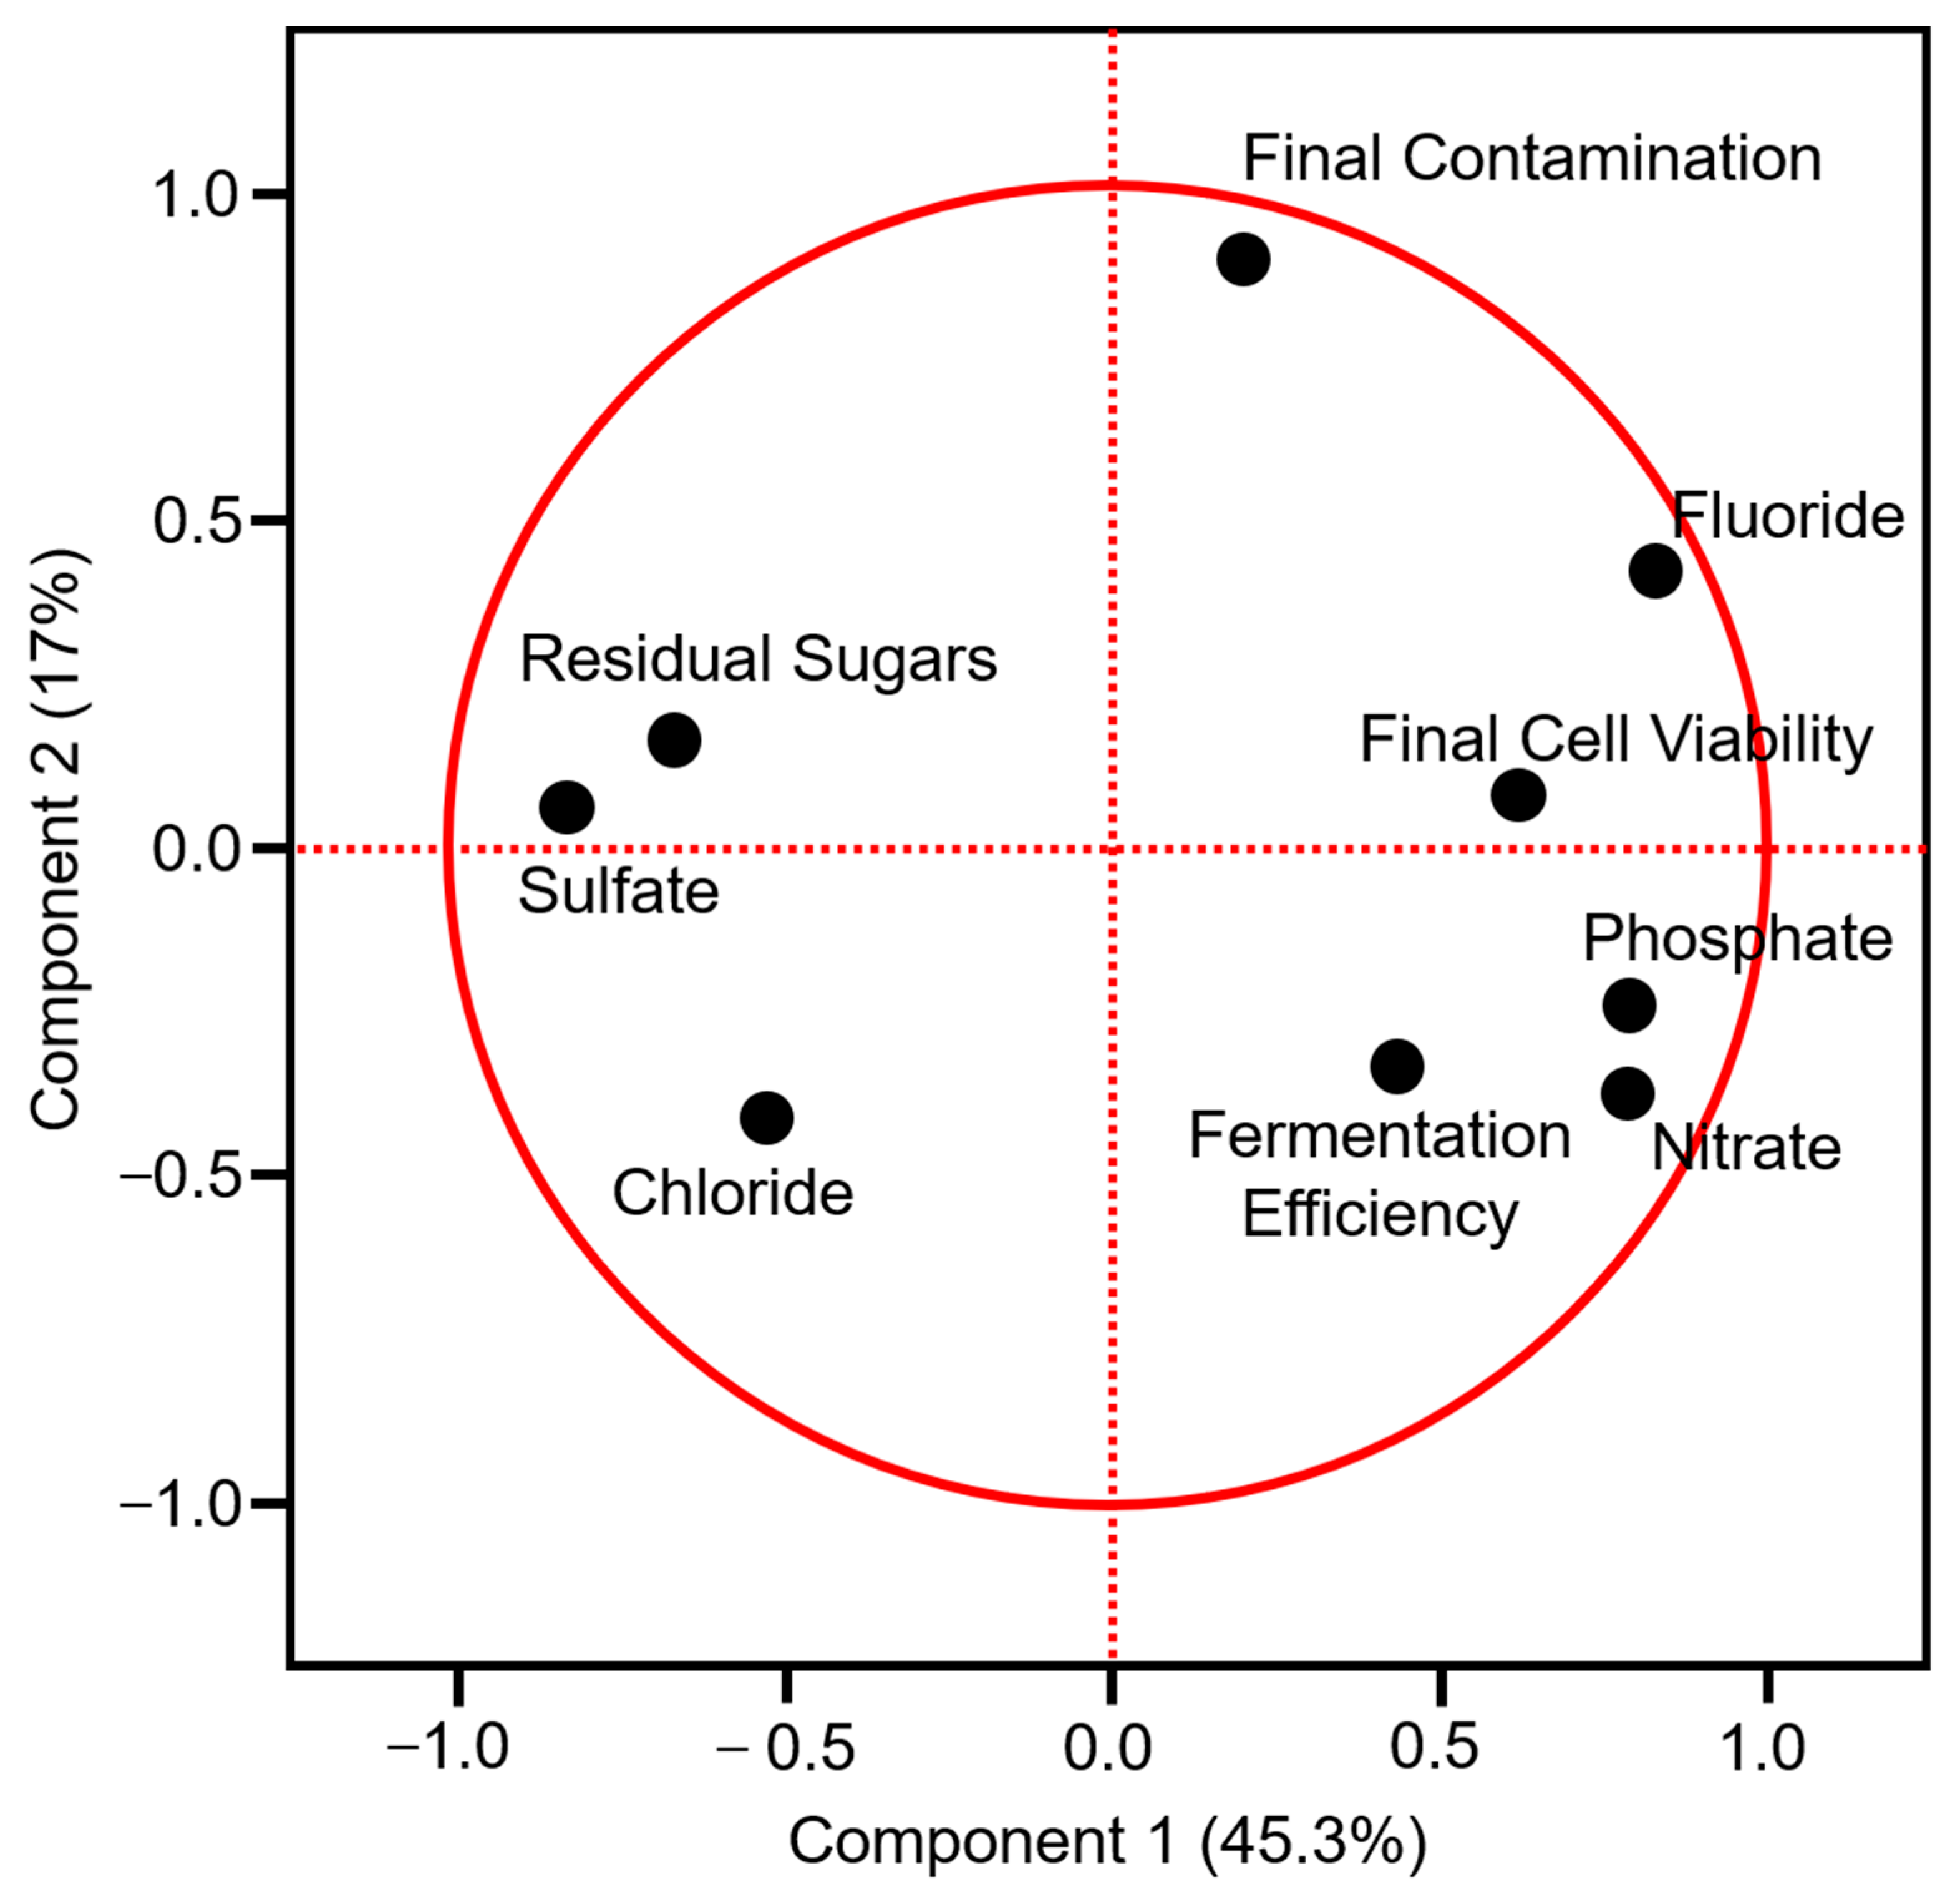
26] and no study proposing the integration of cane juice with corn was found. Therefore, the effects of using the energy cane juice to dilute the corn in the fermentation process are unknown. For these reasons, this study aimed to assess the influence of the energy cane juice on the fermentation efficiency of three treatments: only corn, only energy cane juice, and corn plus energy cane juice. The yeast cell viability; initial and final contamination; residual sugars; and fluoride, chloride, sulfate, nitrate, and phosphate contents were also analyzed. We performed a principal component analysis (PCA) and the correlations between these parameters.
2. Materials and Methods
2.1. Materials
The experiments were conducted in July 2017 at the Sugar and Alcohol Laboratory of the Department of Agri-Food Industry, Food and Nutrition (LAN) of the College of Agriculture “Luiz de Queiroz”, from the University of São Paulo (ESALQ/USP), in Piracicaba.
In the center-west of Brazil, the corn used for ethanol production is the crop surplus of the rotation with soybean, and there are no specific varieties for corn ethanol production [
27]. The corn we used was purchased at an agricultural store in the municipality of Piracicaba, around ESALQ. The corn grains were subjected to hammer milling to obtain fragments with particle size between 2 and 4 mm, by using an automatic sieve. Moisture and starch content of the ground corn were measured according to methods described in the following subsections.
The energy cane was harvested in May 2017 in an experimental station located in Rio Claro, in the state of São Paulo, near Piracicaba. The energy cane was harvested in the morning and transported directly to the ESALQ/USP Sugar and Alcohol Sector, to avoid any influence of contamination at harvest time. In the Sugar and Alcohol laboratory, the energy cane was defibrated and its juice extracted in a hydraulic press. Just after being extracted, the juice underwent a clarification process. It was boiled to separate lighter particles and filtered through a cotton filter. The filtrate was directed to a 9 L glass canister and 2.5 g/L of monobasic sodium phosphate was added. After the reagent was added, the container was sealed and autoclaved at 125 °C with 1 kg-force per cm
−2 of pressure for 25 min to be sterilized. After 48 h resting, the container was opened, the supernatant was siphoned, directed to another glass recipient, and again autoclaved, to be stored until the moment of the experiments [
28]. A sample of this supernatant was taken to analyze the total sugar content (sum of glucose, fructose, and 1.05 times sucrose).
2.2. Experimental Design
Three treatments were used in this study: energy cane treatment, corn treatment, and proposed treatment.
The energy cane treatment (ECT) was the control using only energy cane juice. The stored energy cane juice had 10.5% of initial sugar content. For use in ECT, stored energy cane juice was concentrated by evaporation at 105 °C, so that the initial concentration of reducing sugars in ECT was 20%.
The corn treatment (CT) was performed following the flowchart of traditional ethanol production in US corn ethanol plants [
17] and summarized in
Figure 1. The ground corn was diluted with water. The proposed treatment (PT) process was the same as the one used for the corn treatment (
Figure 1). However, the ground corn was diluted with energy cane juice (10.5% sugar content). Before the dilution, water and energy cane juice were heated to 55 °C, in order to raise the temperature of the corn suspension and bring it closer to the optimal for alpha-amylase enzyme. After that, for both treatments the suspension was heated to 85 °C in an 80-rpm-rotation water bath, when alpha-amylase (0.05%
v/
v) was added according to the volume of the reaction reactor, remaining under these conditions for 90 min, completing the gelatinization step. After the first stage of hydrolysis, the medium was autoclaved. Subsequently, 0.05% (
v/
v) of amyloglucosidase and 1% (
m/
v) of yeast were added, according to the total volume of the reactor, at 30 °C and in an 80-rpm rotation. The saccharification was performed simultaneously with fermentation, gradually releasing fermentable sugars for yeast consumption.
The amounts of corn added to the CT and PT were calculated based on the starch content of the corn (70.2%). Preliminary studies were performed using the same concentrations of enzymes in order to determine the efficiency of the enzymes in converting the starch into glucose. The amount of corn of each reactor was calculated to have 20% (
m/
v) of sugars available to the yeast during the fermentation process. The alpha-amylase (BAN
TM 480 L, specific activity ≥ 250 units/g) and the amyloglucosidase (AMG
TM 300 L, specific activity ≥ 260 units/g) were from Novozymes. The corn treatment had 28% of corn (dry matter), close to values reported in the literature [
16,
17].
The experiment was carried out in a randomized complete block design. Three blocks were carried out with five replications of each treatment in each block. All the 45 experimental units had a working volume of 300 mL. At the beginning of the fermentation, the reactors were inoculated with 1% (m/v) of live Fleischmann lineage yeast. Before inoculating the yeast, all treatments were autoclaved to reduce any influence on fermentation caused by contamination. The experimental units had a standard rotation of 80 rpm in a temperature-controlled environment at 30 °C. After fermentation began, every two hours, a random experimental unit of each treatment was weighed to control the fermentation rate, since the reduction of the total reactor weight can be related to carbon dioxide generation and, consequently, the fermentation rate; based on it, the fermentation of each reactor was ceased when its weight became constant. Subsequently, the fermented juice was centrifuged and the supernatant stored at −4 °C.
2.3. Analytical Methods
The following parameters were analyzed during the described procedures.
2.3.1. Yeast Viability
Yeast viability was determined by differential staining of living cells by 0.1% methylene blue solution and counting of the dead, live, and viable shoots by light microscopy according to the methodology described by [
29,
30]. This analysis was performed at the beginning, the middle, and the end of the fermentation cycle.
For the 0.1% methylene blue solution, 0.025 g of methylene blue dye, 5 g of sodium citrate, and 25 mL of distilled water were used. Methylene blue and sodium citrate were weighed on an analytical balance and then added to distilled water in a conical flask. After the complete dissolution of the solids, the solution was transferred to an amber labeled flask.
For cell viability counting, 0.5 mL of the yeast (wine) suspension was collected and added to 9.5 mL distilled water. After dilution, 0.3 mL was transferred to the tube and 0.3 mL of 0.1% methylene blue solution was added. The mixture was homogenized on the tube shaker for 10 s. With the aid of an automatic pipette, 0.1 mL of the prepared sample was transferred to the Neubauer chamber and covered with a coverslip. The yeast cells viability counts were performed with the dilution of the wine using a Neubauer chamber in an optical microscope (Nikon, 400×).
2.3.2. Anions, Glucose, Fructose and Sucrose Content
Analyzes were performed according to the methodology developed by Application Work AWI CBR-0022-082012 [
31]. The equipment used was an ion chromatograph, model 930 Compact IC Flex, equipped with an Amperometric Detector.
Samples were collected, diluted, and filtered on 0.45 µm Durapore porosity filter units. Then, 0.25 μL of the sample was injected into the ion chromatograph for glucose, fructose, and sucrose analysis. The following chromatographic system was used: Column Metrosep Carb 1—150/4.0, the eluent was 200 mM NaOH solution, with a 1.0 mL/min flow under 35 °C for 9 min.
2.3.3. Bacterial Contamination
Although all the feedstocks were sterilized before fermentation, the bacterial contamination was assessed to ensure that the substrate was not contaminated before and during the fermentation process. After the beginning and at the end of the fermentation, 1 mL samples were collected from each experimental unit and diluted 1000 and 100,000 times, respectively. In a vertical laminar flow chamber, with sterilized materials, it was inoculated in Petri dishes containing YPD media, composed of 1% yeast extract, 2% peptone, 2% glucose [
32], 2% agar, and 10 ppm hexanamide [
33], to avoid the growth of eukaryote cells, such as fungus, allowing only the growth of prokaryote, in this case, contaminant bacteria. It was incubated at 35 °C for 48 h, and after this period, the number of colony-forming units (CFU) was counted.
2.3.4. Starch Content in the Corn
Starch content was estimated indirectly by determining the soluble reducing sugars content. To this end, 0.1 g of ground corn was diluted in 20 mL of water, followed by enzymatic hydrolysis with extra enzymes (20 times more than recommended), under the conditions mentioned in
Section 2.2, followed by chemical hydrolysis as described by [
34].
The diluted solution had the glucose content determined by ion chromatography, following the steps of
Section 2.3.2. Based on the dilution factor and the starch to glucose conversion rate, the glucose content of the solution was converted to starch content based on dry matter.
2.3.5. Alcohol Content
For the analysis of alcohol content, 25 mL of sample was collected from each experimental unit, at the beginning and end of the fermentation. This sample was distilled in a micro-distiller MA 012/1 (Marconi, Piracicaba, Sao Paulo, Brazil). After the sample was distilled, it was analyzed using the Schmidt Haensch Digital Densimeter EDM 4000. Using a 25 mL volumetric pipette, the sample was transferred to the distillation chamber, with distilled water subsequently washed to the place where the sample was placed. After the boiler water had boiled, the boiler and sample collector taps were closed, and the thermostat was set to work temperature. Distillation was conducted until the 25 mL volume was collected in a volumetric flask placed on the distiller condenser outlet valve. For the densimeter to reach the working conditions, it was first necessary to adjust the temperature to 20 °C with a deviation of 0.05 °C. After temperature stabilization, air and water were injected to calibrate the equipment [
35,
36].
After the densimeter had reached working conditions, the sample aliquots were transferred to the sample receiver tube, taking care that no air bubbles formed inside the reading tube. After completing the tube with the sample, the start button was pressed and the density value on the screen was observed. This value was later used to calculate the value in ºGL by converting the read density to the alcohol concentration of the solution in % v/v taken from a relative density conversion table at 20 °C/20 °C.
2.4. Fermentation Yield and Efficiency
The practical yield (Yp) is the amount of ethanol obtained from 100 g of sugars supplied in the juice. Its calculation involves determining the mass of sugars supplied to the reactor and the mass of ethanol produced:
The industrial fermentation process will be more efficient as it approaches Gay-Lussac’s optimal yield. Thus, fermentation efficiency is defined as the percentage ratio between practical and theoretical yields (51.11 g of ethanol/100 g of sugars):
2.5. Statistics
All data collected was digitized and processed on Microsoft Excel. A summary spreadsheet with the data of each variable of each experimental unit was made and input into JMP Pro 15 (JMP, version Pro 15, SAS Institute Inc., Cary, NC, USA 1989–2019) that was used to perform the statistical analysis. Analysis of variance (ANOVA) considering the main effects of treatment on the parameters analyzed. Tukey test was used to separate means at p < 0.05. JMP Pro 15 was also used to perform the principal component analysis (PCA) and the correlations of the parameters assessed for the corn ethanol treatment and the proposed treatment.
4. Discussion
The same procedures were used in the corn treatment (CT) and in the proposed treatment (PT). The only difference was that in the PT energy cane juice was added instead of water, reducing the amount of corn added to the reactor (
Figure 1.) Based on the corn starch content, the energy cane juice sugar content, and the volume of the reactor, the proportions were calculated. To this end, for PT, 280 mL of sugarcane juice (10.5% of sugars) was added, providing 29.4 g of sugar to the reactor. The remaining 30.6 g needed to complete 60 g of sugar in the reactor was provided by corn. The required corn mass was calculated considering that 100 g of corn used in this experiment had 70.2 g of glucose after the hydrolysis process. Thus, 43.59 g of corn provides the remaining 30.6 g to complete 20% of ART in the reactor. To CT, 60 g of sugar was needed to achieve 20% of sugar content in the reactor, so 85.23 g of corn was added for each experimental unit. Preliminarily, it can already be considered that the integration of energy cane with corn reduces water use at the plant and the amount of corn needed from 85.23 g to 43.59, almost half, and reduces the amount of water used in the plant. The CP treatment produced, on average, 11.19 mL of ethanol for each 100 mL of the reactor (90 mL of water and 28.41 g of corn). For each mL of ethanol produced in this treatment, 8.04 mL of water and 2.53 g of corn were needed. PT produced on average 12.03 mL of ethanol for each 100 mL of the reactor (43.59 g of corn). For each mL of ethanol produced, 1.21 g of corn was used. No water was added because it was substituted by the energy cane juice (
Table 1).
However, due to its composition, mainly composed of water and with a high concentration of sugars (about 15%), sugarcane is known for bringing contaminants from the field to the mill; probably, with the energy cane it will be no different and may cause negative impacts during the fermentation process. The bacterial contamination can decrease the fermentation yield from 14 to 90% at levels of 10
8 and 10
9 CFU/mL [
37], concentrations greater than the ones obtained in this study (at 10
5 dilutions no bacterial colonies were found). Besides that, when found, at 10
3 level, there was no significant difference among the treatments, which was expected, since all the experimental units were sterilized before starting the fermentation process, to avoid that the influence of contamination affects the performance of yeast and, consequently, the objective of the work to analyze the effect on fermentation of sugarcane juice energy integrated with corn. Although studies already show that energy cane being stored for 8 h at 30 °C does not affect fermentation [
26], future studies may assess the need to sterilize energy cane juice before mixing with corn, or whether heating to the gelatinization step of hydrolysis could influence reducing or eliminating bacterial contamination brought on by energy cane.
The final viability had no significant difference among treatments. It is known that ethanol in high concentrations can be toxic to the yeast [
38], and at the end of the fermentation process, the sugar concentration is low, which can also negatively affect the yeast. For these reasons, it is common to have residual sugars at the end of the process [
38]. Devantier et al. (2005) started a fermentation process of corn ethanol with 25% of sugars and obtained a 2.5% residual sugar, that is, 90% of the initial sugar was consumed during the fermentation process [
17]. At this experiment, the initial sugar concentration in the reactors was 20%, and the residual sugars had significant differences among the treatments. The corn ethanol (CT) treatment was the one with higher residual sugar, 0.55%. However, still, 97.25% of the initial sugar was consumed, a value greater than obtained by Devantier et al. (2005). The proposed treatment (PT) and energy cane treatment did no differ significantly, consuming 98.35% and 98.65%, respectively.
Although the energy cane treatment had higher sugar consumption, its efficiency was the lowest and significantly different when compared to the other treatments, 80.60%. This was the only treatment that did not have the hydrolysis process; thus, all the sugar was already available at the beginning of the fermentation, creating an unfavorable environment to the yeast, causing osmotic stress. Under stress, it is well known that yeast can divert its metabolic pathway by consuming sugars and producing glycerol instead of ethanol [
39]. Thus, the stress caused to yeast by the high concentration of readily available sugars may be the reason for the poor performance of this treatment, despite the high sugar intake.
On CT and PT, saccharification and fermentation were carried out simultaneously, releasing sugar gradually, not causing osmotic stress to yeast. A pre-saccharification can reduce the enzymes’ dosage by 10–15%. However, it is not used in the dry-milling industry, since when it is a more complex process and has higher risks of contamination [
17]. Normally, during the corn ethanol fermentation, the solution is supplemented with nutrients to promote yeast growth and thus stimulate fermentation [
18]. In this experiment, neither CP nor PT was supplemented with nutrients. It may have affected the CT fermentation efficiency that was significantly different when compared to PT, 86.35%, and 90.82%, respectively, and had higher residual sugars. Although it was not supplemented with nutrients, PT had the best performance. Sugarcane is known for the concentration of minerals, normally not being necessary supplements in the fermentation [
40]. In this study, the PT had significantly greater contents of fluoride, nitrate, and phosphate (
Table 4), which were positively and significantly correlated with the fermentation efficiency (see
Table 5 and
Figure 2). Thus, it is likely that the energy cane juice, in addition to sugar, also provided minerals that helped in the fermentation performance. These minerals could be concentrated together with DDGS (Dried distiller grains with solubles), providing a nutritionally richer product with higher value and market interest for animal feed, which is in great demand in the state of Mato Grosso for cattle feed.
However, energy cane is still a new technology and is starting to be adopted on a commercial scale; thus, new varieties are being developed and released recently [
23] with a high variation of fiber content and juice compositions [
41,
42]. The harvest date can also significantly affect the energy cane composition [
43]. Ceccato-Antonini et al. (2017) claimed to be “the first research to deal with the characteristics of deterioration and fermentability of energy cane juices”. In their study, the fermentation efficiencies of two energy canes VG11-X1 and VG11-X2 (initial sugars of 19.5% and 13.2%) were 54.9% and 56.1%, respectively [
26], considerably lower than the value obtained in this study on the ECT, 80.6%. Li et al. (2017) used 2% of yeast extract on a simultaneous fermentation and saccharification of corn starch for 72 h and obtained a fermentation efficiency of 84.5%, similar to the fermentation efficiency obtained in this study on the CT [
44].


 ,
, 

