Article

Production of Renewable Lipids by the Diatom Amphora copulata

by
Natanamurugaraj Govindan
1,2,
Gaanty Pragas Maniam
1,2,
Mohd Hasbi Ab. Rahim
1,2,
Ahmad Ziad Sulaiman
3,
Azilah Ajit
4,
Tawan Chatsungnoen
5 and
Yusuf Chisti
6,*
1
Algae Culture Collection Center & Laboratory, Faculty of Industrial Sciences & Technology, Universiti Malaysia Pahang, Lebuhraya Tun Razak, Gambang, Kuantan 26300, Pahang, Malaysia
2
Earth Resources & Sustainability Centre, Universiti Malaysia Pahang, Lebuhraya Tun Razak, Gambang, Kuantan 26300, Pahang, Malaysia
3
Faculty of Bioengineering & Technology, Universiti Malaysia Kelantan, Jelib 17600, Kelantan, Malaysia
4
Faculty of Chemical & Natural Resources Engineering, Universiti Malaysia Pahang, Lebuhraya Tun Razak, Gambang, Kuantan 26300, Pahang, Malaysia
5
Department of Biotechnology, Maejo University-Phrae Campus, Phrae 54140, Thailand
6
School of Engineering, Massey University, Palmerston North, Private Bag 11 222, New Zealand
*
Author to whom correspondence should be addressed.
Submission received: 15 February 2021 / Revised: 8 March 2021 / Accepted: 9 March 2021 / Published: 11 March 2021
(This article belongs to the Special Issue Biofuel Fermentation from Renewable Biomass)

Abstract

:
The asymmetric biraphid pennate diatom Amphora copulata, isolated from tropical coastal waters (South China Sea, Malaysia), was cultured for renewable production of lipids (oils) in a medium comprised of inorganic nutrients dissolved in dilute palm oil mill effluent (POME). Optimal levels of nitrate, phosphate, and silicate were identified for maximizing the biomass concentration in batch cultures conducted at 25 ± 2 °C under an irradiance of 130 µmol m−2 s−1 with a 16 h/8 h light-dark cycle. The maximum lipid content in the biomass harvested after 15-days was 39.5 ± 4.5% by dry weight in a POME-based medium with optimal levels of nitrate, phosphate, and silicate. Under the optimized conditions the maximum dry mass concentration of the diatom was 660 mg L−1 on day 12, declining to ~650 mg L−1 on day 15. For the 15-day batch operation, the final average productivities of the biomass and the lipids were 43.3 ± 4.5 mg L−1 d−1 and 17.1 ± 0.3 mg L−1 d−1, respectively. The fatty acids in the diatom lipids were found to be (%, w/w of total lipids): palmitoleic acid (39.8%), palmitic acid (31.9%), myristic acid (6.8%), oleic acid (4.7%), stearic acid (4.5%), arachidonic acid (3.9%), eicosapentaenoic acid (3.6%), linoleic acid (2.5%), tetracosanoic acid (1.7%), and linolenic acid (0.6%).

1. Introduction

Diatoms have the potential to provide commercially useful lipids [1,2,3,4,5,6,7,8,9]. This work is concerned with biomass and lipid production by a newly isolated diatom grown in media formulated with palm oil mill effluent (POME), a cheap and readily available source of key nutrients. Diatoms (class Bacillariophyceae) are distinguished from other microalgae by their hard hydrated amorphous silicon dioxide (SiO2, silica) cell wall, or frustule, which incorporates various organic components. The frustule consists of two halves: the smaller half, or hypotheca, fits into the larger epitheca, as a petri dish and its lid. The large flat upper and lower faces of the thecae comprise the two valves whereas the peripheral region where the thecae overlap comprises the gridle bands [10]. Distinct markings on the surfaces of the valves are known as striae. Running along the middle of the thecae are longitudinal slits known as raphe. These morphological features are distinct in different diatoms and are a robust basis of identification of species [10,11,12].
Diatoms occur in freshwater as well as marine and brackish waters [10]. Diatoms generally photosynthesize, but some can also grow heterotrophically using dissolved organic carbon as an energy source in the dark [13]. Mixotrophic growth using both a combination of light and organic carbon may also occur [14,15]. Heterotrophy is common among pennate diatoms such as Amphora spp. [16,17,18,19,20,21], but not all diatoms are heterotrophic. Compared to other microalgae, diatoms generally grow more rapidly [22], possibly because their silicic cell wall requires less energy to synthesize relative to organic walls.
Although green microalgae and diatoms are well known producers of lipids [1,2,3,4,5,6,7,8,9], only a few species are used commercially [23,24,25,26,27,28,29,30,31]. Triglyceride lipids from microalgae can be converted to biodiesel [31,32] just like the triglycerides from animals and plants, but algal biodiesel is prohibitively expensive because of the high cost of growing and extracting the algae [33,34]. Low-cost production of oils from algae requires species that can be grown rapidly under variable environmental conditions (e.g., light levels, temperature, salinity) using inexpensive culture media. Algal oils can be used in foods, feeds, cosmetics, and as feedstocks for producing high-value products, but not biofuels [35,36]. Contrary to numerous claims, algae, and diatoms do not sequester atmospheric carbon in practicable ways to reduce the carbon burden of the environment [37,38].
Algal culture media formulated using certain agroindustrial wastewaters can reduce the cost of production by reducing the need for high-grade water. Wastewater generated by the oil palm industry is an example of the water that can be used [4,39,40,41]. Palm oil is the most widely consumed vegetable oil. It is commonly used for manufacture of soaps and detergents. Palm oil mill effluent (POME) is a nutrients-rich wastewater generated as a by-product of palm oil production. Between 2.5 and 3.5 metric tons of POME is generated for each ton of crude palm oil extracted from the fresh fruit [42]. POME contains high levels of dissolved organics [43] as well as some inorganic nutrients. In view of its nutrient contents, POME is a potential resource with diverse possible uses [42,43,44], but is poorly managed and remains an important contributor to water pollution [42]. Many microalgae have been grown in media formulated with POME [4,9,39,40,41].
Lipid content of the diatom biomass is influenced by multiple factors including the concentrations of the key nutrients, especially nitrate ( NO 3 ), phosphate ( PO 4 3 ), and silicate ( SiO 3 2 ) in the culture medium [2,4,45]. In addition, environmental factors influence growth and lipid production [2,45]. The present work reports on isolation and identification of a barely known diatom from tropical coastal waters of peninsular Malaysia. Biomass and lipid production of the isolate are characterized in POME-based culture media for possible use in large-scale commercial production. Diluted POME, supplemented with low levels of nitrate, phosphate and silicate, was used to minimize the cost of the culture medium. Suitable concentrations of nitrate, phosphate and silicate were identified by stepwise variation of individual concentrations [46], to maximize biomass growth without providing an excess of a nutrient. The initial levels of one or more of the mentioned inorganic nutrients were intended to be just sufficient to maximize biomass growth for the light available. This strategy was designed to assure nutrient-limitation, or starvation, towards the end of a batch culture because lipid accumulation in the biomass post growth is generally maximized under starvation levels of at least one of the mentioned inorganic nutrients [2,4,5,11,46,47]. Microorganisms grown using cheap wastewater-based media, are potentially renewable sources of commercially useful oils and other precursor chemicals. This hypothesis drove the present investigation of lipid production using a combination of POME-based media and a novel diatom isolate. Lipid production and characterization have not been previously reported for the specific diatom isolated in the present study. Diatom oil produced in the present work is shown to have a similar composition to palm oil. Therefore, in principle, production of diatom oils could be further developed to replace palm oil in at least some applications to reduce deforestation and other ecological impacts associated with palm oil.

2. Materials and Methods

2.1. Sample Collection, Isolation, Identification, and Screening

Microalgae samples were collected from coastal waters in the vicinity of Sungai Baluk river estuary (3°93.793’ N, 103°37.694’ E) East Coast region of Peninsular Malaysia, in June, 2019. A plankton net (5 μm openings) was used at the subsurface level for collecting 1 L water samples [4]. The water temperature at collection point was 28 °C.
The water samples were filtered (Whatman® filter paper, 0.45 μm pore size) and the retained material was recovered by washing off the filter surface with 500 mL sterile freshwater. The microalgae in this suspension were cleaned and isolated as explained by Hendey [48]. Briefly, a sterile inoculation loop was contacted with the recovered suspension, streaked on an f/2 agar plate and incubated for 12 h at room temperature (~25 °C) under standard laboratory lighting (15 µmol photons m−2 s−1). Cells from individual colonies were examined under a fluorescence microscope (Olympus BX53 fluorescence microscope; Olympus, Tokyo, Japan) and further imaged by scanning electron microscopy (SEM, Jeol JSM-6610 LV SEM; JEOL USA, Inc., Peabody, MA, USA) for distinguishing morphological features [10,48,49,50,51].
The isolated microalgae were identified with reference to standard manuals [10,48,51]. A total of 21 microalgae species were isolated and identified [4]. Of these, a diatom was selected for further work because it grew rapidly, accumulated a relatively high level of lipids in the biomass and had not been studied before.

2.2. Diatom Preculture

The diatom was precultured aseptically by suspending in 200 mL f/2 medium in 250 mL Erlenmeyer flasks. The standard f/2 medium comprised of the following (per liter of filtered seawater): 75 mg NaNO3, 5 mg NaH2PO4⋅H2O, 30 mg Na2SiO3⋅9H2O, 1 mL of a trace metals solution and 0.5 mL of a vitamin solution. The trace metals solution contained the following per L of deionized water: 3.15 mg FeCl3⋅6H2O, 4.36 mg Na2EDTA⋅2H2O, 9.8 mg CuSO4⋅5H2O, 6.3 mg Na2MoO4⋅2H2O, 22.0 mg ZnSO4⋅7H2O, 10.0 mg CoCl2⋅6H2O, and 180 mg MnCl2⋅4H2O [4]. The trace vitamins solution contained the following per L of deionized water: 0.1 mg thiamine HCl, 0.5 µg biotin, and 0.5 µg cyanocobalamin. The seawater for the medium had been taken from the coast of Kuantan, Peninsular Malaysia, in June 2019.
The culture flasks were continuously bubbled with filter-sterilized air mixed with 5% (vol/vol) carbon dioxide. The flow rate of the aeration mixture was 75 mL min−1 at normal temperature and pressure [4]. The incubation temperature was 25 ± 2 °C. The flasks were held under fluorescent light with an irradiance level of 35 μmol m−2 s−1 at the surface of the flasks and a 12 h/12 h light-dark cycle.

2.3. Growth and Lipid Production

All experiments used 2 L Erlenmeyer flasks (1 L working volume). The cultures were aerated (75 mL min−1) using the above specified filter-sterilized gas mixture. The incubation temperature was 25 °C. All inocula were prepared identically (Section 2.2). The cell concentration after inoculation was always ~50 mg L−1. A 16 h/8 h light-dark cycle was used. The light level at the surface of the culture flasks was always 130 μmol photons m−2 s−1, as this had been found to be optimal in an earlier study of an unrelated diatom isolated from the same waters as the present species [4]. The total duration of all batch cultures was 15 days. The medium was made using filter-sterilized palm oil mill effluent (POME) that had been diluted with distilled water (100 mL POME mixed with 900 mL distilled water). Undiluted POME was not be used because its dark brown color interfered with light penetration in the culture medium [9]. The composition of diluted POME is shown in Table 1. This diluted POME was supplemented with NPK 20-10-10 commercial fertilizer (75 mg L−1). NPK 20-10-10 contained (by wt) 20% N, 10% P2O5 equivalent and 10% K2O equivalent. Thus, the actual nutrient levels contributed by NPK fertilizer to the basal culture medium were: 15 mg N L−1, 3.3 mg P L−1 and 6.2 mg K L−1. Further nitrate (1–2 mg L−1, as NaNO3), phosphate (5.5–7.5 mg L−1, as NaH2PO4⋅H2O) and silicate (7.5–9.5 mg L−1, as Na2SiO3⋅9H2O) were added to the basal medium in different experiments. The concentrations specified here were in addition to the nutrients already present in POME (see Table 1). These concentration ranges were selected to span the levels that had been found to be optimal in a POME-based medium in studies with a different diatom [4]. A one-factor-at-a-time optimization approach [46] was used to maximize the biomass concentration. All runs were performed in duplicate.
Lipid bodies in the diatom were visualized by fluorescence microscopy of Nile red stained cells. For staining, the culture suspension (4 mL) was mixed with 0.04 mL of Nile red solution (0.5 µg mL−1 dissolved in dimethyl sulfoxide) by inversion in a plastic cuvette and allowed to stand for 30 min at 25 °C. Samples were observed using a fluorescence microscope (Olympus BX53 fluorescence microscope; Olympus, Tokyo, Japan). Excitation and emission wavelengths were 530 and 580 nm, respectively.

2.4. Determination of Dry Cell Mass Concentration and the Specific Growth Rate

The final biomass concentration (day 15 of batch culture) was measured gravimetrically. For this, a precisely known volume of the culture sample was centrifuged (9000× g, 10 min) and the cell pellet was recovered. The cells were rinsed twice by resuspending in distilled water and then recovered by centrifugation [52,53]. The recovered pellet was dried (~30 °C) to constant weight under vacuum and weighed. The measured mass of the dried cells and the initial volume of the culture sample were used to calculate the dry biomass concentration [52].
For plotting the growth curves, the dry cell mass concentration was estimated by measuring the optical density of the cell suspension diluted with fresh medium such that the measured optical density at 750 nm was 0.4, or less [53]. The measured optical density (OD750) and the dilution factor were used to calculate the dry cell mass concentration (Cb) by comparison with a standard plot of Cb versus OD750. This plot had been made by measuring the OD750 values of serial dilutions of a sample of the culture broth with a cell dry mass concentration that had been precisely determined by gravimetry, as explained above. The equation of the standard curve was: Cb (mg L−1) = 406.414 × OD750. The data fitted the standard curve with a correlation coefficient of 0.999 (Figure 1).
The specific growth rate (µ) was calculated as the slope of a plot of ln Cb versus time, during exponential growth [54].

2.5. Lipid Extraction and Quantification

The lipids were extracted from biomass samples that had been washed and freeze-dried. The Bligh and Dyer [55] method as previously used for lipid recovery from numerous microalgae [4,52,54,56,57], was used. Briefly, 0.2 g of freeze-dried biomass was suspended in a solvent mixture (chloroform 1 mL, methanol 2 mL, deionized water 0.8 mL), vortex mixed for 2 min and allowed to rest for 4 h at room temperature. More chloroform (1 mL) was added and the mixture was vortex mixed for 30 s [52]. Deionized water (1 mL) was added and the suspension was vortex mixed for 30 s. The resulting suspension was centrifuged (4150× g, 10-min) and allowed to separate into three layers. The top layer of methanol/water was discarded [52]. The chloroform layer (the third layer from top) was recovered. The residual biomass was extracted twice more. Total lipids in the combined chloroform extract, were determined gravimetrically by evaporating (50 °C) the extract in a preweighed aluminum dish in a fume hood [52]. The mass of the extracted lipid and the dry mass of the cells used in extraction, were used to calculate the total lipid content of the biomass (% by weight).

2.6. Lipid Composition Analysis

The triglycerides in the freeze-dried (Section 2.5) biomass were converted in situ to fatty acid methyl esters (FAME) and extracted [54]. Thus, 50 mg dry biomass was mixed with 5 mL of toluene/acidified methanol (1:2 v/v; methanol was acidified by mixing 1.8 mL concentrated sulfuric acid with 100 mL methanol) and kept at 50 °C overnight [54]. This slurry was extracted three times with 3 mL of hexane each time. The hexane extracts were pooled and the solvent was evaporated under nitrogen to recover an oily residue. This oil residue was dissolved in 2 mL hexane for analysis by gas-chromatography-mass-spectroscopy (GCMS; Agilent 7890A; www.agilent.com, accessed on 1 March 2021). The sample injection volume was 1 µL and helium was the carrier gas [4].

3. Results and Discussion

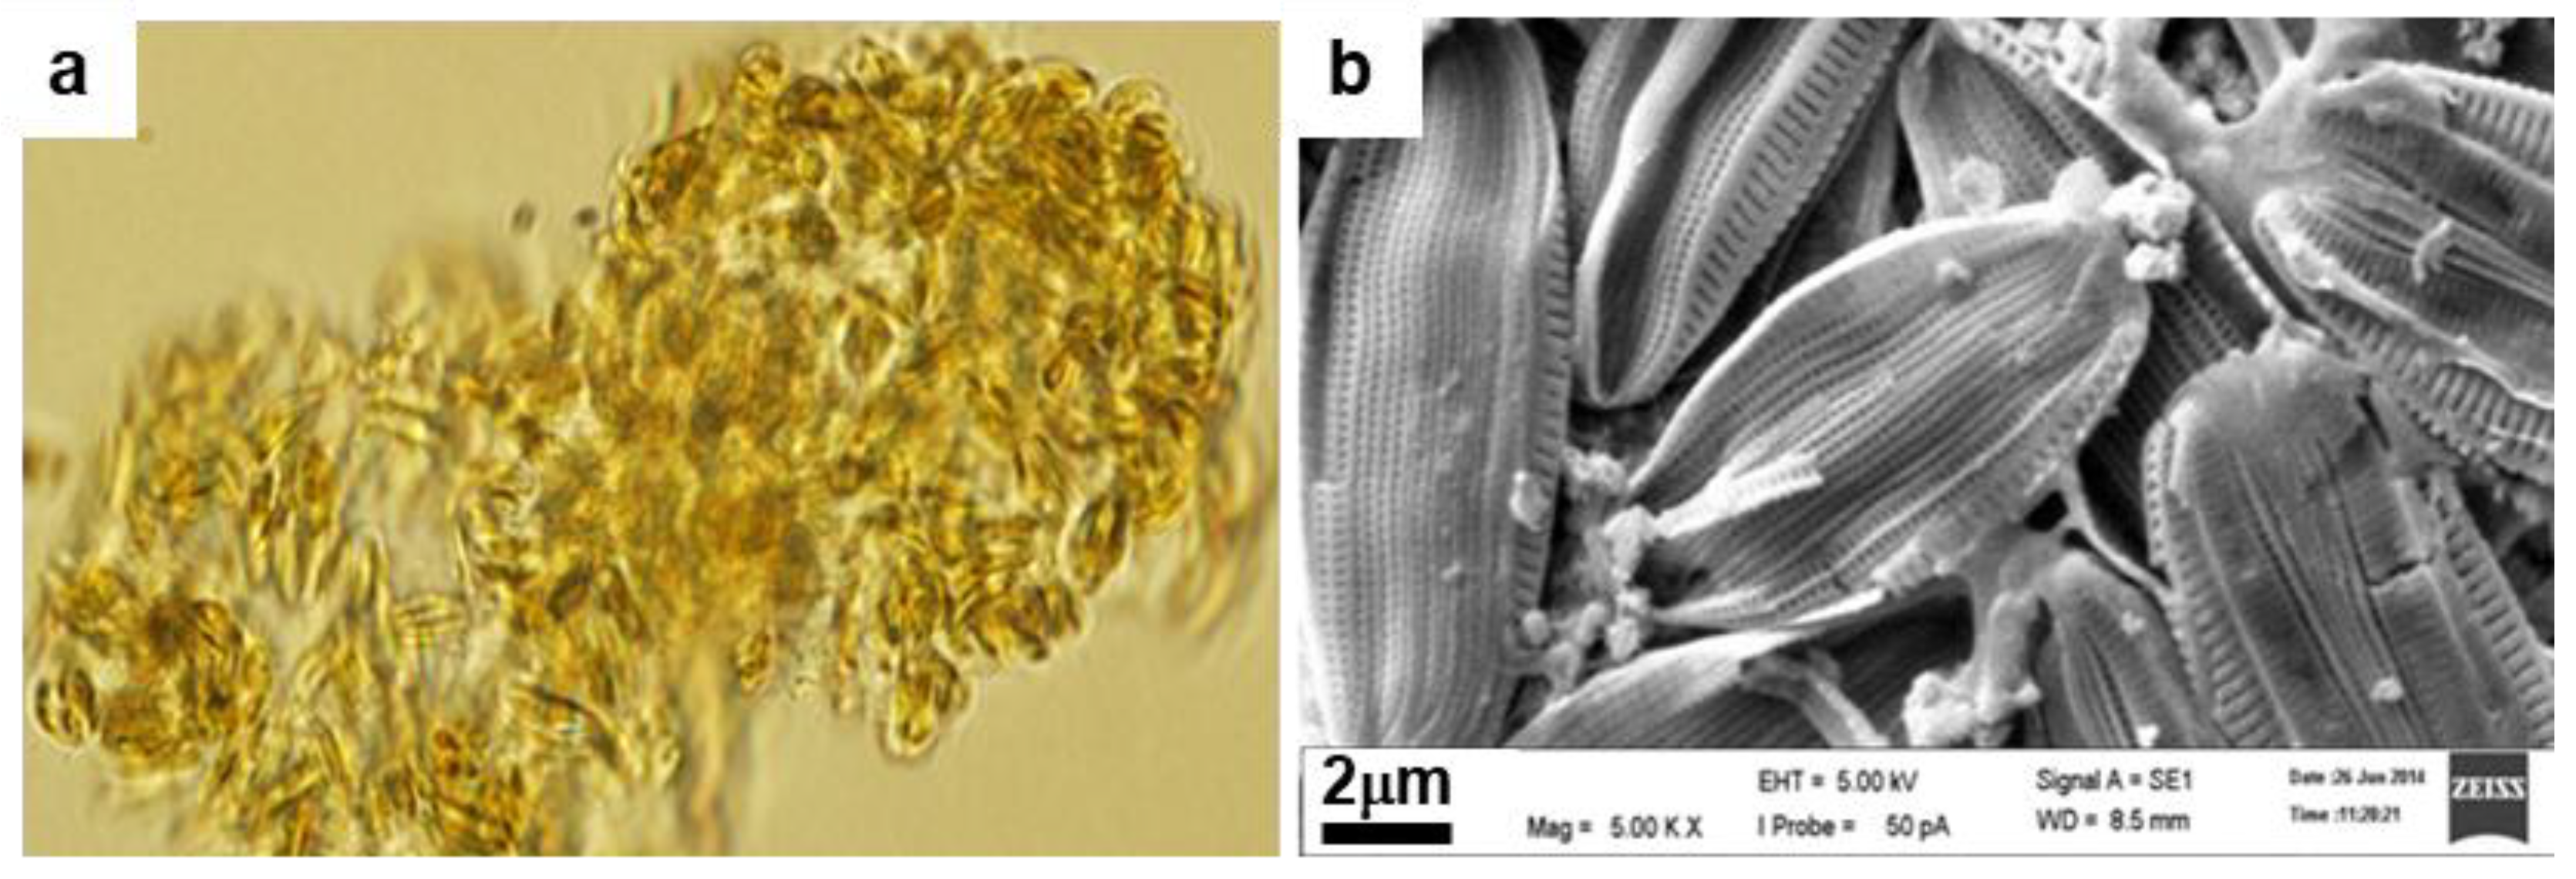
3.1. Identification of the Diatom

Diatoms are identified using classification keys based on the structure of their frustule, including the detailed morphological features of the two valves (upper and lower faces of the thecae) [10,11,48,49,50,51,58]. Frustule morphology of the isolated asymmetric biraphid diatom was consistent with the data published for Amphora copulata: 12–51 µm in length; 4–10 µm valve width; 12–18 µm frustule width; 14–16 dorsal striae per 10 µm near center; 16–18 dorsal striae per 10 µm near poles; and 14–17 ventral striae per 10 µm [58]. Valves were found to be semi-lanceolate to semi-elliptical, with concave ventral margins and smoothly arched dorsal margin [50]. A fluorescence micrograph and an SEM image of the diatom are shown in Figure 2. Based on these morphological features, the isolate was identified to be Amphora copulata. The diatom proved capable of growth in the standard f/2 medium formulated with seawater. In addition, it grew well in an identical medium formulated with diluted filtered POME. Nile red staining of A. copulata showed the cells to contain lipid bodies (Figure 3), as typically associated with diatoms [59].
Amphora copulata is generally viewed as a freshwater diatom [60,61,62], therefore, its isolation from a marine coastal environment, as in the present work, may seem surprising. This apparent discrepancy may be explained by the proximity of the zone of isolation to the estuary of the river Sungai Baluk, a freshwater body. In other studies, A. copulata has been frequently isolated from saline environments. For example, it was isolated from Montevideo Bay on the Atlantic coast of Uruguay, a region near the estuary of the river Rio de la Plata, where the salinity ranged from 3 to 28 ppt (parts per thousand, or g kg−1) [60]. Seawater salinity is generally in the range of 31 to 38 ppt. Similarly, A. copulata has been found in Salton Sea, a hypersaline (salinity ~43 ppt in regions away from river mouths) inland lake in the United States [63] where the real source may have been the rivers that feed the lake. Isolation of live specimens from saline and hypersaline environments suggest that A. copulata not only survives in seawater, notwithstanding its freshwater origins, but actually thrives in seawater-based culture media, as demonstrated during preculture in the present work (Section 2.2).

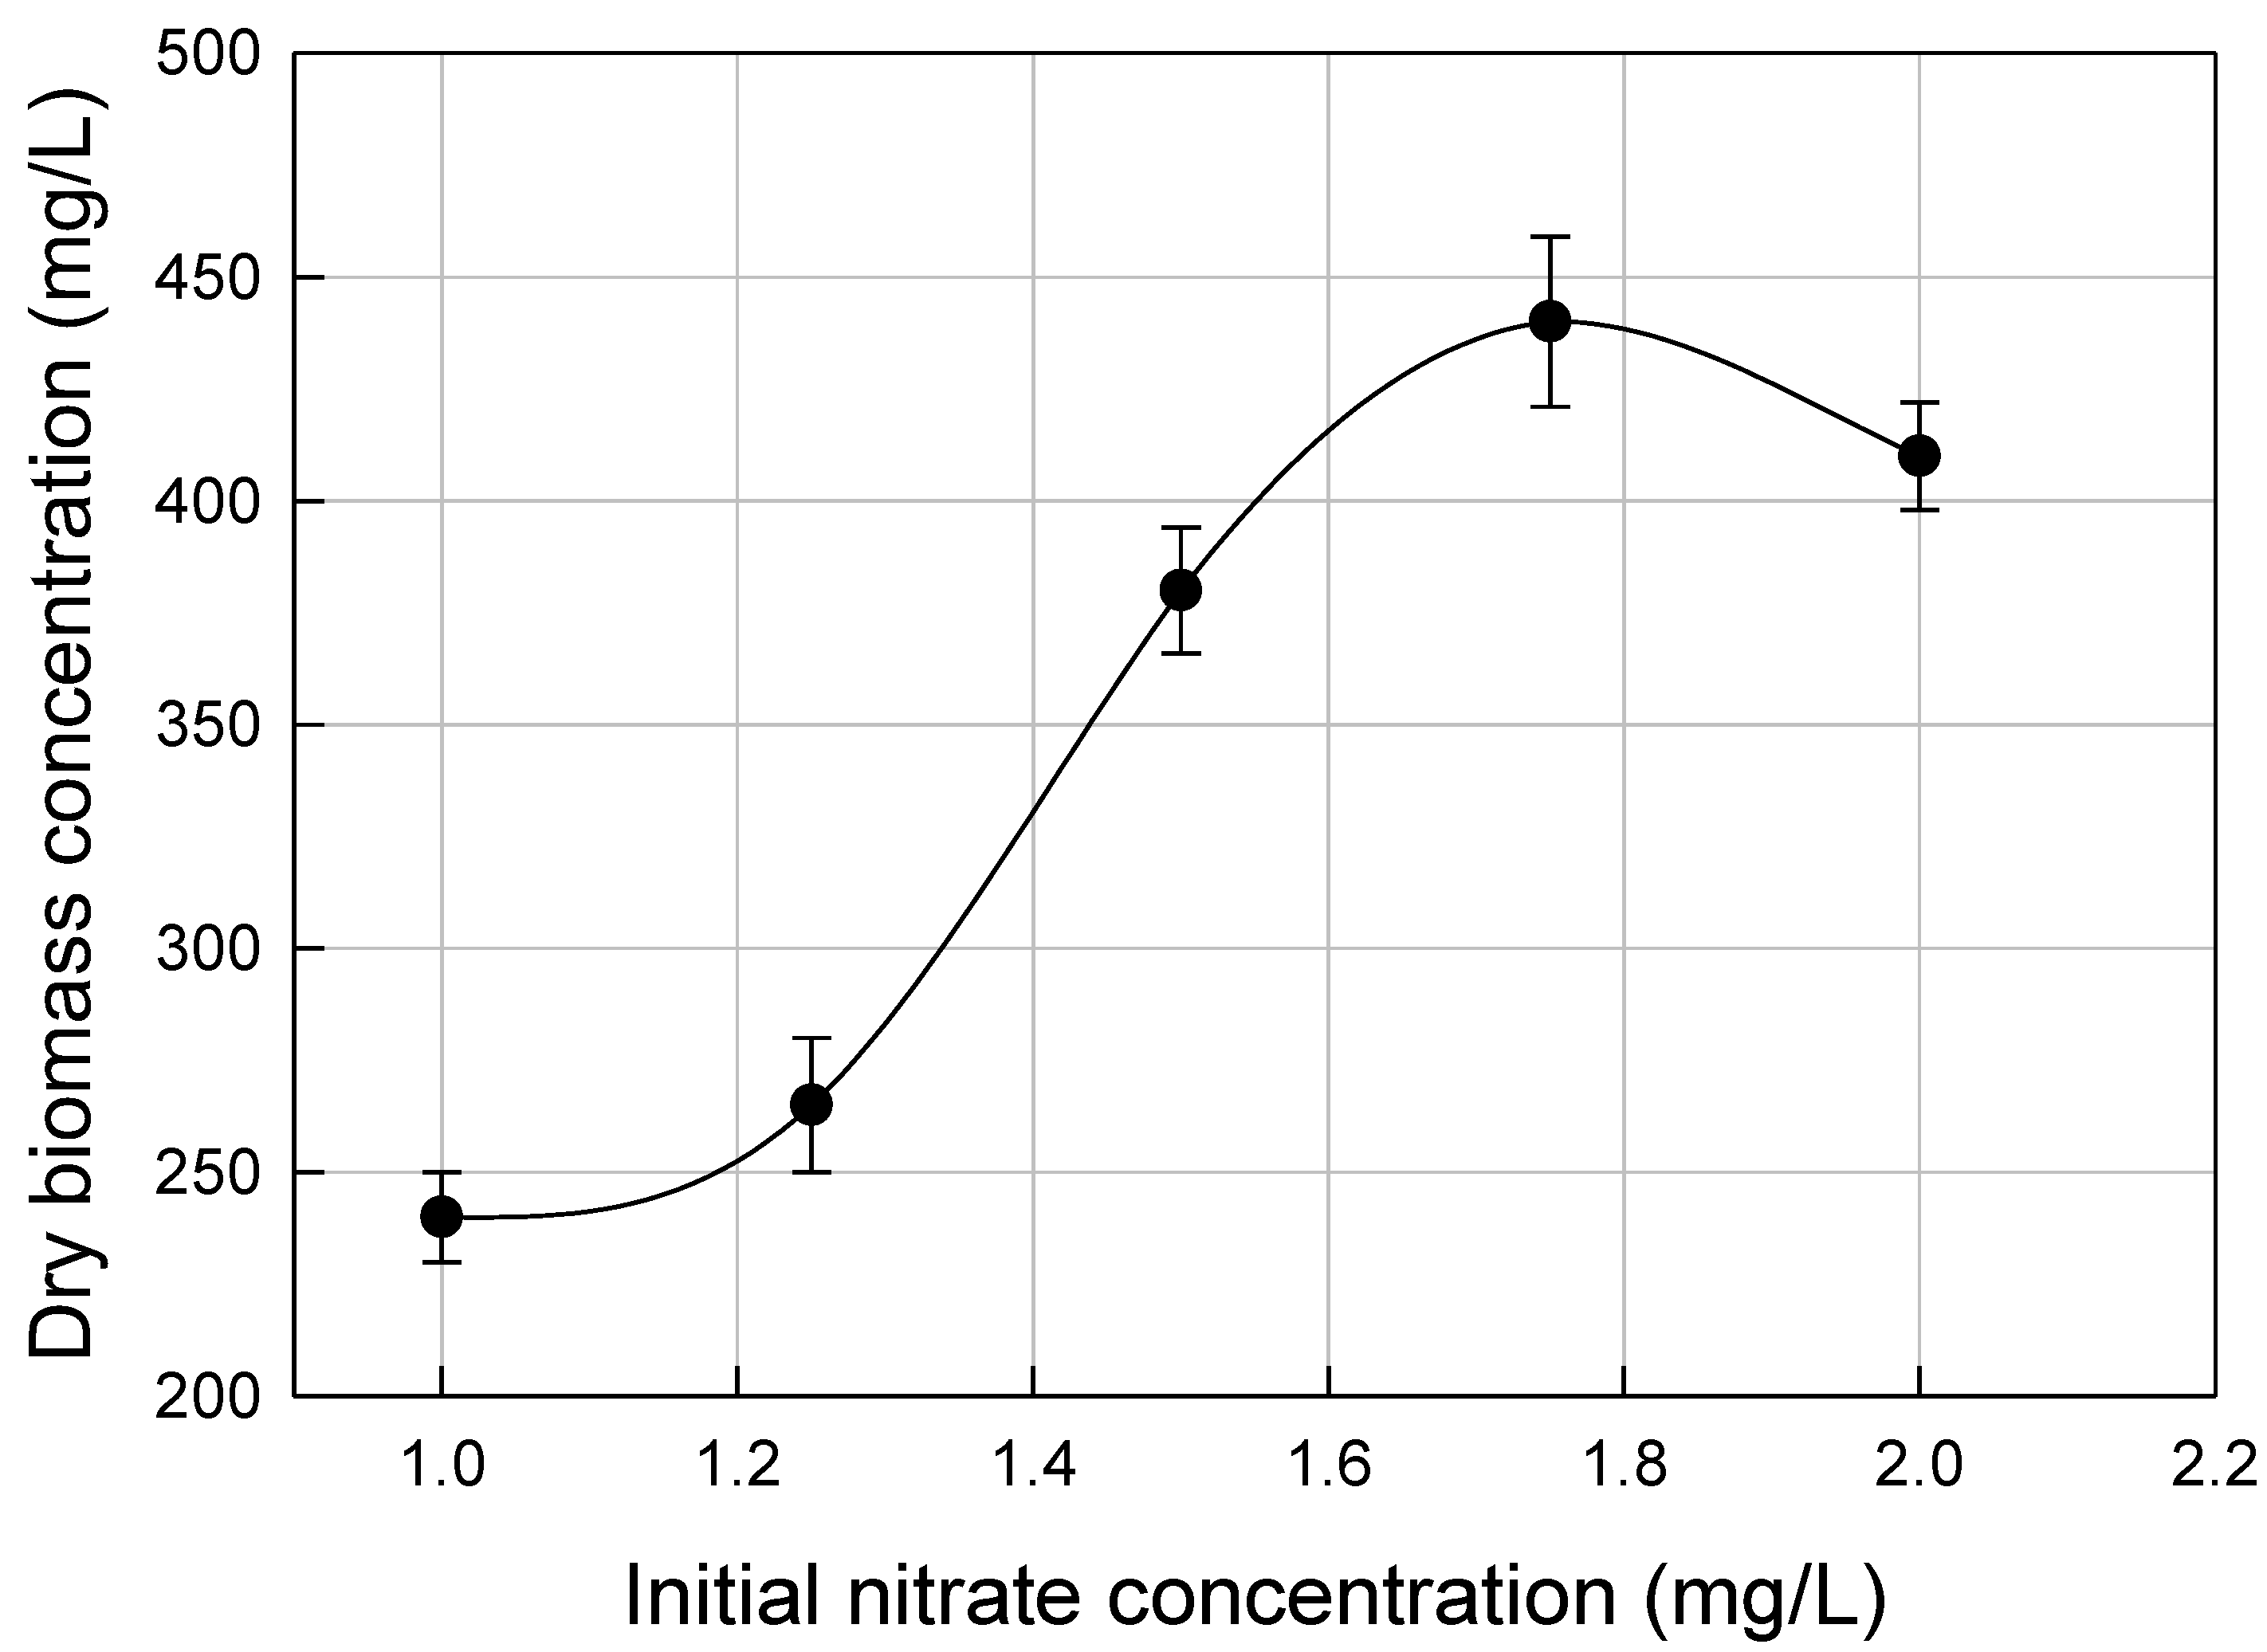
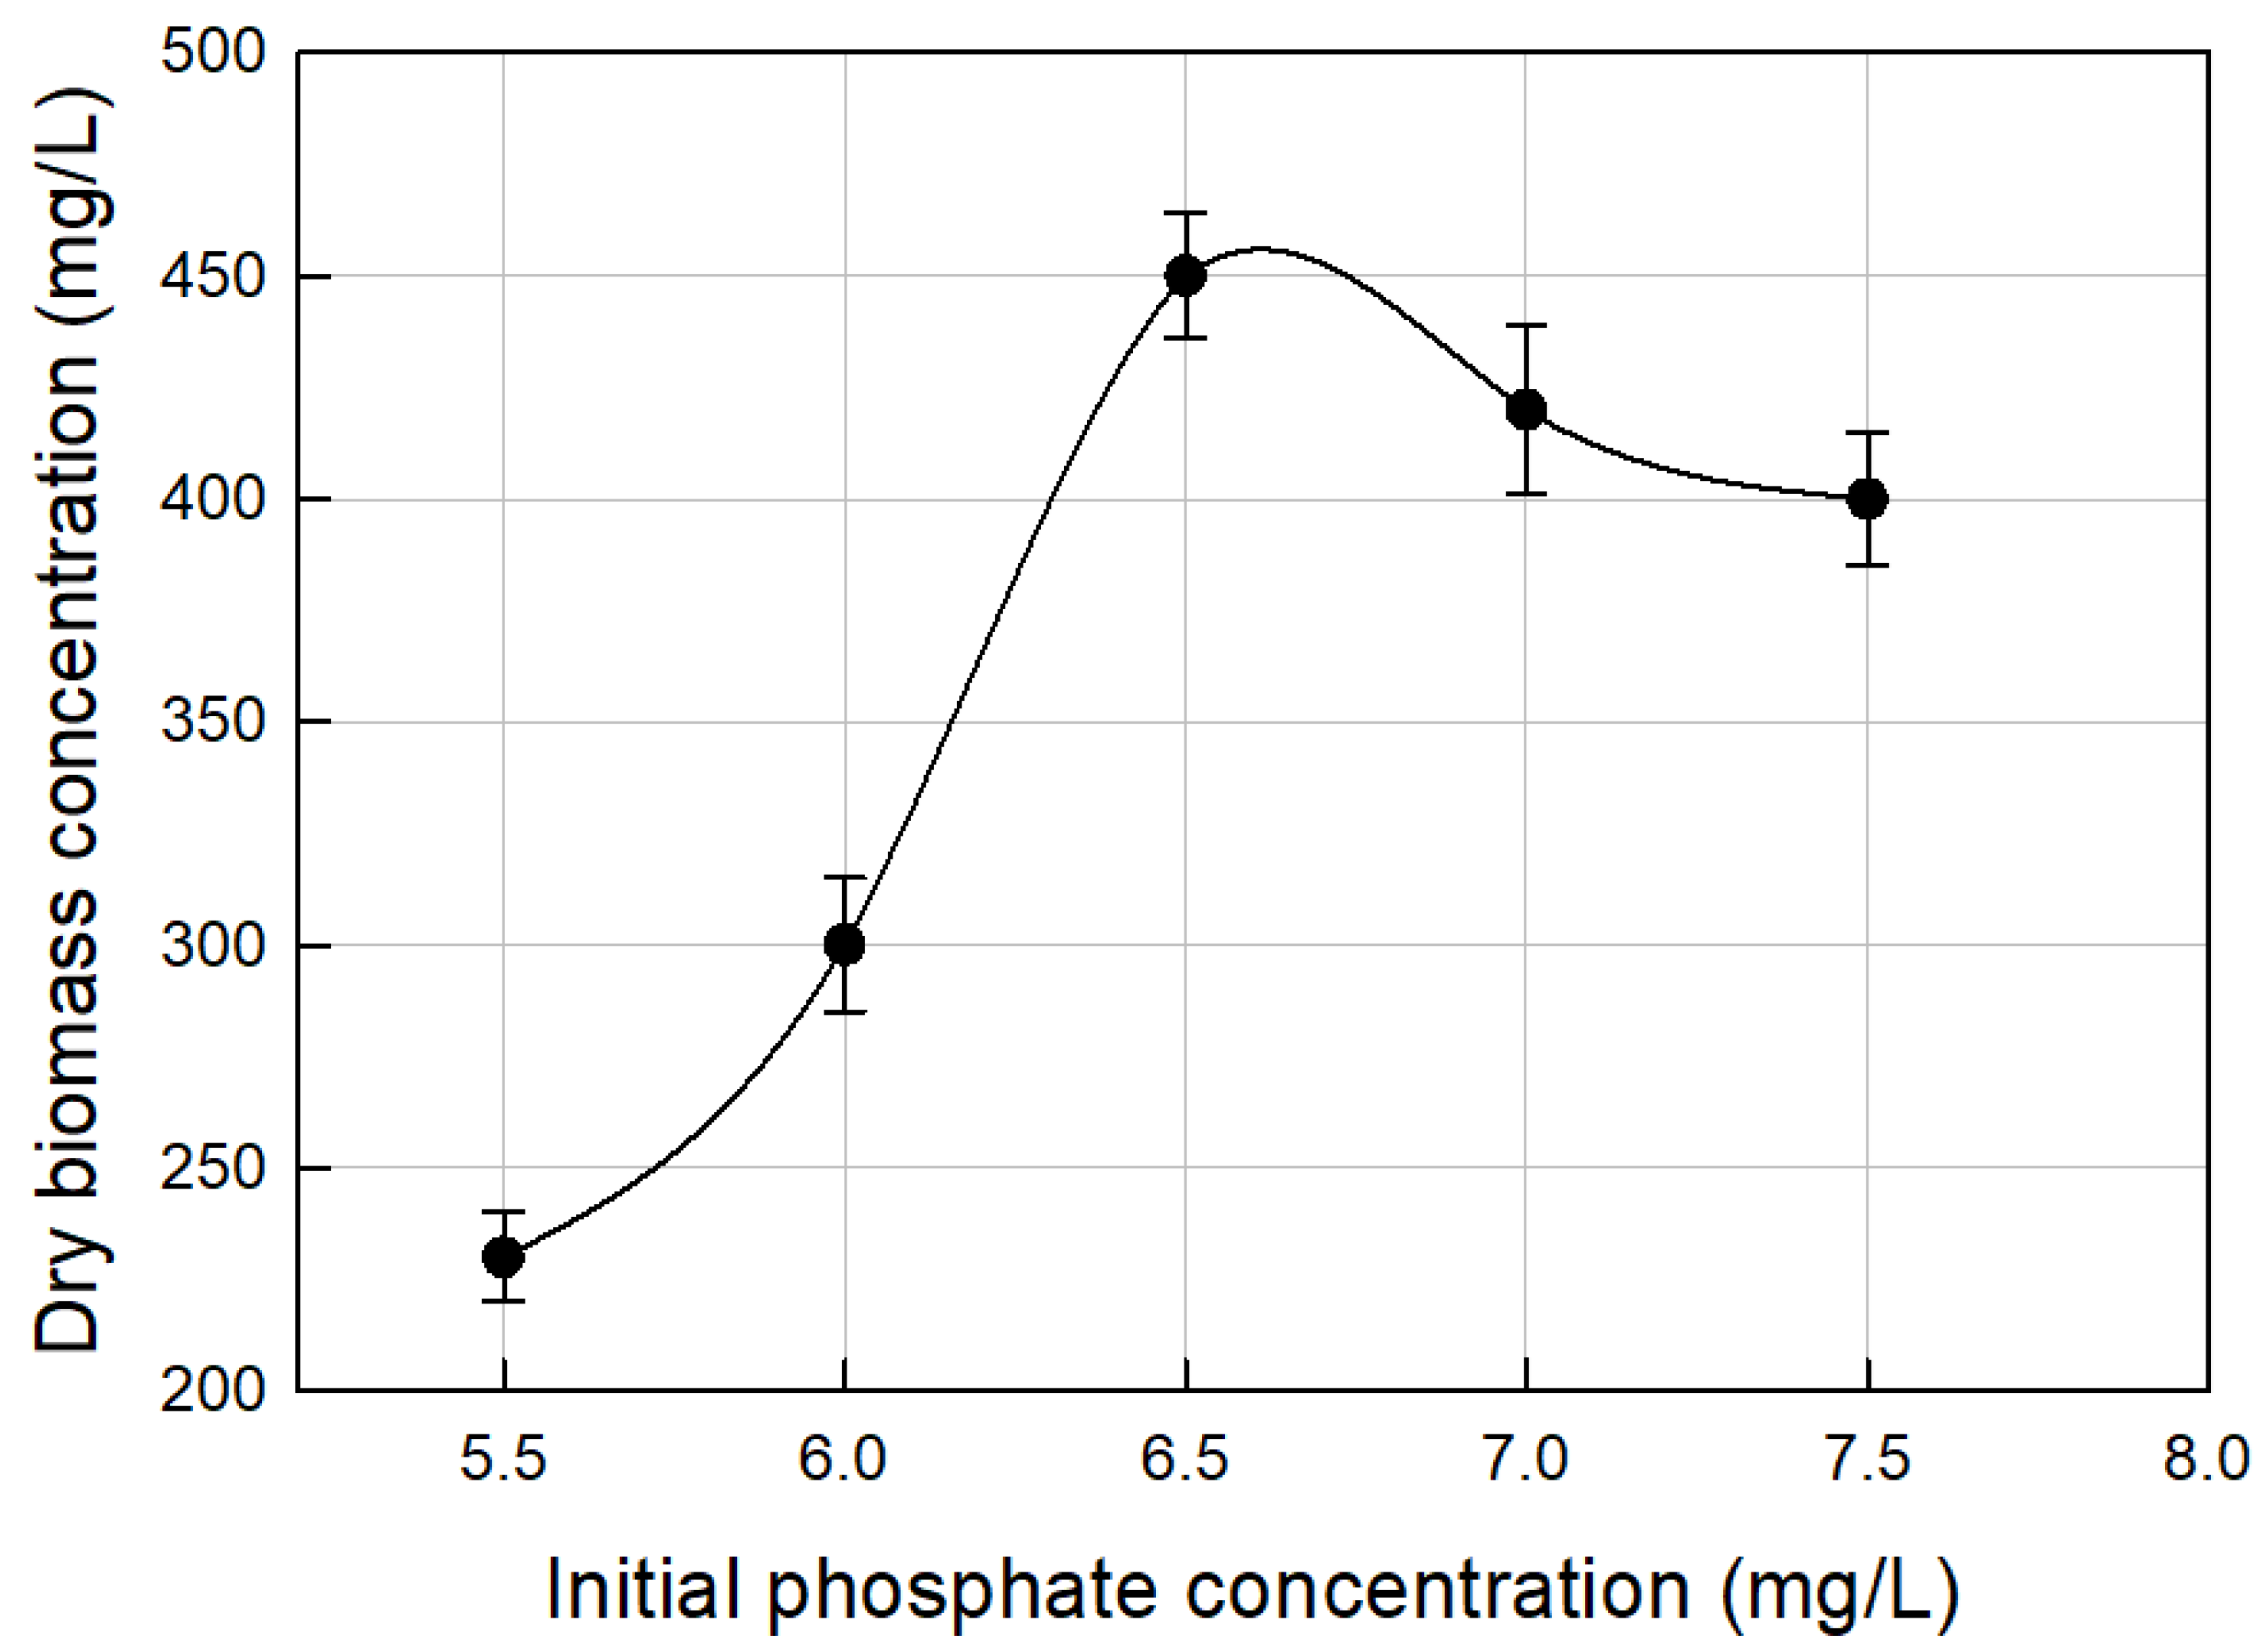
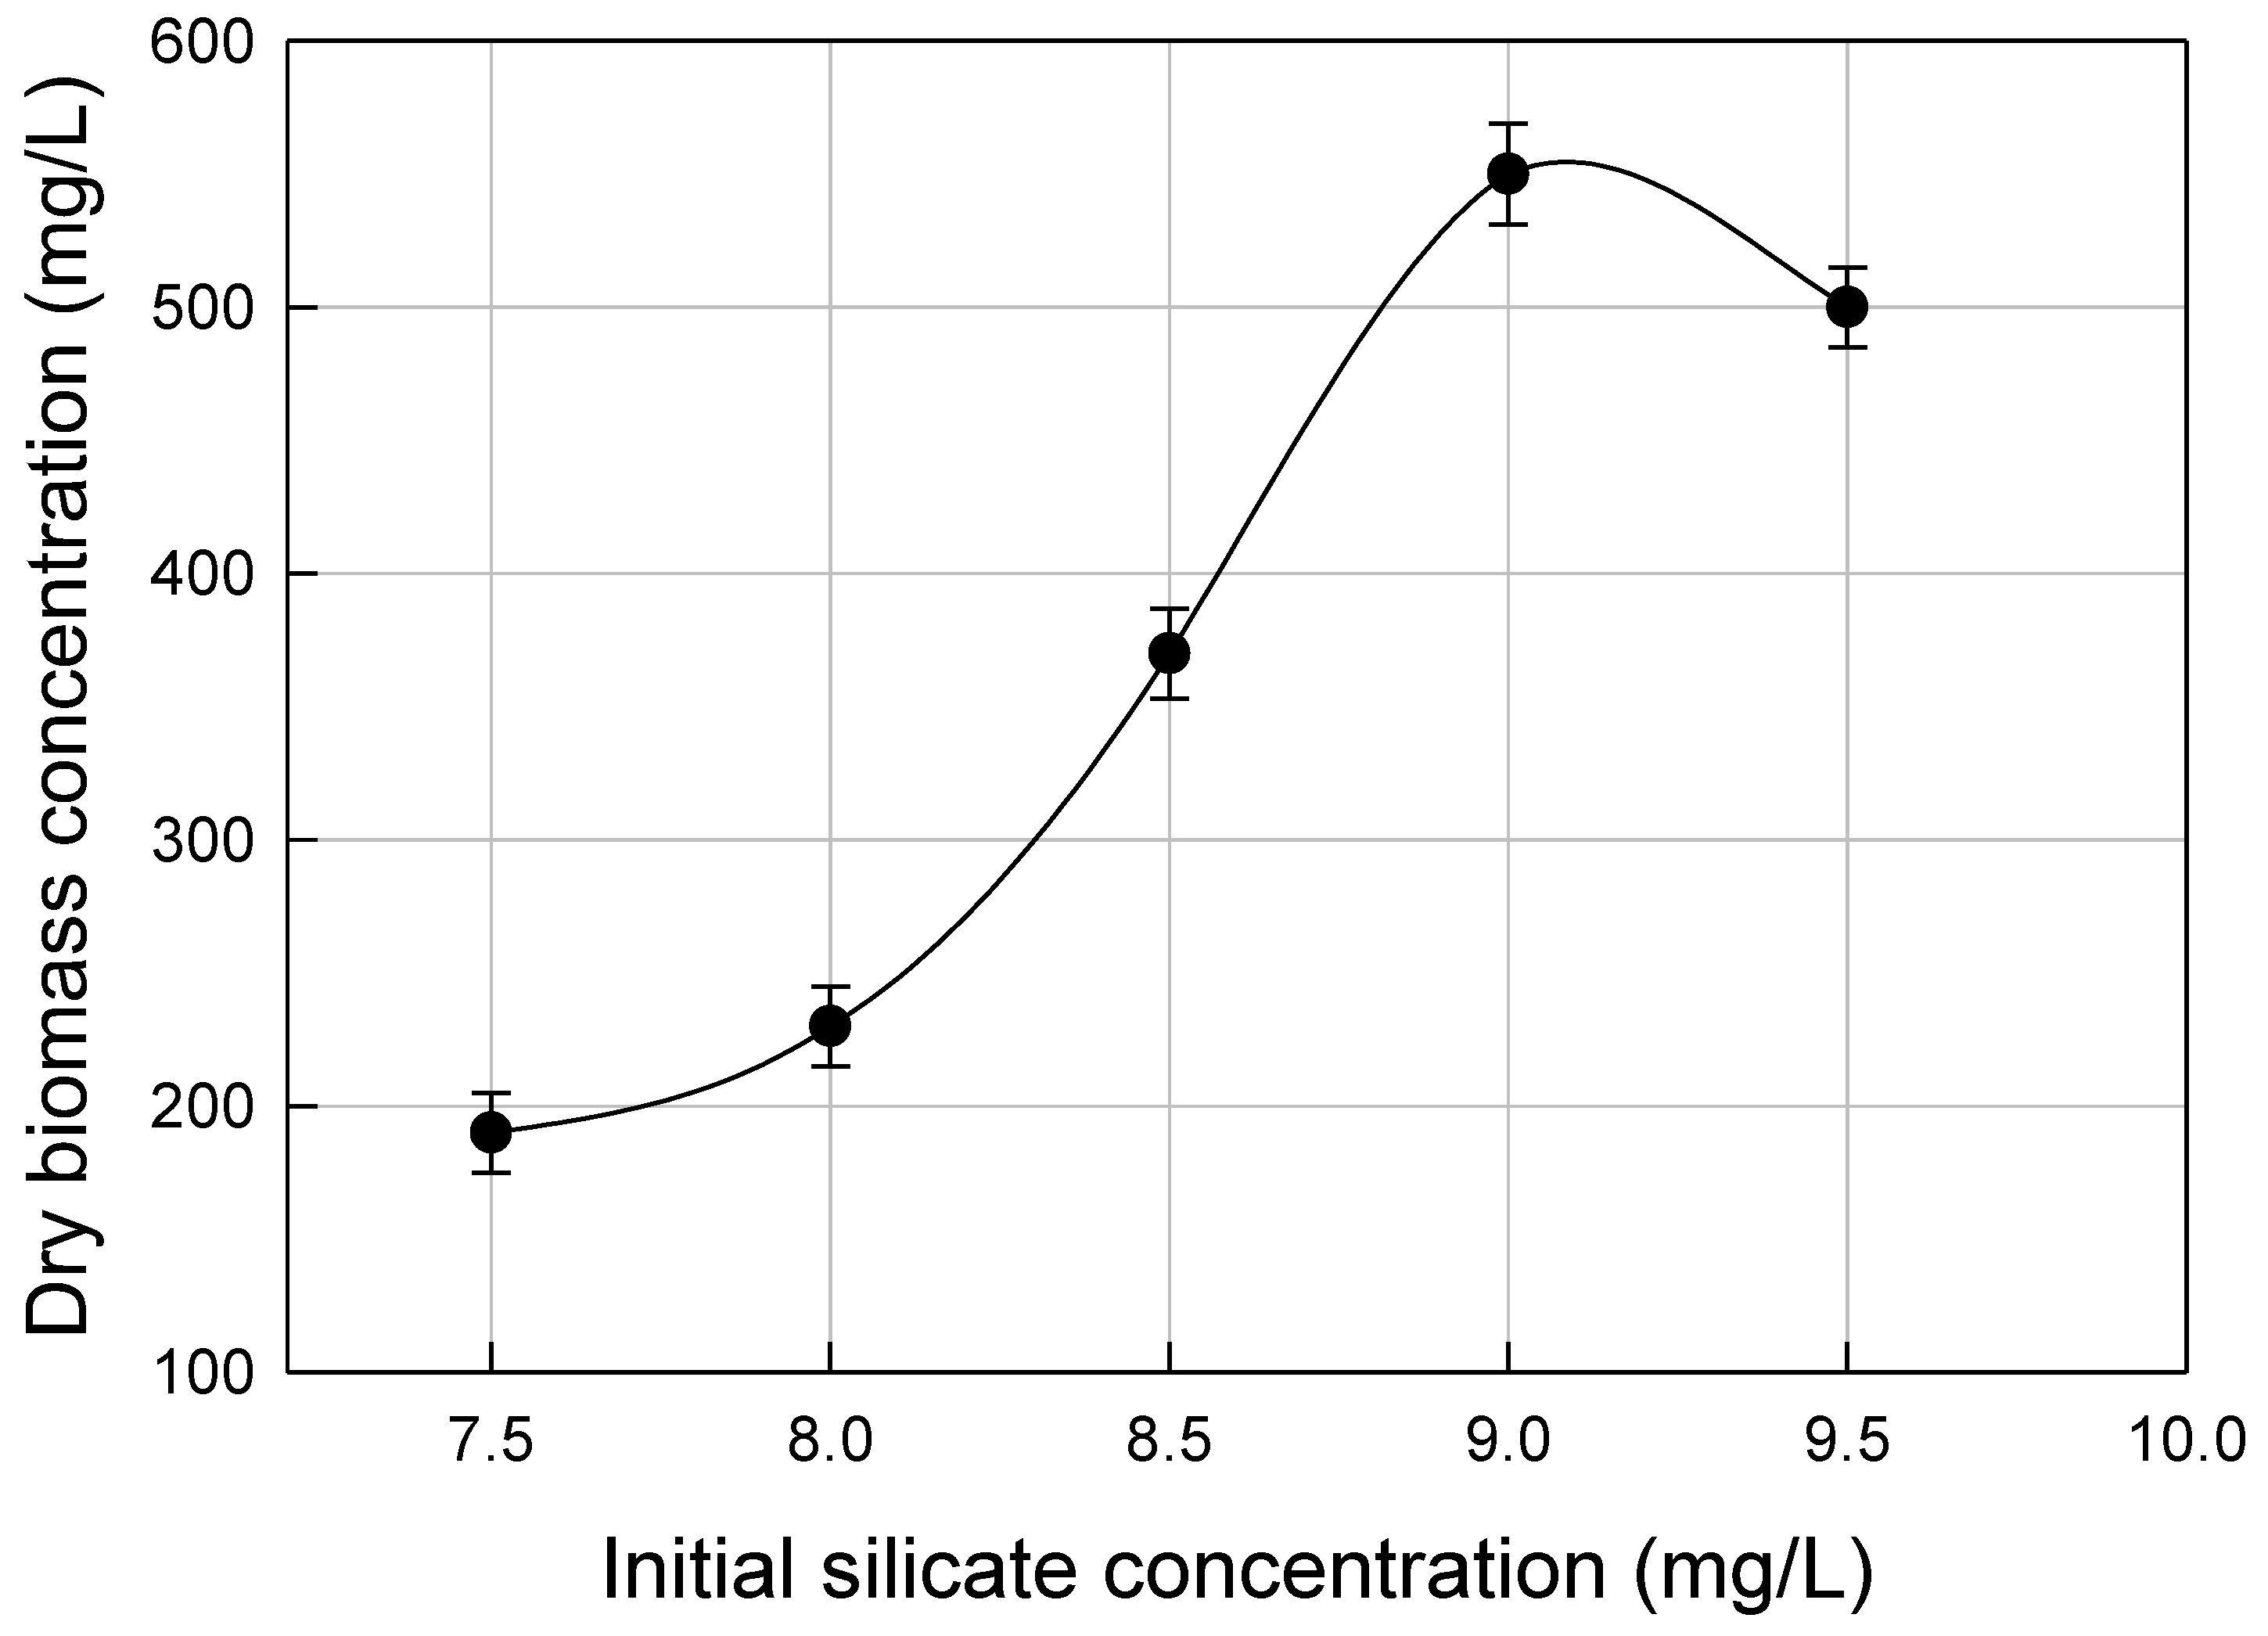
3.2. Nutrients Optimization

Concentration of nitrate was optimized first. As POME contained some of the required N and P (Table 1), and NPK fertilizer also contributed N and P (Section 2.3), only low levels of supplemental N needed to be tested. In a similar POME-based medium with NPK, a supplemental nitrate level of 1.8 mg L−1 (as NaNO3) had been earlier found to be optimal for maximizing lipid production in a different diatom isolated from the same coastal zone [4] as A. copulata of the present study. Therefore, the earlier identified optimal level was used as a guide and the actual supplemental nitrate concentrations spanned this value. The actual initial supplemental nitrate concentrations were 1.00, 1.25, 1.50, 1.75, and 2.00 mg L−1 (as NaNO3) in different experiments. As there was no other source of silicate, all media for optimizing the nitrate concentration included silicate at an initial concentration of 8.5 mg L−1 (as Na2SiO3⋅9H2O). This value was a little less than the 10.1 mg L−1 (as specified salt) which had been found optimal for biomass and lipid production in a different marine diatom isolated from the same coastal zone [4] as A. copulata. Phosphate was added to obtain an initial concentration of 6.5 mg L−1 (as NaH2PO4⋅H2O), not accounting for the P contributed by POME and NPK. This added phosphate level was a little less than 6.8 mg L−1 (as NaH2PO4⋅H2O) previously identified to be optimal for the above referenced different marine diatom [4] in a POME-based medium supplemented with NPK exactly as in the present study. The biomass concentration on the final day of 15-day batch cultures was measured in media supplemented with different initial levels of nitrate. The results are shown in Figure 4. The highest biomass concentration occurred in the medium supplemented with an initial nitrate (as NaNO3) level of 1.75 mg L−1 (Figure 4). Therefore, this value was taken to be optimal and it was used in subsequent experiments intended for identifying optimal levels of phosphate and silicate.
The ammonium (11.1 mg L−1), nitrite (1.3 mg L−1) and nitrate (3.1 mg L−1) in POME (Table 1) together were equivalent to N concentration of 9.73 mg L−1. Therefore, with the above specified supplemental nitrate (1.75 mg NaNO3 L−1 ≡ 0.288 mg N L−1) and N from NPK fertilizer (15 mg N L−1; see Section 2.3), the total N level in the medium was around 25.0 mg N L−1 (1.8 mM).
In the next set of experiments, the initial concentrations of nitrate and silicate were fixed at 1.75 mg L−1 (as NaNO3) and 8.5 mg L−1 (as Na2SiO3⋅9H2O), respectively, and the initial phosphate concentration was varied (5.5, 6.0, 6.5, 7.0, and 7.5 mg L−1, as NaH2PO4⋅H2O) in different experiments. The noted range of initial phosphate concentrations spanned a concentration of 6.8 mg L−1 (as specified salt) that had been identified as optimal for a different diatom in a similar POME-based medium supplemented with NPK [4]. The final biomass concentration attained in 15-day batch cultures in media with different initial phosphate levels is shown in Figure 5. The initial phosphate concentration that maximized biomass production was 6.5 mg L−1 (as NaH2PO4⋅H2O) (Figure 5), nearly the same as the previously identified optimal phosphate concentration for the diatom Gyrosigma sp. [4].
POME provided phosphate at the level of 5.5 mg L−1 (Table 1), equivalent to 1.7 mg P L−1. The optimal supplemental phosphate concentration (6.5 mg L−1, as NaH2PO4⋅H2O) corresponded to a P level of 1.5 mg L−1. NPK fertilizer contributed 3.3 mg P L−1. Therefore, the total P concentration in the medium was around 6.5 mg P L−1 (0.21 mM).
At optimal supplemental phosphate concentration (6.5 mg L−1, as specified salt), the total P concentration in the medium was 6.5 mg P L−1 (0.21 mM). For some freshwater diatoms in P-limited growth, the P-content of the biomass was constant for a given species, but ranged from 0.12 to 0.58% depending on the species [64]. Notwithstanding this, for a given diatom the P-content of the biomass can vary broadly [65,66], and P content of between 0.9 and 1.3% by weight have been recorded in the biomass of microalgae in general [67,68]. If the biomass was assumed to contain between 0.9 and 1.3% P, the available P would support a final biomass concentration of between 500 and 722 mg L−1. As the actual maximum biomass concentration was close to the estimated limits (Figure 5), the culture likely experienced borderline P limitation. For many diatoms, the growth limiting concentration of P has ranged from 1.3 to 30 µg P L−1 (0.04–0.97 µM) [69,70]. Thus, the optimal initial P concentration was at least 218-fold greater than the limiting level.
The next set of experiments focused on identifying the optimal initial concentration of silicate. In these experiments, the initial nitrate and phosphate levels were fixed at 1.75 mg L−1 (as NaNO3) and 6.5 mg L−1 (as NaH2PO4⋅H2O), respectively, and the initial silicate concentration varied (7.5, 8.0, 8.5, 9.0, and 9.5 mg L−1, as Na2SiO3⋅9H2O) in different experiments. The lowest level of the initial silicate concentration was selected to be less than the 10.1 mg L−1 (as specified salt), a level that had earlier been found optimal in a similar medium for the diatom Gyrosigma sp. [4] isolated from the same ecosystem as A. copulata of the present study. The final biomass concentration obtained in 15-day batch cultures in media with different initial silicate levels is shown in Figure 6. According to Figure 6, the optimal silicate concentration was around 9.0 mg L−1 (as specified salt), comparable to the previously identified optimal level for Gyrosigma sp. [4].
Any more nutrients than the identified optimal levels seemed to actually inhibit biomass production (Figure 4, Figure 5 and Figure 6). The optimization method focused on providing just sufficient levels of phosphate, nitrate, and silicate, to ensure maximum final biomass concentration for the given light level, but not an excess of nutrients that could interfere with lipid accumulation in the biomass postgrowth. This approach was used because limitations of one or more of nitrate, phosphate, and silicate, postgrowth, have often been found to promote lipid accumulation in diatoms [2,4,5,11,47,71,72,73,74], for the reasons discussed in the cited literature.
In conclusion, an optimal medium for maximizing biomass concentration in a 15-day batch culture (25 °C, irradiance of 130 µmol m−2 s−1, 16 h/8 h light-dark cycle) was the following: diluted POME wastewater (1 L, Table 1) supplemented with NPK 20-10-10 commercial fertilizer (75 mg L−1), nitrate (1.75 mg L−1, as NaNO3), phosphate (6.5 mg L−1, as NaH2PO4⋅H2O), silicate (9.0 mg L−1, as Na2SiO3⋅9H2O), trace metals (as in f/2; Section 2.2) and vitamins (as in f/2; Section 2.2).

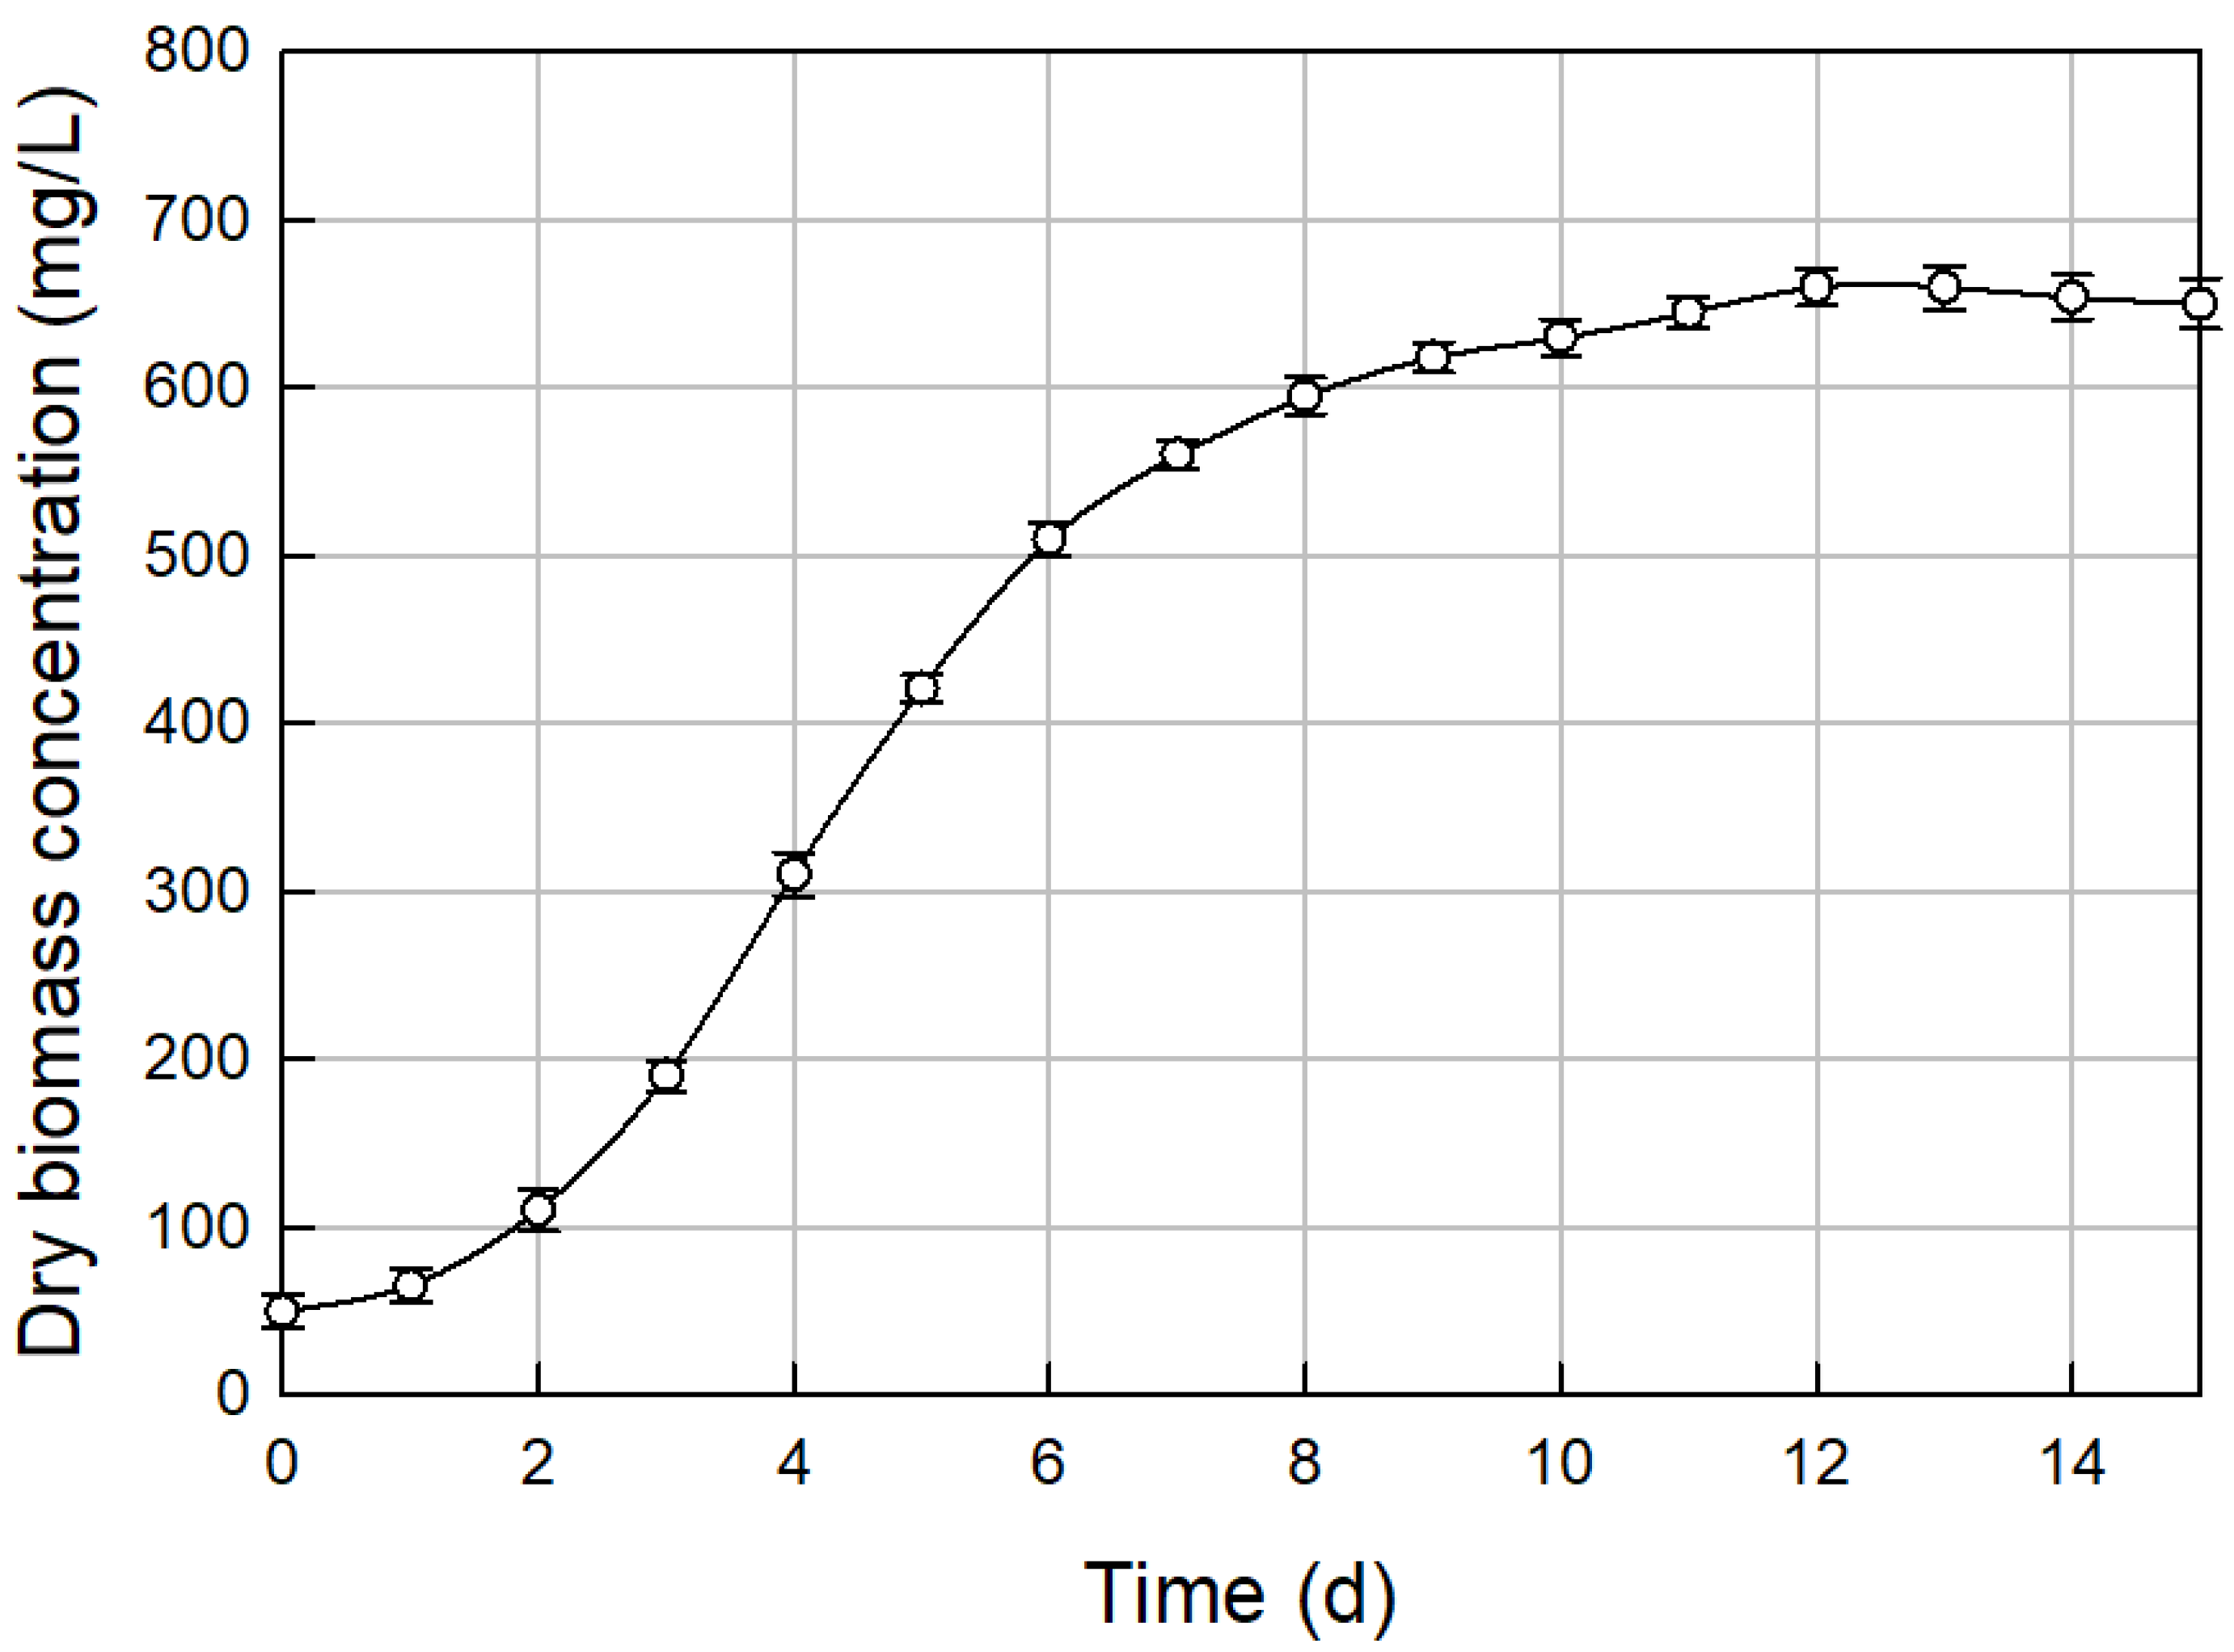
3.3. Biomass Growth in Optimal Medium

The biomass growth curve in the optimal medium is shown in Figure 7. The maximum biomass concentration was 660 mg L−1 on day 12 (Figure 7) and the final (i.e., day 15) biomass productivity was 43.3 ± 4.5 mg L−1 d−1. Based on Figure 7, the maximum specific growth rate during exponential growth was 0.523 d−1. Exponential growth occurs typically early during a batch culture when all dissolved nutrients are relatively plentiful and light is above its limiting level because its penetration in the culture is not yet impeded by self-shading by a high population of cells. The light level (130 µmol m−2 s−1) in the present work was nonlimiting during exponential growth, as it was higher than the saturation light levels that have been reported for diatoms (29 to 70 µmol m−2 s−1; [75,76]).
The culture temperature was relatively warm (25 °C). Relatively modest growth rates (e.g., 0.07–0.46 d−1 at light levels of 70–115 µmol m−2 s−1 (all these were greater or equal to the above cited light saturation levels) and temperatures of 4–18 °C) have been found for many cold water diatoms [77]. For species able to grow at ~24 °C, as in the present work, the specific growth rate may be as high as ~0.80 d−1 [78], or higher, as growth rate generally increases with temperature until the optimal growth temperature is reached. For 17 diatoms cultured at 20 °C under nonlimiting light (irradiance = 200 µmol m−2 s−1; 14 h/10 h light-dark cycle), the doubling time was reported to be in the range of 0.625 to 2 days [79]. Therefore, the specific growth rates were (specific growth rate = (ln 2)/doubling time) between 0.347 and 1.109 d−1. The specific growth rate of A. copulata (0.523 d−1) in the present work was closer to the lower end of this range.
Silicon (Si) is necessary to enable diatoms to build the frustule. The silica content of cells is affected by the culture conditions including Si limitation. In some species, the Si content per cell may decline under Si-limitation with the cells developing thinner frustules whereas other species may cease to grow in Si deficiency [80]. Published data suggest a silicic acid [Si(OH)4] concentration of >20 µM to be a nonlimiting level of Si for most diatoms at a growth temperature of around 25 °C [81]. The identified optimal silicate concentration of 9.0 mg L−1 (as specified salt) for A. copulata was equivalent to an initial Si concentration of 31.7 µM that was clearly in excess of the growth limiting concentration at the beginning of the culture, but certainly declined to below the growth limiting level towards the end. This could be inferred based on data published for the salt-tolerant brackish-water diatom Cyclotella cryptica grown at 25 °C under constant illumination (85 µmol m−2 s−1) [73]. This diatom reduced the culture Si concentration from 430 µM to <3.2 µM while, “still in the exponential phase of growth” [73]. The specific growth rate of C. cryptica in Si replete culture was 1.24 d−1 [73]. In most batch cultures, exponential growth does not persist for longer than 4 days because of the light limitation caused by self-shading by the cells as the population increases. Therefore, C. cryptica consumed ~427 µM silica in under 4 days. In the present work, the starting concentration of Si was ~7% of the starting concentration used by Roessler [73] whereas the culture ran for 15 days, well past the exponential growth phase. Therefore, there is good reason to assume that Si was exhausted much earlier than day 15. On a per cell basis, marine diatoms on average contain much less silicon than freshwater diatoms [82]. A. copulata is a freshwater diatom whereas C. cryptica is generally considered to be a marine species. Therefore, for otherwise similar initial culture conditions and growth rates, A. copulata can be reasonably expected to consume available Si faster than C. cryptica.
Models of Si-dependent growth suggest that diatoms starved of Si release increasing amounts of dissolved organic carbon because the cell growth is slowed more rapidly compared to the rate of degradation of photosystems [83]. This loss of organic carbon from the cells may explain the decline in biomass concentration seen in Figure 7 after day 12, although the onset of Si-limitation certainly occurred much earlier as explained above.
Silicon content of a given diatom can vary tremendously, depending on growth conditions. For some freshwater diatoms in Si-limited growth, the Si content in the biomass was found to remain constant: depending on species, the Si content ranged from 1.8 to 14.9% of the dry biomass [64]. If these values are used as a guide, production of 660 mg biomass L−1 as in Figure 7, should require between 11.9 and 98.3 mg Si L−1. The identified optimal silicate concentration (9.0 mg L−1, as Na2SiO3⋅9H2O) was equivalent to 0.9 mg Si L−1 and, therefore, the culture was already Si-limited at the start with a biomass concentration of ~50 mg L−1 around day 3 (Figure 7). For a given species, the Si content per cell can vary by 7-fold, or more, depending on growth conditions [84] without any apparent ill effects. Therefore, growth can continue at limiting Si levels with a reducing average Si content per cell.
Uptake of silicic acid (Si(OH)4) from the culture medium requires metabolic energy [85]. In freshwater diatoms such as Nitzschia alba, membrane-mediated Si-uptake system follows Michaelis-Menten type saturation kinetics with a Si(OH)4 half-saturation constant of around 4.5 µM at 30 °C [85]. This was equivalent to a silicate concentration of 0.34 mg L−1. This suggests a growth limiting level of Si to be around 9 µM, or ~0.7 mg silicate L−1. In other work, half-saturation constants for silicate uptake have ranged from 0.7 to 2.3 µM [70,86,87,88,89], equivalent to a mass concentration range of 0.05 to 0.18 mg silicate L−1. Based on this analysis, the cultures in Figure 7 were Si-limited well before day 15.
Frustule development may be inhibited in spite of Si-sufficiency, if N is limiting, and possibly also under phosphate limitation. This is because long-chain polyamines are required for the silicification process [90], and synthesis of these N-rich polymers is unlikely to occur in media with insufficient nitrogen. Furthermore, silica polymerization by long-chain polyamines needs the presence of polyanions such as phosphate or pyrophosphate [90], thus phosphate limitation may interfere with frustule development irrespective of the availability of N and Si. In the present work, the cultures were limited at least by N and Si and this suggests that the diatom had thinner frustules and less Si per cell than what might be possible for this species in nutrient replete growth.
Nitrogen is required for the synthesis of essential cellular components including DNA, RNA, protein, and chlorophyll. Normal growth cannot occur in the absence of nitrogen, but elemental composition of the biomass can vary a lot depending on the nutrients available and other environmental factors [65,66]. For four freshwater diatoms, the N content of the biomass grown under N-limiting conditions was 4.2 to 6.7%, depending on species [64], but N-content can approach 12% of dry mass in a nonlimiting medium [4]. Thus, for a maximum biomass concentration of 660 mg L−1 as in Figure 7, the N requirement for nutrient sufficient growth could range from 27.7 to 79.2 mg N L−1. The actual N available in the medium was around 25.0 mg L−1. Therefore, the culture was evidently N-starved in latter stages of growth (Figure 7). Thus, the effects of N, P, and Si on diatom growth are interdependent. Growth slows, or ceases, under N-limitation [83] irrespective of whether excess P and Si are available. As previously noted, inorganic nutrient starvation in latter stages of a culture favors lipid accumulation [2,4,5,11,45,47] in the biomass so long as carbon is plentiful.
In the present work, carbon was always in excess because carbon dioxide was bubbled continuously and dissolved organic carbon was provided as COD (Table 1). Chemical oxygen demand (COD) is the mass of molecular oxygen required to oxidize the dissolved organic carbon to CO2 in a given volume of effluent. As each mole of molecular oxygen is equivalent to a mole of elemental carbon, in terms of elemental C, the dissolved carbon concentration in POME was 555 mg L−1 for the measured COD level (Table 1). In terms of glucose equivalents, the measured COD corresponded to a glucose concentration of 1.4 g L−1. Dissolved organic carbon likely reduced the consumption of carbon dioxide relative to a purely photoautotrophic culture.
In the final medium, POME partly substituted for the expensive high-grade water. In addition, it provided all the dissolved organic carbon, ~39% of the N and ~26% of P.

3.4. Lipid Content and Productivity

At harvest (day 15, Figure 7), the total lipid content of the A. copulata biomass was high (39.5 ± 4.5% dry wt basis). For comparison, under optimized conditions, A. subtropica was reported to have only 19% lipids in the biomass [91]. Lipid content of several other diatoms especially Amphora spp., are shown in Table 2. Although few Amphora spp. have been investigated, many of them seem to be able to accumulate high levels of lipids (Table 2). Compared to many of the diatoms in Table 2, A. copulata had a higher lipid content in the biomass, but A. exigua could accumulate more lipids under certain conditions. Only 8 of the 26 diatoms in Table 2 accumulated more lipids than A. copulata under suitable conditions.
Table 2. Lipid content of some diatoms.
DiatomLipids in Biomass (%, w/w)Reference
Amphora angusta21.4[92]
Amphora arenaria24.7[92]
Amphora bigibba34.3–39.2[93]
Amphora coffeaeformis36.2[94]
Amphora copulata39.5This work
Amphora exigua33.2–45.0[93]
Amphora exigua18.1[95]
Amphora exigua32.1[92]
Amphora graeffii24.4[92]
Amphora subtropica19.0[91]
Amphora sp.19.3[95]
Caloneis platycephala38.4–42.0[93]
Chaetoceros muelleri31.0–35.2[93]
Cocconeis scutellum30.2–33.4[93]
Cyclotella cryptica19.8–28.3[73]
Cylindrotheca fusiformis23.9[56]
Cylindrotheca sp.31.3–35.0[93]
Gyrosigma sp.70.7[4]
Melosira nummuloides32.8–33.2[93]
Navicula lyra37.6–42.1[93]
Nitzschia grossestriata33.2–41.5[93]
Nitzschia panduriformis32.6–39.9[93]
Phaeodactylum tricornutum31.5[96]
Phaeodactylum tricornutum20.1[95]
Seminavis gracilenta36.0–43.0[93]
Skeletonema costatum36.9–41.4[93]
According to the literature, diatoms do not always have a high lipid content. For example, for 17 isolates the lipid content ranged between 7.6 and 42.0% [79]. In a different study of 11 diatoms, lipid in the biomass was found to range between 10.2 and 38.8% [95]. Lipid level in A. copulata biomass was higher than in 94% of the 17 isolates reported by d’Ippolito et al. [79] and all the 11 species reported on by Orcutt and Patterson [95]. The maximum lipid level in diatom biomass has generally been <45% [97], although higher levels (e.g., 69%) have been reported occasionally [4,97]. Growth conditions influence lipid content, as noted previously.
For 25 diatoms grown at identical conditions (18 °C, 400 µmol m−2 s−1 light level, salinity of 30 g kg−1), the lipid content in the biomass ranged between 17.3 and 34.5% of biomass dry weight [92]. The average lipid content for the 25 species, was 24.5% [92]. Thus, a lipid content >24.5% in a diatom should be viewed as above average. Sixteen percent of the 25 species examined by Scholz and Liebezeit [92] were well above average (lipid content >30%) in their lipid content, despite the culture conditions not having been optimized for lipid accumulation. In the present work, A. copulata had a higher lipid content than the 25 species reported on by Scholz and Liebezeit [92]. This was attributed to the nutrient limited conditions that occurred towards the end of the A. copulata culture.
Lipid accumulation is a well-known response in diatoms and other microalgae subjected to nutrient starvation [2,4,5,11,45,47,71,72,73,74]. For example, under nutrient-sufficient conditions optimized for growth, a lipid content of up to 19% (by dry wt) was reported in the marine diatom Amphora subtropica [91], but this could be raised to 53% by P starvation after nutrient-sufficient growth [71]. Silicate starvation also promotes lipid accumulation [45,72]. Limitation of Si, P and N either individually, or in combination, arrests growth as one or more of these elements are required for synthesis of DNA, RNA, structural lipids, chlorophyll and cell frustule. However, neutral lipids such as triglycerides which do not contain Si, P and N in their molecules continue to be produced so long as carbon and energy are available. This explains the often observed accumulation of neutral lipids under nutrient limiting conditions. In the present work, carbon was always available because of continuous sparging with carbon dioxide. In addition, more energy was potentially available compared to an equivalent photoautotrophic culture because some of the energy could be obtained through heterotrophic oxidation of the dissolved organic carbon in POME (COD in Table 1), if such a capability existed. The metabolism was likely mixotrophic during the light period and heterotrophic in the dark. In other work, many diatoms have been shown to utilize dissolved organic carbon [13,14,27,96] and certain Amphora species have been specifically shown to use heterotrophy [16,17,18,19,20,21]. Heterotrophic and mixotrophic cultures have been shown to also enhance the lipid content of the biomass at least in some cases, compared to photoautotrophic growth [97].
Although a high lipid content in the biomass is wanted because it simplifies lipid recovery in commercial operations, this must be combined with a relatively rapid growth of the biomass to reduce production time. A parameter that combines the lipid content of the biomass and its growth rate, is lipid productivity [3,98]. Lipid, or oil productivity is commonly used in comparing the production potential of different species. Biomass and lipid productivities of some highly productive microalgae are shown in Table 3.
The A. copulata lipid productivity (day 15, Figure 7) was 17.1 ± 0.3 mg L−1 d−1. This was comparable to several of the other diatoms (i.e., A. coffeaeformis, A. subtropica, Cylindrotheca fusiformis; Table 3), although about 25–50% less compared to the diatoms Gyrosigma sp. and Phaeodactylum tricornutum. Oil productivity of A. copulata was far greater than data cited by d’Ippolito et al. [79] for all of the 17 diatom isolates which had productivities in the range of 0.2–7.3 mg L−1 d−1. This may be partly ascribed to the fact that these data [79] were not obtained under conditions optimized specifically for lipid production, although nutrient limitation was shown to enhance lipid productivity to >20 mg L−1 d−1 in the brackish-water diatom Cyclotella cryptica [79]. In outdoor photobioreactors in a subtropical climatic region of China, an average annual biomass productivity of 100–150 metric tons ha−1 was observed for certain diatoms over a multiyear span [99], but the lipid content of the biomass was relatively low (15–20% by wt) and economic production of biofuels from it did not prove feasible.
Compared to A. copulata and the other diatoms, several of the microalgae in Table 3 displayed higher lipid productivities. These may be attributed partly to continuous illumination used in growing them: at identical irradiance levels and culture lengths, a 16 h/8 h light-dark cycled culture as in the present work, would receive at least 30% less light compared to a continuously illuminated culture. In any case, a practicable low-cost large-scale cultivation process must use the freely available sunlight [32] and, therefore, a natural light-dark cycle cannot be avoided. Although a light-dark cycle was used for growing A. couplata, growth was likely partly heterotrophic and mixotrophic because of the dissolved organic carbon in the culture medium. This also applied to the data shown in Table 3 for Gyrosigma sp. [4]. In contrast, most of the other microalgae in Table 3 (i.e., A. coffeaeformis, A. subtropica, C. vulgaris, C. minor, C. fusiformis, N. gaditana, N. oculata, N. salina, Neochloris sp., P. tricornutum, and P. simplex) were grown purely photoautotrophically, and their oil productivity would likely increase greatly in heterotrophic or mixotrophic growth as has been demonstrated for some of them [14,54,100,101,102].
Table 3. Biomass and lipid productivities of some microalgae.
AlgaBiomass Productivity (mg L−1 d−1)Lipid Productivity (mg L−1 d−1)Reference
Amphora coffeaeformis143.0–71.07.6–21.9[94] 6
Amphora copulata243.317.1This work 6
Amphora subtropica1100.019.0[91] 7
Chlorella vulgaris3 (seawater)111.037.1[52] 7
Chlorella vulgaris3 (freshwater)120.018.3[52] 7
Choricystis minor3351.082.0[53] 7
Cylindrotheca fusiformis150.011.4[56] 7
Gyrosigma sp. 134.124.1[4] 6
Nannochloropsis gaditana4150.030.1[100] 7
Nannochloropsis oculata4~110~35[103] 6
Nannochloropsis salina460.031.4[56] 7
Neochloris sp. 5139.032.1[52] 7
Phaeodactylum tricornutum1340.027.2–34.0[104] 6
Pseudococcomyxa simplex5127.022.9[52] 7
1 Marine diatom. 2 Freshwater diatom. 3 Freshwater green microalga. 4 Marine microalga (Eustigmatophyceae). 5 Marine green microalga. 6 These studies used a light-dark cycle. 7 These studies used continuous illumination.

3.5. Issues of Optimality

The purpose of identifying optimal compositions of media and the other culture conditions in the controlled environment of the laboratory is simply to establish a benchmark index of maximum productivity of biomass and lipids. This allows a best-performance comparison among different algal species and, for a given species, a comparison with the culture conditions that can be actually implemented. Large-scale algae culture is typically performed outdoors in open raceway ponds [34,94,105]. In this scenario, influential factors such as temperature and irradiance unavoidably vary diurnally and seasonally. In addition, factors such as irradiance vary with depth in a culture system, irrespective of the incident light level at a given instance. Therefore, implementation of the optimal condition established in the laboratory, in actual production practice is essentially impossible. This proviso notwithstanding, optimal media compositions and culture conditions have traditionally been identified using variation of factors individually while keeping all the other factors at fixed values. This one-at-a-time variation of factors has been widely and successfully used [46,106,107], although a more robust alternative employs simultaneous variation of multiple factors in statistically designed experiments in combination with the response-surface method [57,91,108,109]. The latter approach is considered superior as it takes into account the possible interactive effects of factors on performance outcomes, but the two optimization methods often produce comparable results [46].
In the present work, one-at-a-time variation of factors was used. Only one prior study with a different but related diatom A. subtropica identified optimal production conditions using a formal response-surface method [91]. Under the identified conditions (f/2 medium, 34 °C, 21 h light per day, 60 µmol photons m−2 s−1), a 7-day batch culture resulted in a lipid productivity of 19.0 mg L−1 d−1 (Table 3, row 3). Compared with this, the lipid productivity in the present study was 17.1 mg L−1 d−1 (Table 3, row 2), i.e., 90% of the value reported in the cited reference for a closely related diatom [91]. Therefore, the productivity determined in the present work is credible and nearly as high as the formal optimal identified for a closely related diatom. Furthermore, of the 11 Amphora (including the present one) listed in Table 2, the diatom grown in the present work had a lipid content among the top two, i.e., among the top 18%. All this suggests that the conditions identified in the present work were close to optimal for lipid production.

3.6. Fatty Acid Profile of the Diatom Lipids

Although much data exists on lipid profiles of various diatoms [8,93,95,110,111,112], nothing appears to have been published on lipids of A. copulata. The fatty acid methyl ester profile of the triglyceride lipids of A. copulata is shown in Table 4. The unsaturated fatty acids were dominant (55.1% of total fatty acids), comprising mostly monounsaturates (44.5% of total fatty acids) and only 10.6% polyunsaturated fatty acids (PUFA). The proportion of saturated fatty acids (44.9% of total) was nearly the same as the proportion of the monounsaturates (Table 4). This was comparable to A. subtropica in which the saturated and monounsaturated fatty acids comprised 35.7% and 30.4% of the total fatty acids, respectively [91]. Palmitoleic acid was by far the most abundant fatty acid (39.8%) followed by palmitic acid (31.9%). These two fatty acids have also been found to be dominant in A. subtropica, where they together comprised 51% of the total fatty acids [91].
Table 4. Fatty acids profiles of Amphora copulata 1 and palm oil.
Fatty Acid (as Methyl Ester)Amount (%, w/w)
A. CopulataPalm Oil 2
Myristic acid (C14:0)6.80.5
Palmitic acid (C16:0)31.940.5
Palmitoleic acid (C16:1)39.80.1
Stearic acid (C18:0)4.55.2
Oleic acid (C18:1)4.743.5
Linoleic acid (C18:2)2.59.3
Linolenic acid (C18:3)0.60.2
Arachidonic acid (C20:4)3.90.0
Eicosapentaenoic acid (C20:5)3.60.0
Tetracosanoic acid (C24:0)1.70.0
Total saturated fatty acids44.946.6
Total unsaturated fatty acids55.153.4
Total monounsaturated fatty acids44.543.6
Total polyunsaturated fatty acids10.69.8
1 Grown in the optimized medium for 15 days. 2 Based on Reference [113].
The total polyunsaturated fatty acid level was low (10.6%, Table 4) compared to 33.9% reported for A. subtropica lipids [91]. The level of the omega-3 fatty acid eicosapentaenoic acid (EPA, C20:5) was also relatively low (3.6% of total fatty acids; Table 4) compared to many diatoms, but similar to 4.2% reported in A. subtropica [91]. Some marine diatoms have been reported to have high levels of EPA. For example, in the marine diatom Phaeodactylum tricornutum, the EPA level ranged from 27 to >30% of the total fatty acids [104,114]. Among PUFA, EPA has often been found to be the most abundant fatty acid in diatoms [8], but in the present study arachidonic acid level was slightly higher than EPA in total lipids (Table 4). A. copulata did not produce detectable levels of docosahexaenoic acid (DHA, C22:6), a long-chain omega-6 fatty acid that is produced by some diatoms [77], although in general diatoms are poor producers of DHA [8,77,93]. For example, among Amphora spp., A. exigua was found to have no detectable DHA during any season whereas A. bigibba had ~1.5% of total lipids as DHA in winter greenhouses (lower temperature and light compared to summer) [93].
An earlier study of four diatoms (all grown at 20 °C), concluded that the most abundant fatty acids in all cases were C14:0, C16:0, C16:1(n-7) and C20:5(n-3) [8], together accounting for 67–77% of the total fatty acids [8]. This was generally consistent with the present work, as the four mentioned fatty acids constituted ~82% of the total fatty acids in A. copulata (Table 4). The content of the four mentioned fatty acids in total fatty acids of A. exigua grown in the summer (25 to 34.5 °C, comparable to the temperature used in the present work) were 87.3% [93], similar to the present work, but reduced to 51.5% during winter (14 to 22.5 °C) [93]. Although this was not investigated, temperature and light level have the potential to alter the fatty acid profile of A. copulata. Notwithstanding these observations, whether abundance of the four mentioned fatty acids is a general phenomenon in diatoms is questionable. For example, in A. bigibba, the four mentioned fatty acids constituted 48.5% of the total fatty acids in winter (temperature = 14 to 22.5 °C) and 57.4% in summer (25 to 34.5 °C) [93].
Palm oil is among the most commonly used oils for making biodiesel [115], therefore, a comparison of A. copulata lipid profile with that of palm oil is of interest as, in principle, algal oils may be an alternative to palm oil for biodiesel [3,5,29,32,79,116] if some of economic hurdles are overcome [33].
The relative proportions of saturated, monounsaturated, and polyunsaturated fatty acids in A. copulata lipid (Table 4) compared closely to palm oil [113]. Other than price, the fatty acid profile of a triglyceride oil is the key factor in determining its suitability as a biodiesel feedstock [117]. Based on its lipid profile, A. copulata oil is essentially equivalent to palm oil and, therefore, it is technically completely satisfactory for making biodiesel. Notwithstanding this, in terms of economics, A. copulata oil is not competitive with palm oil as explained here.
During the last 5-years (January 2015 to April 2020) the average price of palm oil was US$679 per metric ton (Index Mundi, www.indexmundi.com, accessed on 1 March 2021). In comparison, a least-cost scenario estimated a cost of production of €12,600 per ton (dry basis) for algal biomass in 2012 [118]. In 2020, this translated to around US$15,720 per metric ton after correction for inflation using the European consumer price index (ECPI2012 = 96; ECPI2020 ≈ 106). If the biomass contained 39.5% lipid, as was the case for A. copulata, 2.5 tons of biomass would be required for each ton of algal oil, assuming no losses during recovery. Thus, the cost of the biomass for each ton of oil would be US$2.5 × 15,720, or US$39,300. This is already ~58-fold higher than the market price of palm oil, while the costs of extraction of the algal oil from the biomass and its conversion to biodiesel have not yet been included. If, somehow, the biomass could be produced for US$5000 per ton, i.e., around 32% of the above noted cost of production, it will remain prohibitively expensive for making biodiesel.
Many aspect of economics of production of algal oil have been discussed in the literature [33,34,118]. Although algal biomass can be produced relatively cheaply in raceway ponds [34,105] for diverse applications, the cost of production as noted above, is much too high to allow its use as a source of lipids for biodiesel. According to some estimates, the acceptable cost of algal biomass for making biodiesel depends on the prevailing price of crude petroleum [34]. For a biomass with a triglyceride oil content of 40%, and a crude petroleum price of US$65 per barrel (approximate average price of Brent crude during January 2018 to June 2020), the cost of biomass must decline to well below US$100 ton−1 [34] for algal biodiesel to begin to make economic sense.

4. Concluding Remarks

In 15-day batch cultures (25 °C, 130 µmol m−2 s−1 light level with a 16 h/8 h light-dark cycle) the biomass concentration of the diatom Amphora copulata was maximized at 660 mg L−1 on day 13 in a culture medium that contained diluted POME (1 L), commercial NPK 20-10-10 fertilizer (75 mg L−1), nitrate (1.75 mg L−1, as NaNO3), phosphate (6.5 mg L−1, as specified salt), and silicate (9.0 mg L−1, as specified salt) and other nutrients (trace metals, vitamins) at levels found in the standard f/2 medium. With the optimized levels of nitrate, phosphate, and silicate, the lipid content of the biomass harvested on day 15 was 39.5 ± 4.5% by dry weight. The predominant fatty acids in the lipid were palmitoleic acid (31.9%) and palmitic acid (39.8%). The lipid was rich in saturated (44.9% of total lipid) and monounsaturated fatty acids (44.5% of total lipid), with a moderate level (<11%) of polyunsaturated fatty acids. The final average productivities of the biomass and the lipids were 43.3 ± 4.5 mg L−1 d−1 and 17.1 ± 0.3 mg L−1 d−1, respectively. A. copulata proved to be good in accumulating lipids in the optimized medium. In terms of the relative levels of total saturated, monounsaturated and polyunsaturated fatty acids, A. copulata lipid compared closely with palm oil, a feedstock that is commercially widely used in making biodiesel. Evidence suggests that diatoms such as A. copulata can provide triglyceride oils that closely resemble some of the commercial vegetable oils in terms of fatty acid composition.

Author Contributions

Conceptualization, N.G.; investigation, N.G.; writing—original draft, N.G., G.P.M. and M.H.A.R.; methodology, A.Z.S.; validation, A.A. and T.C.; funding acquisition, G.P.M.; project administration, M.H.A.R.; visualization, Y.C.; writing—review and editing, Y.C.; supervision, Y.C. All authors have read and agreed to the published version of the manuscript.

Funding

This work was financially supported by Universiti Malaysia Pahang (UMP) through a Flagship Grant (RDU182205) and an Internal Research Grant (RDU1903125).

Institutional Review Board Statement

Not applicable.

Informed Consent Statement

Not applicable.

Data Availability Statement

All data is contained within the article.

Acknowledgments

The authors gratefully acknowledge Universiti Malaysia Pahang (UMP) for financial support.

Conflicts of Interest

The authors declare no conflict of interest.

References

  1. Yi, Z.; Xu, M.; Di, X.; Brynjolfsson, S.; Fu, W. Exploring valuable lipids in diatoms. Front. Mar. Sci. 2017, 4, 17. [Google Scholar] [CrossRef] [Green Version]
  2. Aratboni, H.A.; Rafiei, N.; Garcia-Granados, R.; Alemzadeh, A.; Morones-Ramírez, J.R. Biomass and lipid induction strategies in microalgae for biofuel production and other applications. Microb. Cell Fact. 2019, 18, 178. [Google Scholar] [CrossRef] [PubMed] [Green Version]
  3. Chisti, Y. Fuels from microalgae. Biofuels 2010, 1, 233–235. [Google Scholar] [CrossRef]
  4. Govindan, N.; Maniam, G.P.; Yusoff, M.M.; Rahim, M.H.A.; Chatsungnoen, T.; Ramaraj, R.; Chisti, Y. Statistical optimization of lipid production by the diatom Gyrosigma sp. grown in industrial wastewater. J. Appl. Phycol. 2020, 32, 375–387. [Google Scholar] [CrossRef]
  5. Levitan, O.; Dinamarca, J.; Hochman, G.; Falkowski, P.G. Diatoms: A fossil fuel of the future. Trends Biotechnol. 2014, 32, 117–124. [Google Scholar] [CrossRef] [PubMed]
  6. Rosly, N.F.; Abdul Razak, R.A.; Kuppusamy, P.; Yusoff, M.M.Y.; Govindan, N. Induction of bioactive compound composition from marine microalgae (Lyngbya sp.) by using different stress condition. J. Coast. Life Med. 2013, 1, 205–209. [Google Scholar]
  7. Unpaprom, Y.; Tipnee, S.; Ramraj, R. Biodiesel from green alga Scenedesmus acuminatus. Int. J. Sust. Green Energ. 2015, 4, 1–6. [Google Scholar]
  8. Zhukova, N.V.; Aizdaicher, N.A. Fatty acid composition of 15 species of marine microalgae. Phytochemistry 1995, 39, 351–356. [Google Scholar] [CrossRef]
  9. Palanisamy, K.M.; Paramasivam, P.; Maniam, G.P.; Rahim, M.H.A.; Govindan, N.; Chisti, Y. Production of lipids by Chaetoceros affinis in media based on palm oil mill effluent. J. Biotechnol. 2021, 327, 86–96. [Google Scholar] [CrossRef] [PubMed]
  10. Cristóbal, G.; Blanco, S.; Bueno, G. (Eds.) Modern Trends in Diatom Identification: Fundamentals and Applications; Springer: Cham, Switzerland, 2020. [Google Scholar]
  11. Leterme, S.C. The oil production capacity of diatoms. Ann. Aquacult. Res. 2015, 2, 1007. [Google Scholar]
  12. Tomas, C.R. (Ed.) Identifying Marine Diatoms and Dinoflagellates; Academic Press: San Diego, CA, USA, 1996. [Google Scholar]
  13. Tuchman, N.C.; Schollett, M.A.; Rier, S.T.; Geddes, P. Differential heterotrophic utilization of organic compounds by diatoms and bacteria under light and dark conditions. Hydrobiologia 2006, 561, 167–177. [Google Scholar] [CrossRef]
  14. Cerón García, M.C.; García Camacho, F.; Sánchez Mirón, A.; Fernández Sevilla, J.M.; Chisti, Y.; Molina Grima, E. Mixotrophic production of marine microalga Phaeodactylum tricornutum on various carbon sources. J. Microbiol. Biotechnol. 2006, 16, 689–694. [Google Scholar]
  15. White, A.W. Growth of two facultatively heterotrophic marine centric diatoms. J. Phycol. 1974, 10, 292–300. [Google Scholar]
  16. Chairatana, C.; Powtongsook, S.; Piyatiratitivorakul, S. Growth of a diatom Amphora delicatissima in dark heterotrophic culture. Songklanakarin J. Sci. Technol. 2003, 25, 205–212. [Google Scholar]
  17. Chansang, H.; Cooksey, K.E. The glucose transport system of Amphora coeffeaeformis (Bacillariophyceae). J. Phycol. 1977, 13, 51–57. [Google Scholar] [CrossRef]
  18. Cooksey, K.E.; Chansang, H. Isolation and physiological studies of three isolates of Amphora (Bacillariopyceae). J. Phycol. 1976, 12, 455–460. [Google Scholar] [CrossRef]
  19. Lewin, J.C.; Lewin, R.A. Auxotrophy and heterotrophy in marine littoral diatoms. Can. J. Microbiol. 1960, 6, 127–137. [Google Scholar] [CrossRef] [PubMed]
  20. Neilson, A.H.; Lewin, R.A. The uptake and utilization of organic carbon by algae: An essay in comparative biochemistry. Phycologia 1974, 13, 227–264. [Google Scholar] [CrossRef]
  21. Rivkin, R.B.; Putt, M. Heterotrophy and photoheterotrophy by Antarctic microalgae: Light-dependent incorporation of amino acids and glucose. J. Phycol. 1987, 23, 442–452. [Google Scholar] [CrossRef]
  22. Furnas, M.J. In situ growth rates of marine phytoplankton: Approaches to measurement, community and species growth rates. J. Plank. Res. 1990, 12, 1117–1151. [Google Scholar] [CrossRef]
  23. Banerjee, A.; Sharma, R.; Chisti, Y.; Banerjee, U.C. Botryococcus braunii: A renewable source of hydrocarbons and other chemicals. Crit. Rev. Biotechnol. 2002, 22, 245–279. [Google Scholar] [CrossRef] [PubMed]
  24. Borowitzka, M.A.; Moheimani, N.R. (Eds.) Algae for Biofuels and Energy; Springer: Dordrecht, The Netherlands, 2013. [Google Scholar]
  25. Bux, F.; Chisti, Y. (Eds.) Algae Biotechnology: Products and Processes; Springer: New York, NY, USA, 2016. [Google Scholar]
  26. Kuppusamy, P.; Yusoff, M.M.; Maniam, G.P.; Govindan, N. Potential applications of diatoms in medicinal and therapeutic approaches—A review. Indian J. Geo-Mar. Sci. 2017, 46, 663–667. [Google Scholar]
  27. Lebeau, T.; Robert, J.-M. Diatom cultivation and biotechnologically relevant products. Part II: Current and putative products. Appl. Microbiol. Biotechnol. 2003, 60, 624–632. [Google Scholar] [CrossRef] [PubMed]
  28. Levine, I.A.; Fleurence, J. (Eds.) Microalgae in Health and Disease Prevention; Academic Press: London, UK, 2018. [Google Scholar]
  29. Pandey, A.; Chang, J.-S.; Soccol, C.R.; Lee, D.J.; Chisti, Y. (Eds.) Biofuels from Algae, 2nd ed.; Elsevier: Amsterdam, The Netherlands, 2019. [Google Scholar]
  30. Posten, C.; Walter, C. (Eds.) Microalgal Biotechnology: Potential and Production; de Gruyter: Berlin, Germany, 2012. [Google Scholar]
  31. Posten, C.; Walter, C. (Eds.) Microalgal Biotechnology: Integration and Economy; de Gruyter: Berlin, Germany, 2012. [Google Scholar]
  32. Jayakumar, S.; Yusoff, M.M.; Rahim, M.H.A.; Maniam, G.P.; Govindan, N. The prospect of microalgal biodiesel using agro-industrial and industrial wastes in Malaysia. Renew. Sust. Energ. Rev. 2017, 72, 33–47. [Google Scholar] [CrossRef] [Green Version]
  33. Chisti, Y. Constraints to commercialization of algal fuels. J. Biotechnol. 2013, 167, 201–214. [Google Scholar] [CrossRef] [PubMed]
  34. Chisti, Y. Raceways-based production of algal crude oil. Green 2013, 3, 197–216. [Google Scholar] [CrossRef]
  35. Chisti, Y. Microalgae biotechnology: A brief introduction. In Handbook of Microalgae-Based Processes and Products: Fundamentals and Advances in Energy, Food, Feed, Fertilizer, and Bioactive Compounds; Jacob-Lopes, E., Maroneze, M.M., Queiroz, M.I., Zepka, L.Q., Eds.; Academic Press: London, UK, 2020; pp. 3–23. [Google Scholar]
  36. Chisti, Y. Introduction to algal fuels. In Biofuels from Algae, 2nd ed.; Pandey, A., Chang, J.-S., Soccol, C.R., Lee, D.J., Chisti, Y., Eds.; Elsevier: Amsterdam, The Netherlands, 2019; pp. 1–31. [Google Scholar]
  37. Chisti, Y. The saga of algal energy. Biotechnol. Adv. 2018, 36, 1553. [Google Scholar] [CrossRef]
  38. Chisti, Y. Society and microalgae: Understanding the past and present. In Microalgae in Health and Disease Prevention; Levine, I.A., Fleurence, J., Eds.; Academic Press: London, UK, 2018; pp. 11–21. [Google Scholar]
  39. Cheah, W.Y.; Show, P.L.; Juan, J.C.; Chang, J.-S.; Ling, T.C. Microalgae cultivation in palm oil mill effluent (POME) for lipid production and pollutants removal. Energ. Convers. Manag. 2018, 174, 430–438. [Google Scholar] [CrossRef]
  40. Emparan, Q.; Jye, Y.S.; Danquah, M.K.; Harun, R. Cultivation of Nannochloropsis sp. microalgae in palm oil mill effluent (POME) media for phycoremediation and biomass production: Effect of microalgae cells with and without beads. J. Water Process Eng. 2020, 33, 101043. [Google Scholar] [CrossRef]
  41. Hariz, H.B.; Takriff, M.S.; Yasin, N.H.M.; Ba-Abbad, M.M.; Hakimi, N.I.N.M. Potential of the microalgae-based integrated wastewater treatment and CO2 fixation system to treat Palm Oil Mill Effluent (POME) by indigenous microalgae; Scenedesmus sp. and Chlorella sp. J. Water Process Eng. 2019, 32, 100907. [Google Scholar] [CrossRef]
  42. Madaki, Y.S.; Seng, L. Palm oil mill effluent (POME) from Malaysia palm oil mills: Waste or resource. Int. J. Sci. Environ. Technol. 2013, 2, 1138–1155. [Google Scholar]
  43. Rana, S.; Singh, L.; Wahid, Z.; Liu, H. A recent overview of palm oil mill effluent management via bioreactor configurations. Curr. Poll. Rep. 2017, 3, 254–267. [Google Scholar] [CrossRef]
  44. Foo, K.Y.; Hameed, B.H. Insight into the applications of palm oil mill effluent: A renewable utilization of the industrial agricultural waste. Renew. Sust. Energ. Rev. 2010, 14, 1445–1452. [Google Scholar] [CrossRef]
  45. Zulu, N.N.; Zienkiewicz, K.; Vollheyde, K.; Feussner, I. Current trends to comprehend lipid metabolism in diatoms. Prog. Lipid Res. 2018, 70, 1–16. [Google Scholar] [CrossRef] [PubMed]
  46. Patel, G.; Patil, M.D.; Soni, S.; Khobragade, T.P.; Chisti, Y.; Banerjee, U.C. Production of mycophenolic acid by Penicillium brevicompactum—A comparison of two methods of optimization. Biotechnol. Rep. 2016, 11, 77–85. [Google Scholar] [CrossRef] [PubMed] [Green Version]
  47. Lombardi, A.T.; Wangersky, P.J. Influence of phosphorus and silicon on lipid class production by the marine diatom Chaetoceros gracilis grown in turbidostat cage cultures. Mar. Ecol. Prog. Ser. 1991, 77, 39–47. [Google Scholar] [CrossRef]
  48. Hendey, N.I. An Introductory Account of the Smaller Algae of British Coastal Waters, Part V, Bacillariophyceae (Diatoms); HMSO: London, UK, 1964. [Google Scholar]
  49. Hustedt, F. Die Süsswasser-Flora Mitteleuropas: Heft 10: Bacillariophyta (Diatomeae), 2nd ed.; Verlag Von Gustav Fischer: Jena, Germany, 1930. [Google Scholar]
  50. Stepanek, J.; Kociolek, P. Amphora copulata. In Diatoms of North America: The Freshwater Flora of Waterbodies on the Atlantic Coastal Plain; Siver, P.A., Hamilton, P.B., Eds.; A.R.G. Gantner Verlag K.G.: Ruggell, Liechtenstein, 2011. [Google Scholar]
  51. Wehr, J.D.; Sheath, R.G. Freshwater Algae of North America: Ecology and Classification; Academic Press: London, UK, 2003. [Google Scholar]
  52. Luangpipat, T.; Chisti, Y. Biomass and oil production by Chlorella vulgaris and four other microalgae—Effects of salinity and other factors. J. Biotechnol. 2017, 257, 47–57. [Google Scholar] [CrossRef] [PubMed]
  53. Mazzuca Sobczuk, T.; Chisti, Y. Potential fuel oils from the microalga Choricystis minor. J. Chem. Technol. Biotechnol. 2010, 85, 100–108. [Google Scholar] [CrossRef]
  54. Bouyam, S.; Choorit, W.; Sirisansaneeyakul, S.; Chisti, Y. Heterotrophic production of Chlorella sp. TISTR 8990—Biomass growth and composition under various production conditions. Biotechnol. Prog. 2017, 33, 1589–1600. [Google Scholar] [CrossRef]
  55. Bligh, E.G.; Dyer, W.J. A rapid method of total lipid extraction and purification. Can. J. Biochem. Physiol. 1959, 37, 911–917. [Google Scholar] [CrossRef] [Green Version]
  56. Chatsungnoen, T.; Chisti, Y. Oil production by six microalgae: Impact of flocculants and drying on oil recovery from the biomass. J. Appl. Phycol. 2016, 28, 2697–2705. [Google Scholar] [CrossRef]
  57. Chatsungnoen, T.; Chisti, Y. Optimization of oil extraction from Nannochloropsis salina biomass paste. Algal Res. 2016, 15, 100–109. [Google Scholar] [CrossRef]
  58. Schoeman, F.R.; Archibald, R.E.M. Observations on Amphora species (Bacillariophyceae) in the British Museum (Natural History) V. Some species from the subgenus Amphora. S. Afr. J. Bot. 1986, 52, 425–437. [Google Scholar] [CrossRef]
  59. Maeda, Y.; Nojima, D.; Yoshino, T.; Tanaka, T. Structure and properties of oil bodies in diatoms. Philos. Trans. R. Soc. Lond. B Biol. Sci. 2017, 372, 20160408. [Google Scholar] [CrossRef] [PubMed]
  60. Garcia-Rodriguez, F.; del Puerto, L.; Venturini, N.; Pita, A.L.; Brugnoli, E.; Burone, L.; Muniz, P. Diatoms, protein and carbohydrate sediment content as proxies for coastal eutrophication in Montevideo, Rio de la Plata estuary, Uruguay. Braz. J. Oceanogr. 2011, 59, 293–310. [Google Scholar] [CrossRef] [Green Version]
  61. Lee, K.; Round, F.E. Studies on freshwater Amphora species. II. Amphora copulata (Kütz.) Schoeman & Archibald. Diatom Res. 1988, 3, 217–225. [Google Scholar]
  62. Novais, M.H.; Morais, M.M.; Rosado, J.; Dias, L.S.; Hoffmann, L.; Ector, L. Diatoms of temporary and permanent watercourses in Southern Europe (Portugal). River Res. Appl. 2014, 30, 1216–1232. [Google Scholar] [CrossRef] [Green Version]
  63. Lange, C.B.; Tiffany, M.A. The diatom flora of the Salton Sea, California. Hydrobiologia 2002, 473, 179–201. [Google Scholar] [CrossRef]
  64. Coetzer, G.C.; Toerien, D.F.; Schoeman, F.R. Silica, nitrogen and phosphorous requirements of some Southern African diatoms. J. Limnol. Soc. S. Afr. 1977, 3, 27–31. [Google Scholar]
  65. Geider, R.J.; La Roche, J. Redfield revisited: Variability of C:N:P in marine microalgae and its biochemical basis. Eur. J. Phycol. 2002, 37, 1–17. [Google Scholar] [CrossRef] [Green Version]
  66. Leonardos, N.; Geider, R.J. Responses of elemental and biochemical composition of Chaetoceros muelleri to growth under varying light and nitrate: Phosphate supply ratios and their influence on critical N: P. Limnol. Oceanogr. 2004, 49, 2105–2114. [Google Scholar] [CrossRef]
  67. Chisti, Y. Biodiesel from microalgae. Biotechnol. Adv. 2007, 25, 294–306. [Google Scholar] [CrossRef] [PubMed]
  68. Stumm, W.; Morgan, J.J. Aquatic Chemistry: Chemical Equilibria and Rates in Natural Waters, 3rd ed.; Wiley: New York, NY, USA, 1996. [Google Scholar]
  69. Finenko, Z.Z.; Krupatkina-Akinina, D.K. Effect of inorganic phosphorous on the growth rate of diatoms. Mar. Biol. 1974, 26, 193–201. [Google Scholar] [CrossRef]
  70. Parslow, J.S.; Harrison, P.J.; Thompson, P.A. Saturated uptake kinetics: Transient response of the marine diatom Thalassiosira pseudonana to ammonium, nitrate, silicate or phosphate starvation. Mar. Biol. 1984, 83, 51–59. [Google Scholar] [CrossRef]
  71. Chtourou, H.; Dahmen, I.; Jebali, A.; Karray, F.; Hassairi, I.; Abdelkafi, S.; Ayadi, H.; Sayadi, S.; Dhouib, A. Characterization of Amphora sp., a newly isolated diatom wild strain, potentially usable for biodiesel production. Bioproc. Biosyst. Eng. 2015, 38, 1381–1392. [Google Scholar] [CrossRef]
  72. Collyer, D.M.; Fogg, G.E. Studies on fat accumulation by algae. J. Exp. Bot. 1955, 6, 256–275. [Google Scholar] [CrossRef]
  73. Roessler, P.G. Effects of silicon deficiency on lipid composition and metabolism in the diatom Cyclotella cryptica. J. Phycol. 1988, 24, 394–400. [Google Scholar] [CrossRef]
  74. Yang, Z.-K.; Niu, Y.-F.; Ma, Y.-H.; Xue, J.; Zhang, M.-H.; Yang, W.-D.; Liu, J.-S.; Lu, S.-H.; Guan, Y.; Li, H.-Y. Molecular and cellular mechanisms of neutral lipid accumulation in diatom following nitrogen deprivation. Biotechnol. Biofuels 2013, 6, 67. [Google Scholar] [CrossRef] [PubMed] [Green Version]
  75. Admiraal, W. Influence of light and temperature on the growth rate of estuarine benthic diatoms in culture. Mar. Biol. 1977, 39, 1–9. [Google Scholar] [CrossRef]
  76. Gilstad, M.; Sakshaug, E. Growth rates of ten diatom species from the Barents Sea at different irradiances and day lengths. Mar. Ecol. Prog. Ser. 1990, 64, 169–173. [Google Scholar] [CrossRef]
  77. Peltomaa, E.; Hällfors, H.; Taipale, S.J. Comparison of diatoms and dinoflagellates from different habitats as sources of PUFAs. Mar. Drugs 2019, 17, 233. [Google Scholar] [CrossRef] [PubMed] [Green Version]
  78. Montagnes, D.J.S.; Franklin, D.J. Effect of temperature on diatom volume, growth rate, and carbon and nitrogen content: Reconsidering some paradigms. Limnol. Oceanogr. 2001, 46, 2008–2018. [Google Scholar] [CrossRef] [Green Version]
  79. d’Ippolito, G.; Sardo, A.; Paris, D.; Vella, F.M.; Adelfi, M.G.; Botte, P.; Gallo, C.; Fontana, A. Potential of lipid metabolism in marine diatoms for biofuel production. Biotechnol. Biofuels 2015, 8, 28. [Google Scholar] [CrossRef] [PubMed] [Green Version]
  80. Werner, D. (Ed.) The Biology of Diatoms; Blackwell: Los Angeles, CA, USA, 1977. [Google Scholar]
  81. Brzezinski, M.A.; Villareal, T.A.; Lipschultz, F. Silica production and the contribution of diatoms to new and primary production in the central North Pacific. Mar. Ecol. Prog. Ser. 1998, 167, 89–104. [Google Scholar] [CrossRef] [Green Version]
  82. Conley, D.J.; Kilham, S.S. Differences in silica content between marine and freshwater diatoms. Limnol. Oceanogr. 1989, 34, 205–213. [Google Scholar] [CrossRef] [Green Version]
  83. Flynn, K.J.; Martin-Jézéquel, V. Modelling Si–N-limited growth of diatoms. J. Plank. Res. 2000, 22, 447–472. [Google Scholar] [CrossRef] [Green Version]
  84. Vrieling, E.G.; Poort, L.; Beelen, T.P.M.; Gieskes, W.W.C. Growth and silica content of the diatoms Thalassiosira weissflogii and Navicula salinarum at different salinities and enrichments with aluminium. Eur. J. Phycol. 1999, 34, 307–316. [Google Scholar] [CrossRef]
  85. Azam, F.; Hemmingsen, B.B.; Volcani, B.E. Role of silicon in diatom metabolism V. Silicic acid transport and metabolism in the heterotrophic diatom Nitzschia alba. Arch. Microbiol. 1974, 97, 103–114. [Google Scholar] [CrossRef] [PubMed]
  86. Conway, H.L.; Harrison, P.J.; Davis, C.O. Marine diatoms grown in chemostats under silicate or ammonium limitation. II. Transient response of Skeletonema costatum to a single addition of the limiting nutrient. Mar. Biol. 1976, 35, 187–199. [Google Scholar] [CrossRef]
  87. Davis, C.O. Continuous culture of marine diatoms under silicate limitation. II. Effect of light intensity on growth and nutrient uptake of Skeletonema costatum. J. Phycol. 1976, 12, 291–300. [Google Scholar]
  88. Nelson, D.M.; Goering, J.J.; Kilham, S.S.; Guillard, R.R.L. Kinetics of silicic acid uptake and rates of silica dissolution in the marine diatom Thalassiosira pseudonana. J. Phycol. 1976, 12, 246–252. [Google Scholar] [CrossRef] [Green Version]
  89. Paasche, E. The influence of cell size on growth rate, silica content and some other properties of four marine diatom species. Nor. J. Bot. 1973, 20, 197–204. [Google Scholar]
  90. Hildebrand, M.; Lerch, S.J.L.; Shrestha, R.P. Understanding diatom cell wall silicification—Moving forward. Front. Mar. Sci. 2018, 5, 125. [Google Scholar] [CrossRef] [Green Version]
  91. BenMoussa-Dahmen, A.; Chtourou, H.; Rezgui, F.; Sayadi, S.; Dhouib, A. Salinity stress increases lipid, secondary metabolites and enzyme activity in Amphora subtropica and Dunaliella sp. for biodiesel production. Bioresour. Technol. 2016, 218, 816–825. [Google Scholar] [CrossRef] [PubMed]
  92. Scholz, B.; Liebezeit, G. Biochemical characterisation and fatty acid profiles of 25 benthic marine diatoms isolated from the Solthörn tidal flat (southern North Sea). J. Appl. Phycol. 2013, 25, 453–465. [Google Scholar] [CrossRef]
  93. Chen, Y.-C. The biomass and total lipid content and composition of twelve species of marine diatoms cultured under various environments. Food Chem. 2012, 131, 211–219. [Google Scholar] [CrossRef]
  94. Rajaram, M.G.; Nagaraj, S.; Manjunath, M.; Boopathy, A.B.; Kurinjimalar, C.; Rengasamy, R.; Jayakumar, T.; Sheu, J.-R.; Li, J.-Y. Biofuel and biochemical analysis of Amphora coffeaeformis RR03, a novel marine diatom, cultivated in an open raceway pond. Energies 2018, 11, 1341. [Google Scholar] [CrossRef] [Green Version]
  95. Orcutt, D.M.; Patterson, G.W. Sterol, fatty acid and elemental composition of diatoms grown in chemically defined media. Comp. Biochem. Physiol. B 1975, 50B, 579–583. [Google Scholar] [CrossRef]
  96. Lewin, J.; Hellebust, J.A. Heterotrophic nutrition of the marine pennate diatom, Cylindrotheca fusiformis. Can. J. Microbiol. 1970, 16, 1123–1129. [Google Scholar] [CrossRef] [PubMed]
  97. Sayanova, O.; Mimouni, V.; Ulmann, L.; Morant-Manceau, A.; Pasquet, V.; Schoefs, B.; Napier, J.A. Modulation of lipid biosynthesis by stress in diatoms. Phil. Trans. Royal. Soc. B 2017, 372, 20160407. [Google Scholar] [CrossRef] [Green Version]
  98. Griffiths, M.J.; Harrison, S.T.L. Lipid productivity as a key characteristic for choosing algal species for biodiesel production. J. Appl. Phycol. 2009, 21, 493–507. [Google Scholar] [CrossRef]
  99. Wang, J.-K.; Seibert, M. Prospects for commercial production of diatoms. Biotechnol. Biofuels 2017, 10, 16. [Google Scholar] [CrossRef] [PubMed] [Green Version]
  100. Menegol, T.; Romero-Villegas, G.I.; López-Rodríguez, M.; Navarro-López, E.; López-Rosales, L.; Chisti, Y.; Cerón-García, M.C.; Molina-Grima, E. Mixotrophic production of polyunsaturated fatty acids and carotenoids by the microalga Nannochloropsis gaditana. J. Appl. Phycol. 2019, 31, 2823–2832. [Google Scholar] [CrossRef]
  101. Shene, C.; Chisti, Y.; Vergara, D.; Burgos, C.; Rubilar, M.; Bustamante, M. Production of eicosapentaenoic acid by Nannochloropsis oculata: Effects of carbon dioxide and glycerol. J. Biotechnol. 2016, 239, 47–56. [Google Scholar] [CrossRef] [PubMed]
  102. Singhasuwan, S.; Choorit, W.; Sirisansaneeyakul, S.; Kokkaew, N.; Chisti, Y. Carbon-to-nitrogen ratio affects the biomass composition and the fatty acid profile of heterotrophically grown Chlorella sp. TISTR 8990 for biodiesel production. J. Biotechnol. 2015, 216, 169–177. [Google Scholar] [CrossRef] [PubMed]
  103. Shene, C.; Chisti, Y.; Bustamante, M.; Rubilar, M. Effect of CO2 in the aeration gas on cultivation of the microalga Nannochloropsis oculata: Experimental study and mathematical modeling of CO2 assimilation. Algal Res. 2016, 13, 16–29. [Google Scholar] [CrossRef]
  104. Sánchez Mirón, A.; Cerón García, M.-C.; Contreras Gómez, A.; García Camacho, F.; Molina Grima, E.; Chisti, Y. Shear stress tolerance and biochemical characterization of Phaeodactylum tricornutum in quasi steady-state continuous culture in outdoor photobioreactors. Biochem. Eng. J. 2003, 16, 287–297. [Google Scholar] [CrossRef]
  105. Sompech, K.; Chisti, Y.; Srinophakun, T. Design of raceway ponds for producing microalgae. Biofuels 2012, 3, 387–397. [Google Scholar] [CrossRef]
  106. Chutmanop, J.; Chuichulcherm, S.; Chisti, Y.; Srinophakun, P. Protease production by Aspergillus oryzae in solid-state fermentation using agroindustrial substrates. J. Chem. Technol. Biotechnol. 2008, 83, 1012–1018. [Google Scholar] [CrossRef]
  107. Qureshi, A.S.; Khushk, I.; Ali, C.H.; Chisti, Y.; Ahmad, A.; Majeed, H. Coproduction of protease and amylase by thermophilic Bacillus sp. BBXS-2 using open solid-state fermentation of lignocellulosic biomass. Biocatal. Agric. Biotechnol. 2016, 8, 146–151. [Google Scholar] [CrossRef]
  108. Patil, M.D.; Dev, M.J.; Tangadpalliwar, S.; Patel, G.; Garg, P.; Chisti, Y.; Banerjee, U.C. Ultrasonic disruption of Pseudomonas putida for the release of arginine deiminase: Kinetics and predictive models. Bioresour. Technol. 2017, 233, 74–83. [Google Scholar] [CrossRef] [PubMed]
  109. Patil, M.D.; Shinde, K.D.; Patel, G.; Chisti, Y.; Banerjee, U.C. Use of response surface method for maximizing the production of arginine deiminase by Pseudomonas putida. Biotechnol. Rep. 2016, 10, 29–37. [Google Scholar] [CrossRef] [PubMed] [Green Version]
  110. Belarbi, E.H.; Molina, E.; Chisti, Y. A process for high yield and scaleable recovery of high purity eicosapentaenoic acid esters from microalgae and fish oil. Enzym. Microb. Technol. 2000, 26, 516–529. [Google Scholar] [CrossRef]
  111. Kates, M.; Volcani, B.E. Lipid components of diatoms. Biochim. Biophys. Acta 1966, 116, 264–278. [Google Scholar] [CrossRef]
  112. Opute, F.I. Lipid and fatty-acid composition of diatoms. J. Exp. Bot. 1974, 25, 823–835. [Google Scholar] [CrossRef]
  113. Montoya, C.; Cochard, B.; Flori, A.; Cros, D.; Lopes, R.; Cuellar, T.; Espeout, S.; Syaputra, I.; Villeneuve, P.; Pina, M.; et al. Genetic architecture of palm oil fatty acid composition in cultivated oil palm (Elaeis guineensis Jacq.) compared to its wild relative E. oleifera (H.B.K) Cortés. PLoS ONE 2014, 9, e95412. [Google Scholar] [CrossRef] [Green Version]
  114. Yongmanitchai, W.; Ward, O.P. Growth of and omega-3 fatty acid production by Phaeodactylum tricornutum under different culture conditions. Appl. Environ. Microbiol. 1991, 57, 419–425. [Google Scholar] [CrossRef] [PubMed] [Green Version]
  115. Zahan, K.A.; Kano, M. Biodiesel production from palm oil, its by-products, and mill effluent: A review. Energies 2018, 11, 2132. [Google Scholar] [CrossRef] [Green Version]
  116. Richard, T.; Chisti, Y.; Somerville, C.R.; Blanch, H.; Babcock, B.; Gheewala, S.H.; Zilberman, D. The food versus fuel debate. Biofuels 2012, 3, 635–648. [Google Scholar]
  117. Talebi, A.F.; Tabatabaei, M.; Chisti, Y. BiodieselAnalyzer: A user-friendly software for predicting the properties of prospective biodiesel. Biofuel Res. J. 2014, 2, 55–57. [Google Scholar] [CrossRef]
  118. Acién, F.G.; Fernández, J.M.; Magán, J.J.; Molina, E. Production cost of a real microalgae production plant and strategies to reduce it. Biotechnol. Adv. 2012, 30, 1344–1353. [Google Scholar] [CrossRef] [PubMed]
Figure 1. Standard plot of optical density versus biomass concentration.
Fermentation 07 00037 g001
Figure 2. Fluorescence micrograph (a) and scanning electron micrograph (b) of Amphora copulata.
Fermentation 07 00037 g002
Figure 3. Nile red-stained cells of A. copulata showing oil bodies.
Fermentation 07 00037 g003
Figure 4. Dry cell mass concentration on day 15 in media with specified initial nitrate (as NaNO3) concentrations. Average values ± standard deviation of five replicates. (Initial phosphate and silicate concentrations were 6.5 mg L−1 (as NaH2PO4⋅H2O) and 8.5 mg L−1 (as Na2SiO3⋅9H2O), respectively, in all experiments.).
Fermentation 07 00037 g004
Figure 5. Dry cell mass concentration on day 15 in media with different initial phosphate (as NaH2PO4⋅H2O) concentrations. Average values ± standard deviation of five replicates. (Initial nitrate and silicate concentrations were 1.75 mg L−1 (as NaNO3) and 8.5 mg L−1 (as Na2SiO3⋅9H2O), respectively, in all experiments.).
Fermentation 07 00037 g005
Figure 6. Dry cell mass concentration on day 15 in media with different initial silicate (as Na2SiO3⋅9H2O) concentrations. Average values ± standard deviation based on five replicates. (Initial nitrate and phosphate concentrations were 1.75 mg L−1 (as NaNO3) and 6.5 mg L−1 (as NaH2PO4⋅H2O), respectively, in all experiments).
Fermentation 07 00037 g006
Figure 7. Growth curve of A. copulata in optimal medium. Average values ± standard deviation of five replicates.
Fermentation 07 00037 g007
Table 1. Physicochemical characteristics of diluted POME.
ParameterValue
pH7.3
Chemical oxygen demand (COD, mg L1)1480 ± 19
Total suspended solids (TSS, mg L1)71 ± 7
Ammonium (mg L1)11.1 ± 0.5
Phosphate (mg PO 4 3 L1)5.5 ± 0.2
Nitrite (mg NO 2 L1)1.3 ± 0.3
Nitrate (mg NO 3 L1)3.1 ± 0.7
Publisher’s Note: MDPI stays neutral with regard to jurisdictional claims in published maps and institutional affiliations.

