
The Influence of CFRP Anchorage on Achieving Sectional Flexural Capacity of Strengthened Concrete Beams

 ,
, 
Abstract
:1. Introduction
2. Specimen Design
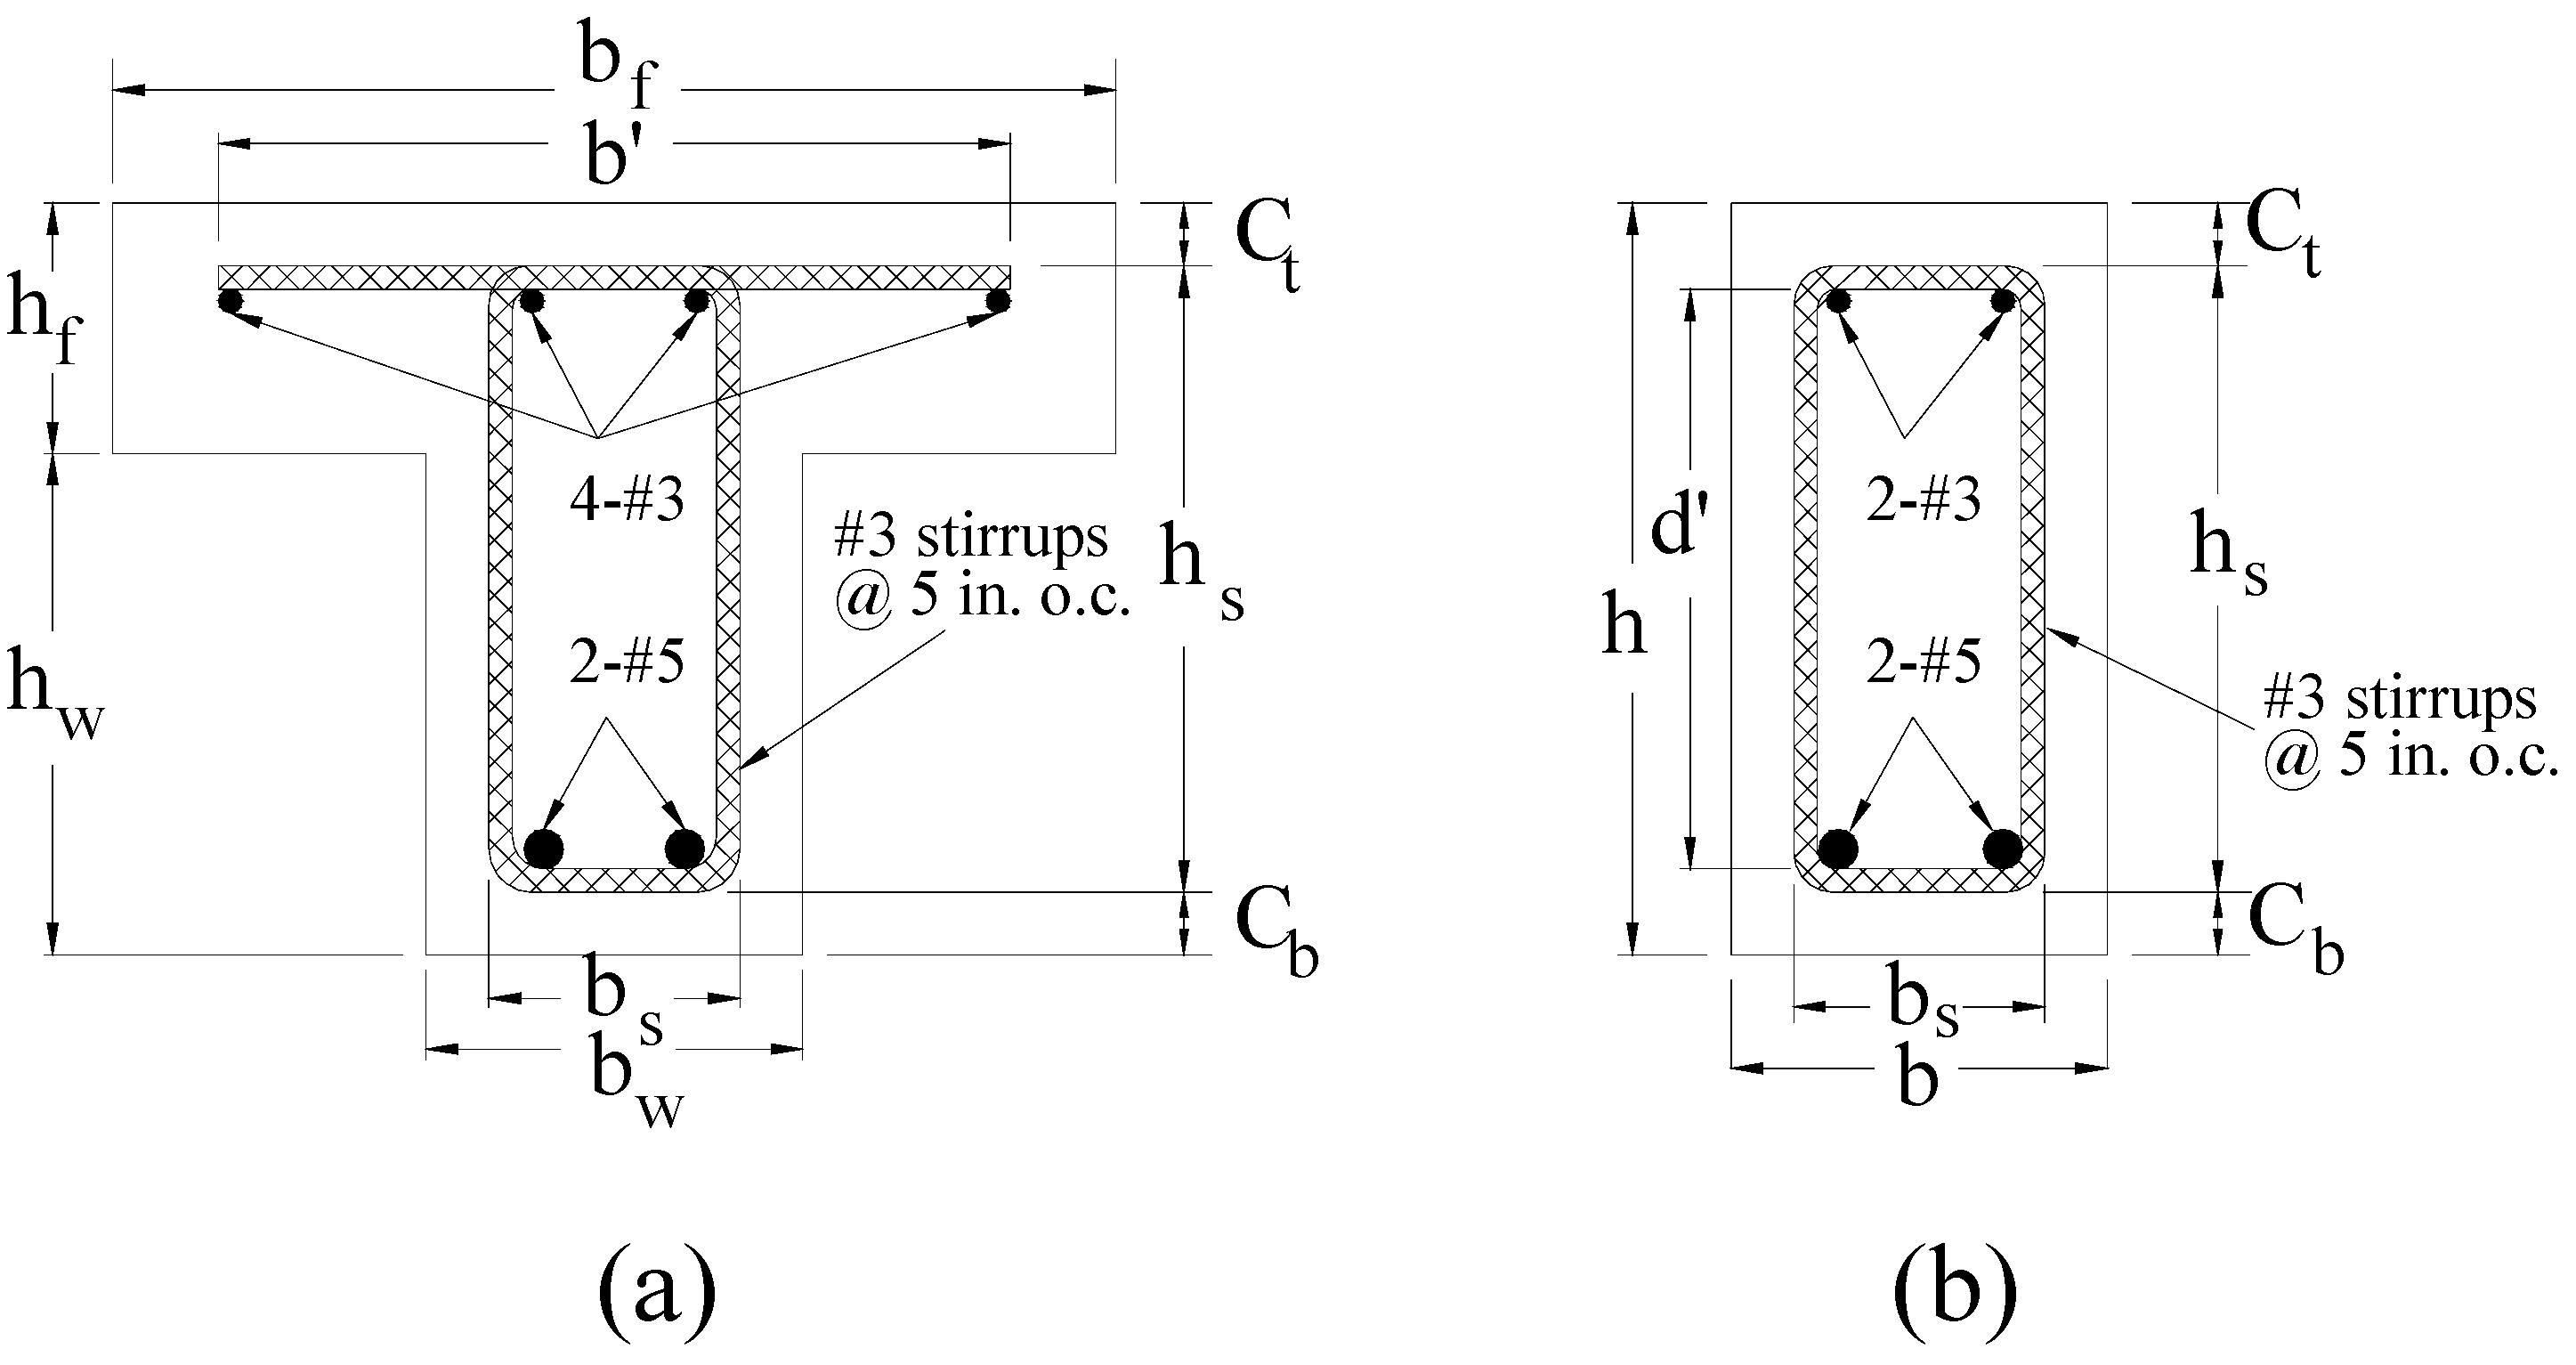
2.1. Beam Geometry


| Variable | Dimension |
|---|---|
| bf | 16 in (406.4 mm) |
| hf | 4 in (101.6 mm) |
| bw | 6 in (152.4 mm) |
| hw | 8 in (203.2 mm) |
| Ct | 1 in (25.4 mm) |
| Cb | 1 in (25.4 mm) |
| hs | 10 in (254 mm) |
| b′ | 13 in (330.2 mm) |
| bs | 4 in (101.6 mm) |
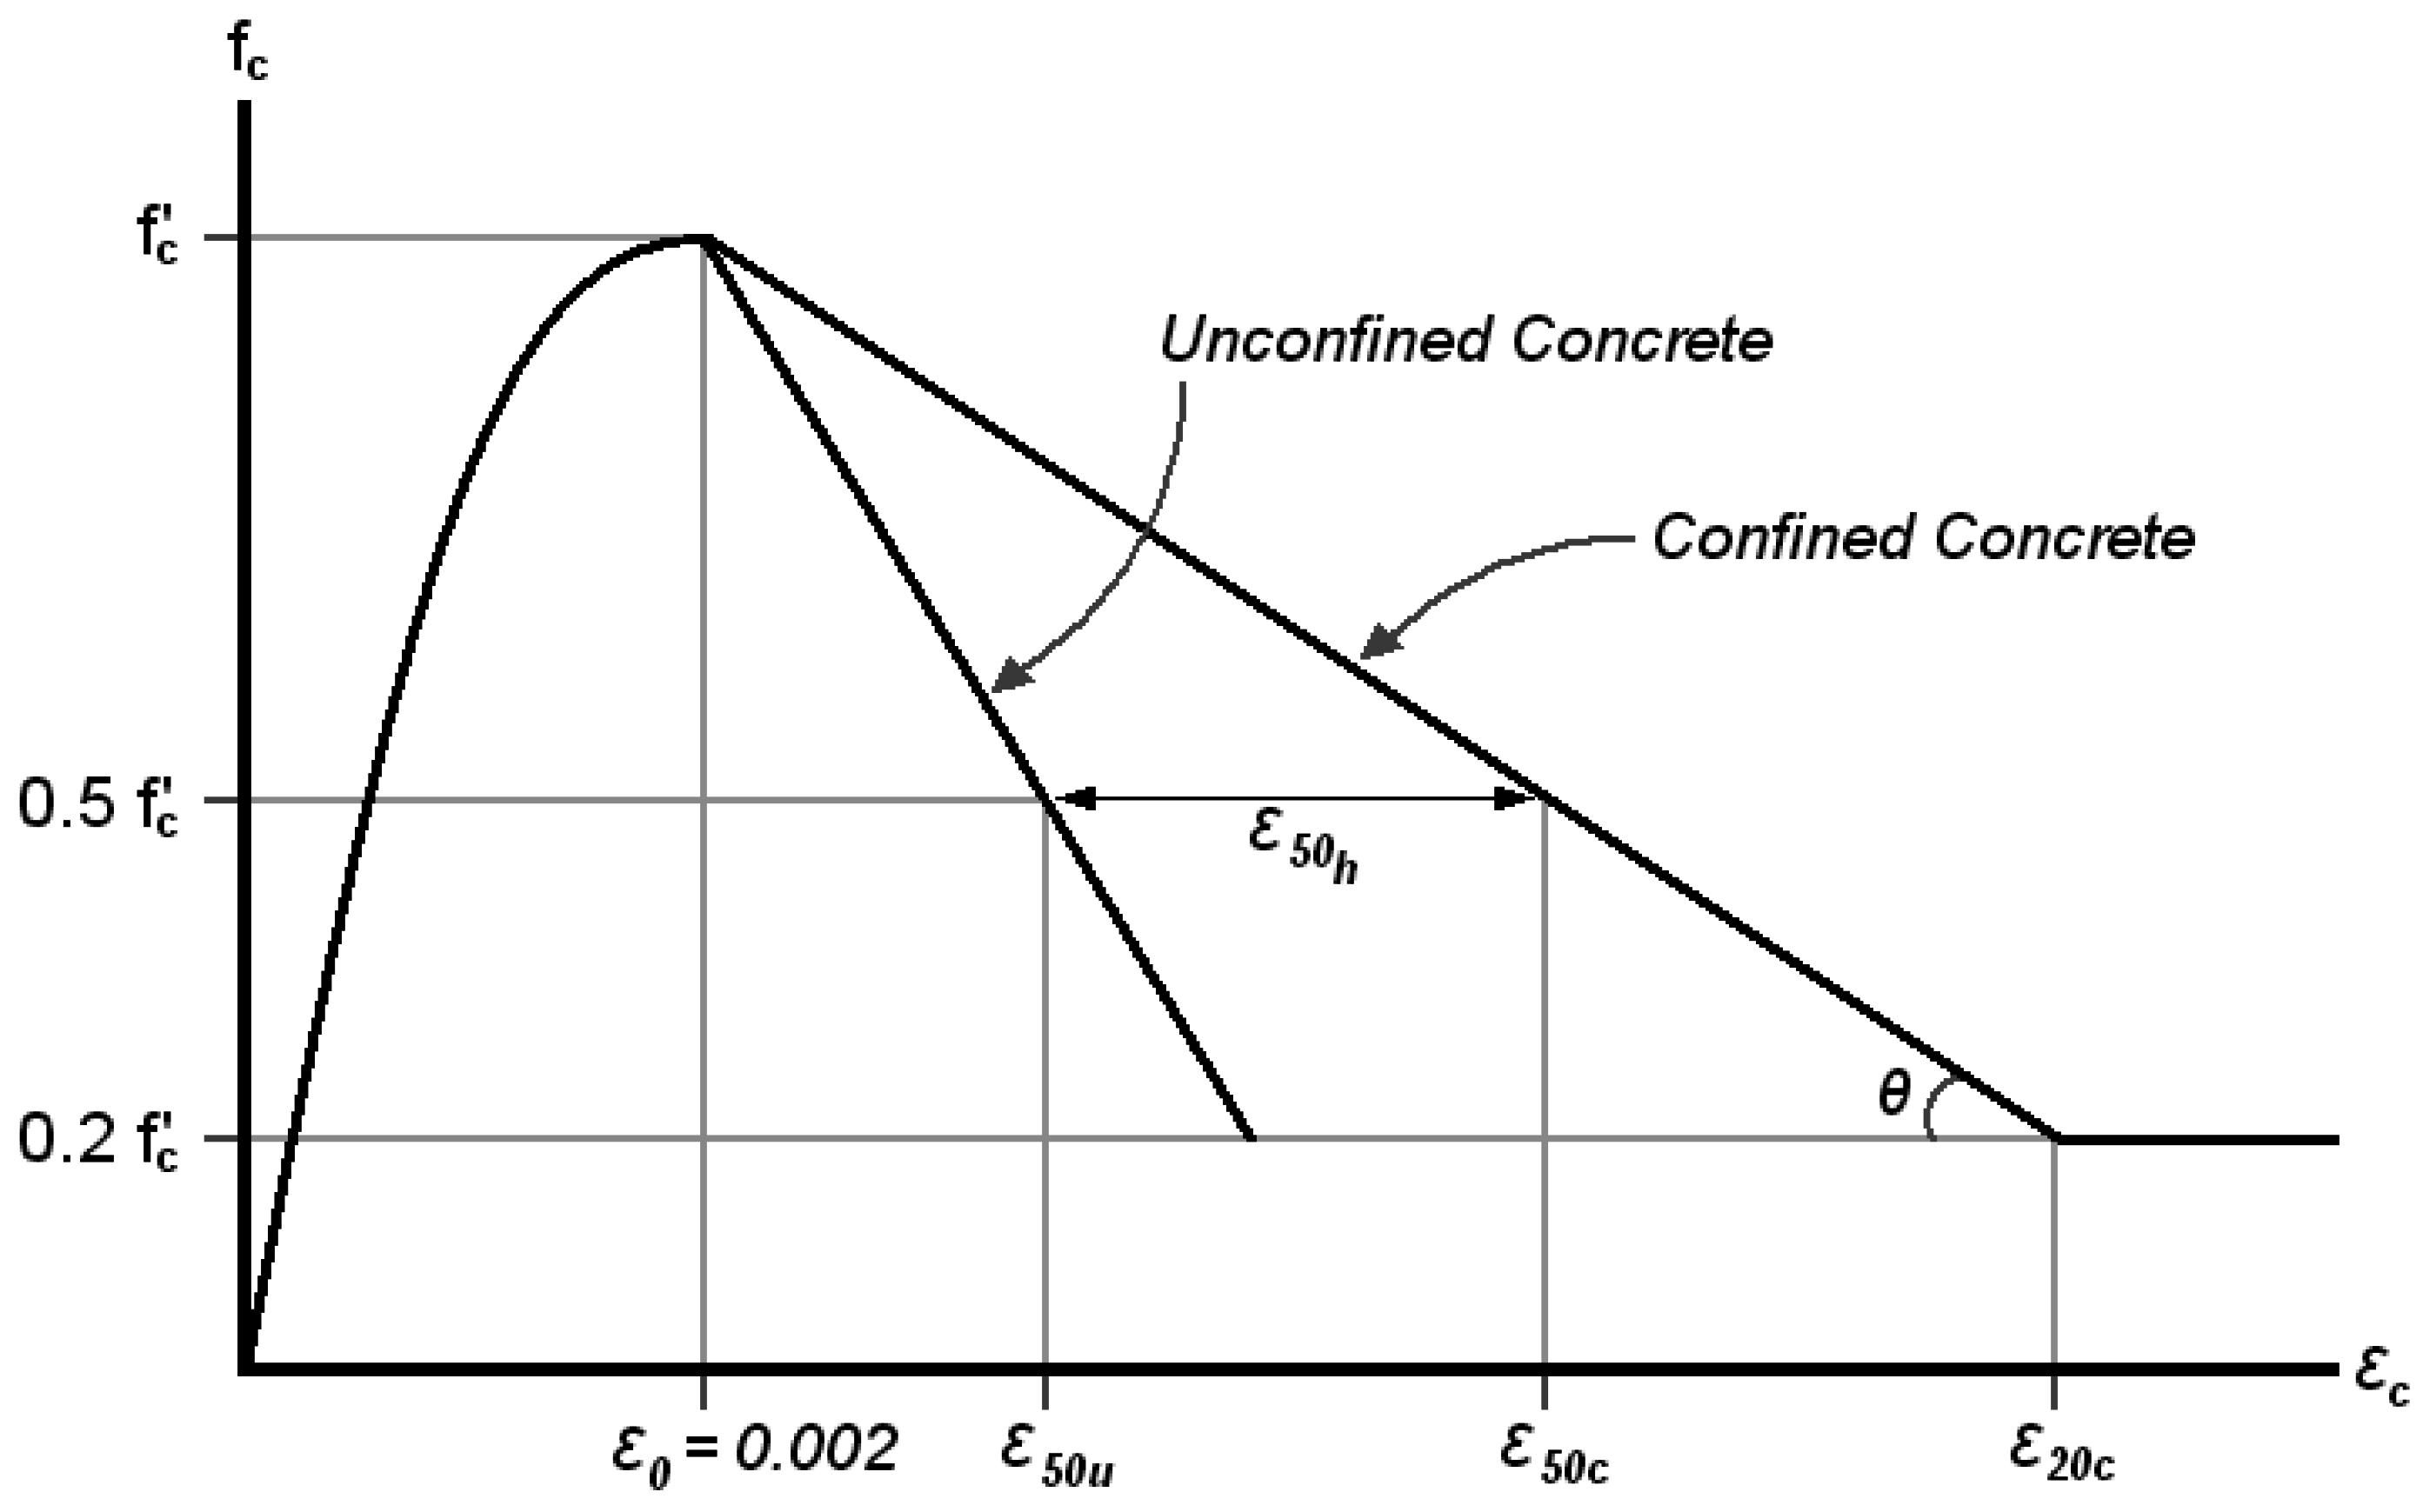
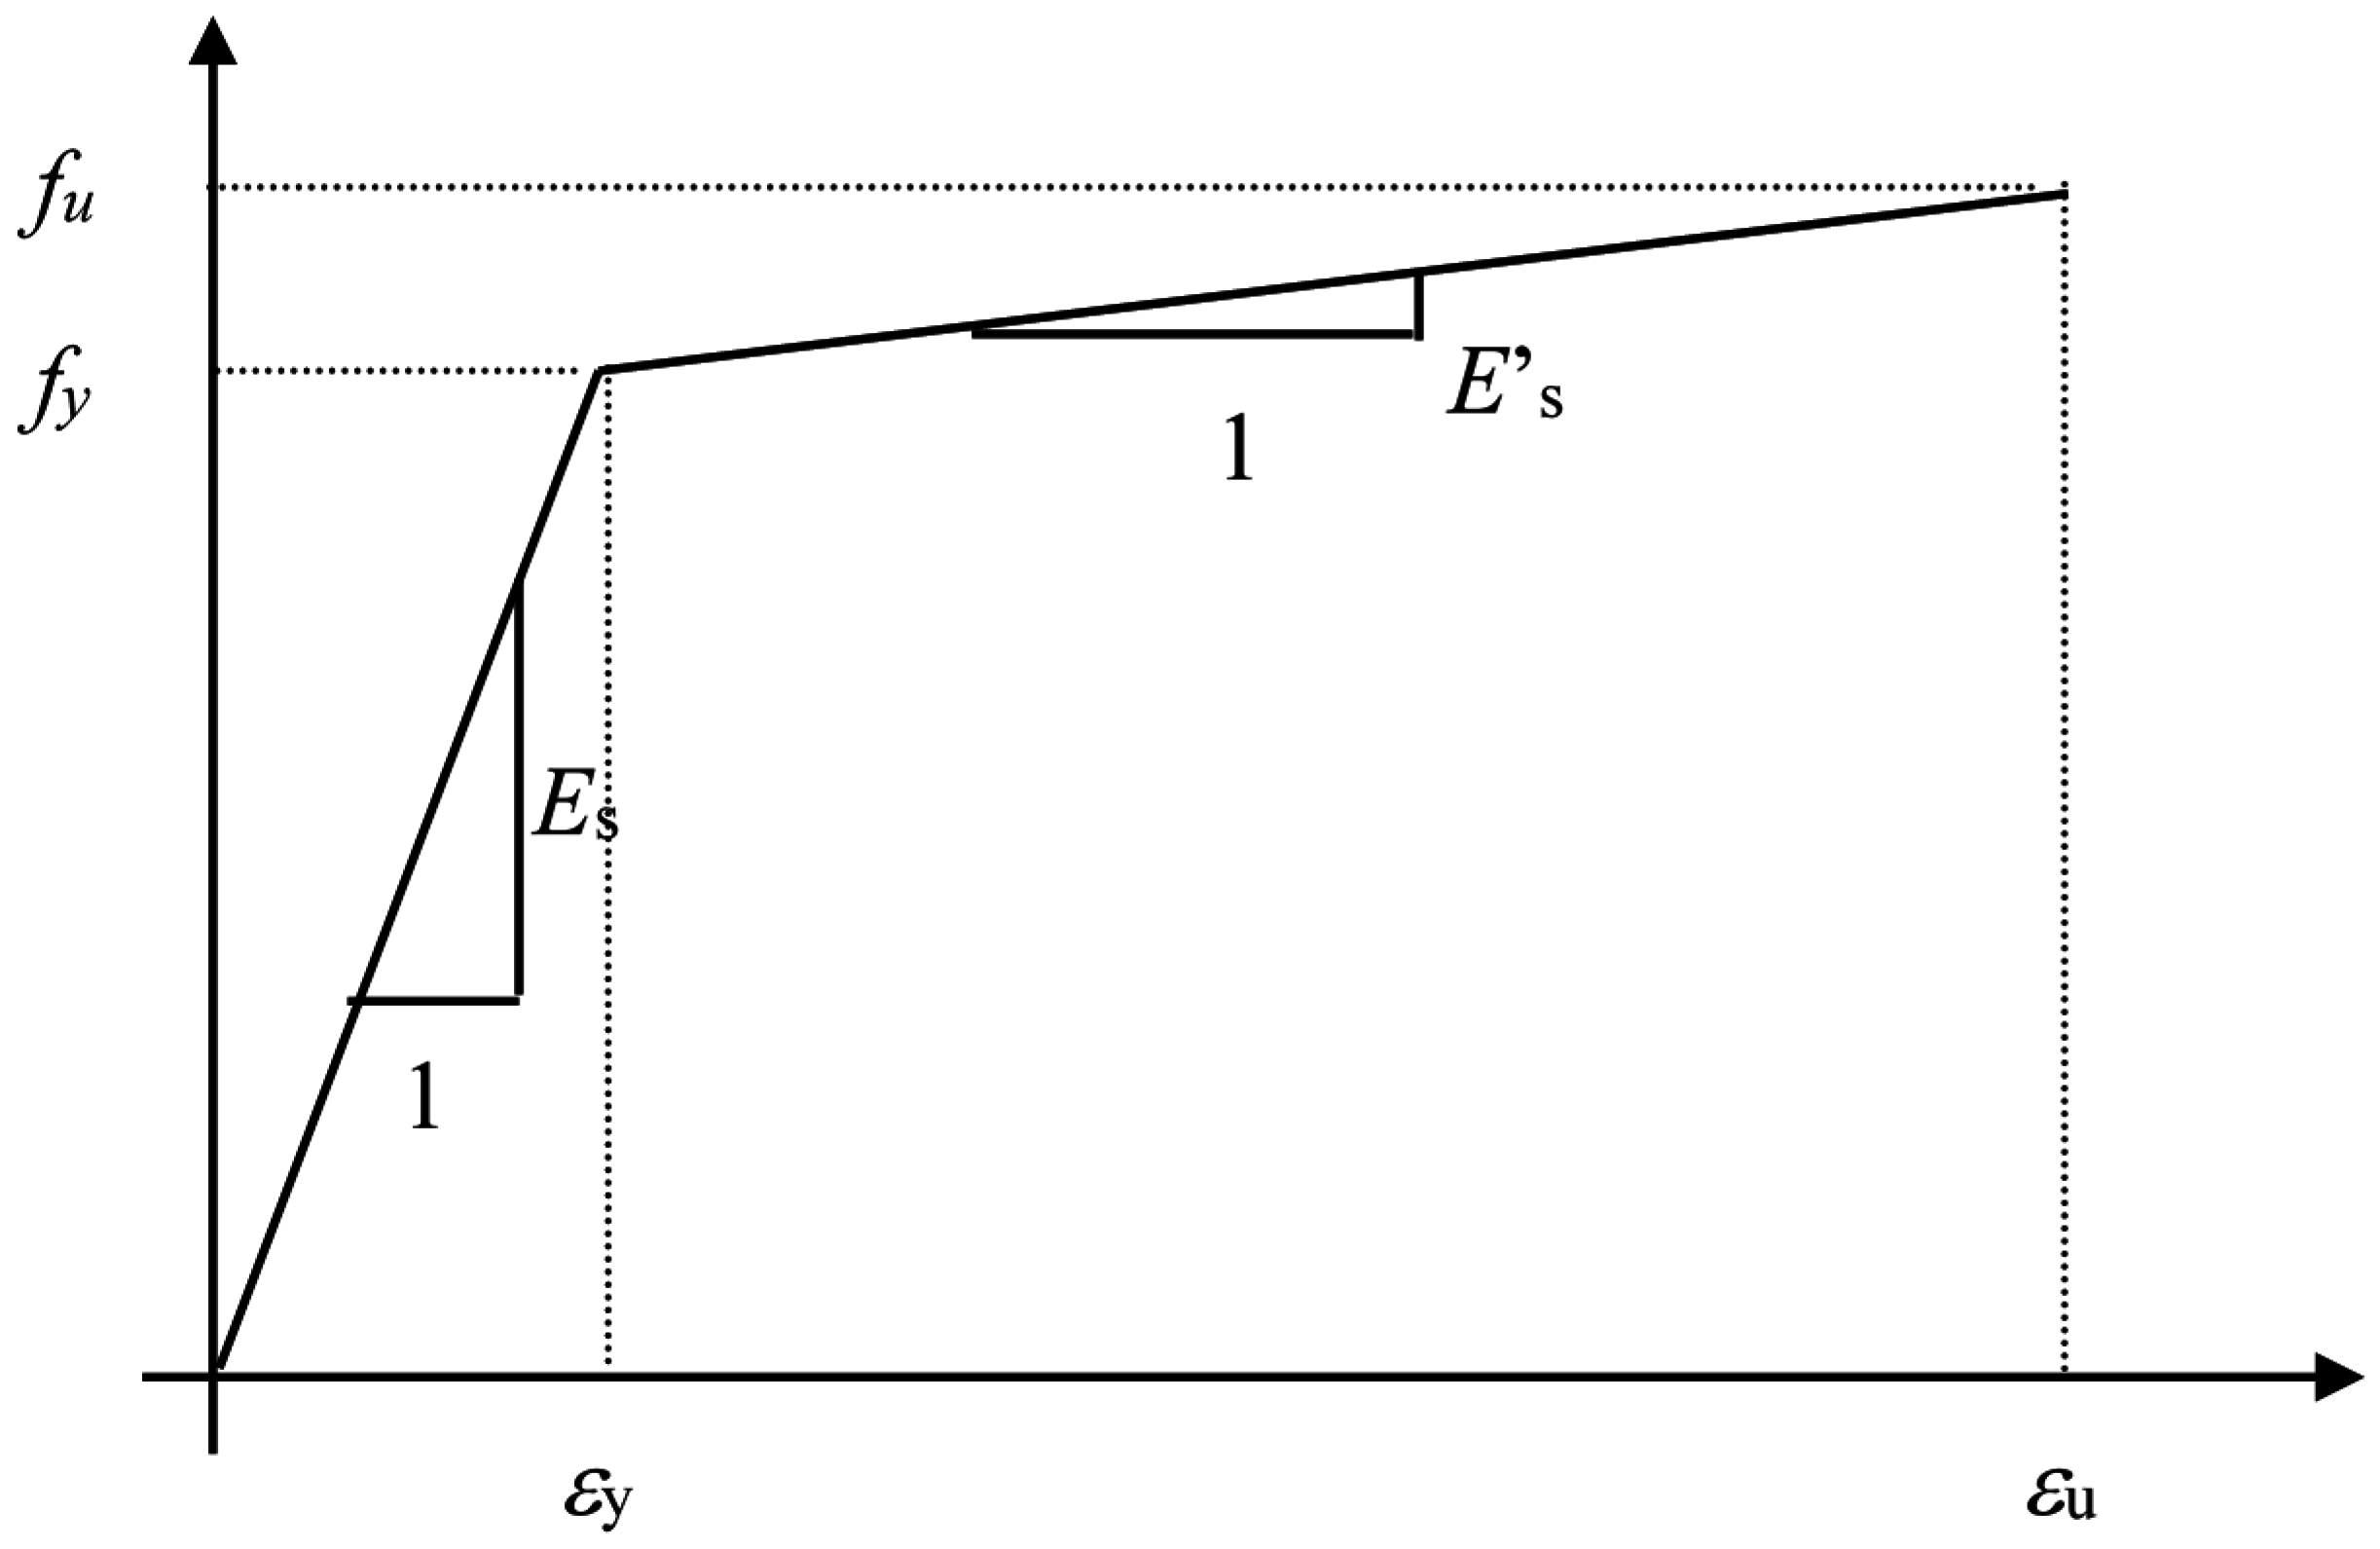
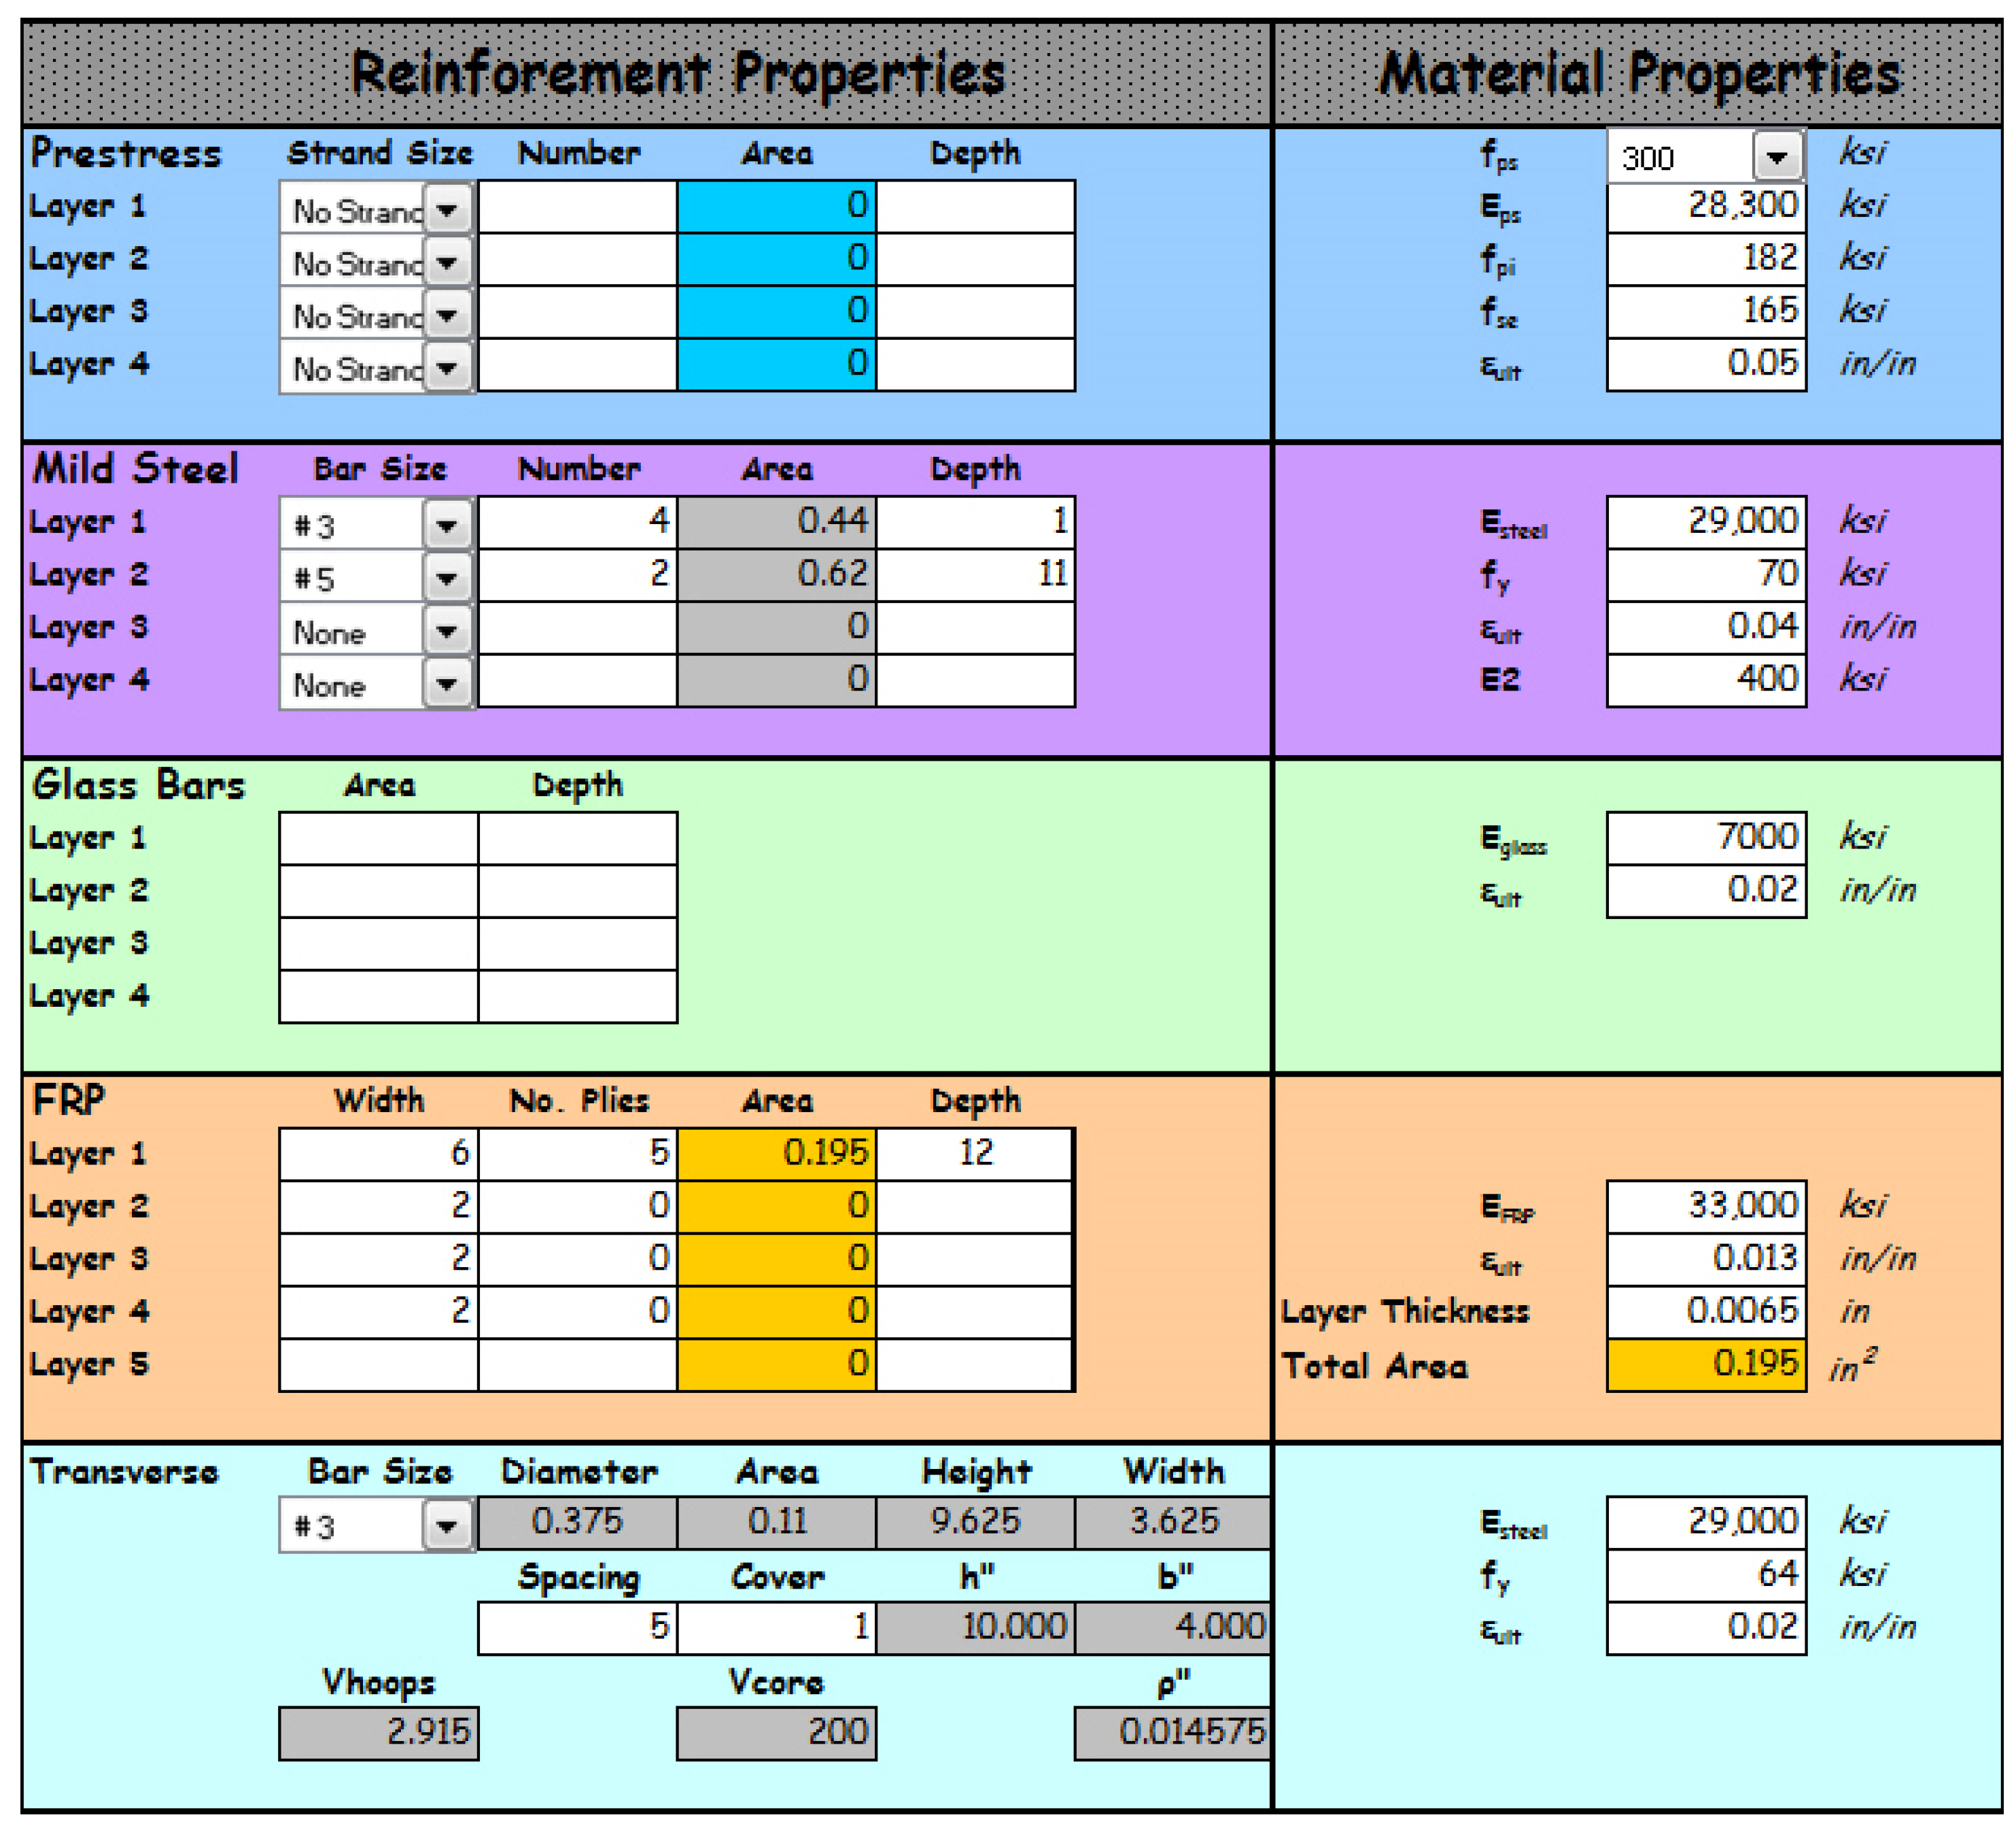
2.2. Material Properties
3. Experimental Program
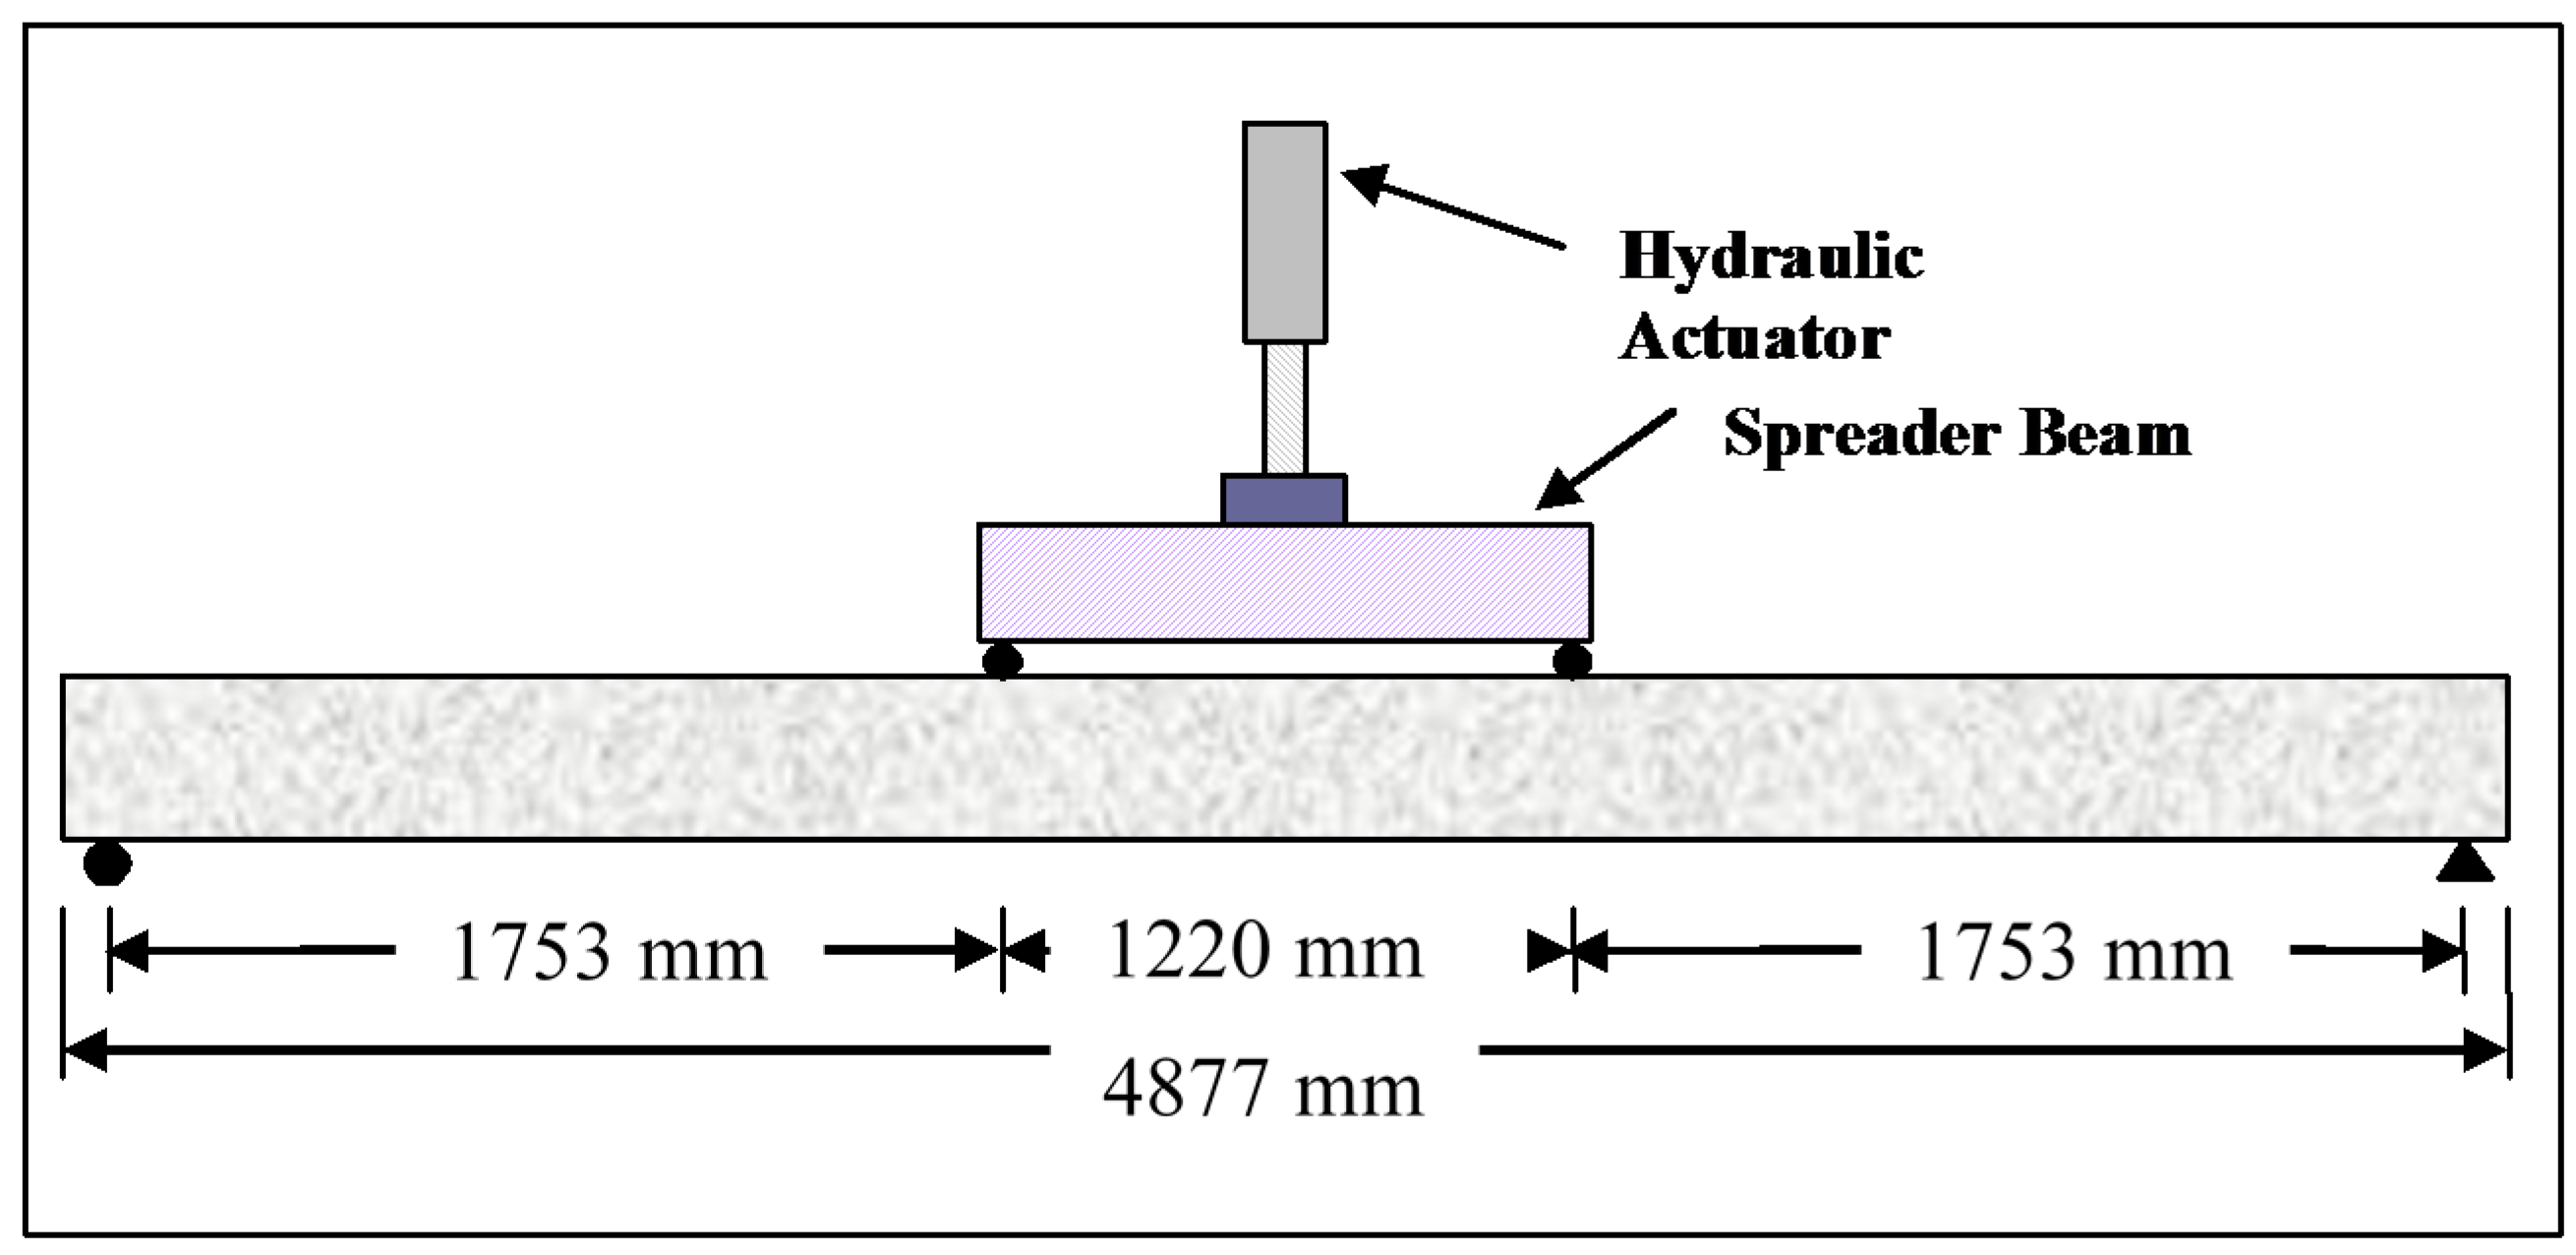
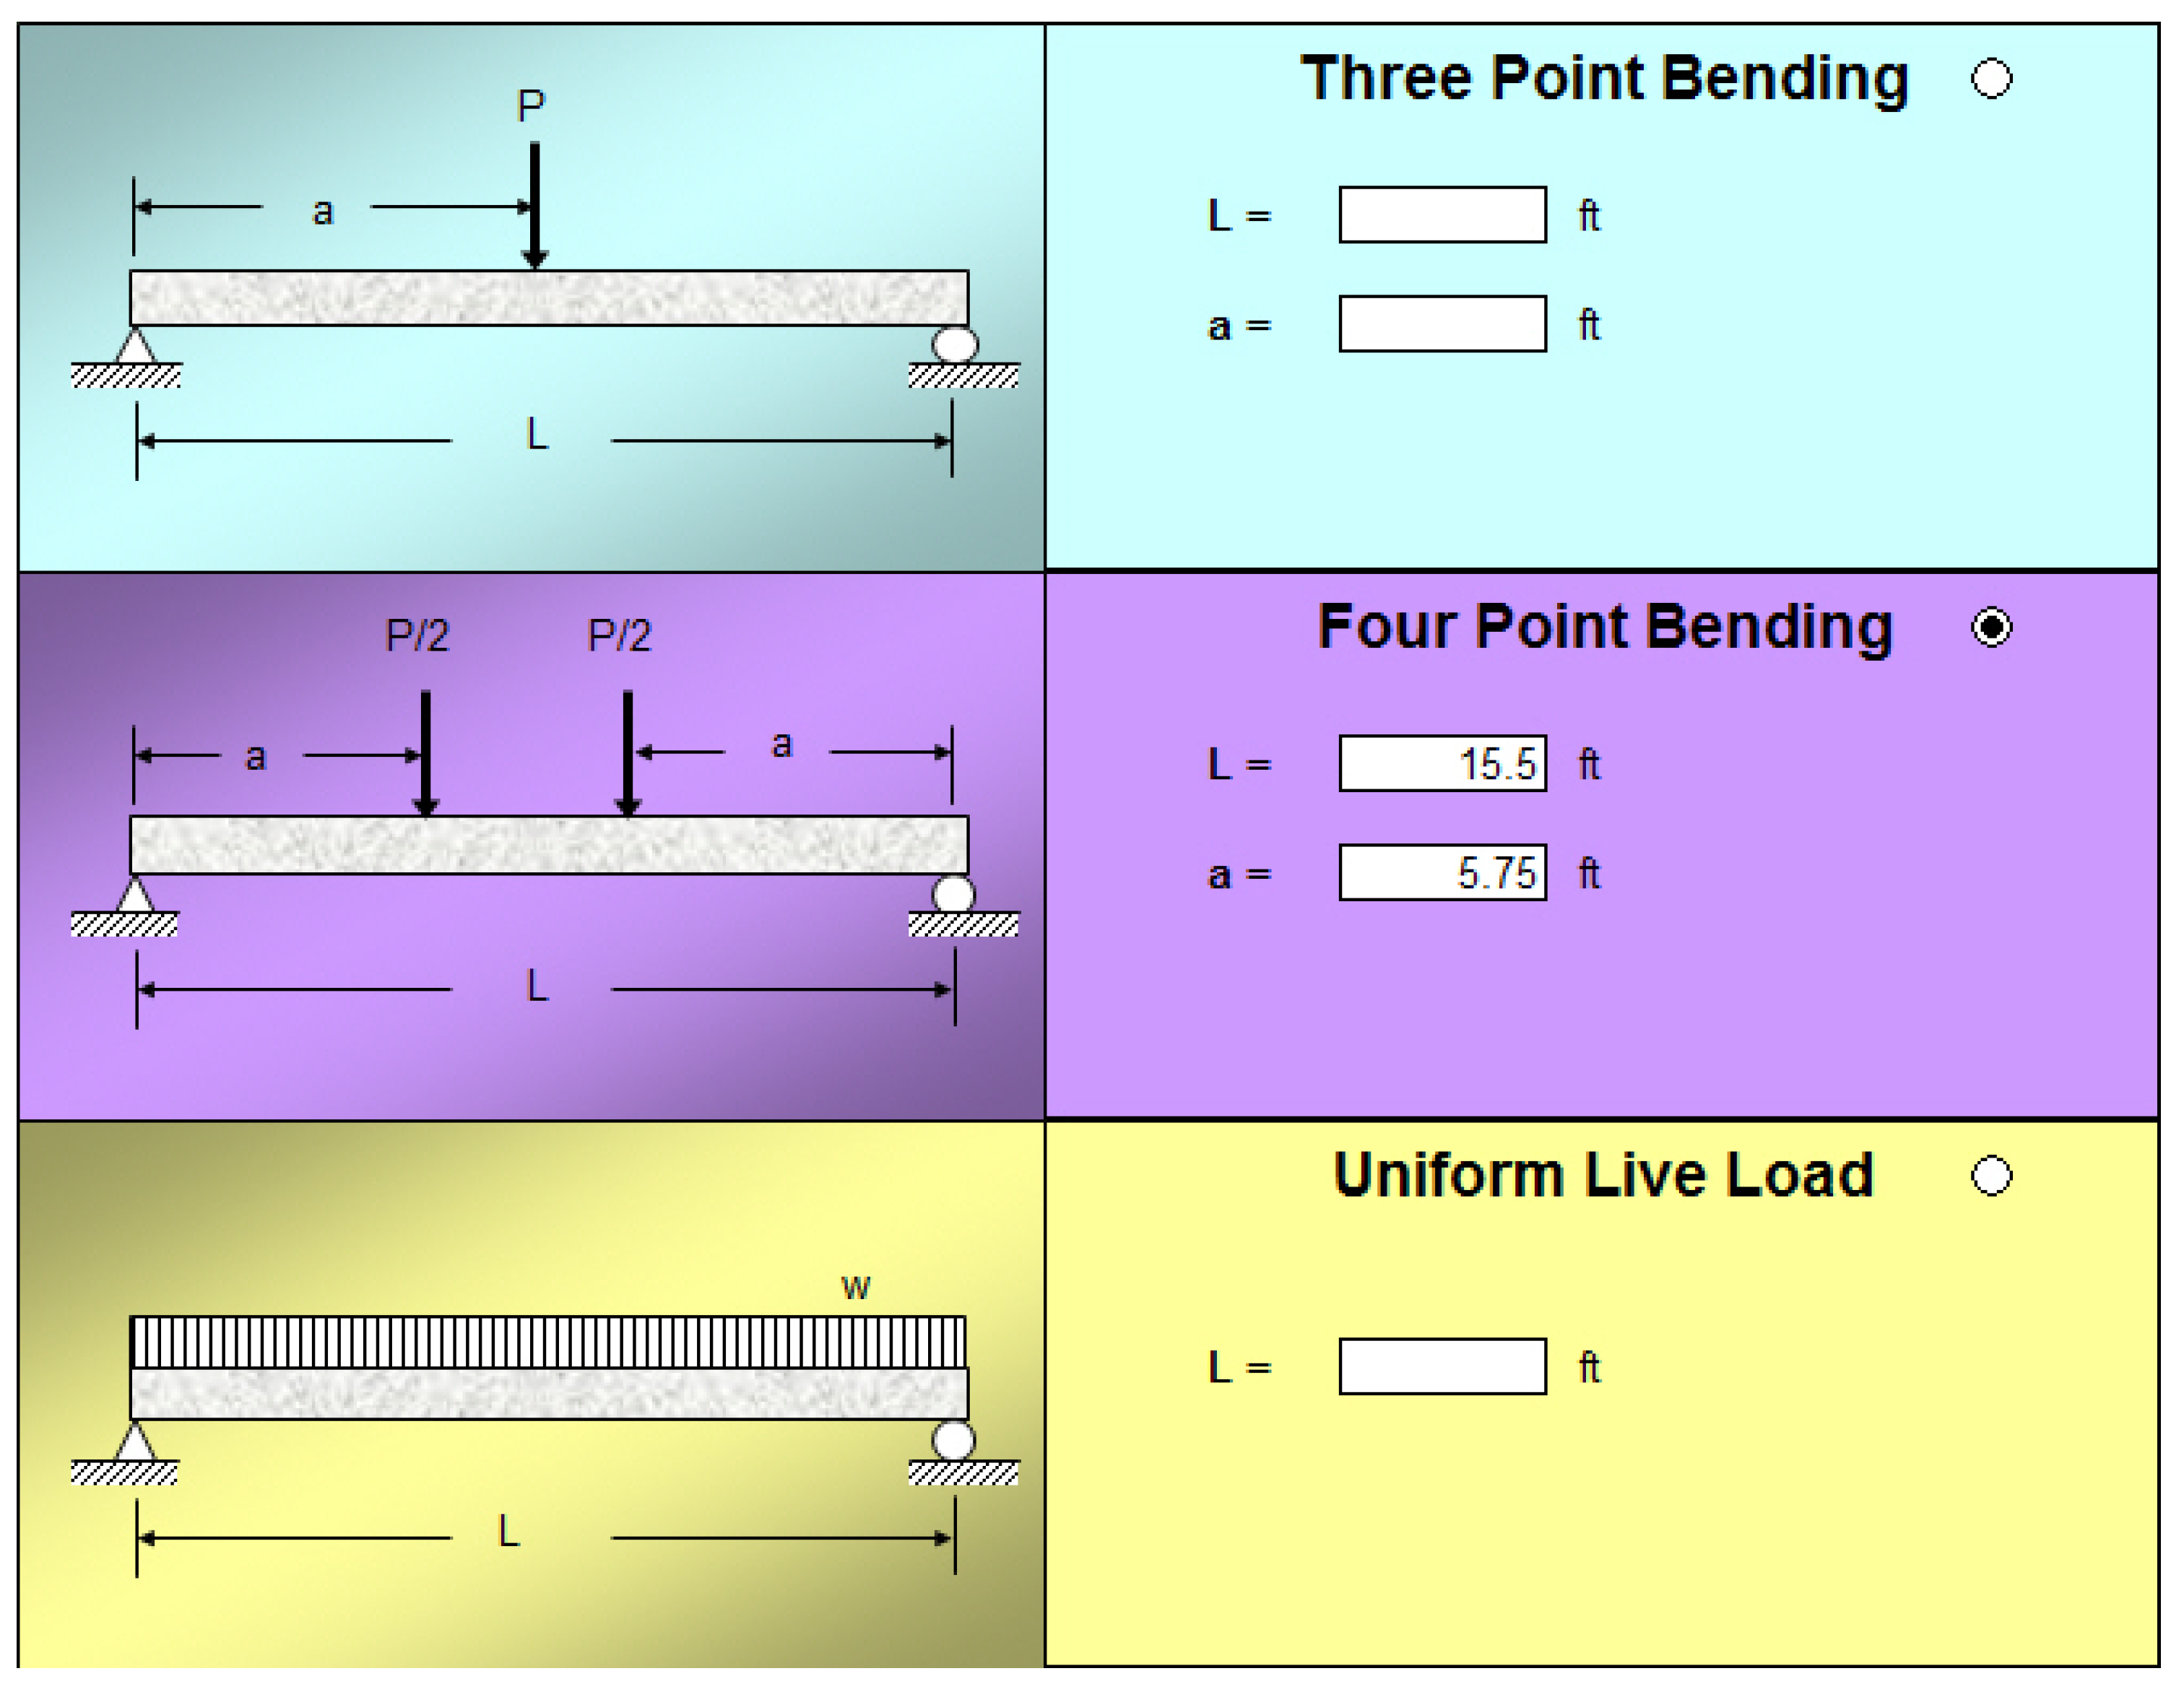
3.1. Test Setup and Data Acquisition

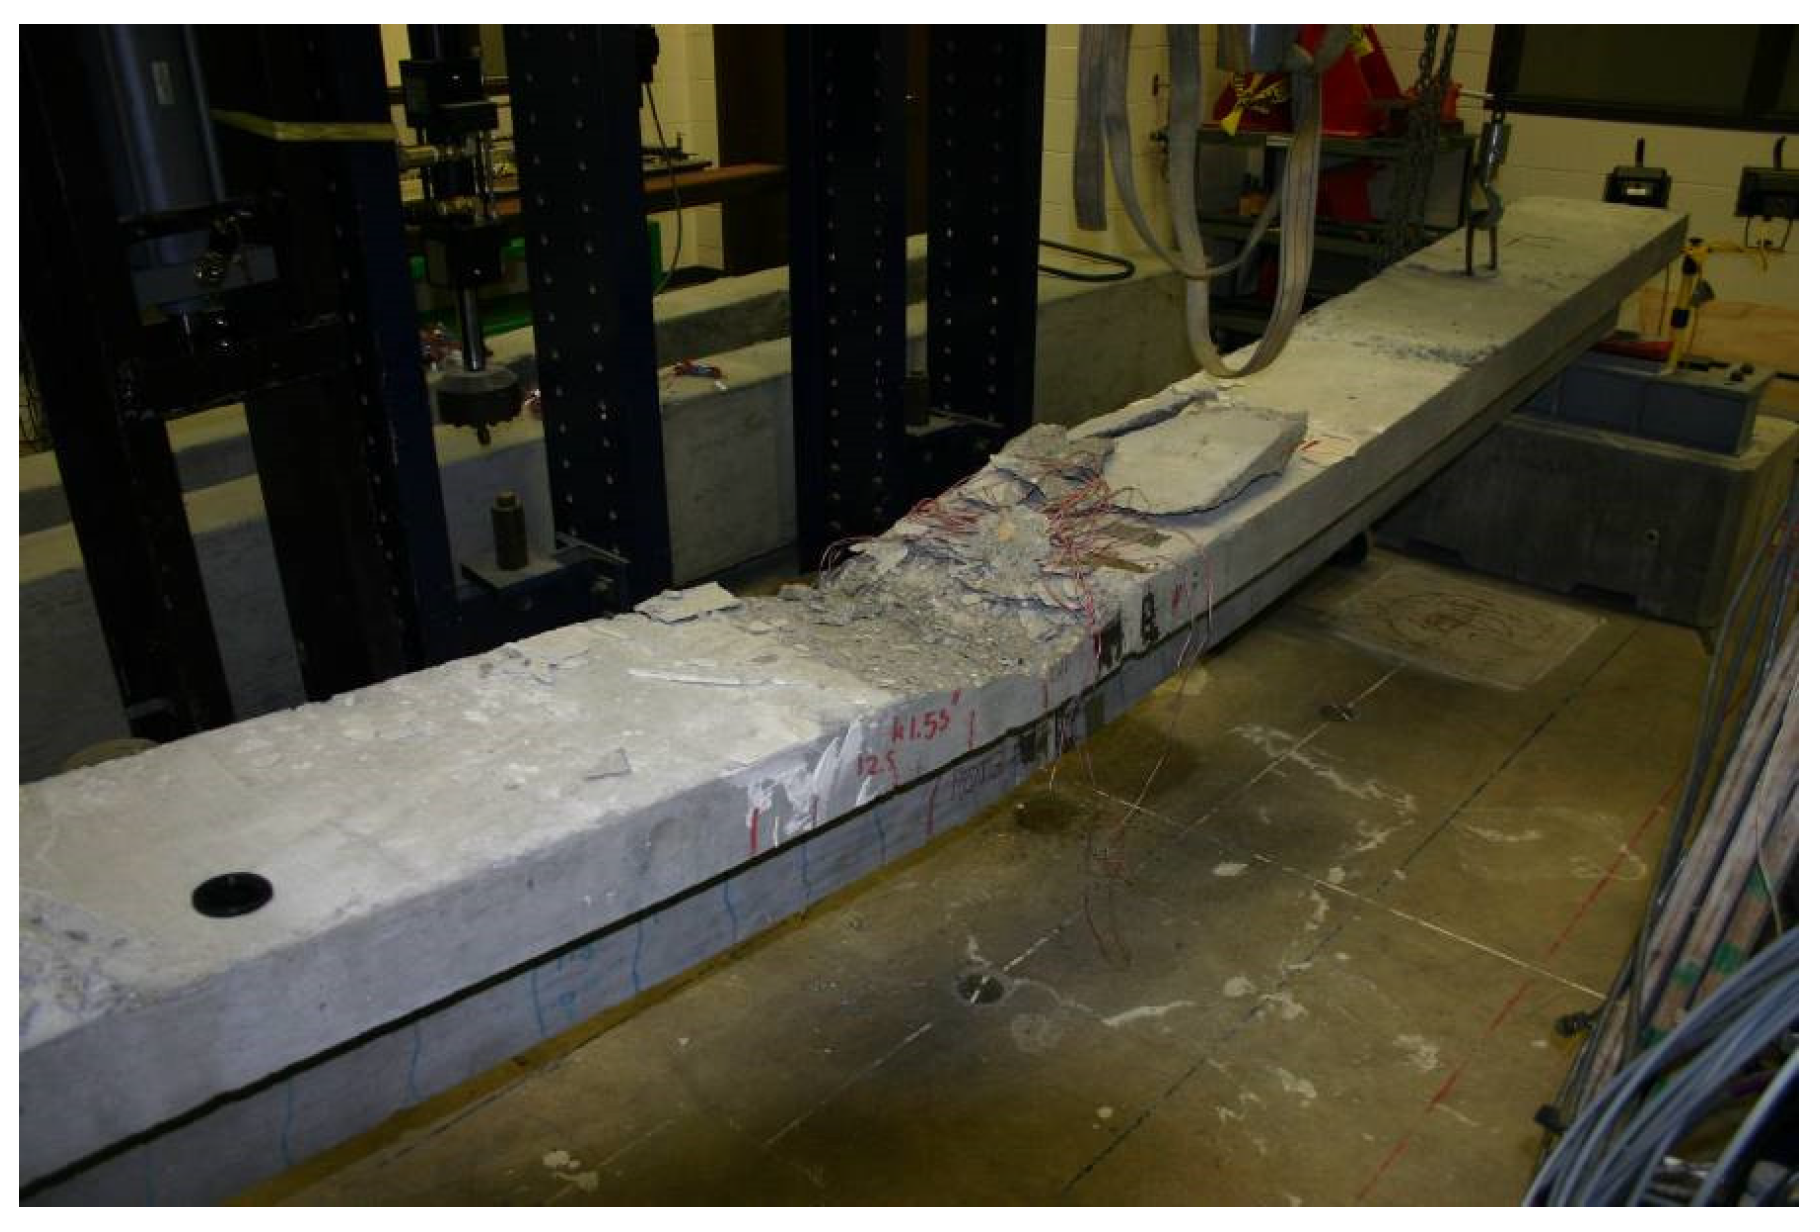
3.2. Test Results
3.2.1. Control T Beam (T1)


3.2.2. T-Beam with Flexural CFRP Only (T2)


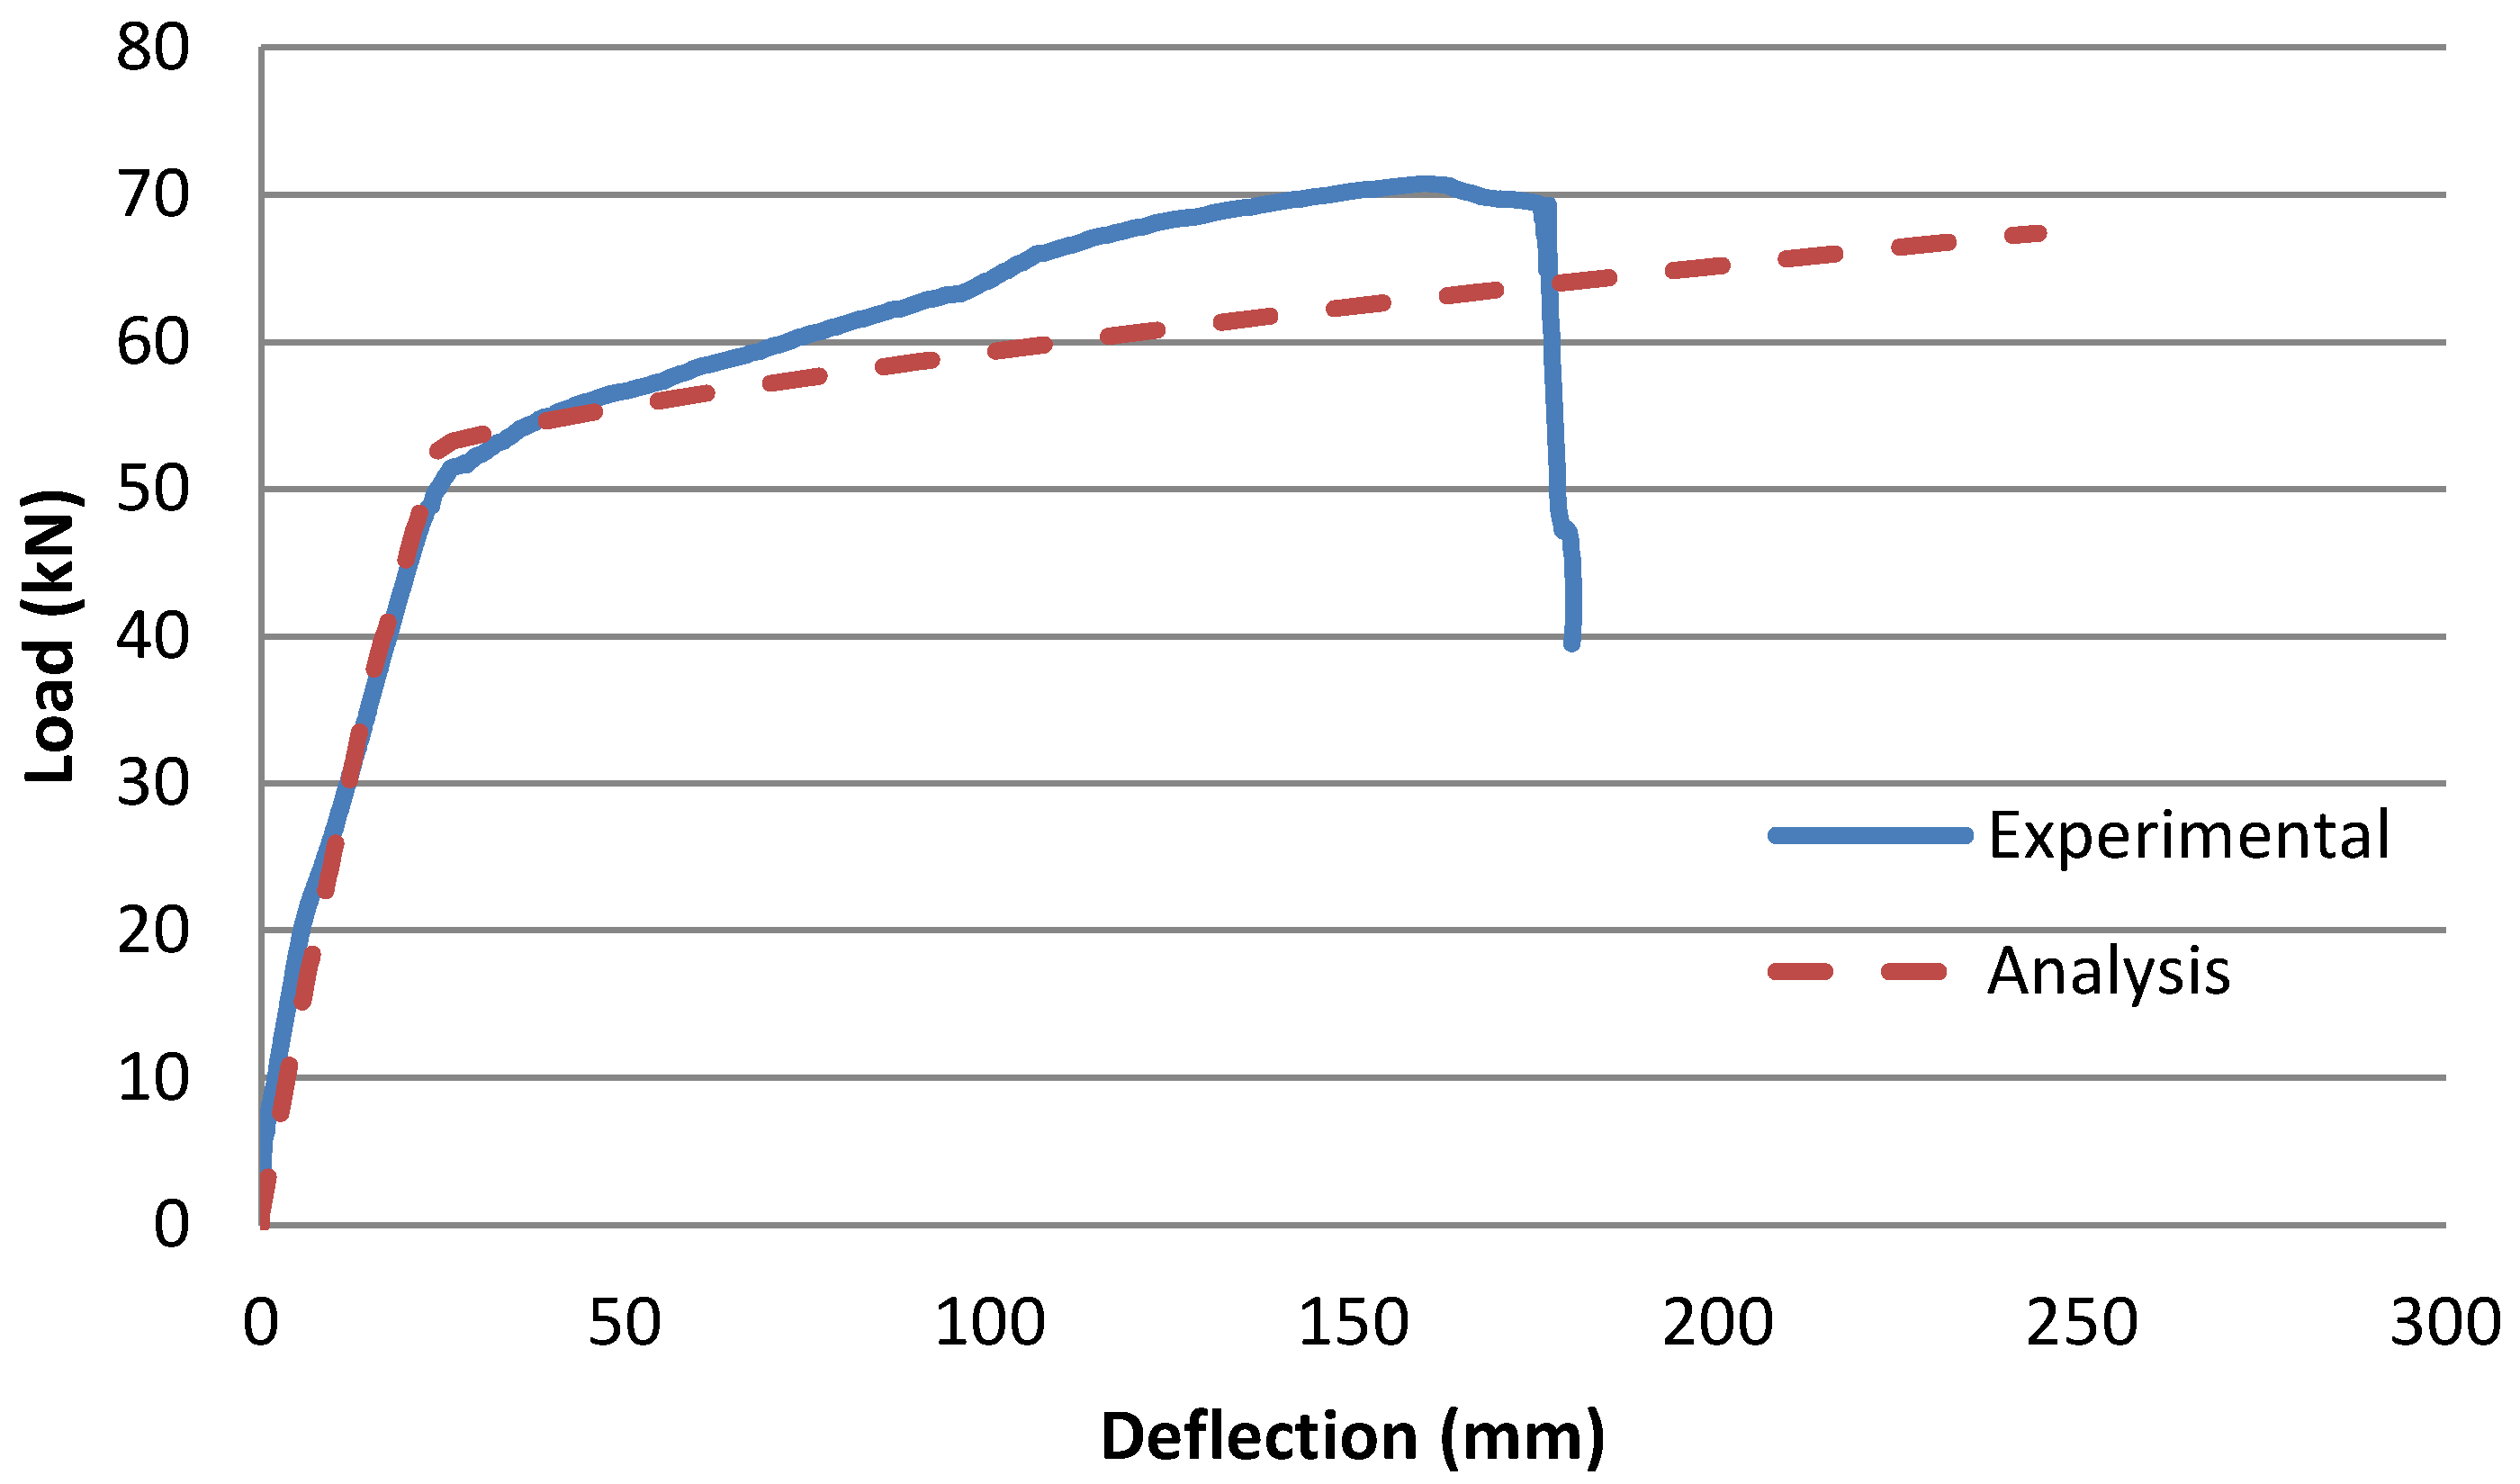
3.2.3. T-Beam with Flexural CFRP and U-Wrap Anchorage (T3)


3.2.4. Control Rectangular Beam (R1)


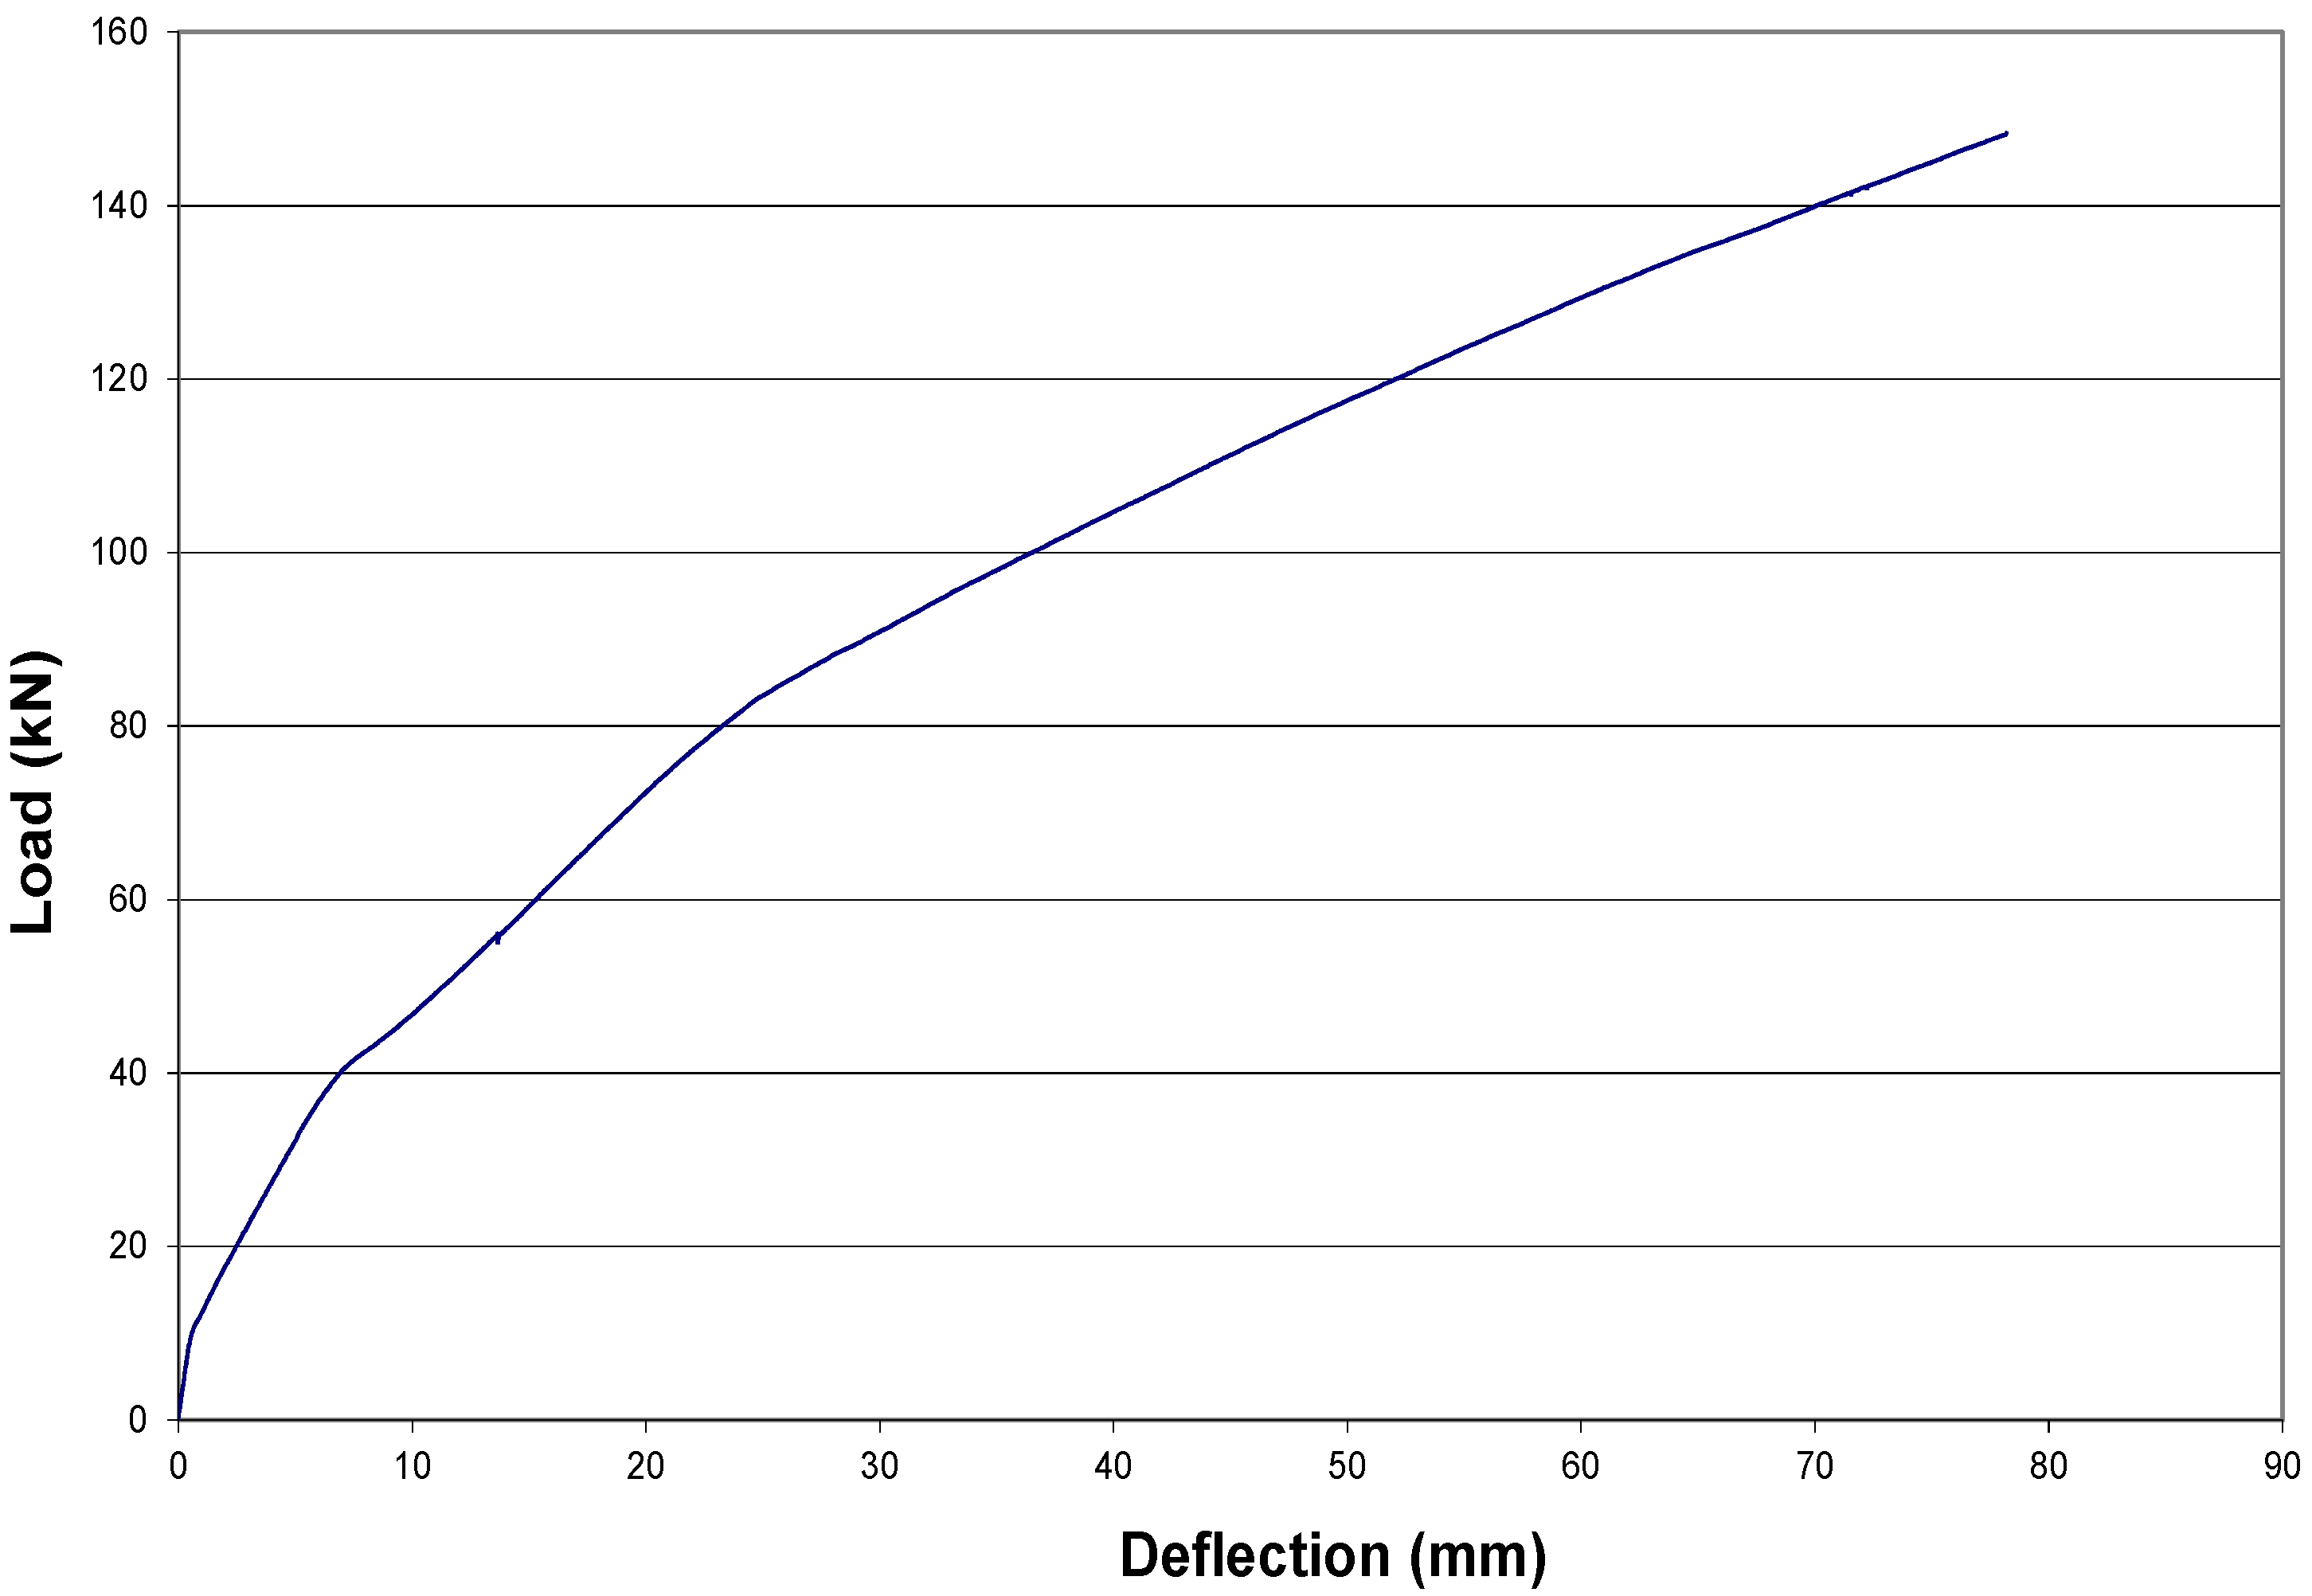
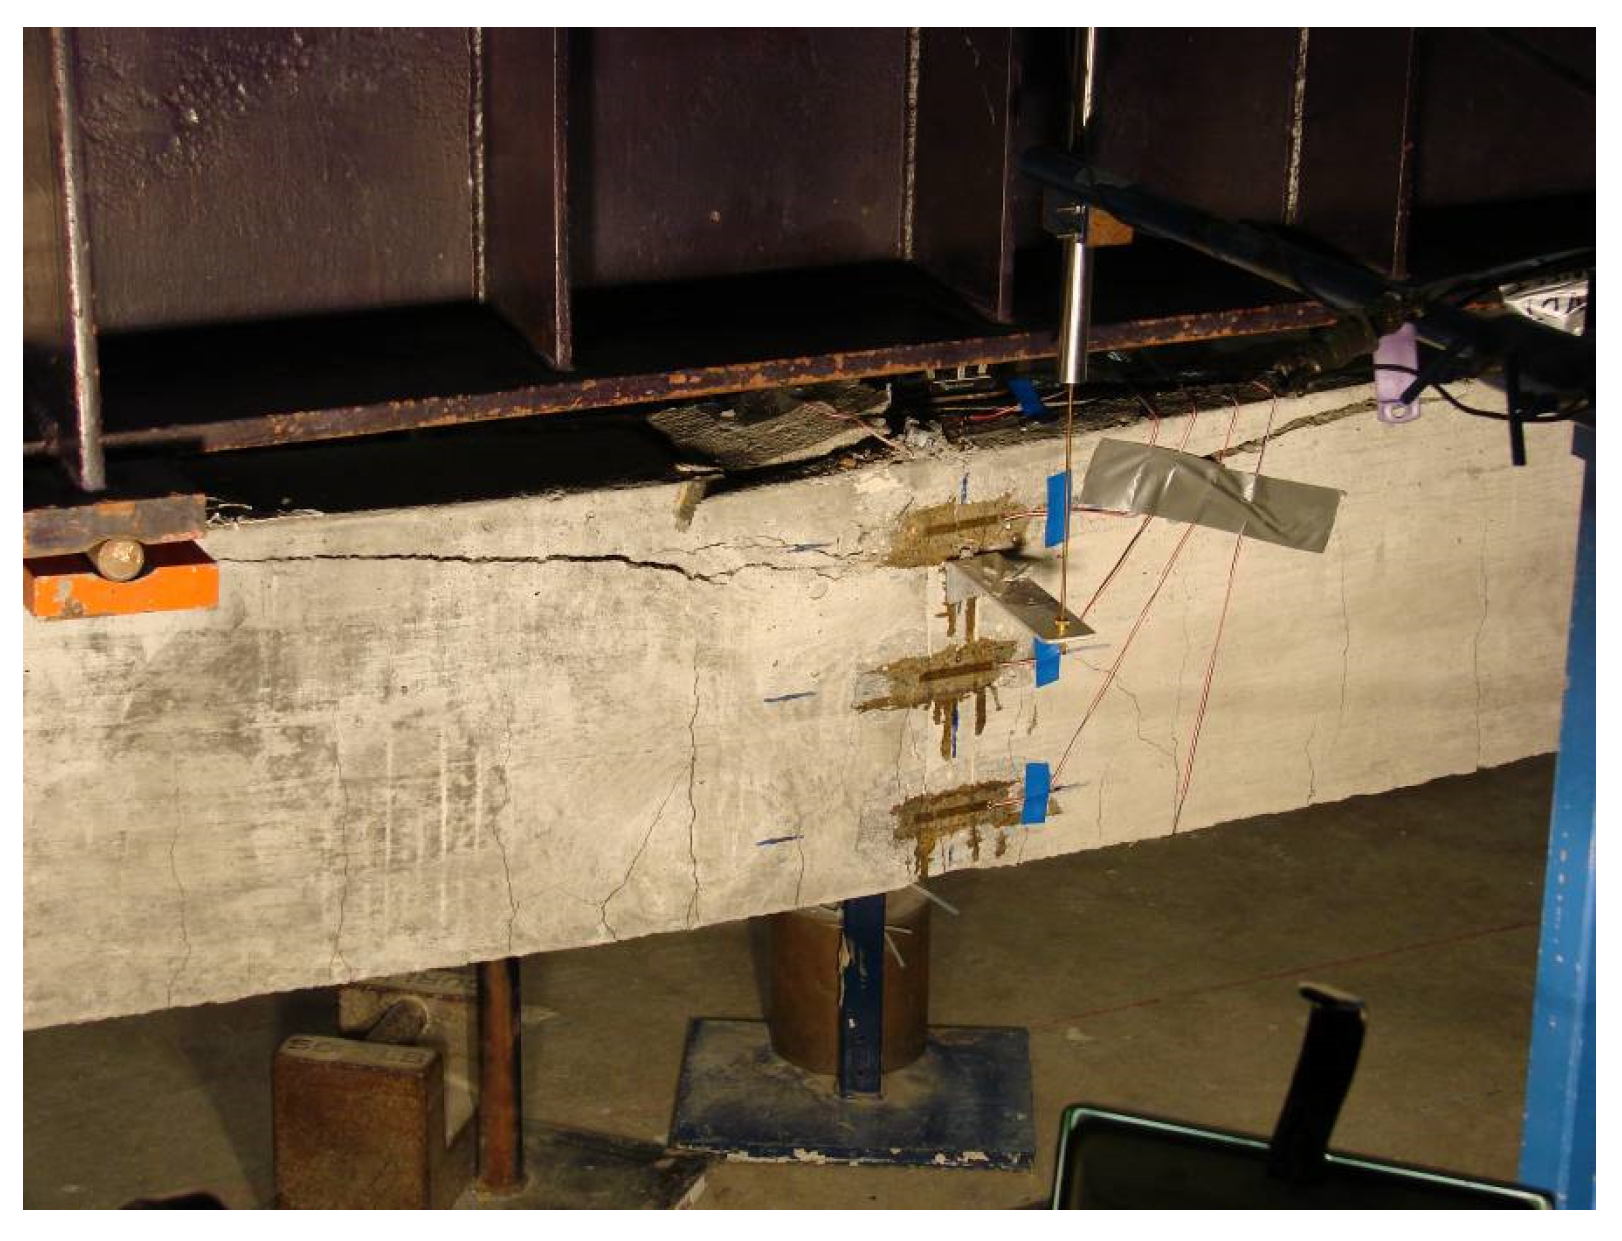
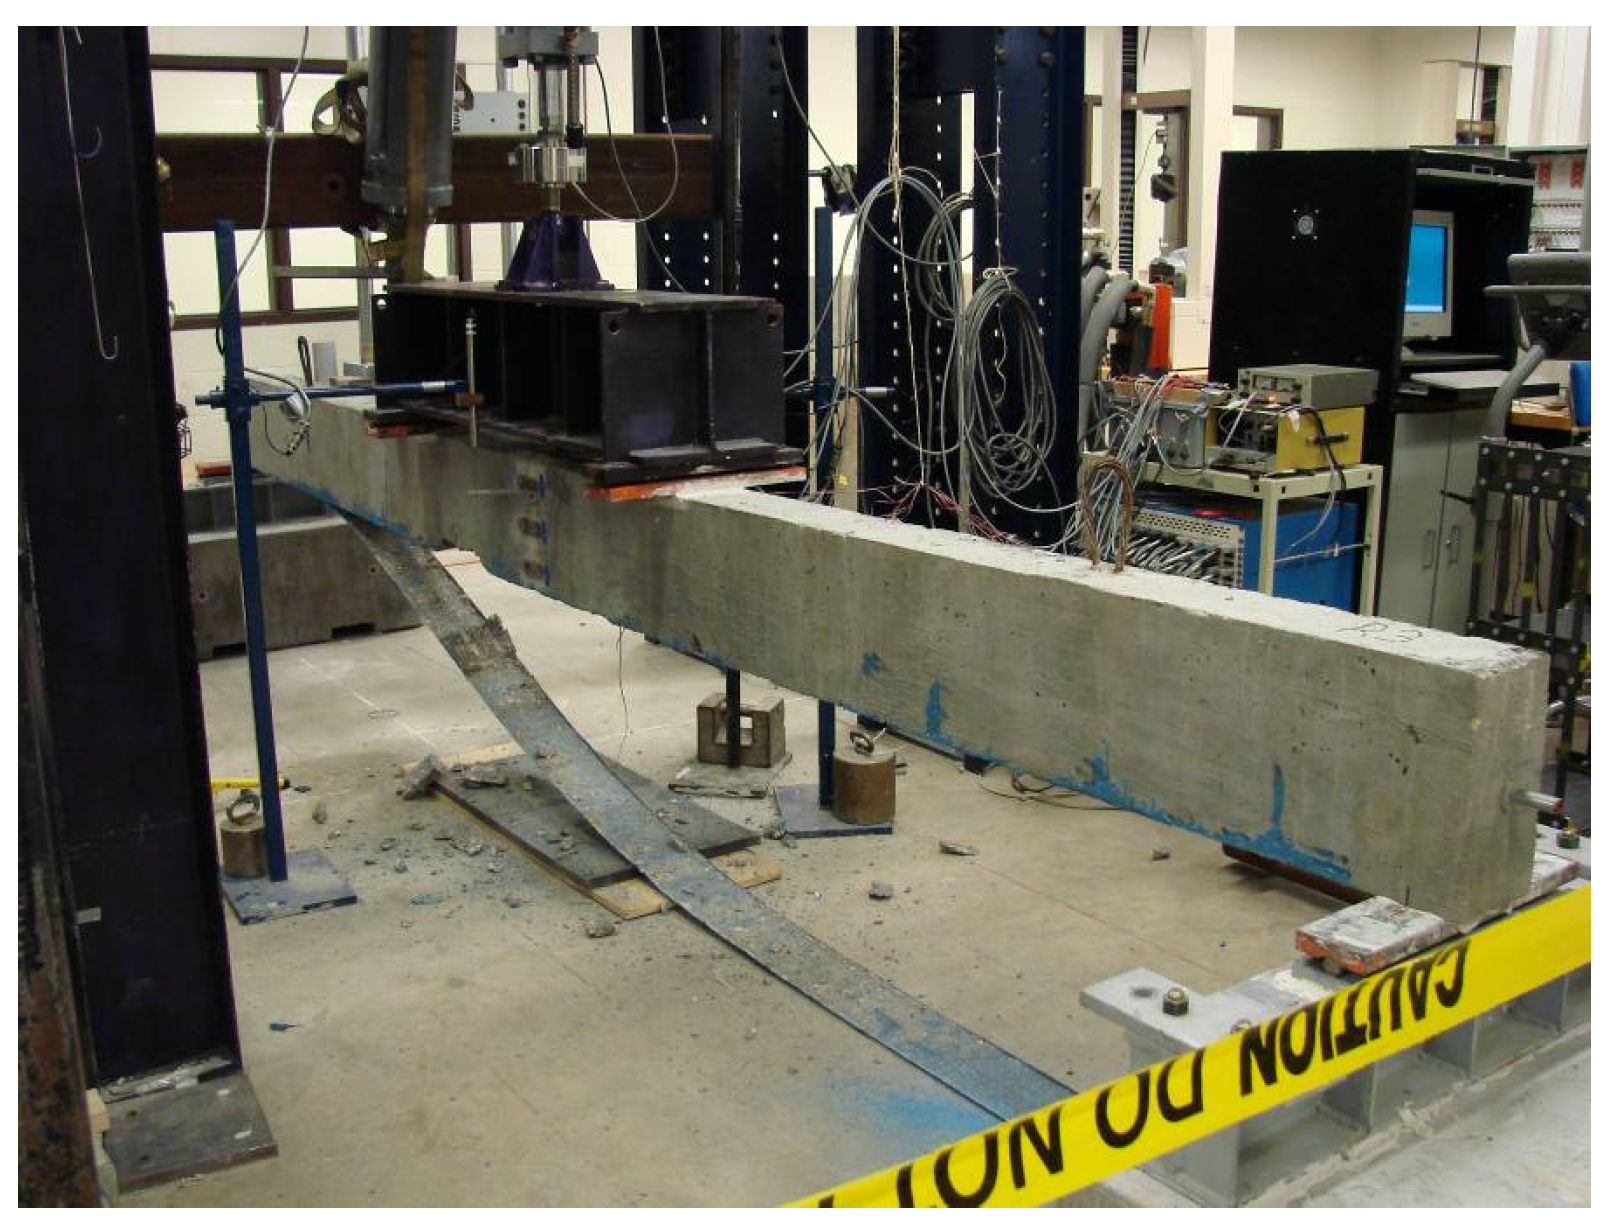
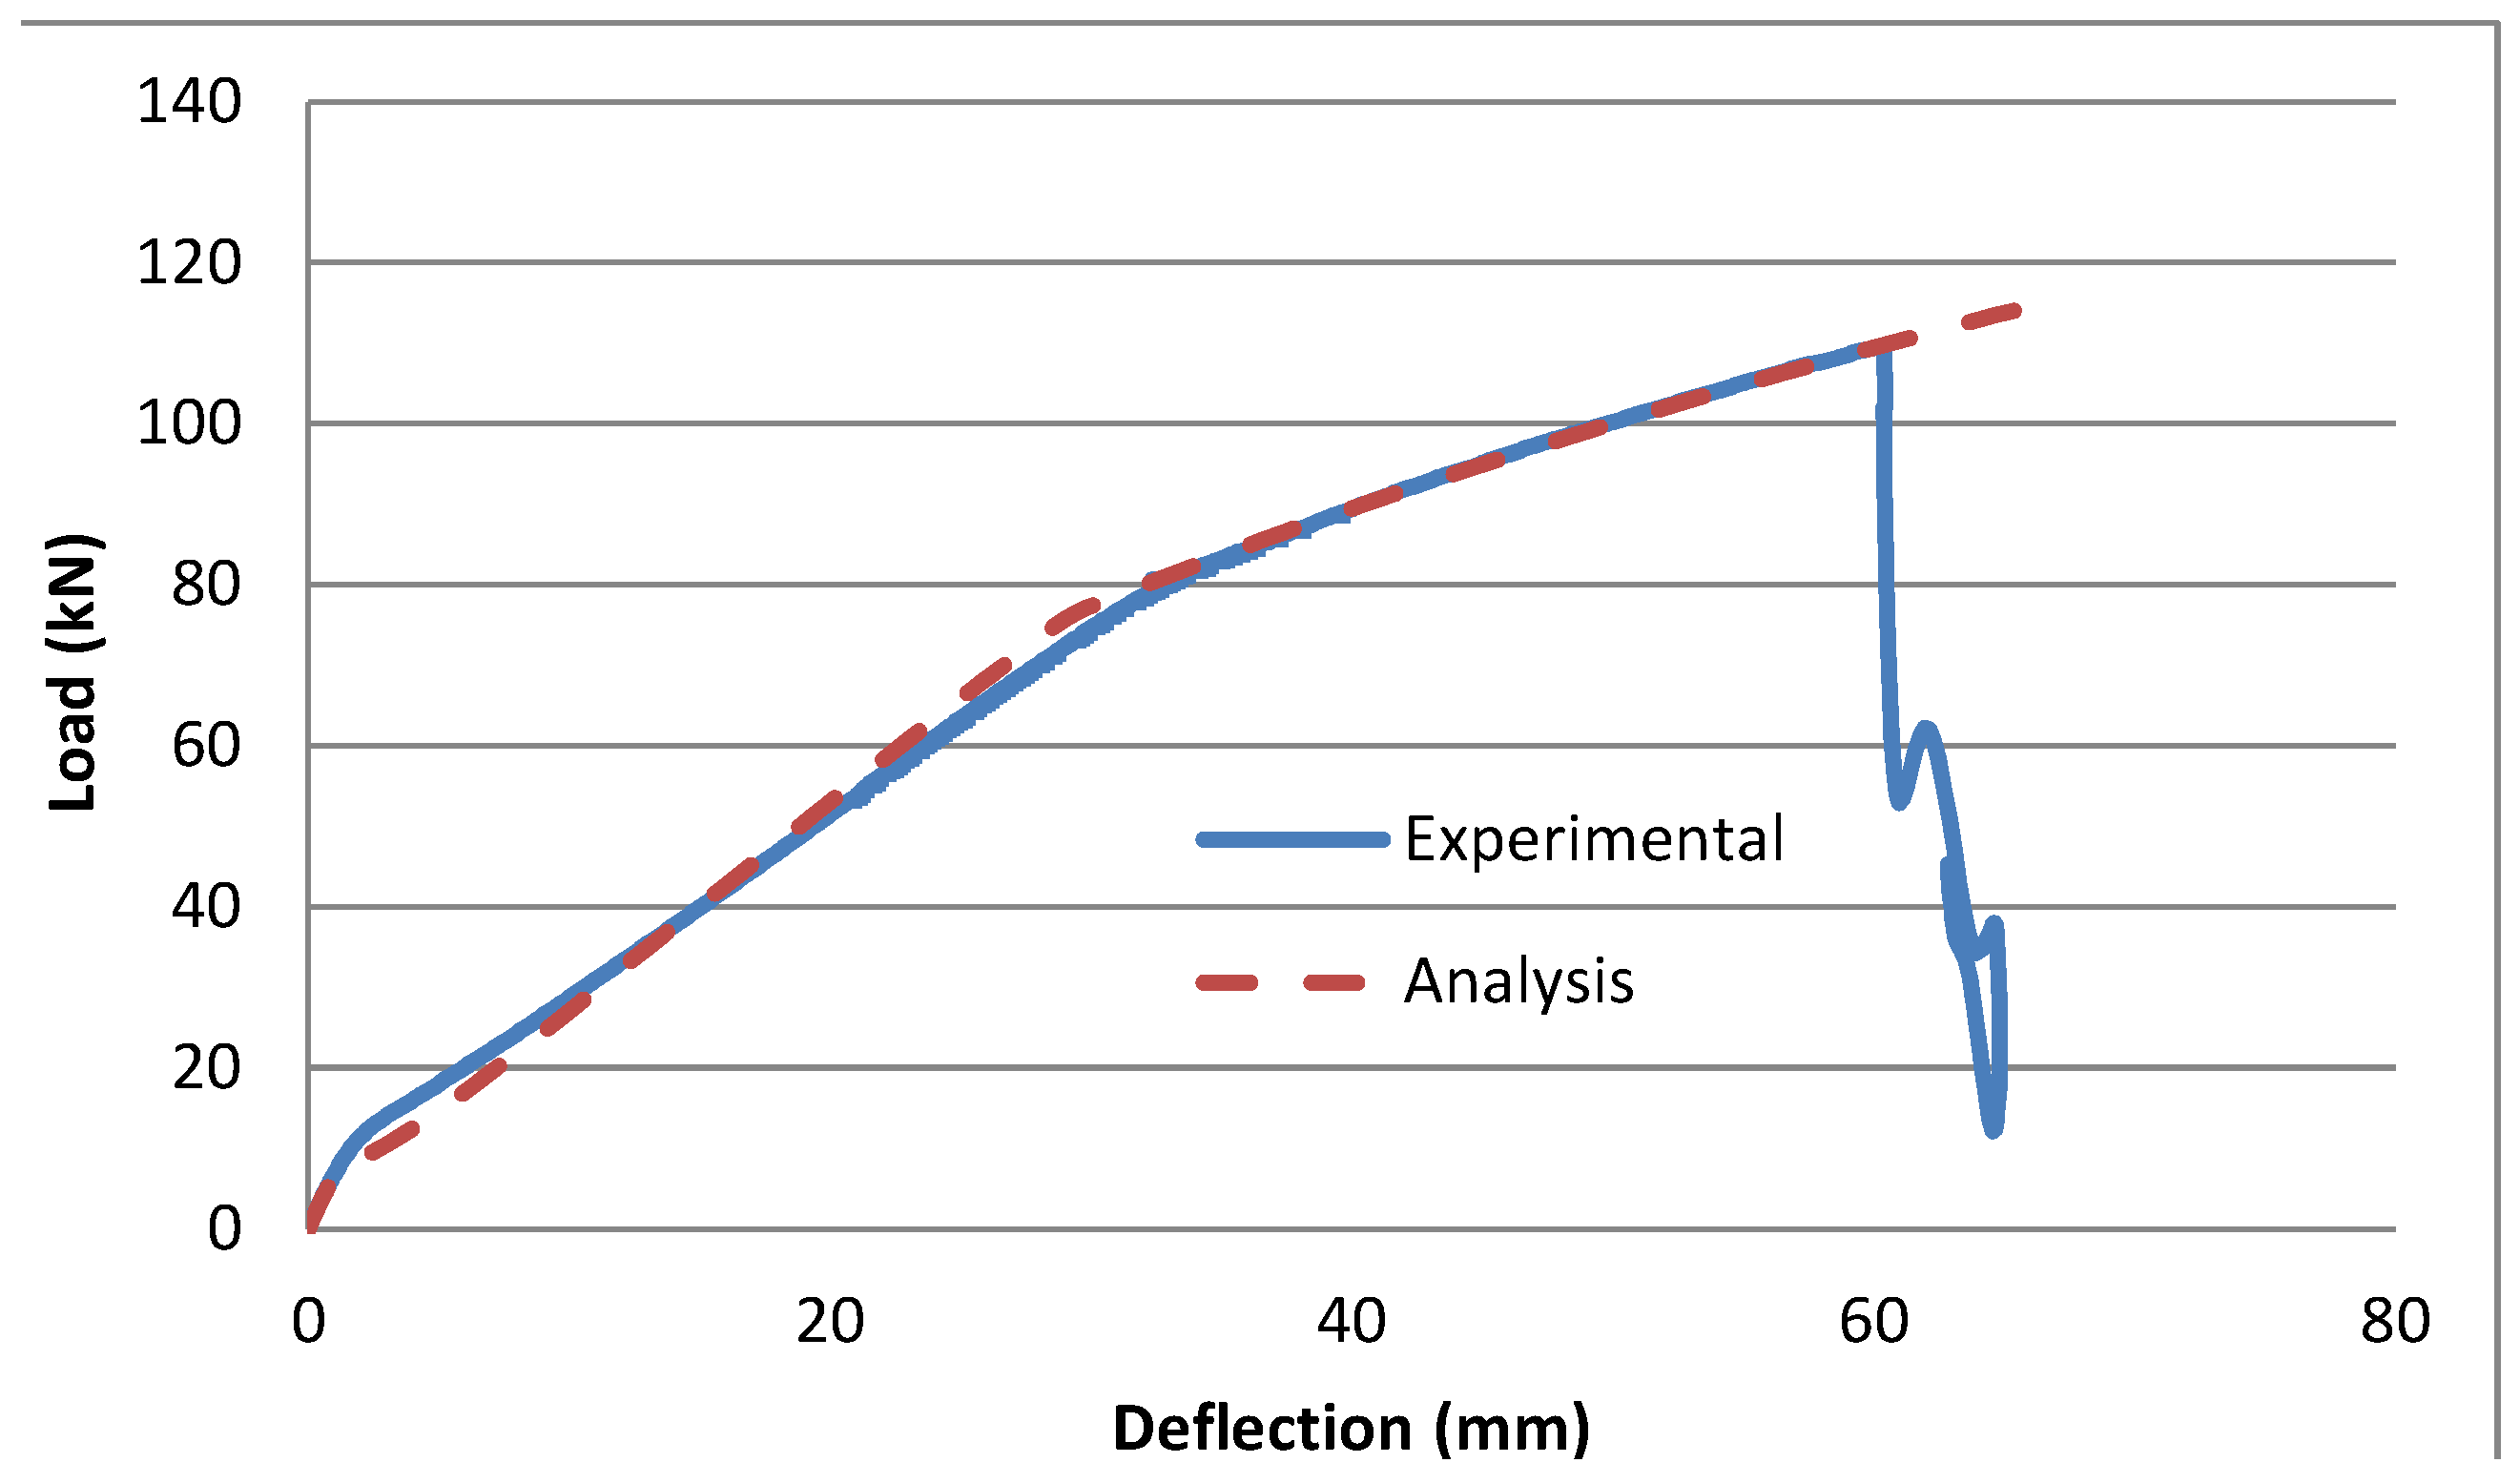
3.2.5. Rectangular Beam with CFRP Only (R2)


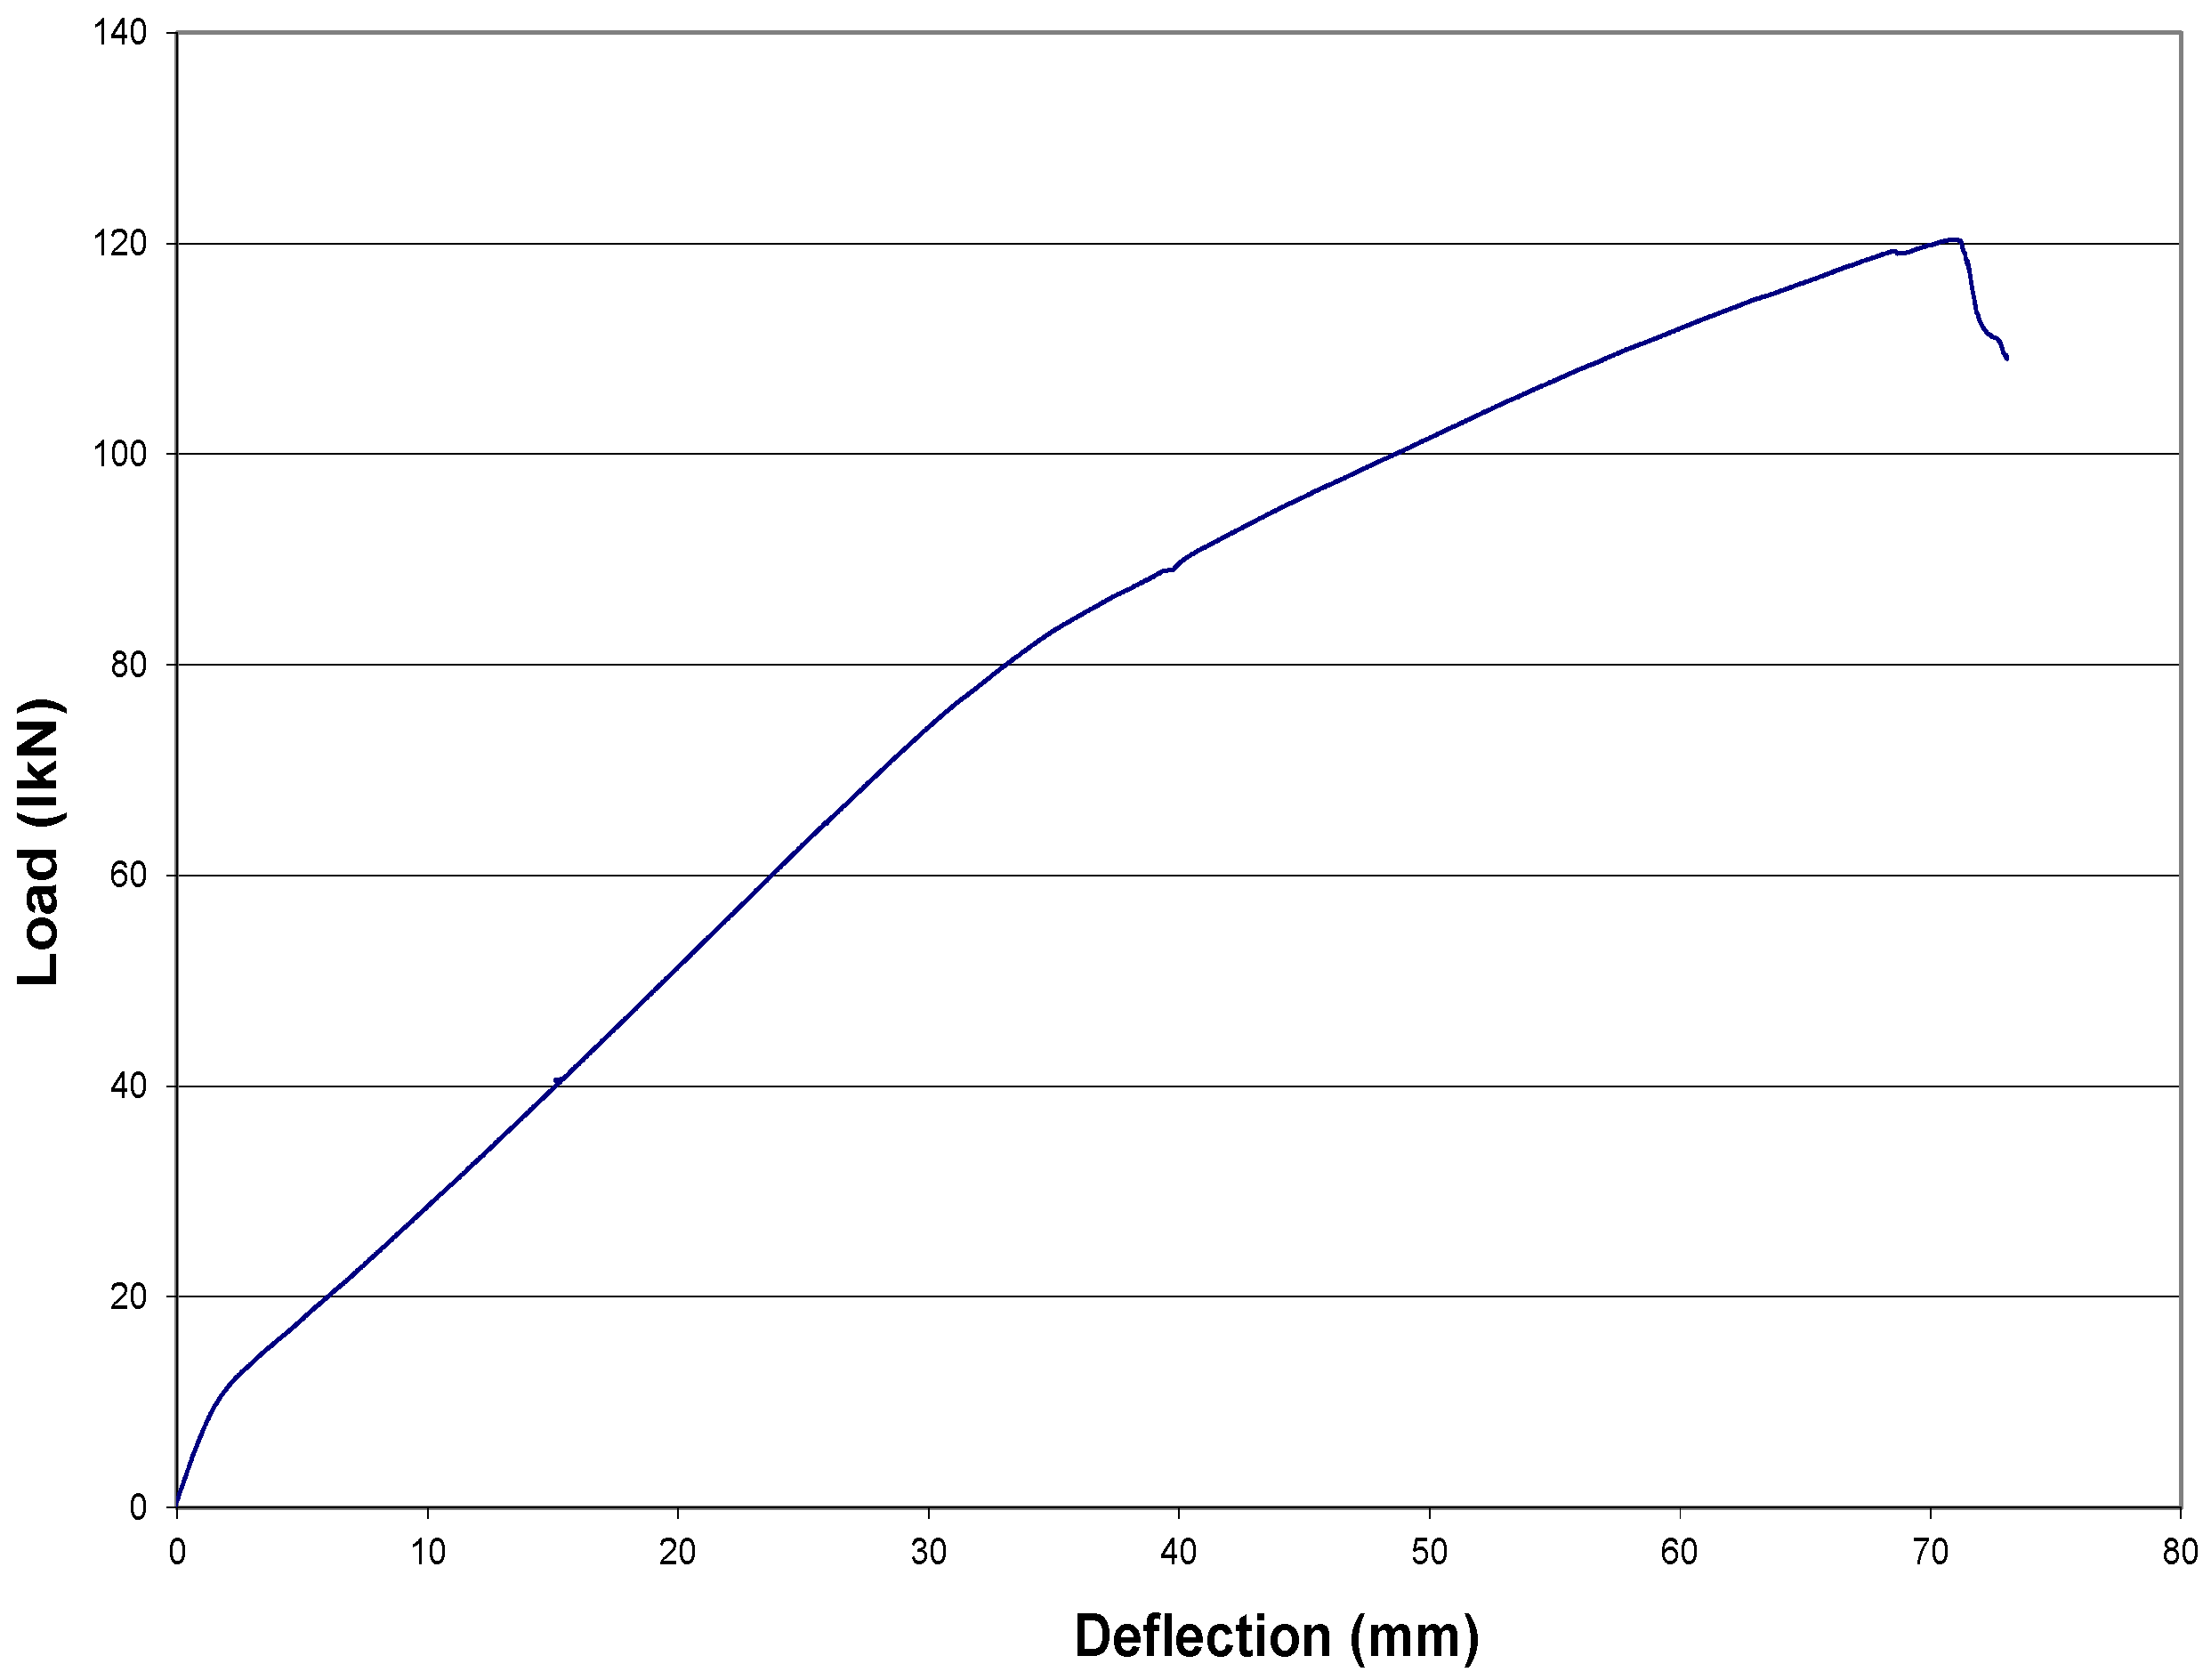
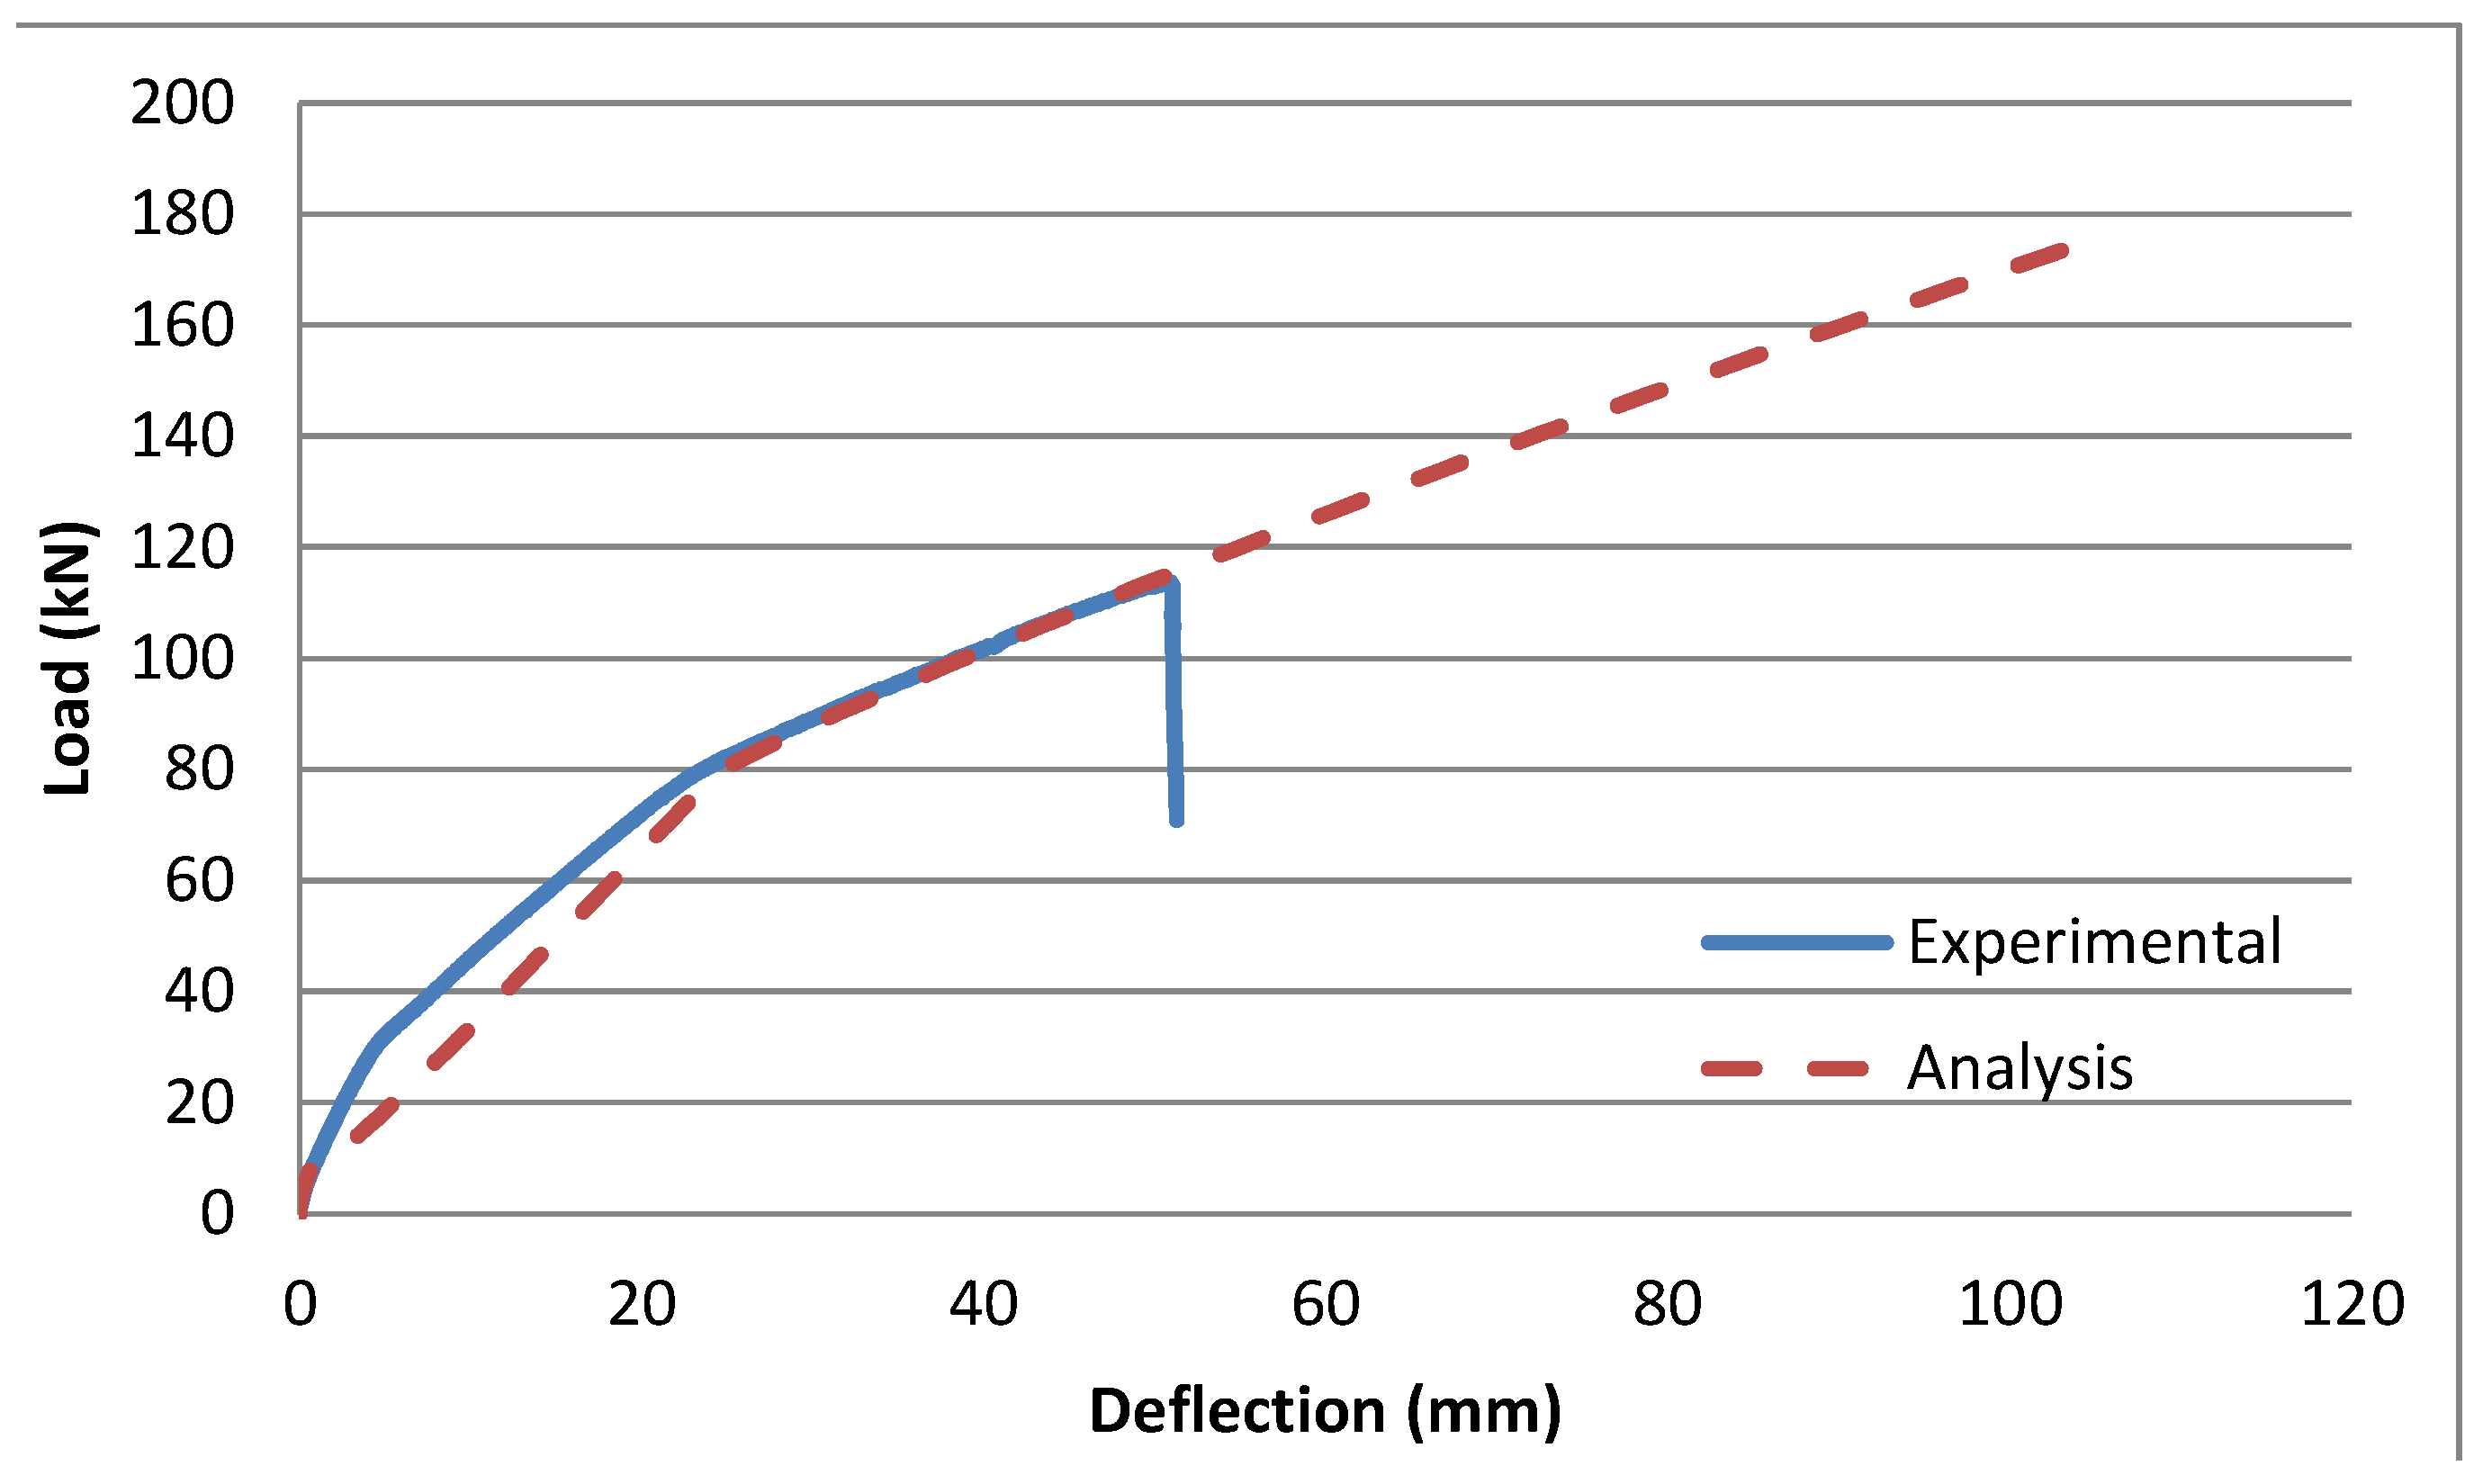
3.2.6. Rectangular Beam with CFRP and U-Wrap Anchorage (R3)


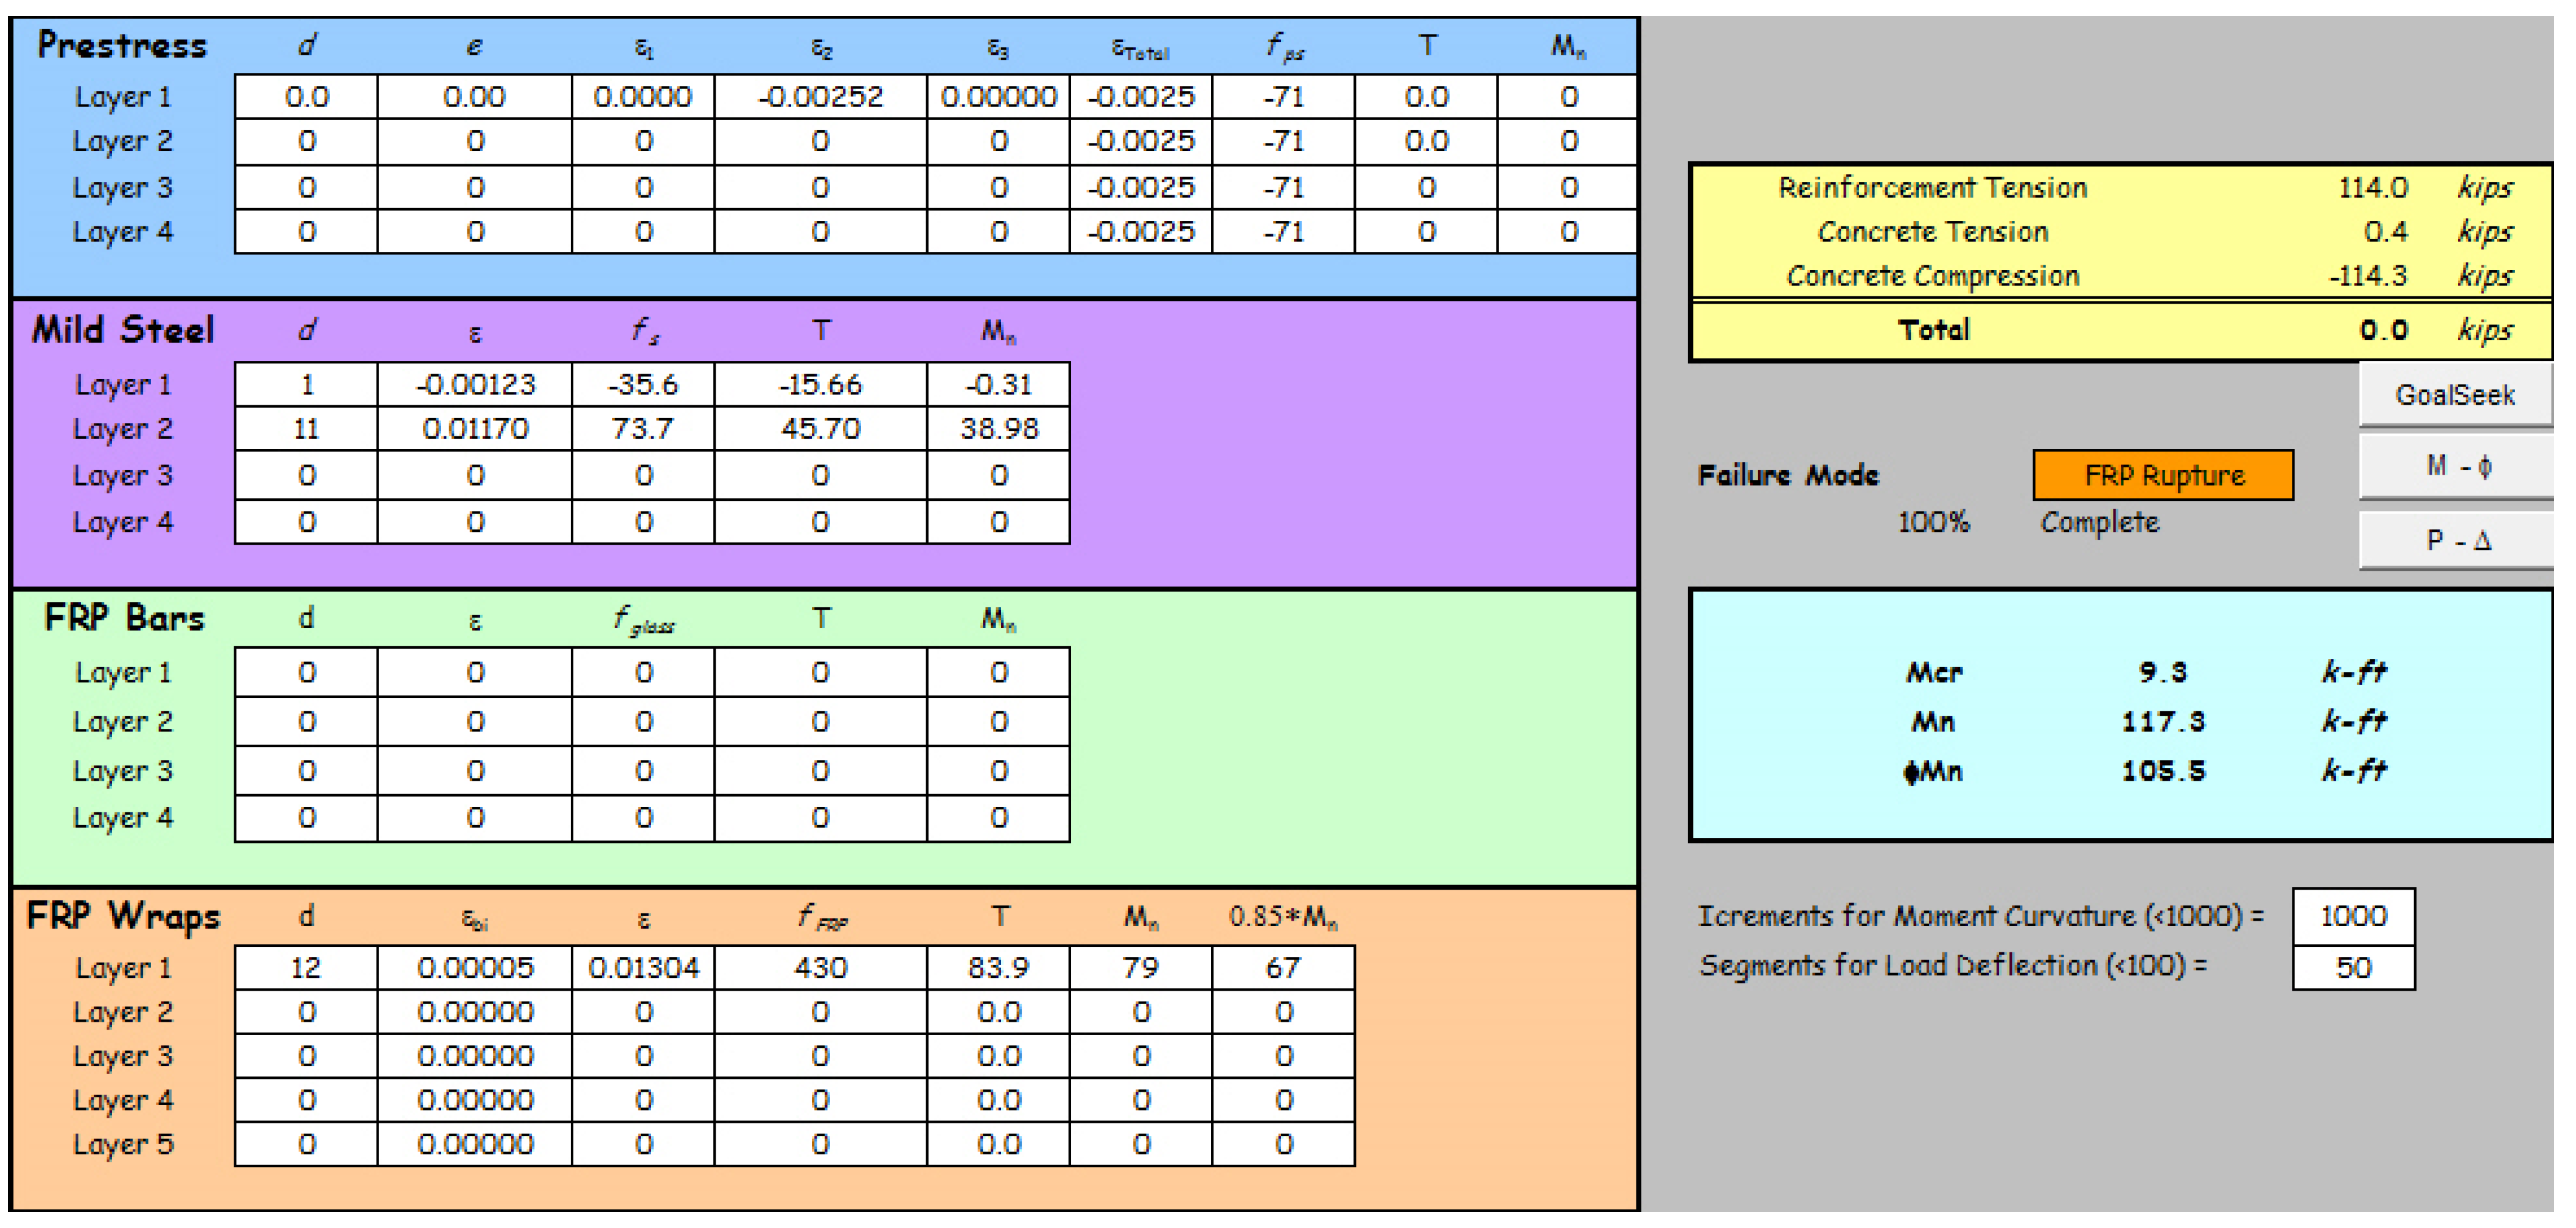
4. Numerical Analysis
4.1. Analysis Procedure


4.2. Nonlinear Analysis Software


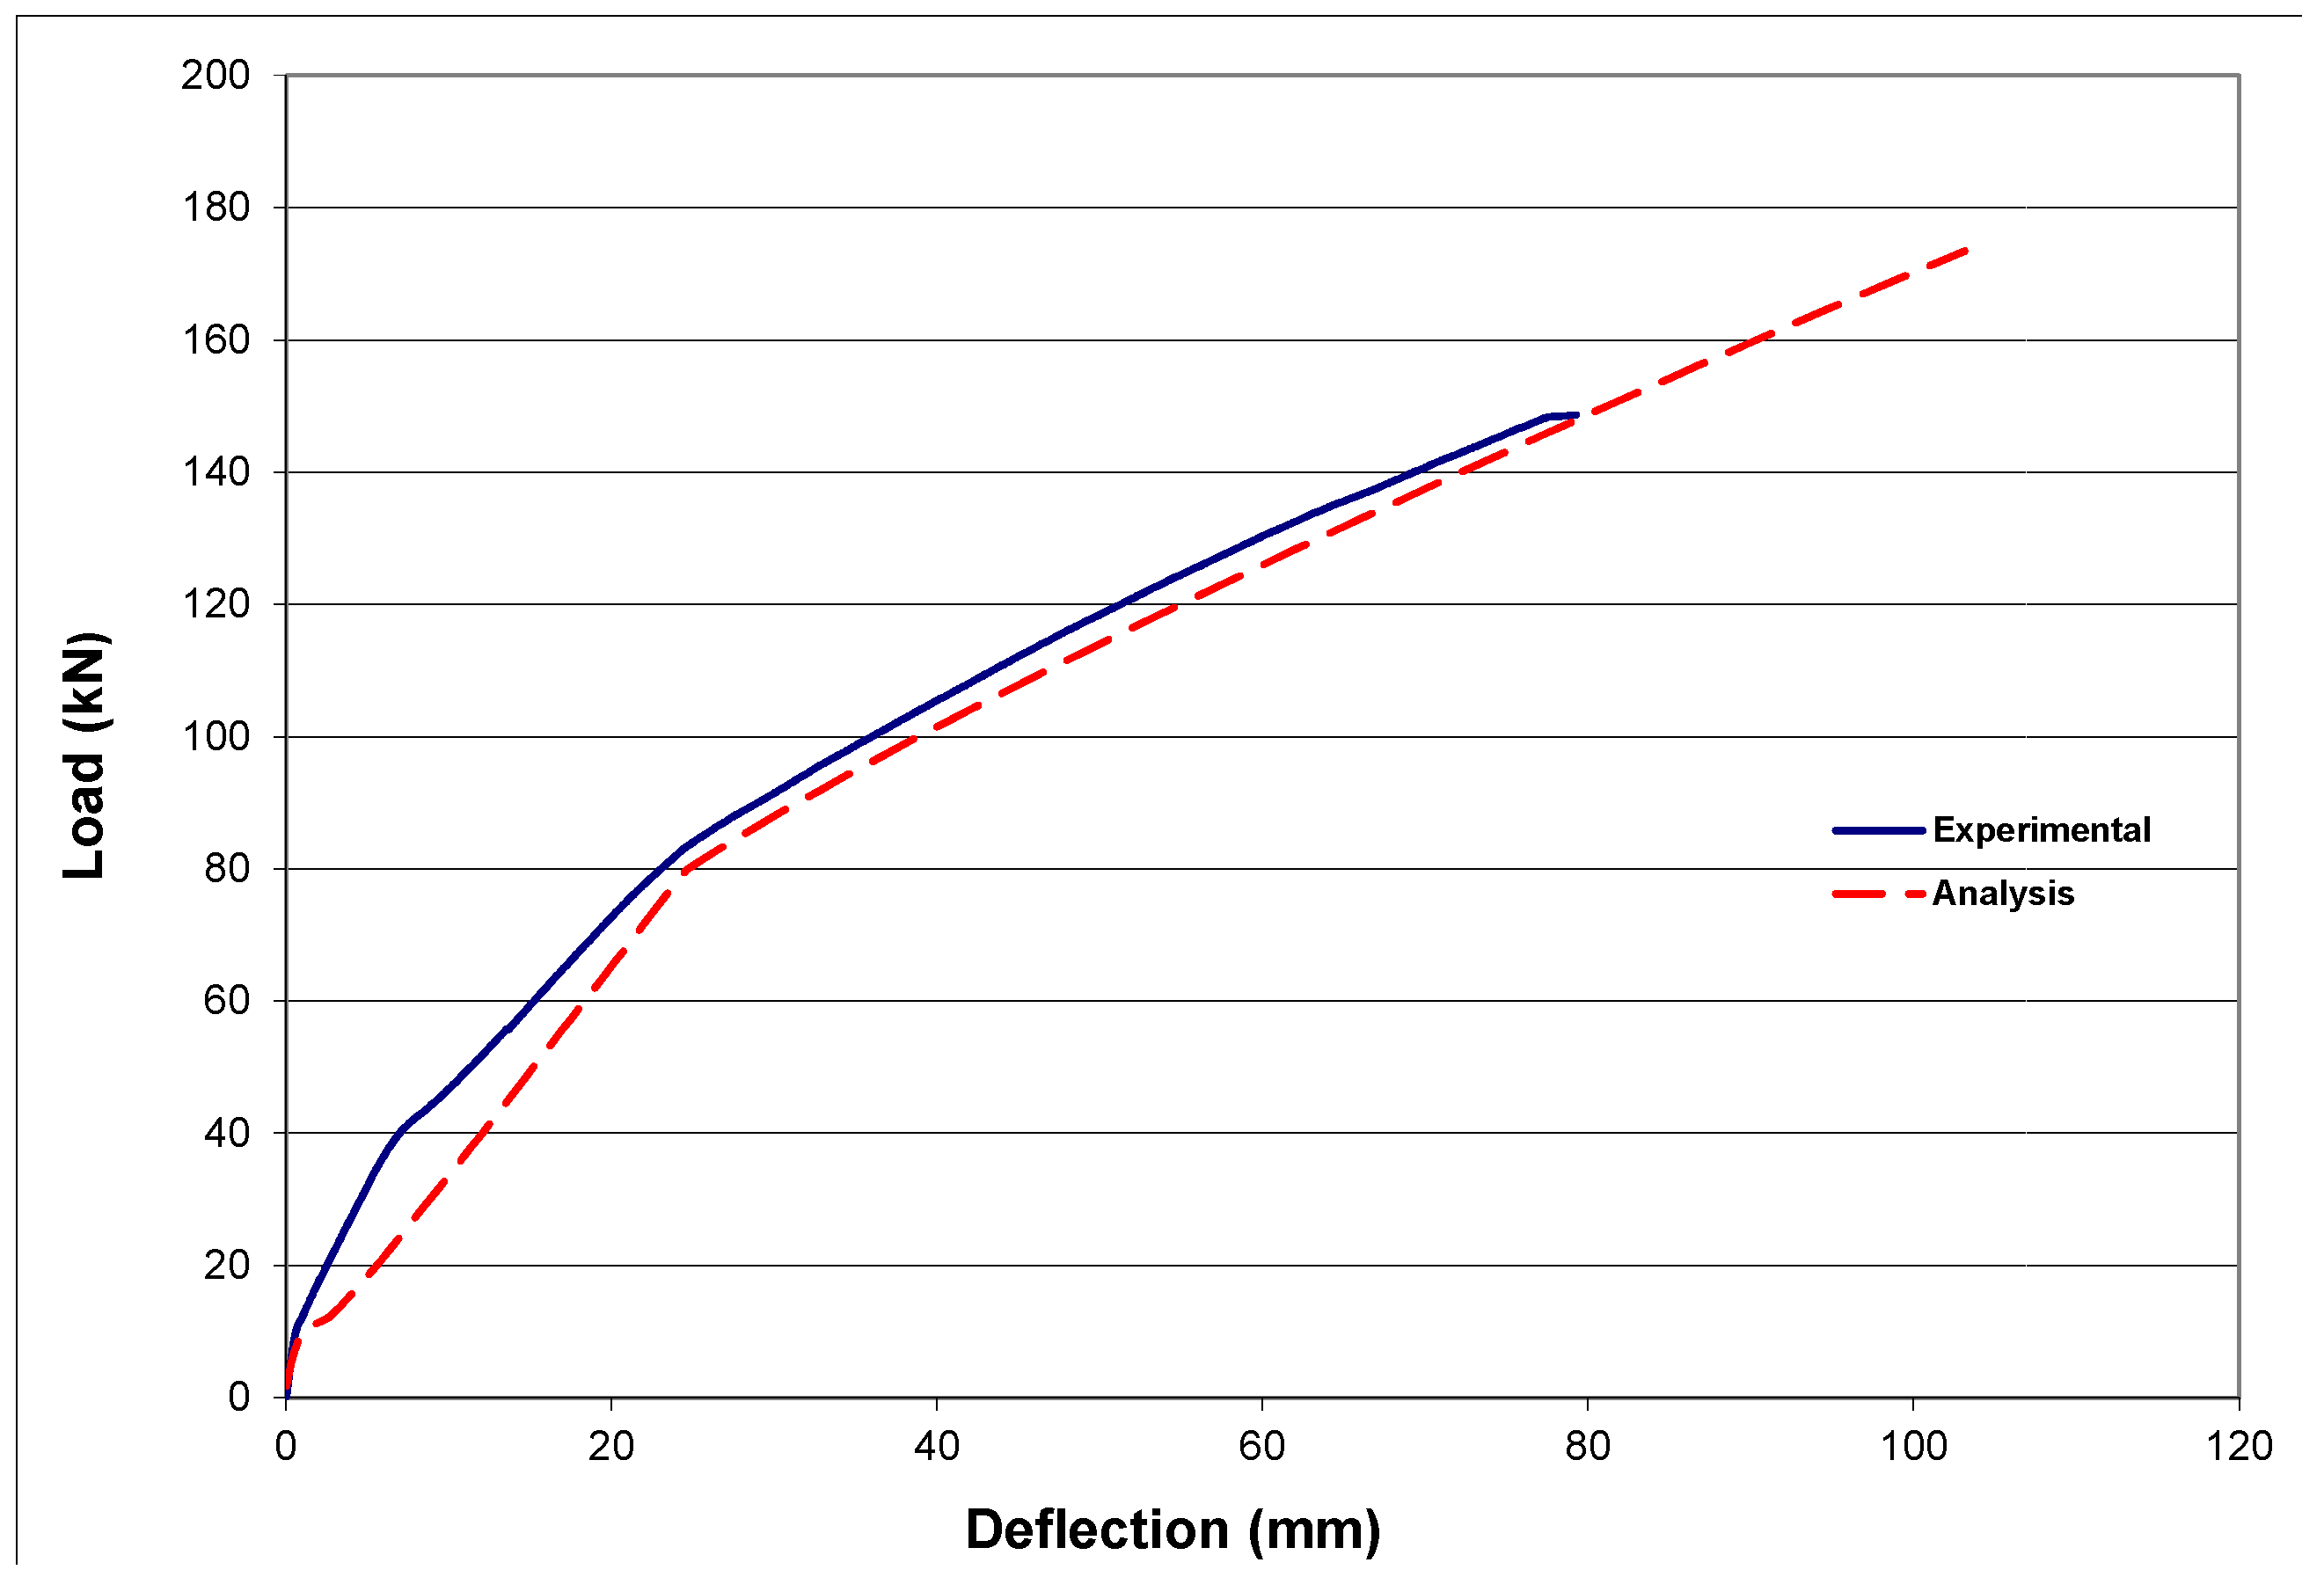
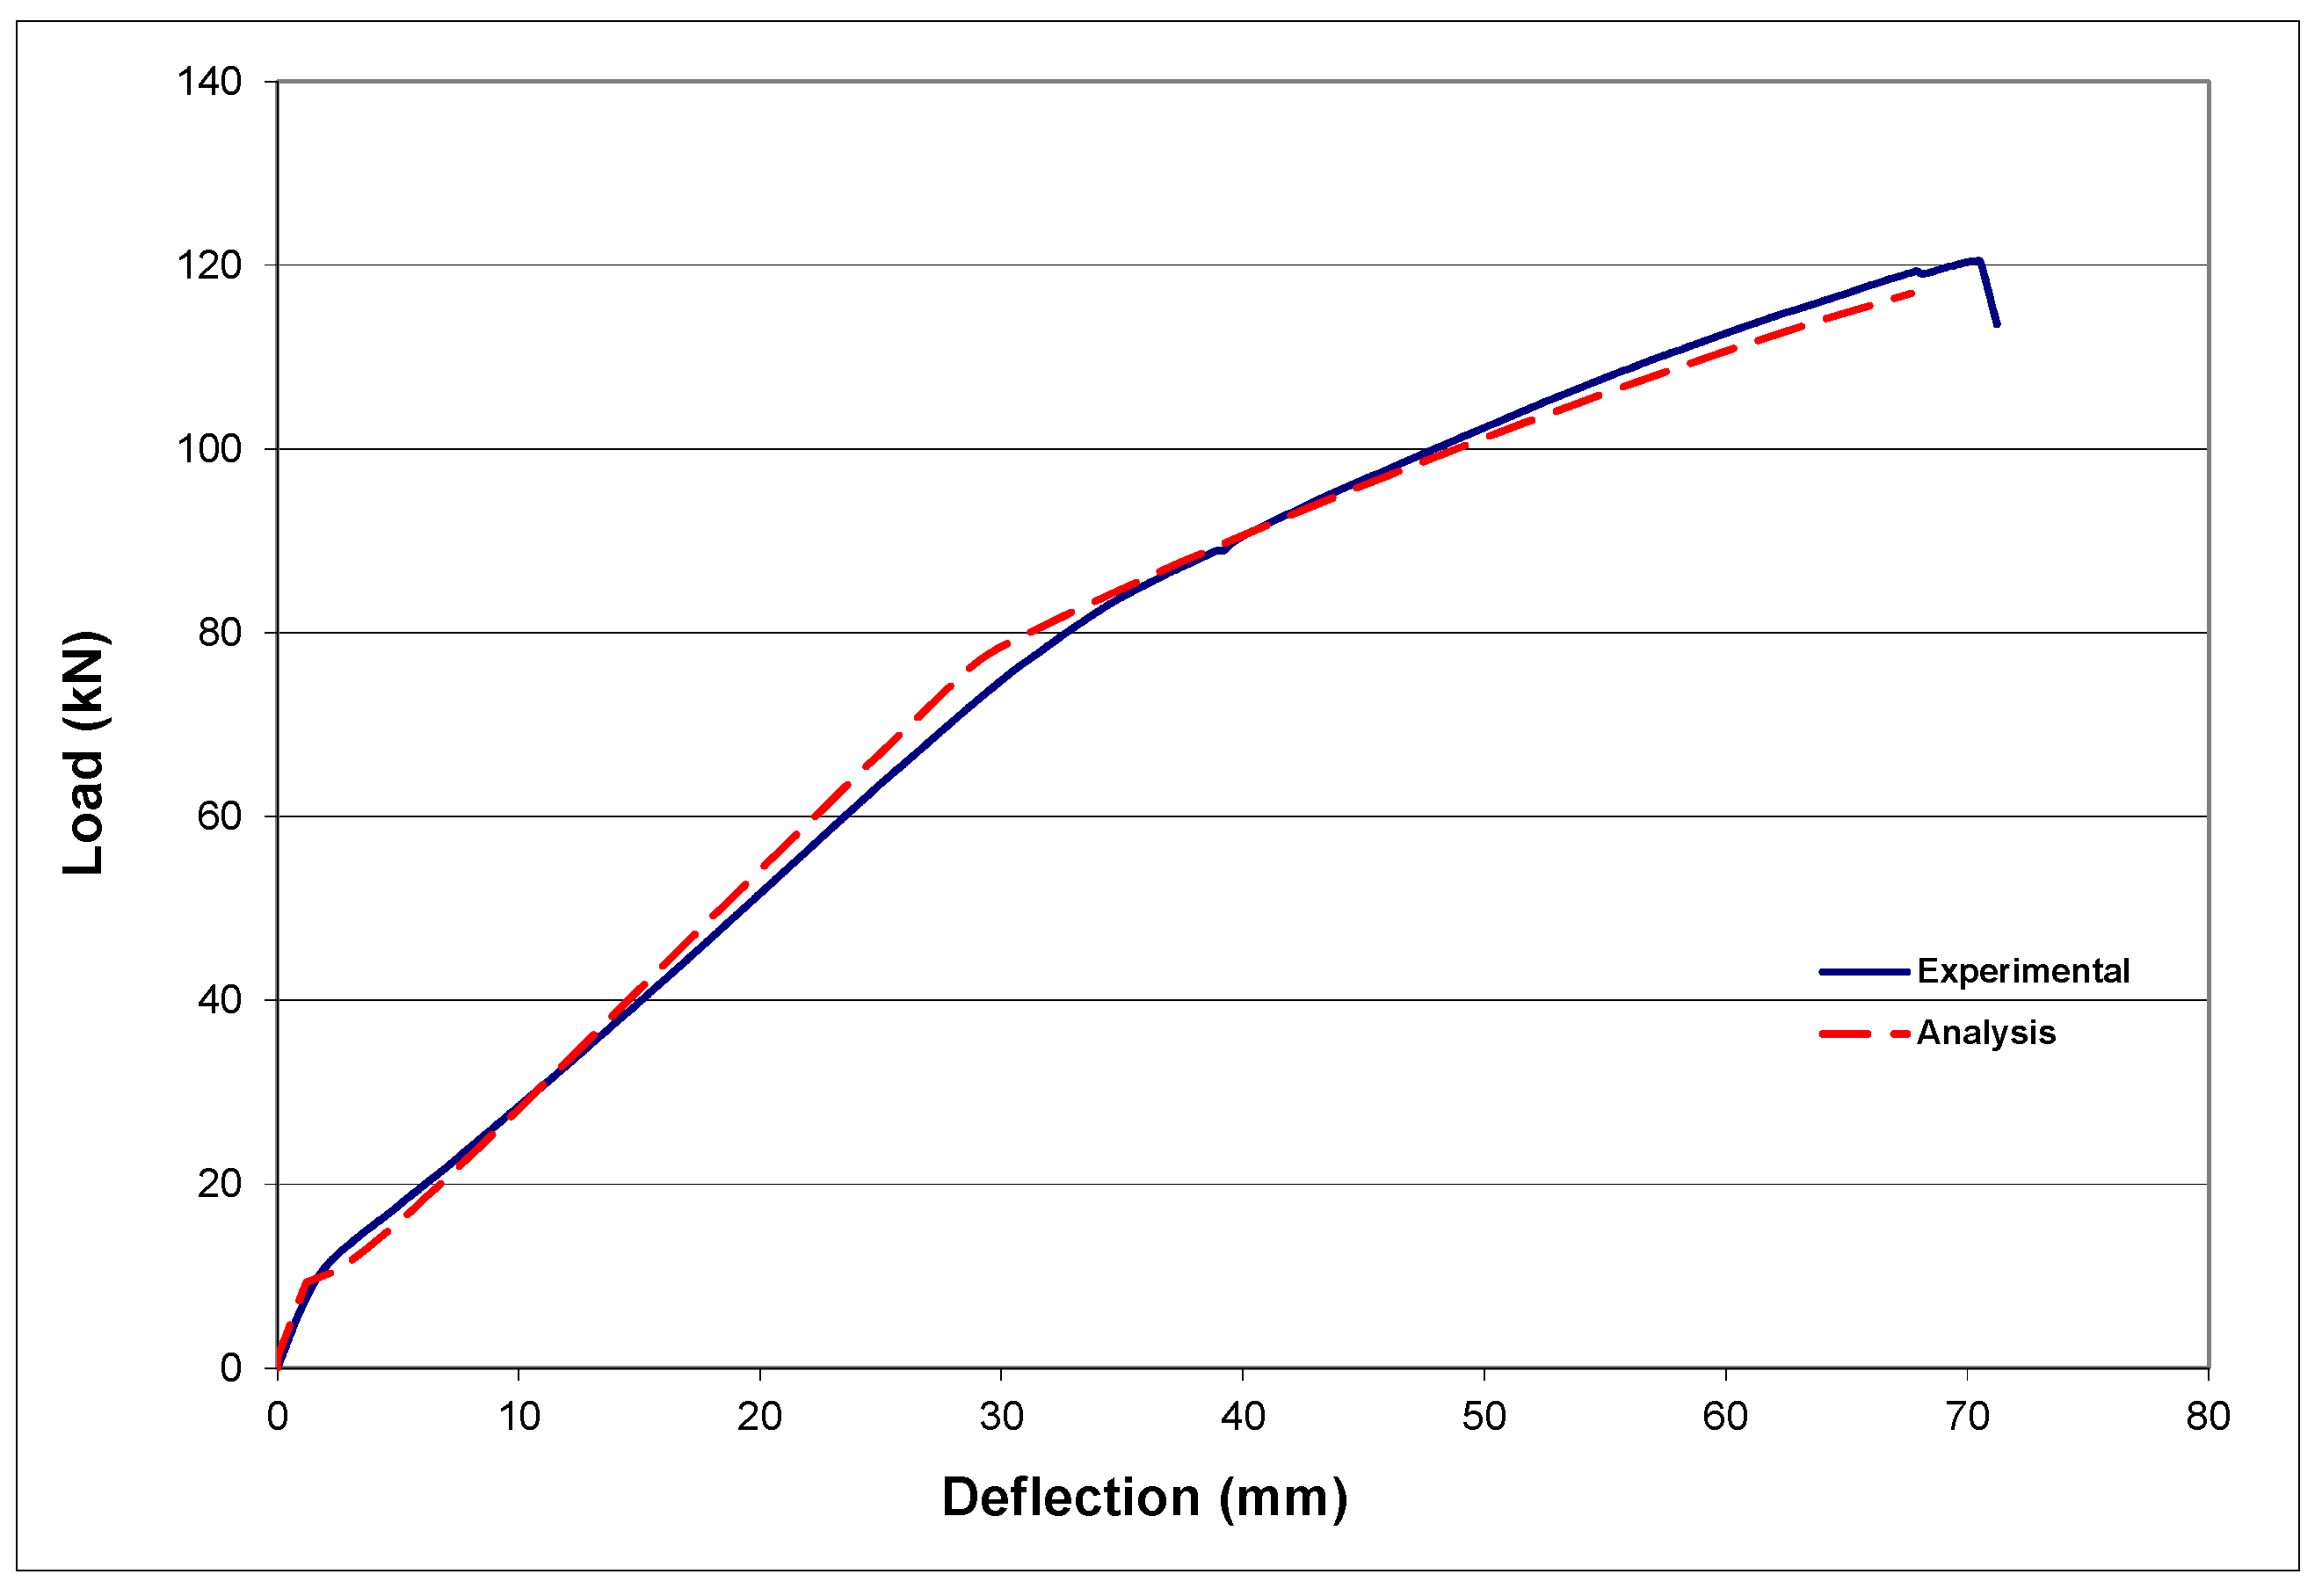
4.3. Comparison with Beam Responses


5. Anchorage Design
5.1. Proposed Anchorage Design Procedure
- Compute the maximum possible FRP tensile force that needs to be developed at the level of classical sectional failure moment:
- Compute the horizontal shear force per unit length of shear span:where Vsf is the horizontal shear friction force per unit length of the FRP shear span, and Laf is the FRP shear span.
- Compute the clamping tension force per unit length in the transverse FRP direction using the shear friction expression:
- Compute the clamping tension force per unit length in the transverse FRP direction. ACI 440.2R-08 [17] limits the effective FRP transverse strain to less than 0.004. In this model, is assumed:
- Compute the width and the number of layers for the transverse FRP:

5.2. Anchorage Design Details
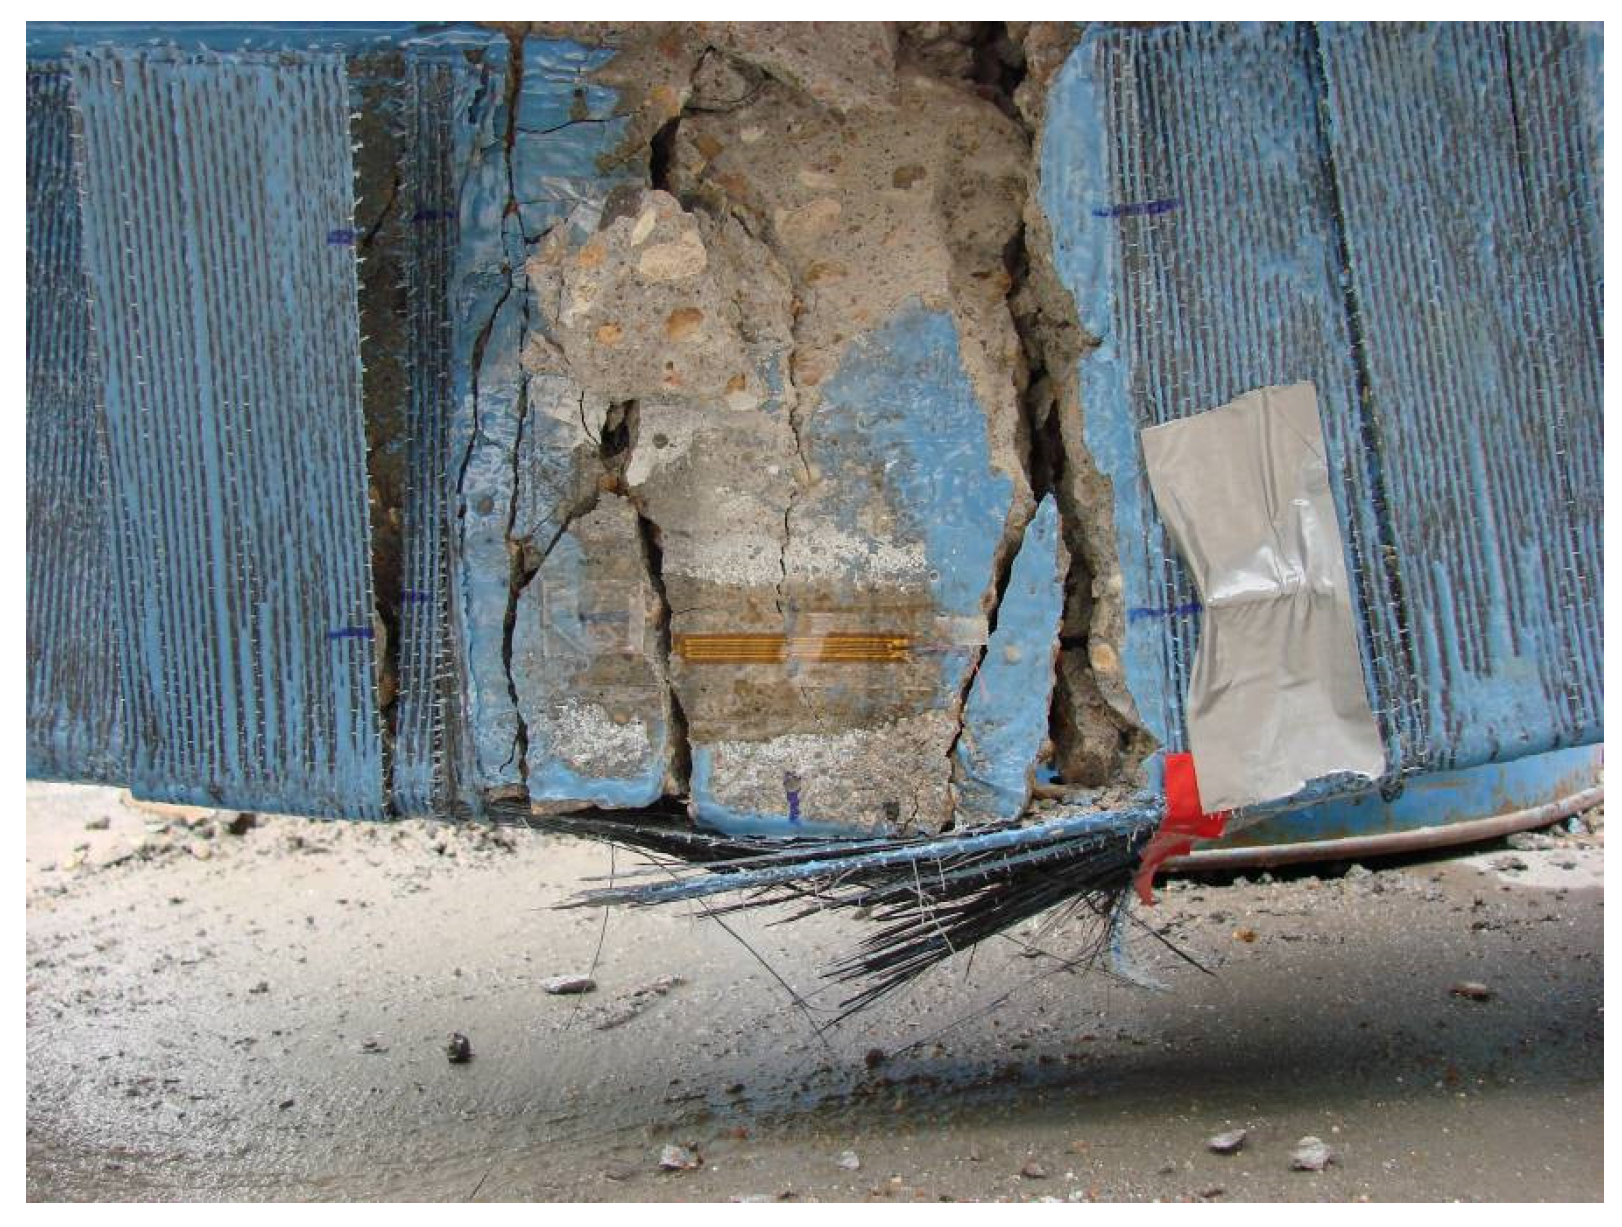
5.2.1. Beam T3: FRP Rupture Failure Mode
5.2.2. Beam R3: Concrete Crushing Failure Mode
6. Conclusions
Acknowledgments
Author Contributions
Conflicts of Interest
References
- Roberts, T. Approximate analysis of shear and normal stress concentrations in the adhesive layer of plated RC beams. Struct. Eng. 1989, 67, 228–233. [Google Scholar]
- Quantrill, R.; Hollaway, L.; Thorne, A. Predictions of the maximum plate end stresses of FRP strengthened beams: Part II. Mag. Concr. Res. 1996, 48, 343–351. [Google Scholar] [CrossRef]
- Täljsten, B. Strengthening of beams by plate bonding. J. Mater. Civ. Eng. 1997, 9, 206–212. [Google Scholar] [CrossRef]
- Malek, A.; Saadatmanesh, H.; Ehsani, M. Prediction of failure load of R/C beams strengthened with FRP plate due to stress concentration at the plate end. ACI Struct. J. 1998, 95, 142–152. [Google Scholar]
- El-Mihilmy, M.; Tedesco, J. Prediction of anchorage failure for reinforced concrete beams strengthened with fiber-reinforced polymer plates. ACI Struct. J. 2001, 98, 301–314. [Google Scholar]
- Rasheed, H.A.; Perviaz, S. Bond slip analysis of FRP strengthened beams. J. Eng. Mech. 2002, 128, 78–86. [Google Scholar] [CrossRef]
- Rasheed, H.A.; Larson, K.H.; Nayyeri Amiri, S. Analytical Solution of Interface Shear Stresses in Externally Bonded FRP-Strengthened Concrete Beams. J. Eng. Mech. 2013, 139, 18–28. [Google Scholar] [CrossRef]
- Ross, C.; Jerome, D.; Tedesco, J.; Hughes, M. Strengthening of reinforced concrete beams with externally bonded composite laminates. ACI Struct. J. 1999, 96, 212–220. [Google Scholar]
- Fanning, P.; Kelly, O. Ultimate response of RC beams strengthened with CFRP plates. J. Compos. Construct. 2001, 5, 122–127. [Google Scholar] [CrossRef]
- Teng, J.G.; Smith, S.T.; Yao, J.; Chen, J.F. Intermediate crack-induced debonding in RC beams and slabs. Construct. Build. Mater. 2003, 17, 447–462. [Google Scholar] [CrossRef]
- Chahrour, A.; Soudki, K. Flexural response of reinforced concrete beams strengthened with end-anchored partially bonded carbon fiber-reinforced polymer strips. J. Compos. Construct. 2005, 9, 170–177. [Google Scholar] [CrossRef]
- Ceroni, F.; Pecce, M.; Matthys, S.; Taerwe, L. Debonding strength and anchorage devices for reinforced concrete elements strengthened with FRP sheets. Compos. B Eng. 2008, 39, 429–441. [Google Scholar] [CrossRef]
- Rasheed, H.A.; Nassajy, M.; Al-Subaie, S.; Abrishamchian, S.M.; Al-Tamimi, A. Suppressing Delamination Failure Mode in Concrete Beams Strengthened with Short CFRP Laminates. Mech. Adv. Mater. Struct. 2011, 18, 194–200. [Google Scholar] [CrossRef]
- Al-Tamimi, A.K.; Hawileh, R.; Abdalla, J.; Rasheed, H.A. Effects of Ratio of CFRP Plate Length to Shear Span and End Anchorage on Flexural Behavior of SCC R/C Beams. ASCE J. Compos. Construct. 2011, 15, 908–919. [Google Scholar] [CrossRef]
- Grelle, S.V.; Sneed, L.H. Review of Anchorage Systems for Externally-Bonded FRP Laminates. Int. J. Concr. Struct. Mater. 2013, 7, 17–33. [Google Scholar] [CrossRef]
- Kalfat, R.; Al-Mahaidi, R.; Smith, S.T. Anchorage devices used to improve the performance of reinforced concrete beams retrofitted with FRP composites: State-of-the-art review. ASCE J. Compos. Construct. 2013, 17, 14–33. [Google Scholar] [CrossRef]
- Guide for the Design and Construction of Externally Bonded FRP Systems for Strengthening Concrete Structures; ACI Committee 440.2R-08; American Concrete Institute: Farmington Hills, MI, USA, 2008.
- Rasheed, H.A. Strengthening Design of Reinforced Concrete with FRP; CRC Press: Boca Raton, FL, USA, 2014. [Google Scholar]
- Building Code Requirements for Structural Concrete and Commentary; ACI Committee 318; American Concrete Institute: Farmington Hills, MI, USA, 2014.
© 2015 by the authors; licensee MDPI, Basel, Switzerland. This article is an open access article distributed under the terms and conditions of the Creative Commons Attribution license (http://creativecommons.org/licenses/by/4.0/).
Share and Cite
Rasheed, H.A.; Decker, B.R.; Esmaeily, A.; Peterman, R.J.; Melhem, H.G. The Influence of CFRP Anchorage on Achieving Sectional Flexural Capacity of Strengthened Concrete Beams. Fibers 2015, 3, 539-559. https://0-doi-org.brum.beds.ac.uk/10.3390/fib3040539
Rasheed HA, Decker BR, Esmaeily A, Peterman RJ, Melhem HG. The Influence of CFRP Anchorage on Achieving Sectional Flexural Capacity of Strengthened Concrete Beams. Fibers. 2015; 3(4):539-559. https://0-doi-org.brum.beds.ac.uk/10.3390/fib3040539
Chicago/Turabian StyleRasheed, Hayder A., Brandon R. Decker, Asad Esmaeily, Robert J. Peterman, and Hani G. Melhem. 2015. "The Influence of CFRP Anchorage on Achieving Sectional Flexural Capacity of Strengthened Concrete Beams" Fibers 3, no. 4: 539-559. https://0-doi-org.brum.beds.ac.uk/10.3390/fib3040539