Moisture Absorption and Opacity of Starch-Based Biocomposites Reinforced with Cellulose Fiber from Bengkoang


1
Department of Mechanical Engineering, Andalas University, Padang 25163, Sumatera Barat, Indonesia
2
Department of Agricultural Technology, Andalas University, Padang 25163, Sumatera Barat, Indonesia
3
Department of Chemistry, Andalas University, Padang 25163, Sumatera Barat, Indonesia
*
Author to whom correspondence should be addressed.
Fibers 2018, 6(3), 62; https://0-doi-org.brum.beds.ac.uk/10.3390/fib6030062
Submission received: 17 July 2018
/
Revised: 18 August 2018
/
Accepted: 24 August 2018
/
Published: 29 August 2018
(This article belongs to the Special Issue Natural Fibre Biocomposites)
Abstract
:Cellulose fiber was isolated from bengkoang (Pachyrhizus erosus) tuber peel. A suspension consisting of distilled water, starch, and glycerol was mixed with various cellulose loadings (0, 2, 6, and 10 g) then gelatinized using a hot plate with a magnetic stirrer. The biocomposite gel was sonicated using an ultrasonication probe (47.78 W/cm2 for 4 min). Scanning electron microscopy (SEM) micrographs for the fracture surface of resulting biocomposite films displayed a rougher surface than starch film, indicating fiber dispersion in the matrix. The opacity and moisture resistance of biocomposite films increased with the addition of cellulose. The opacity was at a maximum value (243.05 AUnm) with 10 g fiber, which was 11.27% higher than the starch film without cellulose. Moisture absorption of this biocomposite was 16.79% lower than the starch film. Fourier transform infrared (FTIR) confirmed this more hydrophobic nature with lower transmittance at –OH stretching in the composite than the starch film. The addition of cellulose fiber into the matrix also increased the crystallinity index.
1. Introduction
In recent years, the demand for the development of starch-based films has been high because of their biodegradability. Films produced from starch have applications in food packaging and agricultural and medical technologies. Starch is abundant and cheap, and provides good film formability [1]. However starch-based films have high water sensitivity, are brittle, and exhibit poor mechanical properties [2,3].
Natural fiber can be used to improve the properties of starch film. Research has shown that fibers from natural sources can potentially provide promising reinforcing materials. Natural fibers are easy to obtain, low cost, non-toxic, and have a high specific strength due to their low density [4,5]. In addition, natural fibers are environmentally friendly and require little energy in the composite fabrication process [6]. Many researchers have reported the improvement of starch-based biocomposites reinforced with natural fiber. They increase their oxygen barrier properties [7,8], water and moisture resistance [2,9,10], and mechanical properties [11,12,13].
Starch and biocomposite film properties also can be improved with ultrasonication. During the gelatinization process, ultrasonication helps to dissolve ghost particles and clumps of insoluble starch that weaken the resulting film’s mechanical properties [14,15]. Ultrasonication aids with dispersion and break-up of agglomerations of fibers in the matrix [16]. Also, ultrasonication is used in the production of nano-sized cellulose molecules because it produces high shear energy that breaks up long cellulose into shorter segments [17,18,19]. A reduction of cellulose size increases the area of contact surface between reinforcement and matrix, which improves the mechanical and barrier properties of the composite [20].
In last decade, the biocomposite potential of fibers and starches from various sources have been explored. Cassava, corn, sago, and potato starch have been used in the matrix. Fibers from potato tuber cells [10], banana peels [21,22], mandarin [16], grapefruit [23], and pomelo [24] have been used as reinforcement. Many of these starch and fiber sources can be obtained from agricultural products and waste. Another agricultural crop that produces both starch and cellulose fiber is bengkoang (Pachyrhizus erosus). This plant grows abundantly in tropical and subtropical regions, including in Indonesia, Mexico, Philippines, China, Malaysia, and Singapore. Information about starch extracted from the bengkoang tuber is still limited, and there has been no work reported on the use of the cellulose from bengkoang tuber peel as a reinforcement material. In this present study, we investigated the effect of various cellulose fiber loadings from bengkoang tuber peel on the properties of a starch-based biocomposite. Particle size distribution, opacity, SEM, X-ray diffraction (XRD), FTIR, and moisture absorption of the starch and biocomposite film were characterized.
2. Materials and Methods
2.1. Materials
Native bengkoang was obtained from a local farm at Padang, West Sumatra, Indonesia, and the starch (13.27% amylose content) was extracted. Glycerol purchased from Brataco (Jakarta, Indonesia) was used as a plasticizer. Distilled water was used as the plasticizing agent.
2.2. Isolation of Cellulose Fiber from Bengkoang Tuber Peel
Cellulose from bengkoang tuber peel was isolated using the method described by Julie Chandra et al. [17] with following modifications. Fibers were cut into 6 mm lengths. Alkaline treatment was used to remove hemicellulose and lignin content with 5% sodium hydroxide (NaOH) solution, and the suspension was heated at 50 °C for 4 h. After that, the alkali was washed from the fibers, and they were treated with 3.5 M hydrochloric acid (HCl) to break up the amorphous region, and the microfibrils were aggregate at 50 °C for 34 h. Treated fibers were washed with distilled water several times until pH = 7, then ground to a pulp manually with a mortar and pestle. This pulp was treated again with 5% NaOH solution at 50 °C for 4 h to remove the remaining non-cellulose content, and then subjected to acid hydrolysis with 5 M hydrochloric acid (HCl) at 50 °C for 17 h. At the end of process, a 4:1 mixture of sodium chlorite (NaClO2) and glacial acetic acid was used to bleach the fibers for 2 h at 60 °C. All chemical treatments were conducted using a hot plate magnetic stirrer with continuous stirring at 500 rpm. Distilled water was used to neutralize the fibers from acid. About 10 mL of bleached fiber was mixed with 140 mL distilled water and ultrasonicated with a 20 KHz ultrasonic cell crusher (Model SJIA-1200W, Ningbo Yinzhou Sjia Lab Equipment Co., Ltd., Ningbo, China) at 47.78 W/cm2 for 120 min, the temperature being maintained under 40 °C.
2.3. Biocomposite Film Preparation
10 wt% starch, 4 g glycerol, and 100 mL distilled water were mixed in a 250 mL beaker (diameter 70 mm, IWAKI, Sumedang, Indonesia). A magnetic stirrer (Scilogex MS-H280-Pro, Scilogex LLC, Rocky Hill, CT, USA) was used at 500 rpm, while the suspension was heated to 80 °C. After the suspension was gelatinized, it was ultrasonicated for 4 min using a 20 KHz ultrasonic cell crusher (Model SJIA-1200W, Ningbo Yinzhou Sjia Lab Equipment Co., Ltd., Ningbo, China) at 47.78 W/cm2. The suspension was then cast to a petri dish (15 cm diameter) and dried in a ventilated oven for 20 h at 50 °C. The resulting film was labelled as the starch film. Cellulose was added to the suspension at the beginning of the similar processes, to fabricate composite films with different amounts of fiber loading (2, 6, and 10 g, equivalent to a dried cellulose weight of 0.16, 0.48, and 0.80 wt% respectively) and labelled as biocomposites (BC), followed by a numerical code indication of the amount of fiber solution added. All suspensions of biocomposite were poured into petri dishes and dried in a ventilated oven for 20 h at 50 °C. Table 1 shows the composition of starch and biocomposite films.
2.4. Characterization
2.4.1. Particle Size Distribution
Particle size measurement using dynamic light scattering (Zetasizer ZS, Malvern, UK) was used for the determination of particle size distribution of bengkoang tuber peel fiber. A 173° detector angle with a HeNe 4 mW 633 nm laser was used. Particle size determination was repeated three times.
2.4.2. Film Opacity
Opacity of films was determined with a spectrophotometer (Shimadzu UV 1800, Shimadzu Corporation, Kyoto, Japan). Films were cut into 1 cm × 2.5 cm rectangles and fixed onto the inner side of a spectrophotometer cell. The absorbance spectrum between 400 and 800 nm was recorded. The opacity of films was determined as the area under spectrum according to ASTM D 1003-00 (Standard test method for haze and luminous transmittance of transparent plastics). The opacity determinations were repeated three times.
2.4.3. X-ray Diffraction (XRD)
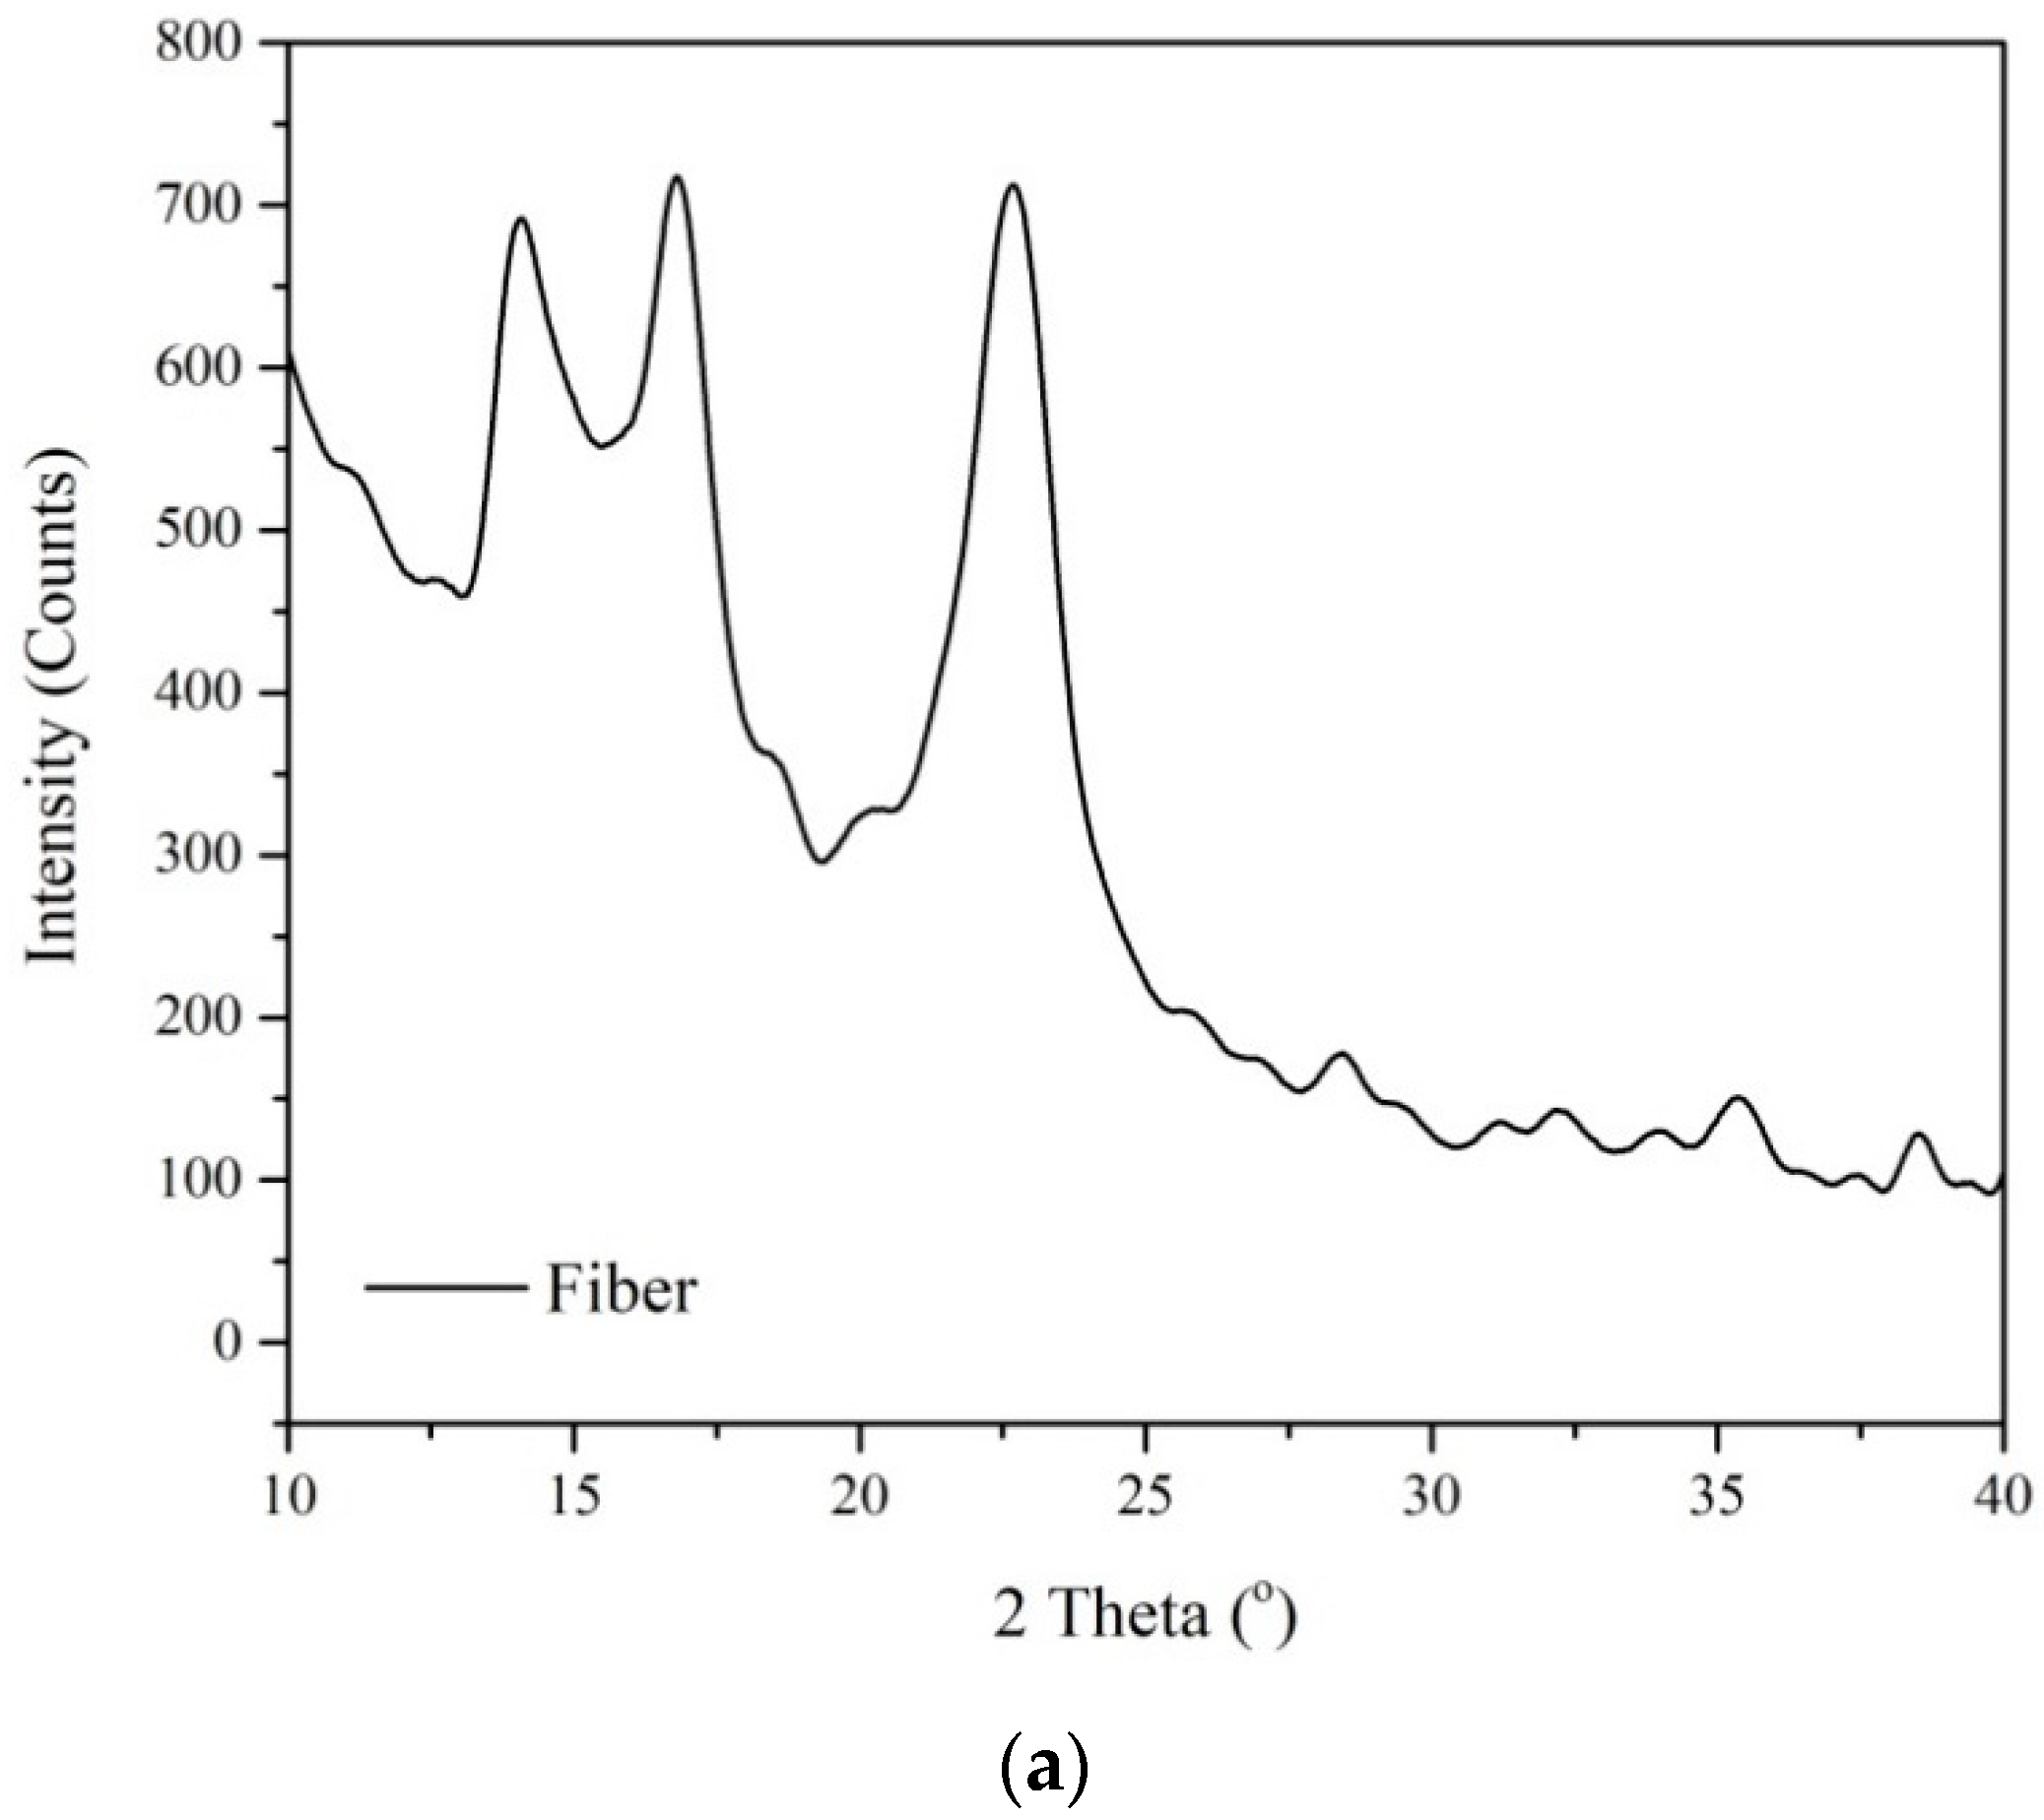
A PANalyticalXpert Pro diffractometer with Cu Kα radiation at 40kV and 30 mA was used to record XRD diffractograms of films. The diffraction between 2θ = 10° to 40° was scanned. The crystallinity index (CI) of films was determined by calculating the ratio of crystalline area to the total area on XRD diffractograms [8]. CI for fiber was calculated with following equation [25]:
where Icry was the maximum intensity of crystalline peak at 2θ = 22–24°, and Iam was the minimum intensity of amorphous diffraction at 2θ = 18–20°.
2.4.4. Fourier Transform Infrared Spectroscopy
FTIR spectra of films were recorded with a FTIR spectrometer (Frontier, PerkinElmer, Waltham, MA, USA) within the wavenumber range of 4000–600 cm−1 at 4 cm−1 resolution.
2.4.5. Moisture Absorption
Moisture absorption of all films was determined using the method described by Abral et al. [9] with the following modifications. Films were cut to 2 cm × 1 cm size and dried in a ventilated oven at 50 °C for 24 h. Dried pieces were weighed to determine the initial mass, then they were placed in a covered box containing saturated NaCl solution (Relative Humidity (RH) 75%) at 25 °C ± 2 °C. Every 30 min, all pieces were weighed.
2.4.6. Scanning Electron Microscopy
The morphology of starch and biocomposite film fracture surfaces were analyzed using a scanning electron microscope (HITACHI SU-3500, Hitachi High-Technologies Corporation, Tokyo, Japan) at an accelerating voltage of 5 kV in a 5 × 10⁻⁴ Pa vacuum. All samples were coated with gold (Au).
3. Results and Discussion
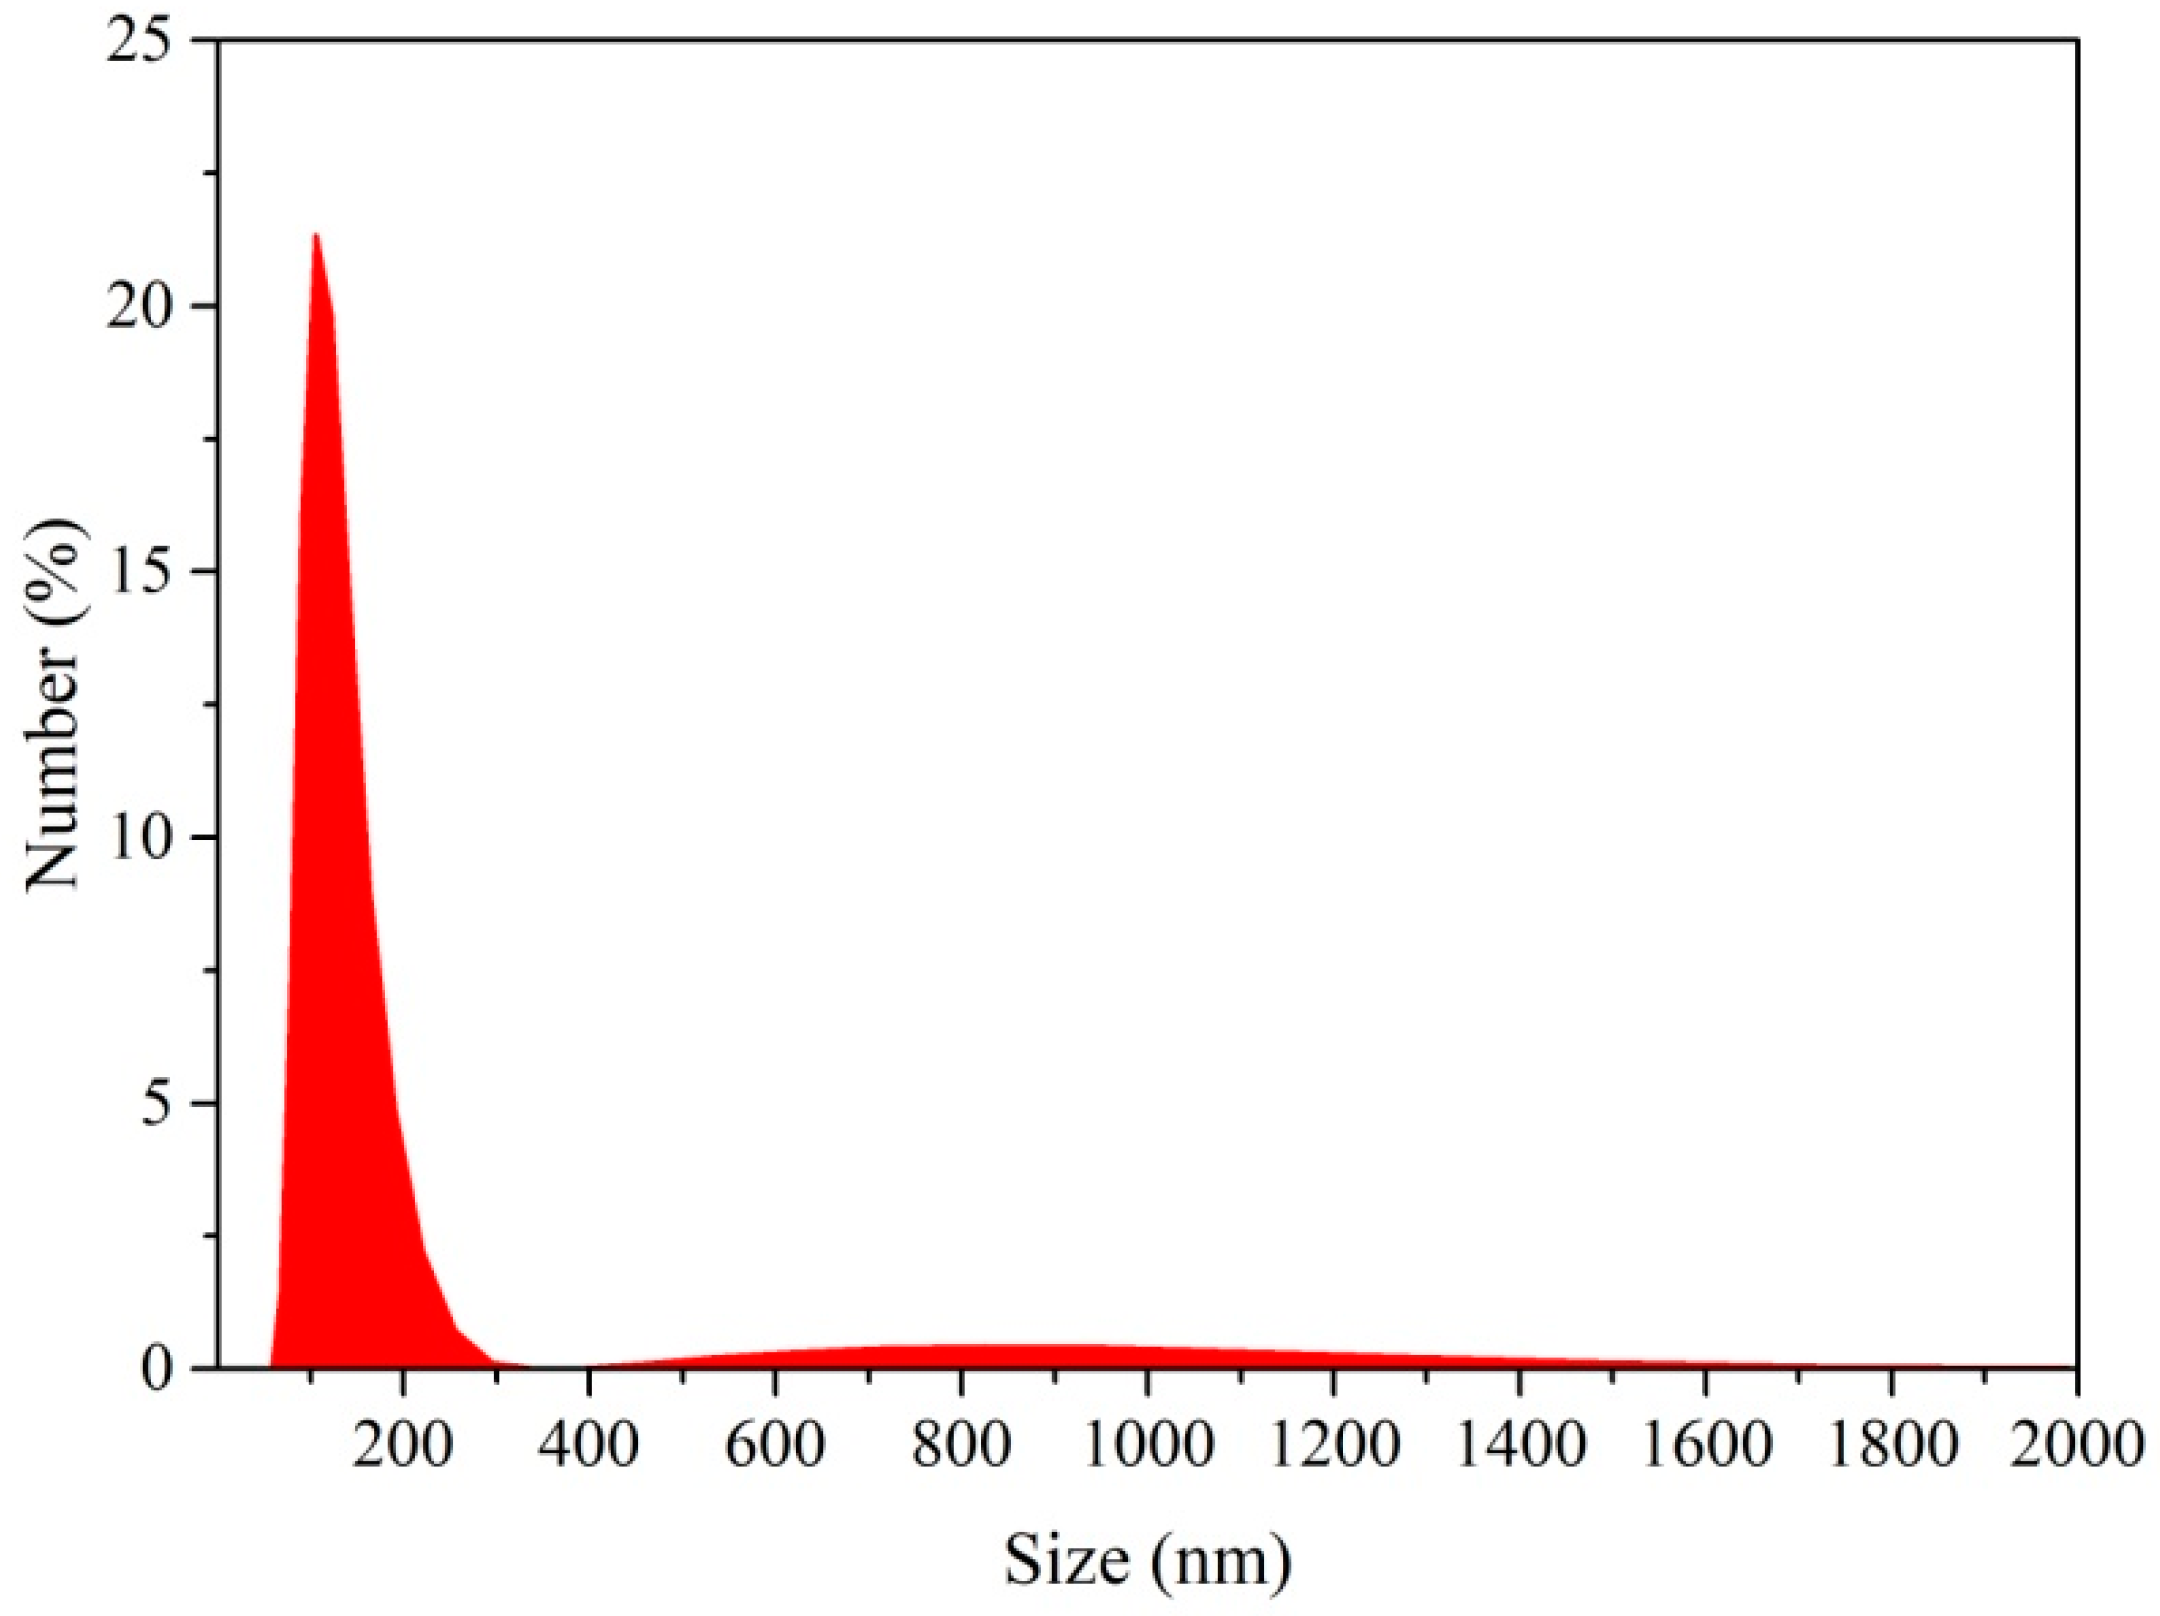
3.1. Particle Size Distribution
Figure 1 shows the size distribution of the cellulose particles produced from bengkoang peel fiber. 24.3% of the cellulose particles were below 100 nm in length which is within the nano-size range, but the other 72.5% were in the 100–250 nm micro-sized range. The reduction of cellulose size started from the removal of the amorphous components from the cellulose after acid hydrolysis [26,27], and then it was reduced further with ultrasonication as the high shear forces and cavitation energy broke up the particles. It also broke apart the aggregates of cellulose, enabling for better dispersion in the aqueous suspension. Similar results have also been reported by Abral et al. [18], who isolated nanocellulose from bacterial cellulose, and Niu et al. [28], who isolated nanocellulose from microcrystalline cellulose.
3.2. Film Opacity
Figure 2 shows the opacity of starch and biocomposite films. The addition of cellulose in the matrix increased the transparency of the biocomposites. For example, the opacity of the starch film was 218.44 AUnm, which was lower than that of BC-10 (243.05 AUnm, 11.27% higher). This is because cellulose is more opaque than starch film. Previous studies also reported on the increasing opacity of biocomposites with increasing fiber content [2,22].
3.3. X-ray Diffraction
Figure 3 shows the XRD patterns of fibers, starch films, and biocomposite films. As shown in Figure 3b, two major peaks were observed at around 2θ = 17° and 22.2°. All films showed similar curves, but the diffraction intensity increased as the amount of cellulose increased from 1211 (Control) to 1351 (BC-10) at around 2θ = 22.2°. This result is because the presence of cellulose in the matrix CI for fiber was 58.48% higher than the starch and biocomposite films. In this case, crystallinity index (CI) for BC-10 was 2.51% higher than that for the control. A similar result was also reported by Abral et al. [13]; they reported the increasing CI of the composites with the addition of fibers.
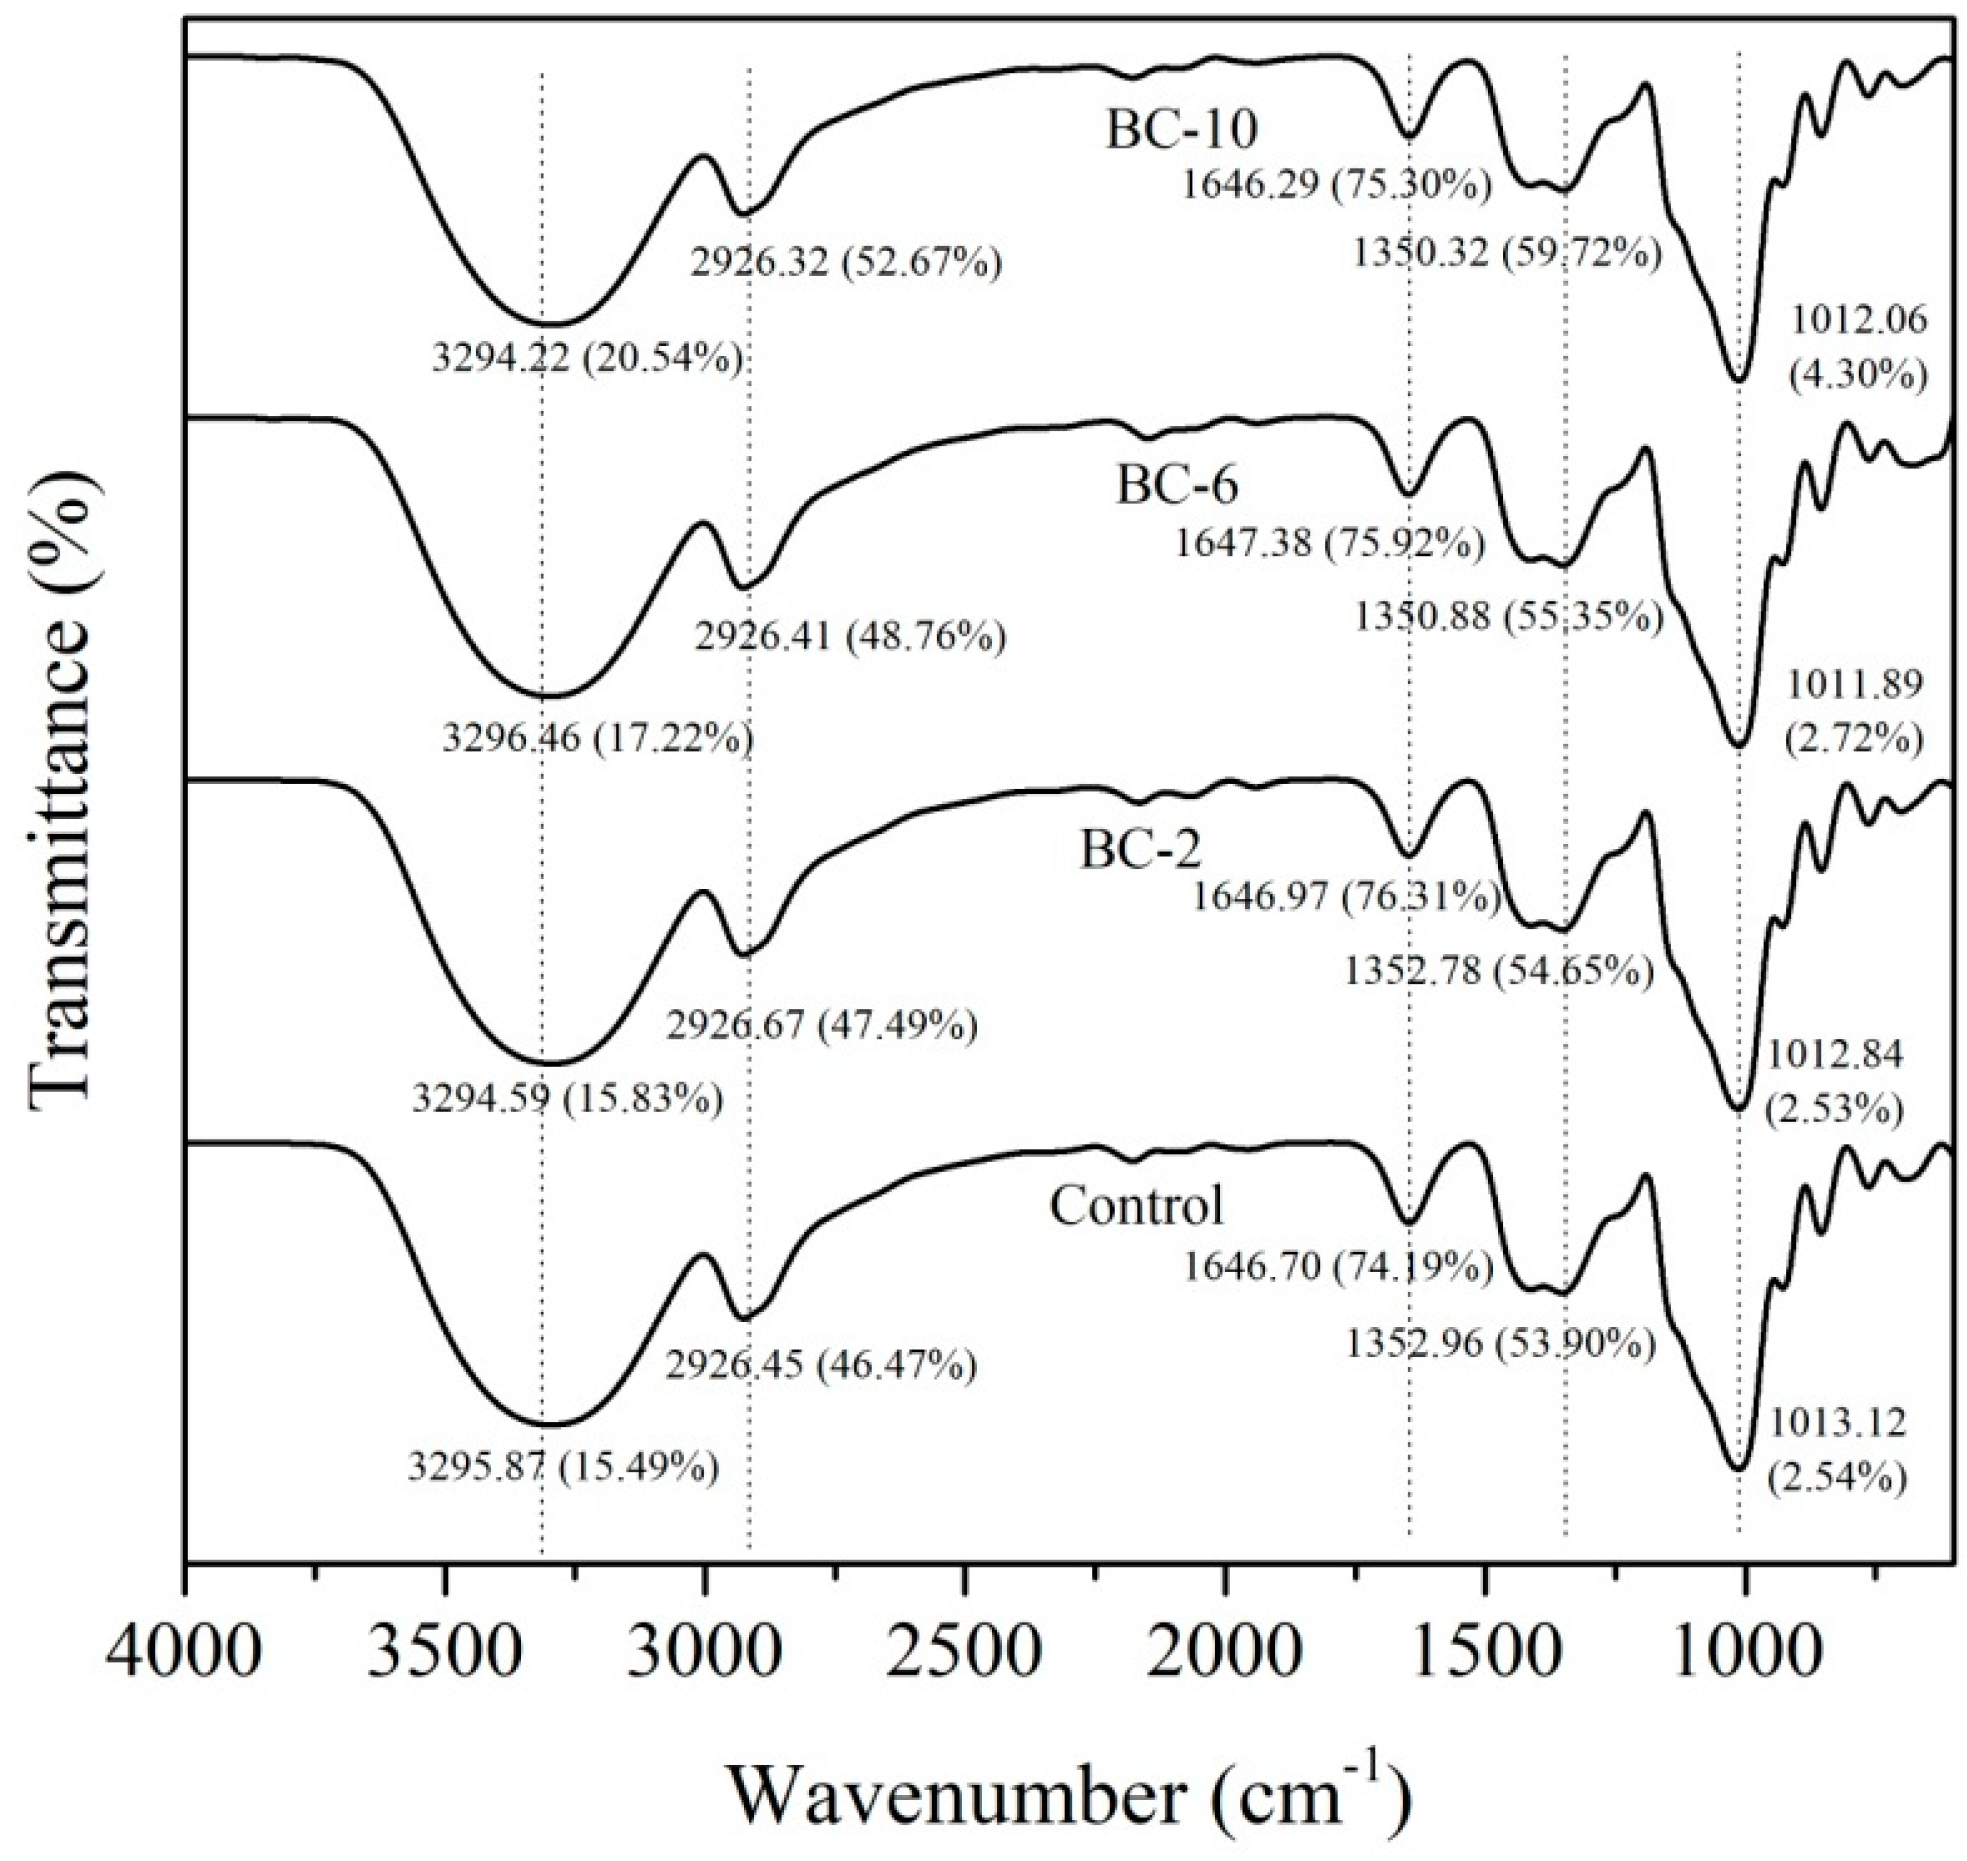
3.4. Fourier Transform Infrared
Figure 4 displays the FTIR spectra of starch and biocomposite films. All FTIR spectra showed similar patterns. Ultrasonication did not result in the appearance of new functional groups, but it shifted the transmittance intensity of the pattern. The band, at around 3296 cm−1 corresponded to the complex vibrational stretching of hydrogen bonded hydroxyl groups (–OH) [29]. Other bands were visible around 2926 cm−1 (–CH stretching), 1647 cm−1 (H–O–H stretching, absorbed water), 1353 cm−1 (–CO stretching in an aryl-arkyl ether) and 1013 (–CO stretching in an anhydroglucose ring). Transmittance intensity of all bands increased with an increase in fiber loading.
FTIR peaks can be also used to determine the change in the crystalline structure of films. This is assessed as the absorbance ratio of the peaks at 995/1022, this being the ratio between the crystalline and the amorphous regions of the biopolymer [14]. As shown in Table 2, the ratio was increased, as the fiber loading increased. For example, the ratio for BC-10 (0.59) was 22.92% higher than BC-2 (0.48). This is consistent with the crystallinity index calculated from the XRD pattern.
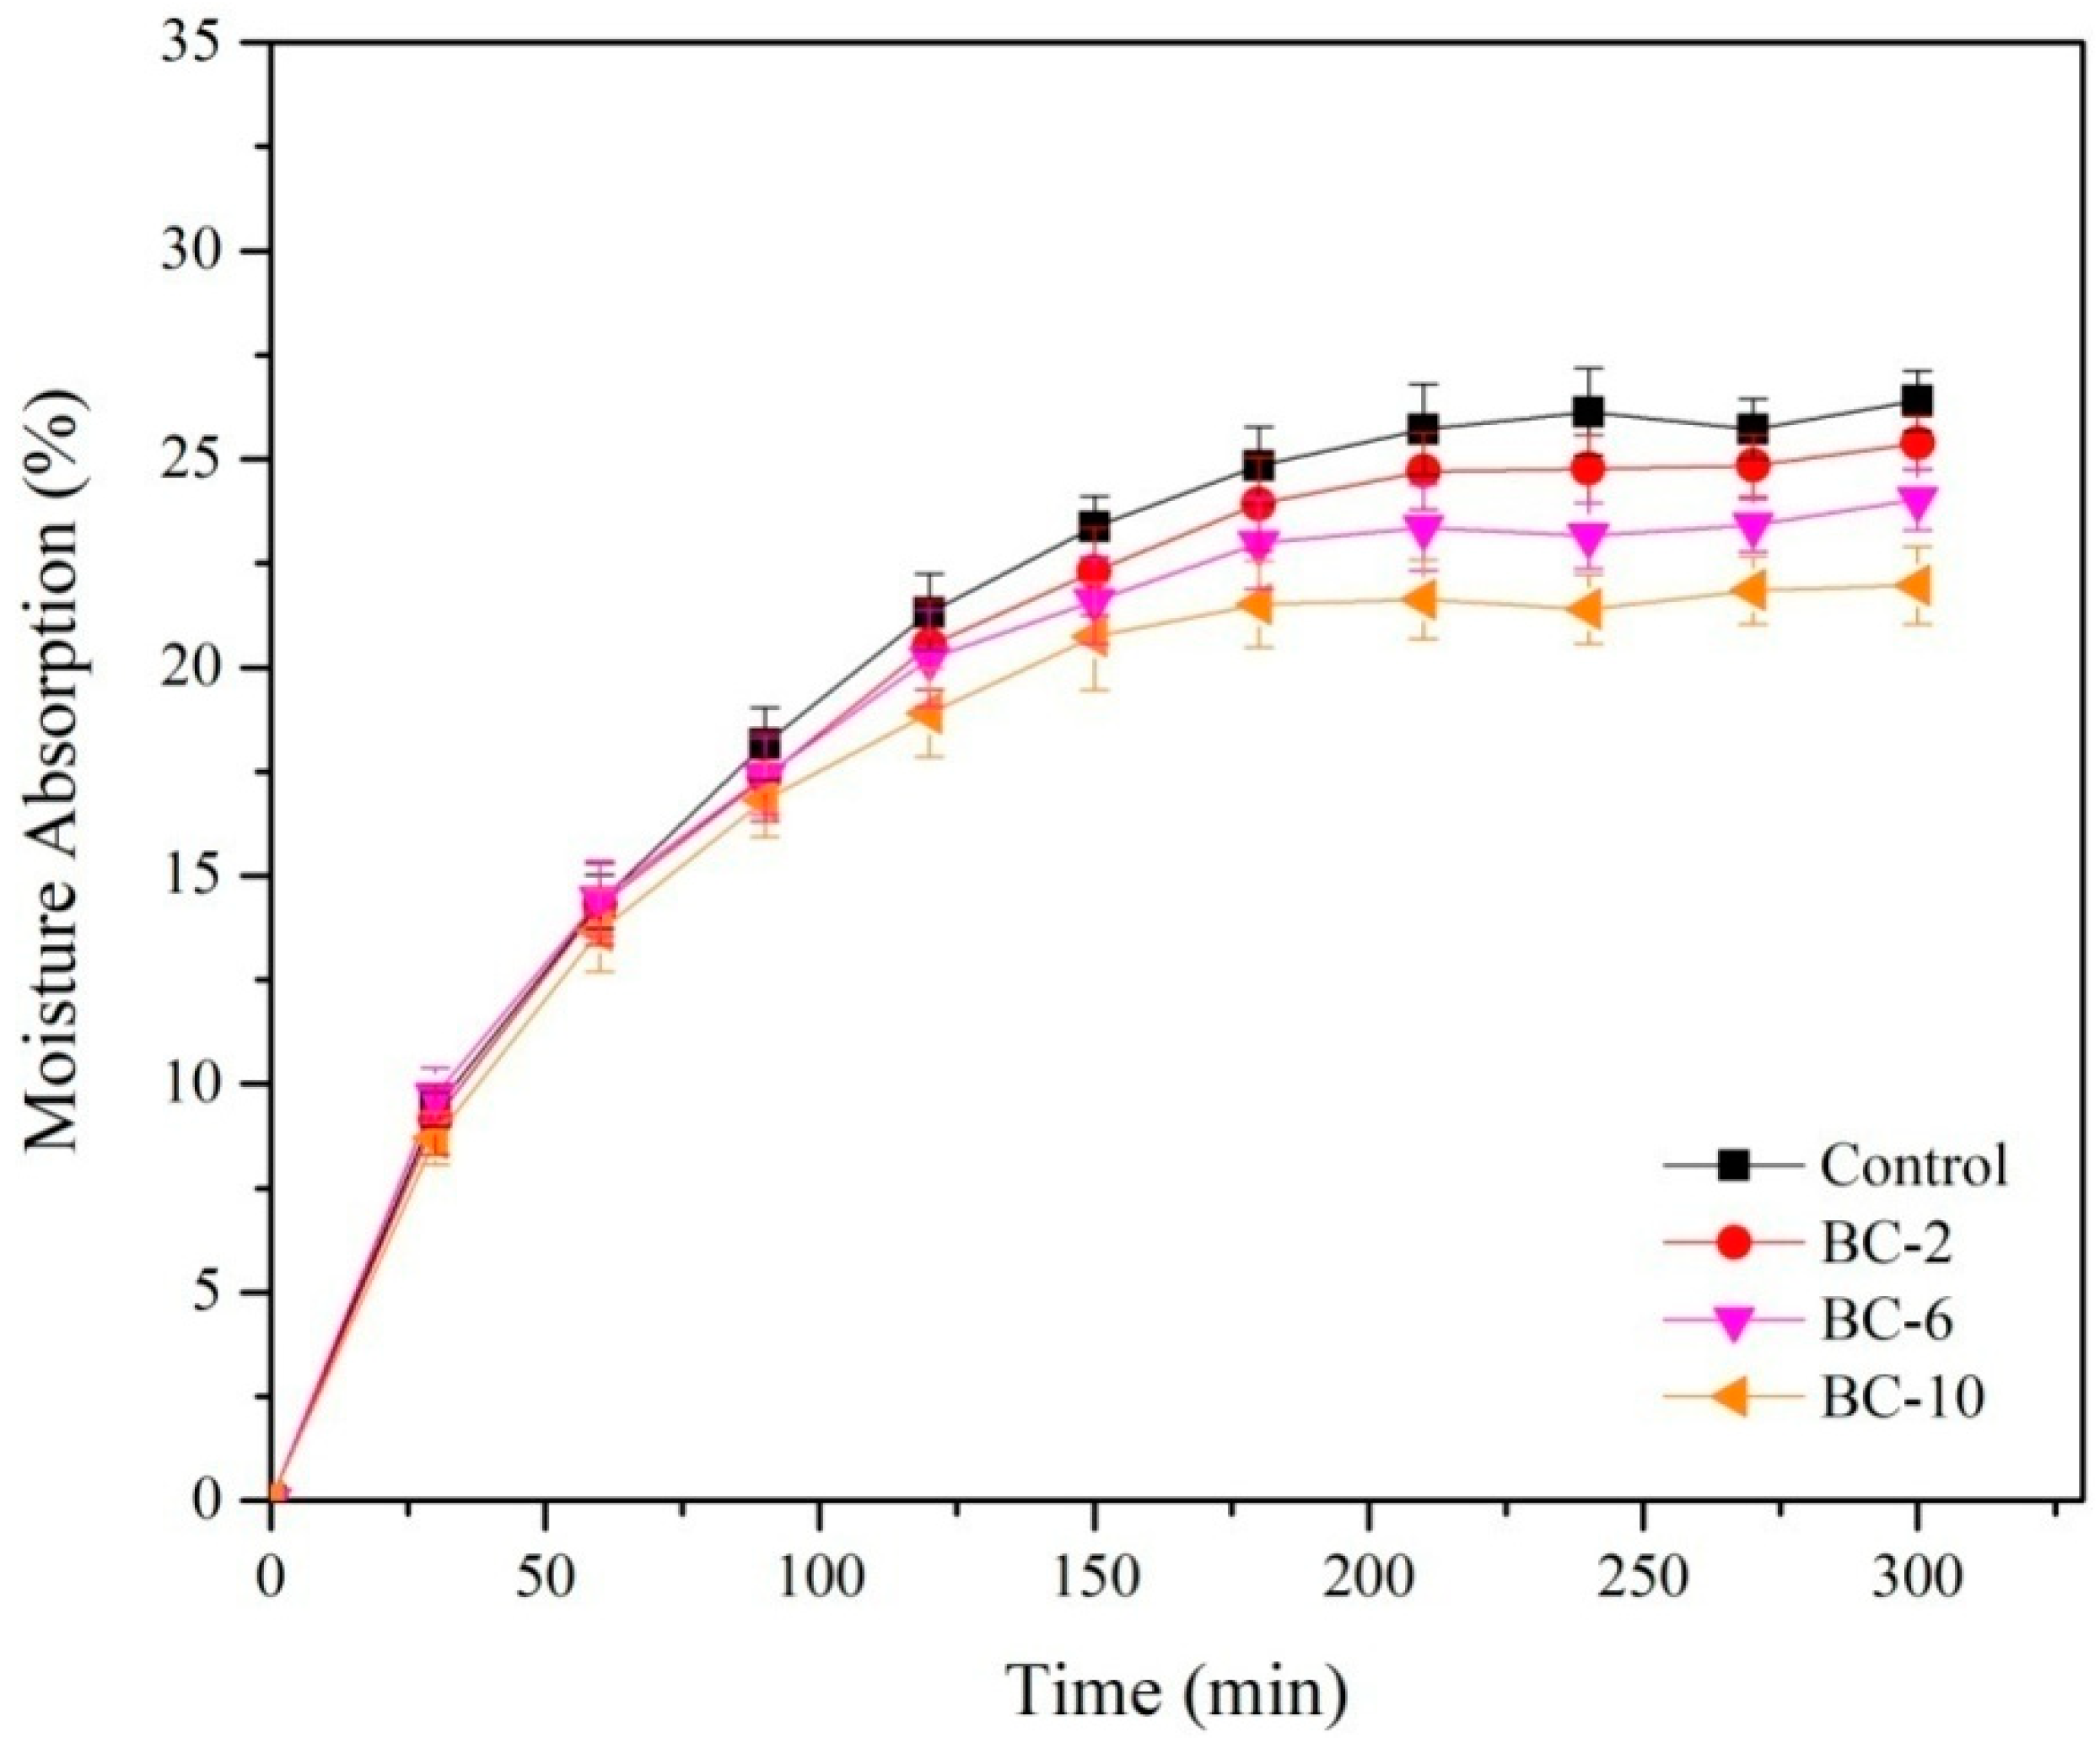
3.5. Moisture Absorption
Figure 5 shows the moisture absorption of starch and biocomposite films. The moisture absorption of the starch film was higher than that of the biocomposites. This is because the starch film was more hydrophilic than the biocomposites as reflected in the lower transmittance of –OH stretching bands than in the biocomposite. Adding 2 g fiber decreased the moisture absorption after 5 h by 3.85%. With further addition of the cellulose fiber, the moisture absorption continued to decrease. For example, the moisture absorption of BC-10 was 13.46% lower than that of BC-2. This was because the number of accessible hydroxyl groups in BC-10 was less than in BC-2. The addition of cellulose fiber reduced the total available –OH groups because of increased intermolecular bonding. This is consistent with the FTIR pattern (Figure 4) which confirmed the more hydrophobic nature of biocomposites with higher cellulose fiber loading in the matrix. For example transmittance (T) of –OH stretching for BC-2 was 2.20% higher than in the control. T value increased with increasing fiber loading, for instance BC-10 had a T value 29.75%, higher than that of BC-2. This result confirmed that BC-10 was more hydrophobic than BC-2. Moisture absorption of biocomposite film decreased as increasing fiber loading. Similar result have also been reported in a previous study which showed increasing moisture resistance of a biocomposite reinforced by higher fiber loading [13]. This is also consistent with the XRD curve (Figure 3). Similar agreement was also reported by Dufresne et al. [10], Montero et al. [20] and Abral et al. [30].
3.6. Scaning Electron Microscopy
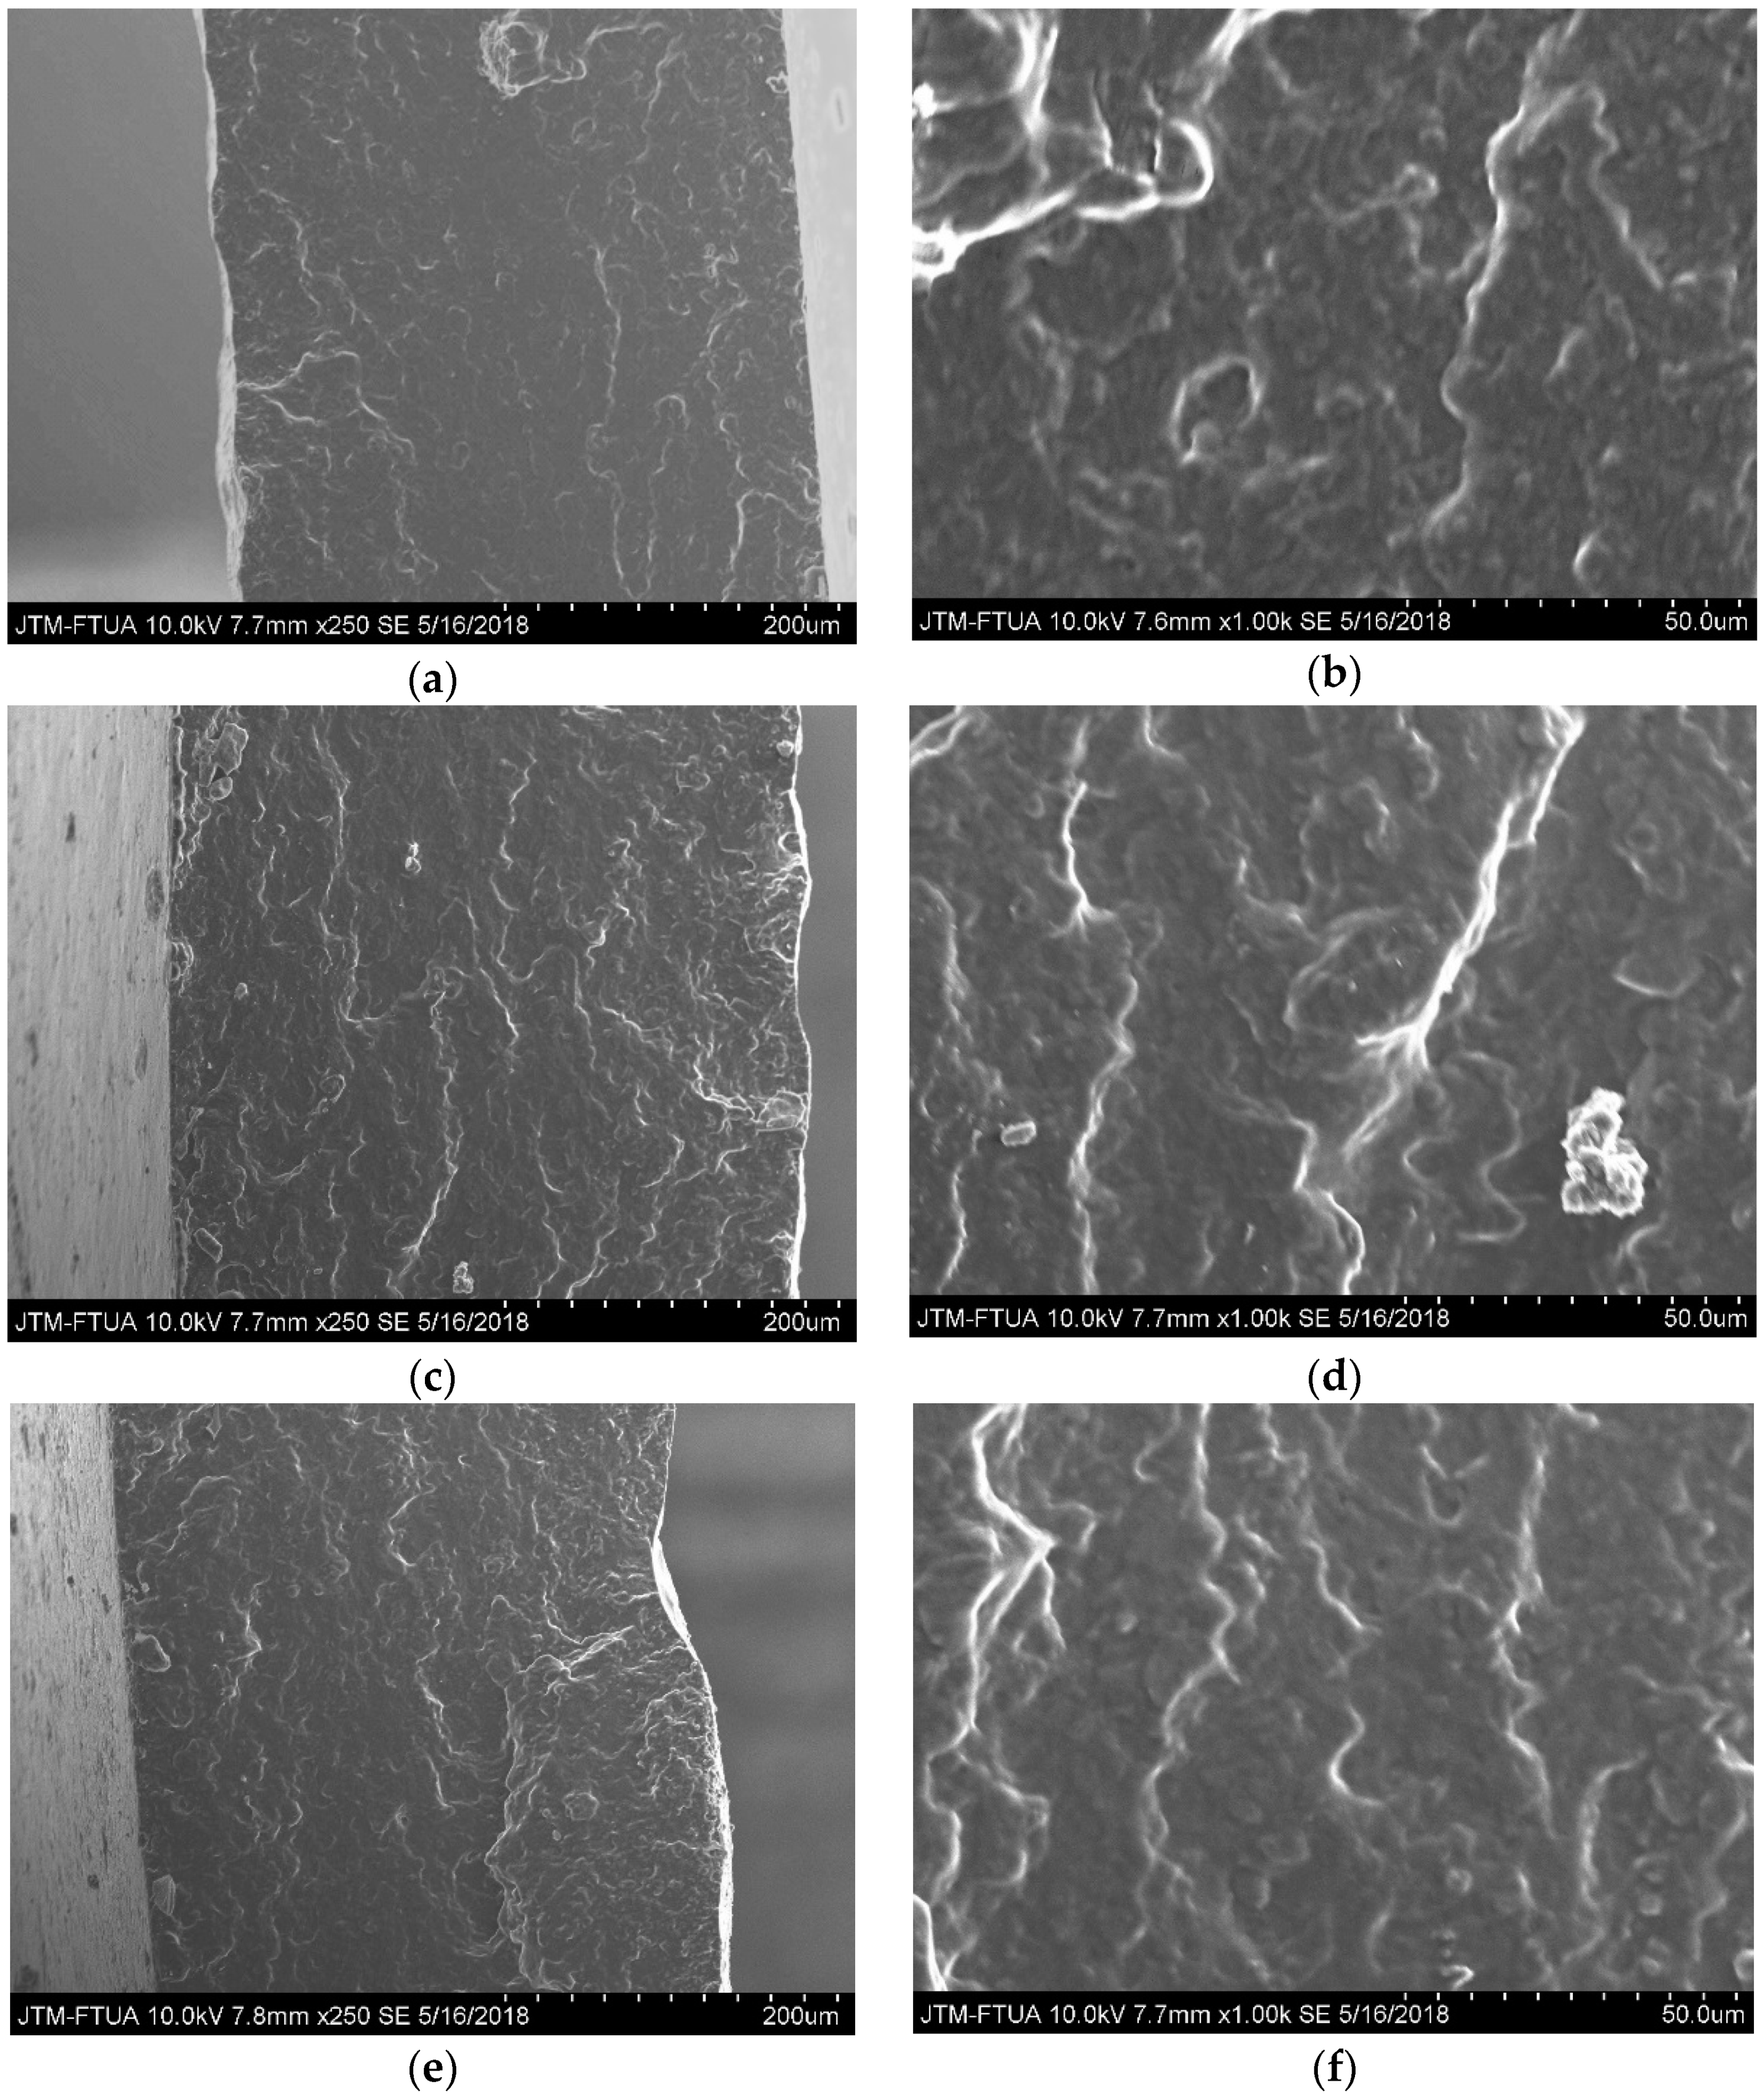
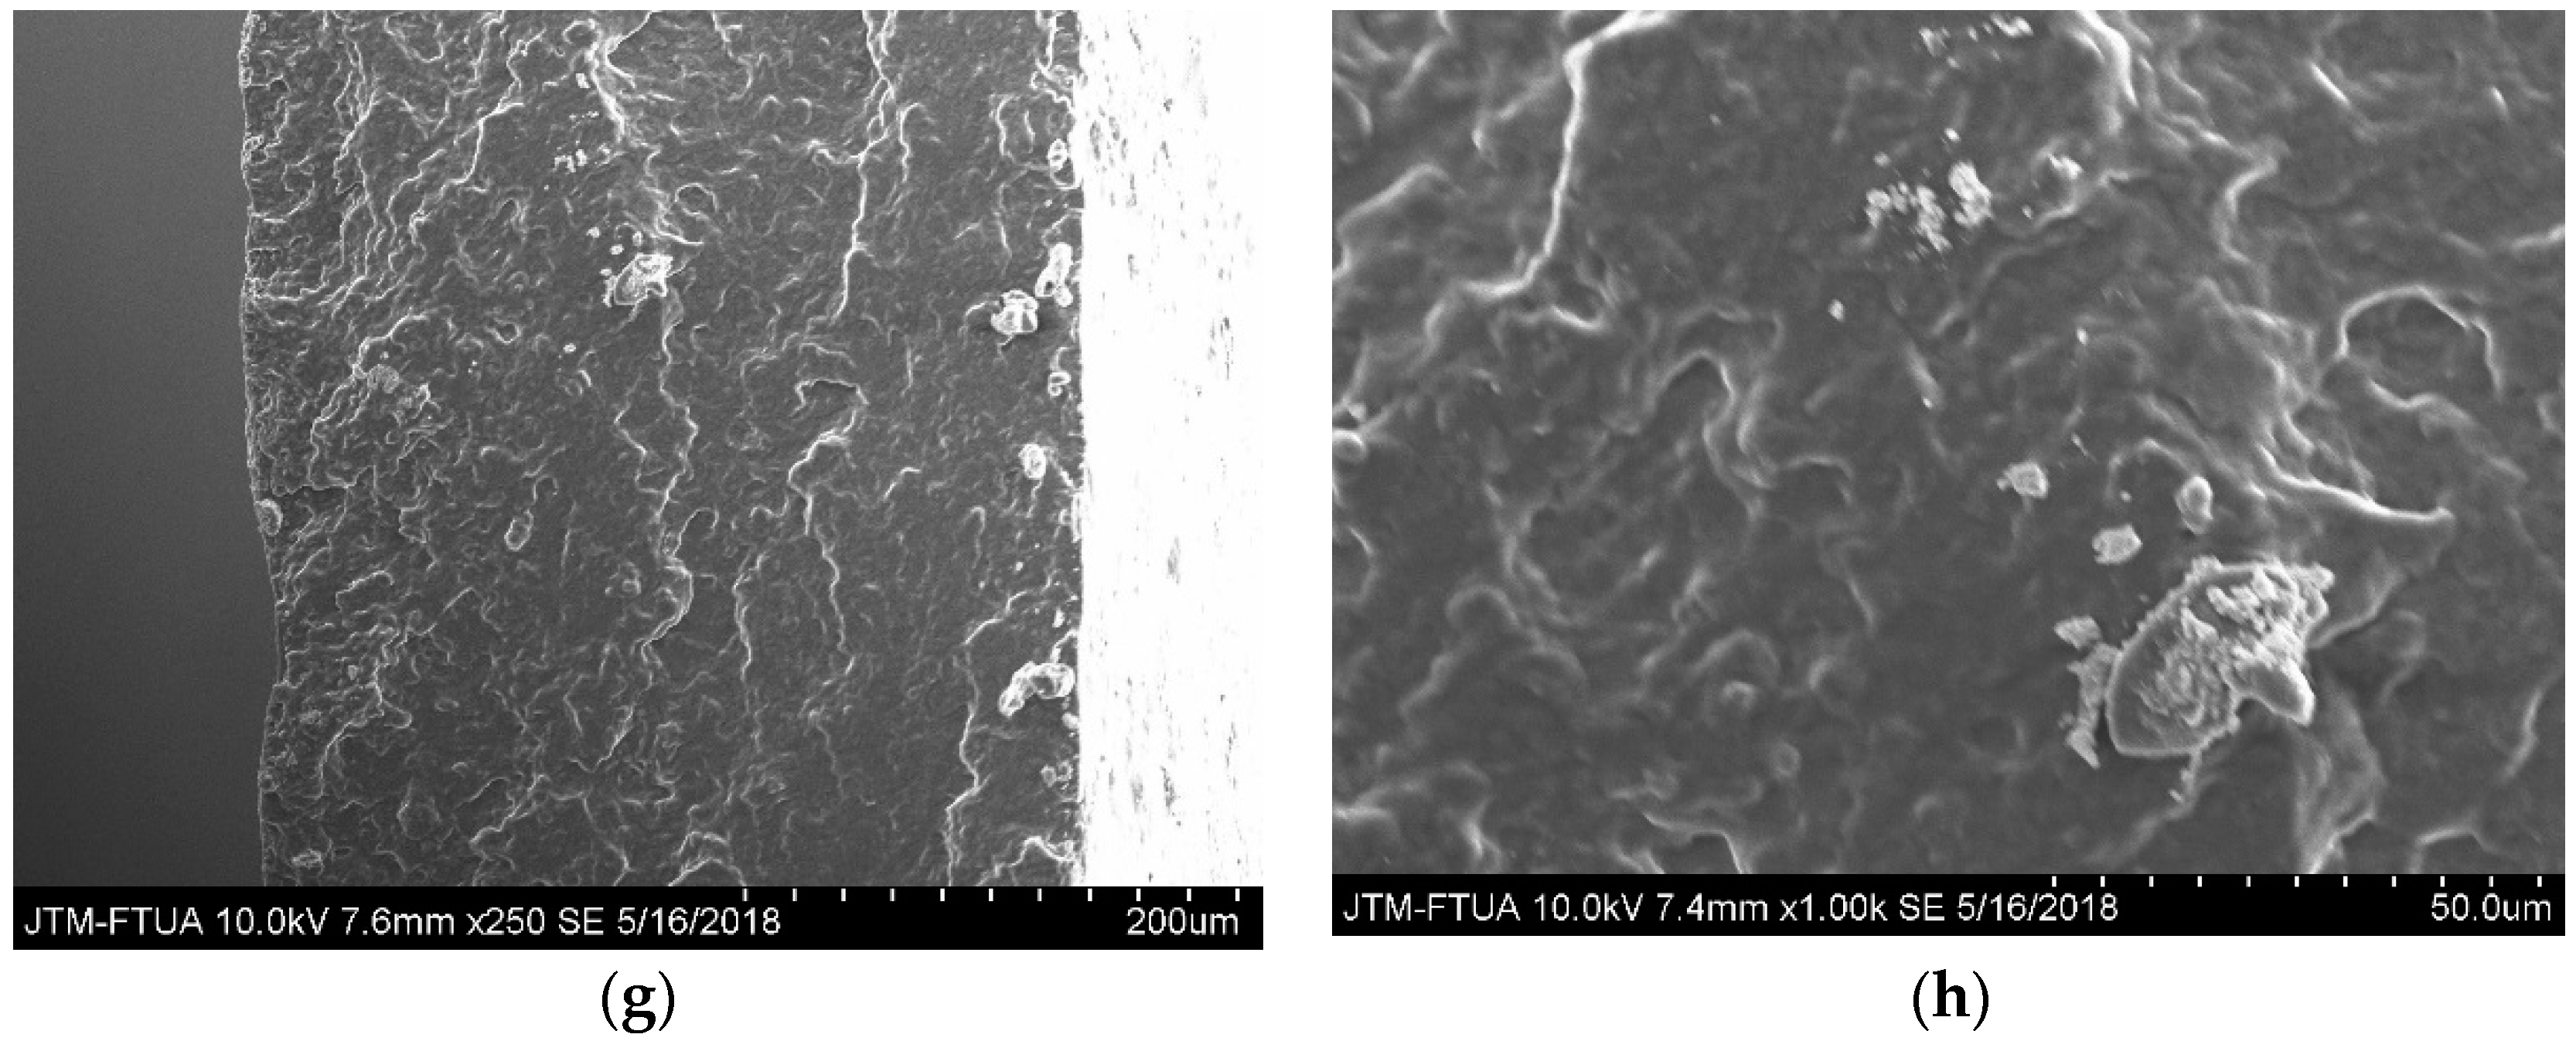
Figure 6a–h show the SEM micrographs of the cross-sections of starch and biocomposite films. As can be seen in Figure 6c,d, the biocomposite film fracture surfaces were slightly rougher compared to the starch films (Figure 6a,b). Increases in cellulose suspension loading resulted in an increased roughness of fracture surfaces (Figure 6e–h). There is no agglomeration of cellulose fibers observed on the surface. This indicates that fibers were well dispersed in the starch matrix, and it may indicate increases in interfacial hydrogen bonding and homogeneity of the biocomposite structure. This result is in a good agreement with the previous study [13]. The higher compactness between the matrix and fiber led to an increase in the crystallinity index as shown in Table 2. The better interfacial hydrogen bonding reduced the number of accessible -OH groups, thus increasing moisture resistance of the biocomposites. This result is supported by the moisture absorption data in Figure 5, which shows a decrease in moisture absorption with increased fiber loading.
4. Conclusions
This study investigated the properties of starch-based biocomposites reinforced with cellulose fiber isolated from bengkoang tuber peel. Overall, cellulose fiber improves the opacity and moisture absorption of the starch-based film and within the range of cellulose fiber concentrations tested (up to 0.80 wt% for each 10 wt% of starch), the higher the cellulose fiber, the higher the opacity and moisture resistance. While moisture resistance is obviously important for the resilience of biofilm packaging, opacity is also an important parameter where the biofilms are used to contain items that need to be protected from light. The addition of cellulose fibers also increased the crystallinity index of the films. A high crystallinity index, which is related to the close and regular packing of polymers and microfibers, is likely to be an indication of superior mechanical properties. This indicates that bengkoang tuber peel fibers that were purified and reduced to micro-size in this manner have potential as a reinforcement material in biocomposite applications.
Author Contributions
Conceptualization, F.H. and H.A.; Methodology, F.H..; Validation, H.A.; Formal Analysis, F.H.; Investigation, F.H.; Data Curation, F.H., H.A. and J.A.; Writing—Original Draft Preparation, F.H.; Writing—Review & Editing, H.A.; Supervision, H.A., A.K. and S.A.
Funding
This research received no external funding.
Acknowledgments
This research was funded by the Directorate General of Higher Education, Ministry of Research, Technology, and Higher Education, Indonesia for supporting research funding, with the project name “Skim PMDSU”, number 13/H.16/PMDSU/LPPM/2016.
Conflicts of Interest
The authors declare no conflict of interest.
References
- Wilhelm, H.M.; Sierakowski, M.R.; Souza, G.P.; Wypych, F. Starch films reinforced with mineral clay. Carbohydr. Polym. 2003, 52, 101–110. [Google Scholar] [CrossRef]
- Bodirlau, R.; Teaca, C.A.; Spiridon, I. Influence of natural fillers on the properties of starch-based biocomposite films. Compos. Part B Eng. 2013, 44, 575–583. [Google Scholar] [CrossRef]
- Shah, U.; Naqash, F.; Gani, A.; Masoodi, F.A. Art and Science behind Modified Starch Edible Films and Coatings: A Review. Compr. Rev. Food Sci. Food Saf. 2016, 15, 568–580. [Google Scholar] [CrossRef] [Green Version]
- Bledzki, A.K.; Gassan, J. Composites reinforced with cellulose based fibres. Prog. Polym. Sci. 1999, 24, 221–274. [Google Scholar] [CrossRef]
- Saheb, N.; Jog, J. Natural Fiber Polymer Composites: A Review. Adv. Polym. Technol. 2015, 2329, 351–363. [Google Scholar] [CrossRef]
- Rajesh, M.; Pitchaimani, J. Mechanical Properties of Natural Fiber Braided Yarn Woven Composite: Comparison with Conventional Yarn Woven Composite. J. Bionic Eng. 2017, 14, 141–150. [Google Scholar] [CrossRef]
- Wang, J.; Gardner, D.J.; Stark, N.M.; Bousfield, D.W.; Tajvidi, M.; Cai, Z. Moisture and oxygen barrier properties of cellulose nanomaterial-based films Moisture and oxygen barrier properties of cellulose nanomaterial-based films. ACS Sustain. Chem. Eng. 2017, 6, 49–70. [Google Scholar] [CrossRef]
- González, K.; Retegi, A.; González, A.; Eceiza, A.; Gabilondo, N. Starch and cellulose nanocrystals together into thermoplastic starch bionanocomposites. Carbohydr. Polym. 2015, 117, 83–90. [Google Scholar] [CrossRef] [PubMed]
- Abral, H.; Putra, G.J.; Asrofi, M.; Park, J.W.; Kim, H.J. Effect of vibration duration of high ultrasound applied to bio-composite while gelatinized on its properties. Ultrason. Sonochem. 2018, 40, 697–702. [Google Scholar] [CrossRef] [PubMed] [Green Version]
- Dufresne, A.; Dupeyre, D.; Vignon, M.R. Cellulose Microfibrils from Potato Tuber Cells: Processing and Characterization of Starch—Cellulose Microfibril Composites. J. Appl. Polym. Sci. 1999, 76, 2080–2092. [Google Scholar] [CrossRef]
- Kakroodi, A.R.; Cheng, S.; Sain, M.; Asiri, A. Mechanical, Thermal, and Morphological Properties of Nanocomposites Based on Polyvinyl Alcohol and Cellulose Nanofiber from Aloe vera Rind. J. Nanomater. 2014, 2014, 12–18. [Google Scholar]
- Asrofi, M.; Abral, H.; Kurnia, Y.K.; Sapuan, S.M.; Kim, H.J. Effect of duration of sonication during gelatinization on properties of tapioca starch water hyacinth fiber biocomposite. Int. J. Biol. Macromol. 2018, 108, 167–176. [Google Scholar] [CrossRef] [PubMed]
- Abral, H.; Dalimunthe, M.H.; Hartono, J.; Efendi, R.P.; Asrofi, M.; Sugiarti, E.; Sapuan, S.M.; Park, J.W.; Kim, H.J. Characterization of tapioca starch biopolymer composites reinforced with micro scale water hyacinth fibers. Starch/Staerke 2018, 70. [Google Scholar] [CrossRef]
- Garcia-Hernandez, A.; Vernon-Carter, E.J.; Alvarez-Ramirez, J. Impact of ghosts on the mechanical, optical, and barrier properties of corn starch films. Starch/Staerke 2017, 69, 1600308. [Google Scholar] [CrossRef] [Green Version]
- Iida, Y.; Tuziuti, T.; Yasui, K.; Towata, A.; Kozuka, T. Control of viscosity in starch and polysaccharide solutions with ultrasound after gelatinization. Innov. Food Sci. Emerg. Technol. 2008, 9, 140–146. [Google Scholar] [CrossRef]
- Hiasa, S.; Iwamoto, S.; Endo, T.; Edashige, Y. Isolation of cellulose nanofibrils from mandarin (Citrus unshiu) peel waste. Ind. Crop. Prod. 2014, 62, 280–285. [Google Scholar] [CrossRef]
- Julie Chandra, C.S.; George, N.; Narayanankutty, S.K. Isolation and characterization of cellulose nanofibrils from arecanut husk fibre. Carbohydr. Polym. 2016, 142, 158–166. [Google Scholar]
- Abral, H.; Lawrensius, V.; Handayani, D.; Sugiarti, E. Preparation of nano-sized particles from bacterial cellulose using ultrasonication and their characterization. Carbohydr. Polym. 2018, 191, 161–167. [Google Scholar] [CrossRef] [PubMed]
- Chen, W.; Yu, H.; Liu, Y.; Chen, P.; Zhang, M.; Hai, Y. Individualization of cellulose nanofibers from wood using high-intensity ultrasonication combined with chemical pretreatments. Carbohydr. Polym. 2011, 83, 1804–1811. [Google Scholar] [CrossRef]
- Montero, B.; Rico, M.; Rodríguez-llamazares, S.; Barral, L.; Bouza, R. Effect of nanocellulose as a filler on biodegradable thermoplastic starch films from tuber, cereal and legume. Carbohydr. Polym. 2016, 157, 1094–1104. [Google Scholar] [CrossRef] [PubMed]
- Tibolla, H.; Pelissari, F.M.; Martins, J.T.; Vicente, A.A.; Menegalli, F.C. Cellulose Nanofibers Produced from Banana Peel by Chemical and Mechanical Treatments: Characterization and Cytotoxicity Assessment. Food Hydrocoll. 2017, 75, 192–201. [Google Scholar] [CrossRef]
- Pelissari, F.M.; Andrade-mahecha, M.M.; José, P.; Sobral, A.; Menegalli, F.C. Nanocomposites based on Banana Starch Reinforced with Cellulose Nanofibers Isolated from Banana Peels. J. Colloid Interface Sci. 2017, 505, 154–167. [Google Scholar] [CrossRef] [PubMed]
- Karataş, M.; Arslan, N. Flow behaviours of cellulose and carboxymethyl cellulose from grapefruit peel. Food Hydrocoll. 2016, 58, 235–245. [Google Scholar] [CrossRef]
- Liu, Y.; Liu, A.; Ibrahim, S.A.; Yang, H.; Huang, W. Isolation and characterization of microcrystalline cellulose from pomelo peel. Int. J. Biol. Macromol. 2018, 111, 717–721. [Google Scholar] [CrossRef] [PubMed]
- Segal, L.; Creely, J.J.; Martin, J.A.E.; Conrad, C.M. An Empirical Method for Estimating the Degree of Crystallinity of Native Cellulose Using the X-ray Diffractometer. Text. Res. J. 1959, 29, 786–794. [Google Scholar] [CrossRef]
- Leite, A.L.M.P.; Florencia, Z.; Menegalli, C. Isolation and characterization of cellulose nanofibers from cassava root bagasse and peelings. Carbohydr. Polym. 2017, 157, 962–970. [Google Scholar] [CrossRef] [PubMed]
- Khawas, P.; Deka, S.C. Isolation and characterization of cellulose nanofibers from culinary banana peel using high-intensity ultrasonication combined with chemical treatment. Carbohydr. Polym. 2016, 137, 608–616. [Google Scholar] [CrossRef] [PubMed]
- Niu, F.; Li, M.; Huang, Q.; Zhang, X.; Pan, W.; Yang, J.; Li, J. The characteristic and dispersion stability of nanocellulose produced by mixed acid hydrolysis and ultrasonic assistance. Carbohydr. Polym. 2017, 165, 197–204. [Google Scholar] [CrossRef] [PubMed]
- Sanjay, M.R.; Madhu, P.; Jawaid, M.; Senthamaraikannan, P.; Senthil, S.; Pradeep, S. Characterization and Properties of Natural Fiber Polymer Composites: A Comprehensive Review. J. Clean. Prod. 2017, 172, 566–581. [Google Scholar] [CrossRef]
- Abral, H.; Anugrah, A.S.; Hafizulhaq, F.; Sugiarti, E.; Muslimin, A.N. Effect of nanofibers fraction on properties of the starch based biocomposite prepared in various ultrasonic power. Int. J. Biol. Macromol. 2018, 116, 1214–1221. [Google Scholar] [CrossRef] [PubMed]
Figure 1.
Particle size distribution of cellulose fiber from bengkoang tuber peel.

Figure 2.
Film opacity of control and biocomposite films.

Figure 3.
X-ray diffraction (XRD) patterns of (a) fibers, and (b) control and biocomposite films.


Figure 4.
FTIR spectra of control and biocomposite films.

Figure 5.
Moisture absorption for control and biocomposite films for 5 h testing time.

Figure 6.
SEM micrograph of fractured cross section of the (a) Control; (b) BC-2; (c) BC-6; (d) BC-10 in X250; (e) Control; (f) BC-2; (g) BC-6; (h) BC-10 in X1000.
Figure 6.
SEM micrograph of fractured cross section of the (a) Control; (b) BC-2; (c) BC-6; (d) BC-10 in X250; (e) Control; (f) BC-2; (g) BC-6; (h) BC-10 in X1000.


Table 1.
Composition of starch and biocomposite films.
| Sample | Starch (g) | Glycerol (g) | Distilled Water (g) | Cellulose Suspension (g) |
|---|---|---|---|---|
| Control | 10 | 4 | 100 | - |
| BC-2 | 10 | 4 | 98 | 2 |
| BC-6 | 10 | 4 | 94 | 6 |
| BC-10 | 10 | 4 | 90 | 10 |
Table 2.
Crystallinity index of starch and biocomposite films.
| Sample | Crystallinity Index (%) | Intensity Ratio at 1022/995 |
|---|---|---|
| Fiber | 58.48 | - |
| Control | 44.70 | 0.47 |
| BC-2 | 44.75 | 0.48 |
| BC-6 | 45.63 | 0.54 |
| BC-10 | 45.82 | 0.59 |
© 2018 by the authors. Licensee MDPI, Basel, Switzerland. This article is an open access article distributed under the terms and conditions of the Creative Commons Attribution (CC BY) license (http://creativecommons.org/licenses/by/4.0/).
Share and Cite
MDPI and ACS Style
Hafizulhaq, F.; Abral, H.; Kasim, A.; Arief, S.; Affi, J. Moisture Absorption and Opacity of Starch-Based Biocomposites Reinforced with Cellulose Fiber from Bengkoang. Fibers 2018, 6, 62. https://0-doi-org.brum.beds.ac.uk/10.3390/fib6030062
AMA Style
Hafizulhaq F, Abral H, Kasim A, Arief S, Affi J. Moisture Absorption and Opacity of Starch-Based Biocomposites Reinforced with Cellulose Fiber from Bengkoang. Fibers. 2018; 6(3):62. https://0-doi-org.brum.beds.ac.uk/10.3390/fib6030062
Chicago/Turabian StyleHafizulhaq, Fadli, Hairul Abral, Anwar Kasim, Syukri Arief, and Jon Affi. 2018. "Moisture Absorption and Opacity of Starch-Based Biocomposites Reinforced with Cellulose Fiber from Bengkoang" Fibers 6, no. 3: 62. https://0-doi-org.brum.beds.ac.uk/10.3390/fib6030062
Note that from the first issue of 2016, this journal uses article numbers instead of page numbers. See further details here.