Physico-Mechanical, Thermal and Biodegradation Performance of Random Flax/Polylactic Acid and Unidirectional Flax/Polylactic Acid Biocomposites


Abstract
:1. Introduction
2. Materials and Methods
2.1. Materials
2.2. Evaluation of Fiber Property and Preform
2.3. Production of Flax/PLA Preforms
2.3.1. Aligned Flax Fiber Preforms
2.3.2. Randomly Aligned Flax Fiber Preforms
2.3.3. Aligned Flax Fiber Composites
2.3.4. Randomly Aligned Flax Fiber Composites
2.4. Characterization of Composites
2.4.1. Mechanical Testing
2.4.2. Density, Fiber Volume Fraction and Void Content Measurement
2.5. Differential Scanning Calorimetry (DSC)
2.6. Water Absorption Test
2.7. Biodegradability Test
2.8. Scanning Electron Microscopy (SEM)
3. Results and Discussion
4. Conclusions
Author Contributions
Funding
Acknowledgments
Conflicts of Interest
References
- Mohanty, A.K.; Misra, M.; Drzal, L.T. Natural Fibers, Biopolymers and Biocomposites; CRC Press: Boca Raton, FL, USA, 2005. [Google Scholar]
- Wallenberger, F.T.; Weston, N. Natural Fibers, Plastics and Composites; Springer Science & Business Media: New York, NY, USA, 2003. [Google Scholar]
- Awal, A.; Rana, M.; Sain, M. Thermorheological and mechanical properties of cellulose reinforced PLA bio-composites. Mech. Mater. 2015, 80, 87–95. [Google Scholar] [CrossRef]
- Garlotta, D. A literature review of poly (lactic acid). J. Polym. Environ. 2001, 9, 63–84. [Google Scholar] [CrossRef]
- Markarian, J. Biopolymers present new market opportunities for additives in packaging. Plast. Addit. Compd. 2008, 10, 22–25. [Google Scholar] [CrossRef]
- Vroman, I.; Tighzert, L. Biodegradable polymers. Materials 2009, 2, 307–344. [Google Scholar] [CrossRef]
- Yusoff, R.B.; Takagi, H.; Nakagaito, A.N. Tensile and flexural properties of polylactic acid-based hybrid green composites reinforced by kenaf, bamboo and coir fibers. Ind. Crops Prod. 2016, 94, 562–573. [Google Scholar] [CrossRef]
- Mohanty, A.K.; Misra, M.; Drzal, L. Sustainable bio-composites from renewable resources: Opportunities and challenges in the green materials world. J. Polym. Environ. 2002, 10, 19–26. [Google Scholar] [CrossRef]
- Burgueno, R.; Quagliata, M.J.; Mohanty, A.K.; Mehta, G.; Drzal, L.T.; Misra, M. Load-bearing natural fiber composite cellular beams and panels. Compos. Part A Appl. Sci. Manuf. 2004, 35, 645–656. [Google Scholar] [CrossRef]
- Sahoo, S.; Misra, M.; Mohanty, A.K. Enhanced properties of lignin-based biodegradable polymer composites using injection molding process. Compos. Part A Appl. Sci. Manuf. 2011, 42, 1710–1718. [Google Scholar] [CrossRef]
- Cabral, H.; Cisneros, M.; Kenny, J.; Vazquez, A.; Bernal, C. Structure–properties relationship of short jute fiber-reinforced polypropylene composites. J. Compos. Mater. 2005, 39, 51–65. [Google Scholar] [CrossRef]
- Jayaraman, K. Manufacturing sisal–polypropylene composites with minimum fibre degradation. Comput. Sci. Technol. 2003, 63, 367–374. [Google Scholar] [CrossRef]
- Madsen, B.; Hoffmeyer, P.; Thomsen, A.B.; Lilholt, H. Hemp yarn reinforced composites—I. Yarn characteristics. Compos. Part A Appl. Sci. Manuf. 2007, 38, 2194–2203. [Google Scholar] [CrossRef]
- Feng, D.; Caulfield, D.; Sanadi, A. Effect of compatibilizer on the structure-property relationships of kenaf-fiber/polypropylene composites. Polym. Compos. 2001, 22, 506–517. [Google Scholar] [CrossRef]
- Baiardo, M.; Zini, E.; Scandola, M. Flax fibre–polyester composites. Compos. Part A Appl. Sci. Manuf. 2004, 35, 703–710. [Google Scholar] [CrossRef]
- Rubio-López, A.; Artero-Guerrero, J.; Pernas-Sánchez, J.; Santiuste, C. Compression after impact of flax/PLA biodegradable composites. Polym. Test. 2017, 59, 127–135. [Google Scholar] [CrossRef]
- Yan, L.; Chouw, N.; Jayaraman, K. Flax fibre and its composites–A review. Compos. Part B Eng. 2014, 56, 296–317. [Google Scholar] [CrossRef]
- Lucintel, B. Opportunities in Natural Fiber Composites; Texas Lucintel: Dallas, TX, USA, 2011. [Google Scholar]
- Saravana Bavan, D.; Mohan Kumar, G. Potential use of natural fiber composite materials in India. J. Reinf. Plast. Compos. 2010, 29, 3600–3613. [Google Scholar] [CrossRef]
- Murariu, M.; Dubois, P. PLA composites: From production to properties. Adv. Drug Del. Rev. 2016, 107, 17–46. [Google Scholar] [CrossRef]
- La Mantia, F.; Morreale, M. Green composites: A brief review. Compos. Part A Appl. Sci. Manuf. 2011, 42, 579–588. [Google Scholar] [CrossRef]
- Koronis, G.; Silva, A.; Fontul, M. Green composites: A review of adequate materials for automotive applications. Compos. Part B Eng. 2013, 44, 120–127. [Google Scholar] [CrossRef]
- Foruzanmehr, M.; Vuillaume, P.Y.; Elkoun, S.; Robert, M. Physical and mechanical properties of PLA composites reinforced by TiO2 grafted flax fibers. Mater. Des. 2016, 106, 295–304. [Google Scholar] [CrossRef]
- Lim, L.-T.; Auras, R.; Rubino, M. Processing technologies for poly (lactic acid). Prog. Polym. Sci. 2008, 33, 820–852. [Google Scholar] [CrossRef]
- Ma, H.; Joo, C.W. Structure and mechanical properties of jute—Polylactic acid biodegradable composites. J. Compos. Mater. 2011, 45, 1451–1460. [Google Scholar]
- Shanks, R.; Hodzic, A.; Ridderhof, D. Composites of poly (lactic acid) with flax fibers modified by interstitial polymerization. J. Appl. Polym. Sci. 2006, 101, 3620–3629. [Google Scholar] [CrossRef]
- Couture, A.; Lebrun, G.; Laperrière, L. Mechanical properties of polylactic acid (PLA) composites reinforced with unidirectional flax and flax-paper layers. Compos. Struct. 2016, 154, 286–295. [Google Scholar] [CrossRef]
- Alimuzzaman, S.; Gong, R.H.; Akonda, M. Impact Property of PLA/flax Nonwoven Biocomposite; Conference Papers in Materials Science; Hindawi: New York, NY, USA, 2013. [Google Scholar]
- Lee, S.H.; Kang, T.J. Mechanical and impact properties of needle punched nonwoven composites. J. Compos. Mater. 2000, 34, 816–840. [Google Scholar] [CrossRef]
- Alimuzzaman, S.; Gong, R.H.; Akonda, M. Nonwoven polylactic acid and flax biocomposites. Polym. Compos. 2013, 34, 1611–1619. [Google Scholar] [CrossRef]
- Hearle, J.; Stevenson, P. Nonwoven fabric studies: Part III: The anisotropy of nonwoven fabrics. Text. Res. J. 1963, 33, 877–888. [Google Scholar] [CrossRef]
- Krenchel, H. Fibre Reinforcement; Theoretical and Practical Investigations of the Elasticity and Strength of Fibre-Reinforced Materials; Akademisk Forlag: Copenhagen, Denmark, 1964. [Google Scholar]
- Bledzki, A.K.; Jaszkiewicz, A.; Scherzer, D. Mechanical properties of PLA composites with man-made cellulose and abaca fibres. Compos. Part A Appl. Sci. Manuf. 2009, 40, 404–412. [Google Scholar] [CrossRef]
- Kim, H.-S.; Kim, H.-J.; Lee, J.-W.; Choi, I.-G. Biodegradability of bio-flour filled biodegradable poly (butylene succinate) bio-composites in natural and compost soil. Polym. Dégrad. Stab. 2006, 91, 1117–1127. [Google Scholar] [CrossRef]
- Kim, H.S.; Yang, H.S.; Kim, H.J. Biodegradability and mechanical properties of agro-flour–filled polybutylene succinate biocomposites. J. Appl. Polym. Sci. 2005, 97, 1513–1521. [Google Scholar] [CrossRef]
- Alimuzzaman, S.; Gong, R.H.; Akonda, M. Biodegradability of nonwoven flax fiber reinforced polylactic acid biocomposites. Polym. Compos. 2014, 35, 2094–2102. [Google Scholar] [CrossRef]
- Panthapulakkal, S.; Sain, M. Injection-molded short hemp fiber/glass fiber-reinforced polypropylene hybrid composites—Mechanical, water absorption and thermal properties. J. Appl. Polym. Sci. 2007, 103, 2432–2441. [Google Scholar] [CrossRef]
- Satyanarayana, K.G.; Arizaga, G.G.; Wypych, F. Biodegradable composites based on lignocellulosic fibers—An overview. Prog. Polym. Sci. 2009, 34, 982–1021. [Google Scholar] [CrossRef]
- Plackett, D.; Andersen, T.L.; Pedersen, W.B.; Nielsen, L. Biodegradable composites based on L-polylactide and jute fibres. Compos. Sci. Technol. 2003, 63, 1287–1296. [Google Scholar] [CrossRef]
- John, M.J.; Anandjiwala, R.D. Recent developments in chemical modification and characterization of natural fiber-reinforced composites. Polym. Compos. 2008, 29, 187–207. [Google Scholar] [CrossRef]
- Rudeekit, Y.; Numnoi, J.; Tajan, M.; Chaiwutthinan, P.; Leejarkpai, T. Determining biodegradability of polylactic acid under different environments. J. Met. Mater. Miner. 2008, 18, 83–87. [Google Scholar]
- Kumar, R.; Yakubu, M.; Anandjiwala, R. Biodegradation of flax fiber reinforced poly lactic acid. Express Polym. Lett. 2010, 4, 423–430. [Google Scholar] [CrossRef] [Green Version]
- Mohammad Khanlou, H.; Hall, W.; Woodfield, P.; Summerscales, J.; Francucci, G. The mechanical properties of flax fibre reinforced poly (lactic acid) bio-composites exposed to wet, freezing and humid environments. J. Compos. Mater. 2018, 52, 835–850. [Google Scholar] [CrossRef]
- Bayerl, T.; Geith, M.; Somashekar, A.A.; Bhattacharyya, D. Influence of fibre architecture on the biodegradability of FLAX/PLA composites. Int. Biodeterior. Biodégrad. 2014, 96, 18–25. [Google Scholar] [CrossRef]


| Fiber Type | Density (g/m3) | Tensile Strength (MPa) | Tensile Modulus (GPa) | Elongation at Break (%) | Moisture Absorption (%) |
|---|---|---|---|---|---|
| Glass | 2.55 | 2000–3500 | 70–73 | 2.5–3 | - |
| Flax | 1.4–1.54 | 800–2000 | 60–85 | 1.2–4 | 7 |
| Hemp | 1.48 | 368–900 | 70 | 1.6 | 8 |
| Jute | 1.44–1.46 | 400–775 | 10–30 | 1.5–1.8 | 12 |
| Sisal | 1.33–1.5 | 350–700 | 22–38 | 2–7 | 11 |
| Coir | 1.25 | 220 | 6 | 15–25 | 10 |
| Cotton | 1.5–1.6 | 200–800 | 5.5–12.6 | 6–12 | 8–25 |
| Properties | Flax Fiber | PLA Fiber | Flax/PLA Nonwoven Mat | Flax/PLA Yarn |
|---|---|---|---|---|
| Fiber diameter (µm) | 22.0 ± 1.0 | 28.0 ± 0.5 | - | - |
| Linear density | 6.6 ± 0.5 dtex | 3.3 ± 0.5 dtex | 250.0 ± 10.0 tex | |
| Areal density | - | - | 1000.0 ± 50.0 g/m2 | - |
| Mean fiber length (mm) | 70.0 ± 17.0 | 70.0 ± 3.0 | - | - |
| Tenacity (MPa) | 750.0 ± 15.0 | 104.0 ± 5.0 | - | - |
| Breaking elongation (%) | 1.8 ± 0.5 | 2.9 ± 1.0 | 0.8 ± 1.0 | 3.5 ± 1.0 |
| Melting temperature (°C) | - | 171.0 | - | - |
| Density (g/cm3) | 1.54 | 1.24 | - | - |
| Properties | Neat PLA | Random Flax/PLA | Aligned Flax/PLA |
|---|---|---|---|
| Flax fiber content (wt.%) | 0.0 | 48.0 | 49.5 |
| Composite density (g/cm3) | 1.24 | 1.1 | 1.2 |
| Void content (%) | 0.5 | 18.0 | 4.0 |
| Tensile strength (MPa) | 40.0 ± 3.0 | 83.0 ± 5.0 | 151.0 ± 7.0 |
| Tensile modulus (GPa) | 3.8 ± 1.0 | 9.3 ± 1.5 | 18.5 ± 2.0 |
| Flexural strength (MPa) | 82.0 ± 2.0 | 130.0 ± 5.0 | 215.0 ± 17.2 |
| Flexural modulus (GPa) | 4.0 ± 0.5 | 9.9 ± 1.0 | 18.8 ± 1.0 |
| Specific tensile strength (MPa1/2. cm3/g) | 5.3 | 7.7 | 10.3 |
| Specific tensile modulus (GPa1/3. cm3/g) | 1.2 | 1.8 | 2.2 |
| Specific flexural strength (MPa1/2. cm3/g) | 7.3 | 10.4 | 12.2 |
| Specific flexural modulus (GPa1/3. cm3/g) | 1.3 | 2.0 | 2.2 |
| Sample | |||||
|---|---|---|---|---|---|
| Onset Melting Temperature | Peak Melting Temperature | ||||
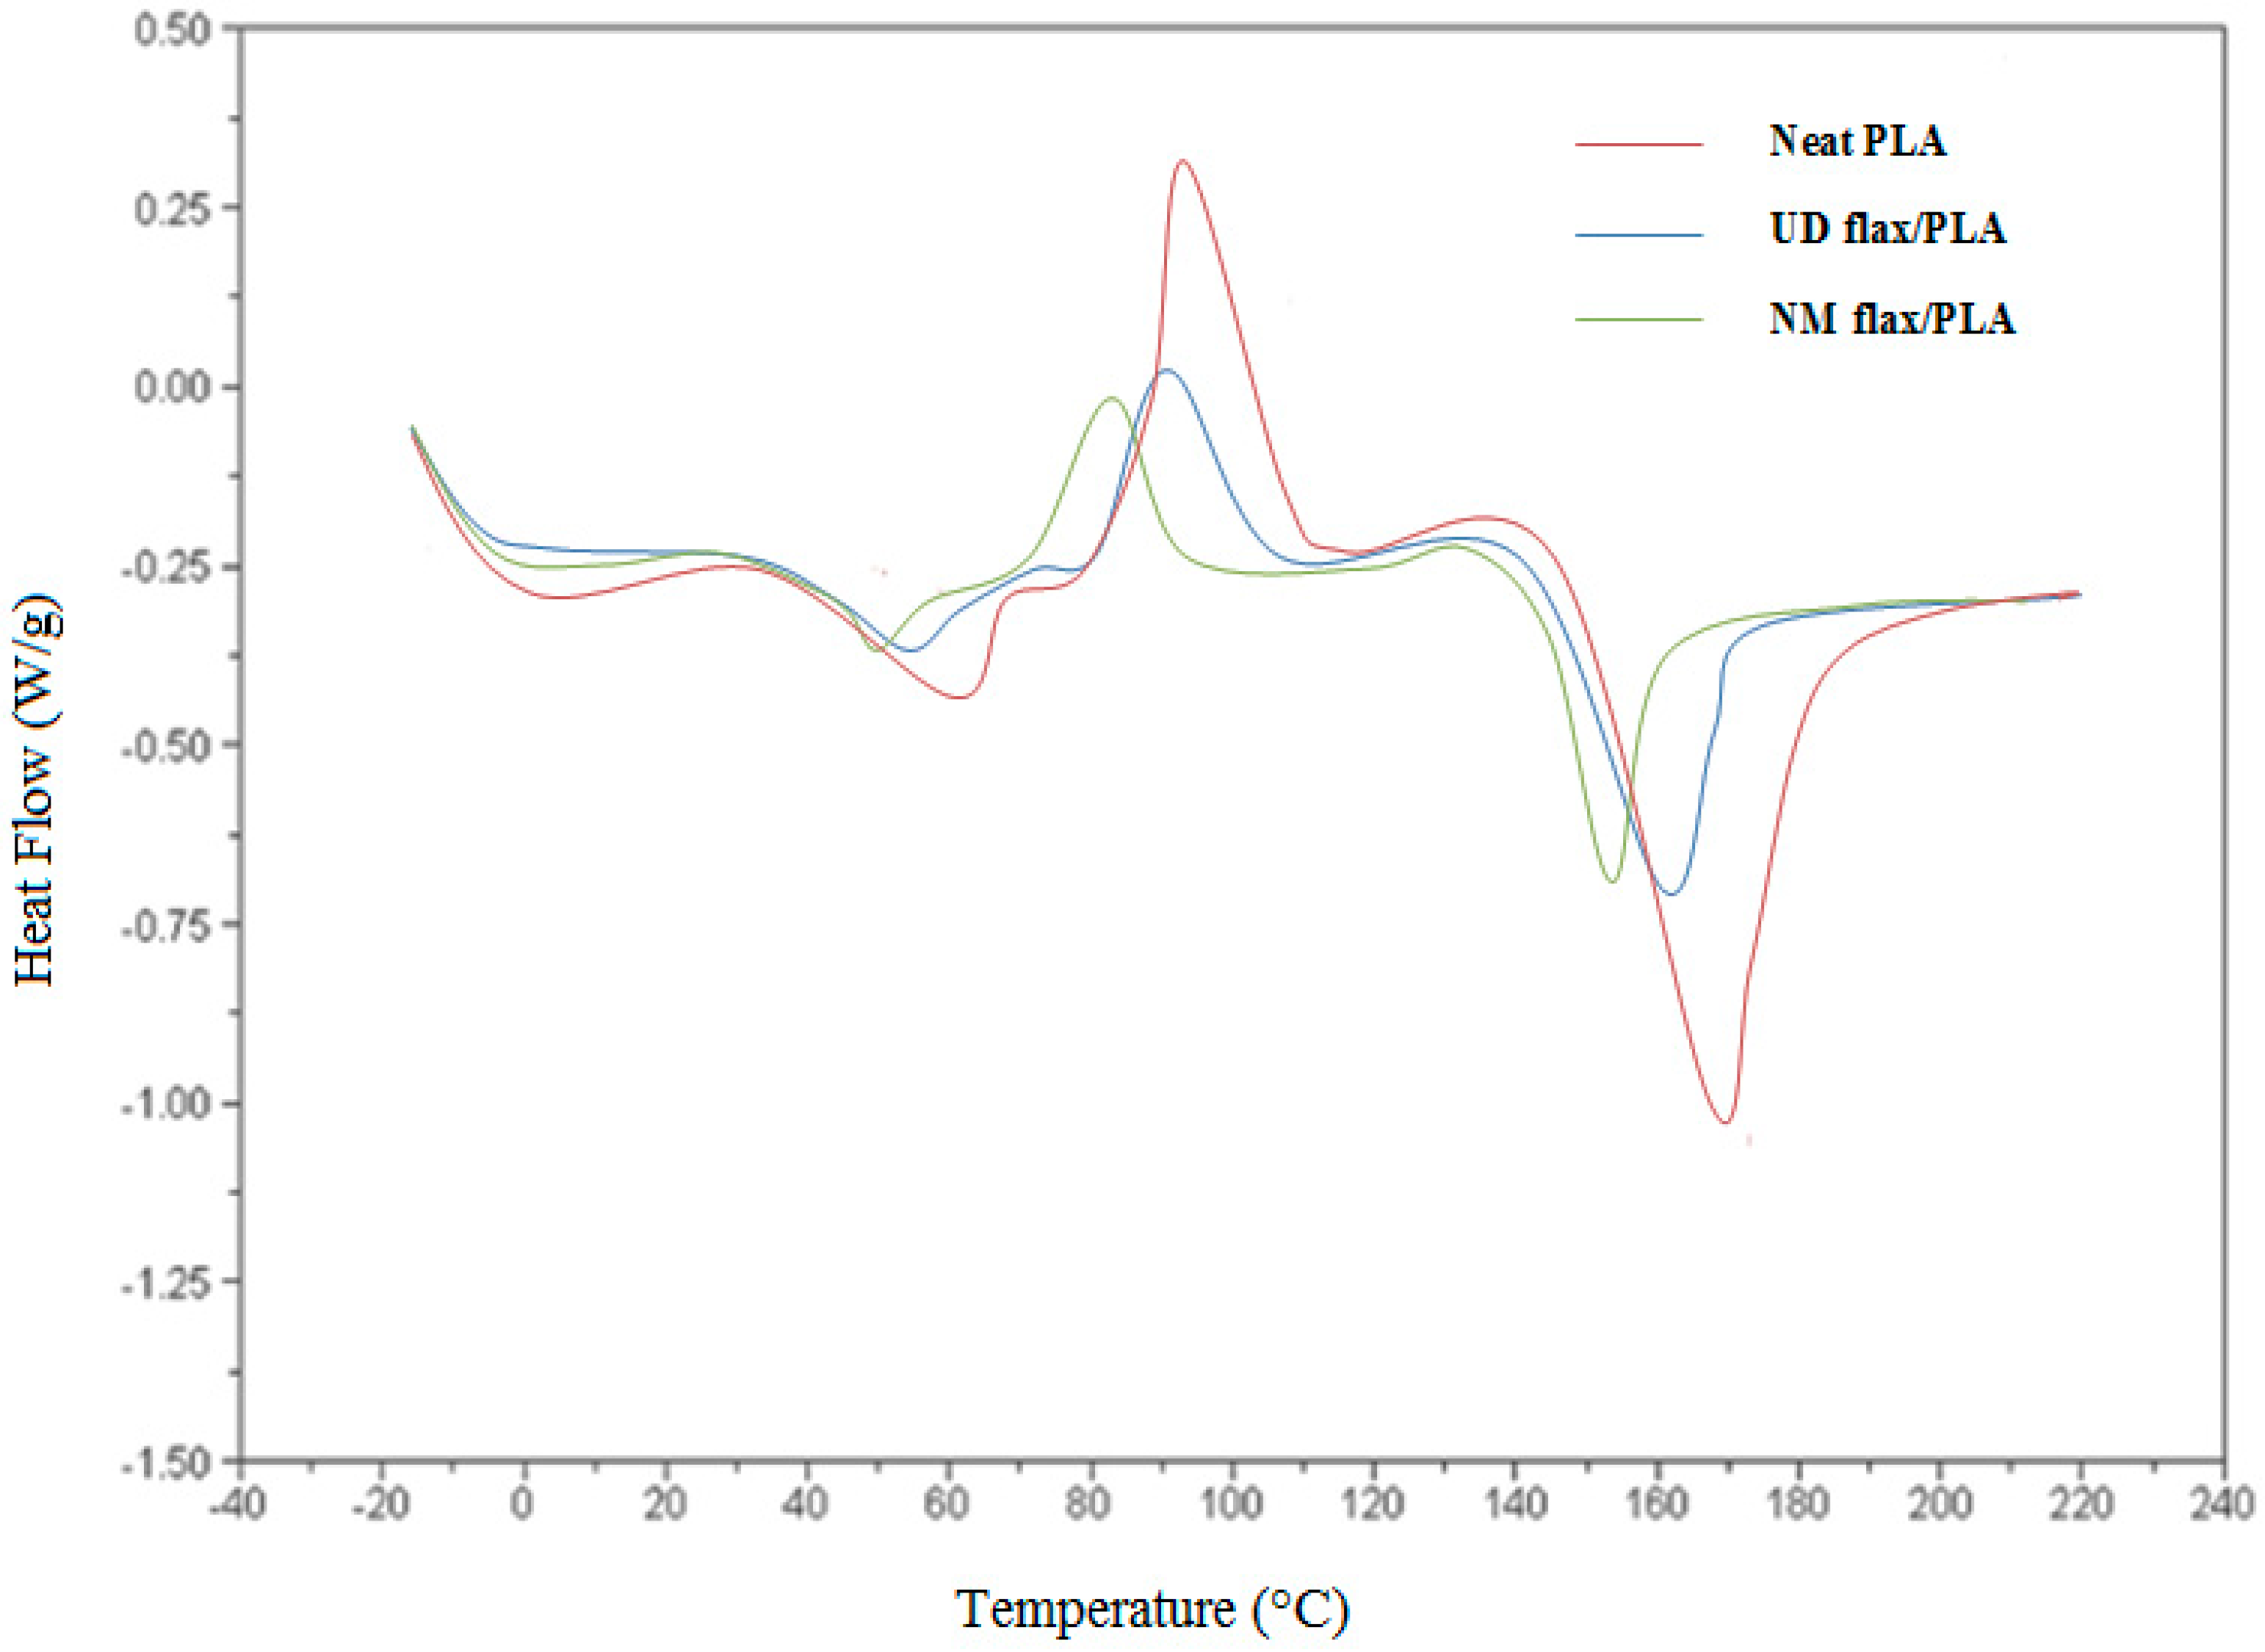
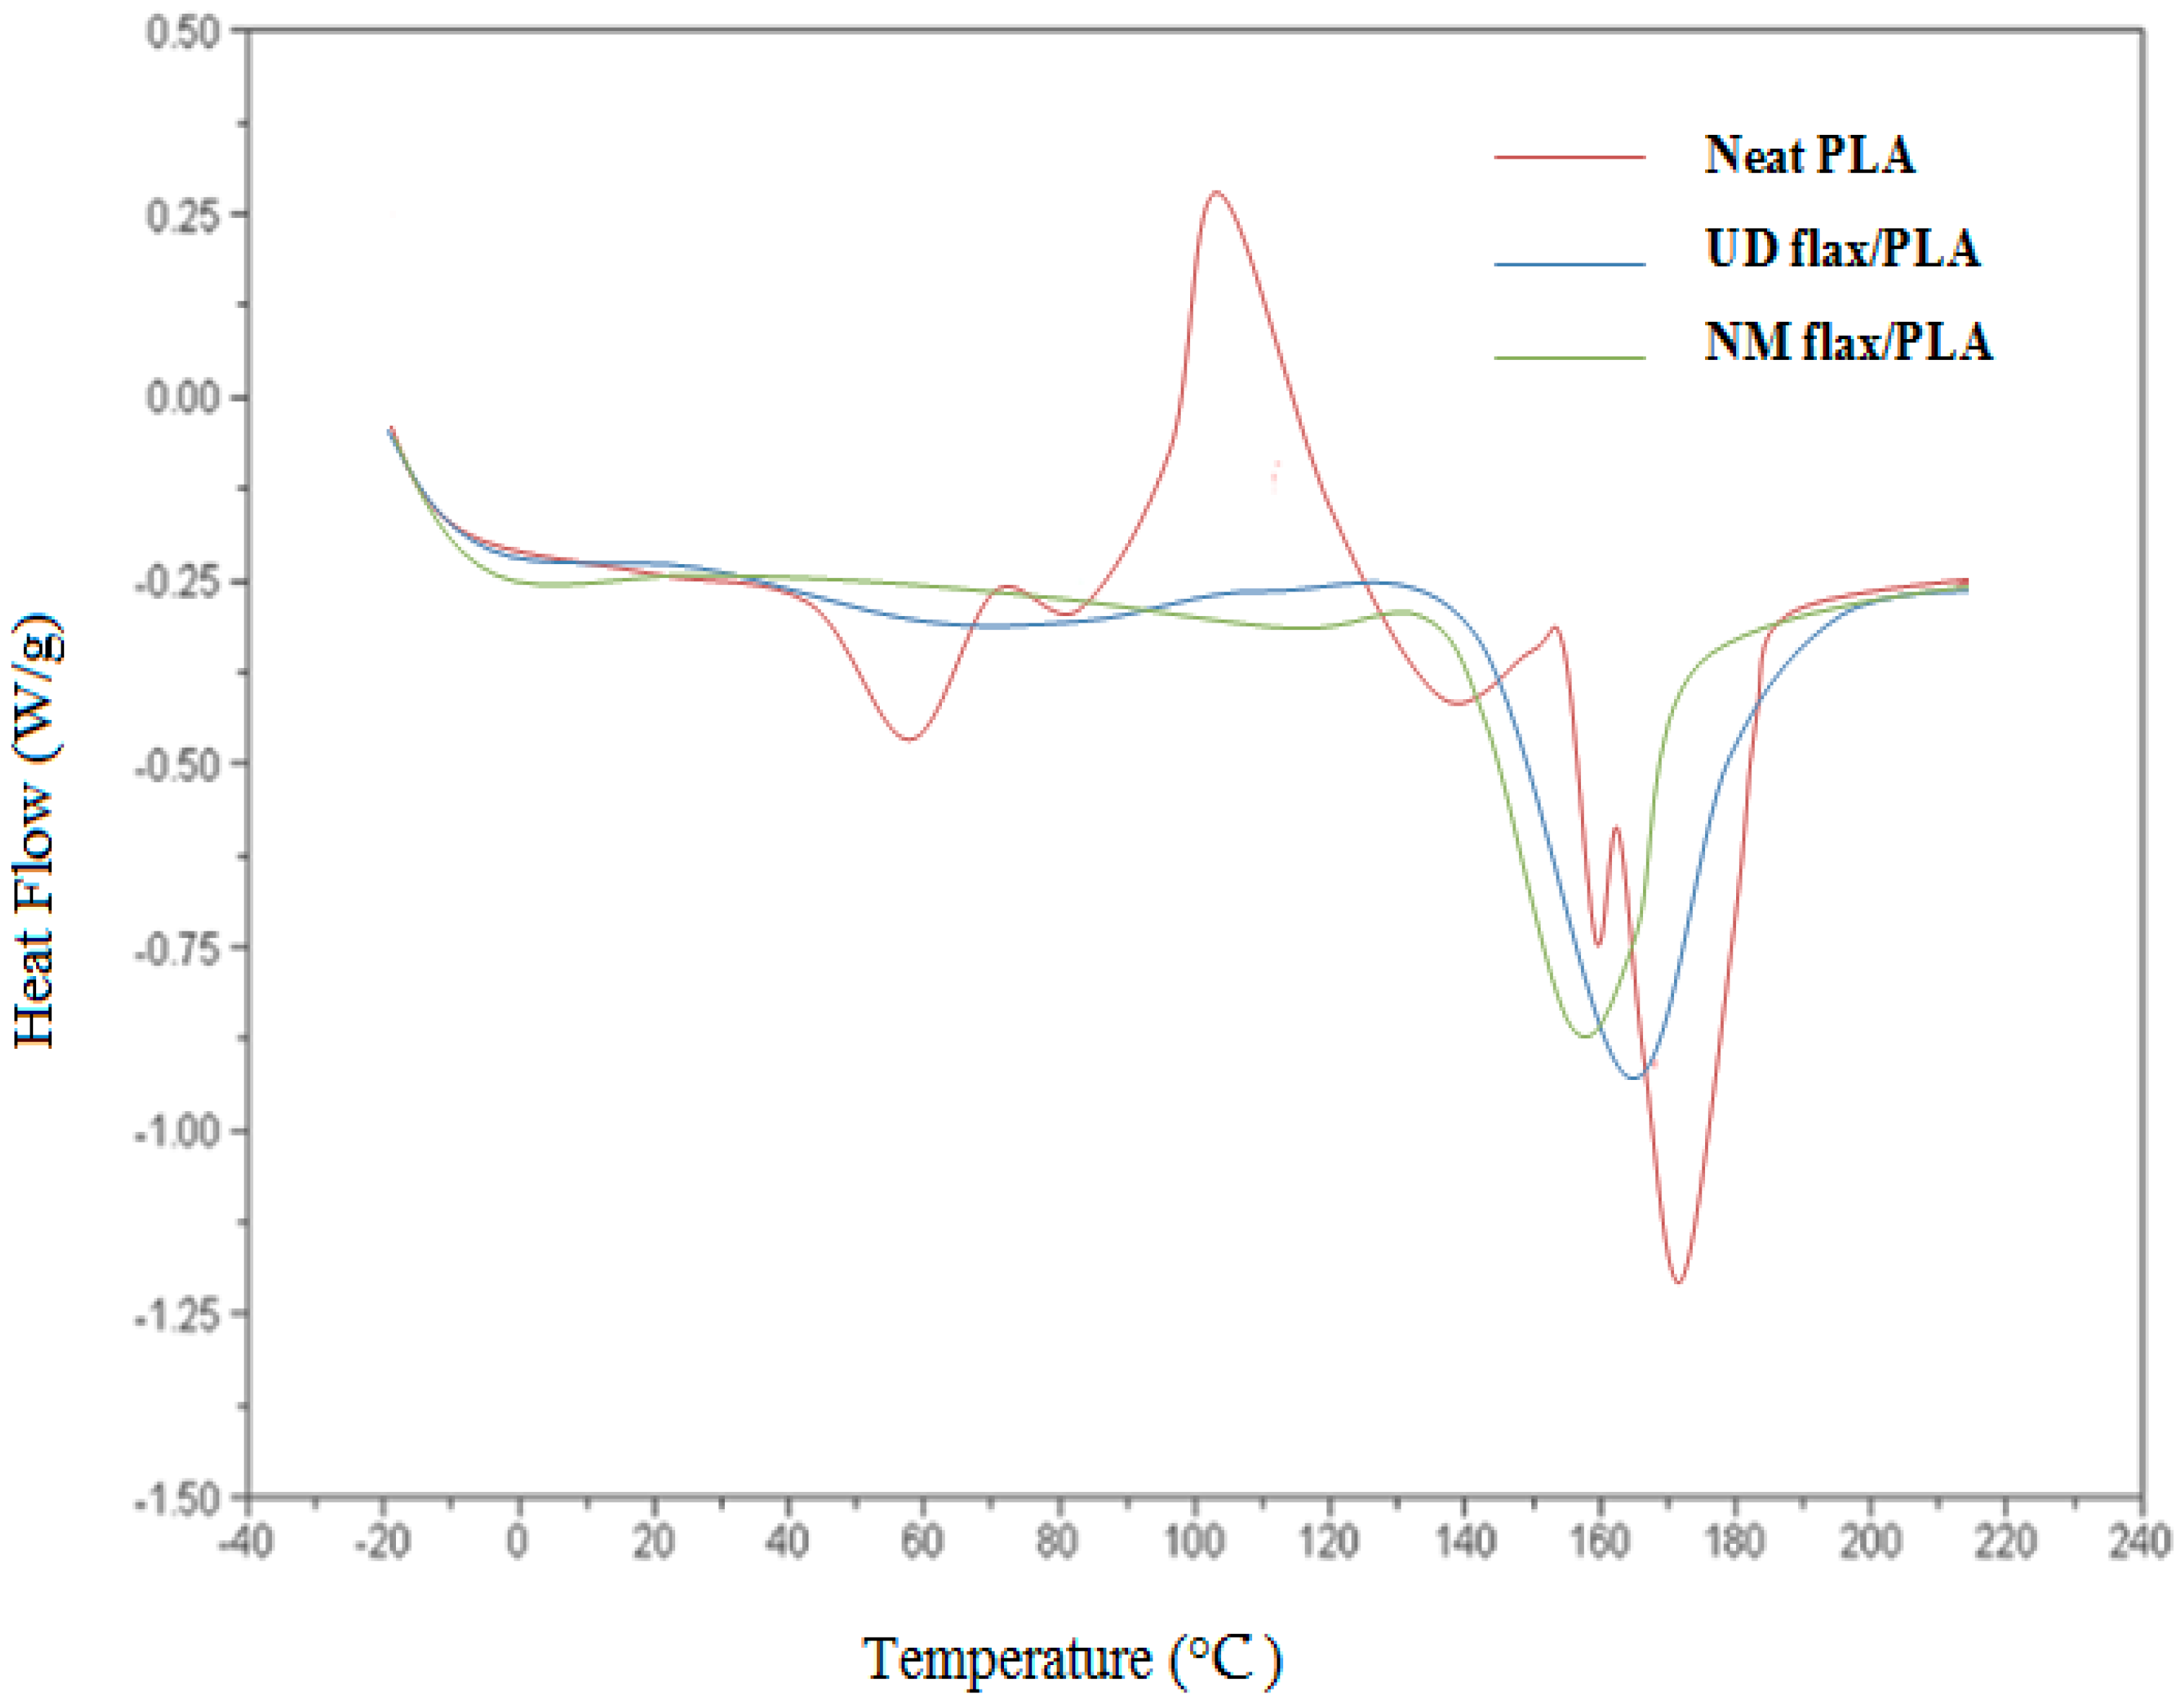
| Neat PLA | 59 | 160 | 171 | 43 | 46 |
| NM flax/PLA | 50 | 145 | 155 | 32 | 34 |
| UD flax/PLA | 54 | 151 | 163 | 39 | 42 |
© 2018 by the authors. Licensee MDPI, Basel, Switzerland. This article is an open access article distributed under the terms and conditions of the Creative Commons Attribution (CC BY) license (http://creativecommons.org/licenses/by/4.0/).
Share and Cite
Akonda, M.; Alimuzzaman, S.; Shah, D.U.; Rahman, A.N.M.M. Physico-Mechanical, Thermal and Biodegradation Performance of Random Flax/Polylactic Acid and Unidirectional Flax/Polylactic Acid Biocomposites. Fibers 2018, 6, 98. https://0-doi-org.brum.beds.ac.uk/10.3390/fib6040098
Akonda M, Alimuzzaman S, Shah DU, Rahman ANMM. Physico-Mechanical, Thermal and Biodegradation Performance of Random Flax/Polylactic Acid and Unidirectional Flax/Polylactic Acid Biocomposites. Fibers. 2018; 6(4):98. https://0-doi-org.brum.beds.ac.uk/10.3390/fib6040098
Chicago/Turabian StyleAkonda, Mahmudul, S. Alimuzzaman, D. U. Shah, and A.N.M. Masudur Rahman. 2018. "Physico-Mechanical, Thermal and Biodegradation Performance of Random Flax/Polylactic Acid and Unidirectional Flax/Polylactic Acid Biocomposites" Fibers 6, no. 4: 98. https://0-doi-org.brum.beds.ac.uk/10.3390/fib6040098