Investigation of Chemical and Physical Surface Changes of Thermally Conditioned Glass Fibres
by
 , ,
, ,
Peter G Jenkins
1,* ,
,
Liu Yang
1,
James L Thomason
1,
Xinyong Chen
2,
John F Watts
3 and
Steven J Hinder
3 1
Department of Mechanical & Aerospace Engineering, University of Strathclyde, 75 Montrose Street, Glasgow G1 1XJ, UK
2
School of Pharmacy, University of Nottingham, University Park, Nottingham NG7 2RD, UK
3
The Surface Analysis Laboratory, Department of Mechanical Engineering Sciences, Mail Stop A1, University of Surrey, Guildford, Surrey GU2 7XH, UK
*
Author to whom correspondence should be addressed.
Fibers 2019, 7(1), 7; https://0-doi-org.brum.beds.ac.uk/10.3390/fib7010007
Submission received: 27 November 2018
/
Revised: 27 December 2018
/
Accepted: 8 January 2019
/
Published: 15 January 2019
(This article belongs to the Special Issue Glass Fibers 2018)
Abstract
:A number of analytical techniques were applied to investigate changes to the surface of unsized boron-free E-glass fibres after thermal conditioning at temperatures up to 700 °C. Novel systematic studies were carried out to investigate the fundamental strength loss from thermal conditioning. Surface chemical changes studied using X-ray photoelectron spectroscopy (XPS) showed a consistent increase in the surface concentration of calcium with increasing conditioning temperature, although this did not correlate well with a loss of fibre strength. Scanning electron microscopy fractography confirmed the difficulty of analysing failure-inducing flaws on individual fibre fracture surfaces. Analysis by atomic force microscopy (AFM) did not reveal any likely surface cracks or flaws of significant dimensions to cause failure: the observation of cracks before fibre fracture may not be possible when using this technique. Fibre surface roughness increased over the whole range of the conditioning temperatures investigated. Although surface roughness did not correlate precisely with fibre strength, there was a clear inverse relationship at temperatures exceeding 400 °C. The interpretation of the surface topography that formed between 400–700 °C produced evidence that the initial stage of phase separation by spinodal decomposition may have occurred at the fibre surface.

1. Introduction
Glass fibre is the predominate reinforcement material that is used in polymer composites, due its relatively high specific properties, low cost and a versatility, due to the ability for the surface to be chemically tailored for different polymer matrices; the annual consumption of E-glass fibres is in excess of 7 million tons [1]. Global glass fibre usage has continued to increase over the last few years, driven by a greater use of composites in established sectors as well as adoption in new markets [2]. However, a significant challenge facing the glass fibre and composites industries is the relative difficulty associated with the cost-effective recycling of glass fibre-reinforced polymer (GFRP) materials at the end of life. The issue is particularly acute with GFRP utilising thermosetting polymers, as opposed to thermoplastics, which retain an inherent recyclability, even when they are used to produce composites. Although some routes exist, such as mechanical grinding for use as a filler or incorporation in cement production [3,4], limitations to these processes mean that neither are likely to be able to accommodate the increasing volumes of end-of-life materials.
Alternative approaches to GFRP recycling are predicated on the benefits of separating the matrix, and any fillers, from the fibrous reinforcement. The glass fibres may be considered as the most valuable fraction [3] and its possible recovery and reuse in second-generation composites would produce major technological, economic and environmental impacts. The separation of fibres and matrix in GFRP requires the application of aggressive processes such as pyrolysis, solvolysis or thermal recycling in the presence of oxygen, for example by fluidised bed combustion (FBC) [5]. Of the existing technologies, there is a substantial body of research on the effect of thermal recycling on the properties of the recovered fibres [5,6,7,8,9]. A universal finding of this research is the large decrease in fibre tensile strength following thermal treatments or recycling, as summarised most comprehensively in [10].
Despite this phenomenon first being reported 60 years ago [11], a full and clear understanding of all the mechanisms that contribute to thermally-induced strength loss has yet to be presented in the literature. It is generally agreed that the failure of brittle materials such as glass fibres is controlled by the presence of flaws [12]: during a tensile test, for example, failure will occur at the most critical surface flaw when a corresponding critical stress is applied. This remains the case when fibres have been heat-treated or thermally recycled, as their brittle nature is preserved. Mechanically inflicted surface damage, creating larger critical flaws or enhancing those pre-existing flaws, can be invoked to explain the strength loss in cases such as the thermal treatment of sized fibres [9] or more aggressive processes like FBC recycling [5], in which some of the lowest reported normalised strength retention values (of the order of 5–10%) have been reported.
It is the case, however, that a significant decrease in glass fibre strength occurs due to exposure to elevated temperature, even in the absence of mechanical sources of surface damage [7,13,14]. This strength loss cannot be attributed to the degradation of surface sizing, as it was measured by using fibres intentionally produced without any surface sizing, referred to as bare- or water-sized. In these experiments, fibres were thermally conditioned individually, rather than in typical fibre bundles. The authors showed in previous work [7] that very careful handling throughout the thermal conditioning process produces higher retained fibre strengths when compared to the typically used method of removing single fibre test specimens from previously conditioned fibre bundles. Fibre handling damage, which occurs during fibre specimen extraction, was suggested as the source of additional mechanical handling damage. Significantly, this study also revealed that a fundamental thermal strength loss occurs that is not related to either the degradation of the fibre surface coating, or to mechanical damage. It is this fundamental thermal-based strength loss that is yet to be fully explained.
In the work presented here, this mechanism of strength loss was further explored by using water-sized E-glass fibres whose fundamental thermal strength loss has already been described in [7]. The investigation characterised the chemical and physical changes of thermally conditioned fibres, using X-ray photoelectron spectroscopy (XPS), atomic force microscopy (AFM) and scanning electron microscopy (SEM). To our knowledge, this is the first such systematic study of this type to be reported. The work is an important step in the development of a better understanding of the strength loss of heat-treated and recycled glass fibres.
2. Materials and Methods
Boron-free E-glass (Advantex) fibres manufactured by Owens Corning Vetrotex were investigated in this study. These fibre rovings were produced on a pilot scale bushing as 20 kg continuous single-end square edge packages. The nominal tex of the rovings was 1200 g/km, and the nominal single-fibre diameter was 17.4 ± 1.3 µm. The fibres used in the study had no sizing applied during the initial manufacturing, and instead, had only been water-sprayed, using the normal cooling sprays under the bushing. Fibre rovings were subsequently dried at 105 °C for 24 hr. These samples are referred to as bare- or water-sized, as it can be assumed that most of the water is removed during the subsequent drying step. Glassbond Saureisen Electrotemp Cement No. 8 was used to restrain fibres during high-temperature treatments where glue or epoxy-based adhesives were no longer sufficient.
During the course of the investigation, the various analyses that were performed required the heat treatment of samples to be carried out in different manners. Considerations such as the length and number of fibres needed, or furnace atmosphere were assessed, and an appropriate choice was made in each case. All heat treatments were performed under air; however, the moisture content within the treatment atmosphere varied slightly. A normal atmospheric relative humidity of 35–45% was measured; compressed air that was supplied to the thermo-gravimetric analyser (TGA) and thermo-mechanical analyser (TMA) had a relative humidity of no more than 5%.
The heat treatment of glass fibres for tensile testing was carried out by using a Carbolite CWF 12/13 furnace, preheated to between 200–700 °C. Fibres were heat-treated for 25 min (of which approximately the first 10 min was required for the furnace to equilibrate to its set temperature), then removed immediately to cool in room temperature air. All treatments were carried out by using fibres taken from a single bundle from the roving. Individual fibres were extracted from the bundle prior to any heating, and mounted onto wire frames using cement. Rather than being held tightly between the two fixing points, the fibres were mounted with some slack along the length. Any thermal expansion of the frames would not, therefore, induce the longitudinal tensile stress. Secondly, it was possible for fibres to flex when exposed to convective air currents; bending stresses caused by this would be concentrated mainly at the fibre ends, which did not form part of the tested gauge length.
Heat treatment of glass fibres to be analysed by XPS was carried out in a TA Instruments Q50 TGA. A short length of fibre bundle was placed in the centre of a platinum pan. A ramp rate of 10 °C/min was applied from room temperature to the target temperature; once this was reached, the program ended and the sample was allowed to cool naturally back to room temperature. The purge gas used was air at a flow rate of 50 mL/min.
Heat treatment of glass fibres to be analysed by Atomic Force Microscopy (AFM) or Scanning Electron Microscopy (SEM) was carried out in a TA Instruments Q400 TMA. A number of parallel fibres were affixed at one end only, in Glassbond cement. Once dry, the assembly was hung in the TMA furnace by using the slot in a film/fibre stage, with the fibres pointing downwards. Heat treatment of fibres was performed using a temperature range of 200–700 °C. The furnace was equilibrated to within 10% of the treatment temperature within the first minute, and to the precise temperature within approximately 5 min. A 15 min isothermal was then applied, after which the furnace was cooled to room temperature within no more than 10 min. The furnace was purged using air at a flow rate of 50 mL/min.
Single-fibre tensile properties were obtained according to the method described in ASTM C1557-03. The details of the procedure utilised are described comprehensively by Yang and Thomason [15]. All fibres were mounted at a gauge length of 20 mm. After each individual fibre diameter was measured by optical microscopy, the samples were tested using an Instron 3342 universal testing machine equipped with a 10 N load cell. An extension rate of 0.3 mm/min was used in all cases. The average strength values at each condition were based on at least 20 tensile tests. All tests were carried out at room temperature and at approximately 50% relative humidity.
Elemental surface compositions (of the outermost 6 nm approximately) were determined using a Thermo ScientificTM (East Grinstead, UK) Theta Probe spectrometer. A monochromated Al Kα X-ray source (1486.6 eV) was employed for all spectra acquisitions. Survey spectra were acquired using a pass energy of 300 eV while high-resolution, core-level spectra were acquired using a Pass Energy of 50 eV. All spectra were acquired using an X-ray spot size of ~400 µm radius. Bundles of glass fibres were placed parallel to one another on the sample holder: the longitudinal axes of the fibre were aligned with the X-ray spots major axis. The insulating nature of the glass fibre samples required the utilisation of charge compensation using a low energy, electron flood gun. The charge compensation conditions were optimised for each sample individually. All spectra were charge-referenced against the C1s peak at 285 eV to correct for charging effects during acquisition. Quantitative surface chemical analyses were calculated from the high-resolution, core-level spectra following the removal of a non-linear (Shirley) background. The manufacturer’s Avantage software was employed, which incorporates the appropriate sensitivity factors and corrects for the electron energy analyser transmission function.
Glass fibre surfaces were imaged by using AFM and SEM. AFM topography images were obtained using a D3000 AFM (Bruker Nano GmbH, Karlsruhe, Germany). Height and phase data were collected in Tapping Mode® using a RTESPA-150 type tip with a cantilever spring constant of 5 N/m and a resonant frequency of approximately 300 kHz. At least two fibres were imaged for each condition and two images of approximately 3 µm × 3 µm were captured for each of these fibres. Images were obtained at a rate of 1.5 Hz with the fast scan direction being perpendicular to the longitudinal fibre axis. The roughness of each fibre surface image was quantified using root mean square (RMS) roughness, defined as the square root of mean square of the height deviation from the mean elevation plane, after removing the background curvature by polynomial fitting. All statistics generated from raw AFM data were produced using NanoScope Analysis software.
Fibres imaged by SEM were first sputter-coated with gold. Images were obtained by using a Hitachi SU6600 Field Emission SEM (FE-SEM), operated at an accelerating voltage of 15 kV and an extraction voltage of 1.8 kV. The fibre fracture surfaces were imaged perpendicular to the fracture face, but they were sputter-coated with it parallel to the target, in order to minimise the thickness of the coating deposited, and thus to reduce potential obscuring of surface features.
3. Results
3.1. Tensile Strength of Heat-Treated Fibres
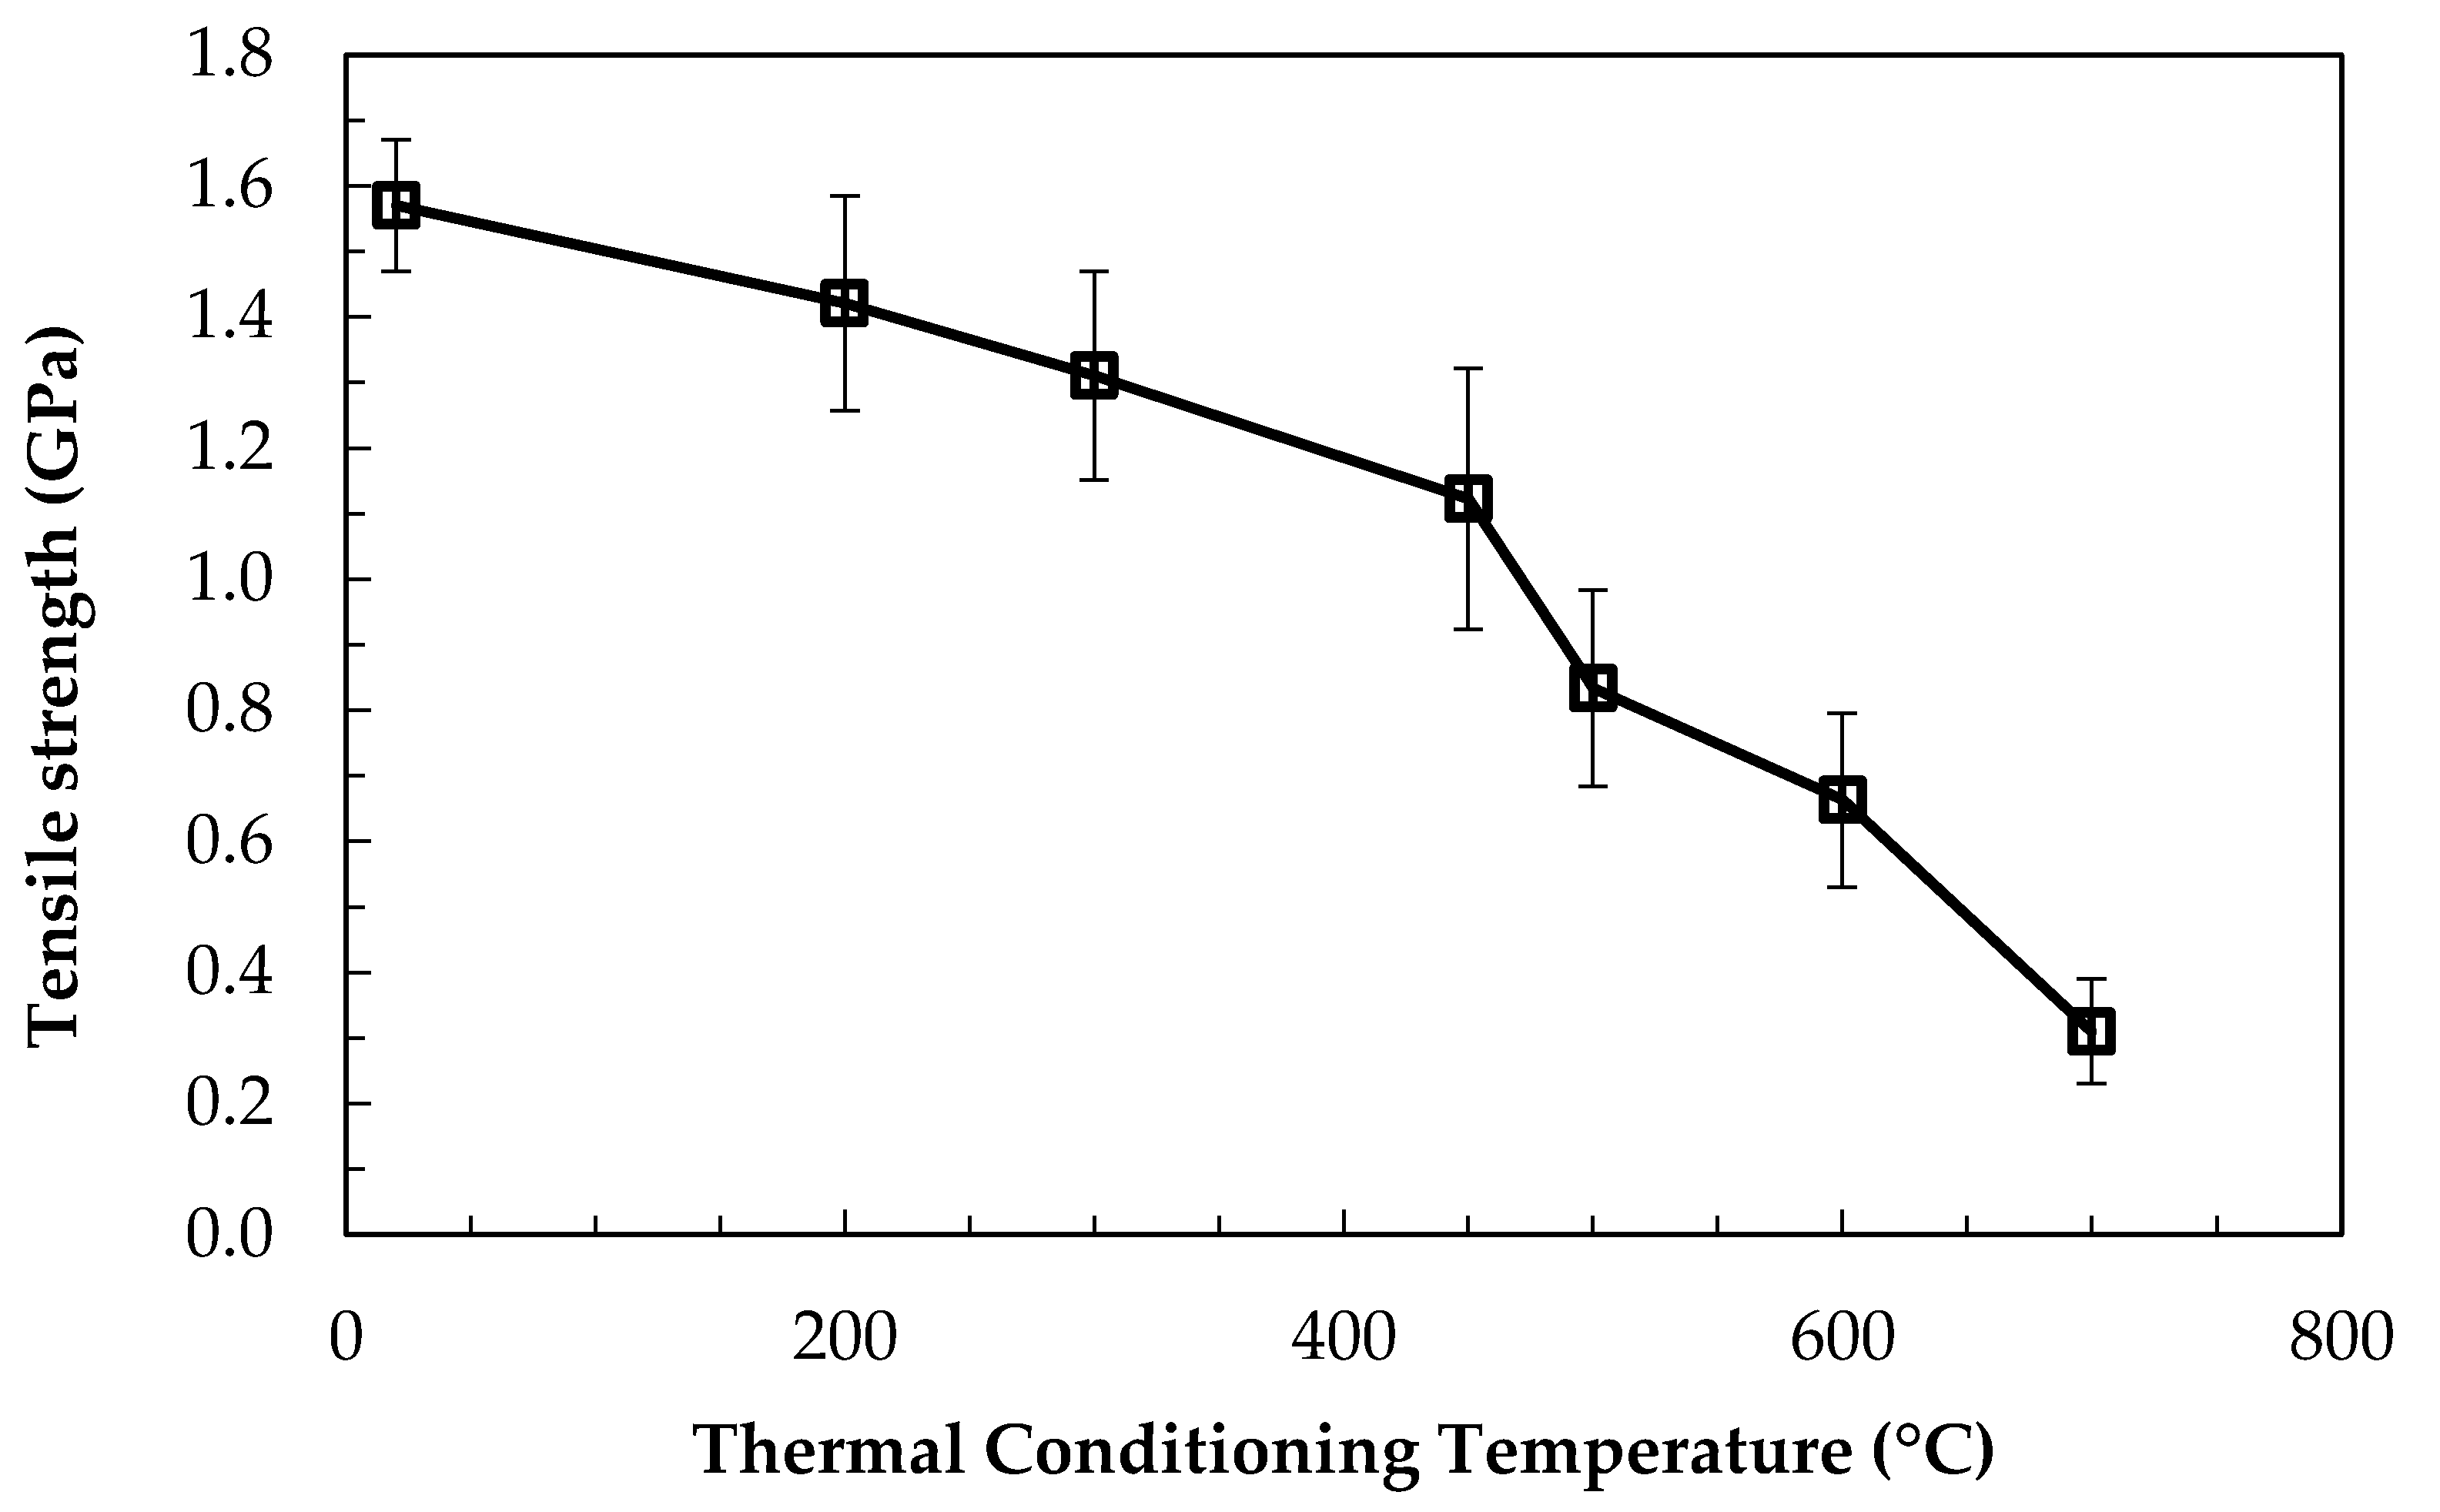
Bare fibres were heat-treated in a furnace, using the method described, at temperatures between 200–700 °C. The average single-fibre tensile strengths (error bars show 95% confidence limits) measured at room temperature following heat treatment are presented in Figure 1.
A trend of strength loss with increasing thermal conditioning temperature was found. A temperature of 300 °C was required for a significant decrease with respect to the initial strength of the fibres to occur, as measured by 95% confidence limits. The most significant strength loss occurred when the conditioning temperature exceeded 450 °C: after treatment at 500, 600, and 700 °C approximately 50, 40, and 20%, respectively, of the initial strength remained.
The strength values in Figure 1 represent the average of at least 20 individual tensile tests, with the exception of the data point at 700 °C. The retained strength of these heat treated fibres was very low, and it approaches the lower limit that was possible to measure when using the standard method. Many fibres break before testing at the points at which they are glued to tensile card templates; they are unable to withstand the minimal bending and twisting stresses related to the cutting of the card template that allows the fibre to bear load during testing. Additionally, some fibres failed at the edge of the gauge length, rather than in the middle portion. This is also likely to be attributable to slight bending at the beginning of the test as tension is first applied to the fibre. The standard practice is to discount such tests from the final analysis, as it is presumed that their inclusion causes an under-estimation of the average fibre strength.
3.2. X-Ray Photoelectron Spectroscopy
XPS spectra were collected for untreated bare glass fibres, and for those heat-treated at the temperatures of most interest with respect to fundamental strength loss: a range of 450–600 °C was selected. Two individual series of data (ser1, ser2) were obtained using new samples each time, with approximately one month between the collections of the series. The major elemental components identified, in addition to carbon from contamination, were oxygen, silicon, calcium, aluminium, magnesium and sodium. All results, given as elemental atomic percentages (at. %), have been corrected against the carbon content of the individual samples: carbon exists only as a contaminant, and it should not be present in bare glass samples either at the surface or in the bulk. The two series of data were averaged and the results are shown in Table 1. The degree of repeatability between the two series of measurements was generally high: for major glass constituents, the individual values deviated by only a few percent from the average. The results for minor constituents such as Na or Mg were, at times, much less repeatable, and at some treatment temperatures, they deviated from the average by 25–50%. This may have been caused by the difficulty in accurately quantifying them from the XPS scan data.
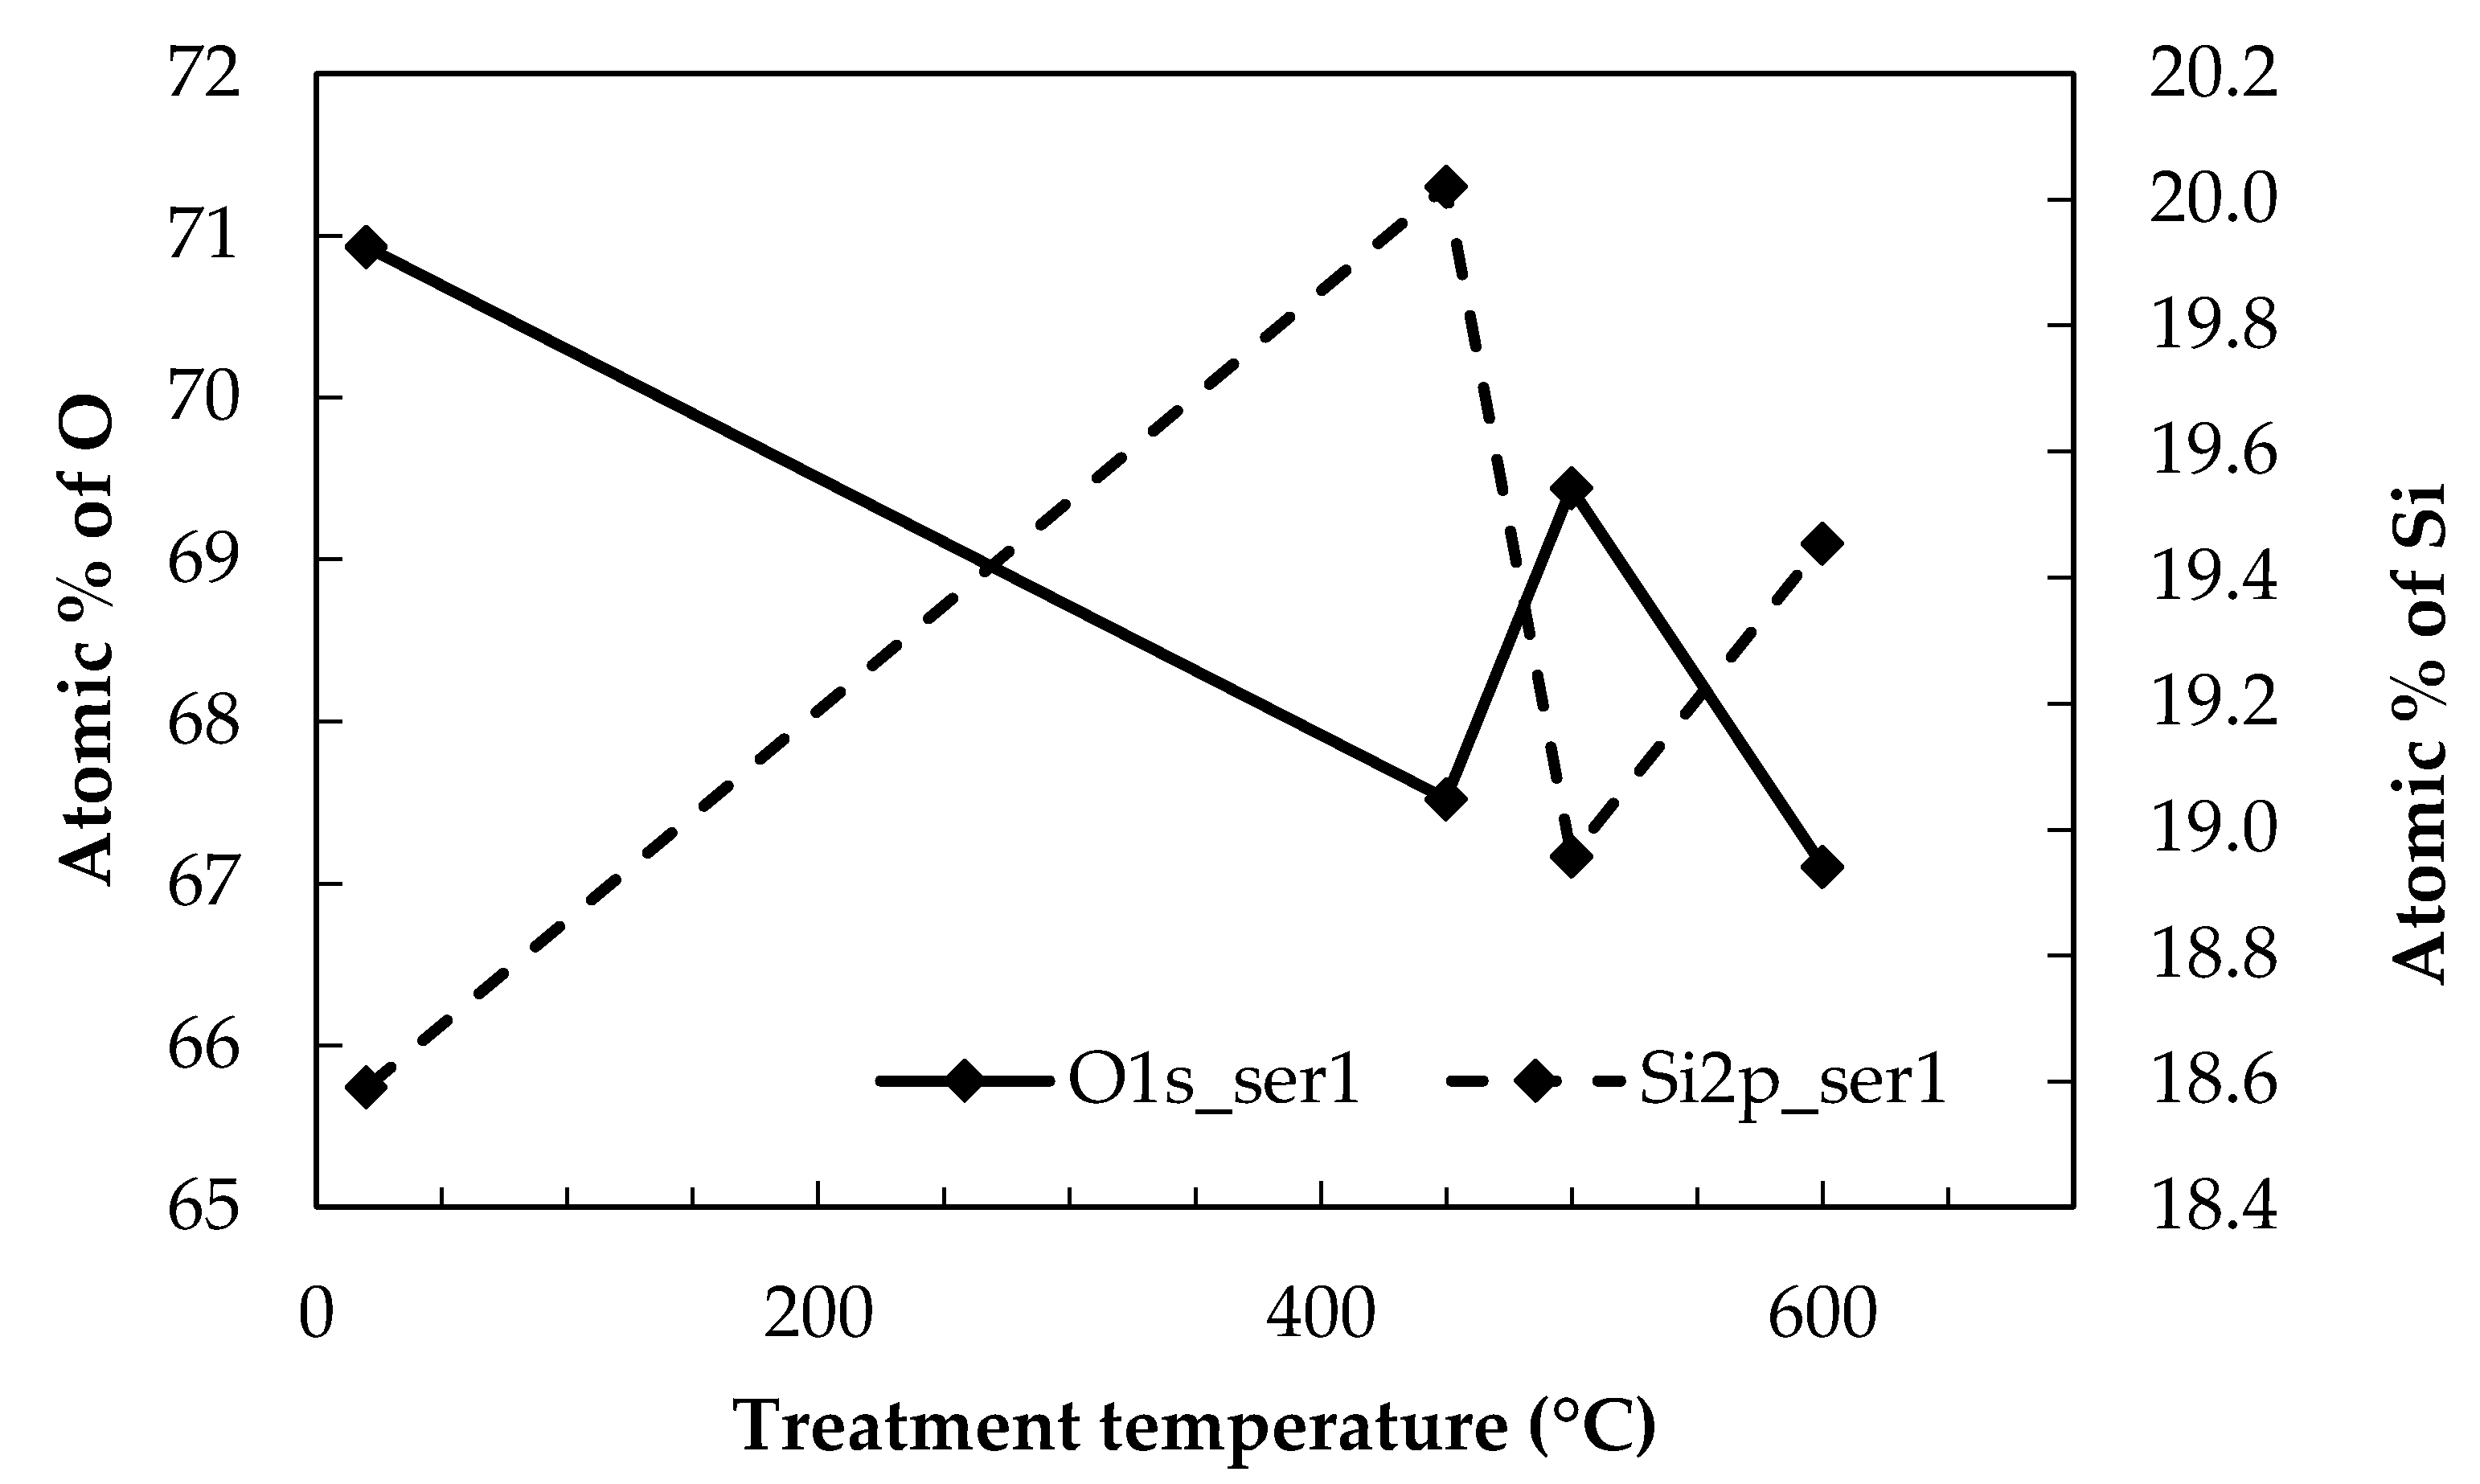
It was found that the variability in Si and O, the two constituents with the highest at. %, were inter-related. The data in Figure 2 show that when the at. % of oxygen increased, for example, from 450 to 500 °C, there was a corresponding decrease in the at. % of Si. It is probable that changes in oxygen content, due to differing surface contamination levels between samples, exert an influence over other constituent elements, which all have significantly lower at. %
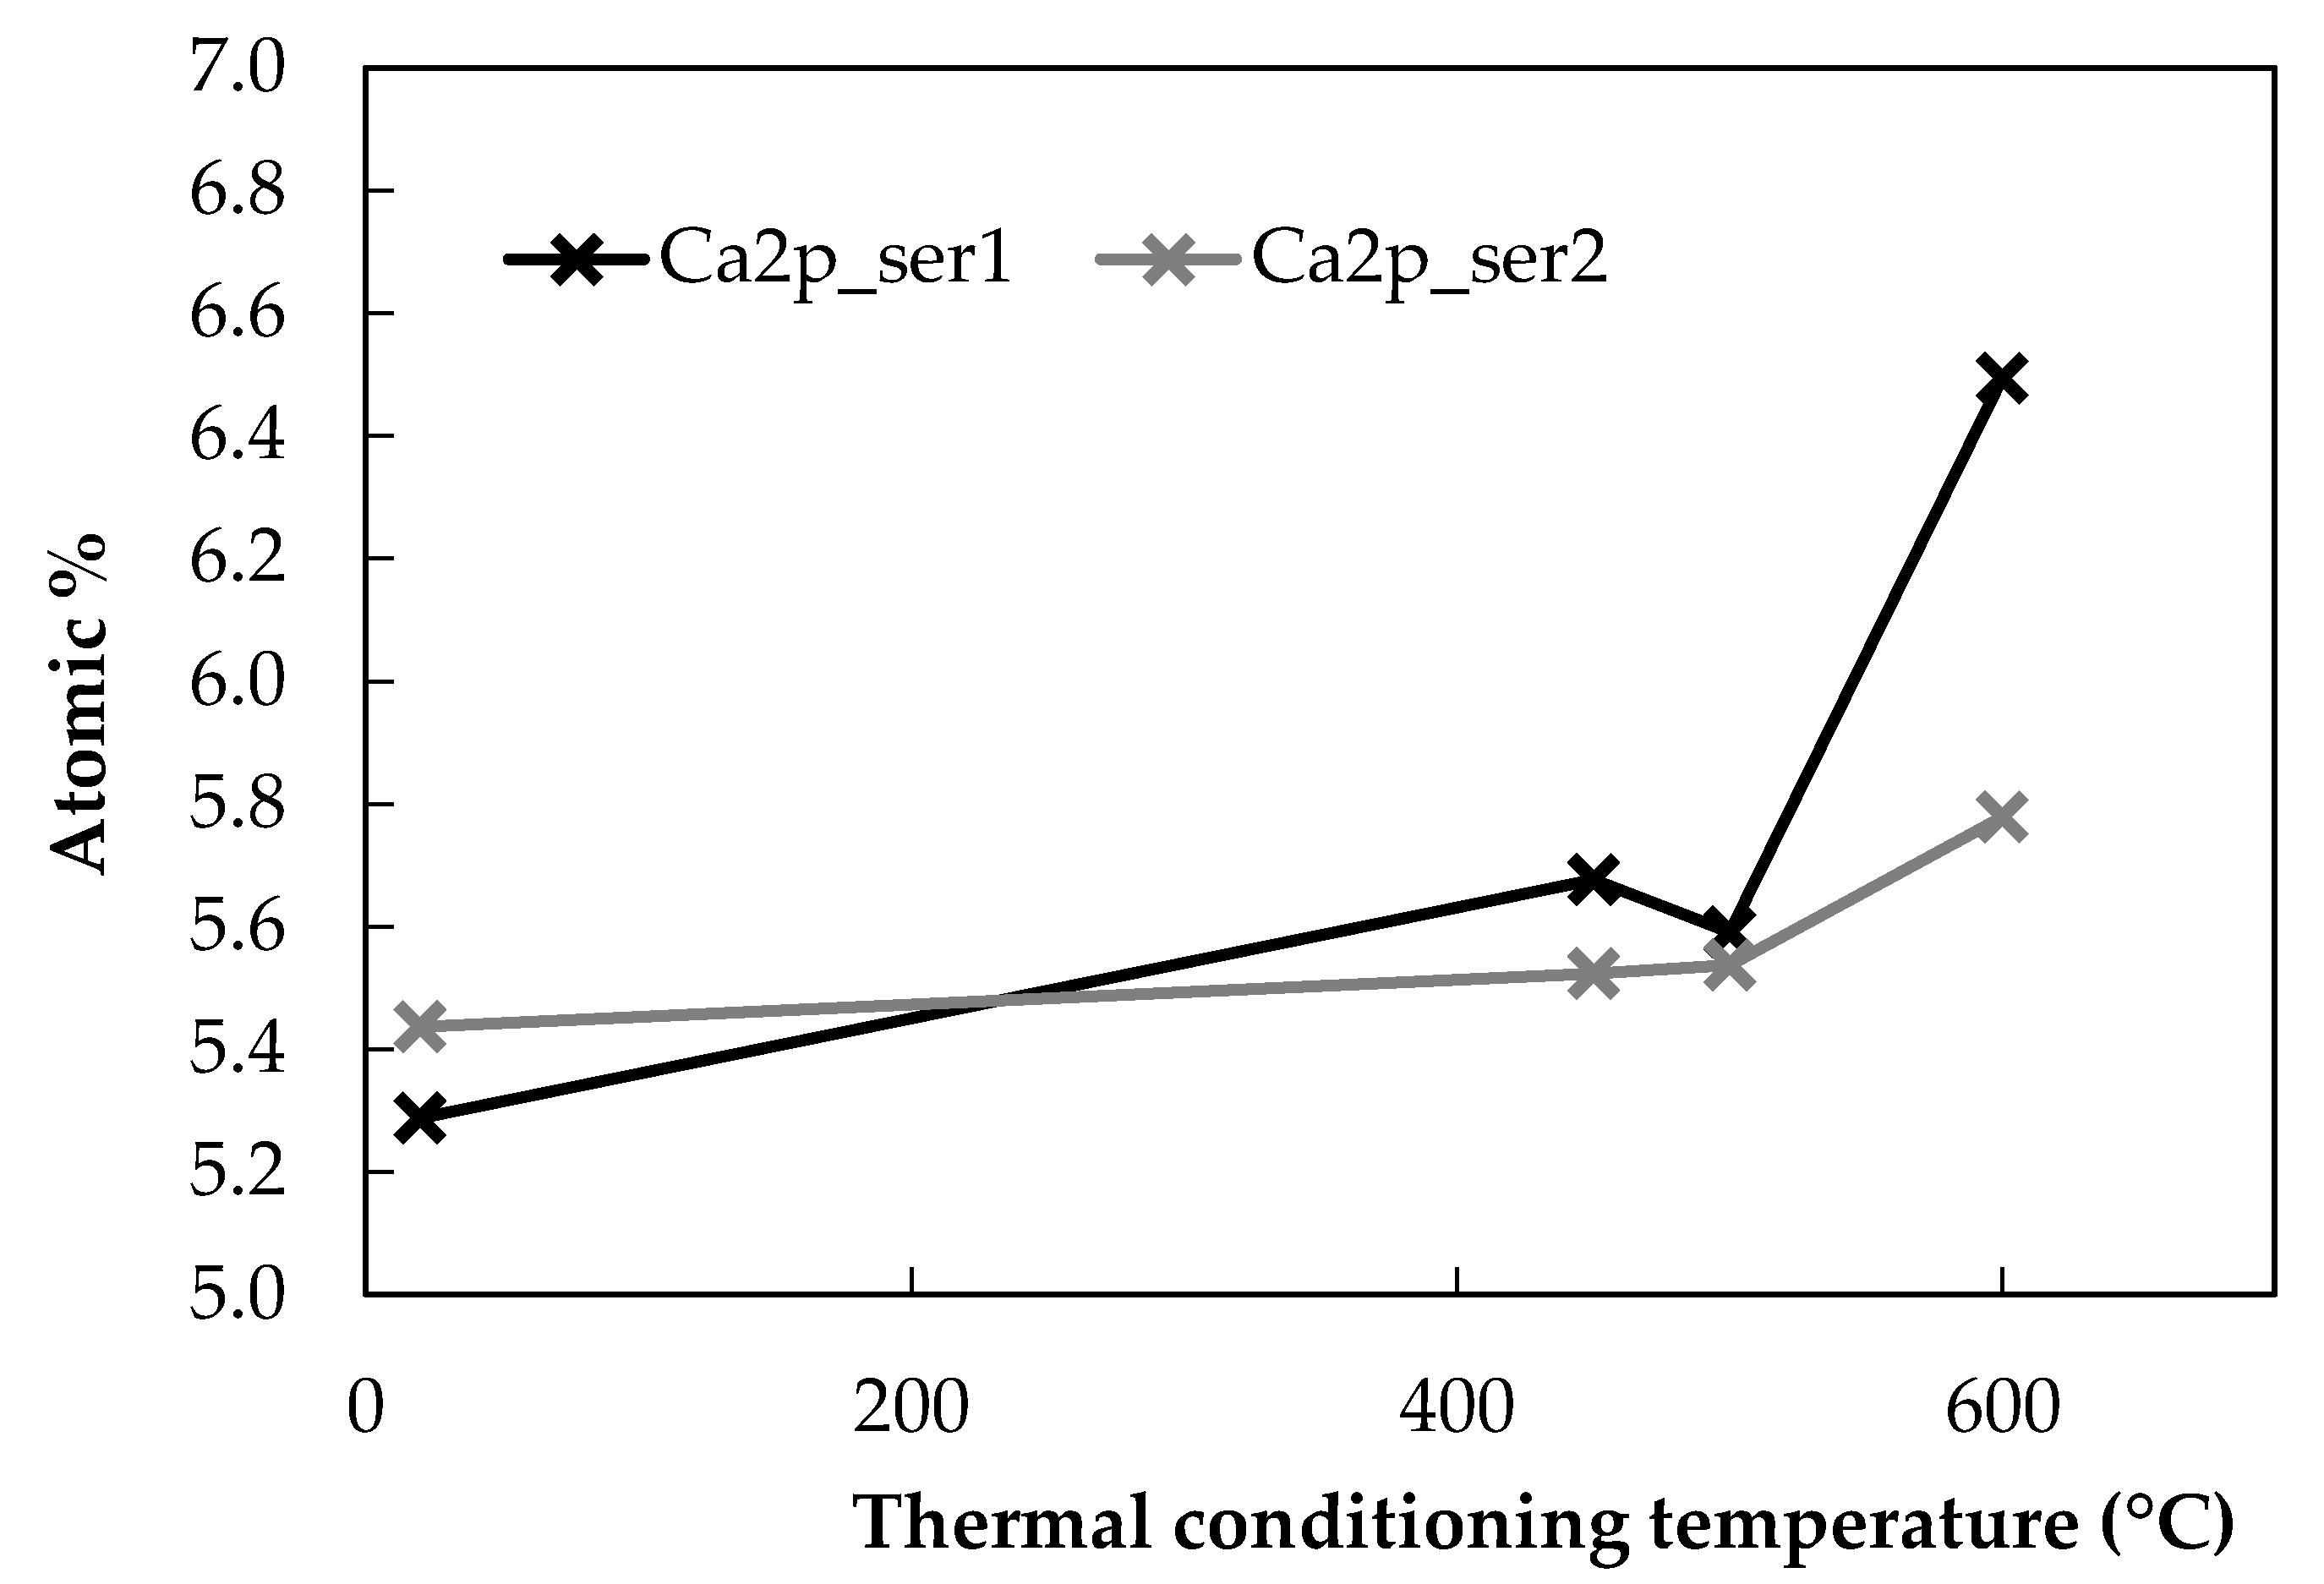
In contrast to the other elements measured in the analysis, Ca demonstrated a relatively consistent trend with the conditioning temperature, as shown in Figure 3. In each of the series of measurements carried out, an increase in Ca at the fibre surface was observed after conditioning at 600 °C, while its at. % was largely stable throughout the rest of the temperature range investigated. The increase was more pronounced in the first series than the second.
3.3. Atomic Force Microscopy
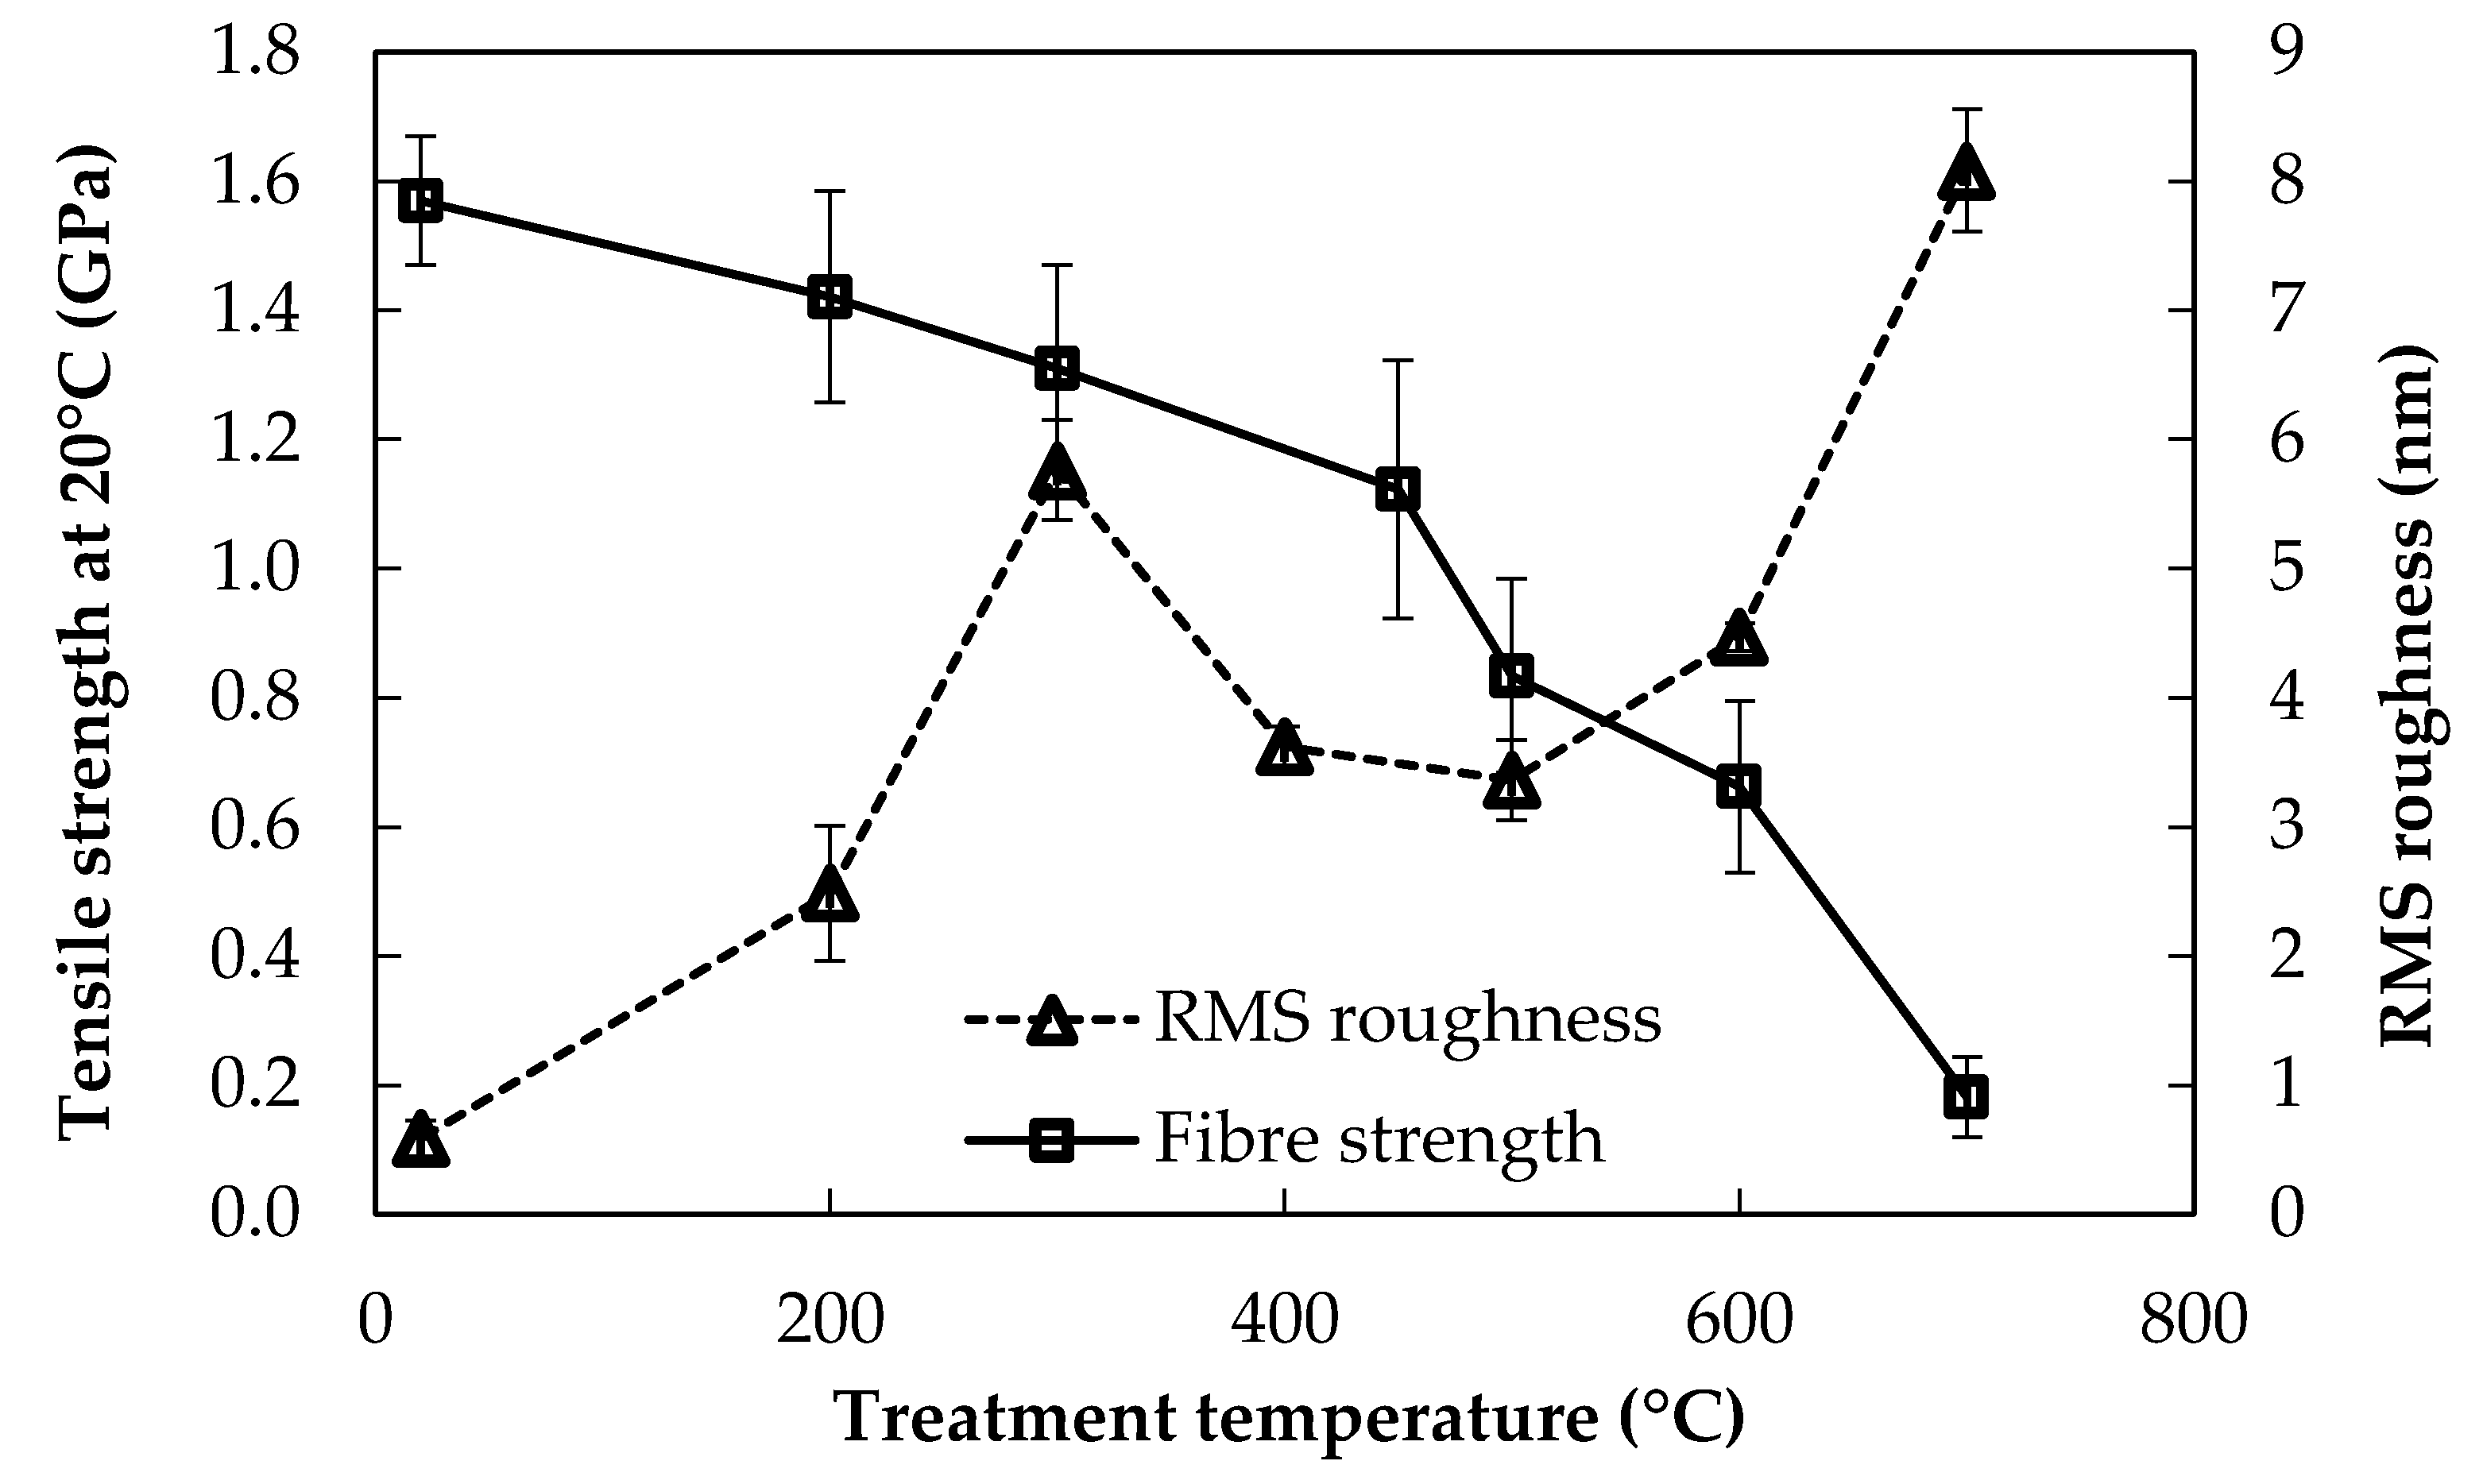
The average RMS roughness of bare E-glass fibres is presented in Figure 4, alongside the strength-loss behaviour of the fibres from Figure 1.
It was observed that fibre surface roughness increased with increasing conditioning temperature, while fibre strength decreased. Aside from this general trend, the correlation between these data was not close. For example, surface roughness increased significantly following treatment to only 200 °C, whereas fibre strength was not significantly different from the baseline value at these low treatment temperatures. The region of most significant strength loss occurred for conditioning temperatures in excess of 450 °C: of the total strength loss between room temperature and 600 °C, around 50% of the loss occurred between 450–600 °C. Over a similar range of thermal conditioning temperature from 400–600 °C, there was only a relatively small increase, however, in RMS roughness. A close inverse correlation between the retained tensile strength and the surface roughness was observed at the higher end of the conditioning temperatures investigated between 500–700 °C. Fibre strengths decreased precipitously, while the fibre surface roughness increased very rapidly, more than doubling from 500 to 700 °C.
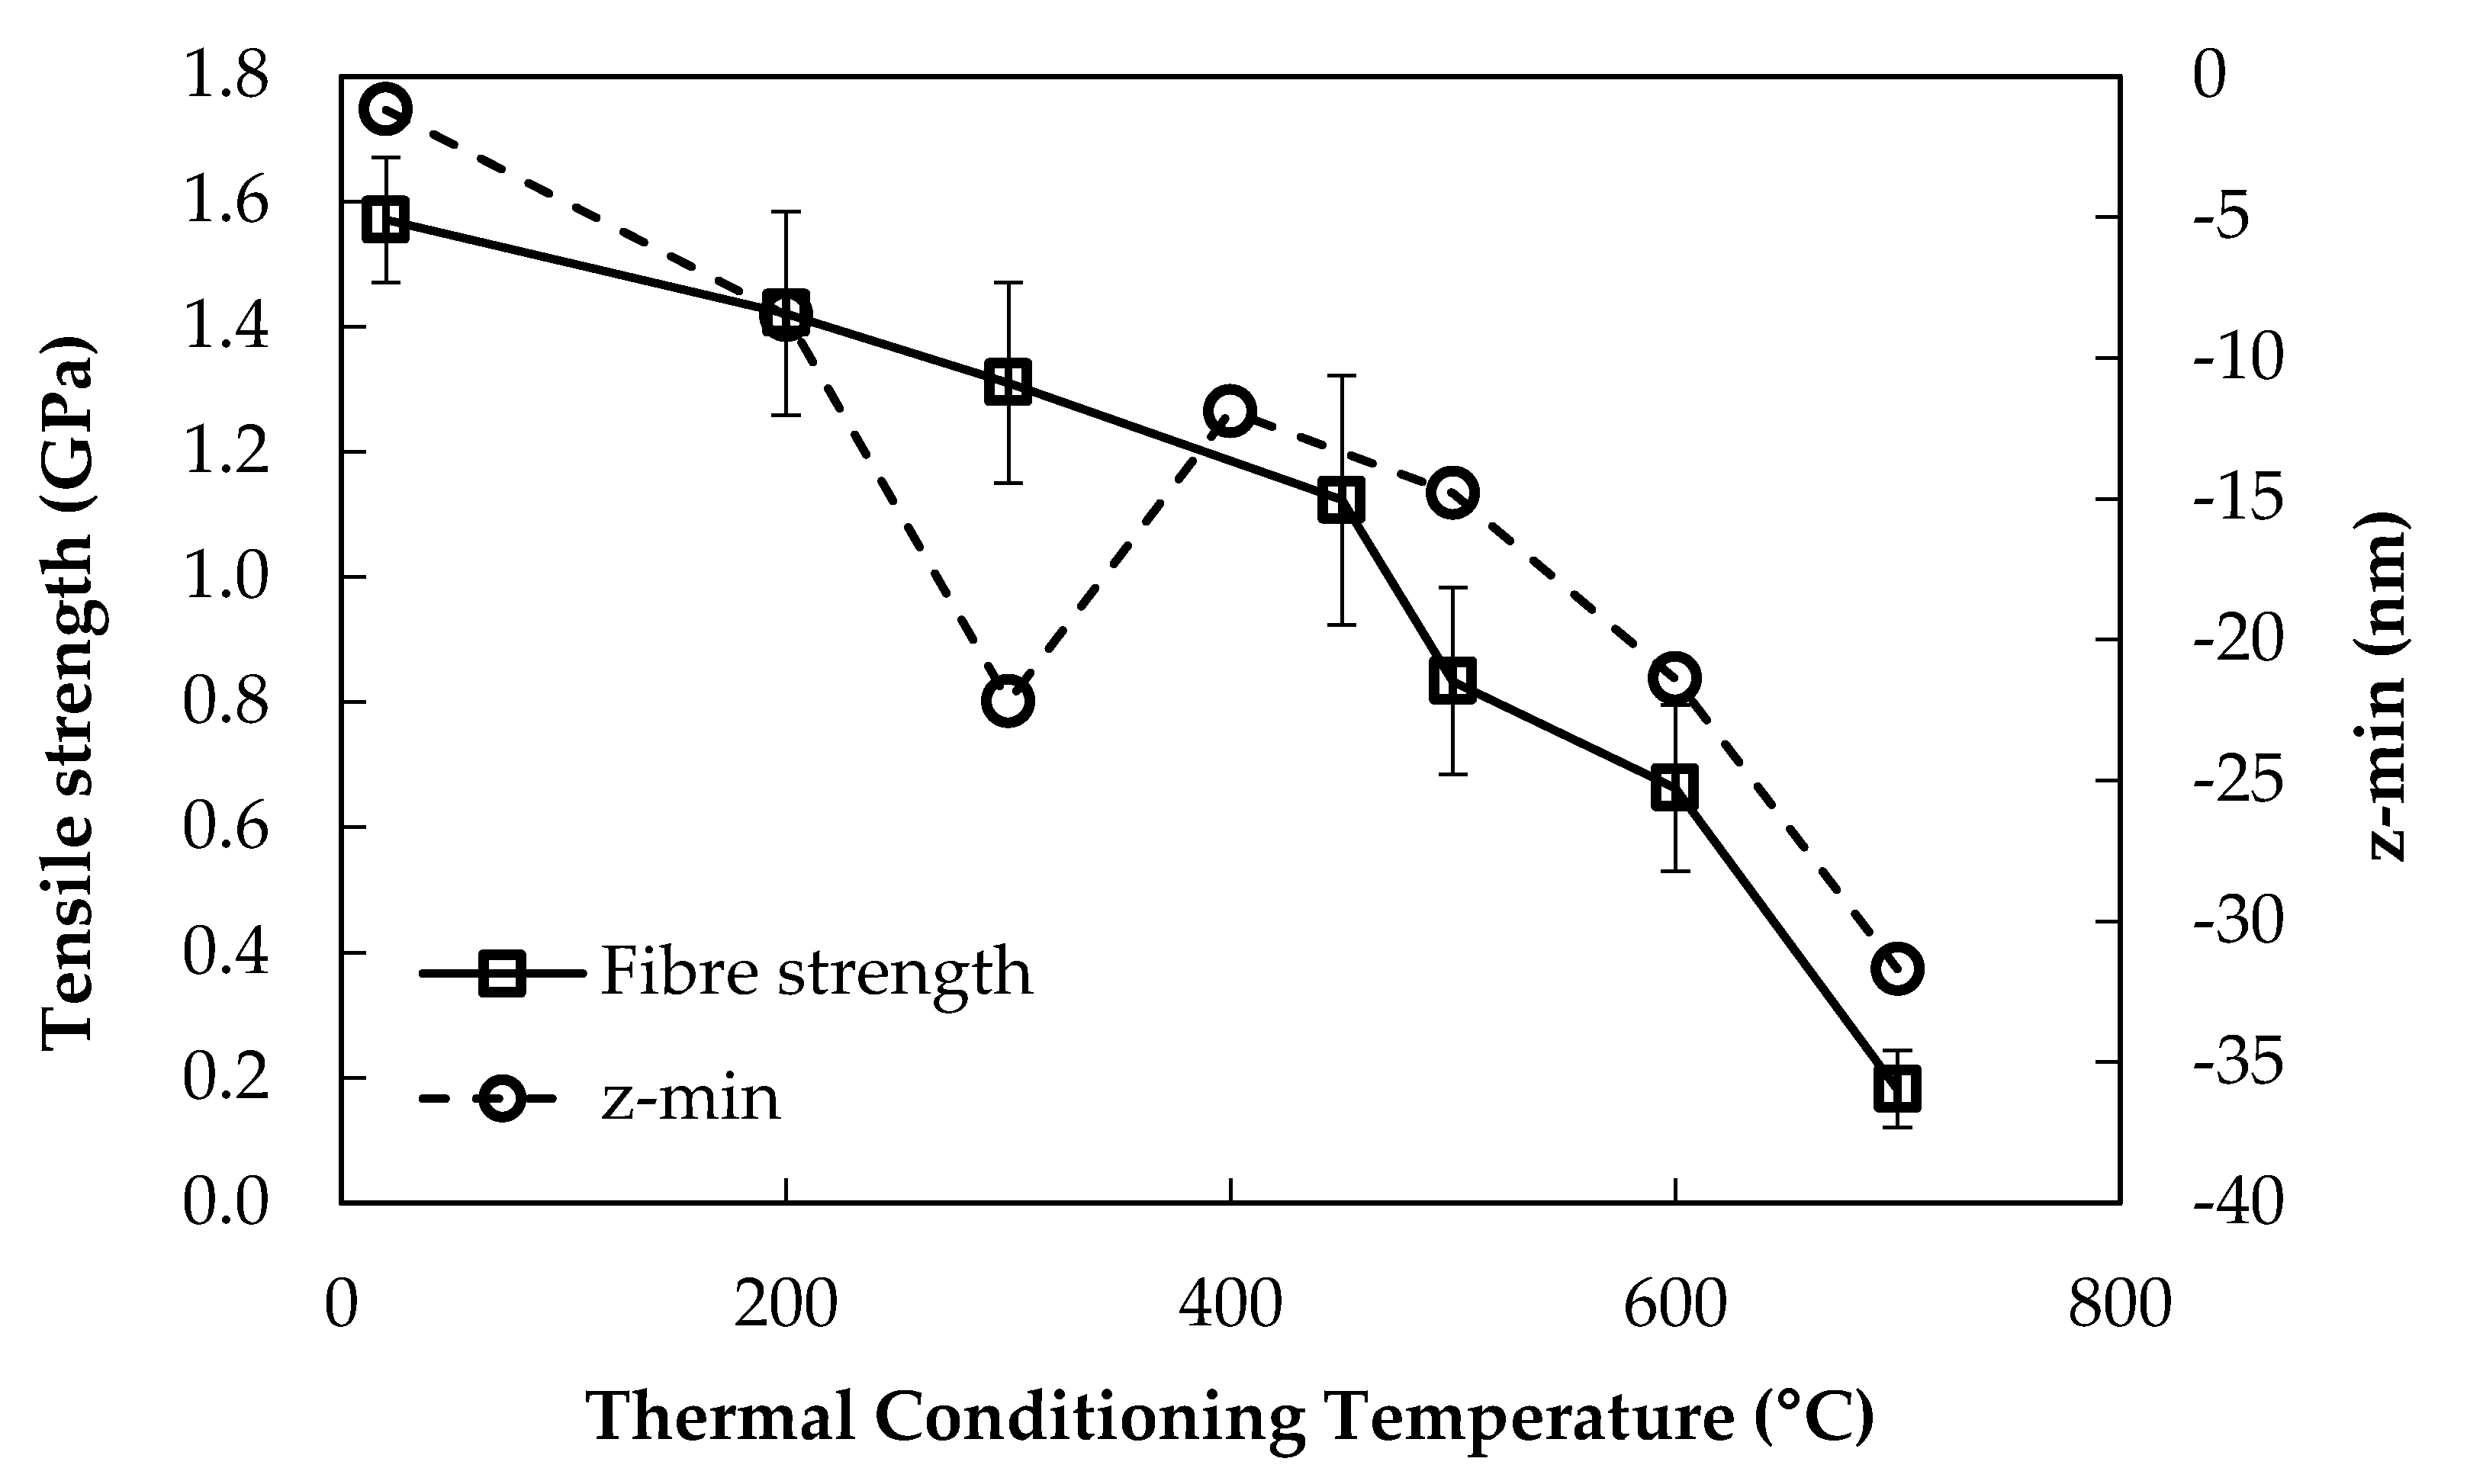
If, instead of RMS roughness, the maximum depth below the z = 0 plane (labelled z-min) was plotted against the heat treatment temperature, the graph obtained was approximately the inverse. It should be noted that the values of zmin were obtained directly from the raw topographical data. The z = 0 plane is established automatically by the Nanoscope software after polynomial fitting, and it lies at the mean of all of the height data points. The values of zmin represent the deepest flaws, pits or slots at the fibre surface that could be detected. These data are plotted with the retained fibre tensile strength in Figure 5.
The data in Figure 5 show that the trend for the average zmin of topography at each treatment temperature correlated relatively well at higher treatment temperatures with fibre strength loss, but there was an obvious disparity at 300 °C. The decrease in zmin between 400–500 °C was only relatively small in comparison, with a significant decrease in fibre strength over the same temperature range.
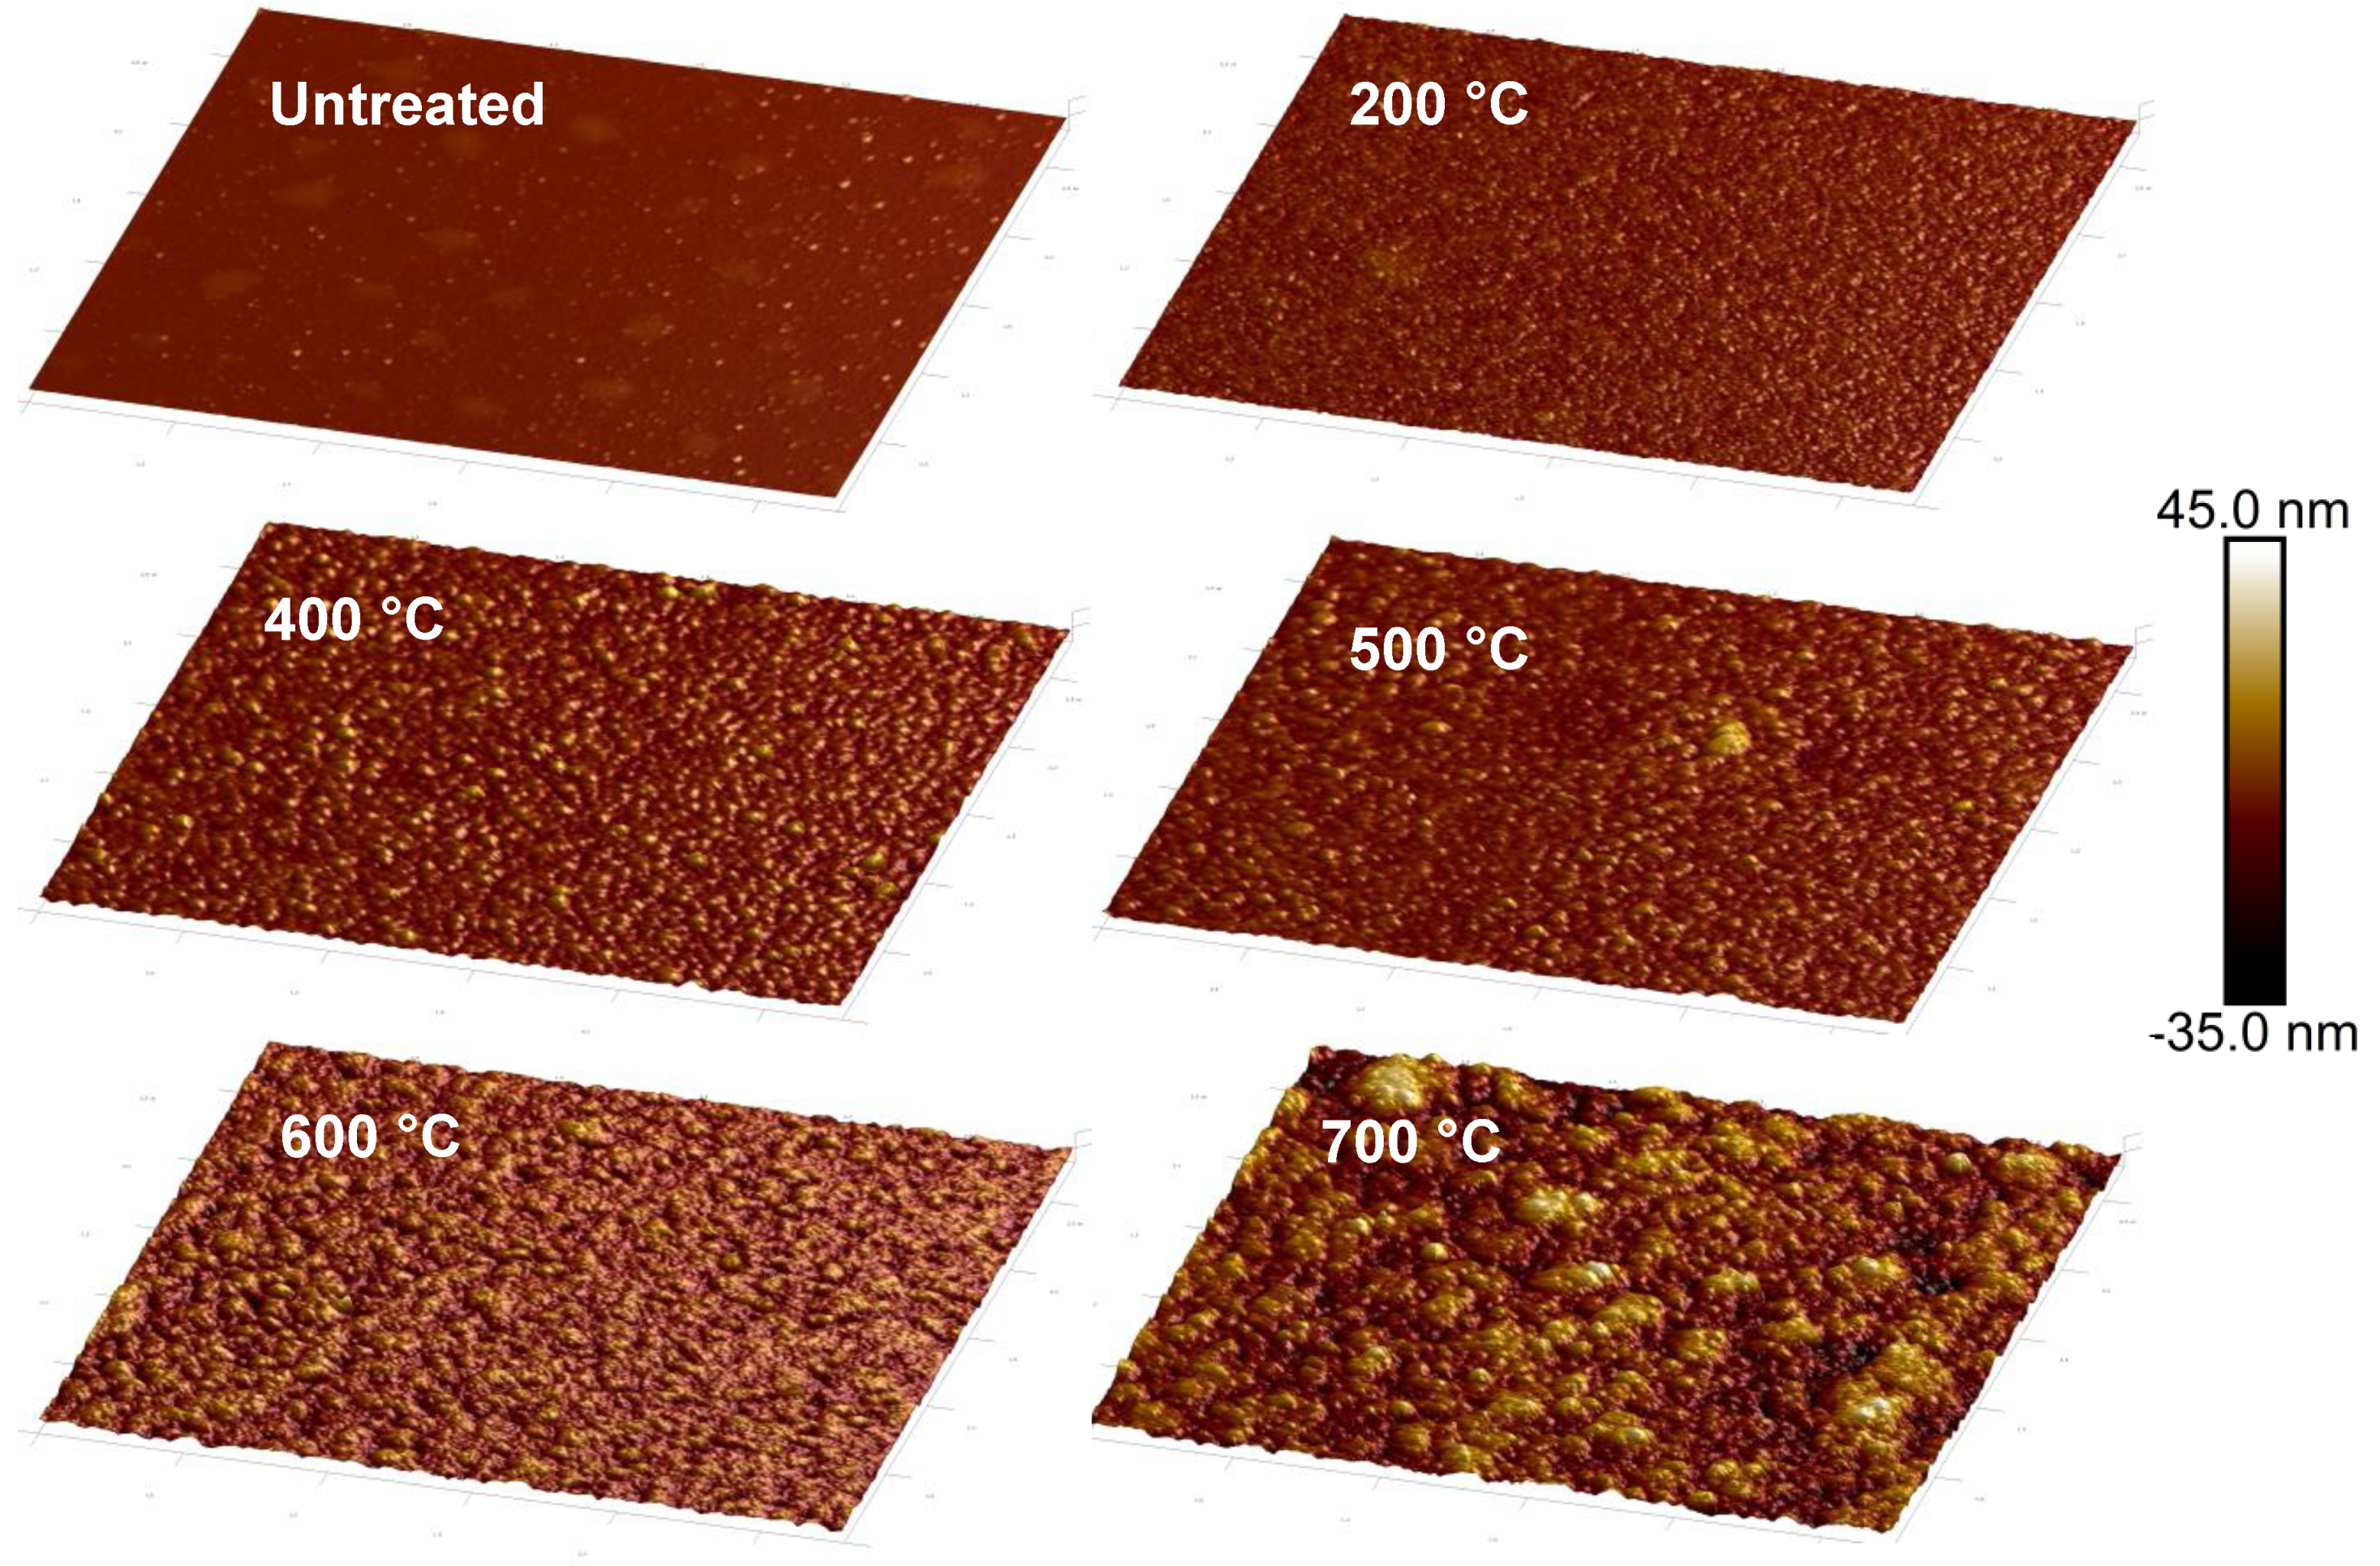
The changes in surface topography observed using AFM were relatively consistent at each conditioning temperature. Examples of some typical topography plots are given in Figure 6.
The surface of untreated fibres was mostly flat, but two types of surface features were observed. Raised circular or ovoid areas of between 100–200 nm in diameter were found; phase plots indicated that these were part of the glass and not a contaminant on the surface. Very small contaminant particles of no more than a few tens of nm in size, identified by a clear phase contrast with the glass, covered the surfaces of all samples. The heat treatment process appeared to remove these contaminant particles. Changes to the surface topography as the roughness increased were generally homogenous across the surface of fibres: Figure 6 shows the typical topographic plots of fibres thermally conditioned between 200 to 700 °C. The additional images obtained at each conditioning temperature were similar to those presented; this was reflected in the size of the error bars in Figure 4, as the average roughness was calculated using all of the available topography data.
After thermal conditioning at only 200 °C, the fibre surface changed completely in comparison to the untreated fibre. A uniform textured appearance was observed, and the maximum height in the z-direction almost doubled in comparison to the untreated fibres. It is possible that this new rougher surface structure obscured the circular mounds that were previously found, but this was not tested. Alternatively, these features could also be a product of some surface contamination that was removed when the fibres were thermally conditioned. This explanation, however, seems less likely, as the mounds were not discernible in the AFM phase data, suggesting that they have similar mechanical properties to the glass surface.
As all of the topography plots in Figure 6 are presented using the same z-scale, the progressive increase in z-range that corresponds with increasing roughness through the range of conditioning temperatures can be clearly observed. Approaching the critical temperature range for strength loss at 400 and 500 °C, the fibre topography was mostly unchanged, reflecting the constant roughness. The surface of the fibres, particularly those conditioned at 400 °C, showed the development of numerous small but well-defined peaks measuring approximately 50–70 nm in the x–y plane. At the highest conditioning temperatures of 600–700 °C, individual peaks were no longer visible, and the entire fibre surface instead appeared to be mottled. The average z-range of the analysed areas increased by almost an order of magnitude from the initially untreated fibres to those conditioned at 700 °C.
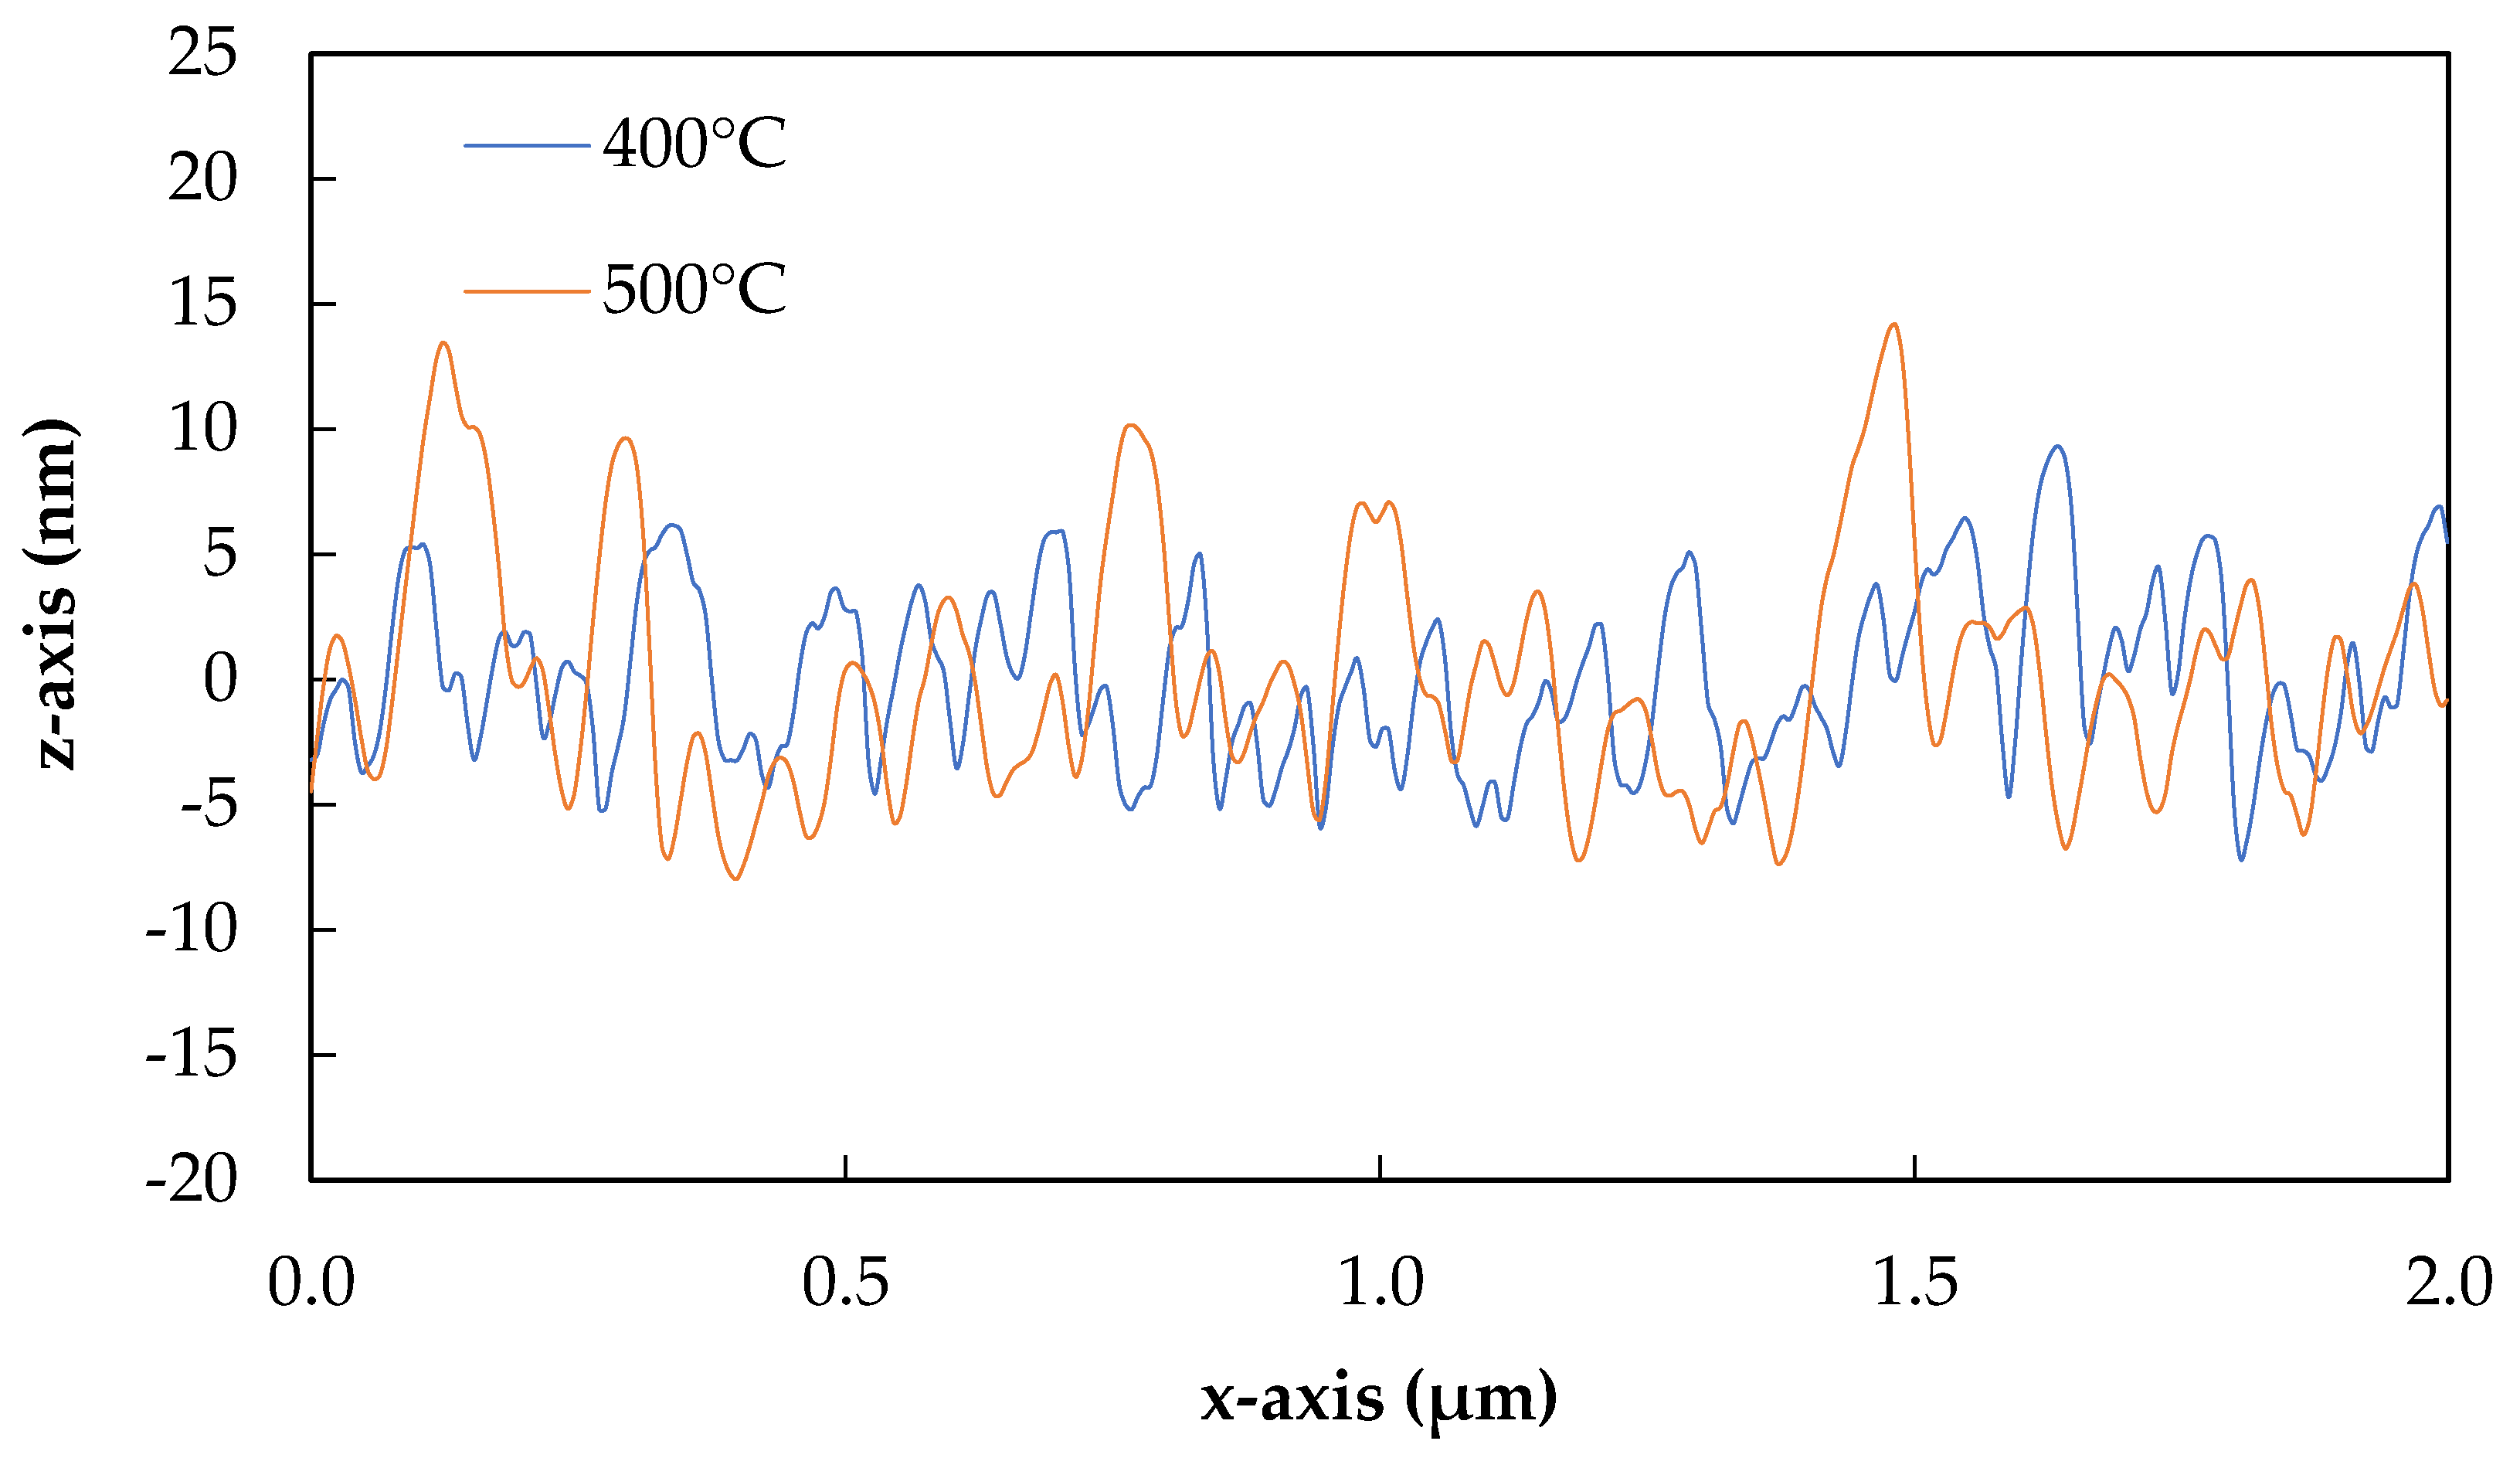
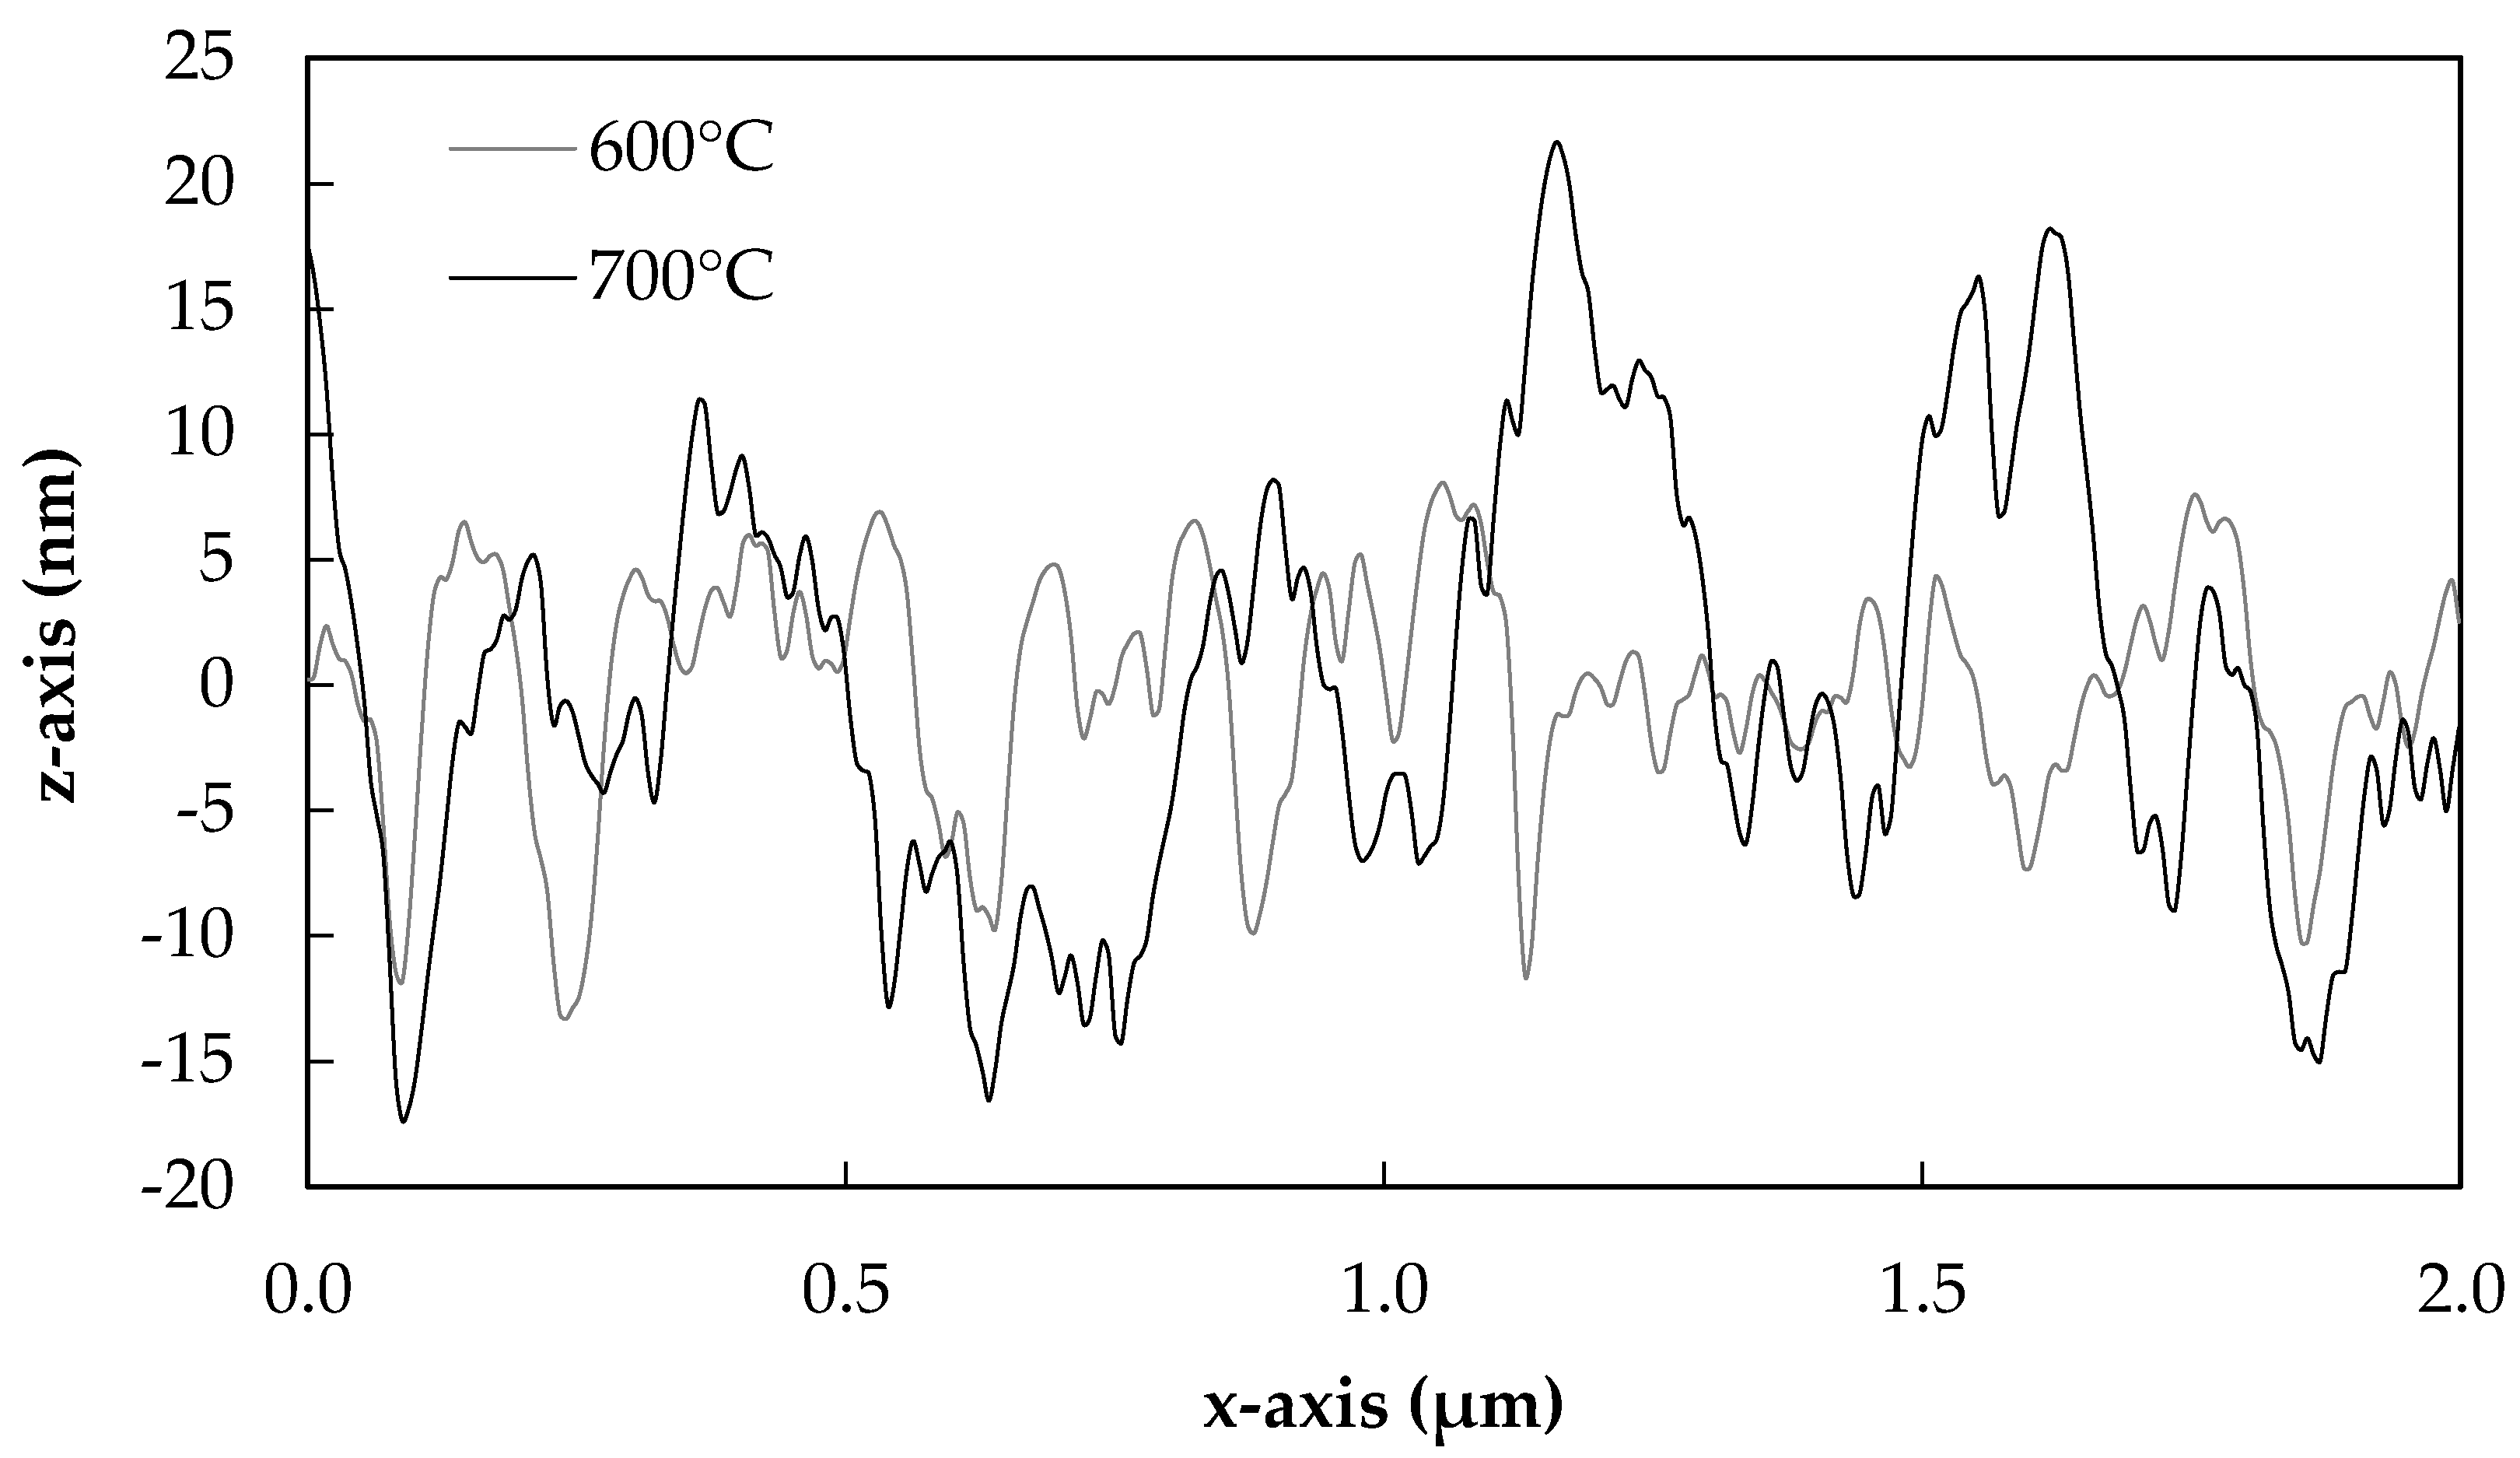
Extracted from typical topography plots, 2D line sections from fibres heat-treated at 400, 500, 600 and 700 °C are presented in Figure 7 and Figure 8.
The slight differences in the surface morphologies of fibres treated at 400 and 500 °C can be more clearly observed in Figure 7. A greater number of smaller peaks were observed for 400 °C treated fibres than 500 °C, although the heights of these were approximately the same overall. Fibres treated at 600 °C began to lose smaller well-defined peaks, as can be seen in Figure 8, and this process was clearer yet for fibres treated at 700 °C. In this latter case, the peaks appeared to further coalesce together in groups, and the heights of the features again increased significantly.
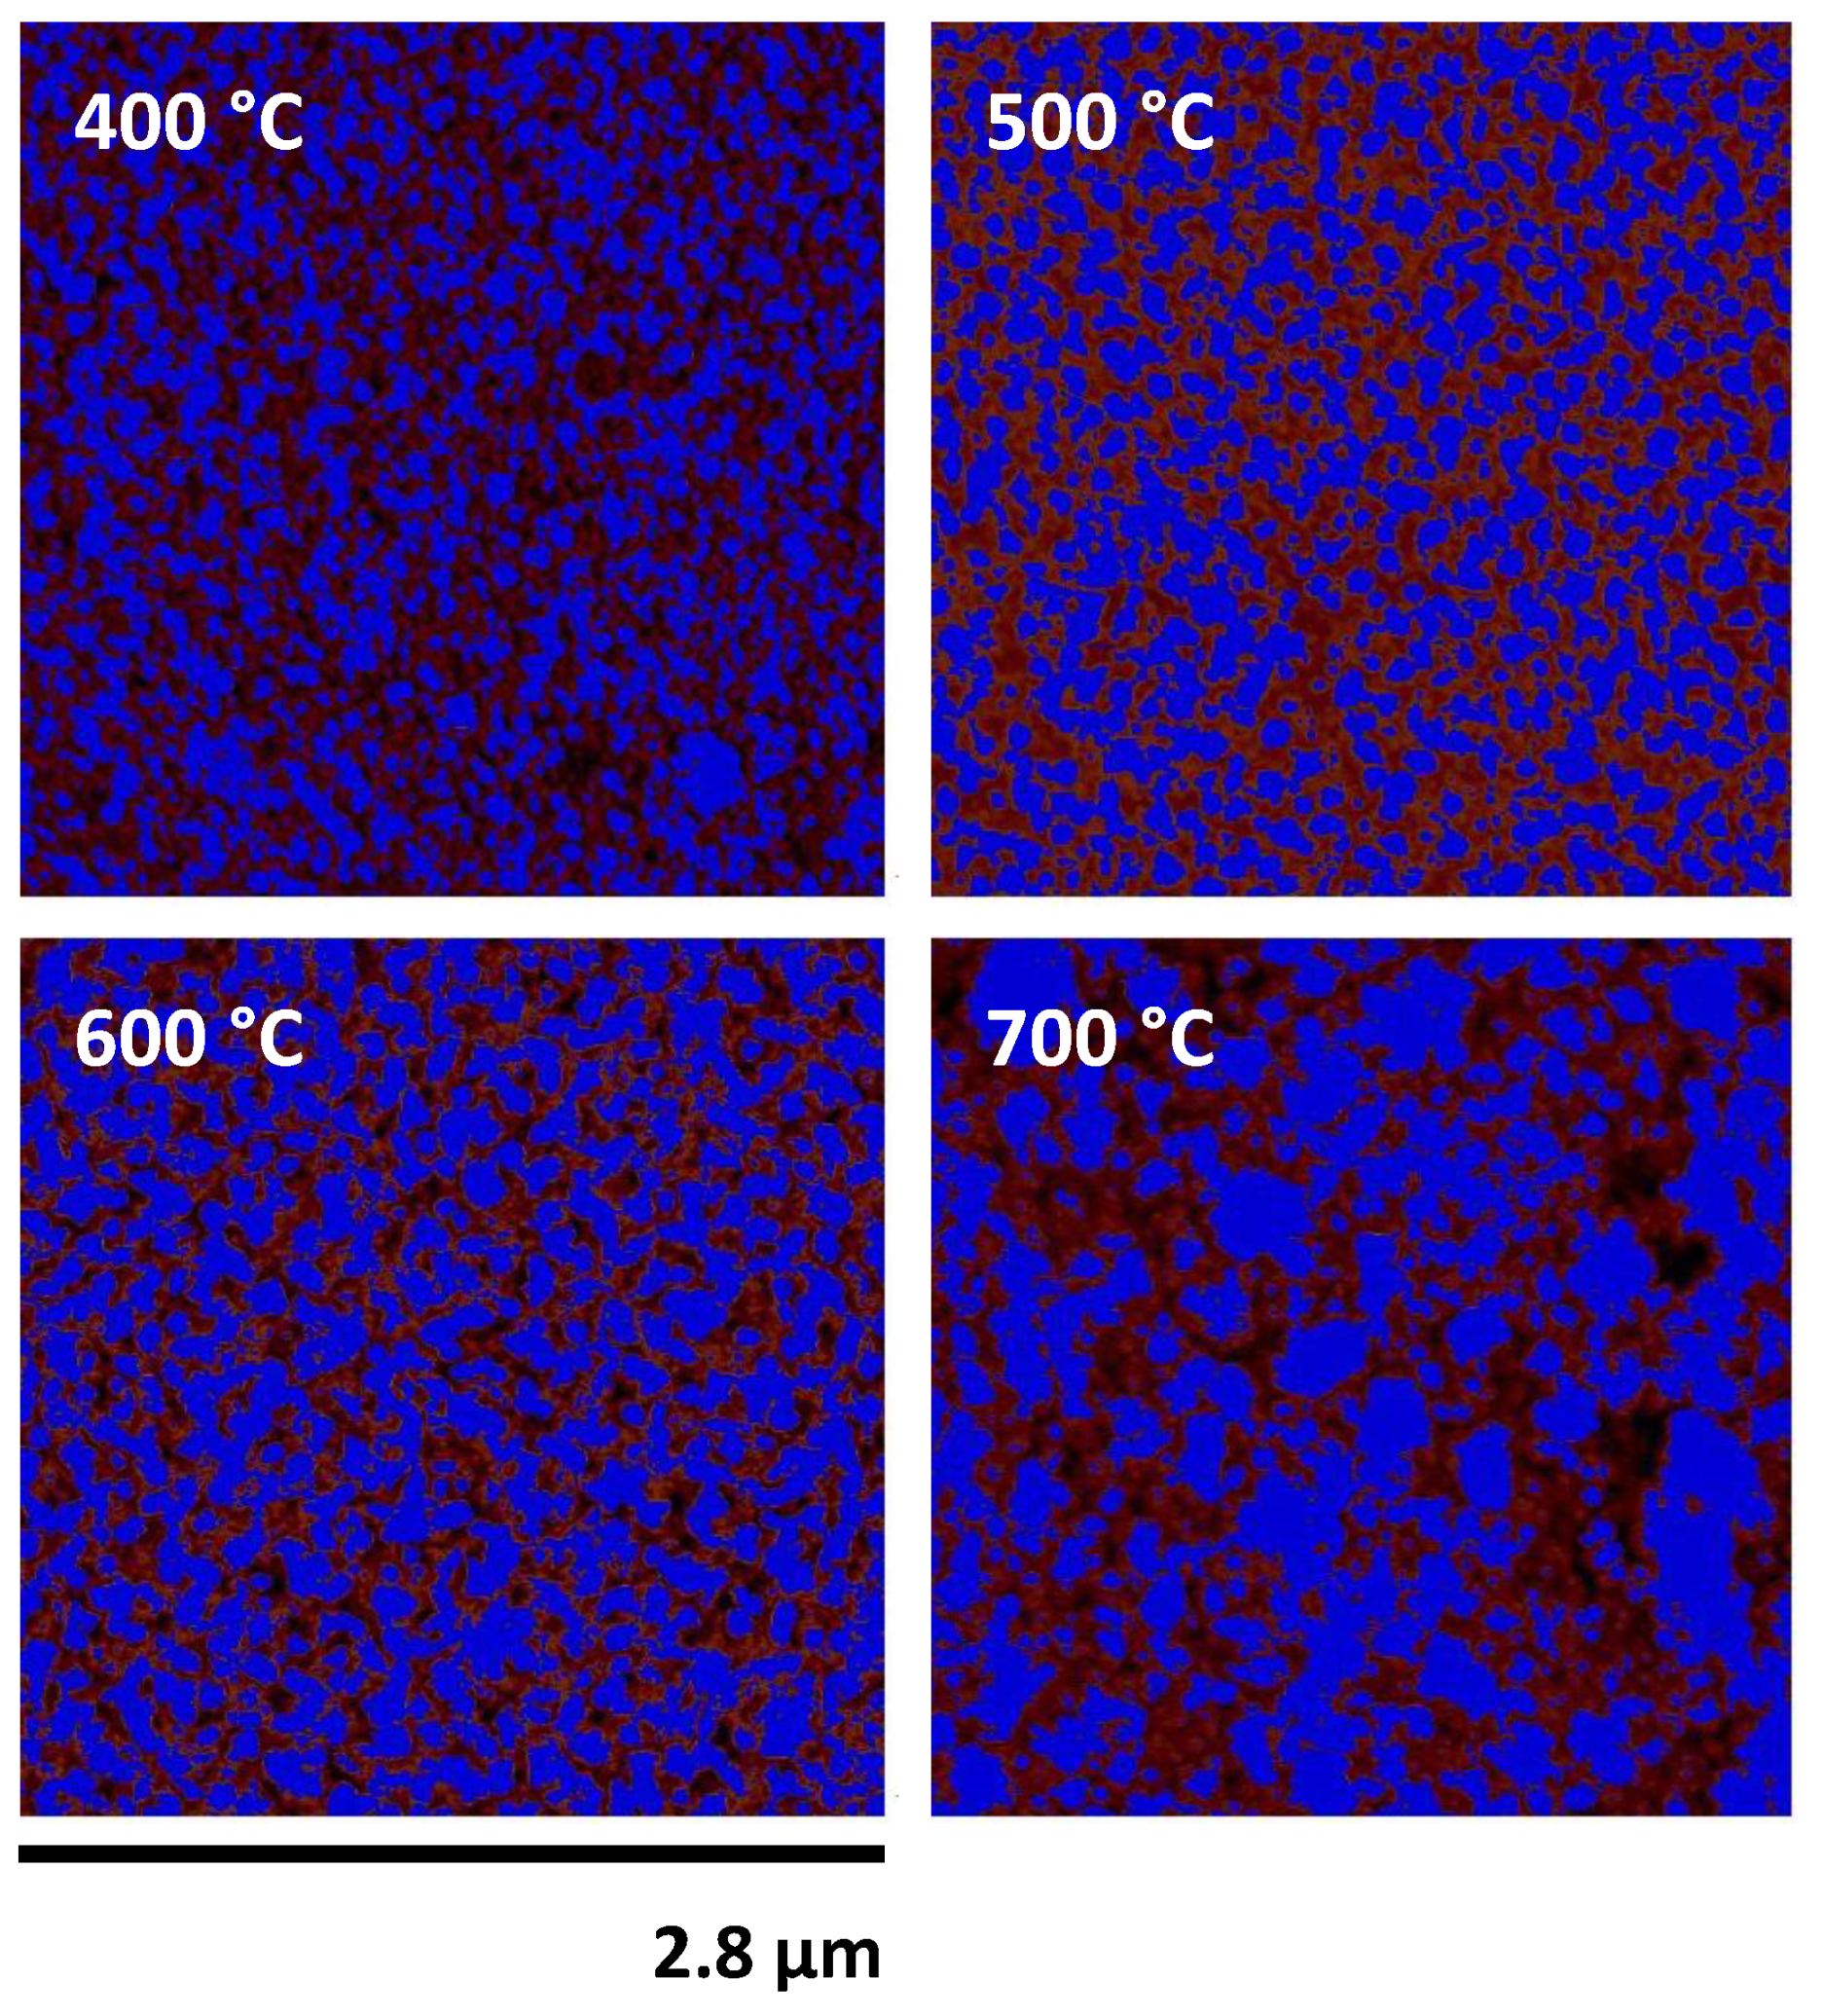
An estimate of the total surface area covered by the developing surface topography was obtained by using the built-in capabilities of NanoScope Analysis. The half-height of each topographical image was calculated by using the raw data, after the exclusion of features due to surface contamination, using the simple equation ½(zmax − zmin). A mask was placed at this height, and the surface coverage of the features lying above the mask was measured. A selection of heat-treated fibres with these features identified by the software is shown in Figure 9.
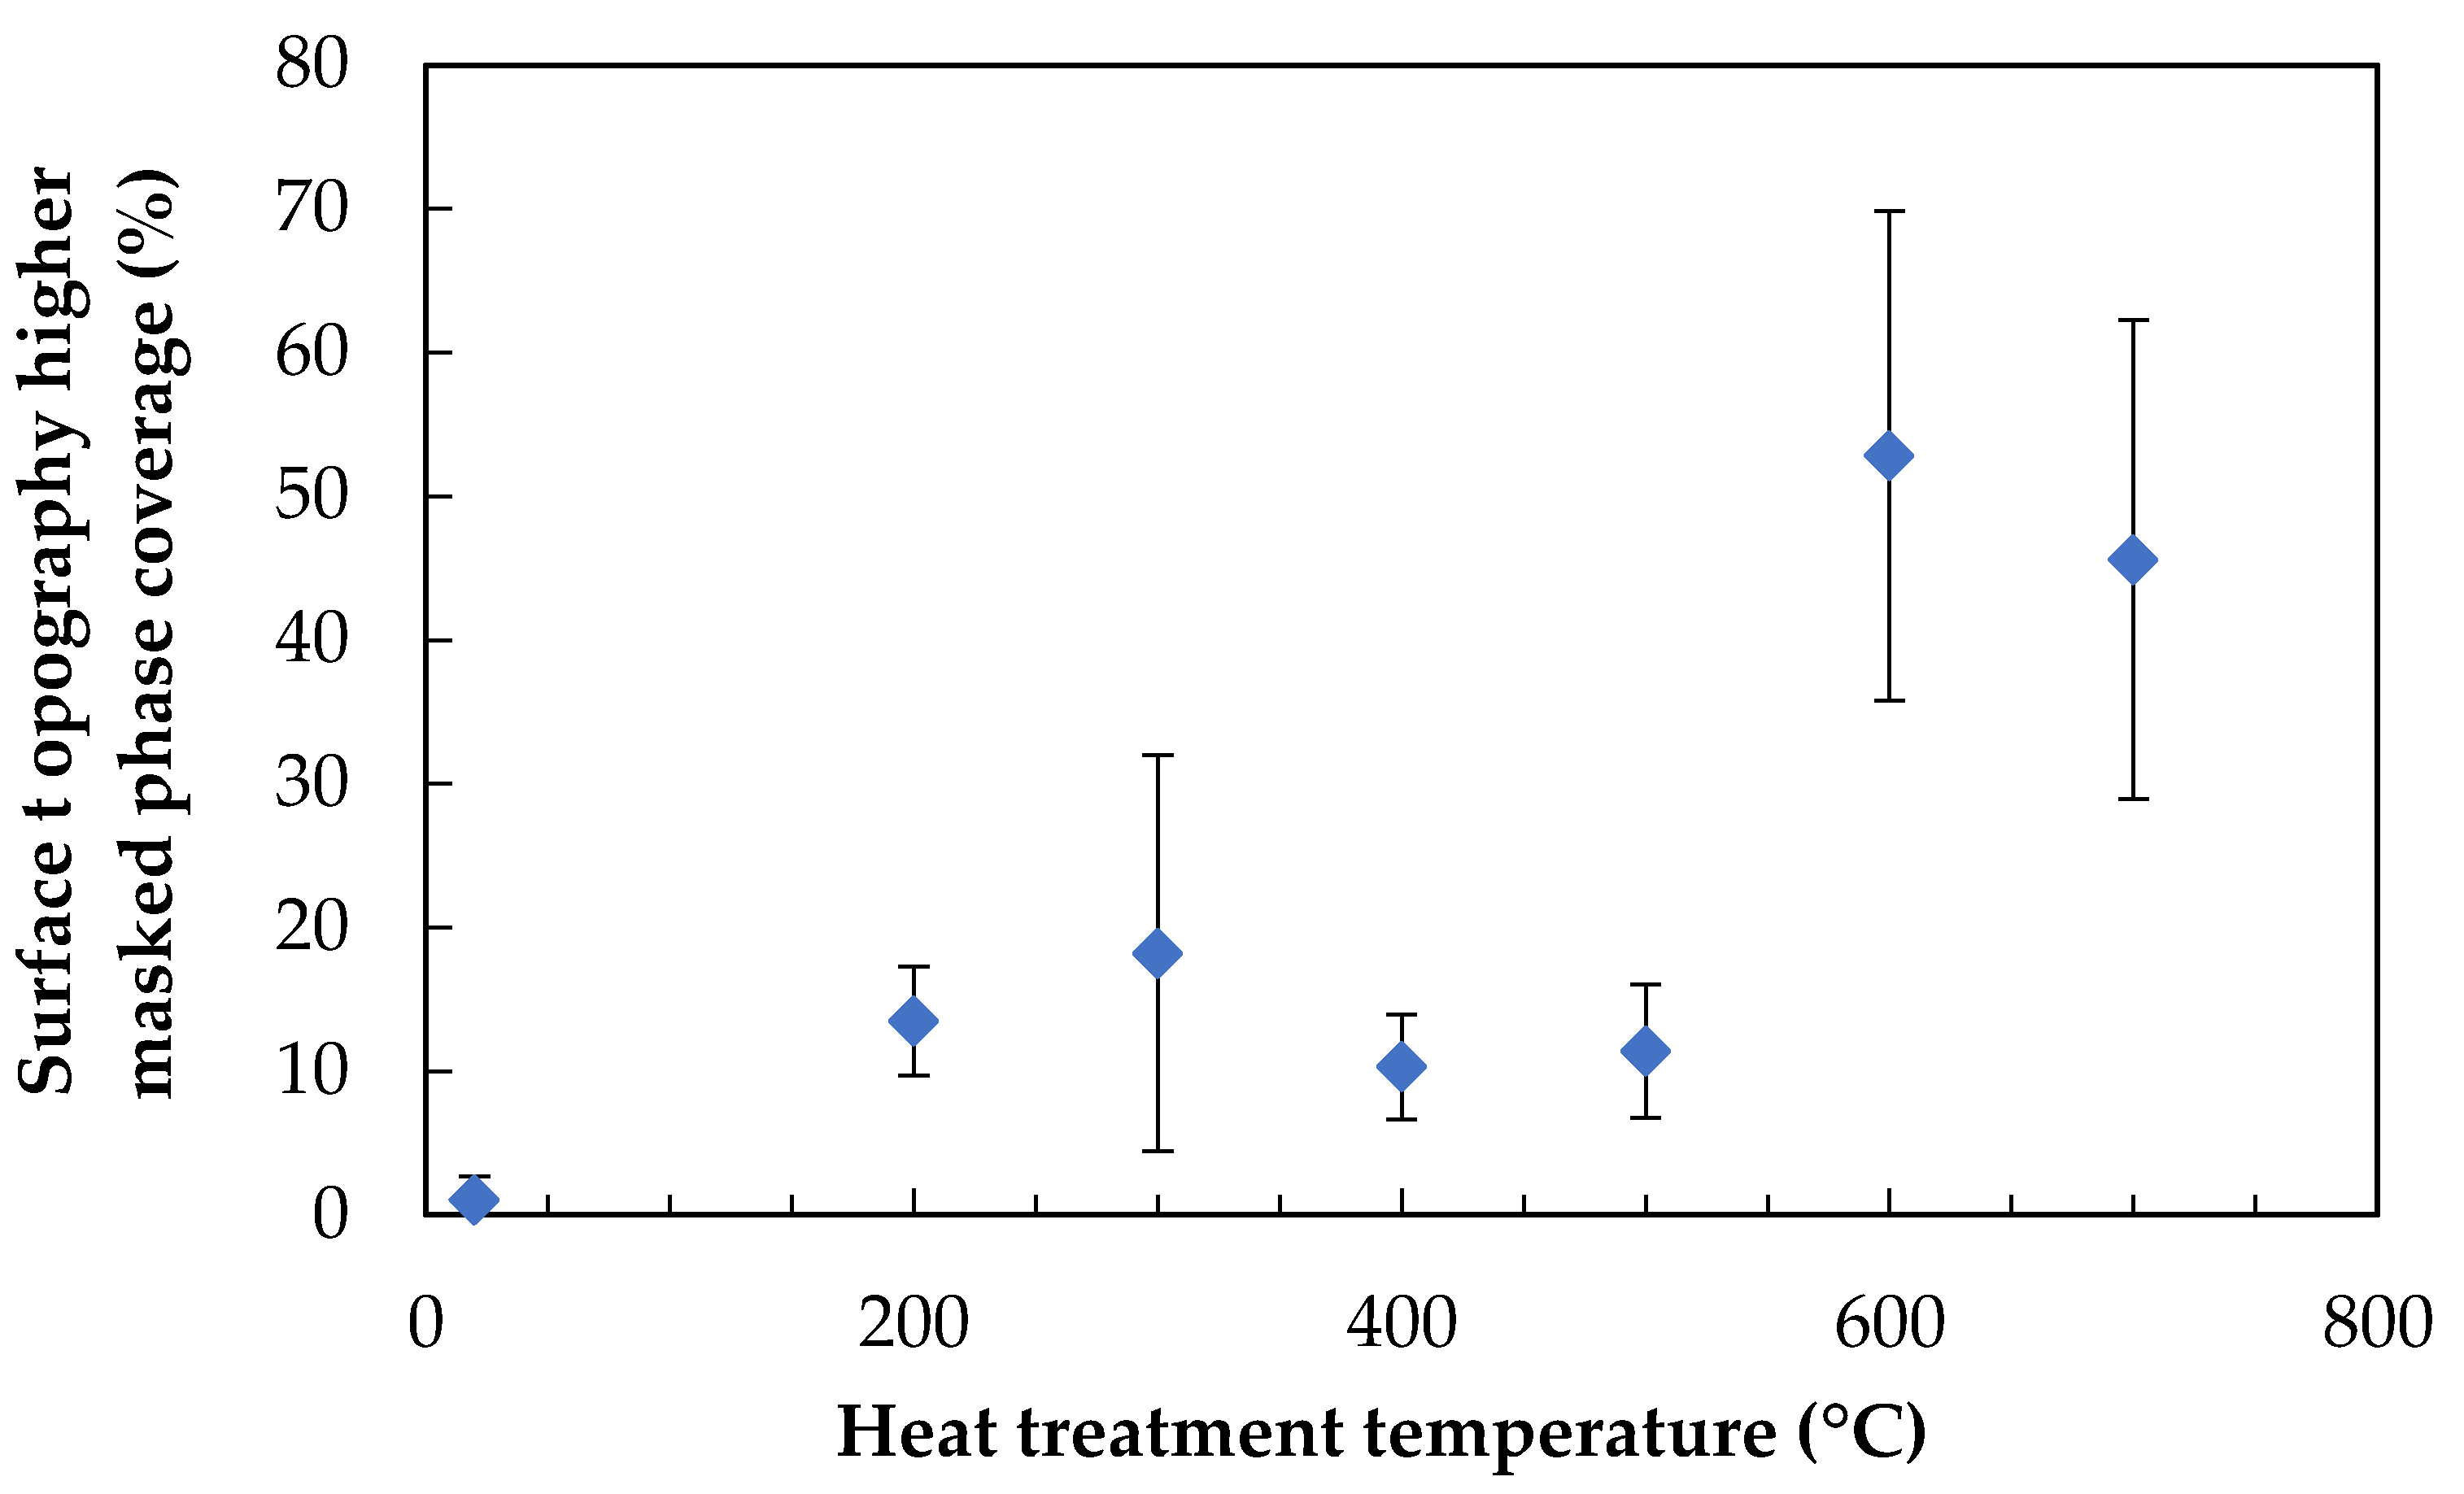
This procedure was carried out on all fibre surface areas for which topographical data were obtained; the results were averaged and are presented in Figure 10. Error bars indicate the sample standard deviations.
A step change in the coverage percentage was noted; similar values were calculated for lower treatment temperatures of 200–500 °C, followed by a significant increase to 600 and 700 °C, which themselves were similar to one another. This somewhat reflects the observations of the 3D topography plots, in which the appearance of 600 and 700 °C treated fibres were somewhat alike. It is notable, however, that the coverage percentages calculated for 200–500 °C were approximately constant, despite the relatively dissimilar fibre surface topographies. These data highlight a clear step change which occurred between the 500 and 600 °C treatment temperatures.
3.4. Scanning Electron Microscopy
3.4.1. Fibre Surfaces
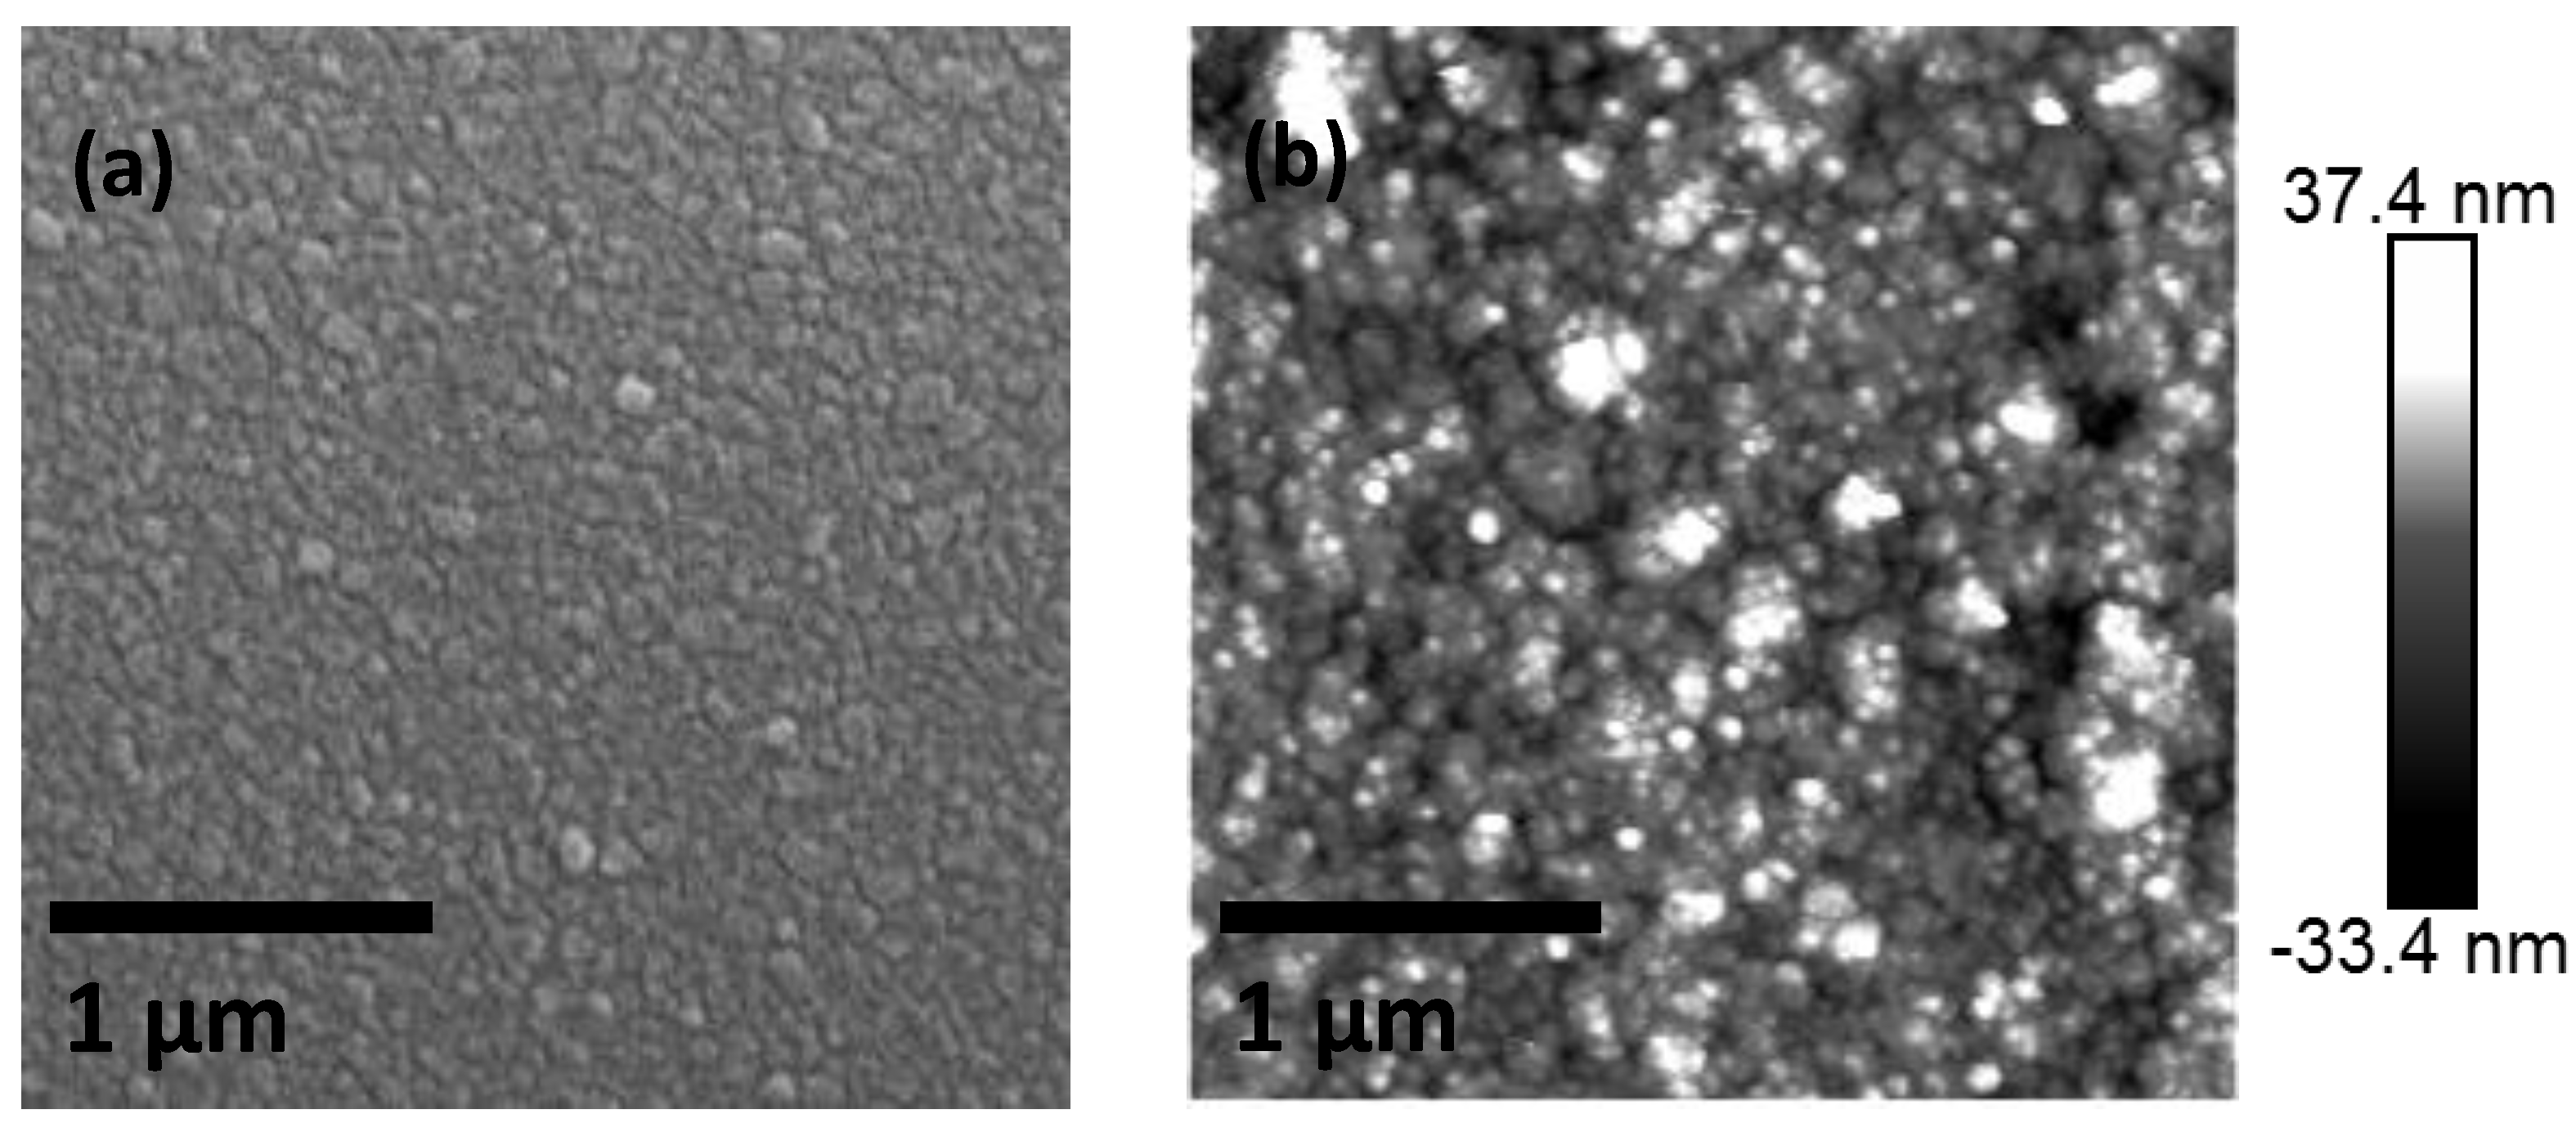
Images of the fibre surfaces were obtained using SEM, in an attempt to complement the image data from AFM. The consequent loss of quantitative topographical data was compensated by the ability to image large areas of the fibre surface quickly, in contrast to the slow rate of data generation using AFM. Two images of fibres identically thermally conditioned at 700 °C are shown in Figure 11; one obtained using SEM and the other by AFM. From close visual inspection of the images, it appeared clear that the same surface topography was visible, regardless of the method of microscopy used. In image (b) obtained by AFM, a significantly greater contrast in the z-axis was evident, as expected.
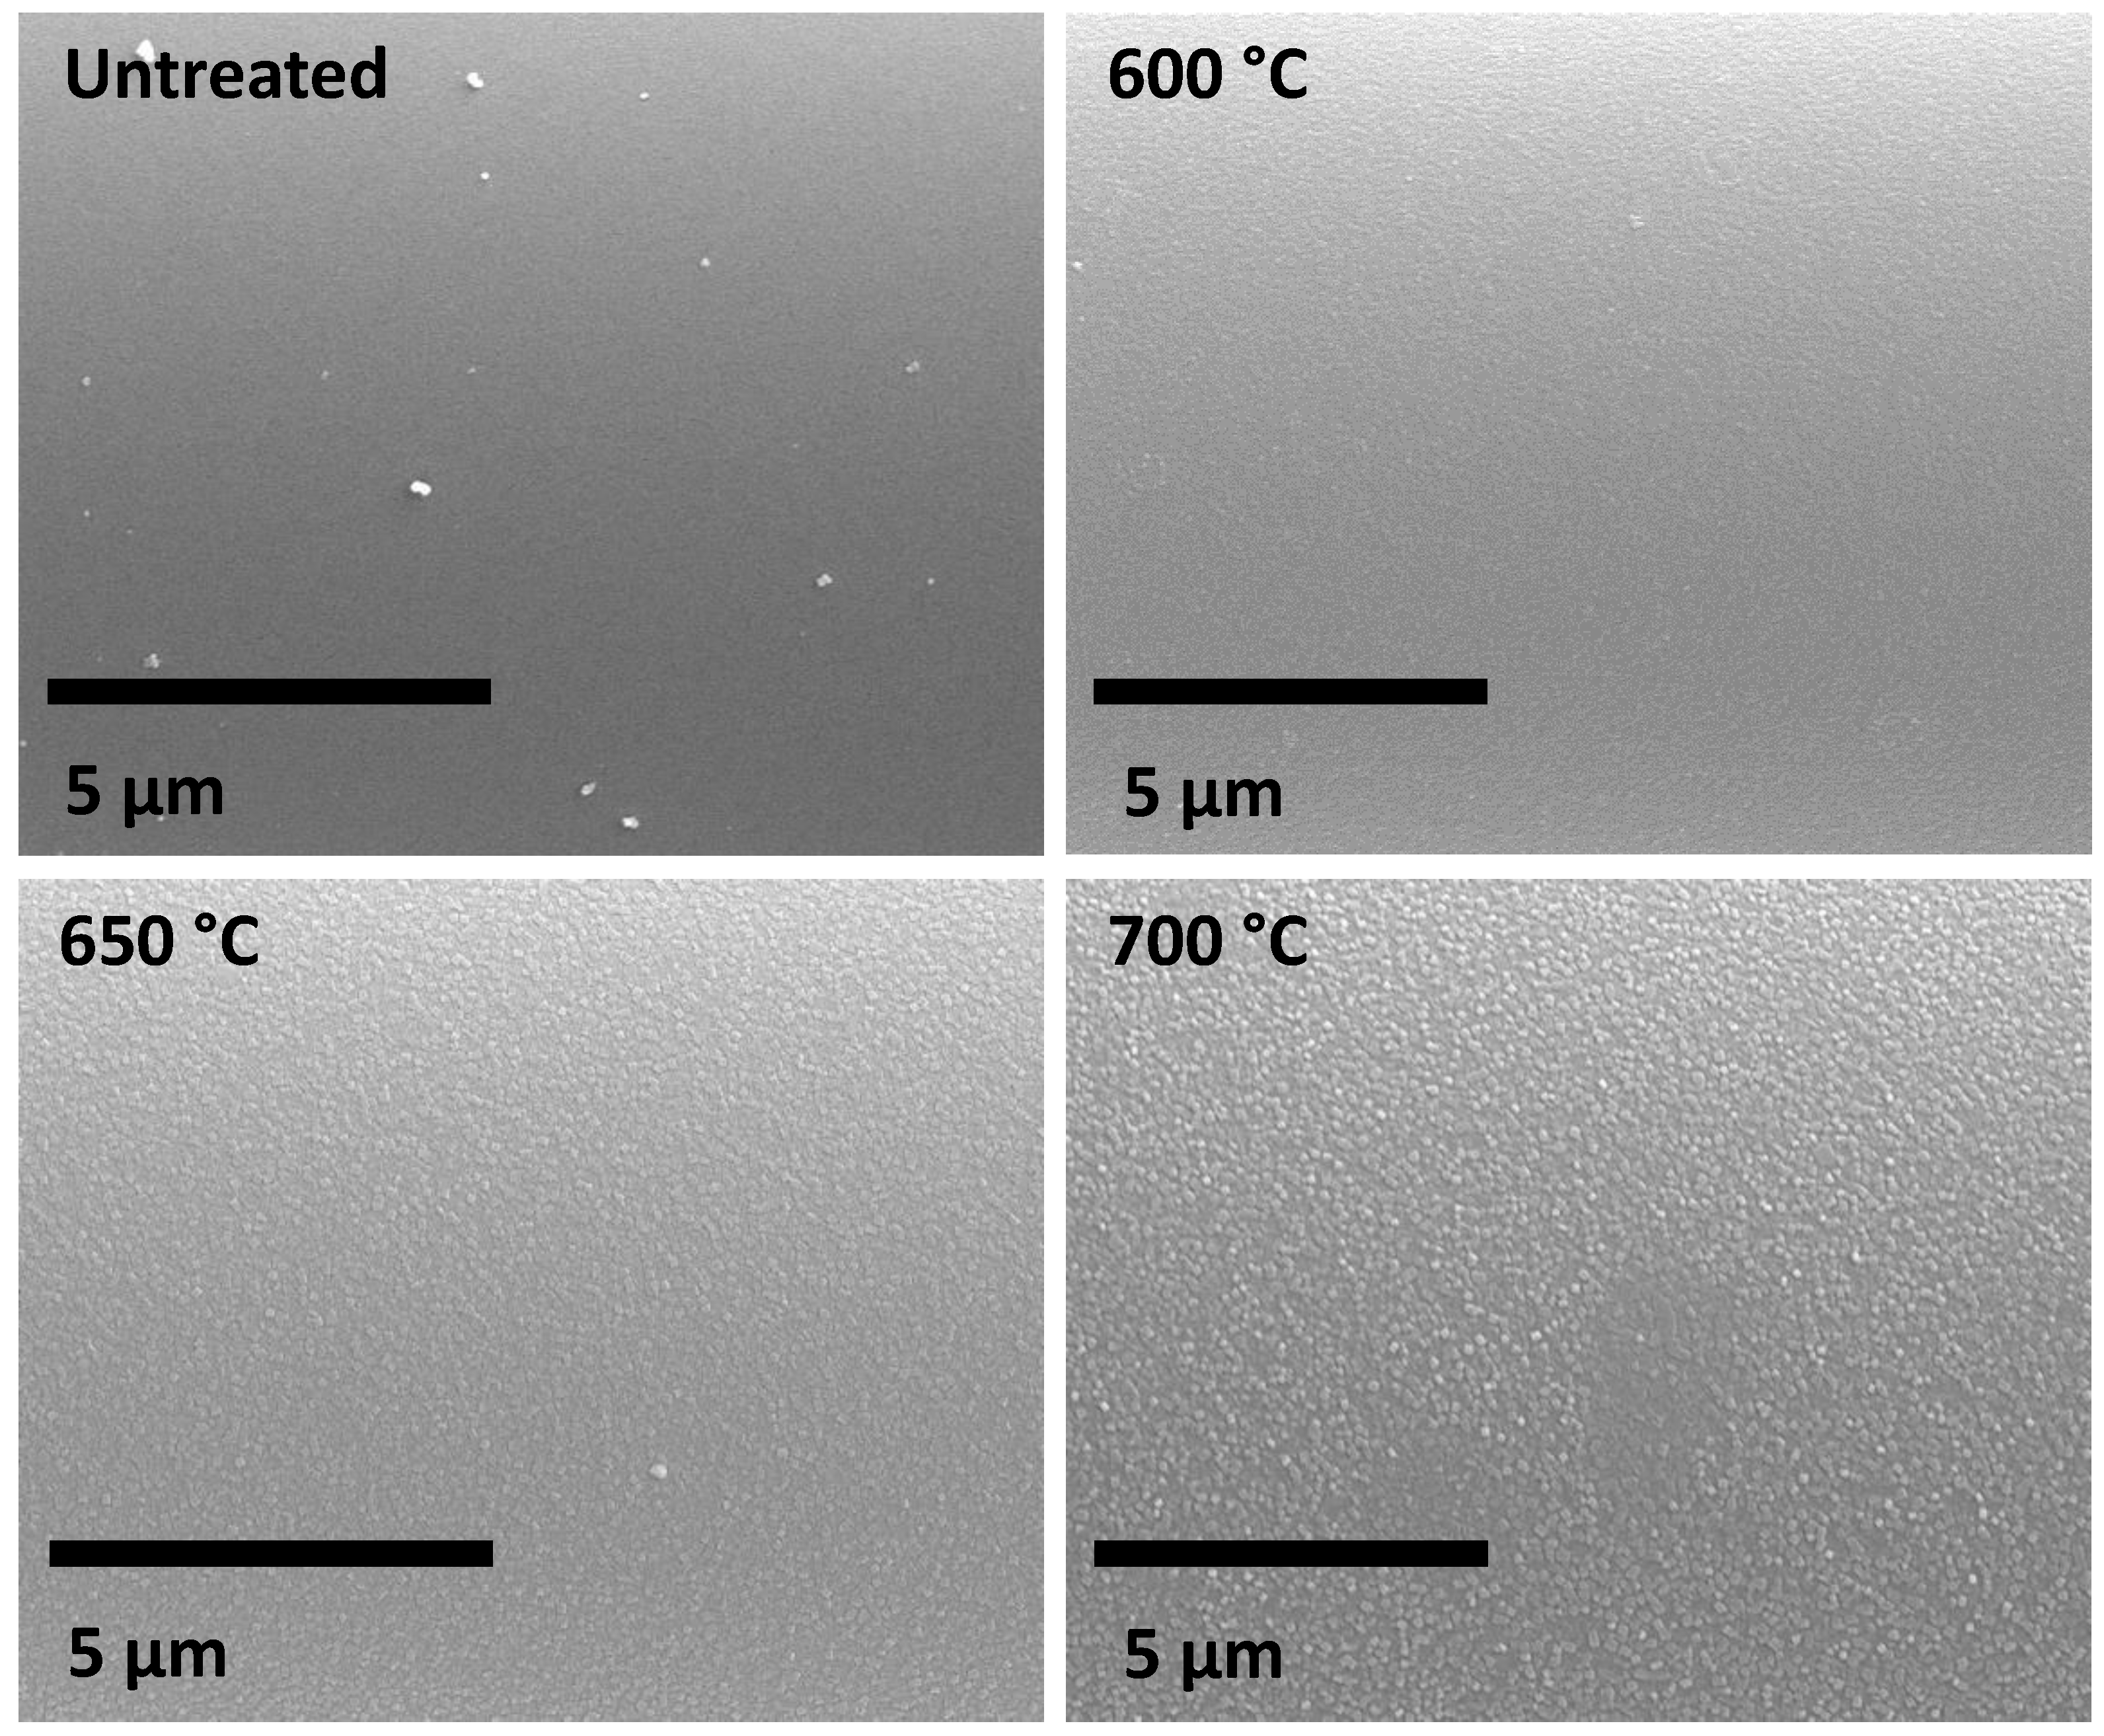
The surface of the thermally conditioned fibres over a range of temperatures was imaged using SEM. No consistent change of the fibre surface was visible until a temperature of at least 600 °C was used. Although the AFM results showed that roughening occurred at temperatures as low as 200 °C, the resolution of SEM was not sufficient to discern the features until they were of several tens of nm in height. It is possible that this is due in part to the need to coat fibres with a conductive material. Four images of fibre surfaces are presented in Figure 12.
The SEM image of the surface of untreated bare glass fibres was found to be largely featureless, except for some small contaminant particles of sub-micron dimensions. Similar particles were observed by AFM on untreated fibre surfaces; using phase imaging, it was clearly observed that they were distinct and not part of the glass surface (as opposed to the mound-like features of 100–200 nm, which were identical to the surrounding glass surface in the phase images). When the fibres were thermally conditioned at or above 600 °C it was possible to observe the progressive development of features on the fibre surface in the SEM micrographs. As shown by the increase in RMS roughness from AFM (Figure 4) the surface features became progressively easier to discern in SEM images as the conditioning temperature was increased. Significantly, the images provide evidence that the phenomenon occurred across the entire fibre surface; complementing the AFM data, which were captured for only a relatively small surface area on each fibre analysed.
3.4.2. Fracture Surfaces
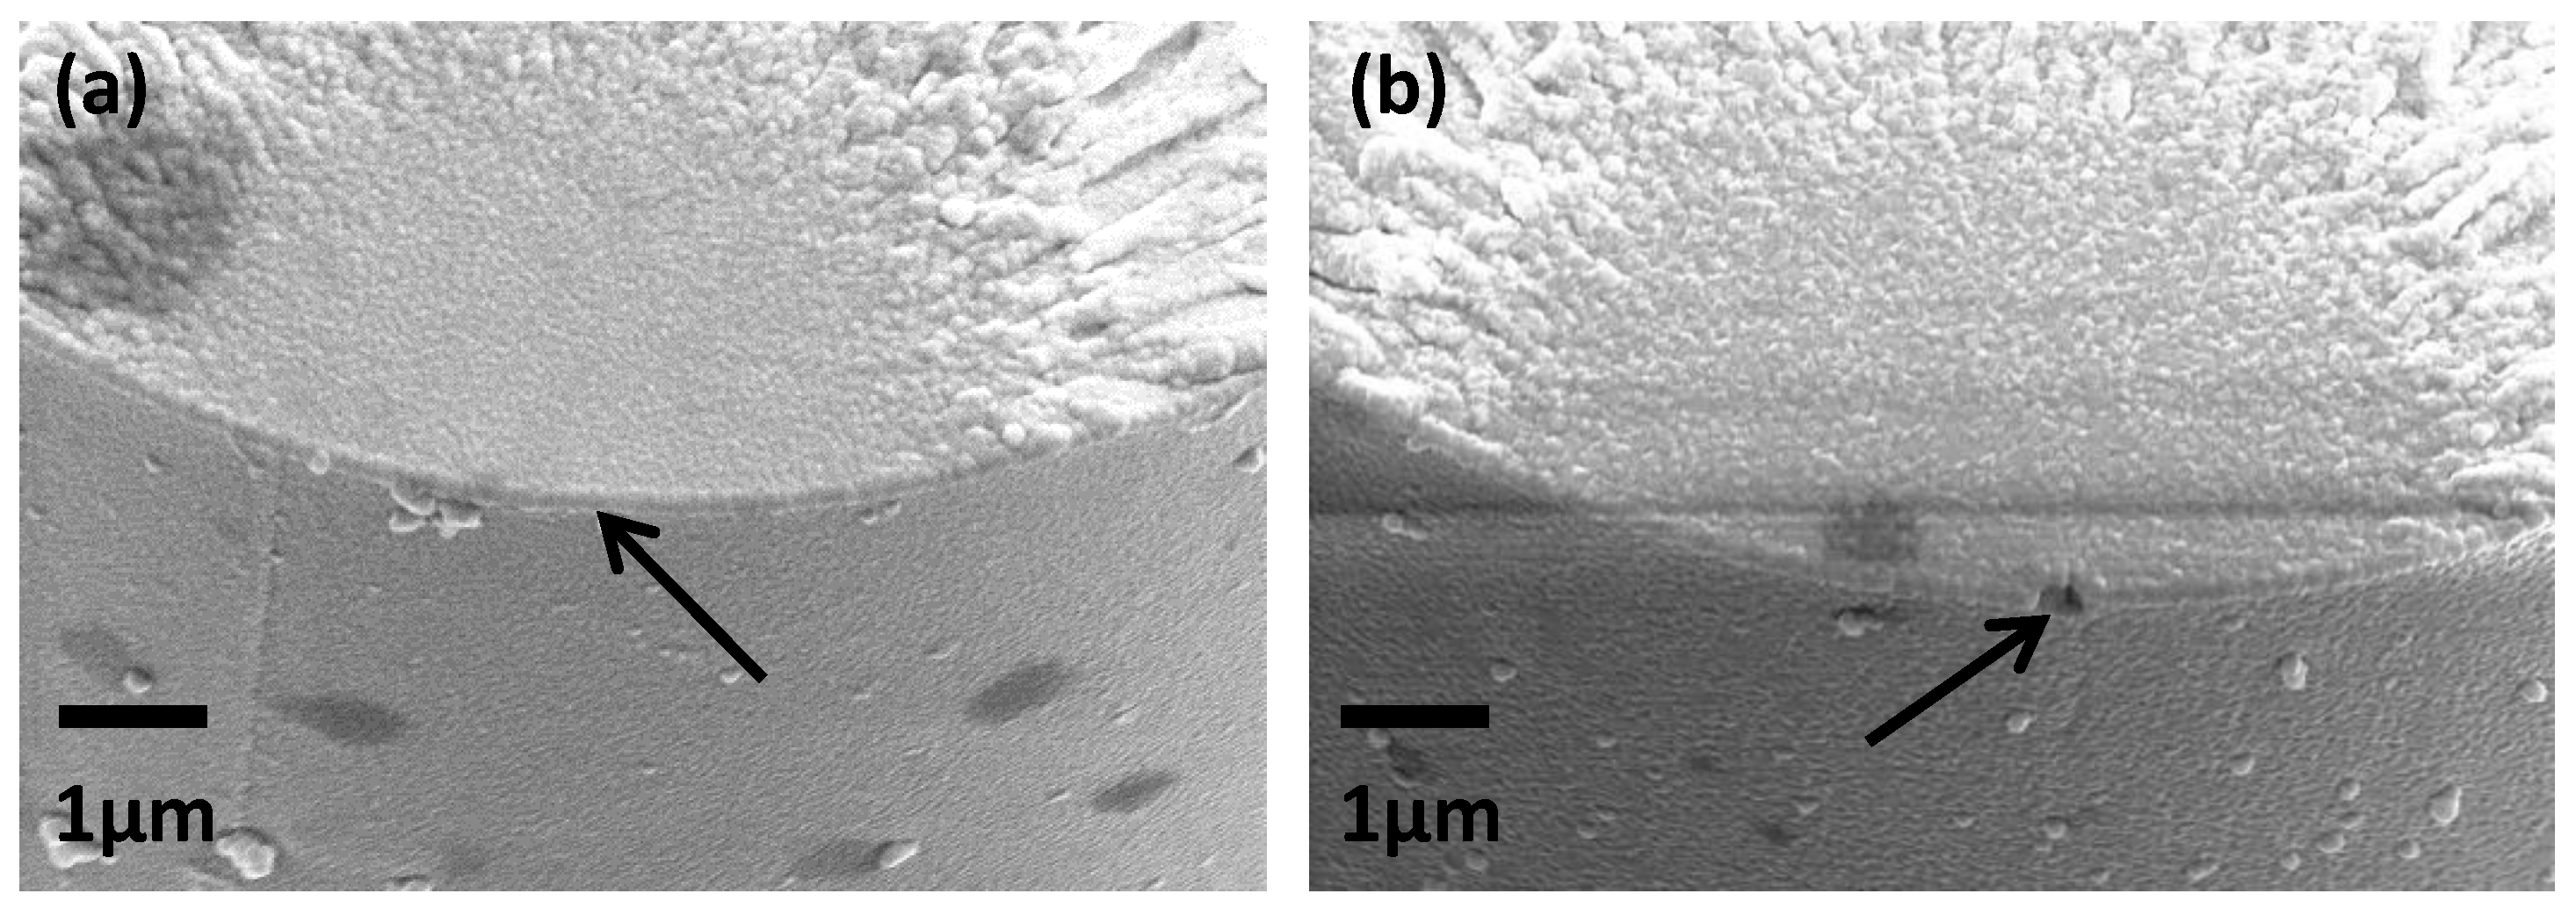
The fracture surface of both as-received and heat-treated fibres following tensile testing were imaged using SEM. In line with established methods [16] the fractures were examined for visible indications of flaws at which failure was initiated. An example of both non-visible and visible flaws at the fracture origin is presented in Figure 13.
A total of 19 fracture surfaces were imaged with sufficient resolution to be inspected for signs of visible flaws at the origin of fracture. The data are presented in Table 2. Samples were categorised as one of three possible types; no visible flaw at the origin of mirror region; visible flaw at the origin or internal pore at which the fracture appeared to have been initiated.
Unlike the data presented by Lund and Yue [16], no examples were found of fibres with internal pores at which failure occurred. An obvious explanation is that the fibres used in this study were all drawn from bushings, rather than produced by spin-casting. The majority of the mirror regions examined showed no evidence of any flaw at the origin. It is possible that the conductive gold coating may have obscured such features, however great care was taken to apply only a very thin coating to prevent this issue.
4. Discussion
4.1. Chemical Surface Changes
Chemical analysis of the surface of the heat-treated fibres revealed that a consistent trend was measured only for calcium: the concentration increased with increasing treatment temperature, particularly from 500 to 600 °C. This result agrees with the findings of Nichols et al. [17]: they reported that the surface region of E-glass fibres was depleted in calcium with respect to the bulk but that surface concentration of Ca increased when the fibres were heat treated. They proposed that Ca diffused from the fibre bulk to the surface and the evidence reported here is in agreement with such a mechanism. Quantified as the commonly used Ca/Si ratio, our data showed a maximum increase of around 12.5% in Ca/Si following heat treatment at the highest temperature studied, using XPS of 600 °C. This is lower than the almost 19% increase in Ca/Si reported in [17], but this difference may be explained by the shorter heat treatment used in our work. The chemical compositions of the fibres used also differed; Nichols et al. used a boron-containing E-glass, but in this study, a boron-free formulation was used. Our results, therefore, are the first to demonstrate the calcium diffusion and surface enrichment phenomenon for boron-free E-glass.
There exists little to no experimental data in the literature to suggest what effect a change in the surface concentration of Ca might have on the strength of glass fibres. It is understood that increasing the ratio of CaO in a glass blend slightly reduces strength, and the increases modulus of the product fibre [18] but this relates to the total content in the glass, and not the surface concentration. Calcium acts as a network modifier in E-glass, balancing the charge associated with the oxygen ions caused by the incorporation of non-siliceous species into the network, while itself being present in the interstices. A similar interstitial network modifier is sodium, for which some data relating concentration and glass strength exists. Investigated by Kennedy et al. [19] and summarised by Freiman [20], it was found that increasing the concentration of sodium in silica glass produced an increase in fracture toughness. It was postulated that this may be related to changes in straining or bending of Si–O bonds, thus influencing the size of a so-called process zone near the crack tip where elastic fracture mechanics may no longer apply. Even if the increase in Ca concentration after thermal conditioning, which is of relatively small magnitude, had an influence on the retained tensile strength of the fibres, it is unlikely that it would produce a weakening effect. Therefore, while the Ca surface-enrichment phenomenon due to heat treatment has been confirmed for boron-free E-glass for the first time, the phenomenon does not seem to be very likely to be related to fibre strength loss. This conclusion is further supported by the lack of correlation between Ca concentration at the surface, and fibre strength loss with heat treatment temperature.
4.2. Physical Surface Changes
4.2.1. Possibility of Phase Separation
A small number of AFM investigations of the surface of uncoated glasses, including glass fibres, have been reported in the literature [21,22,23,24], but the scope of these investigations did not include heat treatment. A systematic analysis of thermally conditioned E-glass fibres by AFM such as that reported here has not previously been conducted. Our surface topography and roughness data do not appear to correlate precisely with the fibre strength loss data presented (Figure 4). This suggests that there may not be a straightforward relationship between the development of roughness at high temperatures and the causes of fibre strength reduction. These data do not appear to support a relationship between increased surface roughness and the development of critical surface flaws. Data obtained on the parameter zmin as determined by AFM showed a somewhat better correlation with fibre strength loss (Figure 5) than did surface roughness. If this parameter is interpreted as an indication of flaw depth, however, the magnitudes are many times smaller than theoretical critical flaw sizes that would agree with the experimentally measured fibre strengths. This is explored in greater detail in a later section.
Aside from the issue of representation of flaws from AFM, the surface topography data provide intriguing new evidence of possible surface changes affecting heat-treated glass fibres. The phenomenon of phase separation in bulk glasses has been well studied and reported in the literature. The possibility of phase separation in glass fibres, however, has almost never been addressed, aside from a single paper on lithium alumino-silicate fibres from almost 50 years ago [25]. There is a body of literature that describes the phase separation of siliceous glasses; such studies often employ simplified binary glass systems [26,27] but more complex glasses have also been studied [27,28,29]. Phase separation following nucleation and growth or spinodal decomposition processes have both been reported, with an apparent dependence on the glass composition used. This is well summarised in a study by Wheaton and Clare [27] in which the sodium silicate and alkali borosilicate glasses analysed showed phase separation by spinodal decomposition, and nucleation and growth, respectively.
The 2D topography graphs presented in Figure 7 and Figure 8 bear resemblance to those in [27]: the heights of the peaks increased with the severity of the heat treatment, and the number of peaks per µm decreased. This is shown most clearly at 700 °C (Figure 8), where the coalescence of smaller individual peaks into only a few larger ones was observed. Significant differences remain between these data, and those that might be described as an ‘ideal’ example of phase separation. This may be explained, however, as the glass fibres used in our investigation were not etched in hydrofluoric acid, which is commonplace in similar studies [27,28]. A clear height contrast due to differential etching rates of phases was therefore not achieved in the topography plots reported here. It is also possible that the process observed was not fully developed, as the heat treatment time of approximately 20 min was relatively short.
As samples were not acid-etched before AFM analysis, it was not possible to easily discern high and low areas of topography. The use of bearing analysis in NanoScope Analysis, however, made it possible to classify the surface into two regions in a reproducible manner. Examples of heat-treated glass fibres whose high topography regions are masked, is shown in Figure 9. Quantitative analysis of surface coverage of the higher phase is presented in Figure 10. The coverage percentage of the untreated fibres was effectively zero: these fibre surfaces were also the most challenging on which to carry out the analysis, as they suffered from the greatest amount of surface contamination by a significant margin. Fibres that were treated at 200–500 °C produced a coverage percentage of the higher phase of between 10–20%; this increased significantly to between 45–53% for fibres that were heat-treated at 600 or 700 °C. The fibre surface areas in Figure 9 for 600 and 700 °C showed the similar coverage percentages, but also the coalescence of surface features that were also presented in Figure 8. The relatively constant area over this temperature range, in addition to the decreasing interfacial area between the high and low phases, would be consistent with a spinodal decomposition mechanism [30]. The heat treatment times used in our investigation were significantly shorter than those commonly used in studies of phase separation of siliceous glasses; however, such studies have always used bulk glass rather than glass fibres. The significantly larger surface area-to-volume ratios of the glass fibres used in our study may explain the possible occurrence of spinodal decomposition over a shorter than usual time scale.
4.2.2. Effects Relating to Water
Heat treatment at a temperature of 200 °C caused a fivefold increase in roughness compared to the untreated fibre surface. This significant roughening may be a product of surface water on fibres [31,32] plus applied heat; even water alone at room temperature is sufficient to produce significant fibre roughness over longer timescales [24]. In any case, this temperature range is not of the greatest interest, as only a small decrease in fibre tensile strength was measured. The increase in roughness found at higher temperatures of 400 °C and above is unlikely to be related to surface water: it has been demonstrated that the adsorbed surface water is removed upon heating to a temperature of approximately 350 °C [33]. Rather than water adsorbed at the surface, Nishioka [33] presents some evidence of diffusion of water from within the glass bulk structure out to the surface at temperatures in excess of 550 °C. The process may continue up to and beyond the glass transition temperature. No further exploration of this phenomenon appears to have been undertaken; it is thus unclear in what form the detected water is present in the glass structure. Diffusion of water into glasses has been studied at length, and it has been shown that water can be present in silica glass as hydroxyl, or in its molecular form [34,35]. It remains possible that at high temperatures, pairs of hydroxyls react to produce molecular water, which diffuses out of the structure. The reaction is usually presented as shown in Equation (1):
The reaction described is reversible, and local equilibrium depends on the conditions. As temperature increases or local vapour pressure decreases, the reaction in Equation (1) shifts to the right hand side, or in other words, the solubility of molecular water decreases [36]. This water will either react to form additional silanols, or alternatively, it may diffuse out from the structure, as found by Nishioka [33]. In either case, the physical processes involving water appear to occur in the glass fibre structure at the same relatively high temperatures which are associated with fundamental fibre strength loss. The role of water in thermally induced strength loss of glass fibres has not been directly investigated, but it must remain a possible contributing mechanism. In other studies water has been established to possess a significant influence over the strengths of glasses and glass fibres; it has a weakening effect on freshly manufactured glass fibres at room temperature [37], but inversely, it can, at elevated temperatures, be used to increase the strength of weakened glass [38,39].
4.3. Fibre Strength Loss and Fracture Behaviour
The results presented in Figure 1 describe the fundamental strength loss of bare E-glass fibres due to only thermal effects. The single-fibre heat treatment process used minimises possible surface damage to fibres by mechanical means, such as fibre–fibre or fibre–surface interactions. The latter can be avoided in any fibre testing procedure, provided that sufficient care is taken, but the former will inevitably occur if thermal conditioning is performed on fibre bundles. It has been shown that the method of heat treatment selected has a significant effect on the retained fibre strength over a wide temperature range of 200–600 °C [7]. Additional mechanical damage can occur when single fibre tensile specimens are extracted from heat-treated bundles, adding to the fundamental strength loss from thermal effects.
It is this fundamental strength loss that is of particular interest, as a satisfactory explanation for the phenomenon has yet to be presented in the literature. Glass fibres are brittle materials, and this is not changed after their exposure to elevated temperatures. Their failure, therefore, should be based on a discussion of flaws or cracks. The failure behaviour can be described adequately by relatively simple models, such as Griffith’s theory [12]. This is often expressed mathematically in combination with Irwin’s [40] stress intensity factor for opening mode loading in plane strain cases to yield Equation (2):
In Equation (2), KIc is the material fracture toughness in N/m3/2, σf is the failure stress in N/m2 and ‘a’ is the critical dimension of a flaw which may be straight-edged, circular, or elliptical. The dimensionless parameter Y is defined by the geometry of the flaw-initiating failure, which is usually obtained by direct observation; corresponding values may be found in ASTM C1322-05b. Within this theoretical framework, a decrease in fibre strength implies that during thermal conditioning, either new, more severe, flaws develop, or pre-existing flaws grow. Such growth might consist of an increase in the critical flaw dimension ‘a’, or a change in the flaw geometry that causes failure at decreased stress. An alternative possibility to explain a decrease in strength might also be a reduction in the mode I fracture toughness; however, some evidence has been presented suggesting that toughness is not changed after the thermal conditioning of E-glass fibres [41].
Fractographic analysis of single glass fibres is relatively challenging and time consuming; perhaps for this reason, there are few papers where sufficient data were collected to allow for useful quantitative analysis [16,42]. The data presented in Table 2 confirm the finding of [16], that the majority of the fracture mirror regions do not have observable signs of a flaw at which the failure originated. Our data, however, show this to be true for a commercial continuous E-glass, rather than for the cascade spun materials in [16]. All failures appeared to originate at the surface, as expected for a brittle material such as glass fibre, whose failure is governed by the surface flaw distribution.
A few visible flaws were found during fractography; an example is given in Figure 13b. In this case, the flaw dimensions give an almost perfect agreement between the theoretical fibre strength—according to Equation (2)—and the measured strength from testing, which are both 1.2 GPa. While it is occasionally possible to identify such surface flaws on fracture surfaces, they have never been identified on pre-fracture glass fibres. The AFM study of heat-treated fibres that were not tensile-tested was intended to discover if surface flaws could be imaged, in addition to providing data on any other changes in surface topography and roughness.
The minimum height measured below the z = 0 plane in topography plots, labelled zmin, was analysed, and the data are presented in Figure 5 and Table 3. The two datasets in Figure 5 correlate relatively well across the temperature range used. At lower treatment temperatures the fibre tensile strength was relatively stable but the average zmin fluctuated greatly between room temperature (untreated) and 400 °C. The most critical strength loss began after heat treating to 450–500 °C, whereas the flaw depth over the same approximate range increased only slightly. The region in which the trend was relatively similar was 500–700 °C in which both the fibre tensile strength and the average flaw depth decreased rapidly. Table 3 shows that the magnitudes of the average zmin measured by AFM were significantly smaller than those that would be required to produce failure at a stress consistent with the average values measured and presented in Figure 1, Figure 4 and Figure 5. The disparity between the theoretical strength, based on Equation (2), and using the average zmin depth as the critical flaw, and the measured strength was at least 2, but generally of the order ≥ 4. The disparity in theoretical flaw size is even greater at around ≥ 16, due to the square root in Equation (2).
The systematic topography study produced data that suggests the existence of physical changes at the fibre surface that have not previously been described, but they did not produce unambiguous evidence of a critical surface flaw. Although troughs below the mean surface (z = 0) were found in all images, their magnitudes were significantly too small to represent critical flaws. Further, although they generally tended to increase in depth as the average fibre strength decreased, the correlation between these was not precise over the temperature range investigated. This may suggest that AFM is not able to measure surface flaws on glass fibres that have not been fractured. A possible explanation is that the surface flaws on the unstressed fibres are too closed to be detected. The geometry of the tip used to characterise surface topography always places some limits on the resolution that may be detected. The tip radius and the front, back and side angles of the tip combine to produce these geometric constraints. In the case of the analysis presented, the tip radius was approximately 8 nm and the relevant angles between 15–25°. If, for simplicity, the surface flaw is imagined as a slot with straight sides, then it must be greater than 8 nm across to be detected. Even when small flaws can be detected, if they are relatively narrow and deep, the probe will be unable to approach the bottom. For example, the average measured strength of a 200 °C treated fibre, 1.42 GPa, requires a theoretical flaw depth of at least 78 nm; for the AFM probe to touch the bottom of this flaw, it would need to have a width of at least 57 nm.
Alternatively, the low sampling rate that can realistically be achieved in AFM analysis is problematic: for example, if only two areas of 9 µm2 are analysed on a nominal 17 µm diameter fibre of length 20 mm, this represents just one thousandth of 1% of the total surface area. The likelihood, then, of positioning the AFM probe above a site that contains the critical surface flaw of the fibre length—or any flaw even approaching it—is low. Even if it were possible to analyse along the entire length of such a fibre in a reasonable timescale, only the topmost section can be imaged due to mounting constraints, giving analysis of just over 5% of the fibre surface area.
5. Conclusions
The fundamental strength loss due to the thermal effects of bare E-glass fibres heat-treated between 200–700 °C has been presented. Chemical and physical changes at the surface of these fibres were analysed by using a variety of techniques, in an attempt to understand how they might contribute to the observed fibre strength decrease. An increase in the surface concentration of calcium was detected at 600 °C; it did not, however, correlate with fibre strength loss behaviour. Fibre surface roughness increased significantly with heat treatment temperature, while an inverse trend was found for the depth of topographical features below the z = 0 plane, zmin. Neither of these trends correlated closely with fibre strength loss, except between 500–700 °C, where fibre strength and zmin decrease and surface roughness increases rapidly. It was found that the values of zmin from topography data corresponded to theoretical failure strengths of greater than the actual measured value by a factor of at least four, in the majority of cases. It was concluded that AFM was unable to effectively image surface features that might represent a critical surface flaw, since the high magnification and limited sampling rate that can be achieved severely limits the probability of finding such a critical surface flaw. Alternatively it is possible that surface flaws are too close to each other in an unstressed fibre to be detected by AFM. The fractography data presented showed that, for the large majority of fracture surfaces, it is not possible to observe the flaws that induced the failures. Although AFM analysis was not successful in directly imaging the critical surface flaws of un-fractured fibres, it revealed significant surface changes that occur when glass fibres are thermally conditioned. The nature of these changes suggests that phase separation may be occurring at the glass fibre surface at high temperatures. Evidence for this was found at treatment temperatures of 600–700 °C, although the initial stages of this phase separation may already be present at 400–500 °C. This phenomenon occurs over the same approximate temperature range as that causing the most significant fibre strength loss. Further investigation of this phenomenon, including its relation to a decrease in fibre strength, might further improve our understanding of the fundamental thermally-induced strength loss mechanism.
Author Contributions
Conceptualization, James L Thomason, Liu Yang and Peter G Jenkins; Methodology, James L Thomason and Peter G Jenkins; Formal analysis, Peter G Jenkins and Xinyong Chen; Investigation, Peter G Jenkins, Xinyong Chen and Steven J Hinder; Resources, James L Thomason, Xinyong Chen and John F Watts; Writing—original draft preparation, Peter G Jenkins; writing—review and editing, Liu Yang, James L Thomason, Xinyong Chen and Steven J Hinder; Supervision, James L Thomason; Funding acquisition, James L Thomason.
Funding
This research was funded by the Engineering and Physical Sciences Research Council, grant number EP/I038616/1.
Acknowledgments
The authors would also like to thank Owens Corning for providing the glass fibres used in this study. Special thanks are given to the Advanced Materials Research Laboratory (AMRL) at the University of Strathclyde for the use of SEM equipment.
Conflicts of Interest
The authors declare no conflict of interest.
References
- Li, H.; Watson, J.C. Continuous Glass Fibers for Reinforcement. Encycl. Glas. Sci. Technol. Hist. Cult. 2016, in press. [Google Scholar]
- Job, S.; Leeke, G.A.; Mativenga, P.T.; Oliveux, O.; Pickering, S.J.; Shuaib, N.A. Composites recycling: Where are we now? Composites UK Ltd. 2016, 1–11. [Google Scholar]
- Pickering, S.J. Recycling technologies for thermoset composite materials—current status. Compos. Part. A Appl. Sci. Manuf. 2006, 37, 1206–1215. [Google Scholar] [CrossRef]
- Oliveux, G.; Dandy, L.O.; Leeke, G.A. Current Status of Recycling of fibre reinforced polymers: Review of technologies, reuse and resulting properties. Prog. Mater. Sci. 2015, 72, 61–99. [Google Scholar] [CrossRef]
- Kennerley, J.R.; Fenwick, N.J.; Pickering, S.J.; Rudd, C.D. The properties of glass fibers recycled from the thermal processing of scrap thermoset composites. J. Vinyl Addit. Technol. 1997, 3, 58–63. [Google Scholar] [CrossRef]
- Kennerley, J.R.; Kelly, R.M.; Fenwick, N.J.; Pickering, S.J.; Rudd, C.D. The characterisation and reuse of glass fibres recycled from scrap composites by the action of a fluidised bed process. Compos. Part A Appl. Sci. Manuf. 1998, 29A, 839–845. [Google Scholar] [CrossRef]
- Jenkins, P.G.; Yang, L.; Liggat, J.J.; Thomason, J.L. Investigation of the strength loss of glass fibre after thermal conditioning. J. Mater. Sci. 2015, 50, 1050–1057. [Google Scholar] [CrossRef]
- Thomason, J.L.; Yang, L.; Meier, R. The properties of glass fibres after conditioning at composite recycling temperatures. Compos. Part A Appl. Sci. Manuf. 2014, 61, 201–208. [Google Scholar] [CrossRef]
- Feih, S.; Boiocchi, E.; Mathys, Z.; et al. Mechanical properties of thermally-treated and recycled glass fibres. Compos. Part B Eng. 2011, 42, 350–358. [Google Scholar] [CrossRef]
- Thomason, J.L.; Jenkins, P.G.; Yang, L. Glass fibre strength—A review with relation to composite recycling. Fibers 2016, 4, 18. [Google Scholar] [CrossRef]
- Sakka, S. Effect of reheating on strength of glass fibers. Bull. Inst. Chem. Res. 1957, 34, 316–320. [Google Scholar]
- Griffith, A.A. The phenomena of rupture and flow in solids. Philos. Trans. R. Soc. A. Math. Phys. Eng. Sci 1921, 221, 163–198. [Google Scholar] [CrossRef]
- Thomas, W.F. An investigation of the factors likely to affect the strength and properties of glass fibres. Phys. Chem. Glas. 1960, 1, 4–18. [Google Scholar]
- Cameron, N.M. The effect of environment and temperature on the strength of E-glass fibres. Part 2. Heating and ageing. Glas Technol. 1968, 9, 121–130. [Google Scholar]
- Yang, L.; Thomason, J.L. Effect of silane coupling agent on mechanical performance of glass fibre. J. Mater. Sci. 2012, 48, 1947–1954. [Google Scholar] [CrossRef] [Green Version]
- Lund, M.D.; Yue, Y. Fractography and tensile strength of glass wool fibres. J. Ceram. Soc. Jpn. 2008, 116, 841–845. [Google Scholar] [CrossRef] [Green Version]
- Nichols, D.; Hercules, D.M.; Peek, R.C.; Vaughan, D.J. Application of x-ray photoelectron spectroscopy to the study of fiberglass surfaces. Appl. Spectrosc. 1974, 28, 219–222. [Google Scholar] [CrossRef]
- Korwin-Edson, M.L.; Hofmann, D.A.; McGinnis, P.B. Strength of high performance glass reinforcement fiber. Int. J. Appl. Glas. Sci. 2012, 3, 107–121. [Google Scholar] [CrossRef]
- Kennedy, C.R.; Bradt, R.C.; Rindone, G.E. Fracture mechanics of binary sodium silicate glasses. In Fracture Mechanics of Ceramics; Bradt, R.C., Evans, A.C., Hasselman, D.P.H., Lange, F.F., Eds.; Springer: Boston, MA, USA, 1974; Volume 2, pp. 883–893. [Google Scholar]
- Freiman, S.W. The Fracture of glass: Past, present, and future. Int. J. Appl. Glas. Sci. 2012, 3, 89–106. [Google Scholar] [CrossRef]
- El Achari, A.; Ghenaim, A.; Wolff, V.; Caze, C.; Carlier, E. Topographic study of glass fibers by atomic force microscopy. Text. Res. J. 1996, 66, 483–490. [Google Scholar] [CrossRef]
- Radlein, E.; Frischat, G.H. Atomic force microscopy as a tool to correlate nanostructure to properties of glasses. J. Non Cryst. Solids 1997, 222, 69–82. [Google Scholar] [CrossRef]
- Gupta, P.K.; Inniss, D.; Kurkjian, C.R.; Zhong, Q. Nanoscale roughness of oxide glass surfaces. J. Non Cryst. Solids 2000, 262, 200–206. [Google Scholar] [CrossRef]
- Mellott, N.P.; Pantano, C.G. A mechanism of corrosion-induced roughening of glass surfaces. Int. J. Appl. Glas. Sci. 2013, 4, 274–279. [Google Scholar] [CrossRef]
- Aslanova, M.S.; Shaina, Z.I. Influence of phase separation on physical and chemical properties of heat-treated fibers. In Phase-Separation Phenom. Glas. Proc. first All-Union Symp. Phase-Separation Phenom; Porai-Koshits, E.A., Ed.; Glas: Leningrad, Russia, 1968; pp. 168–171. [Google Scholar]
- Kreidl, N.J.; Maklad, M.S. Effect of water content on phase separation in soda-silica glasses. J. Am. Ceram. Soc. 1969, 52, 508–509. [Google Scholar] [CrossRef]
- Wheaton, B.R.; Clare, A.G. Evaluation of phase separation in glasses with the use of atomic force microscopy. J. Non Cryst. Solids 2007, 353, 4767–4778. [Google Scholar] [CrossRef]
- Dalmas, D.; Lelarge, A.; Vandembroucq, D. Quantitative AFM analysis of phase separated borosilicate glass surfaces. J. Non Cryst. Solids 2007, 353, 4672–4680. [Google Scholar] [CrossRef] [Green Version]
- Zheng, W.; Lin, M.; Cheng, J. Effect of phase separation on the crystallization and properties of lithium aluminosilicate glass-ceramics. Glass Phys. Chem. 2013, 39, 142–149. [Google Scholar] [CrossRef]
- Varshneya, A.K. Fundamentals of Inorganic Glasses; Academic Press: Cambridge, MA, USA, 2013. [Google Scholar]
- Carman, L.A.; Pantano, C.G. Water-vapor adsorption on calcium-boroaluminosilicate glass fibers. J. Non Cryst. Solids. 1990, 120, 40–46. [Google Scholar] [CrossRef]
- Nishioka, G.M.; Schramke, J.A. Desorption of water from glass fibers. In Mol. Charact. Compos. Interfaces; Ishida, H., Kumar, G., Eds.; Plenum Press: New York, NY, USA, 1985; pp. 387–400. [Google Scholar]
- Nishioka, G.M. Adsorption/desorption of water on glass fiber surfaces. J. Non Cryst. Solids 1990, 120, 34–39. [Google Scholar] [CrossRef]
- Oehler, A.; Tomozawa, M. Water diffusion into silica glass at a low temperature under high water vapor pressure. J. Non Cryst. Solids 2004, 347, 211–219l. [Google Scholar] [CrossRef]
- Amma, S.I.; Kim, S.H.; Pantano, C.G. Analysis of water and hydroxyl species in soda lime glass surfaces using Attenuated Total Reflection (ATR)-Ir spectroscopy. J. Am Ceram. Soc. 2016, 99, 128–134. [Google Scholar] [CrossRef]
- Lezzi, P.J.; Xiao, Q.R.; Tomozawa, M.; et al. Strength increase of silica glass fibers by surface stress relaxation: A new mechanical strengthening method. J. Non Cryst. Solids 2013, 379, 95–106. [Google Scholar] [CrossRef]
- Martin, D.M.; Akinc, M.; Oh, S.M. Effect of forming and aging atmospheres on e-glass strength. J. Am. Ceram. Soc. 1978, 61, 308–311. [Google Scholar] [CrossRef]
- Li, H.; Tomozawa, M. Mechanical strength increase of abraded silica glass by high pressure water vapor treatment. J. Non Cryst. Solids 1994, 168, 287–292. [Google Scholar] [CrossRef]
- Wiederhorn, S.M.; Yi, F.; LaVan, D.; Richter, L.J.; Fett, T.; Hoffmann, M.J. Volume expansion caused by water penetration into silica glass. J. Am. Ceram. Soc. 2015, 98, 78–87. [Google Scholar] [CrossRef]
- Irwin, G.R. Fracture. In Elast. Plast.; Flugge, S., Ed.; Springer: Heidelberg, Germany, 1958; pp. 551–590. [Google Scholar]
- Feih, S.; Mouritz, A.P.; Case, S.W. Determining the mechanism controlling glass fibre strength loss during thermal recycling of waste composites. Compos. Part A Appl. Sci. Manuf. 2015, 76, 255–261. [Google Scholar] [CrossRef]
- Jaras, A.C.; Norman, B.J. The measurement of glass fibre strength in composites from studies of their fracture surfaces. J. Mater. Sci. 1983, 18, 2459–2465. [Google Scholar] [CrossRef]
Figure 1.
Tensile strengths of bare fibres after thermal conditioning at 200–700 °C for 25 min.

Figure 2.
Atomic percentages of Si and O at the E-glass surface with respect to the thermal conditioning temperature.
Figure 2.
Atomic percentages of Si and O at the E-glass surface with respect to the thermal conditioning temperature.

Figure 3.
Atomic percentages of Ca at the E-glass surface with respect to the thermal conditioning temperature.
Figure 3.
Atomic percentages of Ca at the E-glass surface with respect to the thermal conditioning temperature.

Figure 4.
Average fibre tensile strength at room temperature, and fibre surface RMS roughness after thermal conditioning.
Figure 4.
Average fibre tensile strength at room temperature, and fibre surface RMS roughness after thermal conditioning.

Figure 5.
Average fibre tensile strength at room temperature, and average minimum topographical feature in the z-direction after thermal conditioning.
Figure 5.
Average fibre tensile strength at room temperature, and average minimum topographical feature in the z-direction after thermal conditioning.

Figure 6.
Three-dimensional topography plots of bare E-glass fibre: untreated and thermally conditioned at 200–700 °C.
Figure 6.
Three-dimensional topography plots of bare E-glass fibre: untreated and thermally conditioned at 200–700 °C.

Figure 7.
Typical 2D sections of the surface topography after heat treatment at 400 and 500 °C.

Figure 8.
Typical 2D sections of the surface topography after heat treatment at 600 and 700 °C.

Figure 9.
Fibre topography of heat-treated fibres masked to identify the coverage of the structure (sample areas approx. 2.8 × 2.8 µm).
Figure 9.
Fibre topography of heat-treated fibres masked to identify the coverage of the structure (sample areas approx. 2.8 × 2.8 µm).

Figure 10.
Coverage of the higher (masked) phase of surface topography as a percentage, over heat treatment temperature.
Figure 10.
Coverage of the higher (masked) phase of surface topography as a percentage, over heat treatment temperature.

Figure 11.
Images of 700 °C conditioned fibres obtained using (a) Scanning Electron Microscopy (SEM) and (b) Atomic Force Microscopy (AFM).
Figure 11.
Images of 700 °C conditioned fibres obtained using (a) Scanning Electron Microscopy (SEM) and (b) Atomic Force Microscopy (AFM).

Figure 12.
SEM images of E-glass fibre surfaces: untreated and following thermal conditioning at 600, 650 and 700 °C.
Figure 12.
SEM images of E-glass fibre surfaces: untreated and following thermal conditioning at 600, 650 and 700 °C.

Figure 13.
Fracture mirror region of 450 °C heat-treated fibres; (a) no visible flaw and (b) visible semi-circular flaw at the origin of fracture.
Figure 13.
Fracture mirror region of 450 °C heat-treated fibres; (a) no visible flaw and (b) visible semi-circular flaw at the origin of fracture.


Table 1.
Atomic percentages of constituent elements at the surface of boron-free E-glass from X-ray photoelectron spectroscopy (XPS).
Table 1.
Atomic percentages of constituent elements at the surface of boron-free E-glass from X-ray photoelectron spectroscopy (XPS).
| Treatment temperature (°C) | Element Atomic % | |||||
|---|---|---|---|---|---|---|
| Si | O | Ca | Al | Mg | Na | |
| 20 | 18.97 | 70.27 | 5.36 | 3.94 | 1.13 | 0.31 |
| 450 | 18.94 | 67.55 | 5.60 | 3.62 | 2.66 | 1.27 |
| 500 | 19.72 | 67.7 | 5.56 | 4.56 | 1.34 | 1.12 |
| 600 | 19.26 | 67.84 | 6.14 | 4.42 | 1.66 | 0.67 |
Table 2.
Summary of flaws observed on fracture surfaces produced by failure in pure tension, using both as-received and heat treated E-glass fibres.
Table 2.
Summary of flaws observed on fracture surfaces produced by failure in pure tension, using both as-received and heat treated E-glass fibres.
| Sample | Fracture Surfaces Available | Type 1 | Type 2 | Type 3 |
|---|---|---|---|---|
| Surface flaw data | No. | No visible origin | Visible origin | Internal pore |
| Continuous E-glass | 19 | 15 | 4 | 0 |
Table 3.
Comparison of measured average strengths of heat-treated fibres, with calculated strengths based on zmin values taken from AFM topography of heat-treated fibres.
Table 3.
Comparison of measured average strengths of heat-treated fibres, with calculated strengths based on zmin values taken from AFM topography of heat-treated fibres.
| Treatment Temperature (°C) | Measured Avg. Strength (GPa) | Avg. zmin (nm) | Calculated Strength (GPa) | Calculated Strength (GPa) |
|---|---|---|---|---|
| Y = 1.12 | Y = 1.29 | |||
| 200 | 1.42 | −8.5 | 5.0 | 4.3 |
| 300 | 1.31 | −22.2 | 3.1 | 2.7 |
| 400–450 | 1.12 | −11.9 | 4.2 | 3.7 |
| 500 | 0.83 | −14.8 | 3.8 | 3.3 |
| 600 | 0.66 | −21.4 | 3.1 | 2.7 |
| 700 | 0.31 | −31.7 | 2.6 | 2.2 |
© 2019 by the authors. Licensee MDPI, Basel, Switzerland. This article is an open access article distributed under the terms and conditions of the Creative Commons Attribution (CC BY) license (http://creativecommons.org/licenses/by/4.0/).
Share and Cite
MDPI and ACS Style
Jenkins, P.G.; Yang, L.; Thomason, J.L.; Chen, X.; Watts, J.F.; Hinder, S.J. Investigation of Chemical and Physical Surface Changes of Thermally Conditioned Glass Fibres. Fibers 2019, 7, 7. https://0-doi-org.brum.beds.ac.uk/10.3390/fib7010007
AMA Style
Jenkins PG, Yang L, Thomason JL, Chen X, Watts JF, Hinder SJ. Investigation of Chemical and Physical Surface Changes of Thermally Conditioned Glass Fibres. Fibers. 2019; 7(1):7. https://0-doi-org.brum.beds.ac.uk/10.3390/fib7010007
Chicago/Turabian StyleJenkins, Peter G, Liu Yang, James L Thomason, Xinyong Chen, John F Watts, and Steven J Hinder. 2019. "Investigation of Chemical and Physical Surface Changes of Thermally Conditioned Glass Fibres" Fibers 7, no. 1: 7. https://0-doi-org.brum.beds.ac.uk/10.3390/fib7010007
Note that from the first issue of 2016, this journal uses article numbers instead of page numbers. See further details here.