Article

Mechanical Performance of Fused Filament Fabricated and 3D-Printed Polycarbonate Polymer and Polycarbonate/Cellulose Nanofiber Nanocomposites

by
Nectarios Vidakis
1,
Markos Petousis
1,*,
Emmanouil Velidakis
1,
Mariza Spiridaki
1 and
John D. Kechagias
2
1
Mechanical Engineering Department, Hellenic Mediterranean University, 71410 Heraklion, Greece
2
General Department, University of Thessaly, 41500 Larissa, Greece
*
Author to whom correspondence should be addressed.
Submission received: 8 September 2021 / Revised: 9 November 2021 / Accepted: 16 November 2021 / Published: 18 November 2021

Abstract

:
In this study, nanocomposites were fabricated with polycarbonate (PC) as the matrix material. Cellulose Nanofiber (CNF) at low filler loadings (0.5 wt.% and 1.0 wt.%) was used as the filler. Samples were produced using melt mixing extrusion with the Fused Filament Fabrication (FFF) process. The optimum 3D-printing parameters were experimentally determined and the required specimens for each tested material were manufactured using FFF 3D printing. Tests conducted for mechanical performance were tensile, flexural, impact, and Dynamic Mechanical Analysis (DMA) tests, while images of the side and the fracture area of the specimens were acquired using Scanning Electron Microscopy (SEM), aiming to determine the morphology of the specimens and the fracture mechanism. It was concluded that the filler’s ratio addition of 0.5 wt.% created the optimum performance when compared to pure PC and PC CNF 1.0 wt.% nanocomposite material.

1. Introduction

The technology of Additive Manufacturing (AM), in which three-dimensional (3D) printing belongs, is a method utilized for the processing of a wide range of materials to build parts [1]. In most cases, materials are polymers and polymer-based composites [2]. Through AM implementation, it is possible to manufacture parts with complex geometry without the need for special tools and molds [3]. With the employment of a 3D printer, the desirable parts are fabricated in a layer-by-layer manner [4], while it is possible to further tune the final part’s properties by choosing appropriate materials and 3D printing parameters [5]. Additive Manufacturing gives the opportunity to manufacture geometries in products that conventional manufacturing methods are not capable of achieving [6]. In addition, there is also the ability to utilize the AM technology to fabricate already existing products in an optimized way through redesigned processing [7]. Some of the fundamental parameters that would result in optimum performance of the final fabricated part are the material selection [8], the accuracy of the 3D-printing process [9], the 3D-printing speed [8], the geometry characteristics of the slicing process, etc. [7].
Fused Filament Fabrication (FFF) belongs to the material extrusion category [10,11] of the existing AM available technologies. In this method, parts are usually made of a thermoplastic material. Raw material is in filament form, and the manufacturing of part is achieved by its continuous flow through the 3D printer’s extrusion head. The extrusion head is heated to a temperature at which the material is in a melted state and is electronically driven to specific paths [12]. Each path followed by the head to fabricate the requested geometry is determined by computer control, and it is inserted in the 3D printer’s control panel in G-code file type [13].
Polycarbonate (PC) in its pure state is a transparent thermoplastic polymer with chemical structures consisting of carbonate groups. When it comes to engineering applications, PC material is commonly used, as it is strong, tough, and durable [14]. In addition, the ease of processing PC in conventional manufacturing methods such as injection molding, thermoforming, etc. is an additional asset [15]. Polycarbonate has the benefit of being stiff, with good thermal resistance and high viscosity when being processed [7].
The selected nanofiller for the purposes of this study is Cellulose Nanofiber (CNF), and it is one of the most advanced biomass materials, renewable, biodegradable, and of low cost, arising from plants, algae, and bacteria. It is possible to isolate from wood-derived fiber (pulp) [16], which was firstly micro refined to the size of hundredths of nano pieces [17].
The innovation of Additive Manufacturing is mainly in its ability to produce complex geometry parts without raising manufacturing costs [18], while the cost–part quantity graph remains flat [19]. Such assets are creating the potential for AM implementation in a wide range of engineering applications, where high complexity exists for the requested parts. For AM technologies, the reported disadvantages are mainly related to poor fusion [13,20] and anisotropic behavior [8], which is usually due to layer-by-layer adhesion quality issues. To improve the performance of the 3D-printed parts, much research has been conducted regarding the selection of 3D printing parameters [21], such as layer height [20,21,22,23,24], extrusion temperature [22,23,24,25,26], infill pattern [4,27] and ratio, etc. Another way to improve such anisotropy in mechanical and other properties is to create new composite materials [28,29,30,31]. Such materials can improve fusion in the 3D-printing structure while at the same time contribute to the improvement of mechanical [13,32,33,34] and/or other properties [6,35,36,37,38,39,40,41,42].
Research on PC with CNF as an additive in a wide range of forms (micro, nano scale, etc.) has been presented in the literature [37,38,39,40], which is probably due to the enhanced performance of the matrix material and the low cost, mechanical strength, and eco-friendly nature of the filler. Nevertheless, it should be mentioned that such studies are focused on conventional manufacturing methods (injection molding, thermoforming etc.), while according to the authors’ knowledge, there has been no implementation so far of such nanocomposite materials in Additive Manufacturing. CNF addition was selected to be at low, up to 1 wt.%, “loadings” in this study. This selection was made to ensure that nanocomposites will not be affected by the high temperatures of processing required to keep PC in a melt state.
Cellulose Nanofiber (CNF) was used as a filler in different “loadings” in the polycarbonate (PC) matrix to fabricate the nanocomposite materials with a thermomechanical melt mixing process. Filler percentages of 0.5 wt.% and 1.0 wt.% were selected. Specimens were manufactured using FFF 3D printing AM technology. Tensile, flexural, and impact tests were conducted, and Vickers microhardness measurements were taken. All the mechanical tests’ experimental results were thoroughly analyzed. Morphological analysis was also implemented on the 3D-printed specimens through Scanning Electron Microscopy (SEM). Dynamic Mechanical Analysis (DMA) and Differential Scanning Calorimetry (DSC) were conducted to aid better comprehension of the other test results. It was found that specimens with 0.5 wt.% filler percentage had the highest mechanical response, depicting a low filler percentage threshold for this specific filler on the PC polymer matrix.

2. Materials and Methods

2.1. Materials

This study was conducted using polycarbonate (PC) and more specifically EMERGE (PC) 8430, which was procured from Styron Europe GmbH (Horgen, Switzerland). According to the manufacturer’s technical datasheet, the density is 1.20 g/cm3, the tensile stress at fracture is 70.0 MPa, and the elongation at fracture is 110%. Cellulose nanofibers (Cellulose Nanofibril, Nanofibrillated Cellulose, CNFs), which were procured from Nanografi Nanotechnology (Ankara, Turkey), with 329 °C decomposition temperature and 1.50 g/cm3 density, were also used for the purposes of this study in two different filler’s weight-to-weight quantities which were 0.5 wt.% and 1.0 wt.%. Pure polycarbonate (PC) was also tested in the study.

2.2. Methods

Figure 1 below summarizes and presents in brief the methods and steps that were implemented during the current study.

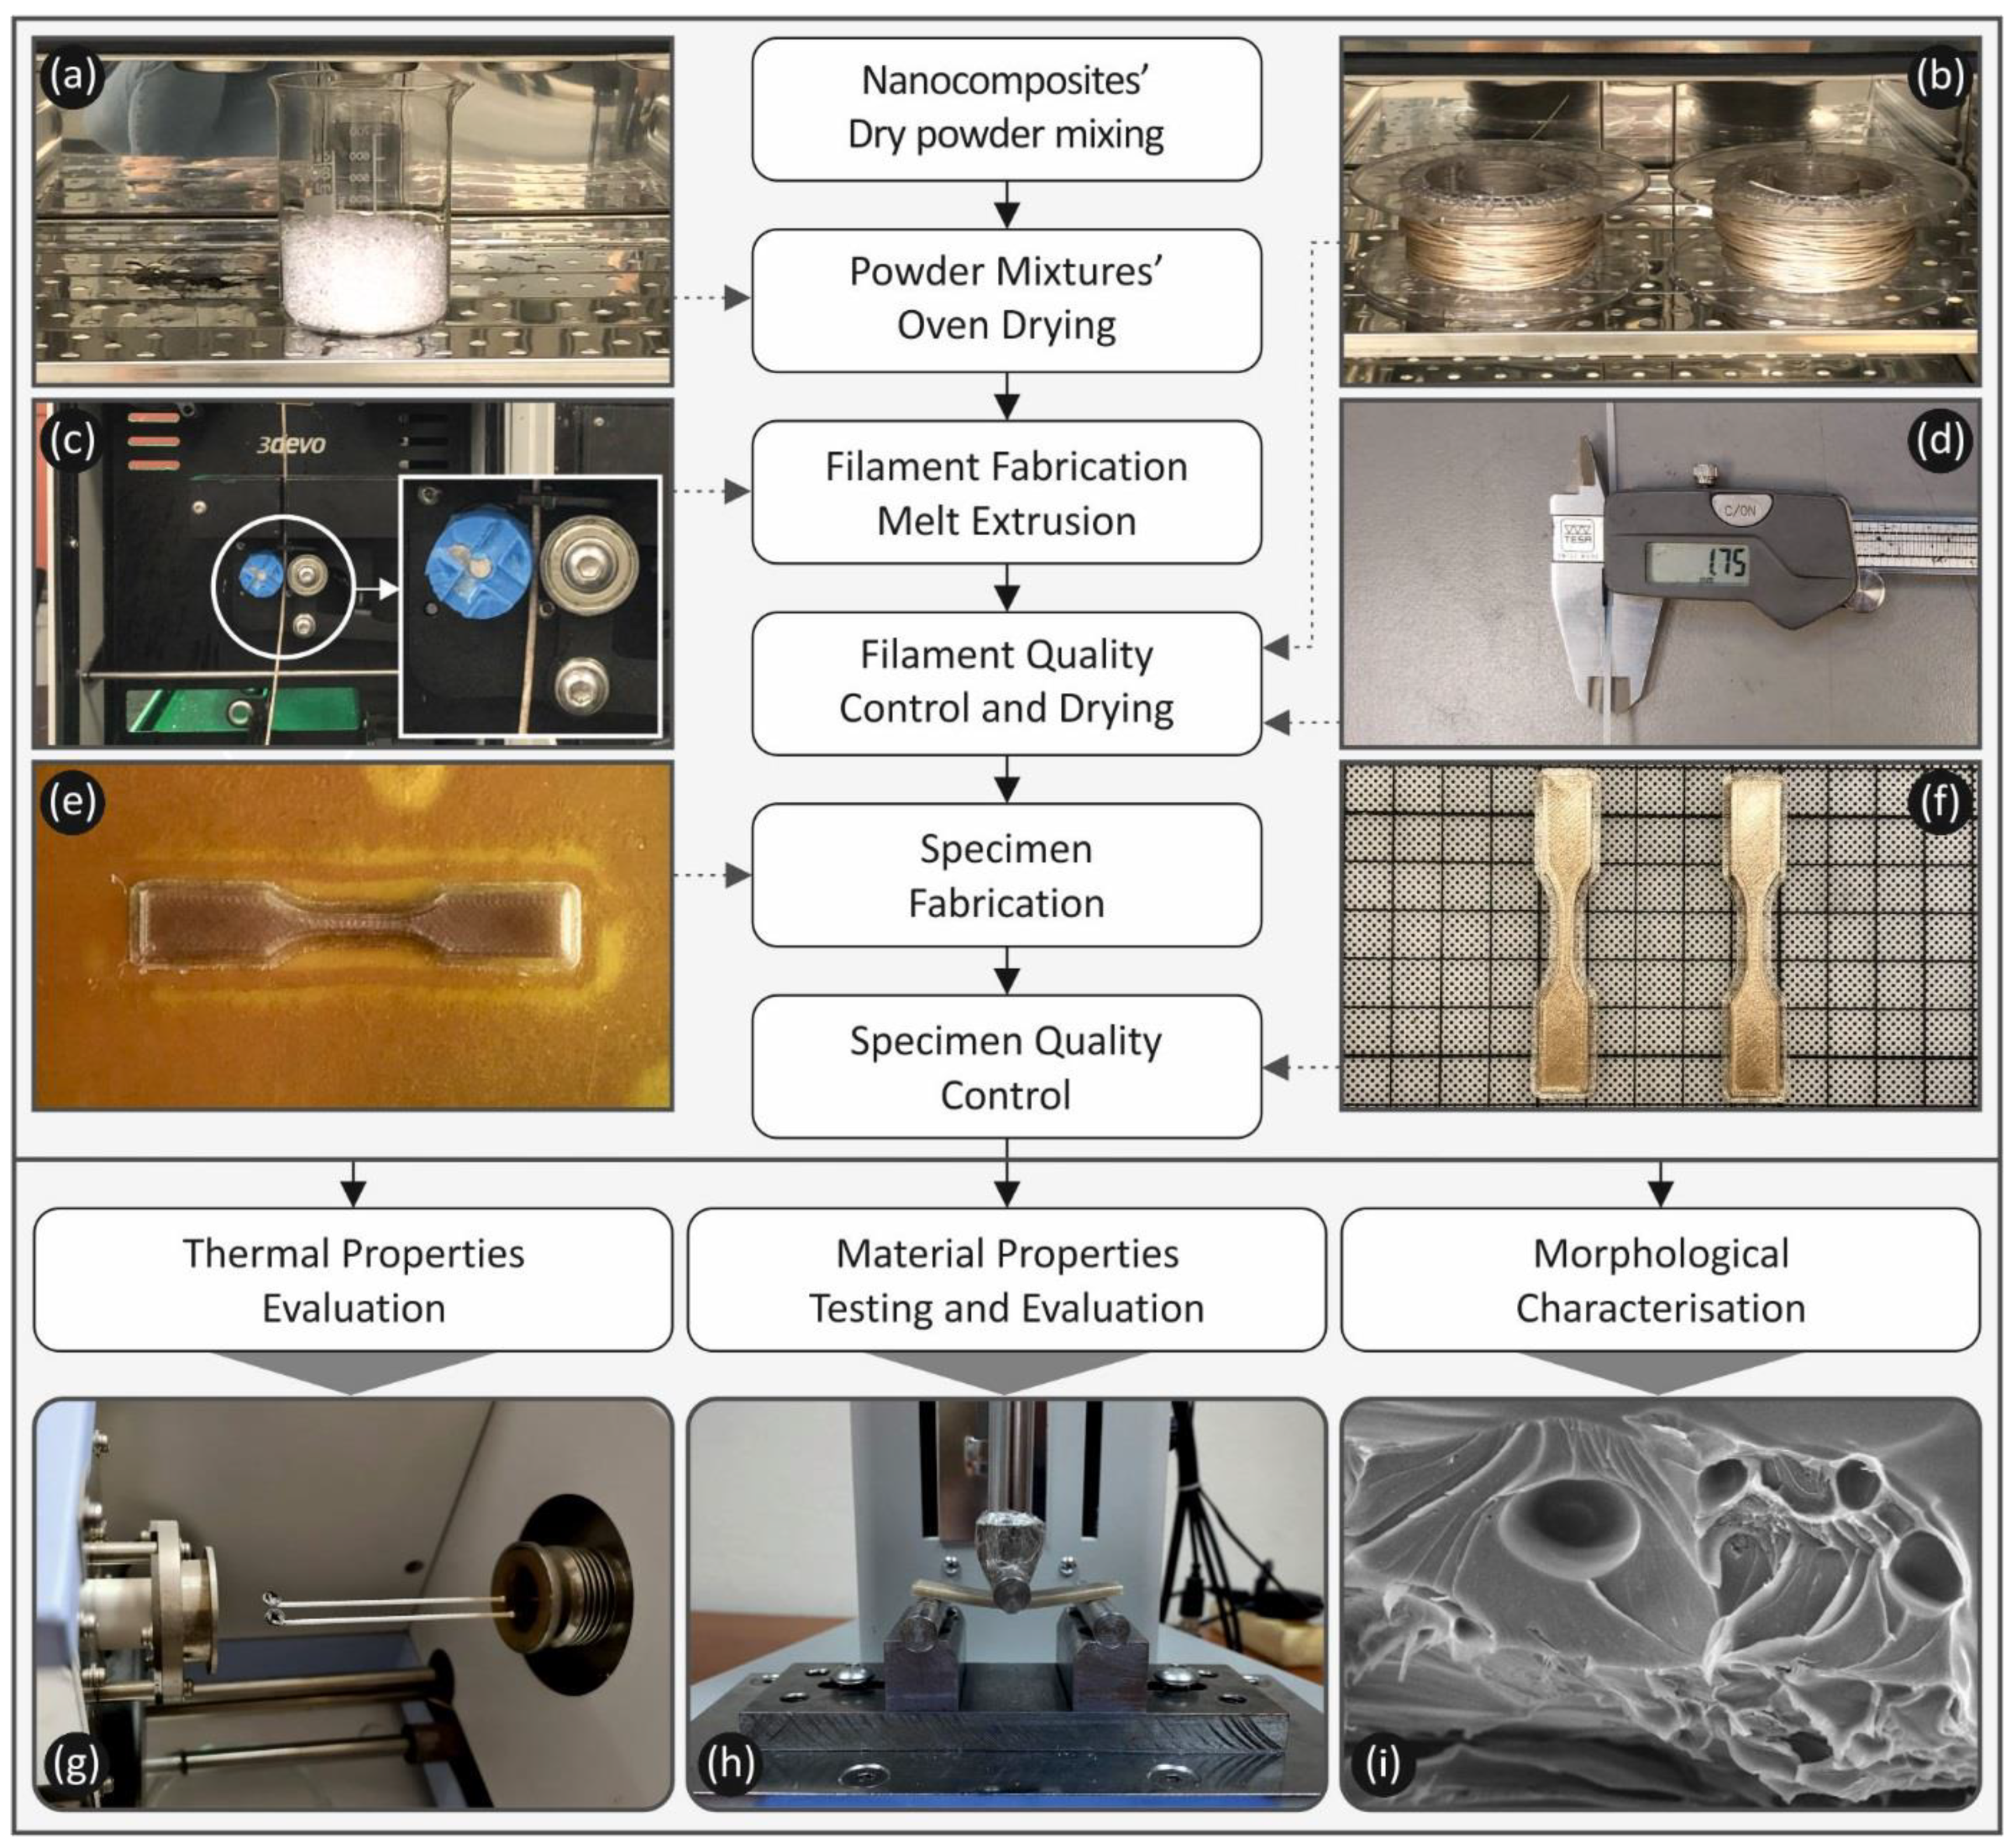
2.2.1. Fabrication of Filaments and FFF 3D-Printing Process of PC and PC/CNF Nanocomposites

The PC granules were initially placed in an industrial oven at 120 °C for 4 h to dry. Then, nanocomposites were dry mixed using a lab mixer before each extrusion process. The extrusion of the granules followed using a 3D Evo Composer 450 (3D Evo B.V., Utrecht, The Netherlands) to fabricate filaments with 1.75 mm diameter. Temperatures set to heat the four different zones of the extruder were 245 °C for heat zones 1, 2, and 3 (with heat zone 1 being the one closer to the extruder’s nozzle), while heat zone 4 (the one closer to the extruder’s hopper) was set at 200 °C. The rotation speed of the extruder’s screw was set to 6.5 rpm, and the cooling fans after the nozzle were set to 50% speed. These data were kept constant in the production of all the different filaments (pure PC, PC/CNF nanocomposites with 0.5 wt.% and 1.0 wt.% loadings). Then, the filaments produced were dried under the same conditions before their usage for specimens’ production with the 3D printing process.
Fused Filament Fabrication (FF) was the method chosen for the manufacturing of the specimens, and the FFF 3D printer used was an Intamsys Funmat HT (Intamsys Technology Co., Ltd., Shanghai, China). Figure 2 shows the exact parameters that were set for the 3D-printing process. This specific 3D printer has a total-closed chamber to reach and keep a steady temperature, which is a necessity for PC processing during the 3D-printing procedure. Parameters not included in Figure 2 were kept in their default values by selecting the PC polymer as the 3D-printing material in the Intamsuite software platform, which is the slicing software utilized in this study.

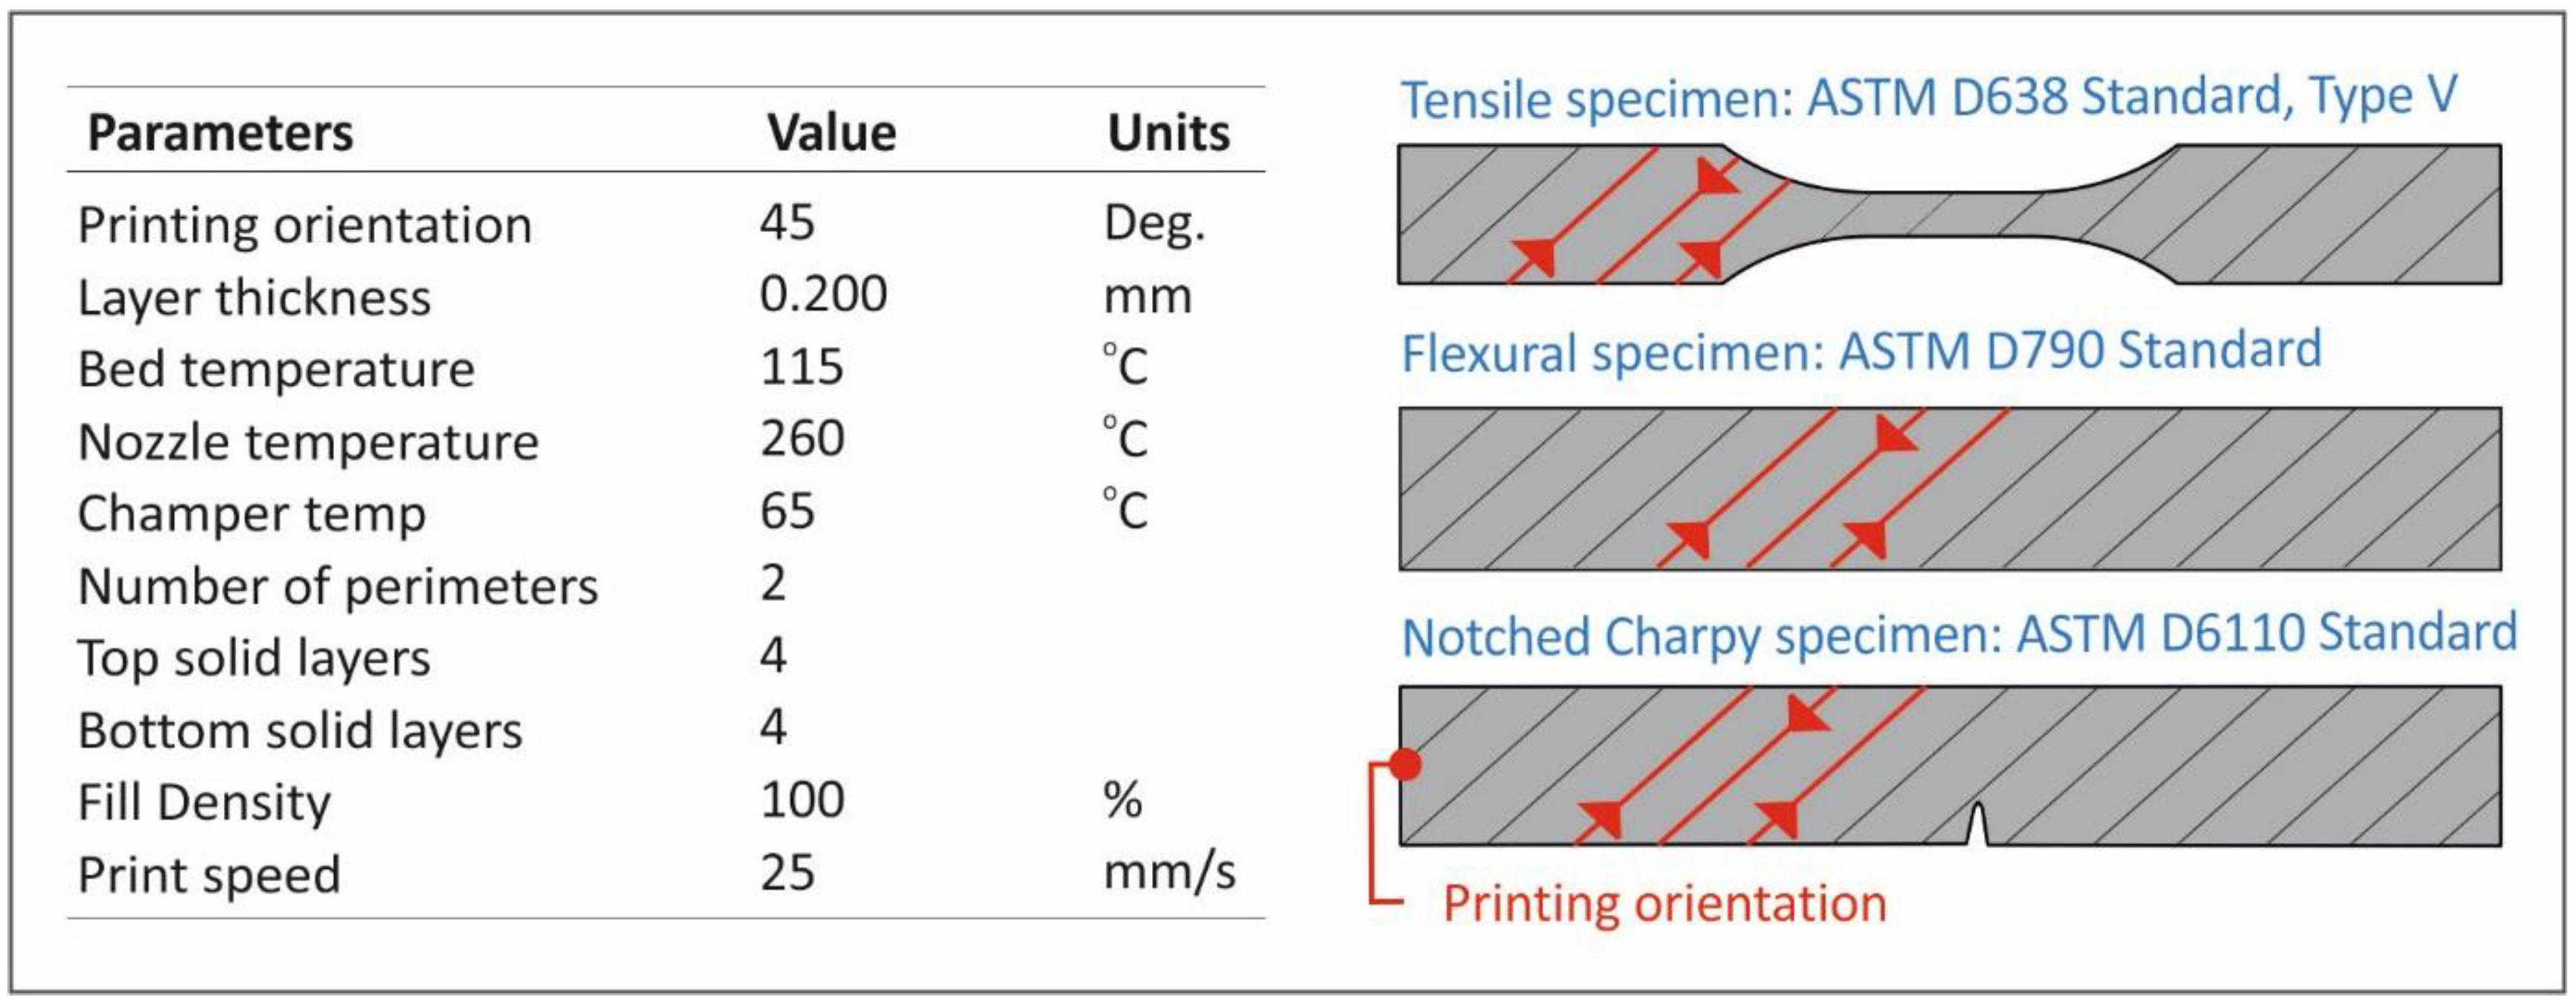
2.2.2. Mechanical Properties Testing

To test the tensile response of the specimens of this study, the American Society for Testing, and the Materials (ASTM) D638-02a international standard [43] was followed. Five (5) type V specimens, according to the standard, with a thickness of 3.2 mm for each material, were tested. The device utilized for the tensile testing was an Imada MX2 (Imada Inc., Northbrook, IL, United States) with the elongation speed set at 10 mm/min, while the room temperature conditions were of 22 °C, ≈50% RH.
For the flexural tests of the specimens, ASTM D790-10 [44] was followed. The five (5) produced specimens of each material (a total of 15) were of 3.2 mm thickness. All were tested using a three-point bending setup on the apparatus stated in Section 2.2.2., with 10 mm/min elongation speed, at room temperature conditions (22 °C, ≈50% RH).
ASTM D6110-04 [45] was the standard for the impact tests. Notched Charpy’s specimens were prepared and tested. The specimens’ length was 80 mm, the width was 10 mm, and the height was 8 mm. The utilized device for the tests was a Terco MT220 Charpy (Terco AB, Kungens Kurva, Sweden). The release height of the hammer for all tests was 367 mm and during the experiments, the room temperature was 22 °C, and the humidity was ≈50% RH.
Microhardness is a material’s property associated with its mechanical response and its plasticity [46]. The international standard used for the Vickers Microhardness measurements on the specimens was the ASTM E384-17 [47]. Specimens were randomly picked through all fabricated specimens (tensile, flexure, and impact). Their surfaces were fully polished before the measurements. The machine used for the test was an Inova Test 300- Vickers (Innovatest Europe BV, Maastricht, the Netherlands). The indentations duration was set at 10 s. Five imprints were measured for each of the different fabricated materials. Measurements conditions were room temperature of 22 °C and humidity of ≈50% RH. The applied force for the indentation was 100 gF.
For a thorough investigation of the mechanical performance, Dynamic Mechanical Analysis (DMA) was also performed on 3D-printed specimens, according to ASTM D4065-12 [48] international standard. A Hybrid TA Instruments rheometer DHR 20 (TA Instruments, New Castle, DE, USA) was utilized. Specimens were placed on a three-point fixture by applying a preload of 0.1 N. A temperature ramp rate of 5 °C/min was followed for a range from 30 to 200 °C.

2.2.3. Morphology and Thermal Analysis

For the morphology analysis, Scanning Electron Microscopy (SEM) was utilized. The machine used for the SEM investigations was a JEOL JSM 6362 LV (Jeol Ltd., Peabody, MA, USA) electron microscope with a 20 kV acceleration voltage on sputtered gold-coated samples in high vacuum mode. Images were taken at two magnification levels. SEM images were acquired at the side surface of the tensile specimens, while images were also acquired from the fractal area of a random specimen of each tested material after the tensile test.
Thermogravimetric Analysis (TGA) was conducted in samples taken from the tensile specimens. For the testing, a Perkin Elmer Diamond TGA/DTGA (Waltham, MA, USA) machine was utilized. Tests were conducted from 40 to 550 °C using a constant temperature ramp of 10 °C/min. During the tests, a forced flow of nitrogen gas was kept constant at 200 mL/min.
A Perkin Elmer Diamond DSC (Waltham, MA, USA) laboratory equipment was utilized to perform differential scanning calorimetry (DSC) measurements on samples. A thermal cycle from 30 to 230 °C was selected, keeping a constant temperature ramp of 10 °C/min, which was followed by a cooling phase back to 30 °C. The increase and the decrease of temperature were performed on air.

3. Results

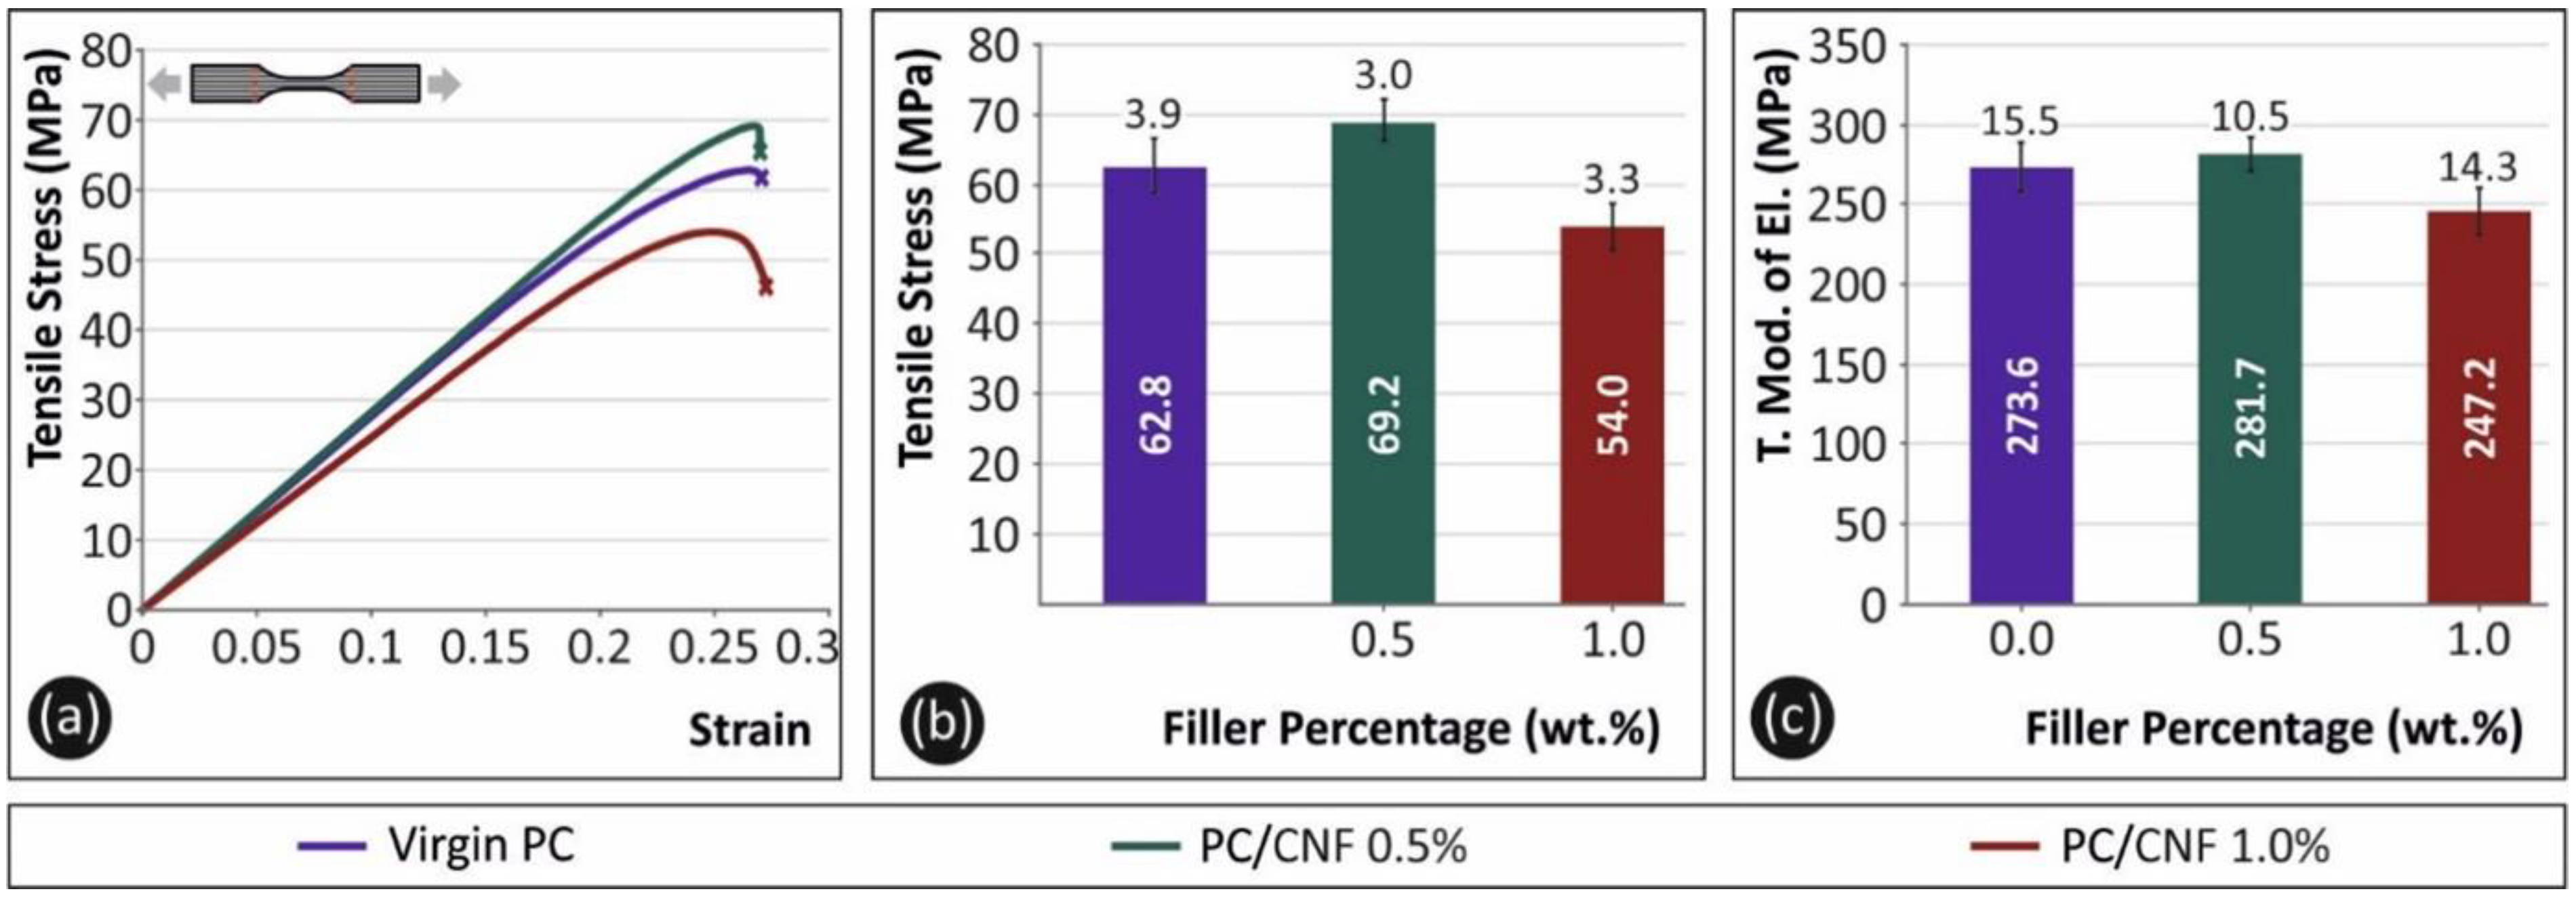
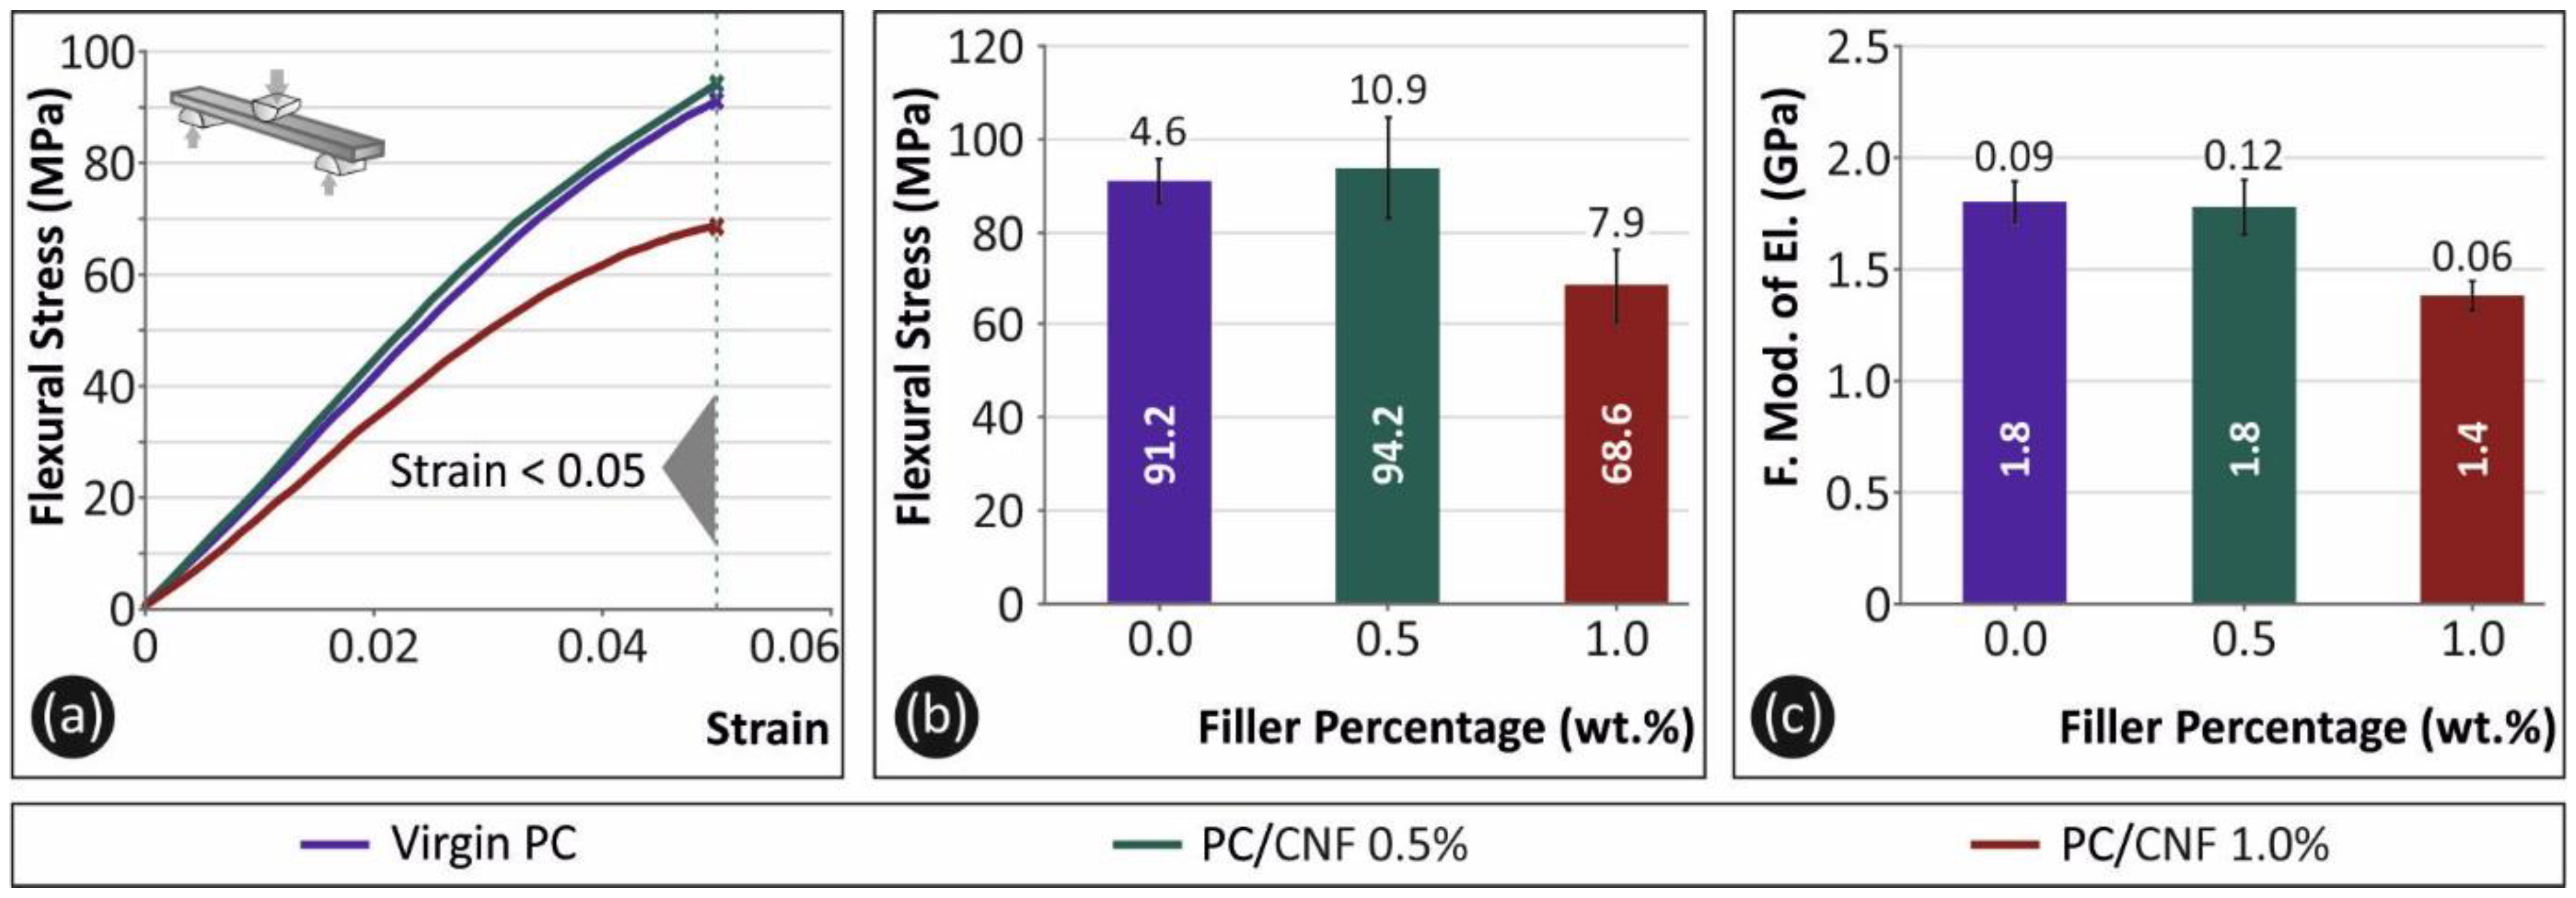
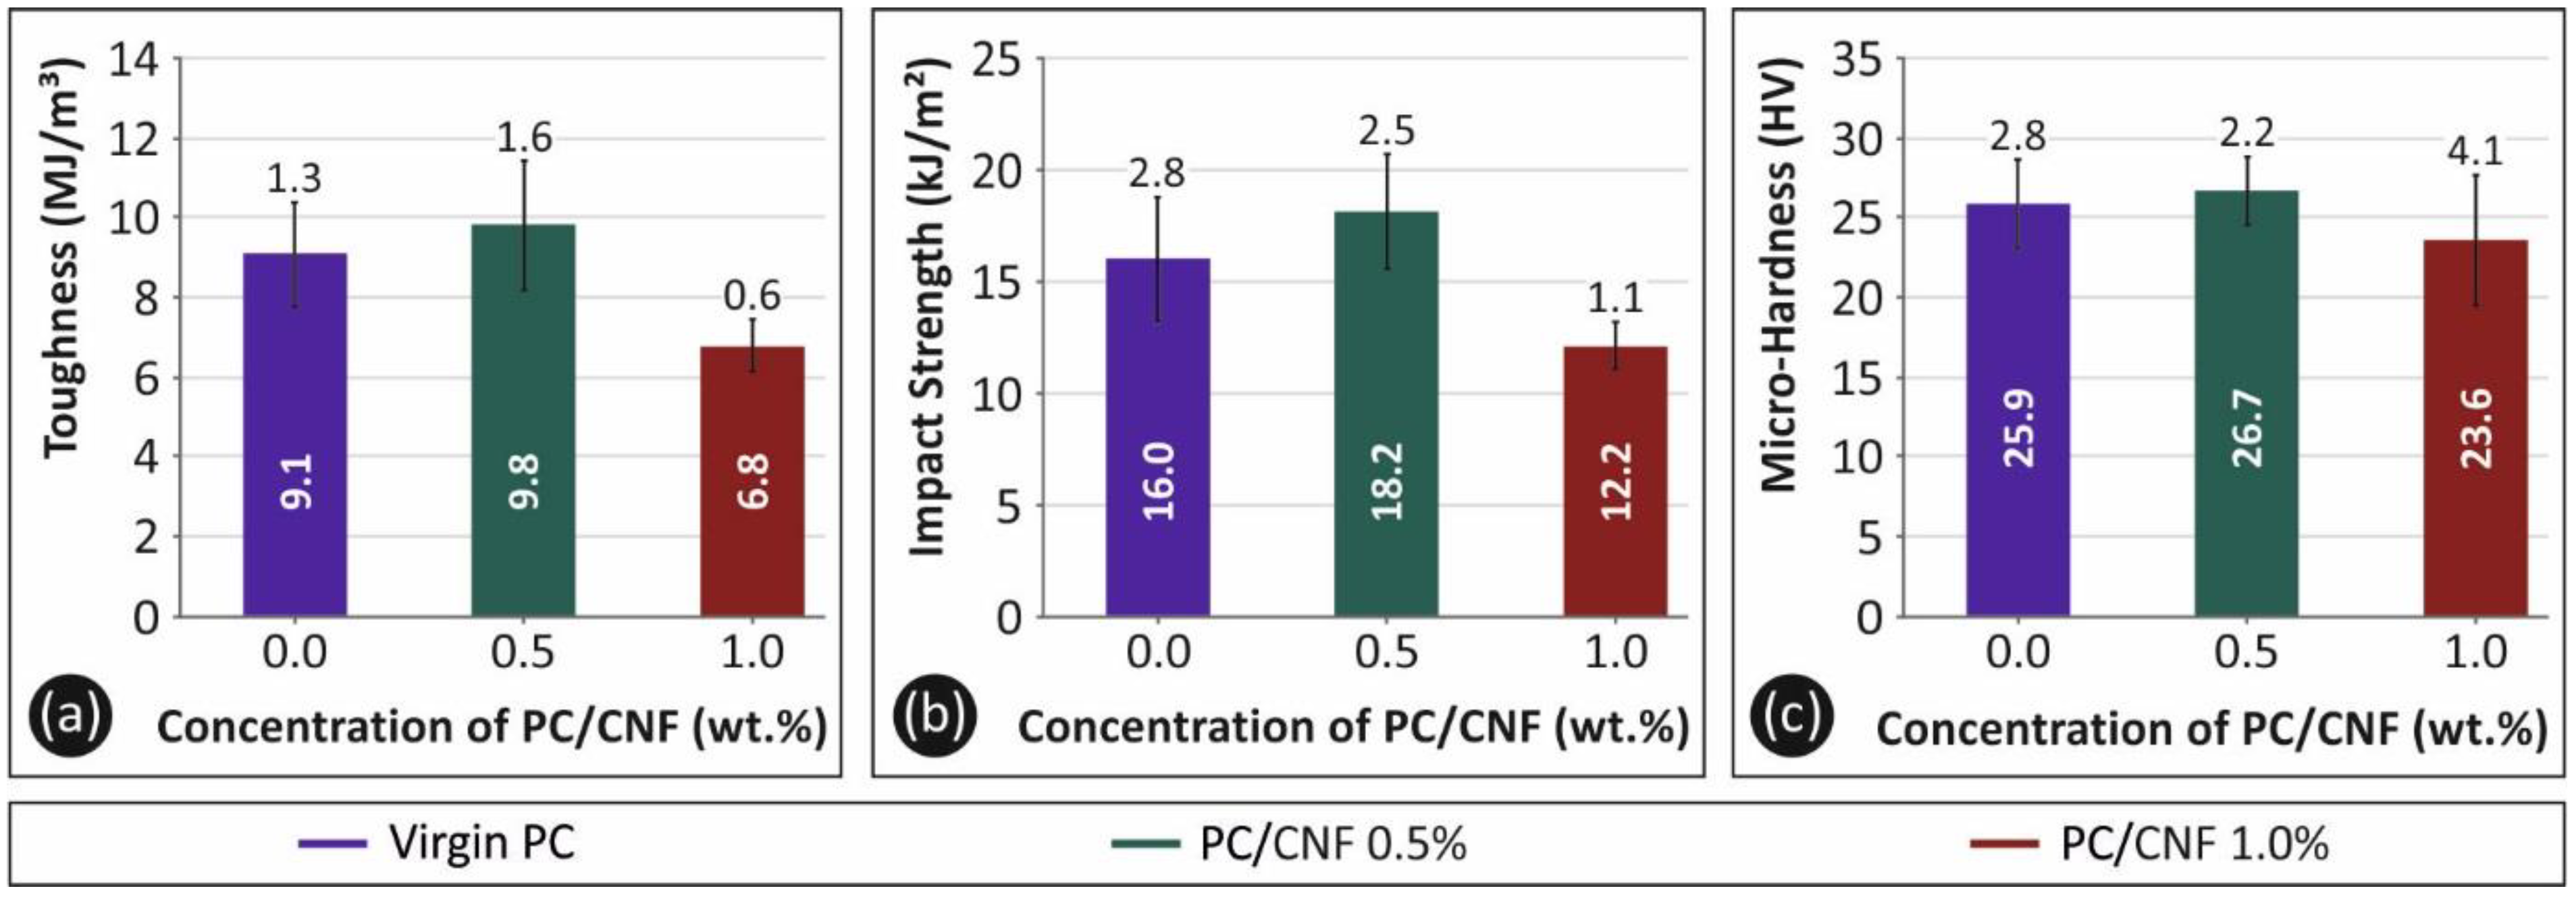
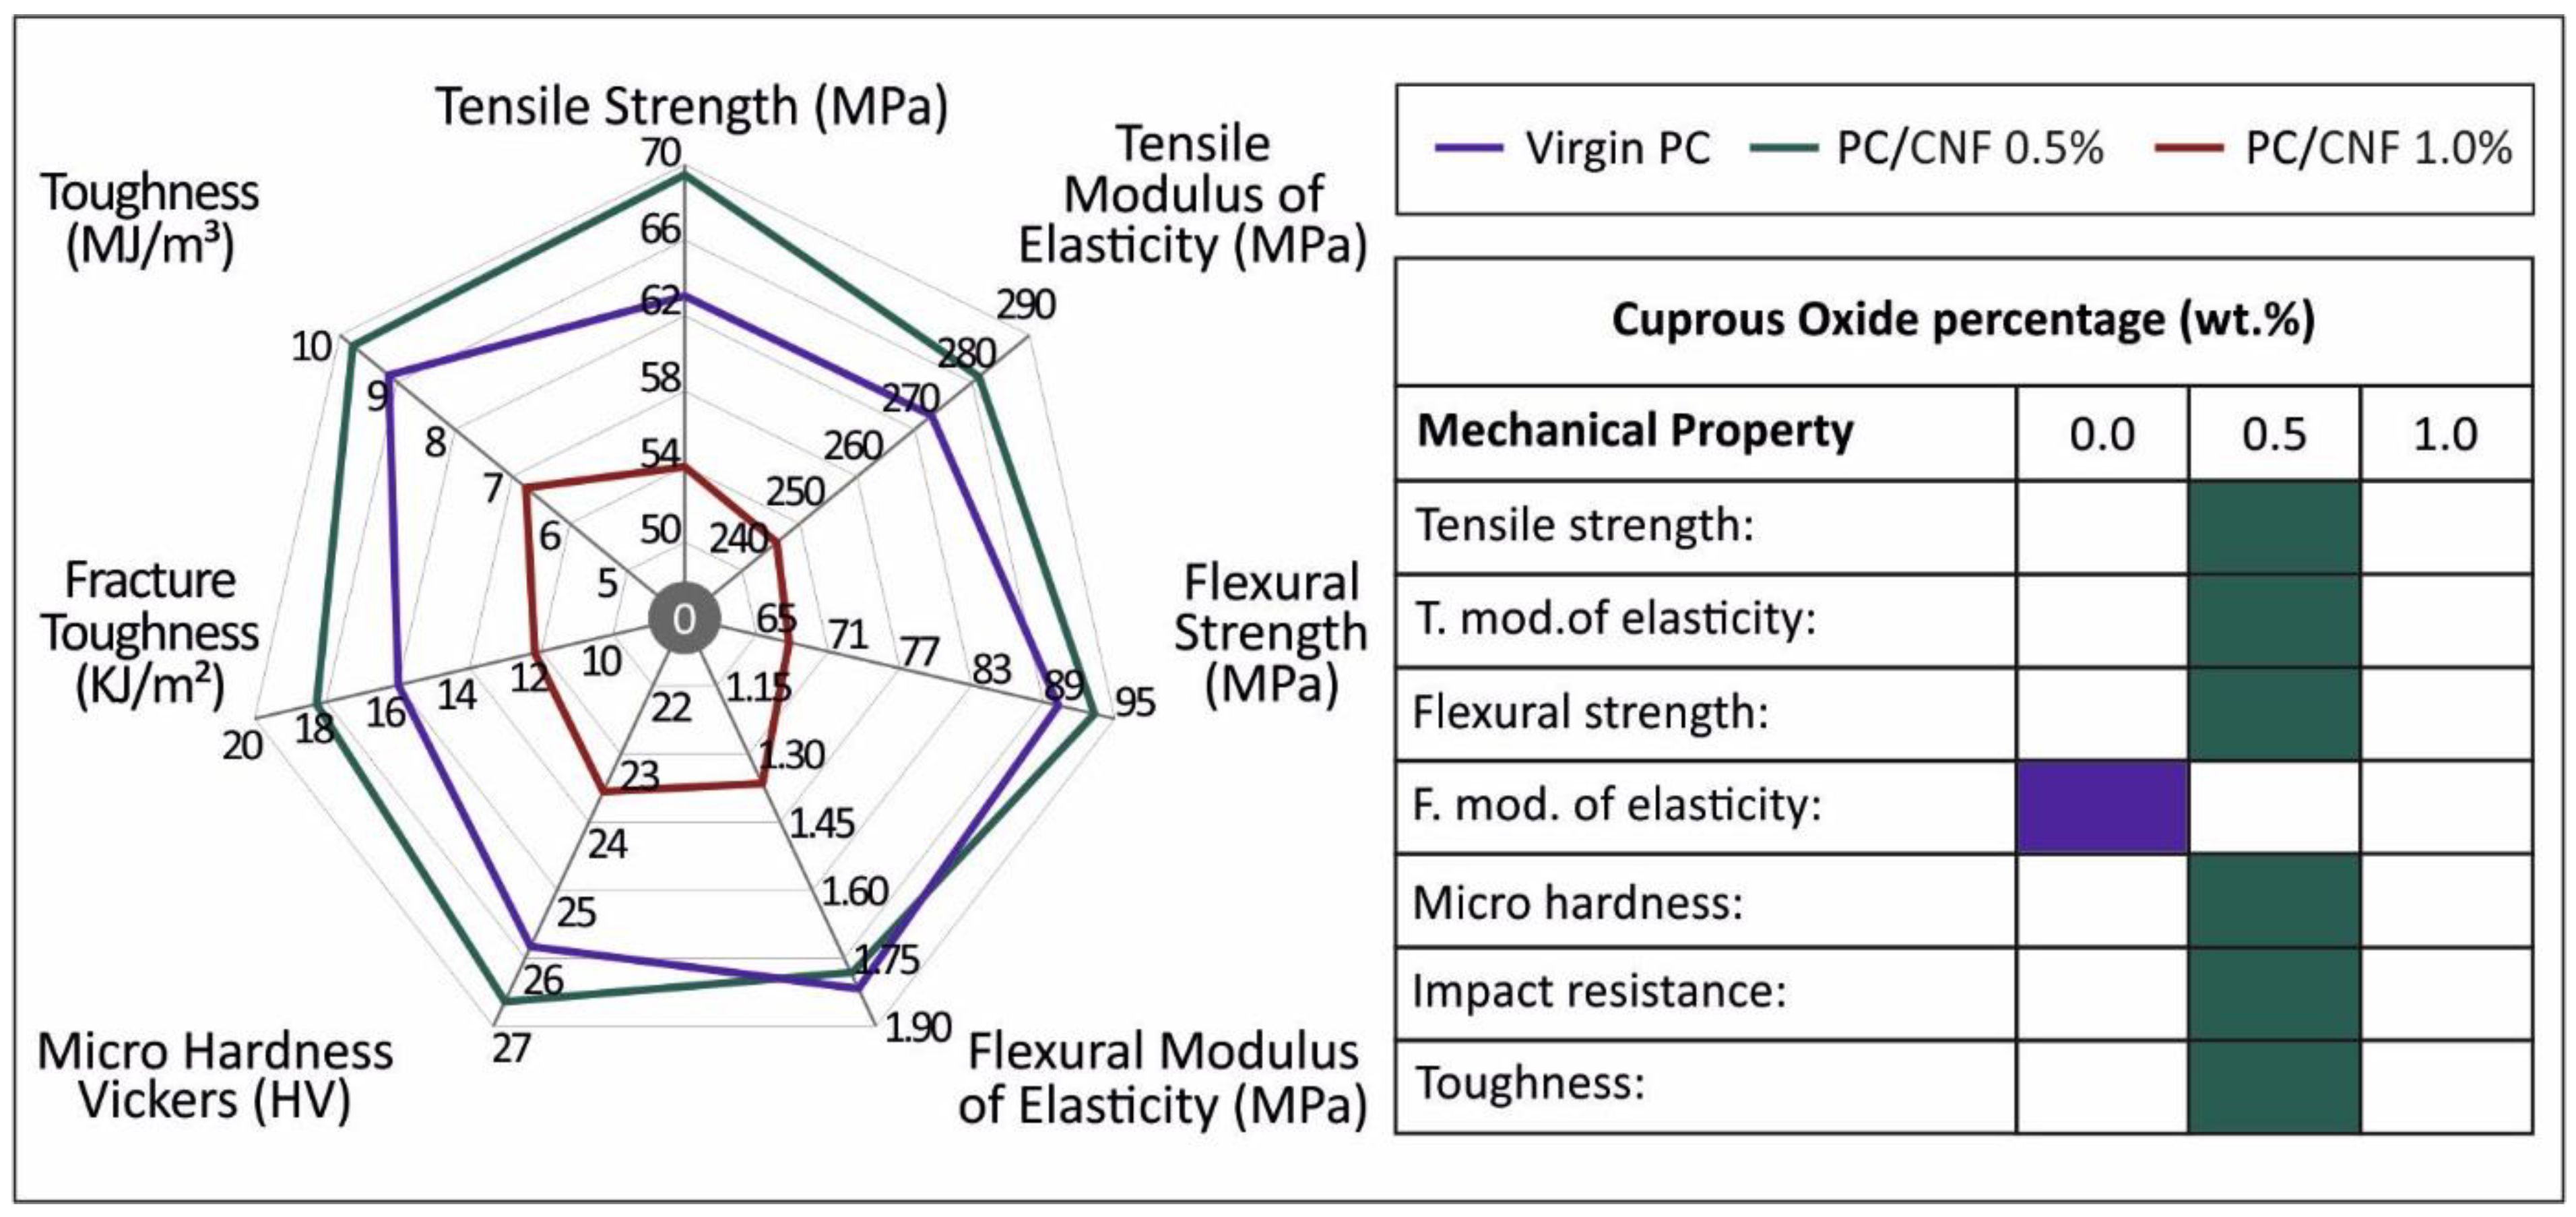
3.1. Mechanical Properties Results

Figure 3 is a presentation of the results calculated after the tensile tests. A representative stress (MPa) to strain (mm/mm) curve is shown for each tested material in Figure 3a. Figure 3b shows the average calculated tensile stress values at fracture (MPa) for PC pure and its CNF nanocomposites fabricated in the study. Figure 3c depicts the calculated average tensile modulus of elasticity (MPa) values for all the materials at different filler loadings. In Figure 3a, it can be observed that regarding the strain before fracture, little differences exist between the different materials, while a slightly more brittle behavior was observed at 1.0 wt.% filler’s ratio. A significant decrease of the tensile strength was exhibited for the PC CNF 1.0 wt.% nanocomposite material. On the contrary, according to Figure 3b, a nanocomposite with a filler loading of 0.5 wt.% manifested an approximately 10% increase in tensile strength compared to the pure polymer (PC). Figure 3c shows a similar trend for the tensile modulus of elasticity for all materials tested.
Figure 4a presents stress (MPa) to strain (mm/mm) curves for all the materials tested. According to the ASTM D790-10 standard instructions and the fact that no fracture occurred at the specimens, the maximum strain is 0.05 mm/mm (or 5%) on the graphs. Figure 4b presents the average maximum flexural stress (MPa) calculated at 5% strain by all materials tested. Figure 4c depicts the average calculated flexural modulus of elasticity (MPa) values. In Figure 4b, it can be observed that 0.5 wt.% CNF concentration exhibits the highest flexural stress value at 5% strain, which is almost 4% higher than the pure PC, while the nanocomposite with 1.0 wt.% CNF content exhibited an almost 25% decrease in values compared to the pure PC. The flexural modulus of elasticity for the pure material and nanocomposite with 0.5 wt.% CNF exhibited little differences, as shown in both Figure 4a,c.
Figure 5a presents the toughness values (MJ/m3) for each material, which was calculated as the integral of the stress to strain curve. Toughness is an indication of the energy required for each specimen’s deformation. Such values are useful to describe the fracture mechanism and create a “safe-fail” procedure in applications. Figure 5b depicts the results from the Charpy’s notched impact tests and more specifically the impact strength (KJ/m2) of each material prepared in this work. Figure 5c shows the values from the microhardness measurements.
In Figure 5a, it is observed that the average calculated toughness of PC CNF 0.5 wt.% is increased by almost 10% compared to the pure PC, while the corresponding composite containing 1.0 wt.% CNF decreased by 30% compared to the pure PC. The impact strength, according to Figure 5b, increased almost 15% in the case of 0.5 wt.% CNF and decreased almost 20% for the 1.0 wt.% filler’s percentage, compared to pure PC. The microhardness values (HV) presented in Figure 5c for the 0.5 wt.% filler concentration do not differ significantly from the corresponding values for the pure material. At 1.0 wt.% concentration, a 10% decrease was measured compared to the pure PC.
In Figure 6c,d, the DMA results for pure PC material (Figure 6c) and PC CNF 0.5 wt.% nanocomposite material (Figure 6d) are presented. The enhancement in mechanical performance due to the CNFs addition was also verified through the DMA as in the entire temperature range employed in the tests; the measured storage modulus increased by almost 100% compared to neat PC. CNFs do not exhibit any effect on the thermomechanical performance of the nanocomposites. The ability to increase the stiffness of the nanocomposite without degrading its thermomechanical performance is desirable in fabricated nanocomposites and can be of great importance in a wide range of applications.

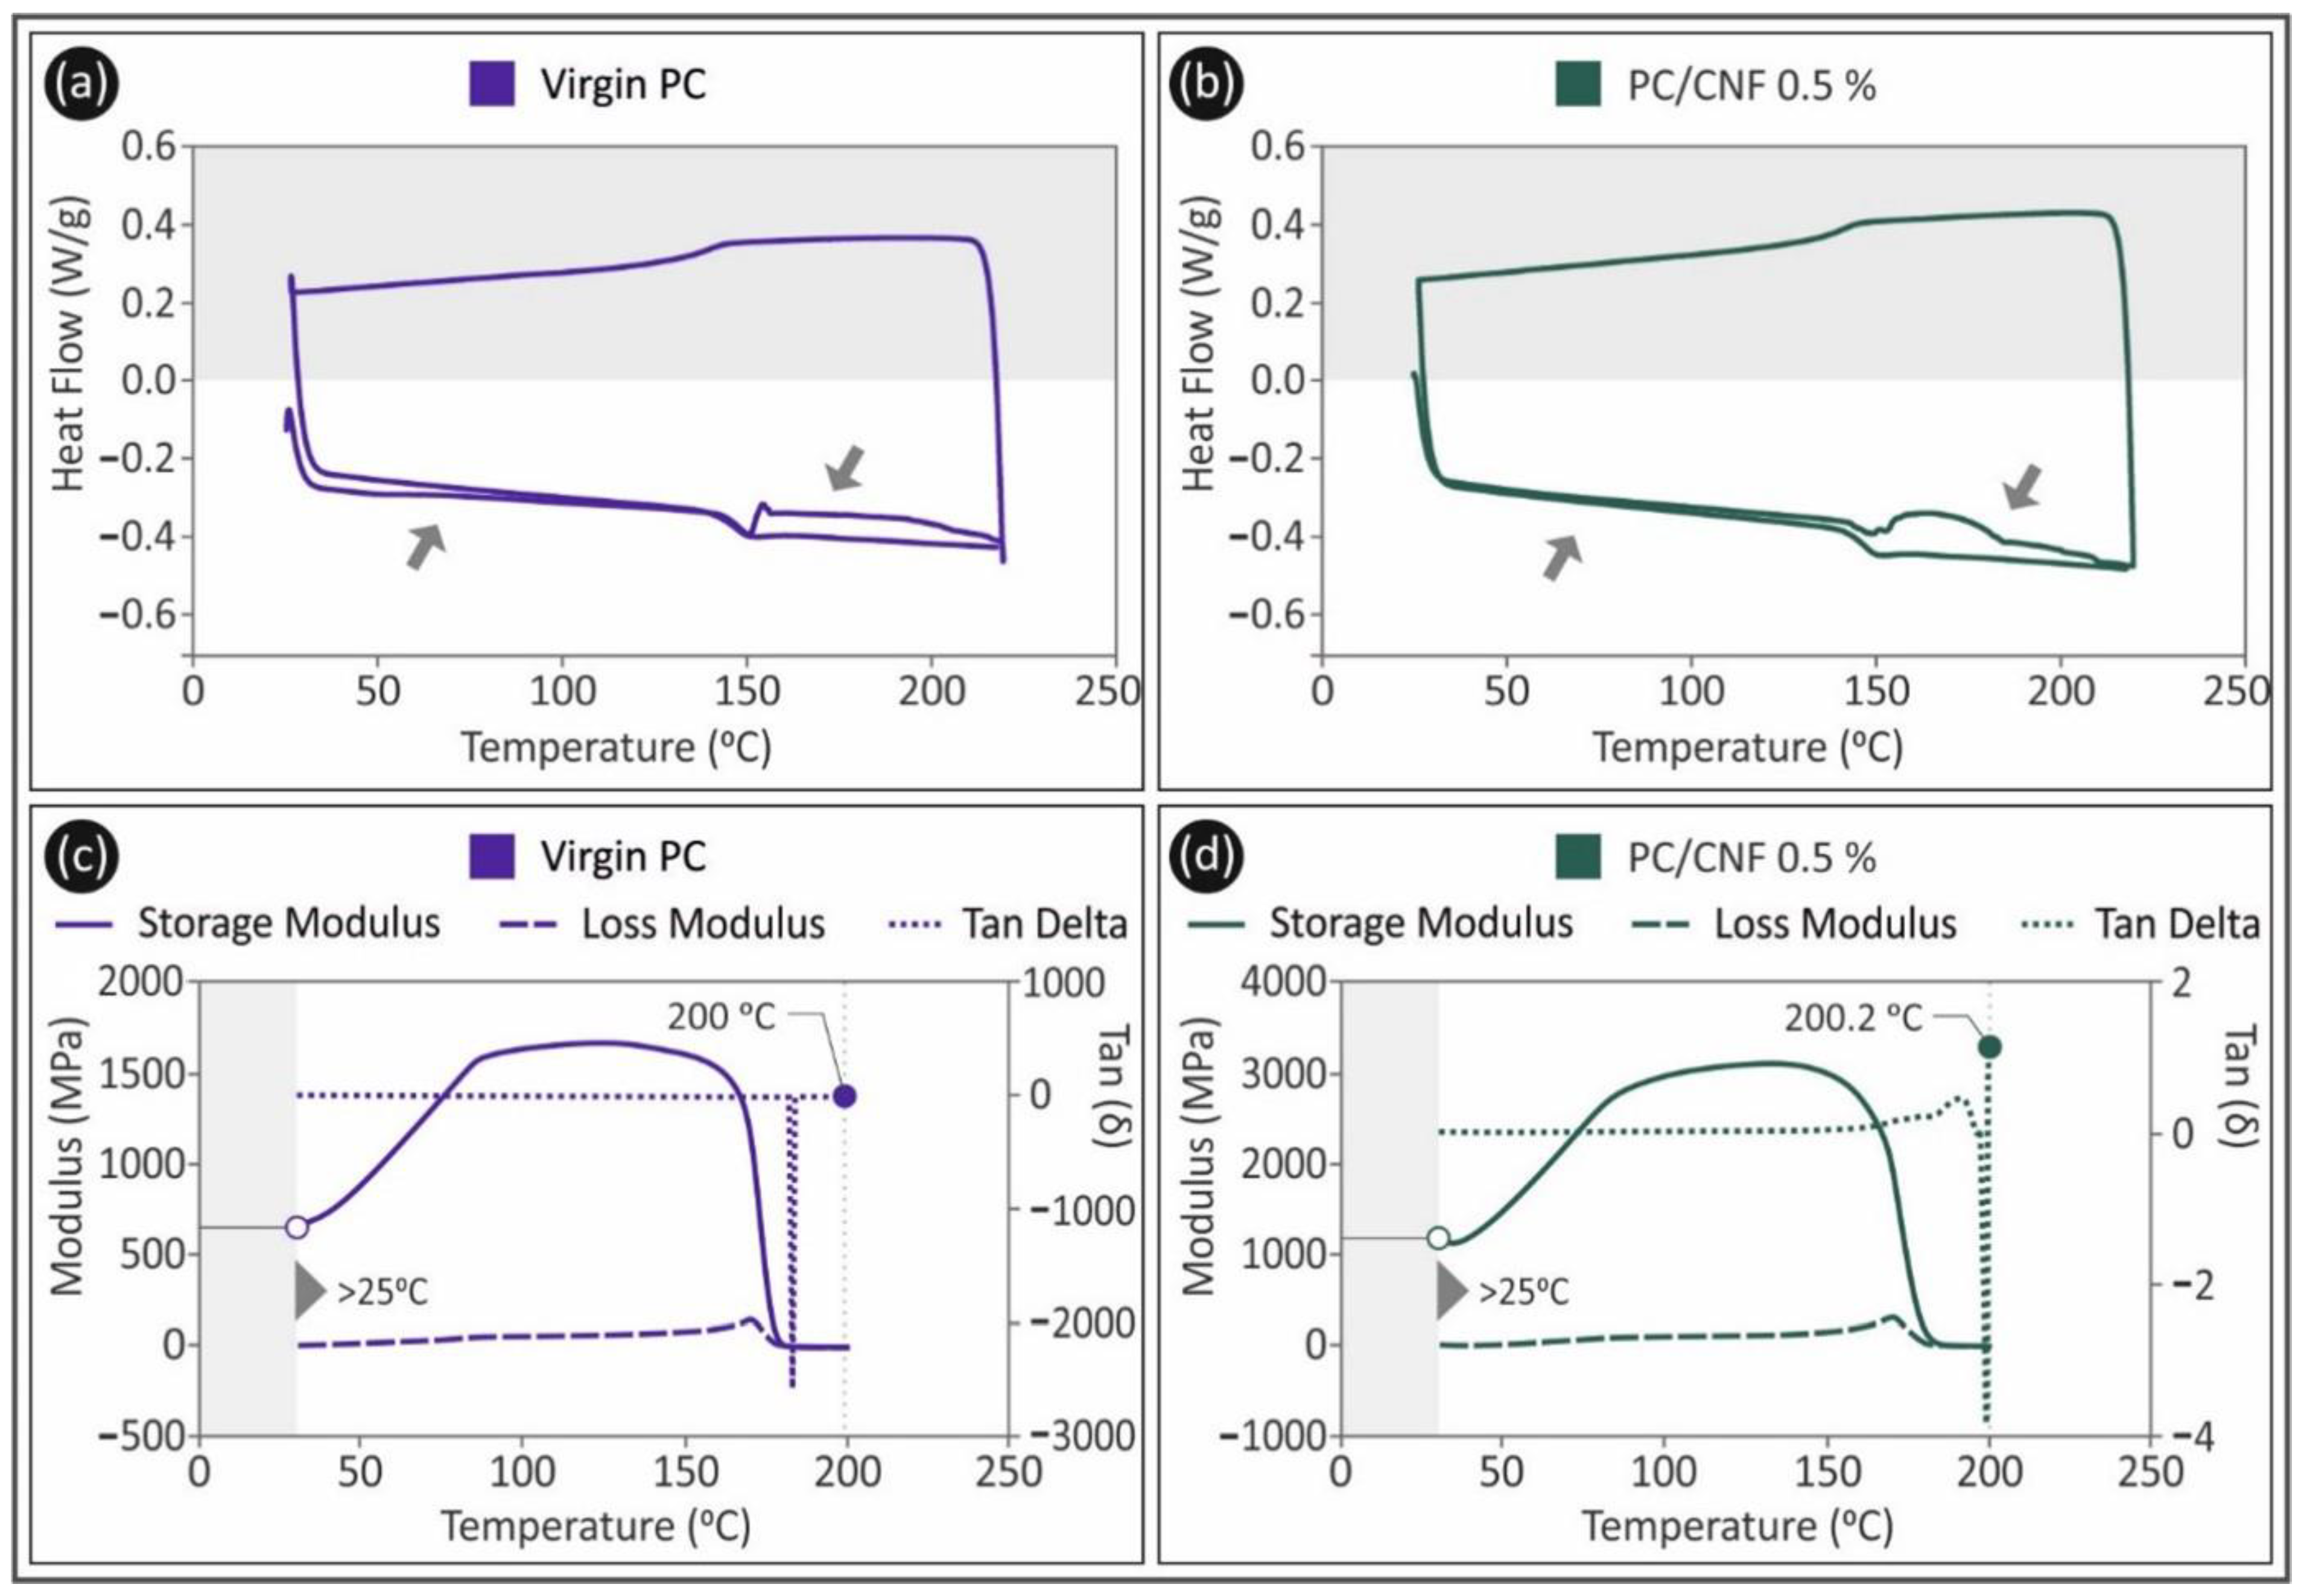
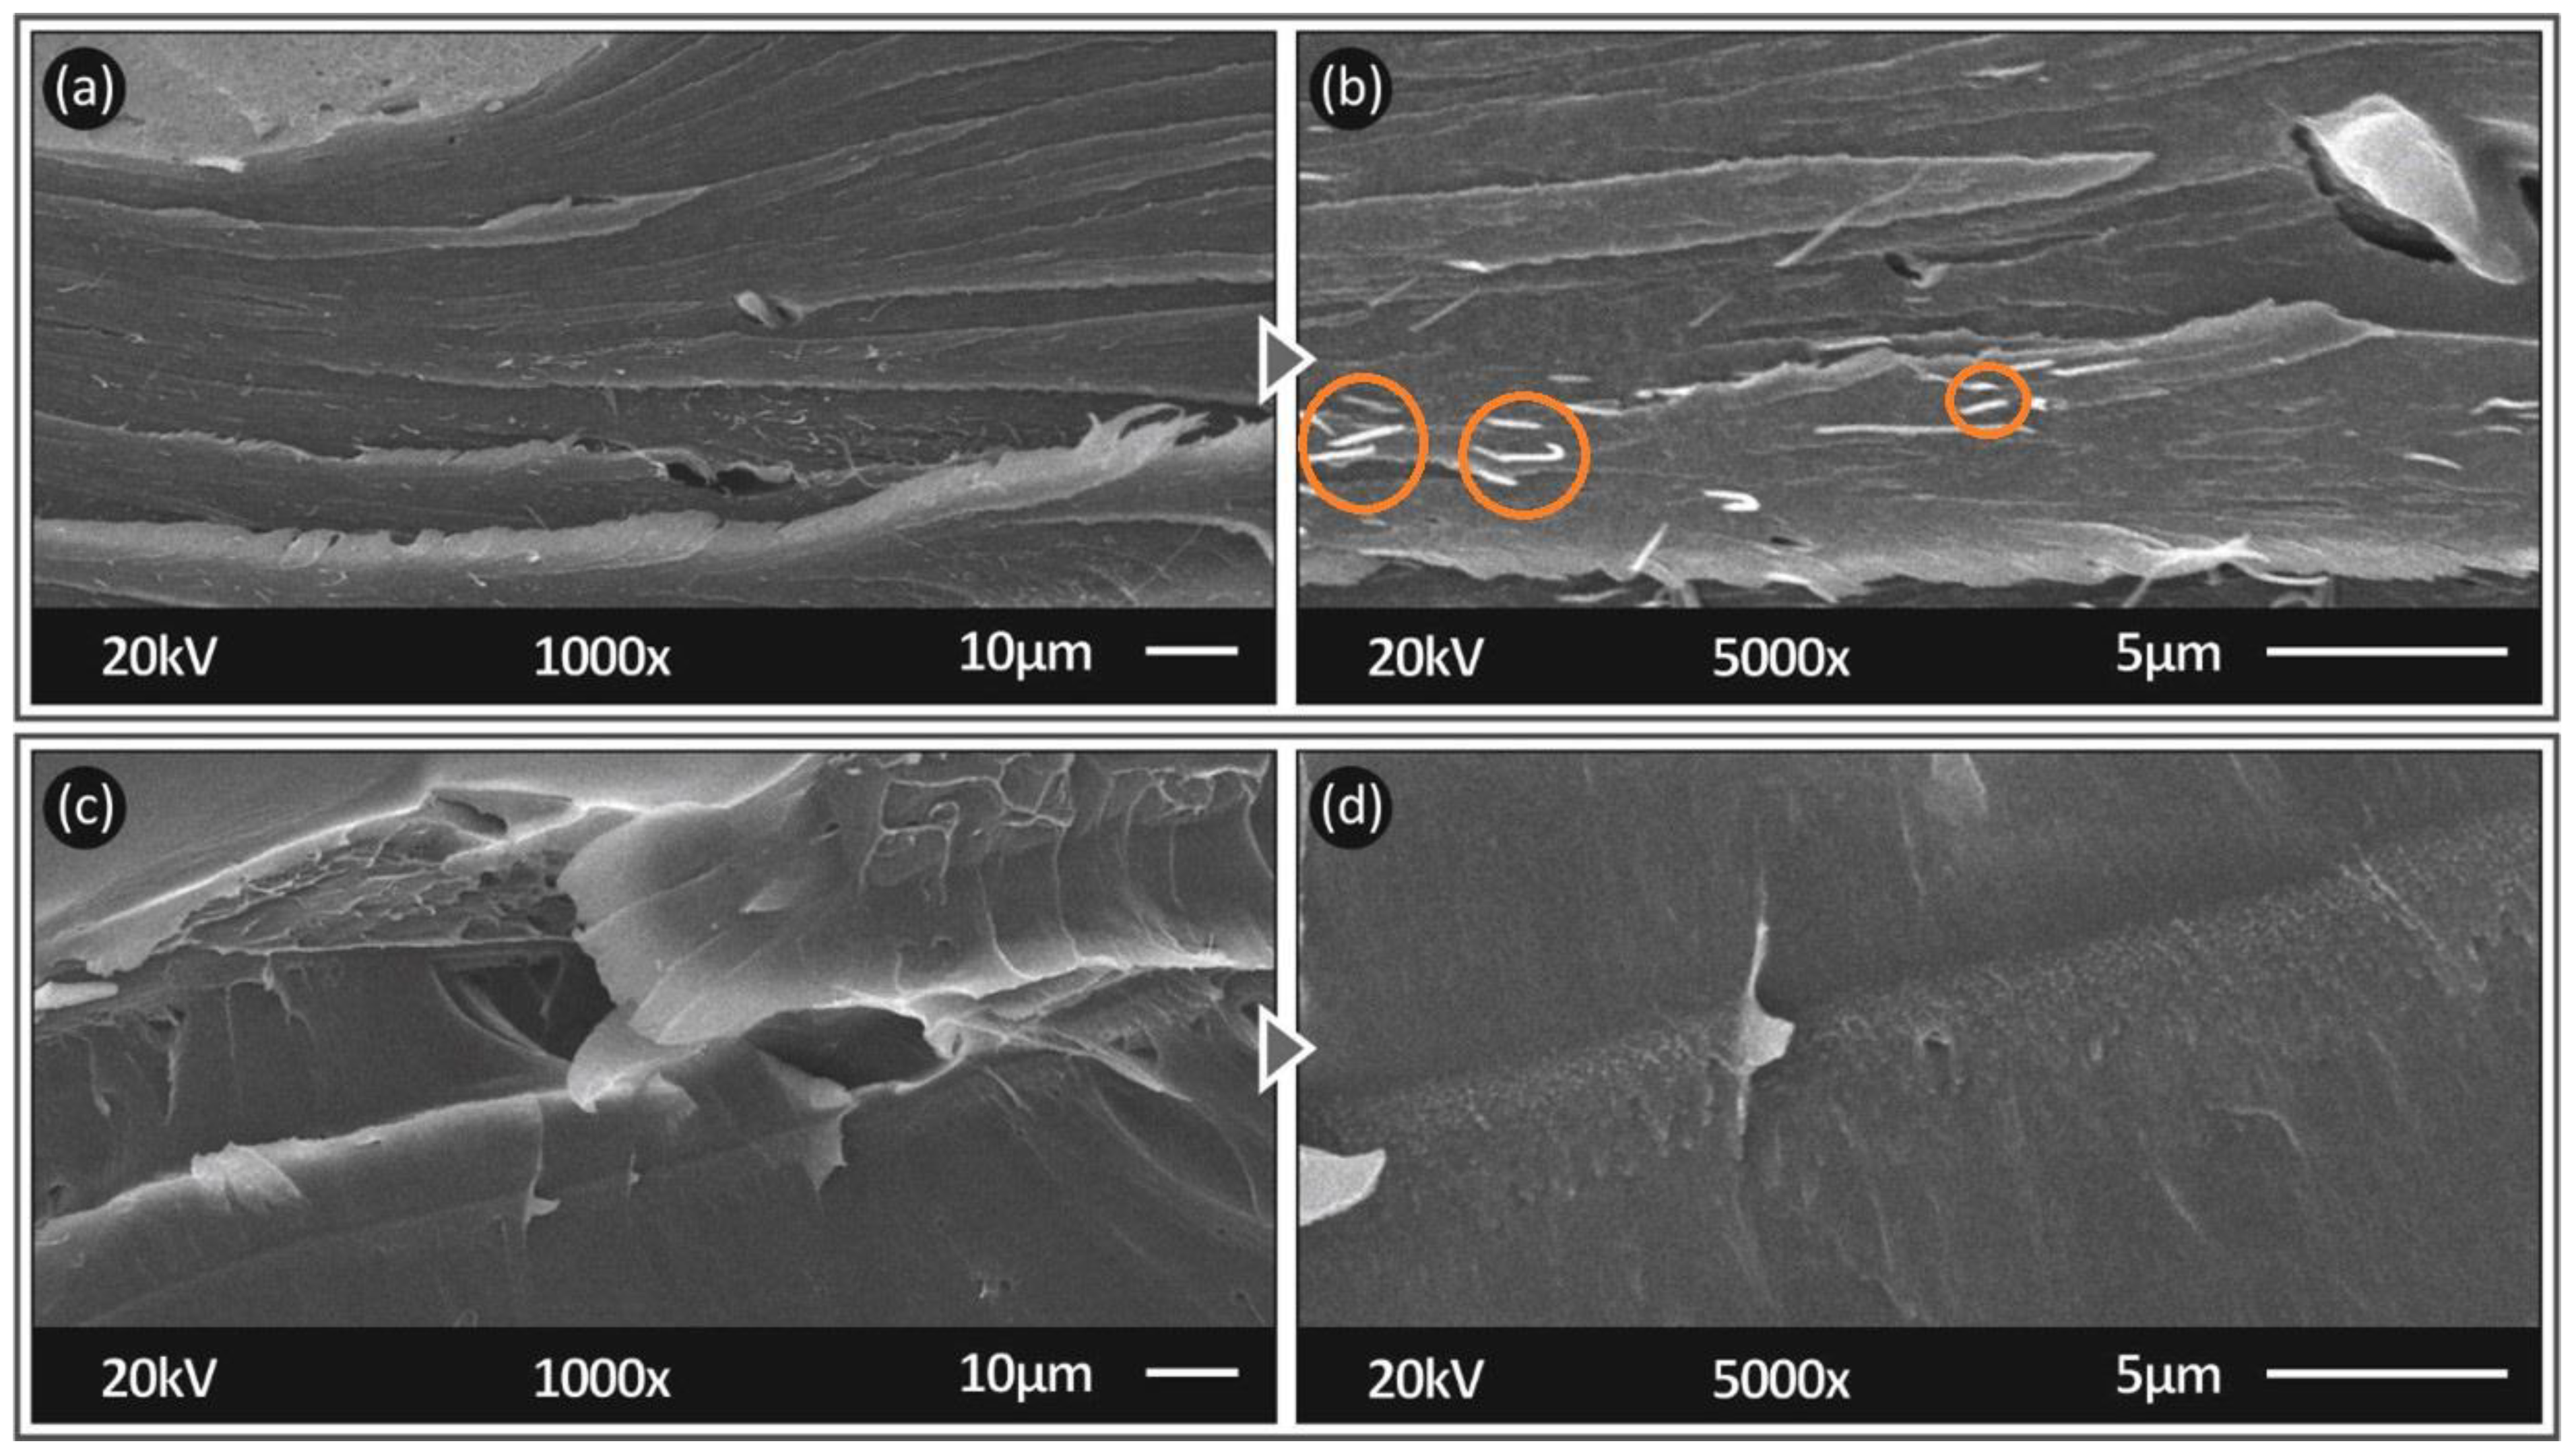
3.2. Morphology and Thermal Analysis Results

SEM microstructural analysis of the tensile tested 3D-printed samples was carried out at two magnifications of the side surfaces, as well as of their fractal area. In Figure 7a,b, two different magnifications of the morphology of the sides of neat PC specimens are presented. In Figure 7c,d, the side surfaces at magnifications of 30× and 150× of PC/CNF 0.5 wt.% nanocomposite are presented and the corresponding magnifications are shown in Figure 7e,f for the PC/CNF 1.0 wt.% nanocomposite.
A fine quality of the side surface can be observed in the images almost for all studied cases. For all the tested materials, each layer is in good agreement with the 3D printer’s layer thickness setup (200 microns). A fine interlayer fusion is presented for neat PC and PC CNF 0.5 wt.%, while in the case of PC CNF 1.0 wt.%, minor voids can be observed. From these SEM images, a rather fine processing quality is observed. The matrix material flow behavior was not significantly affected by the CNFs addition, even in the case of 1.0 wt.%. Such minor discontinuities can be mostly attributed to slight agglomeration or saturation of the filler.
After the tensile test experiments, fractographic microstructural investigations of the FFF 3D-printed PC/CNF nanocomposites was carried out. The SEM images helped in the evaluation of the fracture mechanism of the specimens and also depicted the internal structure quality. Figure 8 shows two magnifications of each one of the materials studied: Figure 8a,b for the neat PC, PC/CNF 0.5 wt.% in Figure 8c,d, and PC/ CNF 1.0 wt.% in Figure 8e,f.
From these SEM images, fine internal structures were observed on the fractured surfaces of all specimens. Fusion in the intralayer geometry is at fine levels. Some minor voids were observed in Figure 8e,f for the case of the 1.0 wt.% filler’s ratio. Such voids are attributed to slight agglomeration of the filler in the matrix material. Moreover, it should be mentioned that the PC melt state temperature is high. Selecting high temperatures during the mixing and the extrusion process could plausibly burn CNFs. Minor voids and discontinuities exhibited in the case of 1.0 wt.% percentage are mainly attributed to such local temperature increases, which probably had driven CNF to burn. This effect had no further effect on the matrix material or caused flow difficulties. Finally, voids can be attributed to the failure mechanism on the specimens during the experiments, as the material undergoes extreme conditions prior to its failure.
Thermogravimetric Analysis (TGA) investigated the thermal behavior of pure PC and its CNF nanocomposites. Figure 9 presents the sample weight (%) to temperature (°C) graph. On the right side (Figure 9b), the DTG graph is presented for the temperature range of 50–550 °C.
From the curves presented, it is obvious that the addition of CNF in the PC matrix material affects the thermal stability and performance of the material. For the 0.5 wt.% filler ratio, the degradation temperature was decreased by almost 100 °C. This was expected, since CNFs are usually derived from organic sources, which are not able to withstand high temperatures. CNF addition to the PC material decreased degradation rates. As shown in Figure 9b, degradation occurred at lower temperature, but its duration was higher compared to the corresponding duration for the pure PC polymer. PC material is shown to be fully undecomposed even at temperatures higher than 500 °C. At temperatures higher than these, pure PC and each tested nanocomposite tend to have similar behavior.
In Figure 6a,b, the heating–cooling cycle of neat PC (Figure 6a) and PC CNF 0.5 wt.% (Figure 6b) are presented. Measurements were taken during the DSC analysis. As already stated, CNF loadings are not affecting the thermal performance of these specific nanocomposites. DSC analysis also confirmed this thermal behavior, as almost no effect was recorded during the tests. Glass transition temperature (Tg) was measured to be slightly (approximately 1.0%) decreased by the addition of CNFs. Generally, the heat flow was also not affected, indicating that CNFs could act as an enhancement filler in PC matrices without compromising the thermomechanical excellence of the PC material.
Figure 10a,b depict images acquired from the fracture area of PC CNF 0.5 wt.% specimen at 1000× and 5000× magnifications, respectively. Figure 10c,d present the corresponding images for PC CNF 1.0 wt.%. CNFs are clearly visible, and a fine dispersion can also be observed in the images.

4. Discussion

According to the mechanical tests results presented in Section 3.1 of the current study, it was shown that the addition of Cellulose Nanofibers in a polycarbonate matrix material results in mechanical performance enhancement for the 0.5 wt.% loading. In Figure 3, it was shown that a filler loading of 0.5 wt.% could enable an improvement of the tensile stress at fracture as well as an increase in the tensile modulus of elasticity. A similar behavior was depicted according to Figure 4 for the flexural stress and the flexural modulus of elasticity. In Figure 5, an improvement was also presented for the calculated toughness (Figure 5a), the measured impact strength (Figure 5b), and the measured Vickers microhardness (Figure 5c). A rather negative effect on the mechanical performance was observed for filler ratio of 1.0 wt.% in all tests conducted, indicating that for this polymer matrix and specimens’ preparation methodology, the 0.5 wt.% filler loading is a threshold.
The effect of the 3D-printing process on the PC polymer can be evaluated by comparing the mechanical response of the pure 3D-printed PC with the properties of the bulk PC material in the vendors’ datasheet. As expected, 3D printing has a negative effect on the mechanical response of the polymer. Although the mechanical properties on the bulk material datasheet were calculated with different standards than the ones implemented in the current study, comparing the values provides indicative qualitative information on the effect of the 3D-printing process on the material. The tensile strength calculated in the experiments was on average 12% lower than the bulk material, with the highest values determined being much less than 10% lower than the bulk material. Other mechanical properties were significantly lower; for example, the impact strength was lower than the bulk material by about 38%, verifying the need for thorough investigation in the 3D-printed parts’ mechanical response.
From literature [49], it was found that the addition of CNFs in polymeric matrices results in an increase in the stiffness of the composite material, which is in accordance with what was found in the current study. Specifically, Weinan et al. [49] have implemented a similar experimental approach for the film manufacturing of reinforced PC material in a wide range of CNFs ratio loadings. In the study, it was found that while the tensile strength increased through the addition of fillers, the strain at break was reduced. Such behavior is imposing a more brittle fracture mechanism, which was observed in this study as well. A study of Dong et al. [50] used CNF as an additive to polylactic acid (PLA) matrix material, with specimens fabricated utilizing the FFF method. Through the analysis of Dong et al. [51], an enhancement in the mechanical performance of composites of 1.0 wt.% CNF filler ratio was presented when compared to pure PLA. Research on the CNF effect on the polymeric matrices has been conducted also by various authors, who reported in most cases an improvement in the mechanical performance in various CNF loadings and in different polymeric matrices and manufacturing methods. Kowalczyk et al. [51] reported on PLA CNF 2.0 wt.% composite, which exhibited an increased storage modulus of 25% when compared to pure PLA. Belgacem et al. [52] reported an increase of 24% in the tensile modulus of elasticity for filler ratio of 30 wt.%.
An increase of the mechanical performance was presented in the current study for the PC/CNF 0.5 wt.% nanocomposite, while the mechanical performance of the 1 wt.% PC/CNF nanocomposite was decreased compared to neat PC. Such behavior is mainly attributed to the extended heat during the melt mixing and the 3D-printing extrusion process. CNF is not a capable material for high-temperature processing, as its burning temperature is close to the processing temperature of PC. Plausible local temperature increase could lead to local burns of the additive and consequently lead to the nanocomposite’s degradation. This is supported by results from the morphology analysis, in which minor voids were observed, as seen in Figure 6 and Figure 7, as well as from the thermal analysis conducted through TGA (Figure 9), in which degradation temperatures of the nanocomposites were lower compared to neat PC.

5. Conclusions

The mechanical performance of FFF 3D-printed PC polymer and its PC/CNF nanocomposites at low filler loadings (0.5 wt.% and 1.0 wt.%) was studied. Figure 11 summarizes the results from the mechanical tests conducted. As presented in this study, PC/CNF 0.5 wt.% nanocomposite material exhibited the highest mechanical performance in almost all the tests conducted, while for the remaining mechanical properties (flexural modulus of elasticity), the material response was very close to the highest calculated value in the experiments. From the morphology analysis, it was found that the addition of CNF did not affect the material flow and the general processing, since the final featured geometry is of fine quality.
As for the study’s conclusion, a method is presented for the preparation of PC/CNF nanocomposites with enhanced mechanical properties for use in AM applications requiring such specifications. PC is a high-performance polymer that is able to support significantly higher loads than the common polymeric materials, and with the addition of the low-cost eco-friendly CNF at low concentration, its mechanical performance is further improved. This is important, especially since the materials in this work are prepared and studied for use in FFF 3D printing, which has obvious advantages, already mentioned above, over the conventional manufacturing methods. Additionally, such nanocomposites should be of low CNF concentration to reduce any potential degradation due to the high processing temperatures of the PC.
The thermal stability of PC and mechanical reinforcement from the CNF addition are creating the necessary optimum material specifications of a nanocomposite engineering grade material. Employing these materials in AM applications is further extending their potential applications, and solutions could be given in industries such as automotive, aerospace, medical, etc. The ability of AM to manufacture geometries with extreme complexity, in addition to the high mechanical performance and adequate thermal stability are creating the optimum combination for a high-quality nanocomposite material.
Under all circumstances, it should be considered that the thermal strength of CNFs is not high enough to withstand PC’s processing temperatures, and when processing is with FFF, high temperatures are required (both in the melt mixing procedure as well as during 3D-printing extrusion). Such conditions are creating a plausible negative effect on the CNF loading in the PC matrix for implementation through the FFF method, and in this case, low ratios should be taken as a necessity for the potential nanocomposites.
Finally, it should be mentioned that in many studies, filler addition is creating a general decrease in the mechanical performance in order to tune other properties of the composite material (e.g., electrical conductivity [36], antibacterial [53]), while degradation was reported also in recycling processing [54]. The results of the mechanical performance presented in this study, in combination with the neutral effect of the CNF addition on the PC processing through FFF, are creating the foundations for further investigation of this filler to create multifunctional nanocomposite materials or enhance the properties of recycled polymers.

Author Contributions

Conceptualization, N.V., E.V.; methodology, M.P.; software, E.V., M.S.; validation, N.V., J.D.K. and M.P.; formal analysis, J.D.K., M.S. and E.V.; investigation, M.P., M.S., N.V. and J.D.K.; resources, N.V., M.P.; data curation, E.V., M.S.; writing—original draft preparation, M.S.; writing—review and editing, M.P.; visualization, N.V. and J.D.K.; supervision, N.V.; project administration, N.V. and M.P.; funding acquisition, N.V. All authors have read and agreed to the published version of the manuscript.

Funding

This research received no external funding.

Institutional Review Board Statement

Not applicable.

Informed Consent Statement

Not applicable.

Data Availability Statement

The data presented in this study are available in the article.

Acknowledgments

The authors would like to thank Aleka Manousaki from the Institute of Electronic Structure and Laser of the Foundation for Research and Technology, Hellas (IESL-FORTH), for taking the SEM images presented in this work.

Conflicts of Interest

The authors declare no conflict of interest.

References

  1. Bhadeshia, H.K.D.H. Additive manufacturing. Mater. Sci. Technol. 2016, 32, 615–616. [Google Scholar] [CrossRef] [Green Version]
  2. Johnson, G.A.; French, J.J. Evaluation of Infill Effect on Mechanical Properties of Consumer 3D Printing Materials. Adv. Technol. Innov. 2018, 3, 179–184. [Google Scholar]
  3. Zhang, X.Y.; Fang, G.; Zhou, J. Additively manufactured scaffolds for bone tissue engineering and the prediction of their mechanical behavior: A review. Materials 2017, 10, 50. [Google Scholar] [CrossRef] [Green Version]
  4. Vidakis, N.; Petousis, M.; Vairis, A.; Savvakis, K.; Maniadi, A. On the compressive behavior of an FDM Steward Platform part. J. Comput. Des. Eng. 2017, 4, 339–346. [Google Scholar] [CrossRef]
  5. Zhang, J.; Wang, J.; Dong, S.; Yu, X.; Han, B. A review of the current progress and application of 3D printed concrete. Compos. A Appl. Sci. Manuf. 2019, 125, 105533. [Google Scholar] [CrossRef]
  6. Tzounis, L.; Bangeas, P.I.; Exadaktylos, A.; Petousis, M.; Vidakis, N. Three-dimensional printed polylactic acid (PLA) surgical retractors with sonochemically immobilized silver nanoparticles: The next generation of low-cost antimicrobial surgery equipment. Nanomaterials 2020, 10, 985. [Google Scholar] [CrossRef]
  7. Savolainen, J.; Collan, M. How Additive Manufacturing Technology Changes Business Models?—Review of Literature. Addit. Manuf. 2020, 32, 101070. [Google Scholar] [CrossRef]
  8. Vidakis, N.; Petousis, M.; Velidakis, E.; Liebscher, M.; Mechtcherine, V.; Tzounis, L. On the strain rate sensitivity of fused filament fabrication (Fff) processed pla, abs, petg, pa6, and pp thermoplastic polymers. Polymers 2020, 12, 2924. [Google Scholar] [CrossRef] [PubMed]
  9. Espera, A.H.; Valino, A.D.; Palaganas, J.O.; Souza, L.; Chen, Q.; Advincula, R.C. 3D Printing of a Robust Polyamide-12-Carbon Black Composite via Selective Laser Sintering: Thermal and Electrical Conductivity. Macromol. Mater. Eng. 2019, 304, 1800718. [Google Scholar] [CrossRef]
  10. Saleh Alghamdi, S.; John, S.; Roy Choudhury, N.; Dutta, N.K. Additive Manufacturing of Polymer Materials: Progress, Promise and Challenges. Polymers 2021, 13, 753. [Google Scholar] [CrossRef]
  11. Yap, Y.L.; Sing, S.L.; Yeong, W.Y. A review of 3D printing processes and materials for soft robotics. Rapid Prototyp. J. 2020, 26, 1345–1361. [Google Scholar] [CrossRef]
  12. Vidakis, N.; Petousis, M.; Velidakis, E.; Tzounis, L.; Mountakis, N.; Korlos, A.; Fischer-Griffiths, P.E.; Grammatikos, S. On the mechanical response of silicon dioxide nanofiller concentration on fused filament fabrication 3D printed isotactic polypropylene nanocomposites. Polymers 2021, 13, 2029. [Google Scholar] [CrossRef] [PubMed]
  13. Zandi, M.D.; Jerez-Mesa, R.; Lluma-Fuentes, J.; Jorba-Peiro, J.; Travieso-Rodriguez, J.A. Study of the manufacturing process effects of fused filament fabrication and injection molding on tensile properties of composite PLA-wood parts. Int. J. Adv. Manuf. Technol. 2020, 108, 1725–1735. [Google Scholar] [CrossRef]
  14. Vidakis, N.; Petousis, M.; Korlos, A.; Velidakis, E.; Mountakis, N.; Charou, C.; Myftari, A. Strain Rate Sensitivity of Polycarbonate and Thermoplastic Polyurethane for Various 3D Printing Temperatures and Layer Heights. Polymers 2021, 13, 2752. [Google Scholar] [CrossRef]
  15. Blumenthal, W.R. Influence of Temperature and Strain Rate on the Compressive Behavior of PMMA and Polycarbonate Polymers. AIP Conf. Proc. 2003, 665, 665–668. [Google Scholar] [CrossRef] [Green Version]
  16. Gauss, C.; Pickering, K.L.; Muthe, L.P. The use of cellulose in bio-derived formulations for 3D/4D printing: A review. Compos. C Open Access 2021, 4, 100113. [Google Scholar] [CrossRef]
  17. Balea, A.; Blanco, A.; Delgado-Aguilar, M.; Monte, M.C.; Tarres, Q.; Fuente, E.; Mutje, P.; Negro, C. Nanocellulose Characterization Challenges. BioResources 2021, 16, 4382–4410. [Google Scholar] [CrossRef]
  18. Dilberoglu, U.M.; Gharehpapagh, B.; Yaman, U.; Dolen, M. The Role of Additive Manufacturing in the Era of Industry 4.0. Procedia Manuf. 2017, 11, 545–554. [Google Scholar] [CrossRef]
  19. Vidakis, N.; Petousis, M.; Maniadi, A. Sustainable Additive Manufacturing: Mechanical Response of High-Density Polyethylene over Multiple Recycling Processes. Recycling 2021, 6, 4. [Google Scholar] [CrossRef]
  20. Goh, G.D.; Yap, Y.L.; Tan, H.K.J.; Sing, S.L.; Goh, G.L.; Yeong, W.Y. Process–Structure–Properties in Polymer Additive Manufacturing via Material Extrusion: A Review. Crit. Rev. Solid State Mater. Sci. 2020, 45, 113–133. [Google Scholar] [CrossRef]
  21. Li, H.; Zhang, S.; Yi, Z.; Li, J.; Sun, A.; Guo, J.; Xu, G. Bonding quality and fracture analysis of polyamide 12 parts fabricated by fused deposition modeling. Rapid Prototyp. J. 2017, 23, 973–982. [Google Scholar] [CrossRef]
  22. Rajpurohit, S.R.; Dave, H.K. Effect of process parameters on tensile strength of FDM printed PLA part. Rapid Prototyp. J. 2018, 24, 1317–1324. [Google Scholar] [CrossRef]
  23. Savvakis, K.; Petousis, M.; Vairis, A.; Vidakis, N.; Bikmeyev, A.T. Experimental Determination of the Tensile Strength of Fused Deposition Modeling Parts. In Proceedings of the Emerging Technologies; Engineering Management, Safety, Ethics, Society, and Education; Materials, Genetics to Structures, Montreal, QC, Canada, 14–20 November 2014; ASME: New York, NY, USA, 2014; p. V014T11A022. [Google Scholar] [CrossRef]
  24. Vidakis, N.; Petousis, M.; Vairis, A.; Savvakis, K.; Maniadi, A. A parametric determination of bending and Charpy’s impact strength of ABS and ABS-plus fused deposition modeling specimens. Prog. Addit. Manuf. 2019, 4, 323–330. [Google Scholar] [CrossRef]
  25. Raj, A.; Samuel, C.; Malladi, N.; Prashantha, K. Enhanced (thermo)mechanical properties in biobased poly(l-lactide)/poly(amide-12) blends using high shear extrusion processing without compatibilizers. Polym. Eng. Sci. 2020, 60, 1902–1916. [Google Scholar] [CrossRef]
  26. Cao, K.; Wang, Y.; Wang, Y. Effects of strain rate and temperature on the tension behavior of polycarbonate. Mater. Des. 2012, 38, 53–58. [Google Scholar] [CrossRef]
  27. Kumar, S.; Singh, R.; Singh, M.; Singh, T.P.; Batish, A. Multi material 3D printing of PLA-PA6/TiO2 polymeric matrix: Flexural, wear and morphological properties. J. Thermoplast. Compos. Mater. 2020. [Google Scholar] [CrossRef]
  28. Ahmed, W.; Siraj, S.; Al-Marzouqi, A.H. 3D printing pla waste to produce ceramic based particulate reinforced composite using abundant silica-sand: Mechanical properties characterization. Polymers 2020, 12, 2579. [Google Scholar] [CrossRef]
  29. Zawaski, C.E.; Chatham, C.A.; Wilts, E.M.; Long, T.E.; Williams, C.B. Using fillers to tune material properties of an ion-containing semi-crystalline poly(ethylene glycol) for fused filament fabrication additive manufacturing. Addit. Manuf. 2021, 39, 101844. [Google Scholar] [CrossRef]
  30. Vidakis, N.; Petousis, M.; Savvakis, K.; Maniadi, A.; Koudoumas, E. A comprehensive investigation of the mechanical behavior and the dielectrics of pure polylactic acid (PLA) and PLA with graphene (GnP) in fused deposition modeling (FDM). Int. J. Plast. Technol. 2019, 23, 195–206. [Google Scholar] [CrossRef]
  31. Van Zyl, W.E.; Boukamp, B.A.; García, M.; Van Vliet, G.; Jain, S.; Schrauwen, B.A.G.; Sarkissov, A.; Van Zyl, W.E.; Boukamp, B. Polypropylene/SiO2 nanocomposites with improved mechanical properties. Rev. Adv. Mater. Sci. 2004, 6, 169–175. [Google Scholar]
  32. Ferreira, I.; Machado, M.; Alves, F.; Torres Marques, A. A review on fibre reinforced composite printing via FFF. Rapid Prototyp. J. 2019, 25, 972–988. [Google Scholar] [CrossRef]
  33. Pelech, I.; Kwiatkowska, M.; Jedrzejewska, A.; Pelech, R.; Kowalczyk, I. Thermal and mechanical properties of polyamide 12/modifed carbon nanotubes composites prepared via the in situ ring-opening polymerization. Polimery/Polymers 2017, 62, 101–108. [Google Scholar] [CrossRef]
  34. Vidakis, N.; Petousis, M.; Velidakis, E.; Tzounis, L.; Mountakis, N.; Kechagias, J.; Grammatikos, S. Optimization of the filler concentration on fused filament fabrication 3D printed polypropylene with titanium dioxide nanocomposites. Materials 2021, 14, 3076. [Google Scholar] [CrossRef]
  35. Tzounis, L.; Pegel, S.; Zafeiropoulos, N.E.; Avgeropoulos, A.; Paipetis, A.S.; Stamm, M. Shear alignment of a poly(styrene-butadiene-styrene) triblock copolymer/MWCNT nanocomposite. Polymer 2017, 131, 1–9. [Google Scholar] [CrossRef]
  36. Vidakis, N.; Petousis, M.; Velidakis, E.; Mountakis, N.; Fischer-griffiths, P.E.; Grammatikos, S.; Tzounis, L. Fused Filament Fabrication Three-Dimensional Printing Multi-Functional of Polylactic Acid/Carbon Black Nanocomposites. J. Carbon Res. 2021, 7, 52. [Google Scholar] [CrossRef]
  37. Li, F.; Yu, H.-Y.; Li, Y.; Abdalkarim, S.Y.H.; Zhu, J.; Zhou, Y. “Soft-rigid” synergistic reinforcement of PHBV composites with functionalized cellulose nanocrystals and amorphous recycled polycarbonate. Compos. B Eng. 2021, 206, 108542. [Google Scholar] [CrossRef]
  38. Mariano, M.; el Kissi, N.; Dufresne, A. Melt processing of cellulose nanocrystal reinforced polycarbonate from a masterbatch process. Eur. Polym. J. 2015, 69, 208–223. [Google Scholar] [CrossRef]
  39. Phuong, V.T.; Gigante, V.; Aliotta, L.; Coltelli, M.B.; Cinelli, P.; Lazzeri, A. Reactively extruded ecocomposites based on poly(lactic acid)/bisphenol A polycarbonate blends reinforced with regenerated cellulose microfibers. Compos. Sci. Technol. 2017, 139, 127–137. [Google Scholar] [CrossRef]
  40. Nielsen, H.L.; Engberg, J.; Ejlertsen, T.; Nielsen, H. Comparison of polycarbonate and cellulose acetate membrane filters for isolation of Campylobacter concisus from stool samples. Diagn. Microbiol. Infect. Dis. 2013, 76, 549–550. [Google Scholar] [CrossRef]
  41. Haider, A.J.; Jameel, Z.N.; Al-Hussaini, I.H.M. Review on: Titanium dioxide applications. Energy Procedia 2019, 157, 17–29. [Google Scholar] [CrossRef]
  42. Gurianov, Y.; Nakonechny, F.; Albo, Y.; Nisnevitch, M. Antibacterial composites of cuprous oxide nanoparticles and polyethylene. Int. J. Mol. Sci. 2019, 20, 439. [Google Scholar] [CrossRef] [Green Version]
  43. ASTM D638-02a. Standard Test. Method for Tensile Properties of Plastics; American Society for Testing and Materials International: West Conshohocken, PA, USA, 2003. [Google Scholar]
  44. ASTM D790-10. Standard Test. Methods for Flexural Properties of Unreinforced and Reinforced Plastics and Electrical Insulating Materials; American Society for Testing and Materials International: West Conshohocken, PA, USA, 2010. [Google Scholar]
  45. ASTM D6110-04. Standard Test Method for Determining the Charpy Impact Resistance of Notched Specimens of Plastics; American Society for Testing and Materials International: West Conshohocken, PA, USA, 2004. [Google Scholar]
  46. Bouzakis, K.D.; Vidakis, N. Superficial plastic response determination of hard isotropic materials using ball indentations and a FEM optimization technique. Mater. Charact. 1999, 42, 1–12. [Google Scholar] [CrossRef]
  47. ASTM E384-17. Standard Test Method for Microindentation Hardness of Materials; American Society for Testing and Materials International: West Conshohocken, PA, USA, 2004. [Google Scholar]
  48. ASTM D4065-12. Standard Practice for Plastics: Dynamic Mechanical Properties: Determination and Report of Procedures; American Society for Testing and Materials International: West Conshohocken, PA, USA, 2012. [Google Scholar]
  49. Xu, W.; Qin, Z.; Yu, H.; Liu, Y.; Liu, N.; Zhou, Z.; Chen, L. Cellulose nanocrystals as organic nanofillers for transparent polycarbonate films. J. Nanopart. Res. 2013, 15, 1716. [Google Scholar] [CrossRef]
  50. Dong, J.; Mei, C.; Han, J.; Lee, S.; Wu, Q. 3D printed poly(lactic acid) composites with grafted cellulose nanofibers: Effect of nanofiber and post-fabrication annealing treatment on composite flexural properties. Addit. Manuf. 2019, 28, 621–628. [Google Scholar] [CrossRef]
  51. Kowalczyk, M.; Piorkowska, E.; Kulpinski, P.; Pracella, M. Mechanical and thermal properties of PLA composites with cellulose nanofibers and standard size fibers. Compos. A Appl. Sci. Manuf. 2011, 42, 1509–1514. [Google Scholar] [CrossRef]
  52. Belgacem, M.N.; Bataille, P.; Sapieha, S. Effect of corona modification on the mechanical properties of polypropylene/cellulose composites. J. Appl. Polym. Sci. 1994, 53, 379–385. [Google Scholar] [CrossRef]
  53. Vidakis, N.; Petousis, M.; Velidakis, E.; Liebscher, M.; Tzounis, L. Three-Dimensional Printed Antimicrobial Objects of Polylactic Acid (PLA)-Silver Nanoparticle Nanocomposite Filaments Produced by an In-Situ Reduction Reactive Melt Mixing Process. Biomimetics 2020, 5, 42. [Google Scholar] [CrossRef]
  54. Vidakis, N.; Petousis, M.; Tzounis, L.; Maniadi, A.; Velidakis, E.; Mountakis, N.; Papageorgiou, D.; Liebscher, M.; Mechtcherine, V. Sustainable additive manufacturing: Mechanical response of polypropylene over multiple recycling processes. Sustainability 2021, 13, 159. [Google Scholar] [CrossRef]
Figure 1. A graphical presentation of the processing workflow adopted in this study, from filament fabrication to specimens’ fabrication, testing, and characterization: (a) PC polymer drying process, (b) Filaments drying process, (c) Extrusion process for filament fabrication, (d) Filament quality control, (e) 3D-printed tensile test specimens’ fabrication, (f) 3D-printed tensile test specimens’ quality control, (g) Thermogravimetric analysis of the samples, (h) Three-point bending test on the specimens, and (i) Scanning Electron Microscopy on the fracture surface of the tensile test specimens.
Fibers 09 00074 g001
Figure 2. Fundamental FFF processing parameters selected for the fabrication of 3D-printed specimens of all tested materials.
Fibers 09 00074 g002
Figure 3. Tensile test results: (a) A representative stress (MPa) to strain curve for each tested material, (b) Average tensile strength (MPa) to filler concentration in the nanocomposites, (c) Average tensile modulus of elasticity (MPa) to the filler’s loading percentage.
Fibers 09 00074 g003
Figure 4. Flexural test results: (a) A representative stress (MPa) to strain (mm/mm) curve for each tested material, (b) Average flexural strength (MPa) to filler concentration in the nanocomposites, (c) Average flexural modulus of elasticity (MPa) to filler’s loading percentage.
Fibers 09 00074 g004
Figure 5. (a) Calculated average toughness (MJ/m3), (b) Impact strength (kJ/m2), (c) Average Vickers microhardness (HV) all presented in a comparable way for all tested materials.
Fibers 09 00074 g005
Figure 6. (a) DSC graph for the Virgin PC sample in the study, (b) DSC graph for the PC/CNF 0.5 wt.% sample in the study, (c) DMA graph for the Virgin PC sample in the study, (d) DMA graph for the PC/CNF 0.5 wt.% sample in the study.
Fibers 09 00074 g006
Figure 7. Side tensile specimens’ surface in two different magnifications for all tested materials, (a,b) pure PC, (c,d) PC CNF 0.5 wt.%, (e,f) PC CNF 1.0 wt.%.
Fibers 09 00074 g007
Figure 8. Fracture area of tensile specimens in two different magnifications for all tested materials, (a,b) Pure PC, (c,d) PC CNF 0.5 wt.%, (e,f) PC CNF 1.0 wt.%.
Fibers 09 00074 g008
Figure 9. Thermogravimetric analysis results: (a) Sample’s weight (%) to temperature (°C) and (b) Derivative of weight loss to temperature (°C) for all tested materials.
Fibers 09 00074 g009
Figure 10. SEM images of the tensile specimens’ fracture area: (a) PC/CNF 0.5 wt.% at 1000× magnification, (b) PC/CNF 0.5 wt.% at 5000× magnification, (c) PC/CNF 1.0 wt.% at 1000× magnification, (d) PC/CNF 1.0 wt.% at 5000× magnification, the CNFs are highlighted in the figure.
Fibers 09 00074 g010
Figure 11. Summary of the results presented through the mechanical analysis of the study. The right side indicates the highest measured values of each measurement.
Fibers 09 00074 g011
Publisher’s Note: MDPI stays neutral with regard to jurisdictional claims in published maps and institutional affiliations.

