Article

Influence of Satellite Sensor Pixel Size and Overpass Time on Undercounting of Cerrado/Savannah Landscape-Scale Fire Radiative Power (FRP): An Assessment Using the MODIS Airborne Simulator

by
Samuel Sperling
1,
Martin J. Wooster
1,2,* and
Bruce D. Malamud
1
1
Department of Geography, King’s College London, London WC2B 4BG, UK
2
NERC National Centre for Earth Observation, King’s College London, London WC2B 4BG, UK
*
Author to whom correspondence should be addressed.
Submission received: 17 April 2020 / Revised: 1 May 2020 / Accepted: 2 May 2020 / Published: 11 May 2020
(This article belongs to the Special Issue Remote Sensing of Fire and Its Impact on Land and Atmosphere)

Abstract

:
The fire radiative power (FRP) of active fires (AFs) is routinely assessed with spaceborne sensors. MODIS is commonly used, and its 1 km nadir pixel size provides a minimum per-pixel FRP detection limit of ~5–8 MW, leading to undercounting of AF pixels with FRPs of less than around 10 MW. Since most biomes show increasing AF pixel frequencies with decreasing FRP, this results in MODIS failing to detect many fires burning when it overpasses. However, the exact magnitude of the landscape-scale FRP underestimation induced by this type of AF undercounting remains poorly understood, as does its sensitivity to sensor pixel size and overpass time. We investigate these issues using both 1 km spaceborne MODIS data and 50 m MODIS Airborne Simulator (MAS) observations of the Brazilian cerrado, a savannah-like environment covering 2 million km2 (>20%) of Brazil where fires are a frequent occurrence. The MAS data were collected during the 1995 SCAR-B experiment, and are able to be spatially degraded to simulate data from sensors with a wide variety of pixel sizes. We explore multiple versions of these MAS data to deliver recommendations for future satellite sensor design, aiming to discover the most effective sensor characteristics that provide negligible pixel-area related FRP underestimation whilst keeping pixels large enough to deliver relatively wide swath widths. We confirm earlier analyses showing 1 km MODIS-type observations fail to detect a very significant number of active fires, and find the degree of undercounting gets worse away from the early afternoon diurnal fire cycle peak (~ 15:00 local time). However, the effect of these undetected fires on the assessment of total landscape-scale FRP is far less significant, since they are mostly low FRP fires. Using two different approaches we estimate that the MODIS-type 1 km data underestimates landscape scale FRP by around a third, and that whilst the degree of underestimation worsens away from the diurnal fire cycle peak the effect of this maybe less important since there are far fewer fires present. MAS data degraded to a 200 m spatial resolution provides landscape-scale FRP totals almost indistinguishable from those calculated with the original 50 m MAS observations, and still provides a pixel size consistent with a wide swath imaging instrument. Our work provides a potentially useful guide for future mission developers aiming at active fire and FRP applications, and we conclude that such missions need operate at spatial resolutions no higher than 200 m if they rely on cooled, low-noise IR detectors. Further work confirming this for fire-affected biomes beyond the savannah-type environments studied here is recommended.

Graphical Abstract

1. Introduction

Satellite-based infrared (IR) sensors have been used since the early 1980s to detect actively burning vegetation fires, primarily using observations made in middle infrared (MIR; 3–5 µm) and longwave infrared (LWIR; 8–12 µm) spectral regions [1]. The MIR spectral region is extremely sensitive to sub-pixel sized hot sources, and can be used to detect active fire (AF) pixels covering as little as 10–4 of the pixel area [1,2,3]. Latterly, such remotely sensed AF detections have often been augmented with assessments of their fire radiative power (FRP), representing the rate of release of thermal radiant energy liberated via the process of combustion (e.g., [2,3,4,5,6]). FRP measures are often used as a means of estimating rates of landscape-scale fuel consumption, and thus its temporal integral (fire radiative energy; FRE) is considered linearly proportional to the amount of fuel consumed over the integration period [4,7], which itself relates to the amount of smoke emitted to the atmosphere. Many studies have thus gone on to relate remotely sensed FRP and FRE metrics to, respectively, the rates and totals of particulate and trace gas emission (e.g., [8,9,10,11,12]), thus providing a relatively direct approach to estimating biomass burning smoke emissions that can be applied in real-time whilst the fires are still burning (e.g., [12]).
Spaceborne and airborne remote sensing instruments possessing a suitable MIR spectral channel of adequate pixel size, and with a dynamic range that largely prevents saturation over even high intensity fires, can be used to generate FRP values across a very wide range of magnitudes [2,3,13]. However, all fire regimes examined so far using spaceborne active fire (AF) detection have all been characterised by a far greater number of low-FRP fires than high FRP fires (e.g., [14,15]). This is a direct result of the dominance of smaller, and often lower intensity, fires in most landscapes and these low-FRP fires are more difficult to discriminate from the type of ‘thermal clutter’ (i.e., locational variations in IR brightness temperature) that typically characterises the ambient background upon which AF pixels are superimposed. Even with the ability to discriminate highly sub-pixel AFs using suitably performing sensors with a MIR channel and relatively small pixel sizes, there will be some fires that remain too small and/or too weakly burning at the observation time to be readily detected from space [3]. Assuming application of the same AF detection algorithm, minimum detectable FRP scales with the sensing instruments ground pixel area [7]. This means that moving, for example, from 1 km to 500 m pixels lowers the minimum FRP detection limit by a factor of four, ignoring for now any influence from potential changes in background thermal clutter the intensity of which generally increases as pixels become smaller and thermal variability becomes less ‘averaged out’. Similarly, whilst 1 km type spatial resolution sensors operating on many polar orbiting spacecraft can detect active fire pixels burning below 10 MW, geostationary satellite sensors with their pixel sizes of typically many km have minimum FRP detection limits of many tens of MW [16].
The most widely used spaceborne FRP product is that generated from observations made by the Moderate Resolution Imaging Spectroradiometer (MODIS) carried onboard the polar orbiting Terra and Aqua satellites [17,18]. MODIS provides a 1 km pixel size at nadir, resulting in a minimum FRP detection limit somewhat below 10 MW at the nadir point with the detection limit increasing as one moves towards the scan edge and pixel size increases [5]. Yet this remains insufficient to detect some of the fires burning on the landscape at the satellite overpass time. Regions where small fires show a particular dominance, such as agricultural residue burning areas, are likely to have the greatest proportion of their fires burning below this minimum FRP detection limit; because of this, total FRP measures derived for such regions may fail to include much of the FRP that is actually being released. Any fuel consumption and/or smoke emissions estimates derived from such landscape-scale FRP measures are thus likely to be at risk of underestimation unless suitable (but yet largely unknown, and very likely highly variable) bias-corrections are undertaken. The Visible Infrared Imaging Radiometer Suite (VIIRS) operates on board the Suomi National Polar-orbiting Partnership (Suomi NPP) and the NOAA-20 polar orbiting satellites, and offers pixel sizes smaller than those of MODIS at 750 m and 375 m. It has been shown [19] that in the eastern China’s agricultural regions the use of VIIRS FRP data derived from these two channels provides FRP totals many times that provided by MODIS due to the ability to detect more of the lowest FRP agricultural residue fires burning below MODIS’ minimum FRP detection limit.
Although the extent of MODIS’ landscape-scale FRP underestimation may be expected to be most significant at locations dominated by the obviously small fires characteristic of agricultural burning, the true extent to which landscape-scale FRP is underestimated by MODIS (or any other 1 km sensor) is poorly understood for most biome’s worldwide. A biome-dependency is assumed, since the level of FRP underestimation will be a function of a biomes fire regime characteristics in terms of fire size and intensity distributions. Furthermore, the relative number of low and high FRP fires will very likely vary over the typically very strong fire diurnal cycle [20,21], making it different for the Terra MODIS and Aqua MODIS observations, which are collected from morning and late evening overpasses (Terra) and early afternoon and night-time (Aqua) overpasses.
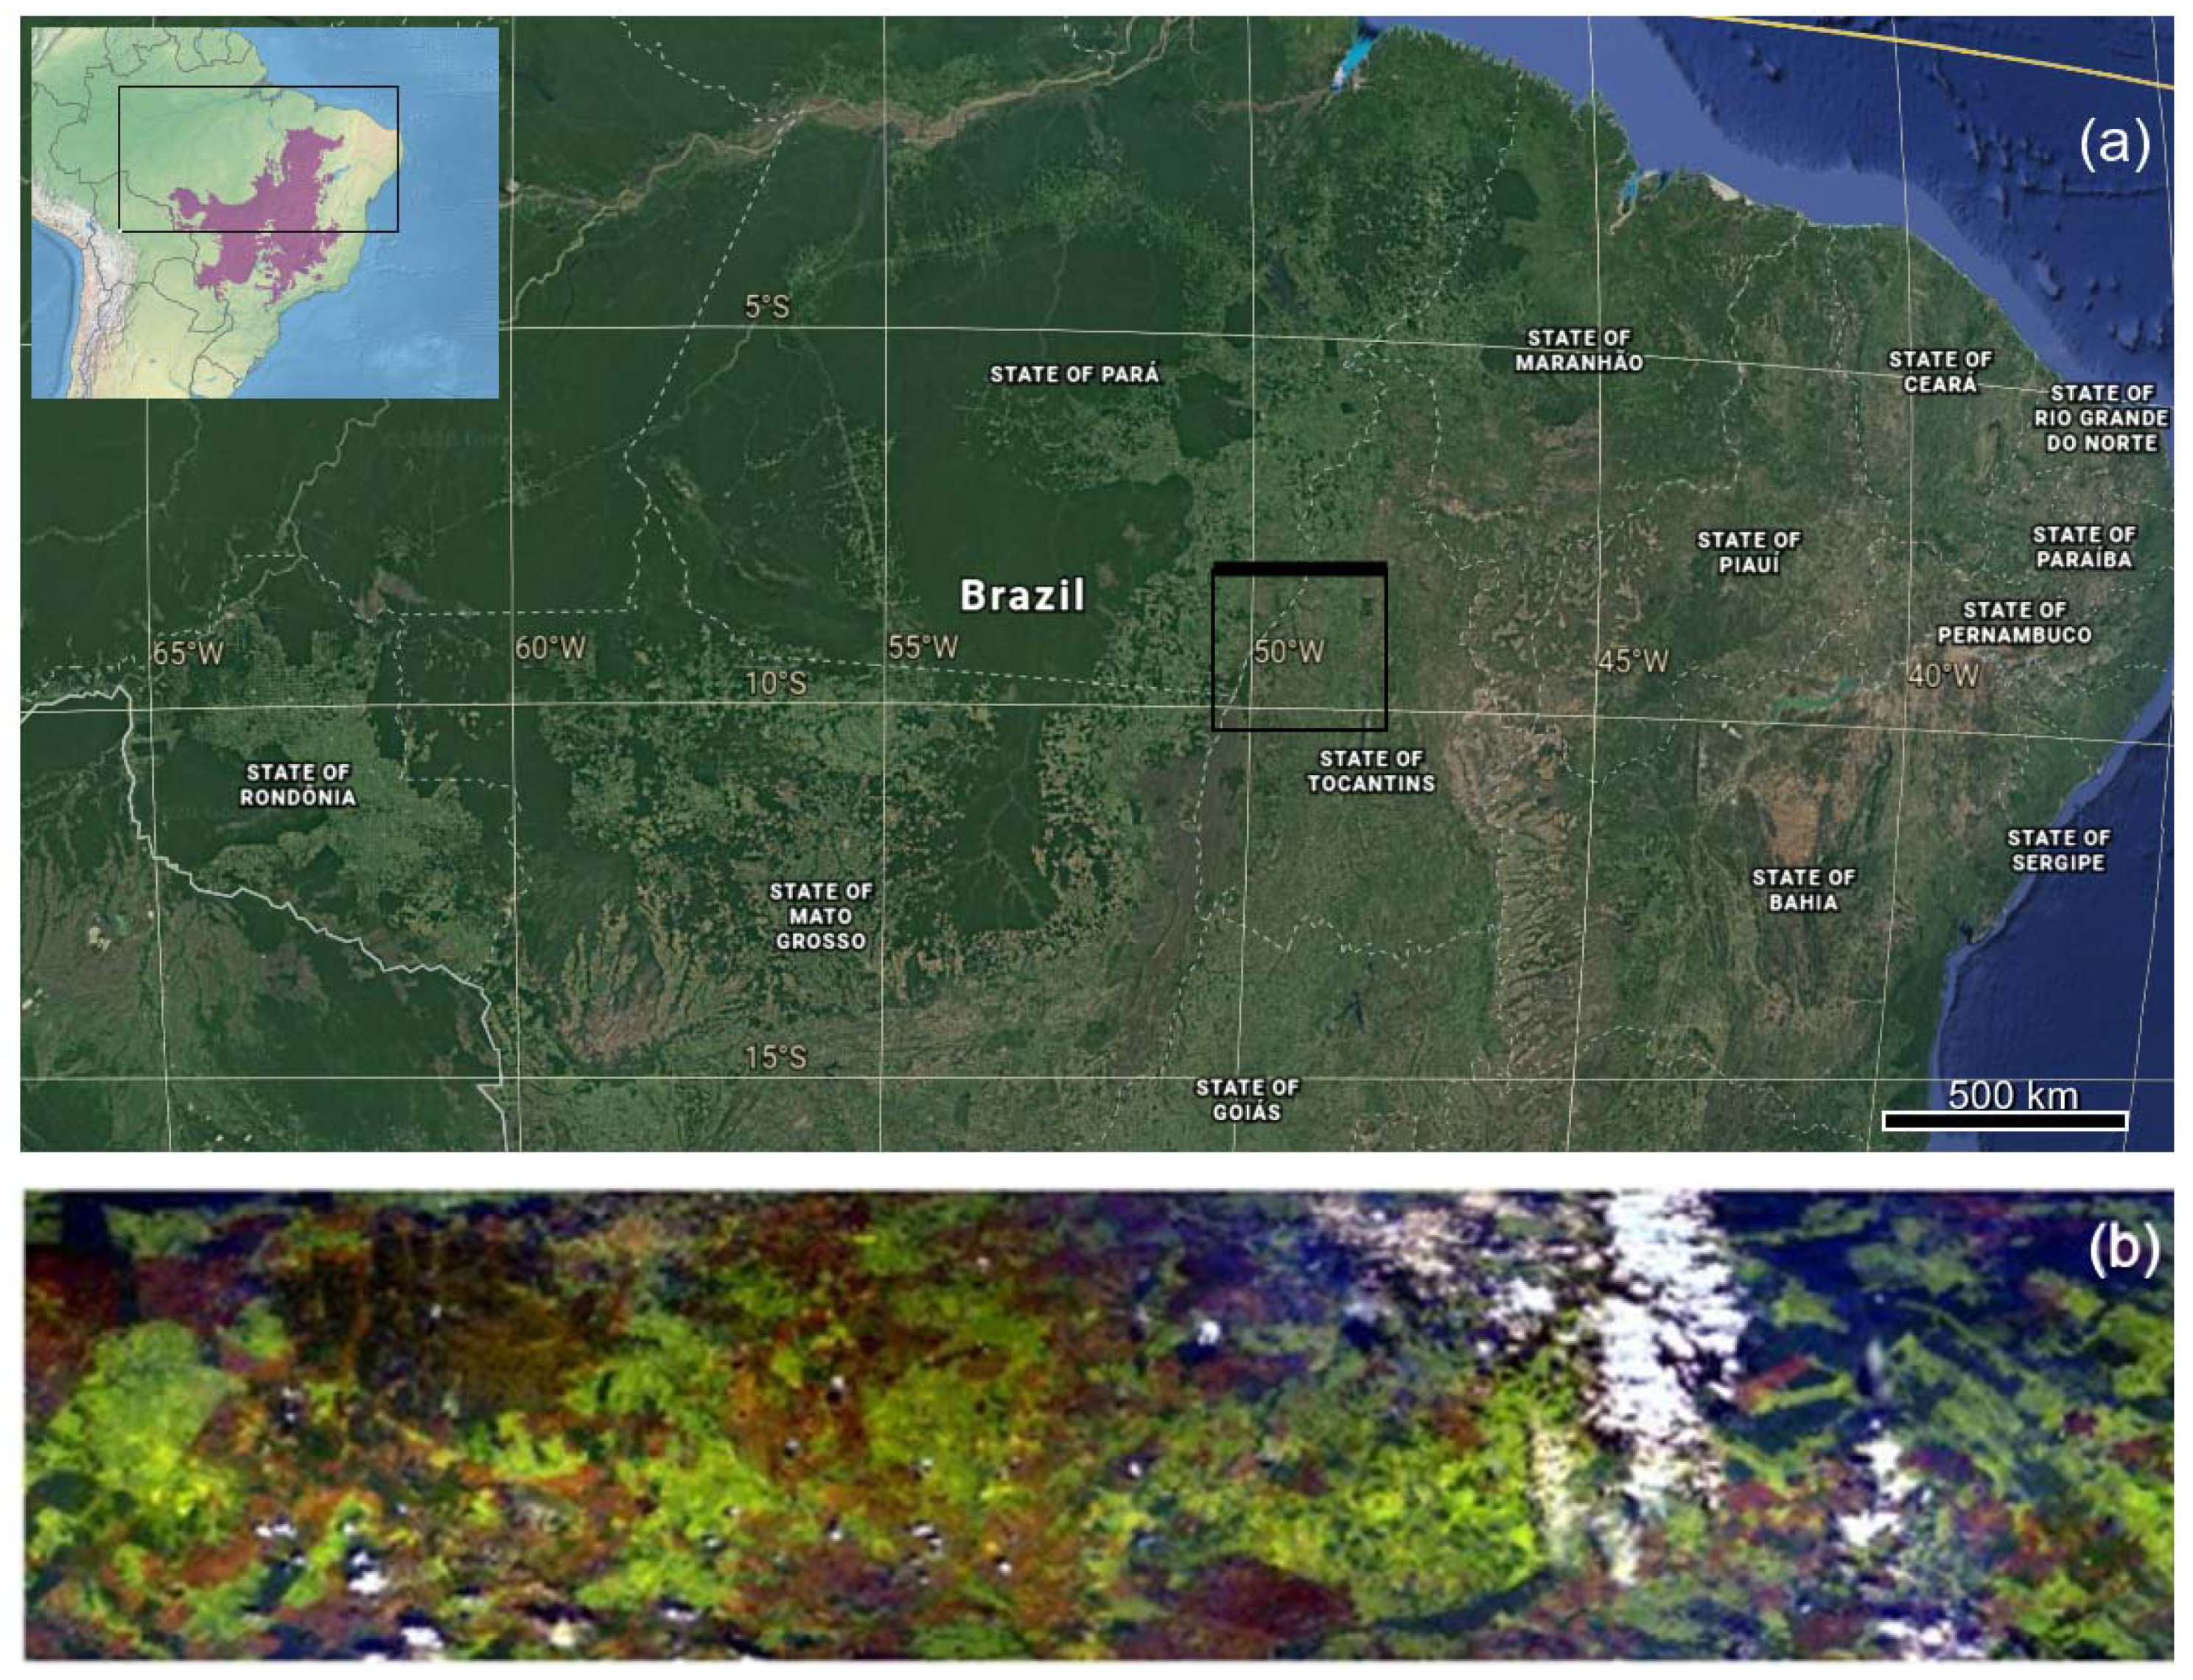
Here we focus on demonstrating how FRP underestimation can be quantified for one of the most fire-prone ecosystems on Earth, namely the Brazilian cerrado which is a savannah-like environment covering 2 million km2 (>20%) of Brazil. In this region we have access to both spaceborne 1 km MODIS data and far higher spatial resolution observations from the MODIS Airborne Simulator (MAS). The MAS instrument was flown on the NASA ER-2 High-Altitude Airborne Science Aircraft, and in this configuration provides similar atmospheric effects to those which affect MODIS spaceborne data but on data with 50 m pixels. MAS possesses similar MIR and LWIR spectral bands as MODIS, and fires for which the area of active combustion exceeds just 0.5 m2 are detectable in the 50 m pixels. This enables the identification of essentially every active fire that was burning and which was not cloud covered during the ER-2 overflights. By spatially degrading the MAS data and re-running the active fire detection process we can (i) accurately quantify the FRP underestimation provided by MODIS-type 1 km sensors, (ii) identify how this varies over the diurnal cycle, and (iii) explore for the purposes of future sensor design the minimum spatial resolution required to deliver an FRP record that has negligible pixel-area related FRP underestimation in this strongly fire-affected environment. We organize the work as follows. In Section 2 we discuss the causes and significance of FRP underestimation present when observing landscapes from remote sensing satellites. This is followed by Section 3 where we present the materials and methods used to assess the degree to which this affects observations made over the Brazilian cerrado ecoregion. The results of the investigation are presented in Section 4, followed by conclusions in Section 5.

2. Causes and Significance of FRP Underestimation

In any particular biome, the number of active fires remaining undetected is likely to be strongly time-dependent, because the proportion of high- to low-FRP fires varies across the diurnal cycle [20,21]. The impact of pixel area on active fire detection performance is well evidenced by analysis of the 375 m spatial resolution data provided by the experimental Bispectral and Infrared Remote Detection (BIRD) satellite mission, which carried the Hotspot Recognition Sensor (HSRS). This system had the task of capturing accurate snapshots of fire activity worldwide [22,23], and could detect active fire pixels having FRP < 1 MW [3], far lower than the minimum FRP detection threshold of 1 km class sensors [17]. MODIS typically shows a 5–8 MW minimum detection limit depending on the nature of the ‘thermal clutter’ that defines the ambient background temperature variability [24], though fires with an FRP < 10 MW appear generally undercounted [18,19,21]. Furthermore, since the minimum FRP detection limit scales with pixel area, and since MODIS’ pixel area increases away from nadir as the scan angle increases, the FRP detection threshold also increases away from nadir. The MODIS pixel area at the swath edge is almost 10 km², and the minimum FRP detection limit here is thus around an order of magnitude higher than at nadir [24]. VIIRS data limit off-nadir pixel growth in the 375 and 750 m spatial resolution channels via a pixel aggregation approach, limiting pixel area growth to a factor of 4.5 by the swath edge, which together with the fundamentally smaller pixel areas compared to MODIS enables far more of the lowest FRP fires to be detected [19].
BIRD data of multiple fire-affected biomes indicates that 64% of HSRS-detected active fires (AFs) had FRP < 10 MW [22], most far lower than this, indicating that MODIS would have missed the majority of the AFs that BIRD HSRS detected. However, these sub-10 MW fires only represented around 2% of the total FRP detected by BIRD HSRS over these same regions, so the fires that would have been missed by MODIS appear in this case to be responsible for very little of the overall landscape-scale FRP (and thus for a minority of fuel consumption and smoke emission). From this analysis it appears that MODIS did not significantly underestimate landscape-scale FRP, despite failing to detect probably most of the fires that were actually burning, because the higher FRP fires it could detect were responsible for the vast majority of FRP release. However, this contrasts with the findings of Zhang et al. (2017) [19], who found very significant landscape-scale FRP underestimation by MODIS when comparing near simultaneous MODIS- and VIIRS-derived FRP values in eastern China (with VIIRS’ 375 m pixel minimum FRP detection limit being very similar to that of the BIRD HSRS). The reason for these contrasting findings is that [19] focused on a ‘small fire’ dominated agricultural burning region, whereas the BIRD-HSRS acquisitions were primarily targeted at far larger and sometimes quite extreme fire events that often included regions showing some extremely high FRP fires. The true extent to which 1 km MODIS-type sensors underestimate landscape-scale FRPs in different biomes therefore remains an open question, and how this characteristic changes between the multiple MODIS overpass times and across the MODIS swath is similarly poorly understood. We address these questions by using remote sensing observations of fires burning in the Brazilian cerrado, which both provides answers for this type of fire-prone environment that are likely to be relatively indicative of savannahs more generally (which are Earth’s most fire-affected environment), and which provides a potential method for future application in other important fire-affected biomes.

3. Materials and Methods

3.1. Cerrado Remote Sensing Observations

The cerrado ecoregion covers 2 million km2 (>20%) of Brazil [25] and comprises a mix of land covers including thick grasslands, dry forest and shrubs [26], all of which are in general susceptible to fire [27]. The MODIS Airborne Simulator (MAS) was flown on the NASA ER-2 at around 20 km altitude above a part of the Brazilian Cerrado shown in Figure 1, as part of the September 1995 SCAR-B (Smoke/Sulfates, Cloud and Radiation – Brazil) experiment [2,28]. The MAS data were acquired at the September peak of the local fire season, and were part of the seminal work that was performed prior to the Terra satellite launch to aid development of the prototype MODIS active fire detection and FRP retrieval algorithm [2], used later to deliver the widely used MOD14/MYD14 MODIS active fire products [17].

3.2. Data Selection

Figure 1a depicts the airborne MAS coverage collected during SCAR-B on 11 September 1995, with six 45-minute circuits conducted around a square flight track between 11:14 and 16:28 local time. The geometrically corrected, radiometrically calibrated level 1b MAS data were obtained from NASA for this study. Their analysis indicated that the northernmost flight leg (bold part of the flight line box shown in Figure 1a) contained the vast majority of the actively burning fires. As the flight path was not exactly repeated on each circuit, this northernmost flight leg also had the most complete geographically repeated coverage across all of the six consecutive rotations made around the full flight box. Data of this northernmost flight leg thus became the focus of this study, and the 93 km × 23 km portion covered by all six repeated overflights were selected for use (see example in Figure 1b), providing six differently-timed views of the same cerrado landscape taken over an approximately 5 h period. The first data collection preceded local noon, a time when the full scale of the landscape fire activity had not yet commenced, encompassed the early-afternoon typical peak time for fire activity, and extended to 15:45 local time when fires are generally less common and burn less intensely [20]. For most biomes, this diurnal pattern results in far fewer fires typically being detected from space in the morning and evening than in the early afternoon, partly because there are fewer and also because those that are burning may be more likely to do so below a sensor’s minimum FRP detection limit [20,21].

3.3. Cloud Masking, Active Fire Detection and FRP Estimation

Active fires cannot be detected through thick cloud cover, and day cloud-induced sunglints can cause erroneous active fire detections (false alarms) [17]. Therefore, cloud masking is usually a necessity prior to any AF detection step [22]. These MAS data, converted from spectral radiance units into spectral reflectance (%) and brightness temperature (Kelvin) were used to identify cloudy pixels using a simple thresholding approach originally developed for the Advanced Very-High-Resolution Radiometer (AVHRR) Global Fire Product [29], and later adapted for the MODIS AF products [17]. Reflectance and brightness temperature thresholding of the signals in the 0.65 µm, 0.86 µm, and 12 µm MAS spectral bands was sufficient to mask cloud, with the only difference to prior studies being an increase in the daytime 12 µm threshold from 265 K to 280 K to aid discrimination of smaller, lower altitude (and thus warmer) clouds that were the most common type found in the Brazilian cerrado dataset. This procedure identified that clouds affected only 7% of the MAS pixels of the northern most flight line of the overall flight path (box-side shown bold in Figure 1a).
Subsequent to cloud masking, active fires were detected in the MAS data via application of a spatial-contextual AF detection algorithm. A flow-chart depicting the various stages of such a spatial-contextual AF detection algorithm can be found in Wooster et al. (2012) [30], where the approach is used in the prototype Sentinel-3 SLSTR active fire and FRP products. That algorithm, and the one used herein, is fundamentally based on the AF detection principles described in Giglio et al. (2003, 2016) [17,18], and which are used to produce the Terra and Aqua MODIS MOD14/MYD14 active fire products. Following the flow of the detailed algorithm [17], potential fire pixels (PFPs) were first identified in the MAS data using a set of liberal thresholds, and the identified PFPs tested again using spatial-contextual tests to confirm whether they could be considered true AF pixels. This spatial-contextual approach to AF pixel detection automatically enabled the algorithm to adapt to the varying ambient background conditions seen in the MAS data, particularly in relation to the wide-ranging acquisition times that resulted in (for example) temporally varying background temperatures.
The FRP of each detected AF pixel was estimated using the MIR radiance method [3,7], the same approach now used for FRP retrieval within the MODIS MOD14/MYD14 AF products (e.g., [18]). A typical cerrado fire might have a fireline depth covering a few to tens of meters, but fireline lengths of hundreds or even thousands of meters are possible [31]. An individual fire may therefore extend along and/or across many track MAS pixels, so following [4] and [22] we clustered AF pixels that were spatially contiguous (or which otherwise lay within 200 m of one another) into individual ’fire clusters’. This approach has the advantage of allowing the FRP estimates provided by different sensors of varying spatial resolution to be easily intercompared at the level of individual fires (e.g., [16,32]). For each identified active fire cluster, an FRP uncertainty estimate was calculated in quadrature from the pixel-level FRP uncertainties and methods detailed in Wooster et al. (2015) [33].

3.4. Dealing with Sensor Saturation

MAS has a low-gain middle infrared (MIR; 3.9 μm) channel that is the equivalent of MODIS’ Band 21 ‘active fire’ channel that, along with the Band 22 ‘normal gain’ 3.9 μm channel, is the primary spectral band used for active fire detection and FRP retrieval [17]. To support the active fire observations necessary to meet the original SCAR-B campaign objectives, the MAS MIR channel had its dynamic range increased to enable measurements of brightness temperatures to ~ 500 K [2]. Such values are high enough to provide unsaturated AF observations from all but the most extreme fire events observed by the spaceborne MODIS sensor [17], but with the 50 m MAS data fires will fill a far higher proportion of the 50 m pixels than they do 1 km MODIS pixels. This difference results in some fires observed by MAS having pixels whose thermal emittance saturates the MAS MIR band, whereas from spaceborne MODIS the fire observation would remain unsaturated. However, this was not a dominant effect, and only 5.3% of all the MAS-detected AF pixels were found to be affected by this phenomena, confirming previous analyses of the SCAR-B MAS data [2]. Fortunately, shortwave infrared (SWIR) channels can also be used to estimate pixel-level FRP [34], a fact already exploited during prior analysis of the MIR saturated pixels during the original SCAR-B analysis [2]. Hence, we were able to use data from the SWIR channels to derive the AF pixel FRP in the 5.3% of cases where MAS MIR channel saturation occurred, with the 2.1 µm SWIR channel being used in almost all (> 99%) cases.
Specifically, analyses of unsaturated MAS-detected AF pixels confirmed the existence of strong correlations between the excess (i.e., above background) fire pixel radiance in the 2.1 µm and the 3.9 µm channels (Figure 2a). The relationships derived from these empirical data were also confirmed using simulations (Figure 2b) made with the multiple thermal component model [3] that was used originally to derive the MIR radiance FRP retrieval approach. The very similar linear relationships shown in Figure 2a,b indicate that the real data and simulation match very well, and the former was thus used at AF pixels showing saturated 3.9 µm data, in order to derive simulated 3.9 µm data from 2.1 µm observations and then derive the FRP estimate with these values [3,7]. A very few (0.4%) of the AF pixels were also saturated in the MAS 2.1 µm channel, and when this occurred we used data from the 1.6 µm SWIR channel which also showed very strong linear relationship to the 3.9 µm data in unsaturated cases. Using this multi-band approach, FRP estimates and their respective uncertainties could be calculated for every MAS-detected AF pixel in every fire cluster, and the resulting FRP retrievals were summed across all detected active fires to create the necessary landscape-scale FRP totals required for our study.

3.5. Methodology for Assessing Impact of Sensor Pixel Area

To assess the effect of sensor pixel area on levels of AF detection failure (i.e., AF errors of omission), the 50 m spatial resolution calibrated and geo-corrected level 1b MAS data (in spectral radiance units) were first spatially degraded to a series of coarser pixel sizes (100 m, 200 m, 500 m and 1000 m). To do this we used an averaging kernel replicating the along-scan triangular spatial response function of the spaceborne MODIS sensor [35]. For example, a 2 km wide (and 1 km full width at half maximum [FWHM]) kernel was used to simulate the 1000 m pixels indicative of MODIS’ nadir observations, and a 200 m wide (100 m FWHM) kernel was used to simulate a sensor with 100 m pixels. Figure 3 shows an example of a fire imaged in the original 50 m MAS data alongside the series of increasingly spatially degraded versions of the same data. Subsequent to the spatial averaging process, the same conversion to reflectance and brightness temperature units, the cloud masking, active fire detection and FRP estimation pre-processing described in Section 3.3, were all applied, generating new AF detections and FRP retrievals appropriate to the data of each pixel size.
To compare MAS-derived results to information acquired from spaceborne MODIS, we used data from the Aqua MODIS early afternoon (~13:00 local time) overpass that is best located to capture the peak of the fire diurnal cycle [20]. Aqua MODIS MYD14 AF products from 2002 covering the same area and month of acquisition as the 1995 MAS data were acquired for the task, this being the closest year Aqua operated to that of the SCAR-B campaign. Examination of Landsat TM data of the area collected in the intervening years confirmed that there had been no dramatic land cover changes in the study area between 1995 and 2002. In this specific MAS to MODIS comparison we limited MAS data use to that within ± 30 minutes of the Aqua MODIS overpass time. AF pixels present in the Aqua MODIS MYD14 data products were clustered into individual fires using the same type of spatial continuity criteria applied to the MAS data, producing a dataset for direct comparison to that derived from the original 50 m pixel MAS observations.
The Aqua MODIS MYD14 data products contain active fire pixels with FRPs down to a minimum of 5 MW [24]. The spatio-contextual AF detection algorithm applied here to the 1000 m spatially degraded MAS data (Section 3.3) was able to detect AF pixels to this same minimum detection limit of 5 MW. When enacted upon the original 50 m MAS data the same algorithm was able to detect AF pixels down to an FRP of about 0.01 MW, whilst the intermediate resolution, spatially-degraded MAS data (500 m, 200 m and 100 m) was able to detect AF pixels with minimum FRPs in-between these two limits of 0.01 and 5 MW.
Frequency densities were used to compare the various MAS-derived and MODIS-derived FRP statistics. These analyses were based on a technique used previously when examining MODIS-derived FRP statistical distributions [14]. From both the original and spatially degraded MAS data, and the spaceborne MODIS data, the number of AF clusters having FRPs within a given megawatt (MW) range (bin) were calculated. These frequencies were then normalized by bin width to derive the respective frequency densities [36] as a function of FRP, an ordinary least squares regression fit to the log of the data, and a power-law best fit obtained for the observed frequency-density relations.
The minimum detectable FRP values of each of the spatially degraded MAS and MODIS datasets were, to first order, proportional to each datasets pixel area [24]. The power-laws fit to each of the sets of frequency-densities as a function of FRP were, however, able to be extrapolated to the same 0.01 MW minimum FRP detection limit that characterises the original 50 m MAS data, in order to estimate the frequencies of the active fires remaining undetected at each spatial resolution. The FRP underestimation induced by these ‘missing detections’ was then determined by comparing the integrated FRP within the “extrapolated” interval (i.e., ≤ 5 MW MODIS minimum detection limit) to that from the “always measured” interval (i.e., that > 5 MW).

4. Results

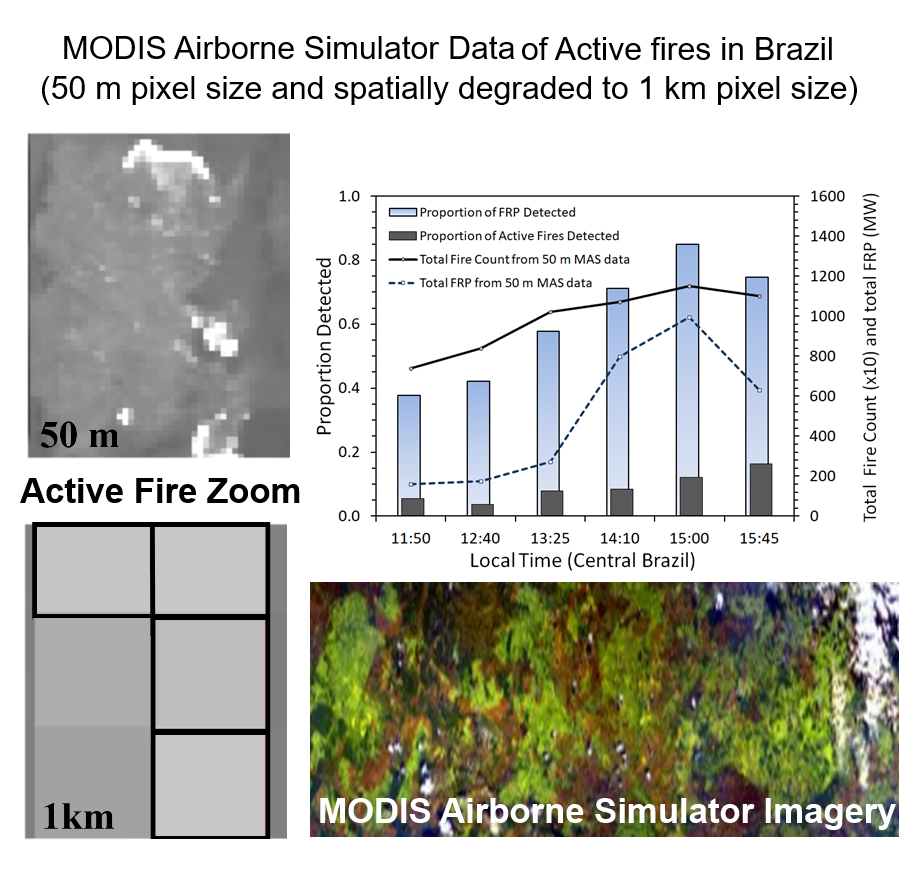
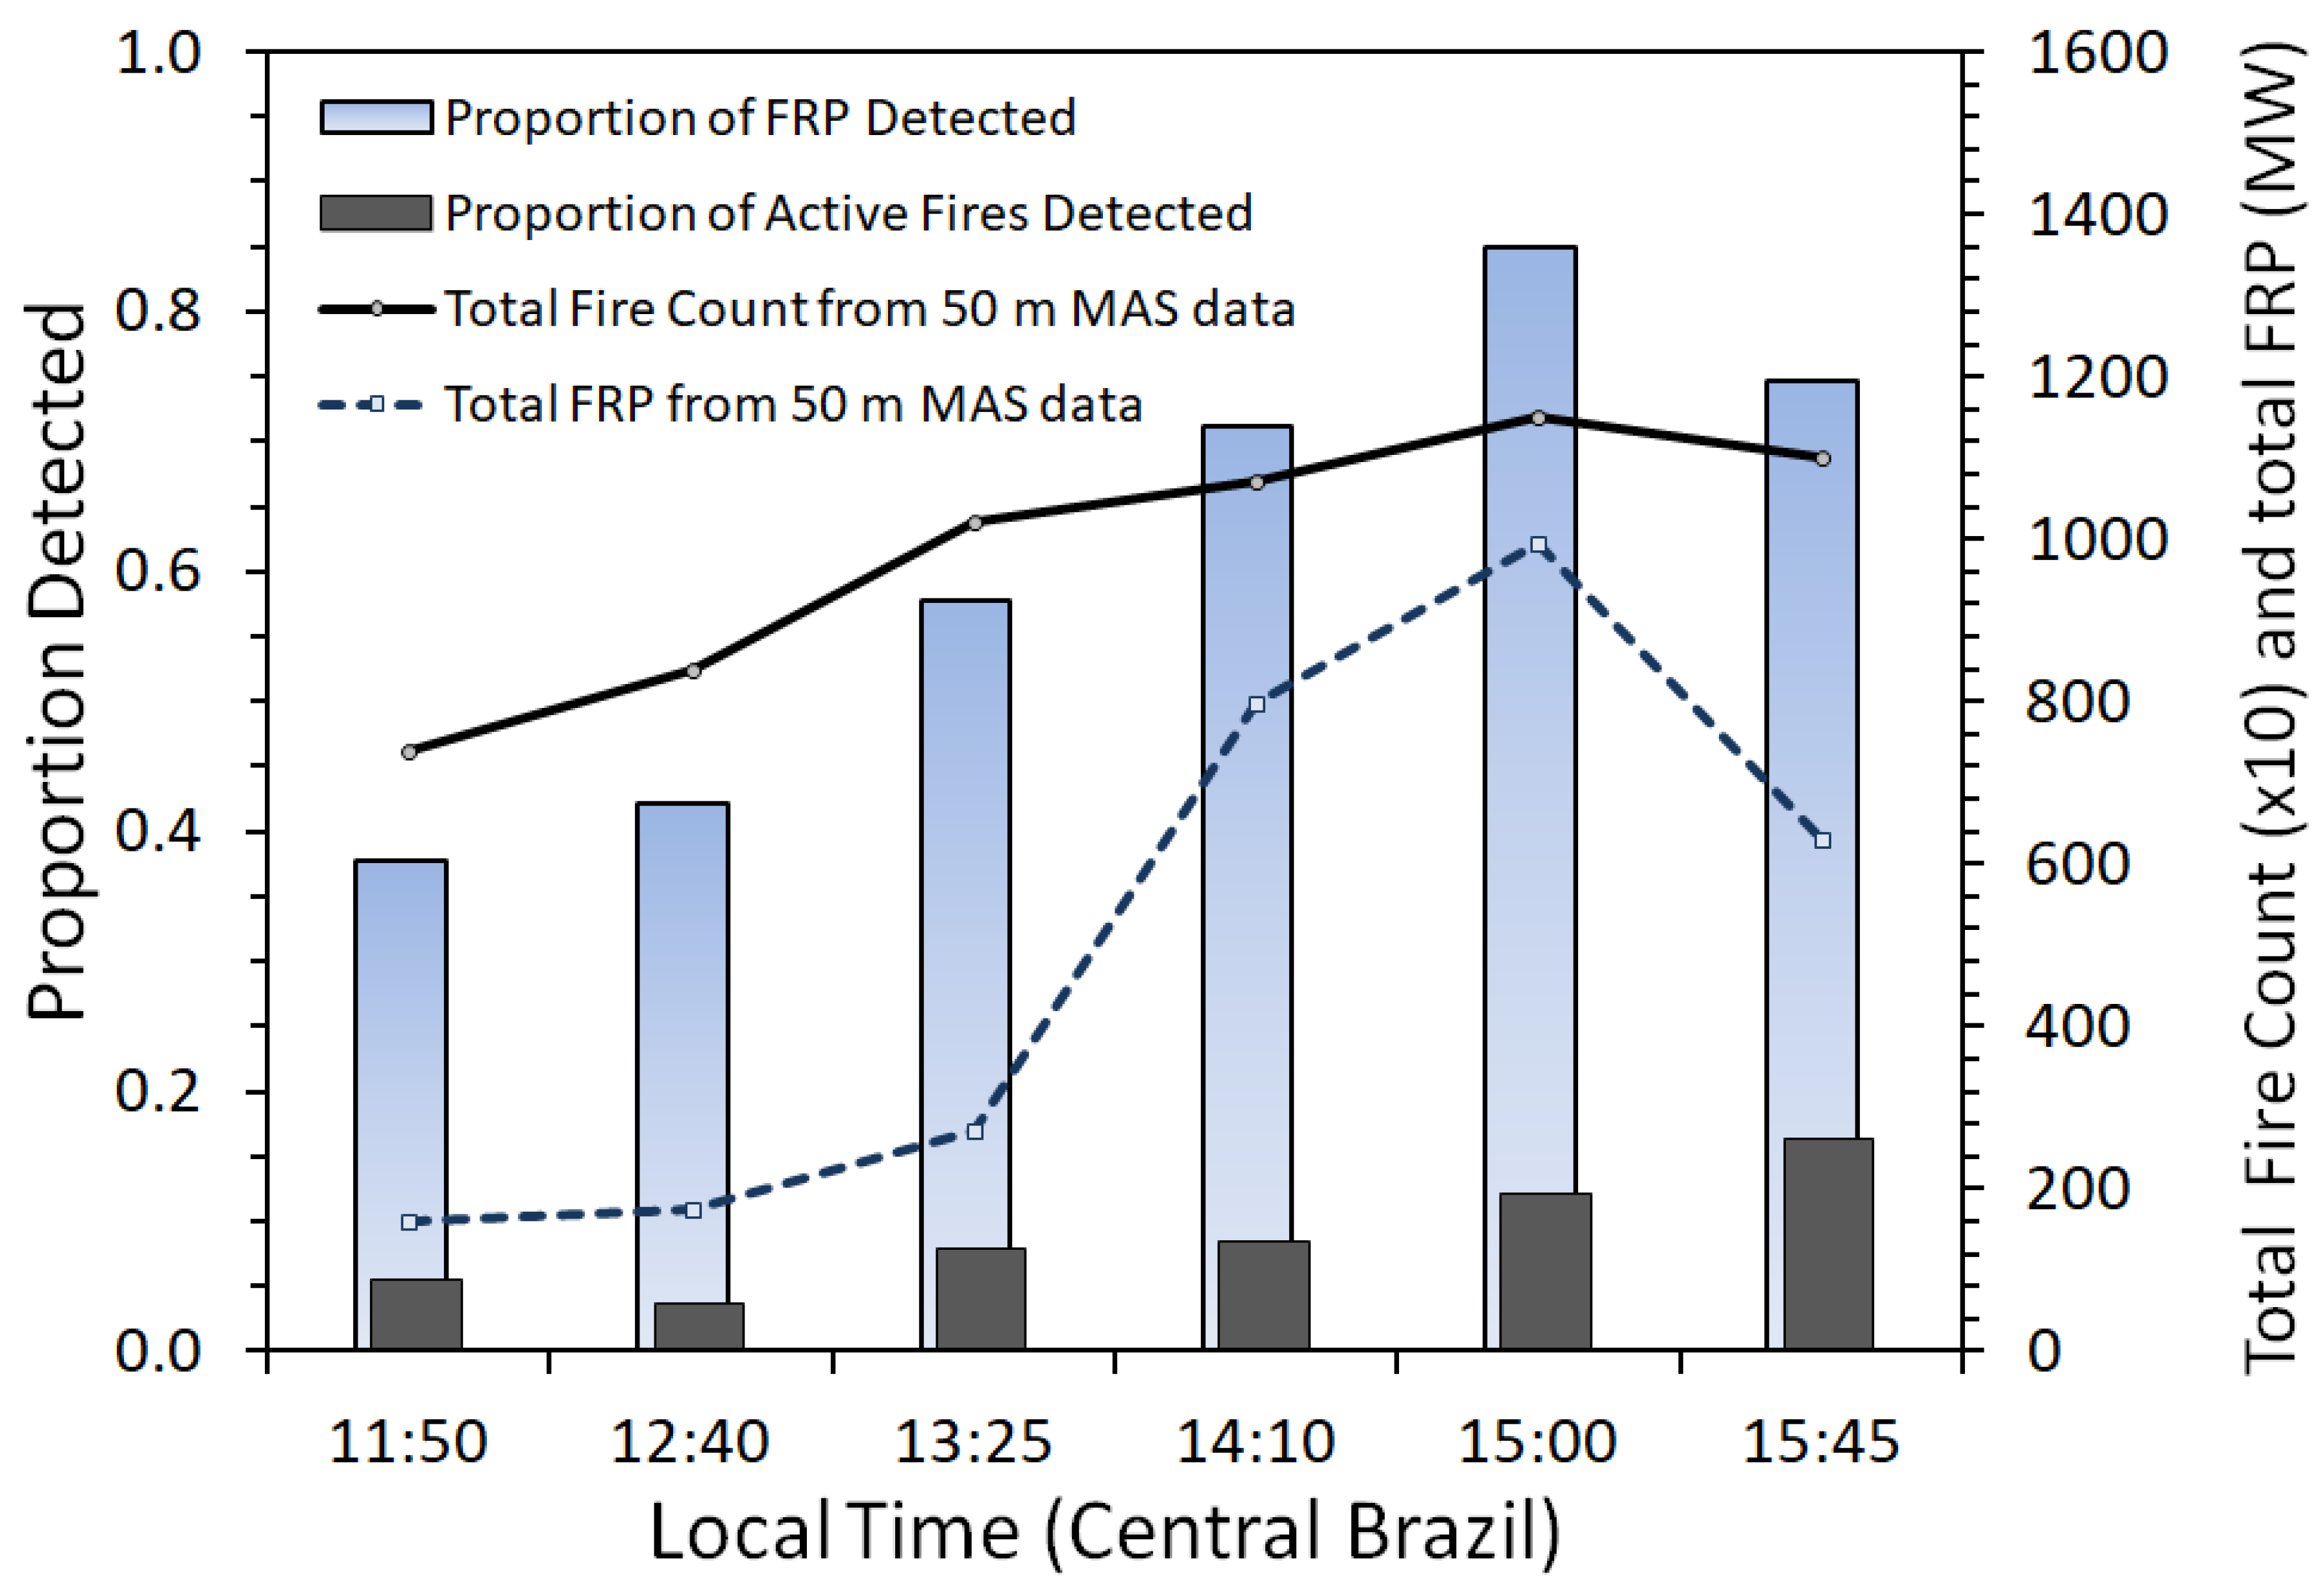
Figure 4 compares the numbers of active fires (AFs) and fire radiative power (FRP) detected in the study region using the coarsest (1 km) spatially degraded MAS data (i.e., that which best simulates spaceborne MODIS nadir observations) with that identified using the original 50 m resolution MAS data. Only daytime data are considered, but fires in these and other environments are almost always far more common by day than by night [20]. In terms of AF detection, peak performance occurs with the 1 km data at 15:45 local time, soon after the local diurnal fire count peak that the MAS data also identifies at ~ 15:00 local time, which is very close to the 15:36 local time peak reported previously for Brazilian deforestation (evergreen broadleaf forest and savannah) fires [20]. Even so, at this time the 1 km spatially degraded MAS data provide an active fire count just 17% of that provided by the original 50 m MAS data (Figure 4). Whilst some of the undercounting is the result of multiple individual fires discernible at 50 m resolution being grouped together as a single fire when resampled to 1 km, much is due to originally detectable fires falling below the minimum detection limit when the data are degraded to 1 km pixels. Furthermore, at times far away from the afternoon diurnal peak of fire activity, the fire count proportion falls further. At 12:40 local time, the 1 km MAS data show an AF count less than 5% of that of the original 50 m resolution data. Together, the data of Figure 4 suggest that by day the MODIS sensors onboard the Terra and Aqua satellites fail to detect a very significant fraction of active fires burning in the Brazillian cerrado at their respective overpass times, but that the best performance (in terms of detecting the highest fraction of actually burning fires) occurs at the early afternoon Aqua overpass time.
In terms of landscape-scale FRP underestimation, the situation is far better than for active fire counts. Even though the active fire detection algorithm fails to identify the majority of the actively burning fires when applied to the 1 km MAS data, these undetected fires each typically have a low FRP and thus their absence in the 1 km dataset has a much more limited effect on overall landscape-scale FRP underestimation. The most significant underestimation occurs furthest away from the ~ 15:00 local time diurnal peak, when at 11:50 local time the spatially degraded 1 km MAS data detects only 38% of the FRP able to be quantified by the 50 m observations (leftmost blue bar in Figure 4). However, at this time the landscape-scale FRP total is less than one sixth of that observed at the diurnal FRP peak (see dashed line in Figure 4), and so the increased level of FRP underestimation see away from this peak has a limited effect on the overall underestimation of landscape-scale fire radiative energy (FRE; calculated via the temporal integration of FRP). We calculate that the FRE identified over the period of the MAS flights using the 1 km MAS-detected active fires represents in fact 72% of that detected with the original 50 m MAS data. This is because, by around 13:00 local time, the local fire regime has seen enough of the fire fires grow in number, size and/or intensity that the 1 km AF detections are able to capture the majority (i.e., blue bar proportion > 0.5 in Figure 4) of the total landscape FRP being emitted, and by the diurnal FRP peak (~ 15:00 local time) the active fires successfully detected using the 1 km MAS data represent 82% of the FRP identified using the 50 m data.
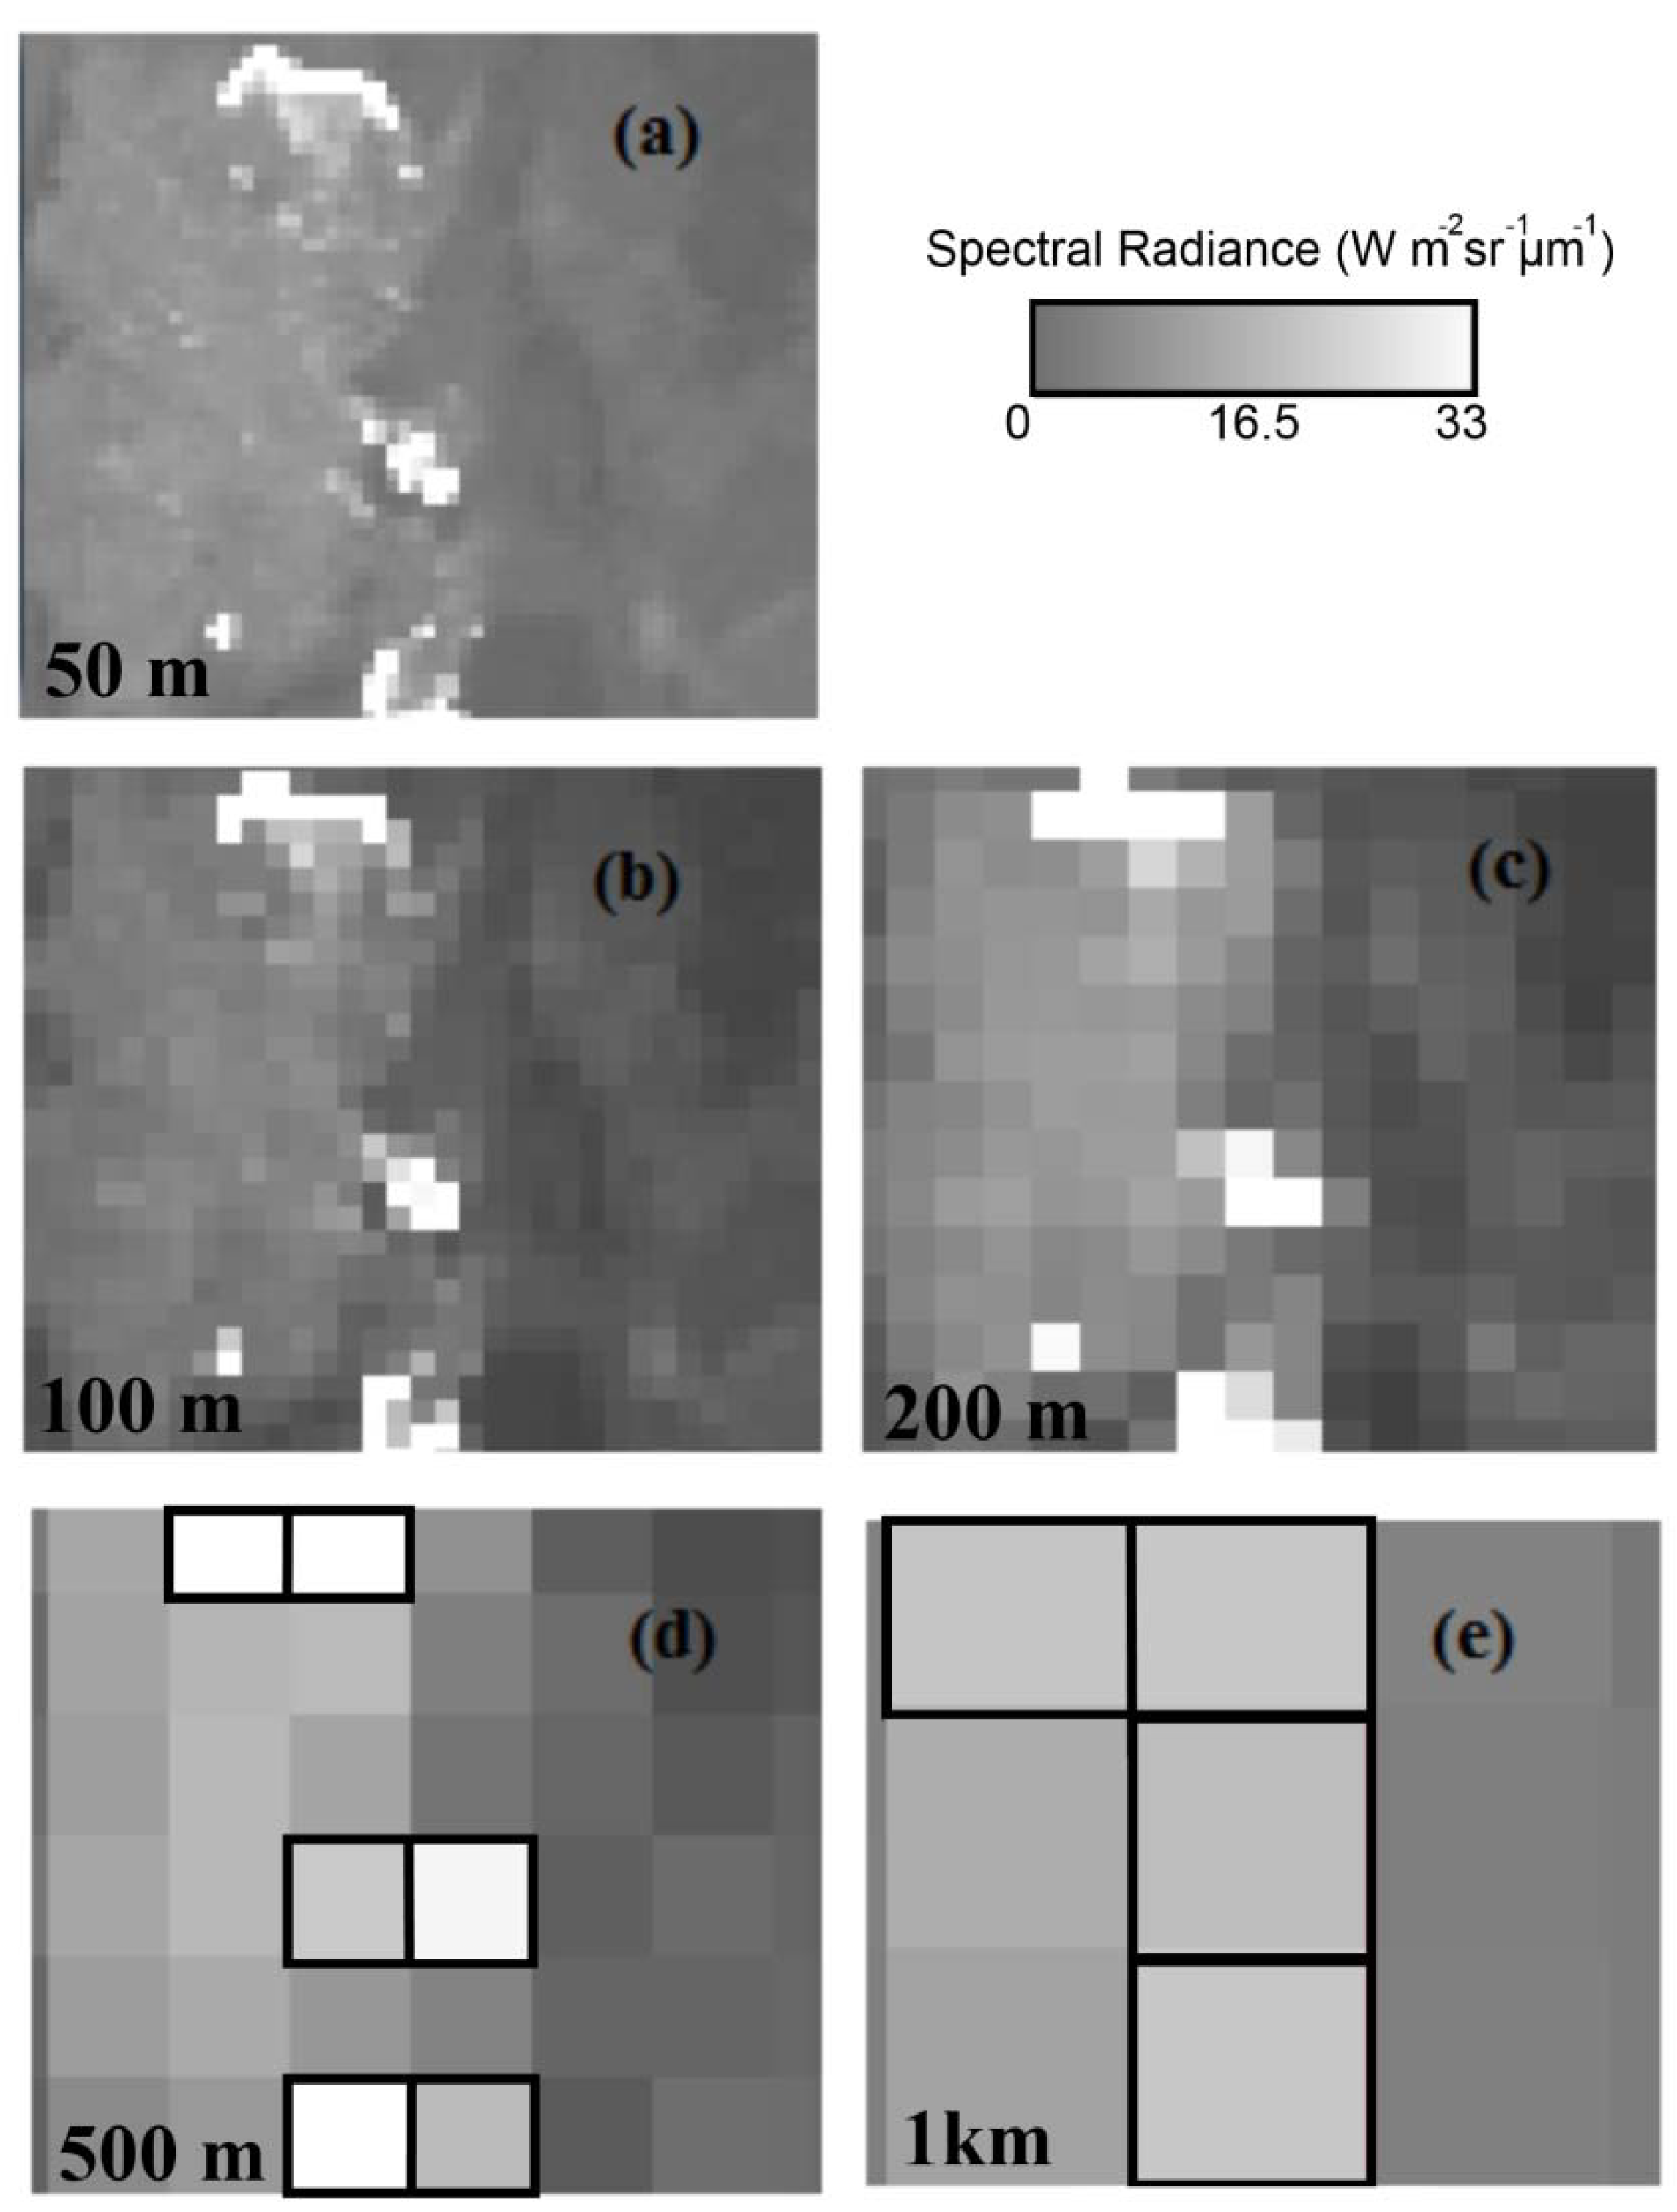
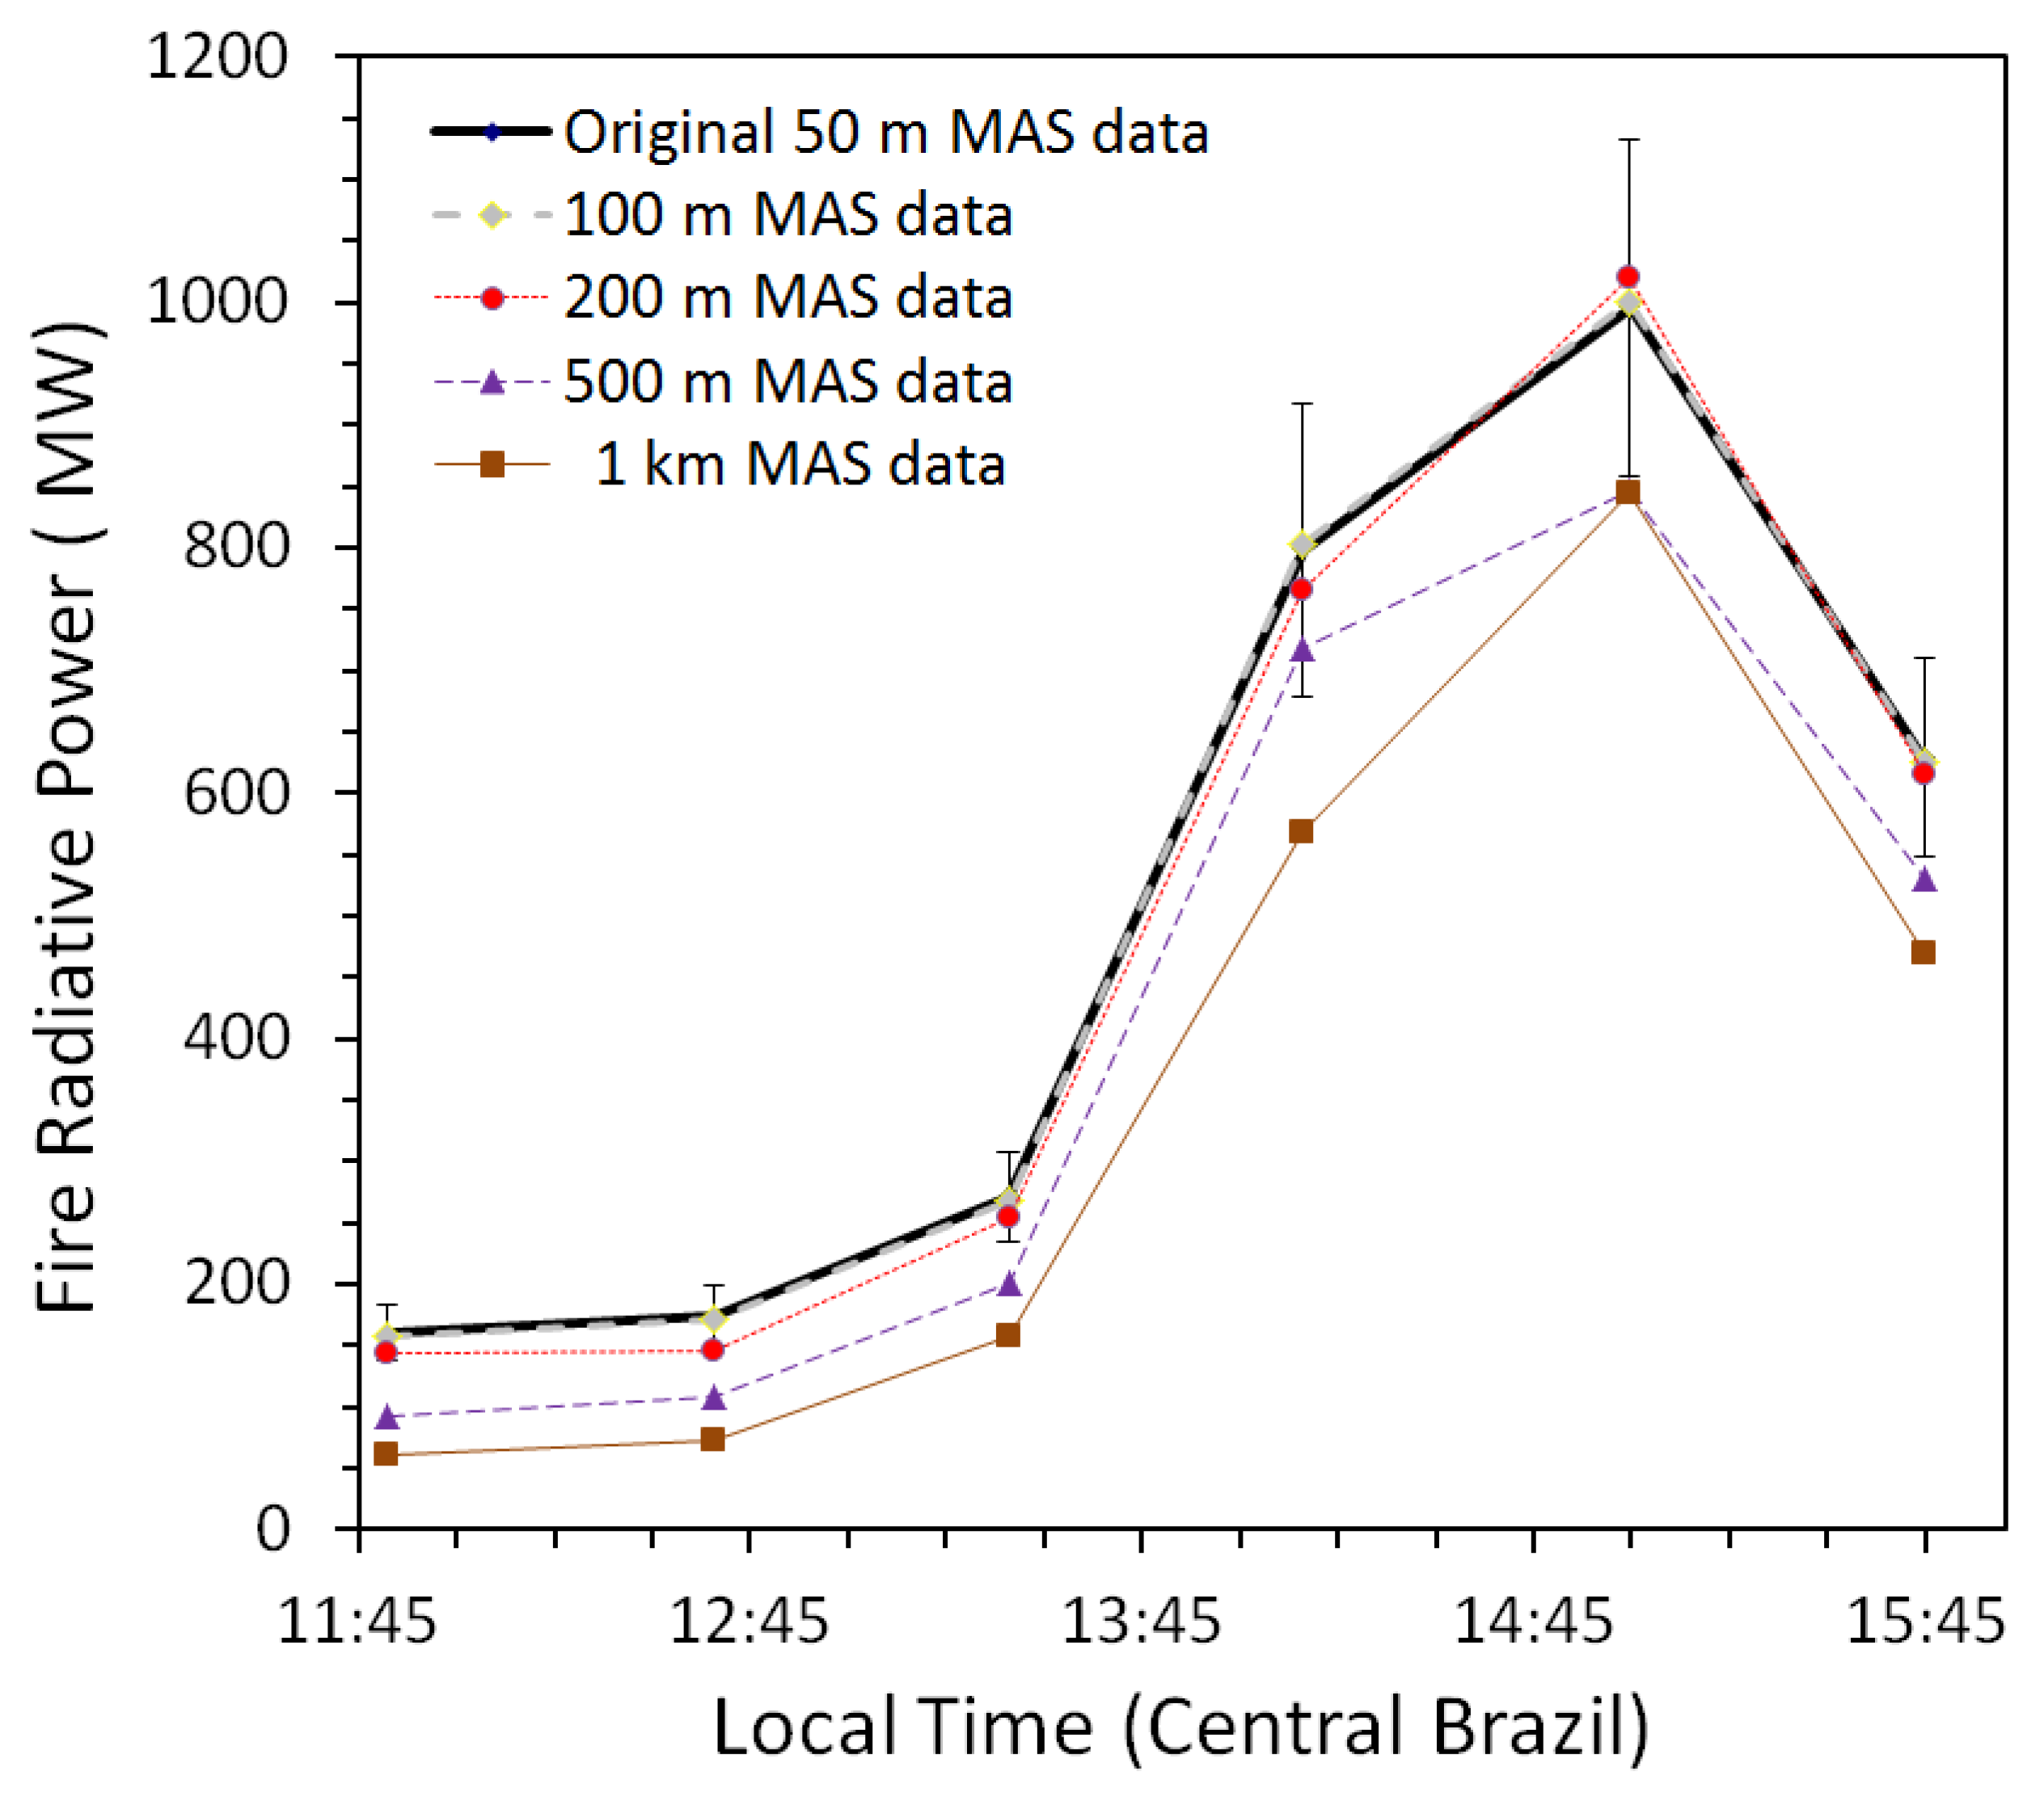
Figure 5 shows for each overflight time the total landscape-scale FRP detected with the original 50 m resolution MAS data and the increasingly spatially degraded datasets (i.e. the 100 m, 200 m, 500 m and 1 km data, examples of which were shown in Figure 3). As introduced in Section 1, the minimum FRP detection limit of a sensor and algorithm essentially scales with pixel area [24], and even though the minimum FRP detection limits for the 100 m and 200 m versions of the MAS data are thus about 4× and 16× those of the original 50 m data respectively, these detection limits remain low enough that in both cases the undetected active fires are responsible for only a very small proportion of the total landscape scale FRP. Therefore, for these 100 m and 200 m spatially degraded MAS datasets, the total landscape FRP sensed by these data lie extremely close to the ‘true’ landscape-scale FRP value calculated from the fires detectable with the original 50 m data (Figure 5).
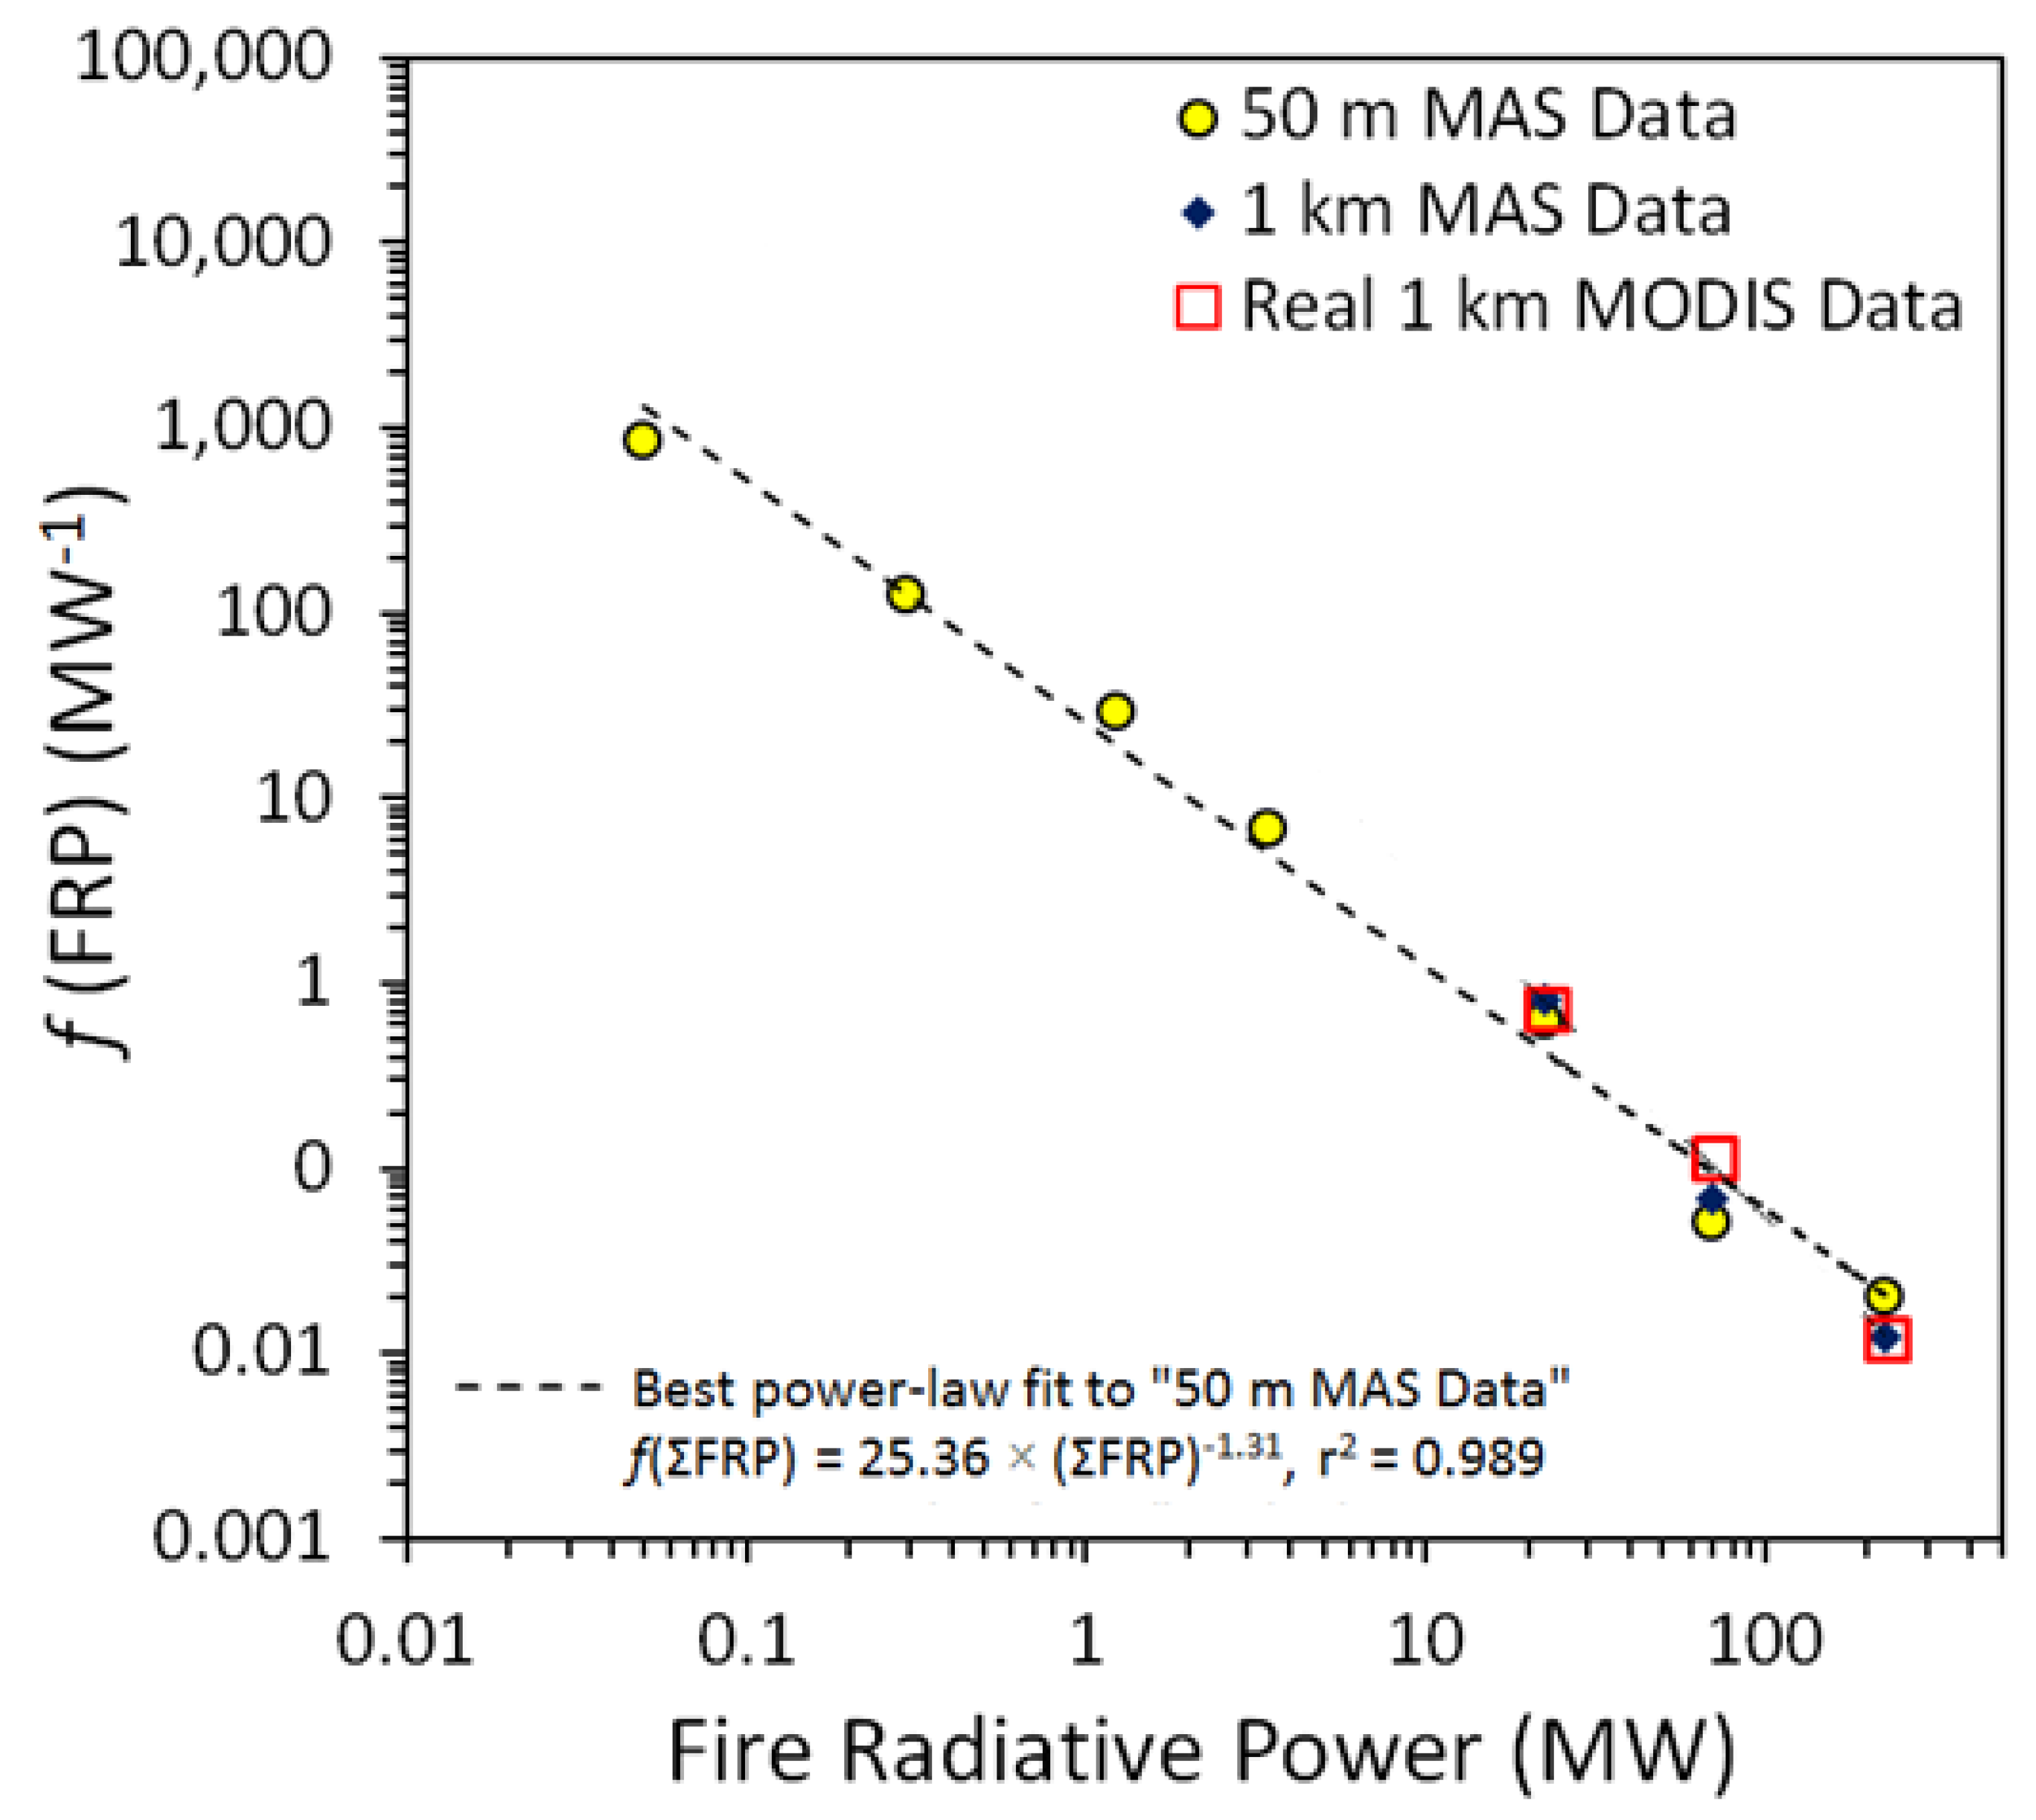
Figure 6 shows the frequency-densities of FRP constructed from the original 50 m MAS data and calculated down to a 0.01 to 0.1 MW FRP range (i.e., a 0.05 MW bin centre). Additionally shown are the FRP frequency-densities from both 1 km spatially degraded MAS data, and from the spaceborne Aqua MODIS data (both calculated down to a 20 MW bin centre, representing the 10 MW to 30 MW FRP range). The latter two sets of frequency-densities appear very similar, suggesting that the degree of FRP underestimation present in the 1 km spatially degraded MAS data is broadly consistent with that in the real Aqua MODIS data. We can therefore use the former degree of underestimation, which we know via comparison between the results obtained with the 50 m and 1 km MAS data (e.g., Figure 4), to estimate the latter currently unknown quantity.
Fitting and extrapolating the FRP frequency-density distribution to the real MODIS data of Figure 6, which include observations of fires at nadir and off-nadir, provides another means of estimating the FRP remaining undetected by Aqua MODIS’ daytime observations because their constituent AF pixels lie below its minimum FRP detection limit. The extrapolation of the best-fit power-law distribution indicates that these undetected fires are responsible for around 35% of the total landscape fire FRP present at early afternoon Aqua overpass, which is close to the figure of 71% derived when comparing landscape FRP totals from the 1 km and 50 m versions of the MAS data captured around 14:10 local time (blue vertical bars, Figure 4), which is the MAS data collection timed closest to the afternoon Aqua overpass of this region. Of course, the MAS and MODIS data are captured in different years, so an exact match would not be expected, and furthermore the FRP frequency densities in Figure 6 may not follow a single strict power-law. Specifically, the exponents of the power-law best fits to the 50 m MAS FRP frequency-density distribution data appear to differ slightly either side of a ~ 10 MW threshold, a ‘break-of-exponent characteristic that has already been observed in wildfire burned area frequency-density statistics (e.g., [36]). Nevertheless, we can be reasonably sure that from these results that the FRP measures provided by Aqua MODIS appear to represent around two thirds of the real landscape fire FRP emitted in this biome and season at the time of the afternoon Aqua MODIS overpass.

5. Summary and Conclusions

Research conducted here has exploited MODIS Airborne Simulator (MAS) data from the 1995 SCAR-B experiment to develop an approach to help optimize some aspects of the design of fire-focused future spaceborne missions. Work in [2] with these same data already helped lay the foundations for the extremely successful spaceborne Terra and Aqua MODIS MOD14/MYD14 Active Fire (AF) detection algorithm and AF products. We have specifically focused on gaining improved understanding of the impact that pixel size has on active fire detection and FRP underestimation in the key fire affected landscape focused on by SCAR-B, the savannah-like Brazilian cerrardo that covers around 20% of the country. Using the original 50 m spatial resolution MAS data collected across a significant part of the cerrardo fire diurnal cycle we have identified pixels containing actively burning fires and estimated the fires FRP. We have then spatially degraded the MAS data to simulate spaceborne remote sensing data of varying pixel sizes (100 m to 1 km), and reapplied our AF detection and FRP estimation techniques to compare the AF detection omission error rates and resulting levels of FRP underestimation coming from use of different spatial resolution data. Finally, we have compared our AF data to those coming from real spaceborne Aqua MODIS observations, attempting to understand the potential degree of landscape-scale FRP underestimation occurring in real MODIS data of this same cerrado region.
Our results confirm observations [2] that the 50 m spatial resolution MAS instrument operated from the high-altitude ER-2 aircraft can detect almost every landscape fire burning in this cerrado environment (cloud cover permitting). Active fire pixels with an FRP as low as 0.01 MW can be discriminated with the 50 m MAS data (equivalent to a flaming fire covering only ~ 0.25 m2), but when the MAS data is spatially degraded the number of fires that remain undetected increases with increasing pixel size. The minimum FRP detection limit scales directly with pixel area [7,16,19,33], and at the diurnal fire cycle peak (~ 15:00 local time) we find that very many of the active fires detectable with the 50 m MAS data become undetectable with the 1 km (MODIS-like) version of the dataset. Away from the diurnal peak of fire activity, the fraction of detectable fires falls even further because more of the fires are of lower intensity and size. Further decreases in the fraction of detectable fires may occur at times outside the 11:50 to 15:45 local time window sampled herein by the ER-2.
However, because it is the smaller and/or more weakly burning active fires that remain undetected by the coarser spatial resolution data, landscape scale underestimation of FRP is far less severe than are the AF errors of omission. The afternoon overpass of the Aqua satellite provides the MODIS observations capturing FRP closest to the diurnal peak of fire activity (~ 15:00 local time), and using two different approaches we find that this afternoon overpass captures around two thirds (our estimates are 65 to 71%) of the true FRP being emitted from fires in this savannah-like landscape, a lower estimate than the 80 to 100% suggested by [2]. The mid-morning Terra MODIS overpass shows a greater degree of FRP underestimation than the Aqua afternoon overpass, due to its imaging at a time much further away from the peak of the diurnal fire cycle. Mid-morning is a time when the fires that are burning are typically significantly smaller and/or more weakly radiant than later in the day, so more of them are missed, but since the absolute fire count and FRP total is also significantly lower at this earlier time of day the overall FRE and/or daily average FRP used by others (e.g., [10]) to estimate daily mean smoke emissions are less impacted by this level of FRP underestimation than may initially appear the case. Overall, we find that the FRE derived using the 1 km version of the MAS data over the 5 hours of the ER-2 flight campaign is 72% of that derived with the full resolution (50 m) version of the same dataset.
Whilst the analysis performed herein has focused on 1 km MODIS data, in fact the pixel area of MODIS increases markedly as you move far away from nadir, as demonstrated in [24]. At the MODIS edge of swath, the minimum detectable per-pixel FRP is around an order of magnitude higher than at the nadir point, though the impact of this on landscape-scale FRP underestimation appears more than counteracted by the MODIS ‘bow-tie’ effect inducing double- or triple-counting of AF pixels towards the swath edge (such that more FRP is in fact detected at the MODIS edge of swath observations than at nadir) [24]. Without this ‘bow-tie’ effect, our analysis of MAS data shows that in the cerrado landscape MODIS’ edge of swath observations would probably detect less than 50% of the true FRP being emitted. However, the more recent VIIRS sensor, with its dual 375 m and 750 m observations should be able to detect perhaps 90% of the FRP coming from landscape cerrado fires when imaging at nadir [19,37], and the pixel aggregation scheme employed to limit VIIRS off-nadir pixel area growth to within around a factor of two helps limit falloff in this figure as view zenith angle increases.
Degrading the MAS data to a series of intermediate spatial resolutions and performing the same analyses as for the 1 km data informs us that reducing pixel sizes below around 200 m may offer limited additional advantages for regional FRP estimation, because active fires responsible for more than 97% of the total FRP emission are detected at this pixel size. This means that almost all the FRP coming from fires responsible for the vast majority of air pollutant and carbon emissions could be detected with spaceborne data collected at a 200 m spatial resolution, and thus we recommend this pixel size as potentially the minimum needed for future spaceborne missions aiming at AF detection and especially FRP retrieval, at least when targeting savannah-like biomes. At these types of pixel sizes, large swath instruments having relatively frequent revisit capabilities remain possible, especially when operating two or more such system simultaneously. Further investigation may indicate that even coarser pixel sizes maybe considered adequate for biomes such as the North American boreal forest, which typically show preponderance of higher FRP fires when compared to savannahs [14,38].
These spatial resolution recommendations assume the use of MIR-channel equipped sensors having relatively low noise characteristics, so that even relatively low FRP active fire pixels can be clearly identified against their non-fire background ‘thermal clutter’. MODIS in fact has two 3.9 μm channels, with an NEdT of 0.07 and 2.0 K respectively, in order to provide both low noise for sensitivity to smaller (low FRP) fires and a wide dynamic range to avoid saturation over larger (higher FRP) fires [5,17,18], whilst VIIRS operates MIR channels at two spatial resolutions (375 m and 750 m) for a similar reason [19,38]. If sensors characterised by significantly higher noise levels and thus different detection sensitivities are being considered for use (e.g., MIR microbolometers) then these pixel size recommendations may need to be re-assessed. Any such considerations should also be traded off against the apparent potential for increasing false alarm rates as pixel size decreases and thermal clutter and other non-fire effects on the thermal signals potentially increase in magnitude [19,38].
Assuming the low-noise detection capabilities of MAS and MODIS-type sensors, 200 m pixels enable fires with FRPs of around 0.2 MW—equivalent to a flaming area of ~ 5 m² or a smouldering area ~ ×10 larger—to be detected. The vast majority of FRP and smoke emissions come from fires larger than this, even when taking into account the increased non-CO2 trace gas and particulate emissions factors characteristic of smouldering fires [39]. It is for this reason that we consider pixel sizes finer than 200 m potentially unnecessary for the FRP application, and areas of agricultural residue burning maybe among the only biomes where significant FRP release is commonly dominated by fires smaller than these limits, with sub-surface fires in peatlands and coal seams also potentially posing similar issues. However, even here the clustering of many such fires within a single pixel enables many of the fires to still be detected, e.g., as demonstrated via use of 375 m VIIRS I-Band data [19,39]. Since pixel area is typically traded off against instrument swath width and temporal revisit time on polar orbiting spacecraft, the suggestion of an absolute minimum 200 m limit on pixel size should provide a useful guide for future mission developers aiming at active fire and FRP applications. Our methodology builds on that of [2] to develop an approach to help optimize the design of potential future spaceborne missions with an active fire detection and FRP focus, and our findings should be further confirmed by collecting additional airborne observations that extend the dataset used herein to other times, seasons and biomes.

Author Contributions

Conceptualization and Methodology, M.J.W. and B.D.M.; Formal Analysis, S.S.; Writing—Original Draft Preparation, M.J.W., S.S. and B.D.M.; Writing—Review & Editing, M.J.W., S.S. and B.D.M. All authors have read and agreed to the published version of the manuscript.

Funding

This research was primarily funded by a NERC PhD studentship to S.S. made by the NERC Centre for Terrestrial Carbon Dynamics (CTCD), and supported also by NERC National Capability funding to NCEO (PR140015) and NERC Grant NE/M017729/1.

Acknowledgments

This paper is dedicated to the memory of Samuel Sperling, the first author, who sadly passed away 27 March 2015. The authors would like to thank NERC and the UK’s Centre for Terrestrial Carbon Dynamics (CTCD) for funding the PhD under which this research was conducted. The NASA teams responsible for the MAS and MODIS datasets used herein are warmly thanked, including the entire SCAR-B team for their initial data collection effort.

Conflicts of Interest

The founding sponsors had no role in the design of the study; in the collection, analyses, or interpretation of data; in the writing of the manuscript, and in the decision to publish the results.

References

  1. Robinson, J.M. Fire from space: Global fire evaluation using infrared remote sensing. Int. J. Remote Sens. 1991, 12, 3–24. [Google Scholar] [CrossRef]
  2. Kaufman, Y.J.; Kleidman, R.G.; King, M.D. SCAR-B fires in the tropics: Properties and their remote sensing from EOS-MODIS. J. Geophys. Res. 1998, 103, 955–969. [Google Scholar] [CrossRef]
  3. Wooster, M.J.; Zhukov, B.; Oertel, D. Fire radiative energy for quantitative study of biomass burning: Derivation from the BIRD experimental satellite and comparison to MODIS fire products. Remote Sens. Environ. 2003, 86, 83–107. [Google Scholar] [CrossRef]
  4. Roberts, G.; Wooster, M.J.; Perry, G.L.W.; Drake, N.; Rebelo, L.-M.; Dipotso, F. Retrieval of biomass combustion rates and totals from fire radiative power observations: Application to southern Africa using geostationary SEVIRI Imagery. J. Geophys. Res. 2005, 110. [Google Scholar] [CrossRef] [Green Version]
  5. Freeborn, P.H.; Wooster, M.J.; Roy, D.P.; Cochrane, M.A. Quantification of MODIS fire radiative power (FRP) measurement uncertainty for use in satellite-based active fire characterization and biomass burning estimation. Geophys. Res. Lett. 2014, 41, 1988–1994. [Google Scholar] [CrossRef]
  6. Freeborn, P.H.; Wooster, M.J.; Roberts, G.; Xu, W. Evaluating the SEVIRI fire thermal anomaly detection algorithm across the Central African Republic using the MODIS active fire product. Remote Sens. 2014, 6, 1890–1917. [Google Scholar] [CrossRef] [Green Version]
  7. Wooster, M.J.; Roberts, G.; Perry, G.; Kaufman, Y.J. Retrieval of biomass combustion rates and totals from fire radiative power observations: Part 1—Calibration relationships between biomass consumption and fire radiative energy release. J. Geophys. Res. 2005, 110. [Google Scholar] [CrossRef]
  8. Ichoku, C.; Kaufman, Y.J. A method to derive smoke emission rates from MODIS fire radiative energy measurements. IEEE TGRS 2005, 43, 2636–2649. [Google Scholar] [CrossRef]
  9. Freeborn, P.H.; Wooster, M.J.; Hao, W.M.; Ryan, C.A.; Nordgren, B.L.; Baker, S.P.; Ichoku, C. Relationships between energy release, fuel mass loss, and trace gas and aerosol emissions during laboratory biomass fires. J. Geophys. Res. 2008, 113. [Google Scholar] [CrossRef]
  10. Kaiser, J.W.; Heil, A.; Andreae, M.O.; Benedetti, A.; Chubarova, N.; Jones, L.; Morcrette, J.-J.; Razinger, M.; Schultz, M.G.; Suttie, M.; et al. Biomass burning emissions estimated with a global fire assimilation system based on observed fire radiative power. Biogeosciences 2012, 9, 527–554. [Google Scholar] [CrossRef] [Green Version]
  11. Schreier, S.F.; Richter, A.; Kaiser, J.W.; Burrows, J.P. The empirical relationship between satellite-derived tropospheric NO2 and fire radiative power and possible implications for fire emission rates of NO x. Atmos. Chem. Phys. 2014, 14, 2447–2466. [Google Scholar] [CrossRef] [Green Version]
  12. Mota, B.; Wooster, M.J. A new top-down approach for directly estimating biomass burning emissions and fuel consumption rates and totals from geostationary satellite fire radiative power (FRP). Remote Sens. Environ. 2018, 206, 45–62. [Google Scholar] [CrossRef] [Green Version]
  13. Giglio, L.; Kendall, J.D. Application of the Dozier retrieval to wildfire characterization—A sensitivity analysis. Remote Sens. Environ. 2001, 77, 34–49. [Google Scholar] [CrossRef]
  14. Wooster, M.J.; Zhang, Y.H. Boreal forest fires burn less intensely in Russia than in North America. Geophys. Res. Lett. 2004, 31. [Google Scholar] [CrossRef] [Green Version]
  15. Freeborn, P.H.; Cochrane, M.A.; Wooster, M.J. A Decade Long, Multi-Scale Map Comparison of Fire Regime Parameters Derived from Three Publicly Available Satellite-Based Fire Products: A Case Study in the Central African Republic. Remote Sens. 2014, 6, 4061–4089. [Google Scholar] [CrossRef] [Green Version]
  16. Roberts, G.; Wooster, M.J.; Xu, W.; Freeborn, P.H.; Morcrette, J.J.; Jones, L.; Benedetti, A.; Kaiser, J. LSA SAF Meteosat FRP Products: Part 2—Evaluation and demonstration of use in the Copernicus Atmosphere Monitoring Service (CAMS). Atmos. Chem. Phys. 2015, 15, 15909–15976. [Google Scholar] [CrossRef] [Green Version]
  17. Giglio, L.; Descloitres, J.; Justice, C.O.; Kaufman, Y.J. An enhanced contextual fire detection algorithm for MODIS. Remote Sens. Environ. 2003, 87, 273–282. [Google Scholar] [CrossRef]
  18. Giglio, L.; Schroeder, W.; Justice, C.O. The collection 6 MODIS active fire detection algorithm and fire products. Remote Sens. Environ. 2016, 178, 31–41. [Google Scholar] [CrossRef] [Green Version]
  19. Zhang, T.; Wooster, M.J.; Xu, W. Approaches for synergistically exploiting VIIRS I-and M-Band data in regional active fire detection and FRP assessment: A demonstration with respect to agricultural residue burning in Eastern China. Remote Sens. Environ. 2017, 198, 407–424. [Google Scholar] [CrossRef] [Green Version]
  20. Giglio, L. Characterization of the tropical diurnal fire cycle using VIRS and MODIS observations. Remote Sens. Environ. 2007, 108, 407–421. [Google Scholar] [CrossRef]
  21. Roberts, G.; Wooster, M.J.; Lagoudakis, E. Annual and diurnal African biomass burning temporal dynamics. Biogeosciences 2009, 6, 849–866. [Google Scholar] [CrossRef] [Green Version]
  22. Zhukov, B.; Lorenz, E.; Oertel, D.; Wooster, M.; Roberts, G. Spaceborne detection and characterization of fires during the bi-spectral infrared detection (BIRD) experimental small satellite mission (2001–2004). Remote Sens. Environ. 2006, 100, 29–51. [Google Scholar] [CrossRef]
  23. Skrbek, W.; Lorenz, E. November. HSRS: An infrared sensor for hot spot detection. In Infrared Spaceborne Remote Sensing VI; International Society for Optics and Photonics: Bellingham, WA, USA, 1998; Volume 3437, pp. 167–176. [Google Scholar]
  24. Freeborn, P.H.; Wooster, M.J.; Roberts, G. Addressing the spatiotemporal sampling design of MODIS to provide estimates of the fire radiative energy emitted from Africa. Remote Sens. Environ. 2011, 115, 475–489. [Google Scholar] [CrossRef]
  25. Sano, E.E.; Rosa, R.; Brito, J.L.; Ferreira, L.G. Land cover mapping of the tropical savanna region in Brazil. Environ. Monit. Assess. 2010, 166, 113–124. [Google Scholar] [CrossRef] [PubMed]
  26. Miranda, A.C.; Miranda, H.S.; Lloyd, J.; Grace, J.; Francey, R.J.; McIntyre, J.A.; Meir, P.; Riggan, P.; Lockwood, R.; Brass, J. Fluxes of carbon, water and energy over Brazilian cerrado: An analysis using eddy covariance and stable isotopes. Plant Cell Environ. 1997, 20, 315–328. [Google Scholar] [CrossRef]
  27. Mutch, R.W. Global Forest Fire Assessment 1990–2000; The Forest Resources Assessment Programme: Roma, Italy, 2001.
  28. NASA; UARC. MODIS Airborne Simulator. Available online: http://mas.arc.nasa.gov/ (accessed on 1 March 2007).
  29. Stroppiana, D.; Pinnock, S.; Gregoire, J.M. The Global Fire Product: Daily fire occurrence from April 1992 to December 1993 derived from NOAA AVHRR data. Int. J. Remote Sens. 2000, 21, 1279–1288. [Google Scholar] [CrossRef]
  30. Wooster, M.J.; Xu, W.; Nightingale, T. Sentinel-3 SLSTR active fire detection and FRP product: Pre-launch algorithm development and performance evaluation using MODIS and ASTER datasets. Remote Sens. Environ. 2012, 120, 236–254. [Google Scholar] [CrossRef]
  31. Riggan, P.J.; Tissell, R.G.; Lockwood, R.N. Remote Measurement of the 1992 Tapera Prescribed Fire at the Reserva Ecológica do IBGE; IBAMA: Brasilia, Brasil, 2010.
  32. Xu, W.; Wooster, M.J.; Roberts, G.; Freeborn, P. New GOES imager algorithms for cloud and active fire detection and fire radiative power assessment across North, South and Central America. Remote Sens. Environ. 2010, 114, 1876–1895. [Google Scholar] [CrossRef]
  33. Wooster, M.J.; Roberts, G.; Freeborn, P.H.; Xu, W.; Govaerts, Y.; Beeby, R.; He, J.; Lattanzio, A.; Fisher, D.; Mullen, R. LSA SAF Meteosat FRP products–Part 1: Algorithms, product contents, and analysis. Atmos. Chem. Phys. 2015, 15, 13217. [Google Scholar] [CrossRef] [Green Version]
  34. Fisher, D.; Wooster, M.J. Shortwave IR Adaption of the Mid-Infrared Radiance Method of Fire Radiative Power (FRP) Retrieval for Assessing Industrial Gas Flaring Output. Remote Sens. 2018, 10, 305. [Google Scholar] [CrossRef] [Green Version]
  35. Nishihama, M.; Wolfe, R.; Solomon, D.; Patt, F.; Blanchette, J.; Fleig, A.; Masuoka, E. MODIS level 1A Earth Location: Algorithm Theoretical Basis Document Version 3.0; SDST-092, MODIS Science Data Support Team; NASA: Washington, DC, USA, 1997.
  36. Pereira, M.G.; Malamud, B.D.; Trigo, R.M.; Alves, P.I.; Llasat, M.C. The history and characteristics of the 1980–2005 Portuguese rural fire database. Nat. Hazard. Earth Sys. Sci. 2011, 11, 3343–3358. [Google Scholar] [CrossRef]
  37. Schroeder, W.; Oliva, P.; Giglio, L.; Csiszar, I.A. The New VIIRS 375 m active fire detection data product: Algorithm description and initial assessment. Remote Sens. Environ. 2014, 143, 85–96. [Google Scholar] [CrossRef]
  38. Ichoku, C.; Giglio, L.; Wooster, M.J.; Remer, L.A. Global characterization of biomass-burning patterns using satellite measurements of fire radiative energy. Remote Sens. Environ. 2008, 112, 2950–2962. [Google Scholar] [CrossRef]
  39. Wooster, M.J.; Freeborn, P.H.; Archibald, S.; Oppenheimer, C.; Roberts, G.J.; Smith, T.E.L.; Govender, N.; Burton, M.; Palumbo, I. Field determination of biomass burning emission ratios and factors via open-path FTIR spectroscopy and fire radiative power assessment: Headfire, backfire and residual smouldering combustion in African savannahs. Atmos. Chem. Phys. 2011, 11, 11591–11615. [Google Scholar] [CrossRef] [Green Version]
Figure 1. Study region in the Brazilian cerrado. (a) The upper left inset shows the distribution of the cerrado landscape in pink, with black rectangle outlining the location of the main figure. The main figure shows a Google Earth image superimposed upon which is the coverage of the 11 September 1995 MODIS Airborne Simulator (MAS) data collection made from a high-altitude NASA ER-2 [2]. Six full flights around a square flight pattern were conducted over five hours, shown by the four-sided flightline black box. The northernmost flight leg, which contained the vast majority of fires and provided the dataset used herein, is depicted by the upper box side bolded. (b) MAS true colour composite derived from one overflight of a subset of the northern flight leg as indicated by the bold box side in (a), with a swath width of 37 km from the 20 km flying height. Evidence of multiple burn scars (darker brown) left by fires is clear.
Fire 03 00011 g001
Figure 2. Linear best fit relationships between ‘excess above background’ SWIR (2.1 µm) and MIR (3.9 µm) spectral radiances recorded at active fire pixels in (a) real data extracted from the 50 m spatial resolution MODIS Airborne Simulator (MAS) imagery of cerrado fires burning in the northernmost MAS flight leg highlighted in Figure 1a, and (b) simulated observations of active fires made using the multiple thermal component model [3]. Whilst (a) contains some saturated observations when 3.9 µm radiances become higher, (b) is unaffected by this and provides a very similar linear best fit relation.
Fire 03 00011 g002
Figure 3. MODIS Airborne Simulator (MAS) imagery of cerrado fires burning in the northernmost MAS flight leg (bold box side highlighted in Figure 1a). Shown is a subset of data from that shown in Figure 1b, here depicted in the MAS low-gain middle infrared (MIR; 3.9 μm) channel that has a spectral response very similar to that of the MODIS Band 21 ‘active fire’ 3.9 μm channel. (a) The original MAS data with 50 m pixels, along with a legend displaying the spectral radiance scale. Bright pixels indicate those containing actively burning fires, albeit in generally filling only a small fraction of the 2500 m2 pixel area. Using appropriately sized averaging kernels as outlined in the main text, the original 50 m MAS data were spatially degraded to four pixel sizes: (b) 100 m, (c) 200 m, (d) 500 m and (e) 1000 m. For clarity, in (d,e), the two coarsest spatial resolution datasets, the thick black lines outline the active fire pixels detected.
Fire 03 00011 g003
Figure 4. Comparison between 11 September 1995 Brazilian cerrado active fire information obtained with the original 50 m spatial resolution MAS data (right-hand y-axis: solid line showing absolute total fire count [note ×10 scaling] and dashed line showing total FRP), and the same data spatially degraded to 1 km (left-hand y-axis: proportions of FRP detected shown as blue vertical bars, proportion of active fires detected shown as vertical grey bars). The MAS data are from the northernmost Brazilian cerrado flight leg highlighted in Figure 1, a subset of which is shown in Figure 3 at each pixel size examined. The 11 September 1995 flightline was flown six times between 11:50 and 15:45 local time (at intervals ranging from 45 to 50 minutes). Many fires detectable at 50 m fail to be detected when using the coarser 1 km data, but the fires that are detected are responsible for much of the FRP released.
Fire 03 00011 g004
Figure 5. Total FRP measured in the northernmost MAS flight leg highlighted in Figure 1a, calculated at the six different MAS overflight times (11:50, 12:40, 13:25, 14:10, 15:00, 15:45 local time) and using both the original 50 m spatial resolution data and the four spatially degraded versions (100 m, 200 m, 500 m, 1 km; see examples in Figure 3). Uncertainty estimates in FRP (vertical error bars) are shown only for the original 50 m MAS data for clarity.
Fire 03 00011 g005
Figure 6. Frequency densities of the summed MAS-detected Fire Radiative Power [f(ΣFRP)] observations in the northernmost MAS flightline (Figure 1) flown in Sept 1995, shown as a function of FRP, for both the original 50 m spatial resolution MAS data (yellow filled circles) and that spatially degraded to 1 km (blue filled diamonds); see also Figure 3. The f(ΣFRP) derived from real spaceborne AQUA MODIS (MYD14) data of the same area and time of year (in 2002) are noted as ‘real’ 1 km MODIS Data in the chart (non-filled red squares). The best-fit power-law fit to f(ΣFRP) as a function of ΣFRP is also given for the 50 m spatial resolution MAS dataset (dashed line and equation).
Fire 03 00011 g006

