Multiple-Scale Relationships between Vegetation, the Wildland–Urban Interface, and Structure Loss to Wildfire in California


Abstract
:1. Introduction
- (1)
- Is vegetation cover substantially greater at locations of destroyed structures than unburned structures? Does this effect vary by region or distance?
- (2)
- What is the relative importance of vegetation calculated at local and landscape scales in relation to other factors previously associated with structure loss?
- (3)
- Does structure loss vary across different classes of the wildland–urban interface?
- (4)
- Do these relationships vary by geographical region within California?
2. Materials and Methods
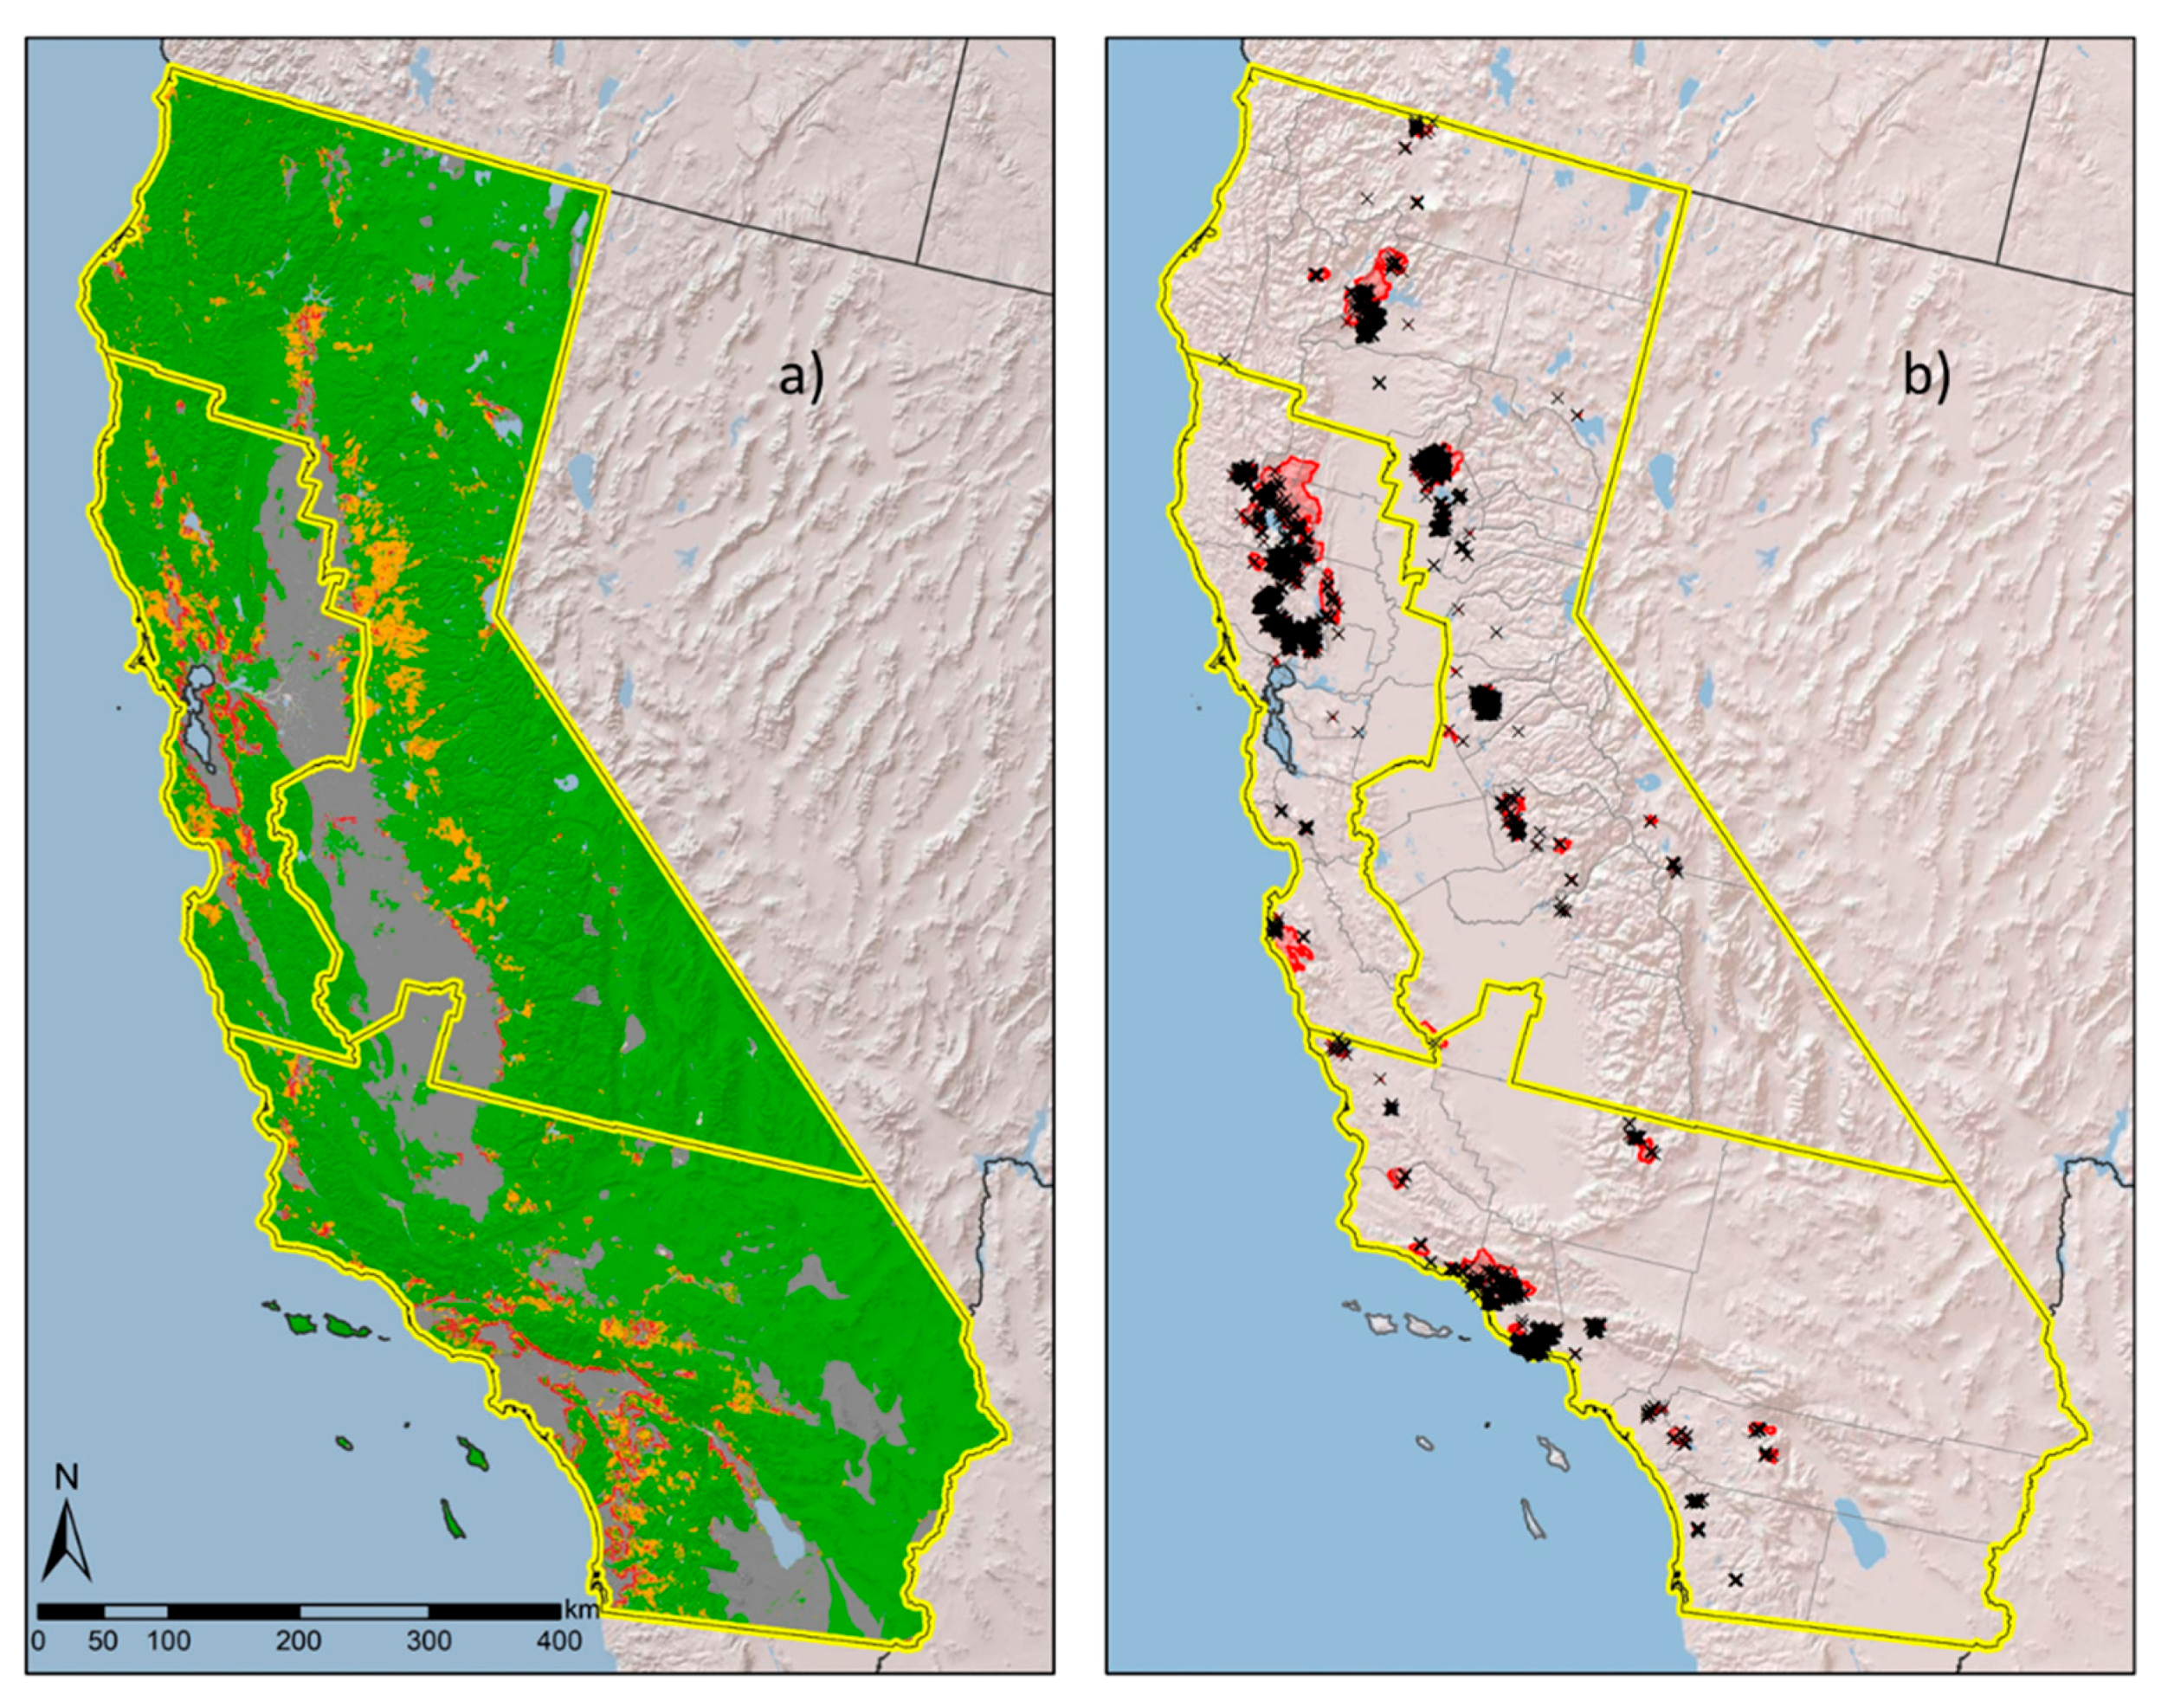
2.1. Structure Locations and Study Regions
2.2. Variables

| Variable Name | Definition | Source | Resolution | |
|---|---|---|---|---|
| Climate | Actual evapotranspiration (AET) | Average AET (Water available between wilting point and field capacity; mm), 1981–2020 | Flint and Flint [31] | 270 m |
| MaxTemp | Average Maximum Monthly Temperature (deg. C), Annual, 1981–2010 | Flint and Flint [31] | 270 m | |
| Topography | Elevation | Elevation (m) | U.S. Geological Survey | 30 m |
| Topographic heterogeneity | The range in elevation values from a center cell and the three-cell radius immediately surrounding it using a digital elevation model. Values were converted to a 0–1 scale using the standard deviation. | NatureServe (https://databasin.org) | 90 m | |
| Human | Dist_powerline | Euclidean distance from electric transmission lines (status = operational AND type = OH; m) | California Energy Commission | 30 m |
| Dist_rd | Euclidean distance from roads (excluding 4WD and OHV; m) | TIGER/Line 2016 (www.census.gov) | 30 m | |
| Vegetation | ||||
| NDVI_30 | Mean NDVI max averaged for 1 and 2 years before fire across 30 m buffer around structure | Climate Engine (http://climateengine.org/) | 30 m | |
| NDVI_90 | Mean NDVI max averaged for 1 and 2 years before fire across 90 m buffer around structure | Climate Engine (http://climateengine.org/) | 30 m | |
| NDVI_300 | Mean NDVI max averaged for 1 and 2 years before fire across 300 m buffer around structure | Climate Engine (http://climateengine.org/) | 30 m | |
| Flammable veg in 2.5 km | Proportion highly flammable vegetation (grass, trees, and shrubs) across circular moving window with 2.5 km radius | NLCD 2016 Land Cover www.mrlc.gov | 30 m | |
| Vegetation and human | WUI Class | Intermix, Interface, Unvegetated; Low-density vegetated | Radeloff et al. [23] | Polygon converted to 30 m grid |
2.3. Analysis
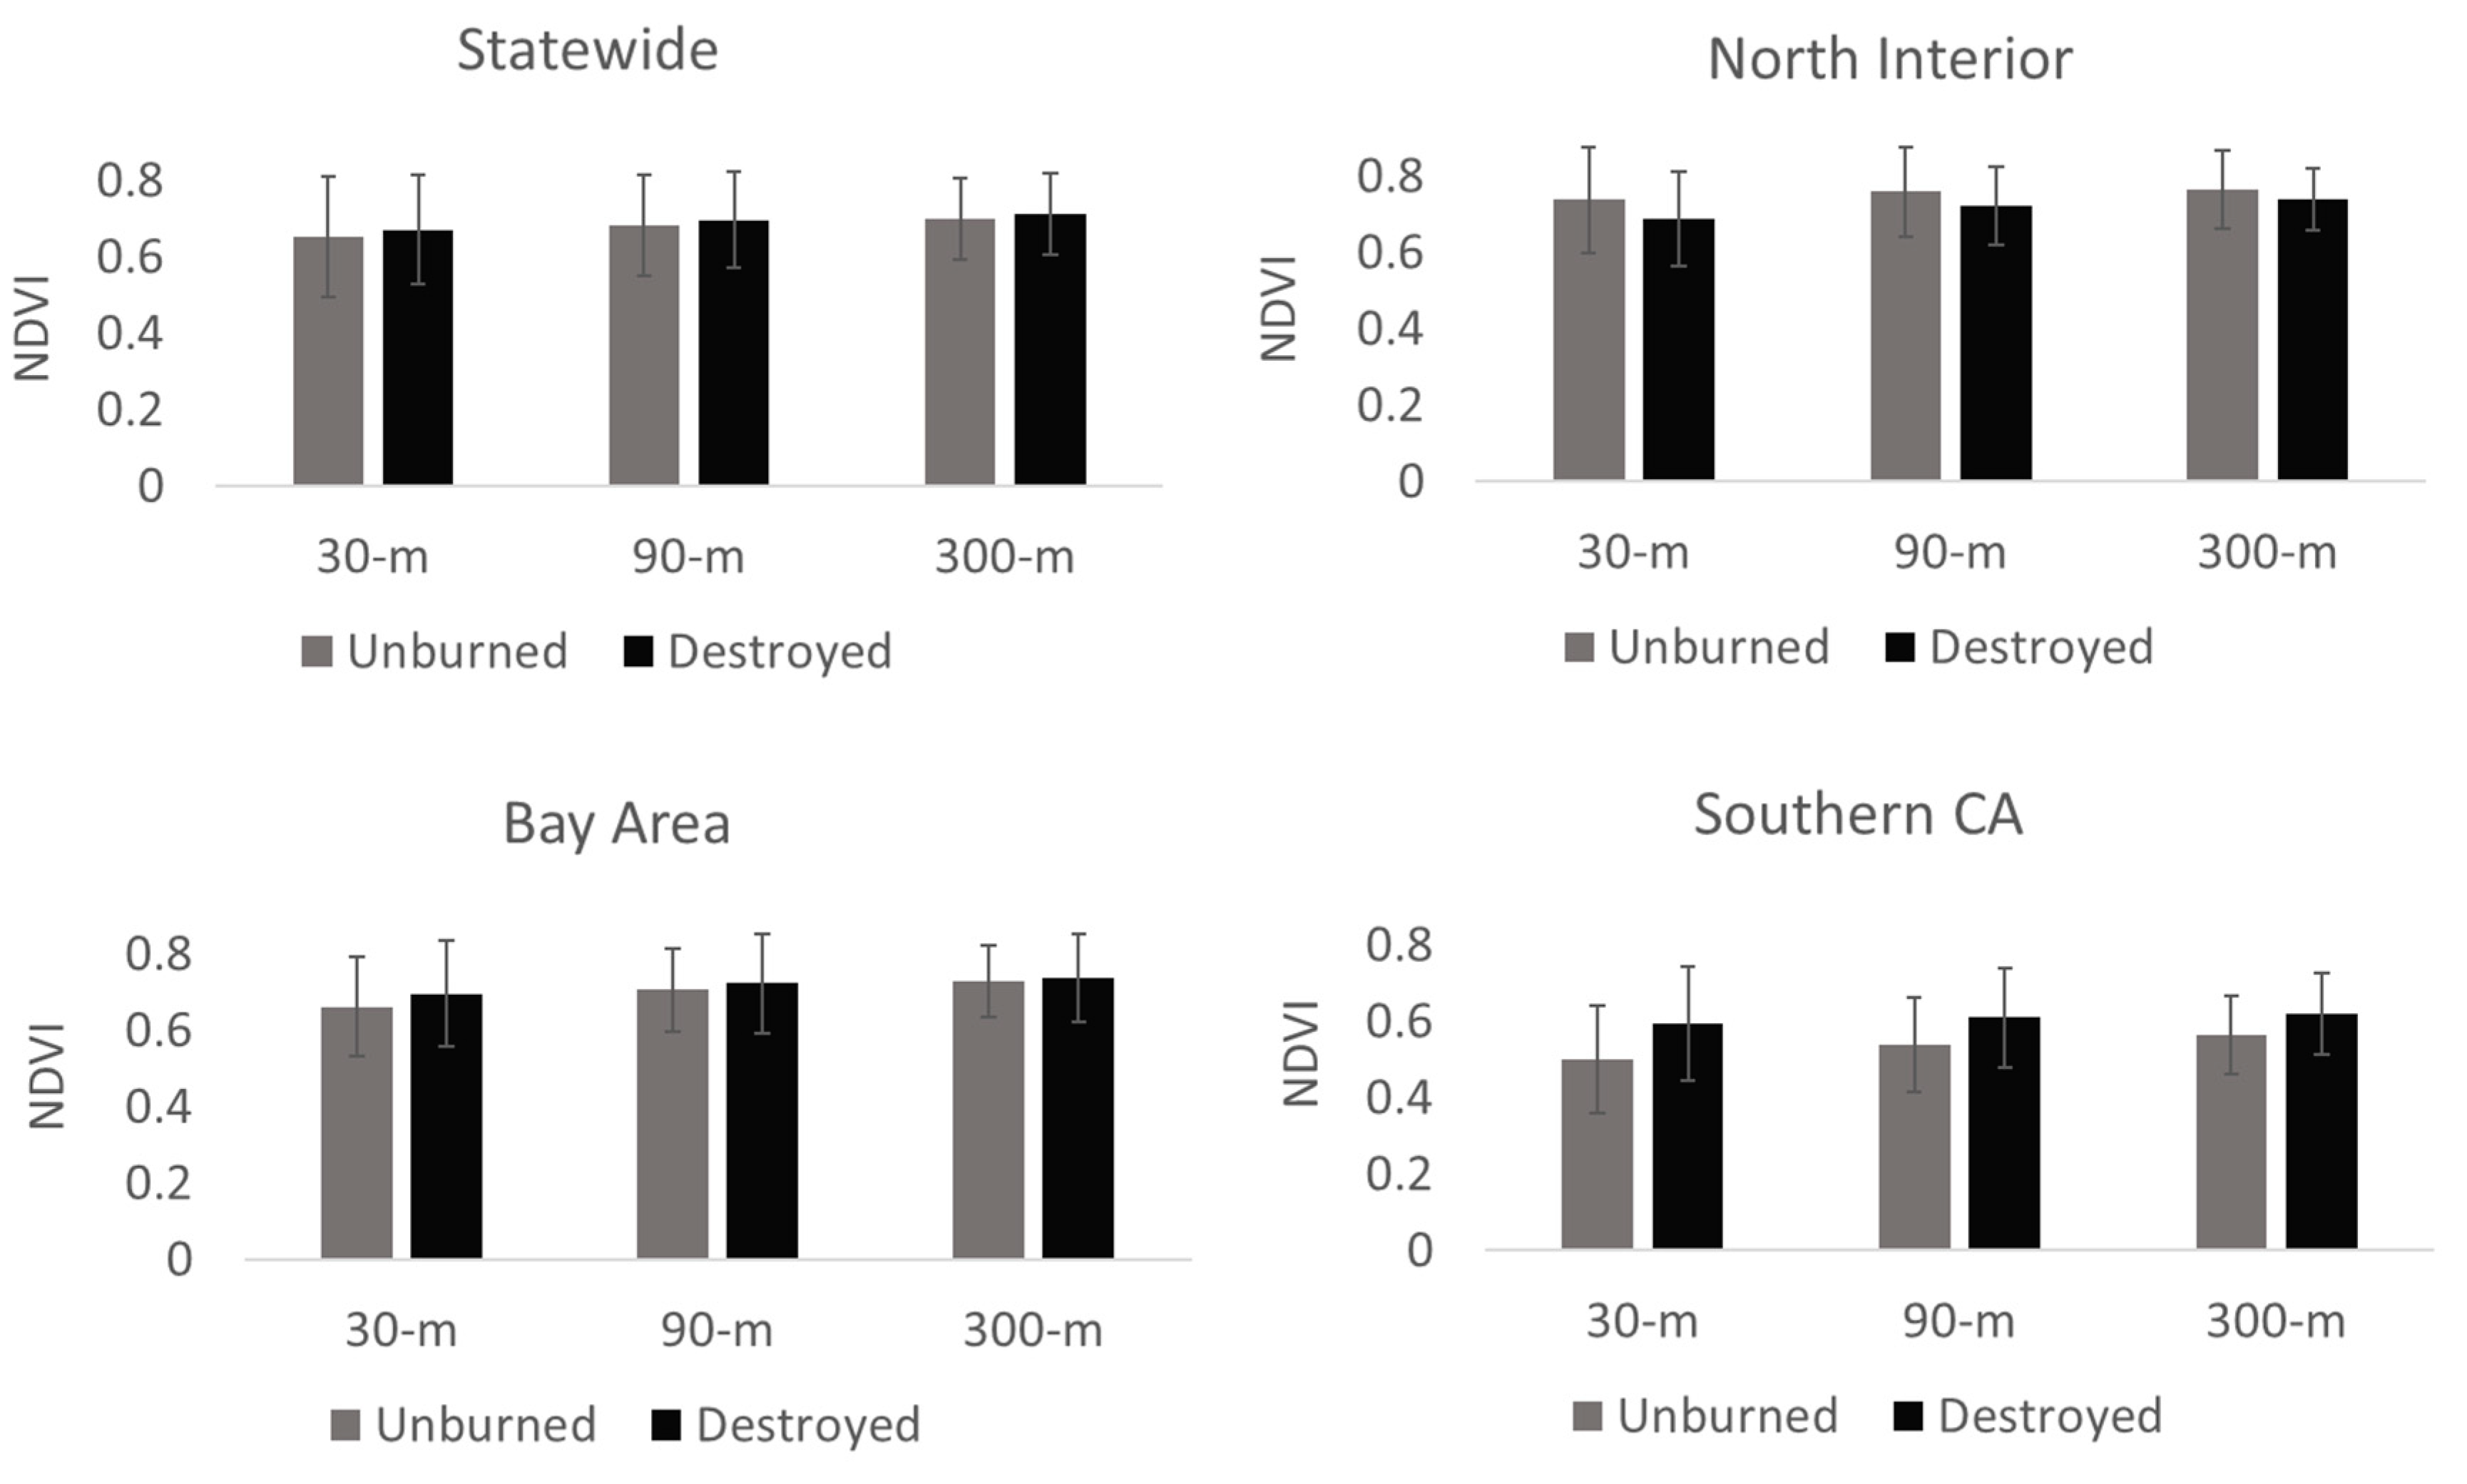
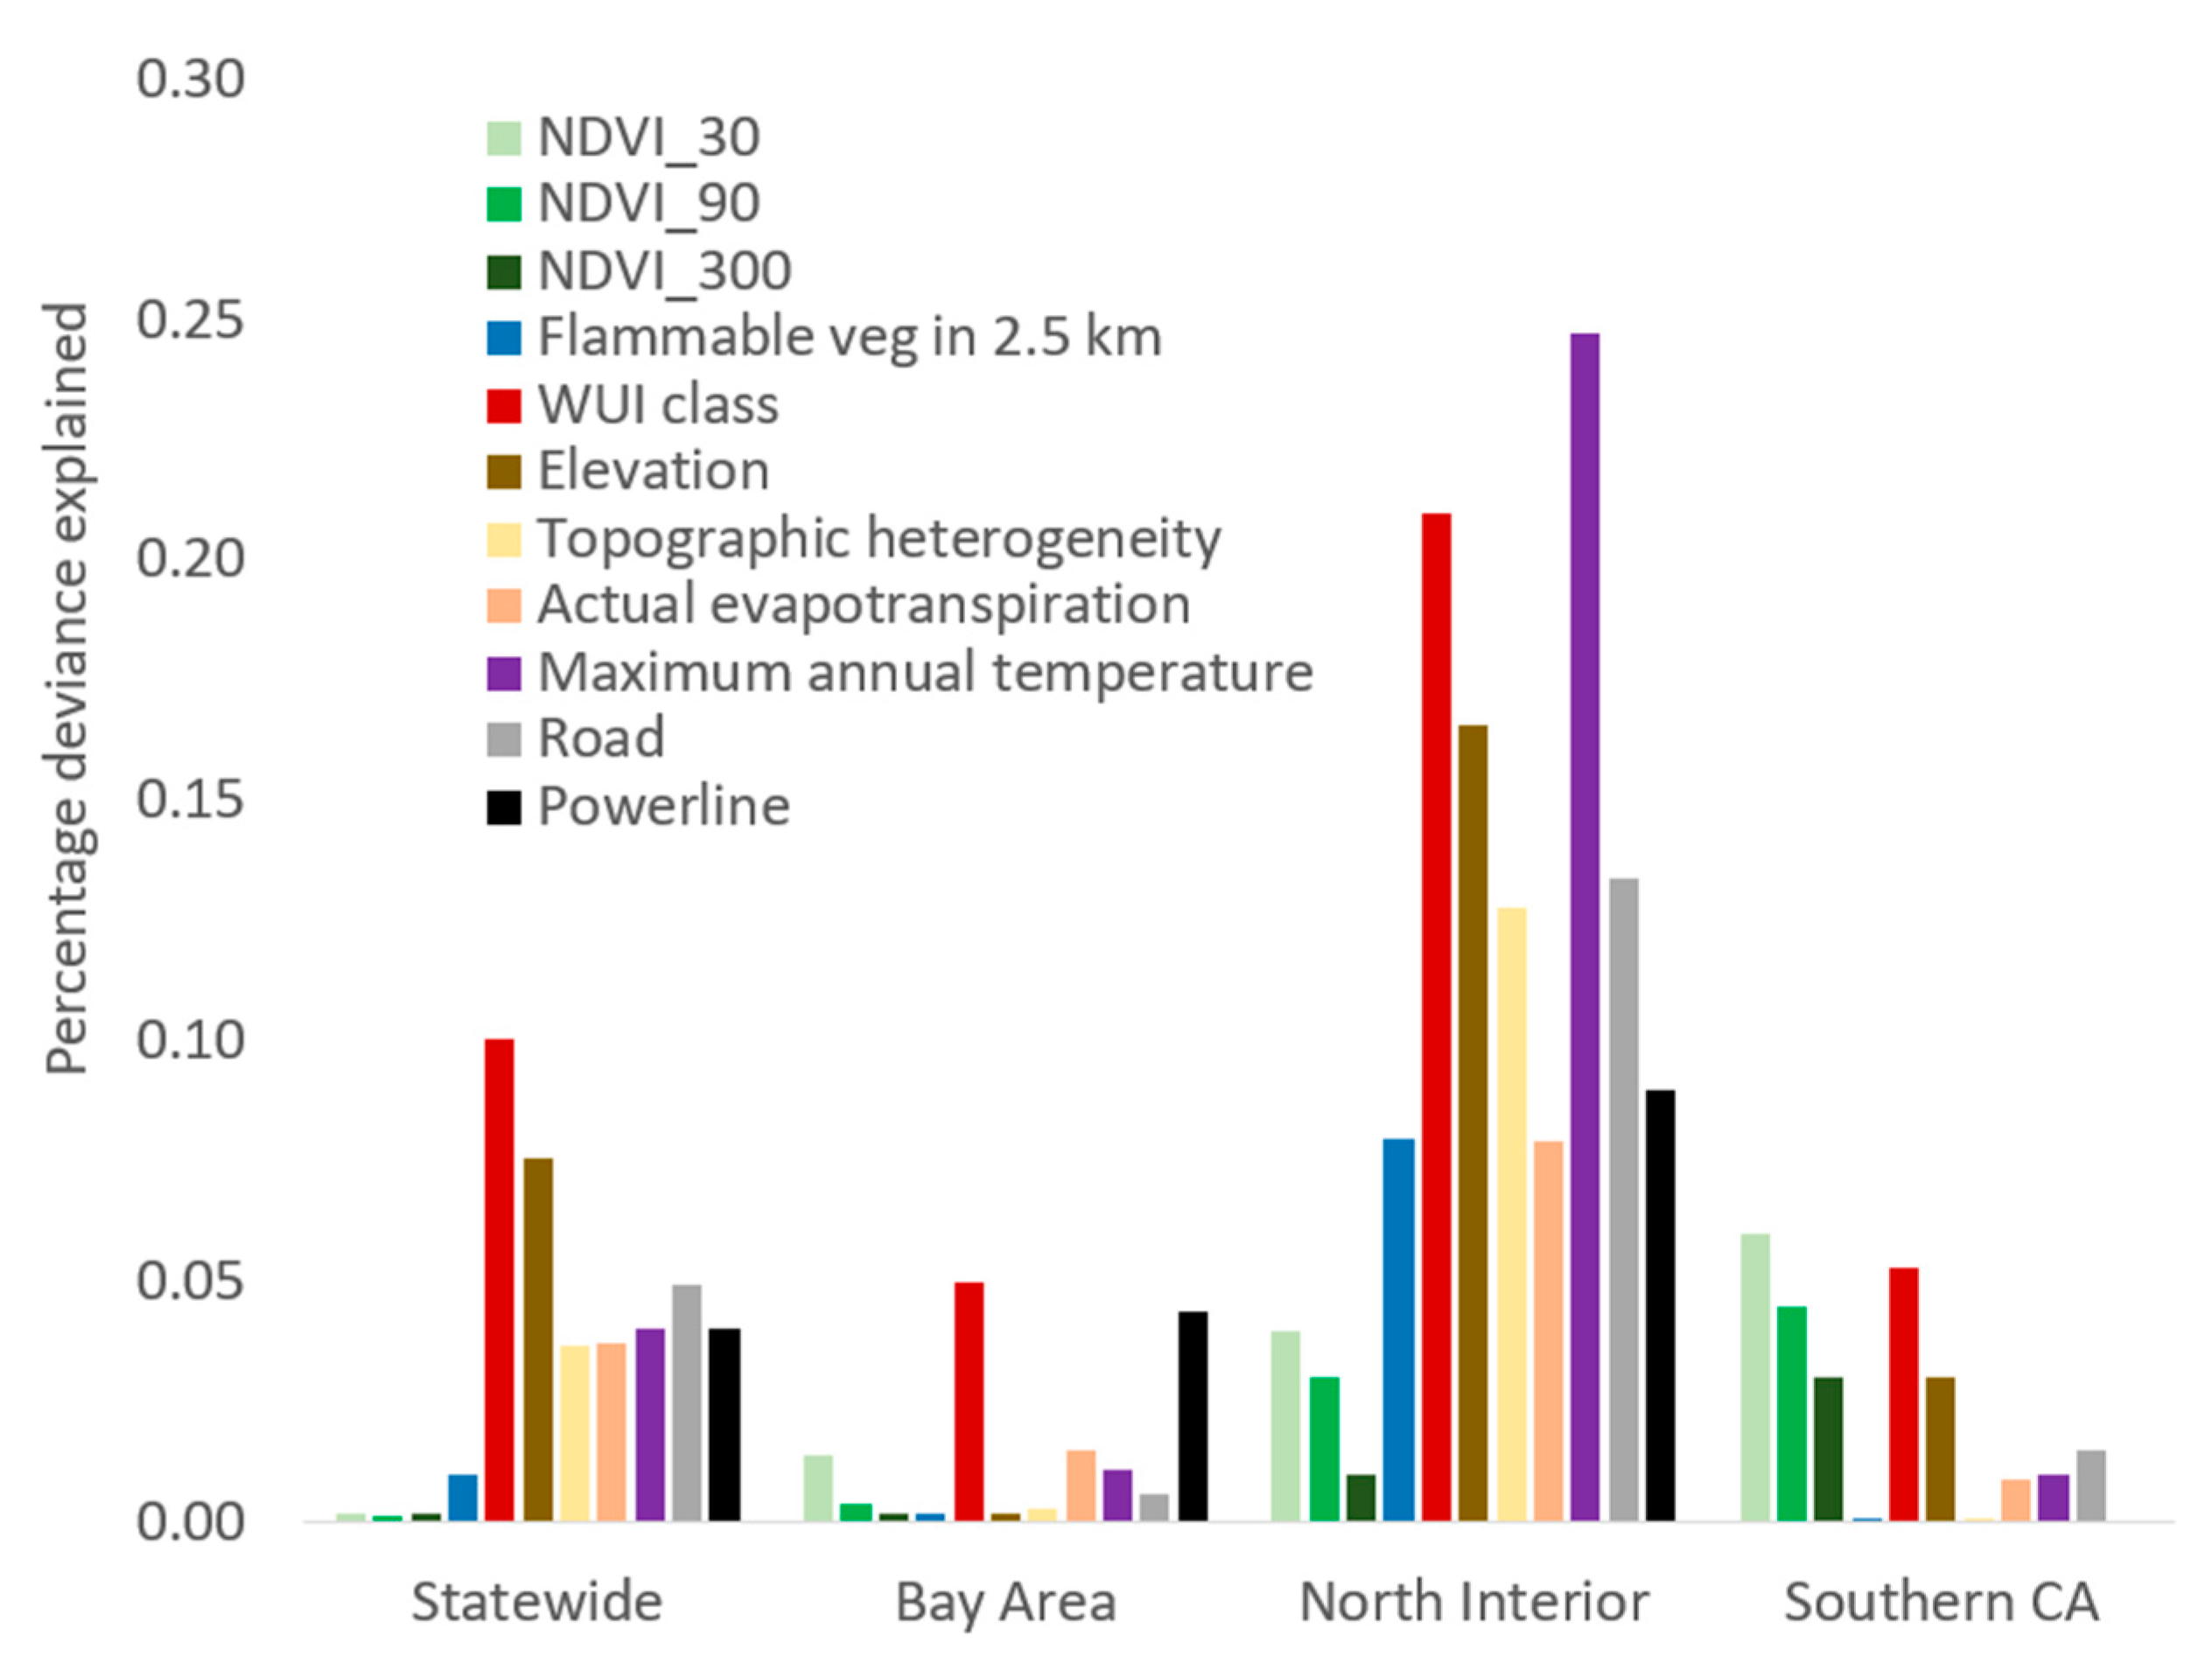
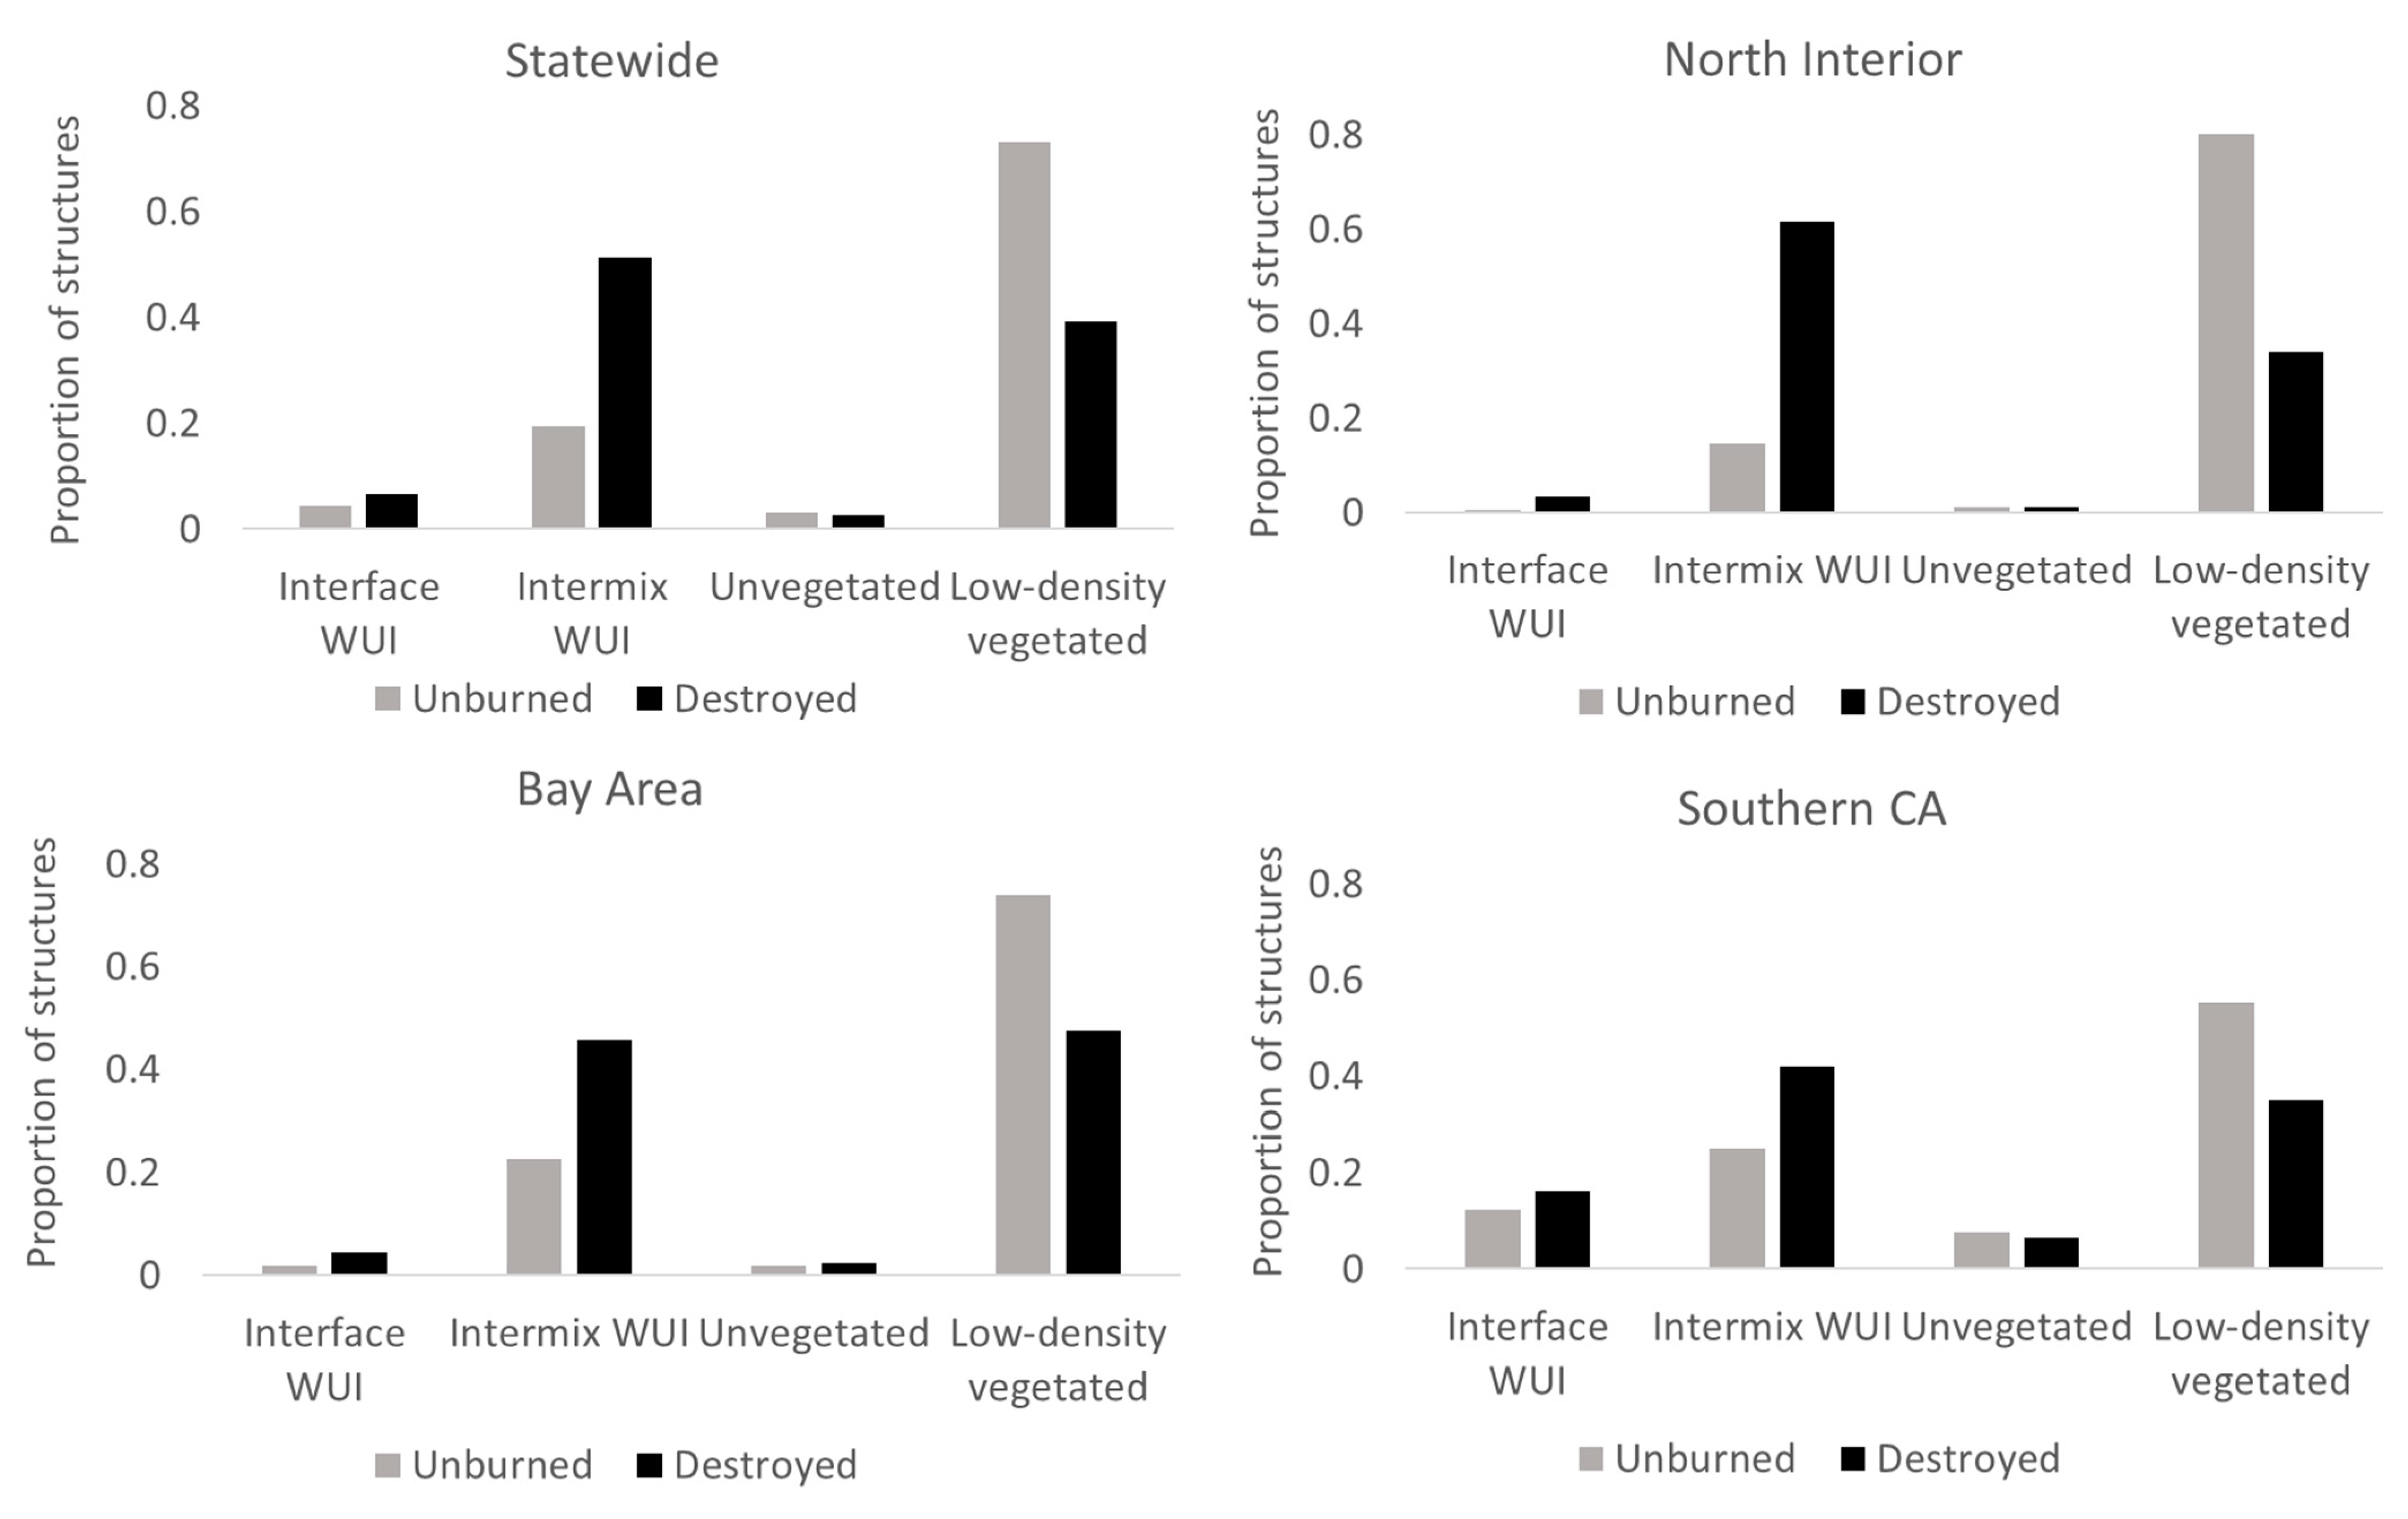
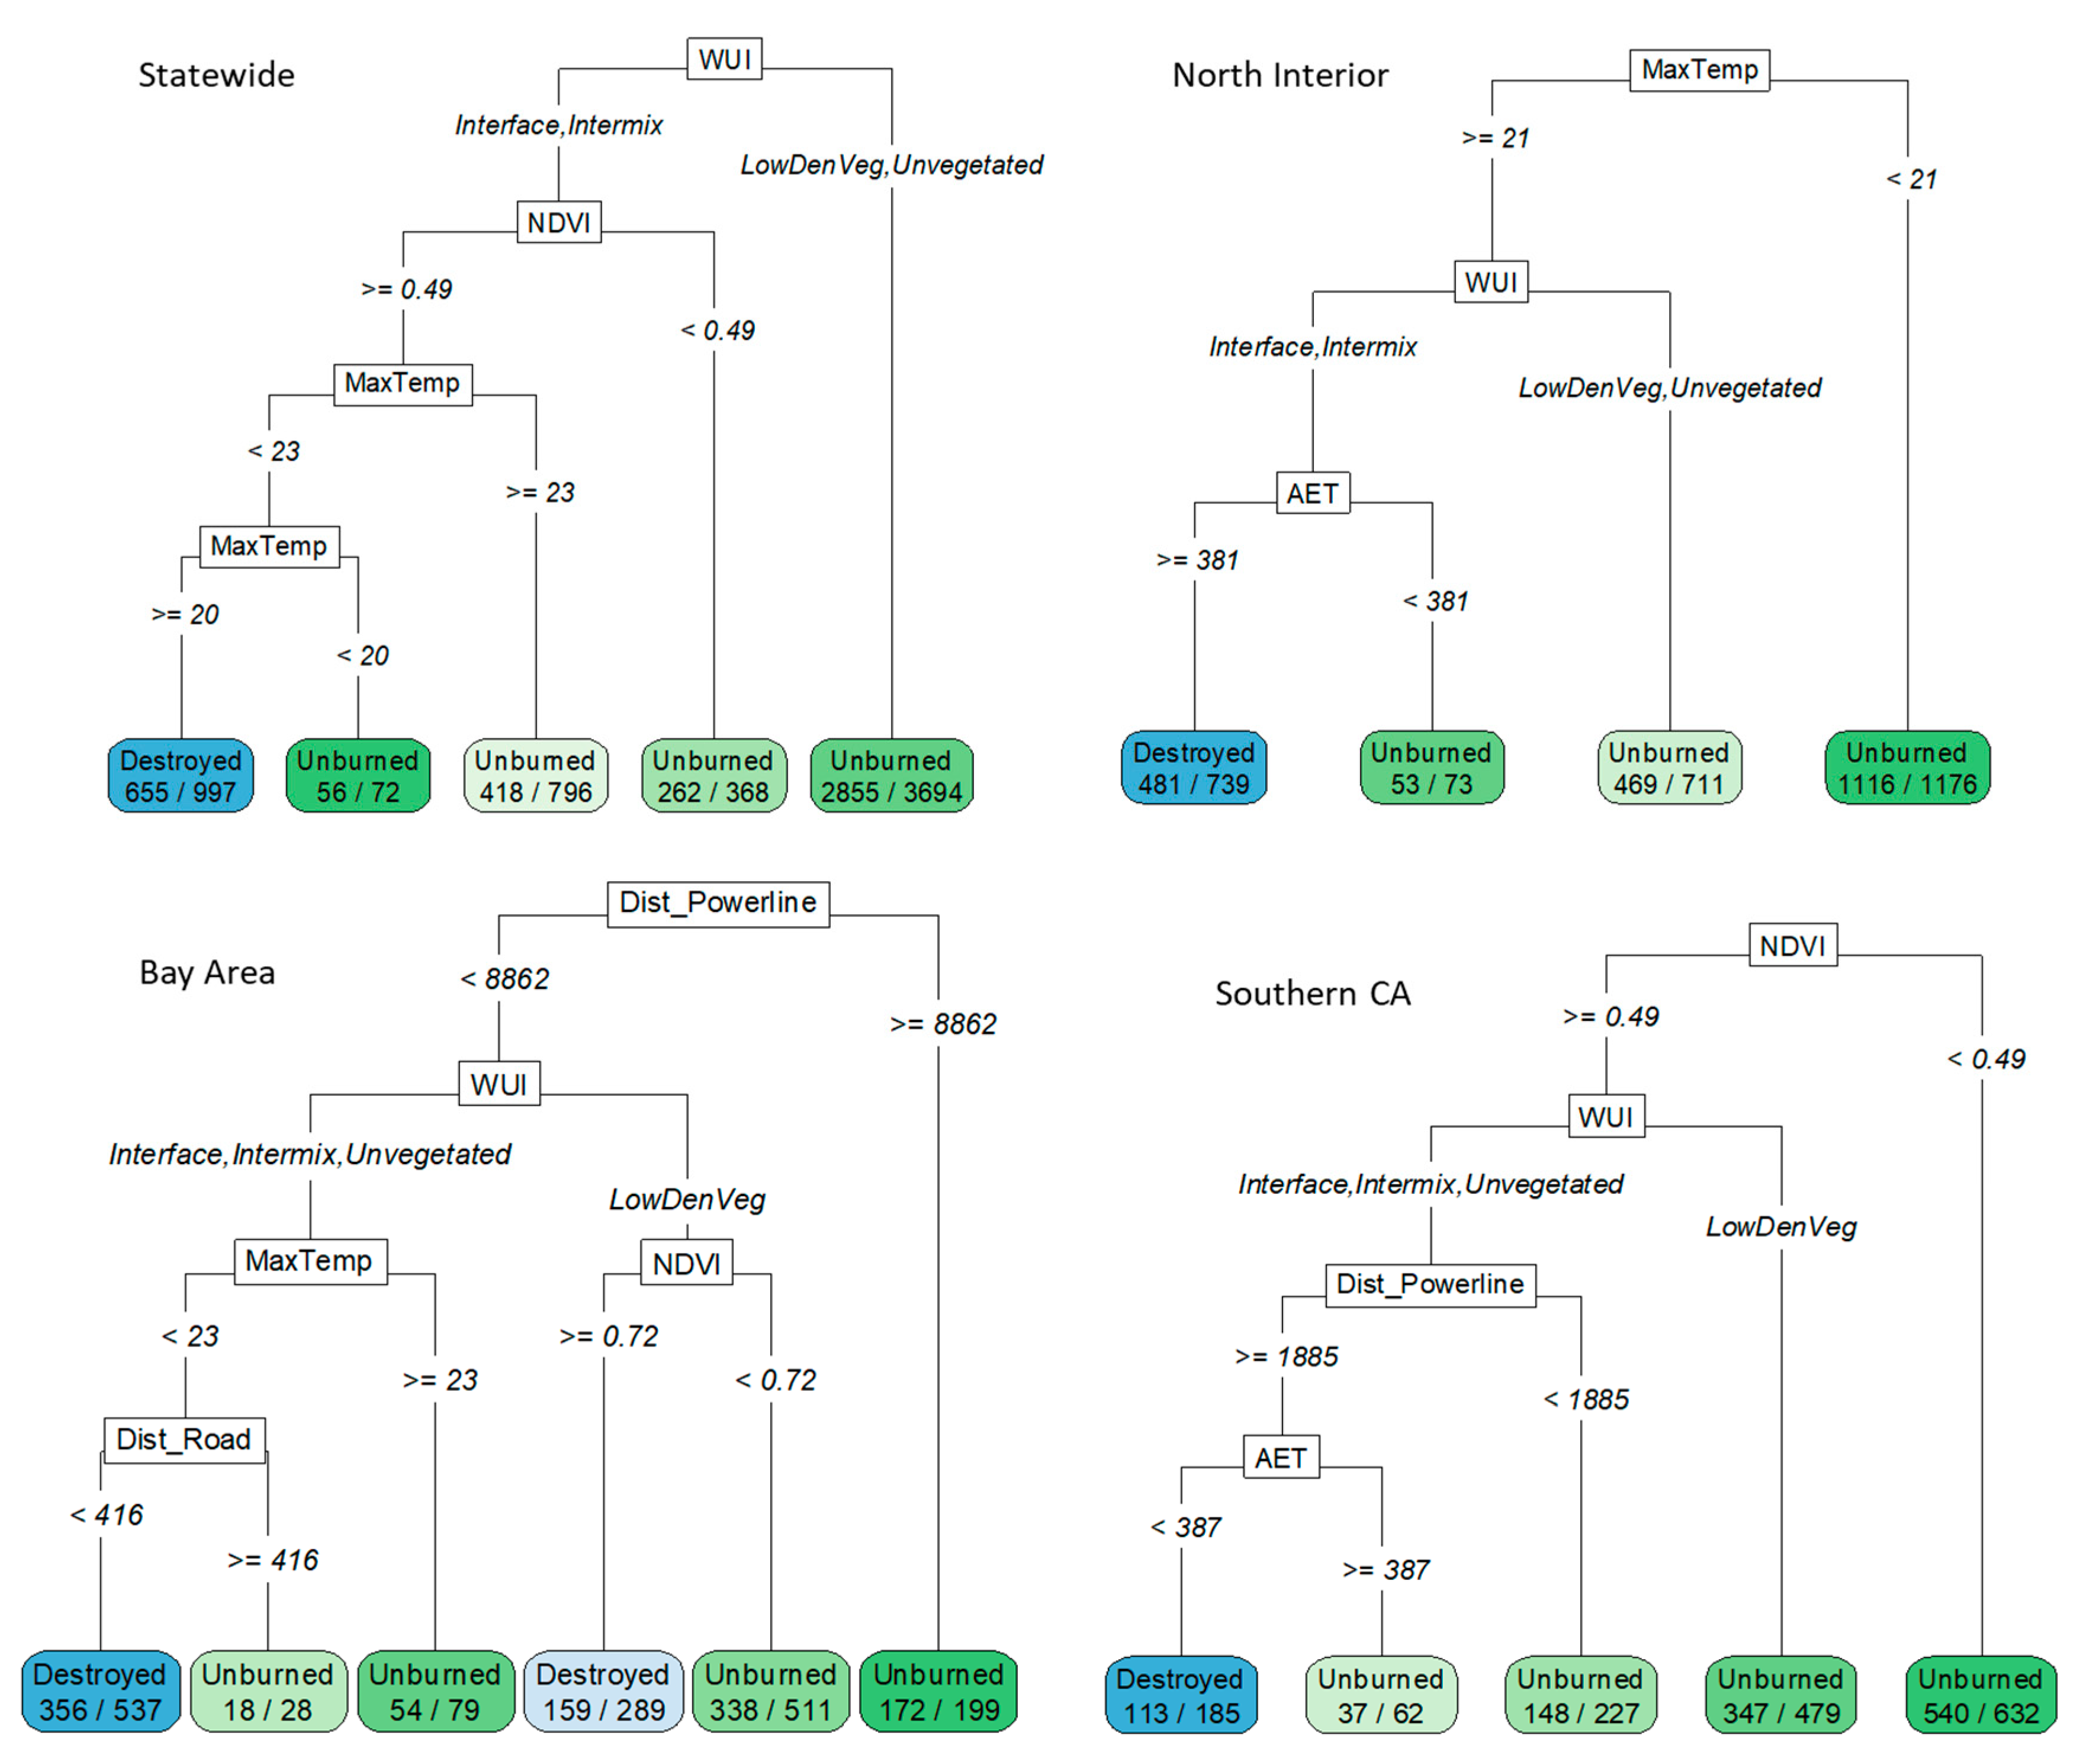
3. Results
4. Discussion
5. Conclusions
Author Contributions
Funding
Data Availability Statement
Acknowledgments
Conflicts of Interest
References
- Haynes, H.J.G. Fire Loss in the United States during 2014; National Fire Protection Association, Fire Analysis and Research Division: Quincy, MA, USA, 2015. [Google Scholar]
- Blanchi, R.; Lucas, C.; Leonard, J.; Finkele, K. Meteorological conditions and wildfire-related house loss in Australia. Int. J. Wildl. Fire 2010, 19, 914–926. [Google Scholar] [CrossRef] [Green Version]
- Molina-Terrén, D.M.; Xanthopoulos, G.; Diakakis, M.; Ribeiro, L.; Caballero, D.; Delogu, G.M.; Viegas, D.X.; Silva, C.A.; Cardil, A. Analysis of forest fire fatalities in Southern Europe: Spain, Portugal, Greece and Sardinia (Italy). Int. J. Wildl. Fire 2019, 28, 85–98. [Google Scholar] [CrossRef] [Green Version]
- Syphard, A.D.; Rustigian-Romsos, H.; Mann, M.; Conlisk, E.; Moritz, M.A.; Ackerly, D. The relative influence of climate and housing development on current and projected future fire patterns and structure loss across three California landscapes. Glob. Environ. Chang. 2019, 56, 41–55. [Google Scholar] [CrossRef]
- Syphard, A.D.; Keeley, J.E. Why are so many structures burning in California. Fremontia 2020, 47, 28–35. [Google Scholar]
- Alexandre, P.M.; Stewart, S.I.; Mockrin, M.H.; Keuler, N.S.; Syphard, A.D.; Bar-Massada, A.; Clayton, M.K.; Radeloff, V.C. The relative impacts of vegetation, topography and spatial arrangement on building loss to wildfires in case studies of California and Colorado. Landsc. Ecol. 2015, 31, 415–430. [Google Scholar] [CrossRef]
- Foote, E.I.D.; Martin, R.E.; Gilless, J.K. The defensible space factor study: A survey instrument for post-fire structure loss analysis. In Proceedings of the 11th Conference on Fire and Forest Meteorology, Missoula, MT, USA, 16–19 April 1991; Andrews, P.L., Potts, D.F., Eds.; Society of American Foresters: Bethesda, MD, USA, 1991. [Google Scholar]
- Cohen, J.D. Home ignitability in the wildland-urban interface. J. For. 2000, 98, 15–21. [Google Scholar]
- Cohen, J. Relating flame radiation to home ignition using modeling and experimental crown fires. Can. J. For. Res. 2004, 34, 1616–1626. [Google Scholar] [CrossRef]
- Maranghides, A.; Mell, W. A Case Study of a Community Affected by the Witch and Guejito Fires; National Institute of Standards and Technology: Gaithersburg, MD, USA, 2009.
- Braziunas, K.H.; Seidl, R.; Rammer, W.; Turner, M.G. Can we manage a future with more fire? Effectiveness of defensible space treatment depends on housing amount and configuration. Landsc. Ecol. 2021, 36, 309–330. [Google Scholar] [CrossRef]
- Syphard, A.D.; Brennan, T.J.; Keeley, J.E. The role of defensible space for residential structure protection during wildfires. Int. J. Wildl. Fire 2014, 23, 1165–1175. [Google Scholar] [CrossRef]
- Miner, A. Defensible Space Optimization for Preventing Wildfire Structue Loss in the Santa Monica Mountains; Johns Hopkins University: Baltimore, MD, USA, 2014. [Google Scholar]
- Platt, R.V. Wildfire hazard in the home ignition zone: An object-oriented analysis integrating LiDAR and VHR satellite imagery. Appl. Geogr. 2014, 51, 108–117. [Google Scholar] [CrossRef]
- Penman, S.H.; Price, O.F.; Penman, T.D.; Bradstock, R.A. The role of defensible space on the likelihood of house impact from wildfires in forested landscapes of south eastern Australia. Int. J. Wildl. Fire 2018, 28, 4–14. [Google Scholar] [CrossRef]
- Gibbons, P.; van Bommel, L.; Gill, A.; Cary, G.J.; Driscoll, D.A.; Bradstock, R.A.; Knight, E.; Moritz, M.A.; Stephens, S.L.; Lindenmayer, D.B. Land management practices associated with house loss in wildfires. PLoS ONE 2012, 7, e29212. [Google Scholar] [CrossRef]
- Gibbons, P.; Gill, A.M.; Shore, N.; Moritz, M.A.; Dovers, S.; Cary, G.J. Options for reducing house-losses during wildfires without clearing trees and shrubs. Landsc. Urban Plan. 2018, 174, 10–17. [Google Scholar] [CrossRef]
- Syphard, A.D.; Keeley, J.E. Factors associated with structure loss in the 2013–2018 California wildfires. Fire 2019, 2, 49. [Google Scholar] [CrossRef] [Green Version]
- Alexandre, P.M.; Stewart, S.I.; Keuler, N.S.; Clayton, M.K.; Mockrin, M.H.; Bar-Massada, A.; Syphard, A.D.; Radeloff, V.C. Factors related to building loss due to wildfires in the conterminous United States. Ecol. Appl. 2016, 26, 2323–2338. [Google Scholar] [CrossRef] [PubMed]
- Schumann, R.L.; Mockrin, M.; Syphard, A.D.; Whittaker, J.; Price, O.; Johnson, C.; Emrich, C.T.; Butsic, V. Wildfire recovery as a “hot moment ” for creating fire-adapted communities. Int. J. Disaster Risk Reduct. 2019, 42, 101354. [Google Scholar] [CrossRef]
- Blanchi, R.; Leonard, J.E. Investigation of Bushfire Attack Mechanisms Involved in House Loss in the ACT Bushfire 2003. Bushfire CRC Report CMIT-2005-377. Available online: https://www.bushfirecrc.com/sites/default/files/downloads/act_bushfire_crc_report.pdf (accessed on 11 March 2021).
- Radeloff, V.C.; Hammer, R.B.; Stewart, S.I.; Fried, J.S.; Holcomb, S.S.; McKeefry, J.F. The wildland-urban interface in the United States. Ecol. Appl. 2005, 15, 799–805. [Google Scholar] [CrossRef] [Green Version]
- Radeloff, V.C.; Helmers, D.P.; Anu Kramer, H.; Mockrin, M.H.; Alexandre, P.M.; Bar-Massada, A.; Butsic, V.; Hawbaker, T.J.; Martinuzzi, S.; Syphard, A.D.; et al. Rapid growth of the US wildland-urban interface raises wildfire risk. Proc. Natl. Acad. Sci. USA 2018, 115, 3314–3319. [Google Scholar] [CrossRef] [PubMed] [Green Version]
- Kramer, H.A.; Mockrin, M.H.; Alexandre, P.M.; Stewart, S.I.; Radeloff, V.C. Where wildfires destroy buildings in the US relative to the wildland–urban interface and national fire outreach programs. Int. J. Wildl. fire 2018, 27, 329–341. [Google Scholar] [CrossRef] [Green Version]
- Kramer, H.A.; Mockrin, M.H.; Alexandre, P.M.; Radeloff, V.C. High wildfire damage in interface communities in California. Int. J. Wildl. Fire 2019, 28, 641. [Google Scholar] [CrossRef] [Green Version]
- Bar-Massada, A.; Radeloff, V.C.; Stewart, S.I. Biotic and abiotic effects of human settlements in the wildland-urban interface. Bioscience 2014, 64, 429–437. [Google Scholar] [CrossRef]
- Miranda, A.; Carrasco, J.; González, M.; Pais, C.; Lara, A.; Altamirano, A.; Weintraub, A.; Syphard, A.D. Evidence-based mapping of the wildland-urban interface to better identify human communities threatened by wildfires. Environ. Res. Lett. 2020, 15. [Google Scholar] [CrossRef]
- Schmidt, J. The Butte Fire: A Case Study in Using LIDAR Measures of Pre-Fire Vegetation to Estimate Structure Loss Rates. Munich Pers. RePEc Arch. 2020. Available online: https://mpra.ub.uni-muenchen.de/99699/ (accessed on 11 March 2021).
- Gray, M.E.; Dickson, B.G.; Zachmann, L.J. Modelling and mapping dynamic variability in large fire probability in the lower Sonoran Desert of south-western Arizona. Int. J. Wildl. Fire 2014, 23, 1108–1118. [Google Scholar] [CrossRef] [Green Version]
- McGarigal, K.; Marks, B.J. FRAGSTATS: Spatial Pattern Analysis Program for Quantifying Landscape Structure. 1995. Available online: http://www.umass.edu/landeco/research/fragstats/documents/Metrics/Metrics%20TOC.htm (accessed on 11 March 2021).
- Flint, A.L.; Flint, L.E. Downscaling future climate scenarios to fine scales for hydrologic and ecologic modeling and analysis. Ecol. Process. 2012, 1, 2. [Google Scholar] [CrossRef] [Green Version]
- Mann, M.; Batllori, E.; Moritz, M.; Waller, E.; Berck, P.; Flint, A.; Flint, L.; Dolfi, E. Incorporating anthropogenic influences into fire probability models: Effects of human activity and climate change on fire activity in California. PLoS ONE 2016, 11, e0153589. [Google Scholar] [CrossRef] [Green Version]
- Krawchuk, M.A.; Moritz, M.A.; Parisien, M.-A.; Van Dorn, J.; Hayhoe, K. Global Pyrogeography: The Current and Future Distribution of Wildfire. PLoS ONE 2009, 4, e5102. [Google Scholar] [CrossRef]
- Parisien, M.A.; Moritz, M.A. Environmental controls on the distribution of wildfire at multiple spatial scales. Ecol. Monogr. 2009, 79, 127–154. [Google Scholar] [CrossRef]
- Venables, W.M.; Ripley, B.D. Modern Applied Statistics with S-Plus; Springer: New York, NY, USA, 1994. [Google Scholar]
- Sheskin, D.J. Handbook of Parametric and Nonparametric Statistical Procedures; CRC Press: Boca Raton, FL, USA, 2003; ISBN 1420036262. [Google Scholar]
- Breiman, L.; Friedman, J.; Olshen, R.; Stone, C. Classification and Regression Trees; Wadsworth: Belmont, CA, USA, 1984. [Google Scholar]
- Hanley, J.A.; McNeil, B.J. The meaning and use of the area under a receiver operating characteristics curve. Radiology 1982, 143, 29–36. [Google Scholar] [CrossRef] [Green Version]
- Theobald, D.M.; Romme, W.H. Expansion of the US wildland-urban interface. Landsc. Urban Plan. 2007, 83, 340–354. [Google Scholar] [CrossRef]
- Stewart, S.I.; Radeloff, V.C.; Hammer, R.B.; Hawbaker, T.J. Defining the Wildland—Urban Interface. J. For. 2007, 105, 201–207. [Google Scholar]
- Sirca, C.; Casula, F.; Bouillon, C.; García, B.F.; Ramiro, M.M.F.; Molina, B.V.; Spano, D. A wildfire risk oriented GIS tool for mapping Rural-Urban Interfaces. Environ. Model. Softw. 2017, 94, 36–47. [Google Scholar] [CrossRef]
- Alcasena, F.J.; Evers, C.R.; Vega-Garcia, C. The wildland-urban interface raster dataset of Catalonia. Data Br. 2018, 17, 124–128. [Google Scholar] [CrossRef] [PubMed]
- Syphard, A.D.; Keeley, J.E.; Massada, A.B.; Brennan, T.J.; Radeloff, V.C. Housing arrangement and location determine the likelihood of housing loss due to wildfire. PLoS ONE 2012, 7, e33954. [Google Scholar] [CrossRef] [Green Version]
- Caggiano, M.D.; Hawbaker, T.J.; Gannon, B.M.; Hoffman, C.M. Building loss in wui disasters: Evaluating the core components of the wildland–urban interface definition. Fire 2020, 3, 73. [Google Scholar] [CrossRef]
- Price, O.; Bradstock, R. Landscape scale influences of forest area and housing density on house loss in the 2009 Victorian bushfires. PLoS ONE 2013, 8, e73421. [Google Scholar] [CrossRef] [PubMed] [Green Version]
- Caton, S.E.; Hakes, R.S.P.; Gorham, D.J.; Zhou, A.; Gollner, M.J. Review of pathways for building fire spread in the wildland urban interface part I: Exposure conditions. Fire Technol. 2017, 53, 429–473. [Google Scholar] [CrossRef]
- Keeley, J.E.; Syphard, A.D. Different historical fire-climate patterns in California. Int. J. Wildl. Fire 2017, 26, 253. [Google Scholar] [CrossRef]
- Syphard, A.D.; Brennan, T.J.; Keeley, J.E. The importance of building construction materials relative to other factors affecting structure survival during wildfire. Int. J. Disaster Risk Reduct. 2017, 21, 140–147. [Google Scholar] [CrossRef]
- Bond, W.J.; van Wilgen, B. Fire and Plants; Chapman & Hall: London, UK, 1996. [Google Scholar]
- Schmidt, J. Vegetation Cover and Structure Loss in Four Northern California Wildfires: Butte, Tubbs, Carr, and Camp. 2020. Available online: https://core.ac.uk/download/pdf/356665112.pdf (accessed on 11 March 2021).


| Statewide | p-Value | Bay Area | p-Value | North Interior | p-Value | Southern p-Value CA | ||
|---|---|---|---|---|---|---|---|---|
| Intermix vs. Interface | 1.22 | <0.001 | 0.93 | 0.4 | 0.89 | 0.25 | 1.14 | 0.2 |
| Intermix vs. Unvegetated | 1.15 | <0.001 | 1.17 | 0.31 | 1.17 | 0.01 | 1.55 | 0.009 |
| Intermix vs. Low-density vegetated | 2.25 | <0.001 | 1.66 | <0.001 | 4.14 | <0.001 | 1.95 | <0.001 |
| Interface vs. Unvegetated | 0.96 | 0.004 | 1.29 | 0.19 | 2.34 | 0.006 | 1.34 | 0.11 |
| Interface vs. Low-density vegetated | 1.85 | <0.001 | 1.78 | <0.001 | 4.64 | <0.001 | 1.7 | <0.001 |
| Vegetated vs. Unvegetated | 0.51 | <0.001 | 0.71 | 0.03 | 0.5 | 0.02 | 0.79 | 0.177 |
Publisher’s Note: MDPI stays neutral with regard to jurisdictional claims in published maps and institutional affiliations. |
© 2021 by the authors. Licensee MDPI, Basel, Switzerland. This article is an open access article distributed under the terms and conditions of the Creative Commons Attribution (CC BY) license (http://creativecommons.org/licenses/by/4.0/).
Share and Cite
Syphard, A.D.; Rustigian-Romsos, H.; Keeley, J.E. Multiple-Scale Relationships between Vegetation, the Wildland–Urban Interface, and Structure Loss to Wildfire in California. Fire 2021, 4, 12. https://0-doi-org.brum.beds.ac.uk/10.3390/fire4010012
Syphard AD, Rustigian-Romsos H, Keeley JE. Multiple-Scale Relationships between Vegetation, the Wildland–Urban Interface, and Structure Loss to Wildfire in California. Fire. 2021; 4(1):12. https://0-doi-org.brum.beds.ac.uk/10.3390/fire4010012
Chicago/Turabian StyleSyphard, Alexandra D., Heather Rustigian-Romsos, and Jon E. Keeley. 2021. "Multiple-Scale Relationships between Vegetation, the Wildland–Urban Interface, and Structure Loss to Wildfire in California" Fire 4, no. 1: 12. https://0-doi-org.brum.beds.ac.uk/10.3390/fire4010012