
Customising Evacuation Instructions for High-Rise Residential Occupants to Expedite Fire Egress: Results from Agent-Based Simulation


1
School of Engineering and the Built Environment, Birmingham City University, Birmingham B5 5JU, UK
2
School of Architecture, Building, and Civil Engineering, Loughborough University, Loughborough LE11 3TU, UK
3
School of Built Environment and Architecture, London South Bank University, London SE1 0AA, UK
*
Author to whom correspondence should be addressed.
Fire 2021, 4(2), 21; https://0-doi-org.brum.beds.ac.uk/10.3390/fire4020021
Submission received: 1 March 2021
/
Revised: 1 April 2021
/
Accepted: 21 April 2021
/
Published: 24 April 2021
Abstract
:As the possibility of safe escape is one of the most crucial aspects of a building’s fire safety features, understanding of human behaviour under fire conditions is important for a successful evacuation. Although most of today’s buildings are equipped with fire safety systems, a fire can still occur at anytime and anywhere in a building and have devastating consequences. In the last decade, researchers and practitioners have used information technology to assist with fire safety design and emergency management. Building Information Modelling (BIM) is an exemplar process whose underpinning digital technology has been helpful for fire safety design, simulation, and analysis, but there is a lack of research on how BIM-based models combined with agent-based simulations can help improve evacuation via effective navigation and wayfinding in high-rise residential buildings. Customising evacuation instructions based on BIM, simulation results and occupant location, and delivery of these bespoke instructions to occupants’ smartphones during a fire emergency is relatively novel and research is needed to realise the potential of this approach. Therefore, this study investigates how customised evacuation instructions delivered to each occupant in a high-rise residential building could result in a faster evacuation during a fire incident. The research adopted a case study building and used Pathfinder (agent-based evacuation simulation software) to simulate evacuation from this eleven-floor high-rise residential building in Cairo, Egypt. Constraining evacuees (simulated agents in Pathfinder) to take particular exit routes was used as a proxy for delivering customised evacuation instructions to actual evacuees. Simulation results show that, in general, allowing the use of lifts for the benefit of disabled occupants could lead to their misuse by able-bodied occupants; evacuees would attempt to use the first visible point of exit regardless of how crowded it is. With optimally customised instructions, the evacuation time was, on average, 17.6 min (almost 50%) shorter than when the occupant’s choice of egress route was simulated based on standard path planning factors such as route length, nearby crowds and visible hazards. With evacuation instructions sent via smartphones, occupants could exit more rapidly via alternative routes. Such bespoke instructions were shown to reduce the adverse effects of crowdedness and uneven distribution of occupants along vertical and horizontal evacuation routes on evacuation time.
1. Introduction
Over the past few years, the planning, management and practices of fire egress have been impacted by advances in information technology. Researchers [1] have noted that safe evacuation depends on characteristics of the fire (such as intensity, growth, and smoke yield), characteristics of the building (such as layout and materials) and human characteristics (such as personality, mobility, and familiarity with the building). Placing fire egress in the wider context of fire safety management, information technologies, such as Building Information Modelling (BIM) and fire simulations, have been applied to encompass all such characteristics [1].
This research aims to improve evacuation from high-rise residential buildings by sending bespoke instructions to occupants’ smartphones based on their location in the building. High-rise residential buildings were chosen as the focus of this research as they are among the most common types of buildings in urban areas. Definitive criteria for high-rise residential buildings can vary depending on minimum building storeys and building height. The National Fire Protection Association [2] states that a building is considered as a high-rise building if the overall height is more than 23 m from the ground level to the highest floor. Another view [3] is that a building is considered as a high-rise if it is greater than 75ft (23 m), generally from 7 to 10 stories. A different perspective is offered by the Hackitt Review [4] produced in the aftermath of the June 2017 London Grenfell fire tragedy [5], which called for a new regulatory framework where fire safety measures should primarily target buildings of 10 storeys or more, i.e., 30 m and above. Regardless of the formal classification of high-rise buildings, tall buildings have been identified as acutely high-risk when it comes to fire incidents due to the density of occupants and the diverse levels of occupant mobility [6]. Tall residential buildings have been singled out as particularly risky to fire incidents [7].
Since occupants’ safety during evacuation will always be the top priority and their actions have a huge impact on their safety, more investigation into human behaviour under fire conditions is needed, particularly with respect to how evacuation instructions can be customised to each occupant’s circumstances (for maximum impact) and can be delivered to users during a fire situation. Occupant behaviour under a fire emergency continues to be challenging to predict and there are no robust models of occupant behaviour and decision-making [8,9]. One model of decision-making in fire situations includes factors such as people’s awareness, beliefs, attitudes, motivations, and coping strategies [10]. Another model [11] highlights the particular behaviour of high-rise residential building occupants. The wide variety of activities of such occupants, compounded by the notable complexity of such buildings, makes egress behaviour exceptionally convoluted. Another study [12] attempts to impose a prescriptive decision-making model on these complex situations based on simple Yes/No questions such as “Are there safer locations than the current location?”. Models of human behaviour have also been invoked to inform the customisation of egress signage [13], to optimise ship evacuation [14], and to evaluate immersive VR simulations of fire situations [15].
The Hackitt Review emphasised the need for “a ‘golden thread’ of good-quality information…[to] enable future building owners to better manage their buildings safely” [4] (p. 35). This “golden thread” can arguably be extended to include use by building occupants for whom this information can enable a safe fire evacuation. Consequently, the research question of interest here is how would the multiple sources of ‘quality information’ available through modern technology be harnessed for evacuation purposes in such a way that different user needs are taken into account? We argue here that BIM-based models of buildings enriched with agent-based simulations of evacuees (who could be presumed to have access to mobile phone messaging systems) can be used to customise evacuation instructions sent to occupants’ smartphones based on their locations. Interestingly, text messages have been found to be just as effective in managing underground mine evacuation as verbal alerts from co-workers [16].
In this research, BIM is singled out as a particularly important component of the “golden thread” of information appliable to fire egress and indeed as a conceptual lens for considering information technology in the built environment. There is no universally accepted definition of BIM, which is unsurprising given its wide scope and range of applications. It is a term used in both verbal and noun forms. As a verb, BIM is widely accepted as a both a working process as well as an underlying set off technologies. In his BIM framework, Succar [17] includes separate “process” and “technology” fields. One prominent feature of BIM is the concept of purposeful management of information through the lifecycle of a constructed facility for improved productivity and effectiveness of all the lifecycle phases [18]. In the research reported here, the term BIM is used (as a noun) to denote a parametric 3D model that can be used for agent-based egress simulation, can be used to represent the location of occupants carrying location-sensitive smartphones, and can be combined with information from other sensors in a building.
BIM has previously been applied to fire safety management. A study [19] reported that BIM offers a different workflow for fire engineers to the one that is currently being used. Despite this, there is still some alignment between the functionality of BIM and the needs of fire engineering. The rich semantics in BIM-based models enable reasoning, navigation, and simulation [20,21]. For example, a BIM-based architecture (enriched with data from heat sensors) has been used to automatically generate the quickest egress routes and to update building signage accordingly in real-time [13]. Similar to the research reported here, another study [22] integrated BIM with real-time data of occupant location to manage evacuation. Other studies [23,24] similarly used BIM-based building layout designs combined with agent-based simulations to compute egress time; such research empowers designers to optimise building layouts for safe evacuation. Some research [25] exploited the visual powers of BIM, for example, to integrate data from sensors and dynamic simulations. Other research [26] leveraged the (computational) enriched modelling of building geometry, for example, to determine the location in the indoor space of occupants needing rescuing. Whereas many of the works cited already allude to the use of BIM to serve as a central anchor for external data from sensors or simulations, one study in particular [27] shifted its emphasis to this federating power of BIM. In many cases [24,27], the Industry Foundation Classes (IFC) standard is used as the information architecture. The IFC standard has also been applied during use of the Fire Dynamics Simulator (FDS) platform [28,29,30].
An influential point of departure for this research is BIM-based simulations for serious games to aid in fire safety management. Studies [31,32,33,34] that used BIM-based games as a research instrument to observe human behaviour demonstrated the fidelity of such simulations, particularly agent-based simulations. BIM, combined with other platforms such as GIS [33], can provide the data necessary for such accurate simulations. The application of such environments to train occupants in effective egress has also been recognised [35], albeit for earthquake egress rather than fire egress. In contrast to published studies, this research uniquely combines BIM with agent-based simulation to tailor the evacuation instructions sent to occupants’ smartphones based on their locations in the building.
2. Materials and Methods
The underlying aim of this research is to improve evacuation from high-rise residential buildings. As the importance of giving information to occupants/evacuees emerged from the literature review, it is hypothesised that sending bespoke instructions to occupants’ smartphones can significantly reduce evacuation time. BIM, enriched with agent-based simulations of evacuees, is positioned as the mechanism for customising evacuation instructions sent to occupants’ smartphones based on their locations and building conditions.
Pathfinder [36] was selected as a reliable agent-based egress simulator and is a tool that has been used in several fire evacuation studies [37,38,39]. Constraining evacuees (simulated agents in Pathfinder) to take particular exit routes was used as a proxy to model the delivery and following of customised evacuation instructions to actual evacuees. Evacuation time was used as the egress performance metric. (There is a clear need to quantify egress capacity for fire safety management, and one other study [40] proposed an “Escape Route Index”). As detailed below, evacuation time was compared between a “base case” when the occupant’s choice of egress route was simulated based on standard path planning factors, such as route length, nearby crowds, and visible hazards, and various configurations constraining the egress route of particular evacuee subgroups originating in various building locations.
2.1. The Building
To select a scenario study building, a number of criteria were established. Egypt was chosen as the geographical context of this research, and the target region restricted to Cairo. Published fire incident data was unavailable but based on preliminary discussions with fire defence officers in Cairo the city has the highest number of fire accidents in residential buildings in Egypt. The second criterion was that the building had to be fairly new, i.e., not older than 15 years, so that it was equipped with relatively modern egress arrangements. The third criterion was that the building needed to be classified as a high-rise residential building. (Based on the NFPA [2] definition, a building is classified as high-rise if the overall height of the building is more than 23 m). In addition to the high-rise classification, the building geometry or layout needed to be complex enough to represent a worst-case scenario with respect to evacuation. Fourth, the number of occupants who live in or visit the selected building must be considered large enough compared to other building types in Cairo. Based on preliminary discussions with firefighters in the city, a high-rise residential building is considered to have a large number of occupants/visitors if the building has more than 250 occupants present at the same time. This density of occupants was needed to isolate the effect of sending customised instructions to evacuees as a key objective of this research. The fifth criterion was that the building must have multiple lifts and emergency exit staircases. The sixth criterion was that the building had to have CCTV installed to identify smoke in the corridors.
From a shortlist of potential buildings, the one that satisfied all the criteria consisted of 11 storeys/floors. Its ground floor to first floor height measured approximately 6 m and each subsequent floor was 3 m high, making the total height of the building 39–40 m. This satisfied existing high-rise building definitions. The building had one main entrance and 11 floors, with the last two floors (9th–11th) containing two-story split-level apartments. The main entrance of the building is at the front of the building, with a second entrance (approximately 1.2 m less in width than the main entrance) also located in the front façade (Figure 1f). The main entrance was connected to the main stairs. In addition, an emergency exit is located at the back side of the building. The emergency entrance was connected to emergency stairs. In addition to the main and emergency stairs for vertical circulation, the building had six lifts.
Due to unavailability of as-built drawings, photos of the building were taken, including all corridors, stairs, lifts, apartments, and emergency exits, to ensure the building was modelled as accurately as possible. A number of walk-through audits were also conducted to record building geometry measurements. The building was modelled using Autodesk Revit (Figure 1a) and subsequently imported into Pathfinder using the .DWG file format. While importing, the model had to be modified as not all building geometry was transferred correctly from Revit to Pathfinder. For instance, certain construction elements (e.g., walls, doors, stairs, and lifts) had to be added to the Pathfinder model manually [29] to ensure completeness (Figure 1b–f). Stairs and lifts in particular needed to be modelled manually in Pathfinder as the imported elements caused simulated agents to get stuck during the evacuation simulation.
For the purpose of egress simulation, the building was modelled to contain 509 occupants in total (measured from a headcount survey, as presented in Section 2.2).
2.2. The Simulation Cases
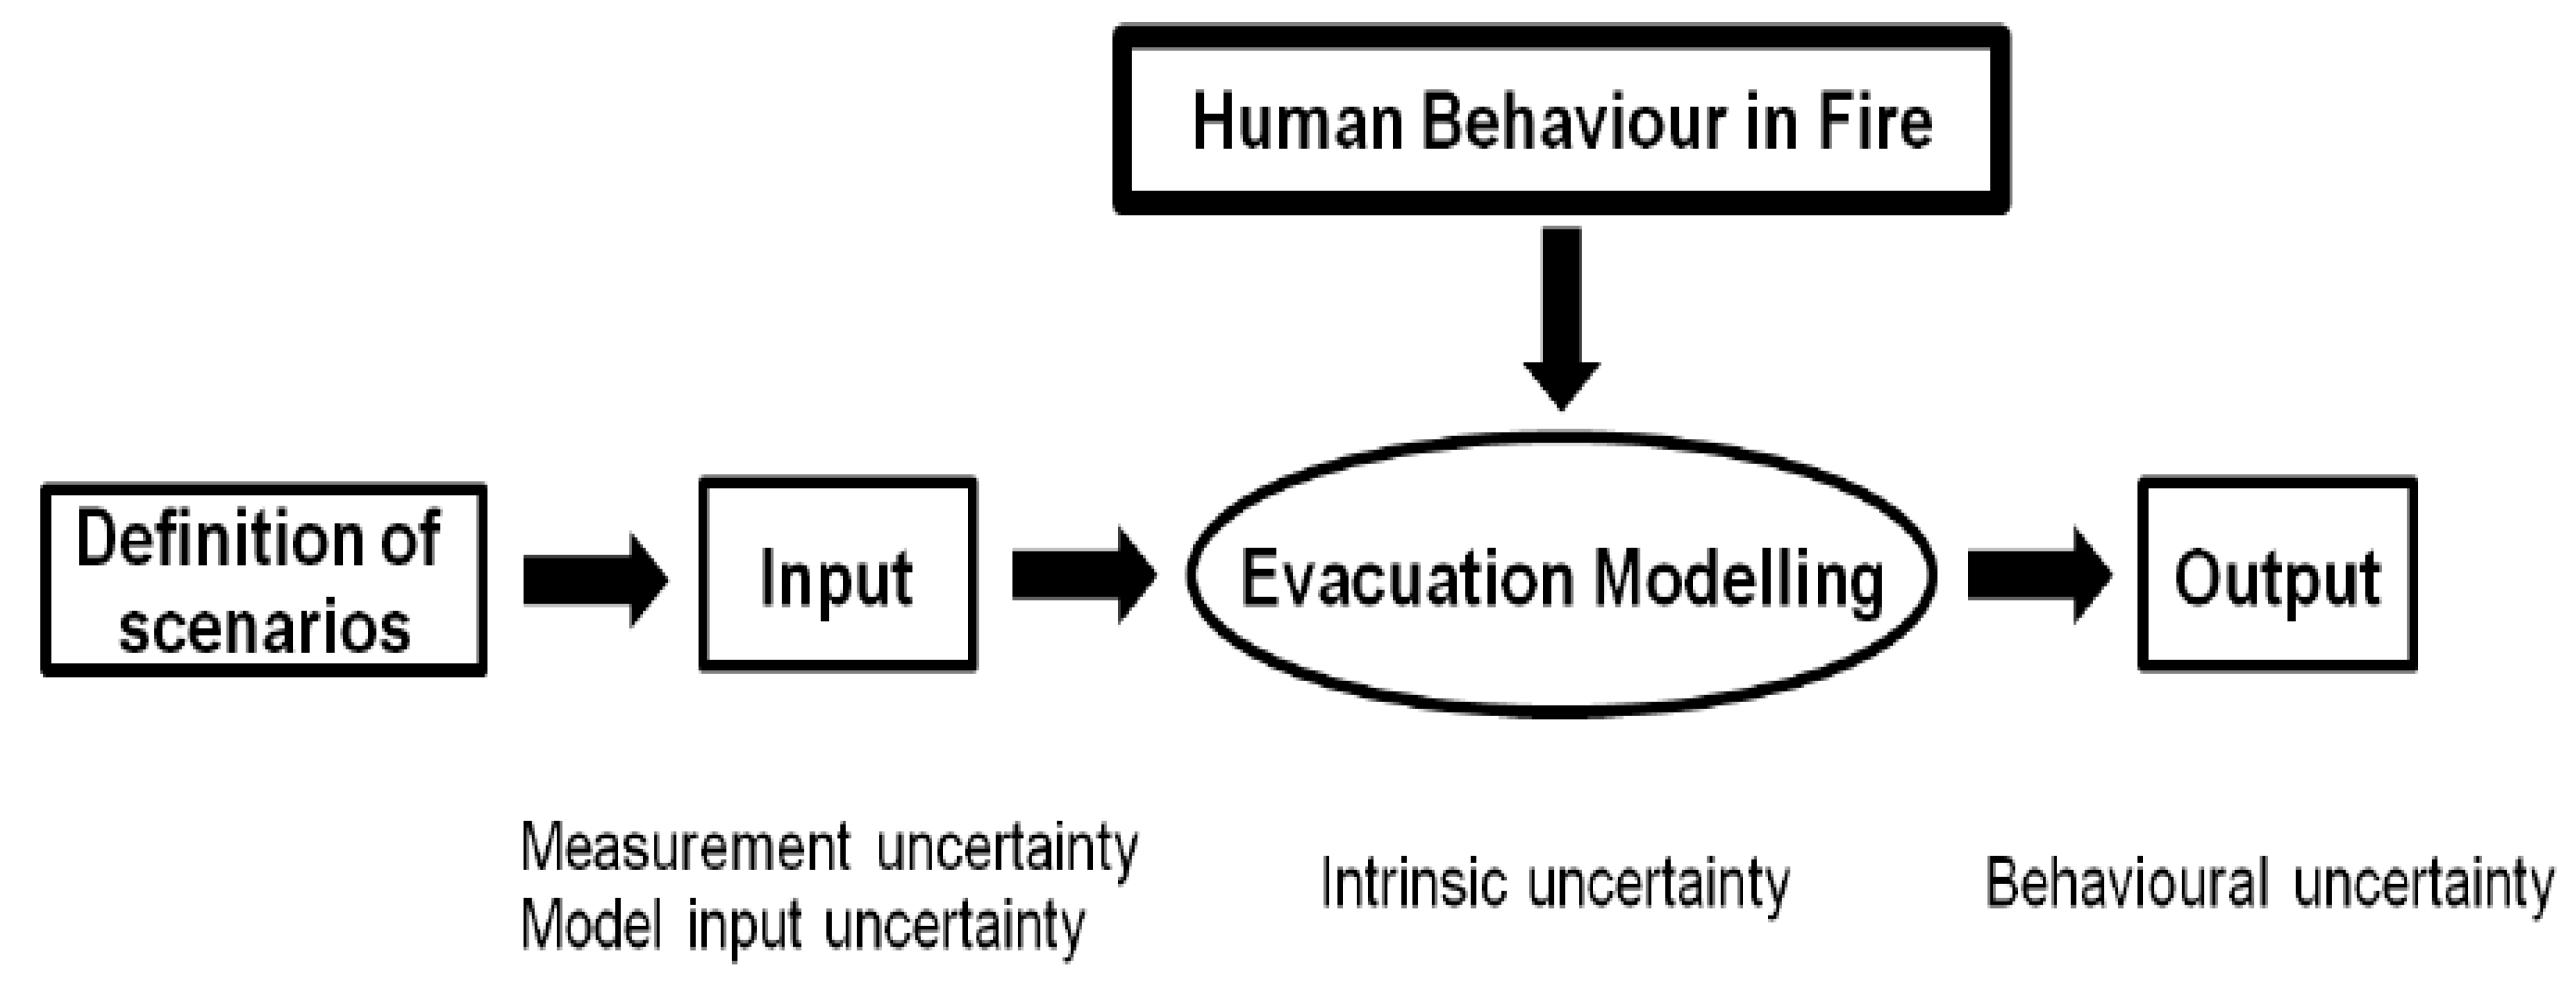
The simulation strategy was based on the fire evacuation process shown in Figure 2 simulating human behaviour [41] under various egress path constraints to represent occupants receiving different evacuation instructions. The instructions (egress path constraints) varied from floor to floor. Eight different scenarios were simulated using Pathfinder (Appendix A) with different configurations of instructions given to occupants on various floors. Scenario 1, the base case, represented no instructions sent to any occupants and lift use was not allowed. Scenario 2 represented no instructions sent but lift use was allowed to isolate the effect of lift use on evacuation time. Scenario 3 attempted to give uniform instructions to the lower half of the building with evacuees in the upper half instructed to use combinations of the lift, main stairs, and emergency stairs. In Scenario 4, occupants on various floors were instructed to use combinations of the main and emergency stairs with lift use not permitted on any floors. Scenarios 5 and 7 divided lift use between the top floors and the middle floors of the building. Scenario 6 isolated lift use in floors 6–8. Scenario 8 divided evacuees in the bottom half of the building between the main and emergency stairs while some evacuees in the top half of the building were instructed to use the lift. Scenarios 3–8 collectively covered a range of possible instructions sent to occupants on various floors.
The ultimate goal was to determine the optimum set of instructions that resulted in the fastest and safest evacuation. According to a study [41], the differences between reality and the evacuation simulation can be framed as arising from uncertainty. In this regard, the study [41] defined uncertainty as a “potential deficiency in any activity or phase of the modelling process as consequence of the lack of knowledge or understanding.” The objective of the modelling procedure (Figure 2) was to model the evacuation process as accurately as possible. Nevertheless, evacuation modellers and engineers need to understand the limitations of evacuation models in order to interpret the results and devise appropriate courses of action based on these results.
One significant source of uncertainty is the set of occupant starting locations at the start of the evacuation. This uncertainly is usually mitigated by running the simulation multiple times with random occupant starting locations. The Pathfinder “Randomisation” feature allows investigators to explore how the random location of occupants affects evacuation time. Selecting the most appropriate number of simulation runs remains a challenge due to the many probabilistic aspects of human egress behaviour and the possibly large fluctuations in model results. To date, there has not been an accepted/standardised method to manage model uncertainty in human behaviour or determine the appropriate number of simulation runs, both of which are left to the judgment of the model user [42]. A reasonable number of simulations need to be run until there is a pattern of results and a point is reached where further simulations would not add value to the data collected. In this research, each of the eight scenarios was run 12 times with occupant locations and orientations randomly changed for each run. The 12 simulation runs were found to be sufficient to ensure consistently accurate results with little significant variation in average evacuation time if further runs were conducted. For each set of runs for a given scenario, the average, minimum, and maximum evacuation times were noted. Each scenario provided a different set of instructions to occupants that collectively covered the full range of possible evacuation instructions to various groups of occupants. The evacuation path of a simulated occupant was constrained in a particular way to represent that occupant receiving and following bespoke instructions on their smartphone.
To ensure that the simulations detected possible differences between the various scenarios, this study used “worst case” data for various input variables. This included variables such as the largest possible number of occupants in the building and the maximum percentages of females/children as well as disabled occupants. To determine these maximum values as input data, a headcount survey of the real building was conducted beforehand over the course of a week, recording the numbers of occupants for each apartment in the building. The survey was conducted after working hours to ensure the largest numbers of residents/occupants were recorded. The survey results are shown in Table 1, giving the total number of occupants on each floor and the total occupants within the building. Overall, there were 9 disabled occupants in the building (1.8% of total occupants), while 37 occupants (7.3% of total occupants) were above the age of 65. In addition to Table 1, Appendix B provides a demographic breakdown of occupants per floor.
“Pre-movement time” was an input parameter of particular concern. This pre-movement time is the time it takes occupants to be ready (i.e., prepare, investigate, etc.) before starting to evacuate. Simulated occupants begin to follow received instructions after the pre-movement time had elapsed. Previous studies [9,43,44,45,46,47,48] seem to suggest a pre-movement time of 3–5 min for awake occupants and 6–8 min for sleeping occupants. A detailed analysis of the effect of pre-movement time was felt to be beyond the scope of the current research, and those ranges were used.
Another important model input parameter was “walking speed”. Model walking speeds for various classes of evacuees are usually derived from published research. The occupant walking speeds used in this research are shown in Table 2 and ranged from 0.37 m/s (the minimum speed for mobility-impaired females older than 50 years) to 1.85 m/s (the maximum speed for males younger than 30 years). The figures are from published research [49] based on experiments conducted for evacuating passenger ships and, in the absence of similar comprehensive studies for residential buildings, were adopted for this investigation. Although Table 2 does not give walking speeds for children, it has been suggested that children between the ages of 2 and 13 years should have a walking speed of 0.06–0.67 m/s [49] and this is the range used in the simulations for this research. It can of course be argued that walking speeds in ships differ from those in buildings. However, as this research is not concerned with absolute evacuation times but with the proportional change in evacuation times due to sending bespoke evacuation instructions, and in the absence of data specifically measured for residential high-rise building occupants, use of this data was considered to be appropriate.
The lift data used includes a speed of 1.2 m/s2 for acceleration with a maximum velocity of 2.5 m/s, open and close time of 5.0 s, as well as a maximum capacity of 10 occupants at a time. All lifts were originally positioned at the ground floor by default.
Pathfinder does not directly model the effects of smoke and toxic gases. Although these effects can be critical, they were considered beyond the scope of the current research. (The effect of smoke can indirectly be modelled in Pathfinder by, for example, applying reduction factors to walking speeds in particular smoke-filled rooms.)
To simulate the effect of receiving (and following) bespoke evacuation instructions, occupants on particular floors were set with specific behaviours (i.e., egress routes). When occupants are not set with a specific behaviour and the Pathfinder option of “Goto Any Exit” is chosen, the simulated occupant decides what the best route is depending on a number of factors [47]. These factors could include queue times for each door of the current room, the time to travel to each door of the current room, the estimated time from each door to the exit, and the distance that has already been travelled in the room.
The Pathfinder results output file provides “First In” and “Last Out” data that denotes the first and last occupant that have used a certain entrance and exit, respectively [50]. All data collected from the simulations were entered into a spreadsheet for analysis. In this research, the “Last Out” time is used as a measure of evacuation time, which in turn is used as an egress performance indicator.
3. Results and Discussion
The 12 simulations conducted for each of the eight different scenarios resulted in a total of 96 different simulations (Table 3). As stated previously, all occupants in all scenarios were set with the same pre-movement time: 3–5 min for 75% of occupants and 6–8 min for the remaining 25%. Scenario 1 was used as a benchmark (base case) in which occupants were not provided with any specific evacuation information other than Pathfinder’s default “Goto Any Exit” instruction at the start of evacuation. It can be seen from Table 3 that Scenario 1 had the longest evacuation times, with evacuation times in the range 35.2–37.4 min and an average of 36.2 min. This section focuses on the results from the standout scenarios: 1, 2, 3, 6 and 8.
3.1. Overview of Scenario 1: No Instructions; Evacuate via Nearest Exit; Lifts Unavailable
For Scenario 1, the second entrance had the highest number of occupants using it to evacuate with a total of 244 out of 509 occupants exiting through it. This was despite the fact that the second entrance has a narrower width than the main entrance and was apparently due to the location of that exit. The second-most used exit route was the main entrance with 148 occupants evacuating through that route, followed by the emergency exit with 117 occupants. Table 4 shows “First In” and “Last Out” times for the three exit points for a typical Scenario 1 run (Simulation 1).
From watching the simulation, after the pre-movement time, when nearly all occupants moved towards the evacuation routes, there was inevitable crowdedness on all the stairs, particularly at the 2nd, 3rd, and 4th floors due to the volume of occupants descending to these floors from the higher floors. There was subsequently a high density of occupants on the all the stairs of the building, resulting in some floors having a density of 2.75–3.00 occupants/m2. The crowdedness subsequently affected the occupants’ travel speed but, notably, there was no delay or queuing at any of the exit doors. It was also observed that for those on the first floor, the sheer number of occupants queuing by the stairs delayed occupants from reaching the ground floor. In addition, 11 children and adults above the age of 50 who were at the front of the queue were located on this (first) floor, further exacerbating the evacuation delay as other occupants could not get past them. As the evacuation progressed, the floors with the least occupant density were the 9th to 11th floors as they were the first floors to start evacuating following the pre-movement time. In less than 2.6 min, occupants on the 9th to 11th floors had reached the 6th floor using the main stairs and emergency stairs. After 9.4 min, nearly one third of occupants had reached the 4th and 5th floors. However, it then took evacuees 4.1–6.3 min to get to the 1st floor.
Although the crowdedness and queuing resulted in evacuation delays, the results are understandable. Evacuees from the floors above were continually pouring into the main stairs, leading to more queuing time and a reduction in evacuation speed. Since Pathfinder does not allow simulated occupants to pass through (or squeeze past) one another, the evacuation speed is set by those at the front of the queue, and if they happen to have a lower walking speed (children, elderly, or disabled), this will reduce the walking/evacuation speed of all other occupants stuck behind. The overall walking speed after 6.5 min of evacuation on the ground floor ranged from 0.6 m/s to 0.96 m/s, which according to a study [45] is around the maximum walking speed for females older than 50 years. This continued until after 11.4 min when the average walking speed dropped further to between 0.47 m/s and 0.73 m/s due to the addition of more occupants from the top floors. Furthermore, 27 occupants on the 4th, 5th, and 6th floors took 450–500 s (7.5–8.3 min) to exit the building. There were 14 occupants on the 3rd floor and 11 on the 2nd floor who took 400–450 s (6.7–7.5 min) to evacuate the building.
3.2. Overview of Scenario 2: No Instructions; Evacuate via Nearest Exit; Lifts Available
Similar to Scenario 1, all occupants in Scenario 2 were given basic evacuation instructions and directed to the nearest exit using the “Goto Any Exit” option in Pathfinder, except this time the lifts could be used as an egress route. This was done to capture the use case for disabled occupants as well as to explore the possibility that some able-bodied occupants may still decide to use lifts as a means of escape. Scenario 2 had an average evacuation time of 21.3 min, which is the second-longest evacuation time after Scenario 1. Evacuation times were in the range of 20.2–22.4 min. Although Scenario 2 produced a faster evacuation time than Scenario 1 by nearly 15 min, it can still be concluded that Scenario 2 led to a relatively slow evacuation. As in Scenario 1, the second entrance in Scenario 2 was preferred by 244 occupants for evacuating the building, apparently due to its proximity to the main stairs used by most evacuees and despite its narrower width than the main entrance. The main entrance ranked second in preference with 165 occupants opting to use it for escape, while the least-used exit (as in Scenario 1) was the emergency exit with only 100 out of 509 occupants using this exit. In this scenario, it was also observed that the emergency stairs were the least used vertical circulation option because most occupants preferred to use the lift. Although this use of lifts may not necessarily reflect how informed occupants may behave in real fire situations, it demonstrated the behavioural possibilities when the use of lifts is an option, at least for disabled evacuees. Table 5 shows “First In” and “Last Out” times for the three exit points for a typical Scenario 2 run, Simulation 7. The “First In” times are comparable for the three exits, but the “Last Out“ times are significantly lower for the emergency exit. Comparing the times in Table 4 and Table 5, Scenario 2 had the longer “First In” times but the shorter “Last Out” times. This suggests that the evacuation in Scenario 2 was generally concentrated in a narrower window of time than in Scenario 1. Evacuation times in Scenario 2 were generally more widely distributed, presumably because of variations between using the lifts and the staircases.
The role of the lifts in Scenario 2 is worth exploring further because of their apparent impact. Following the pre-movement time, all occupants started to evacuate from all floors using all available evacuation routes, including the lifts. The lifts were notably used by occupants on the 1st, 2nd and 3rd floors who could have easily used the main or emergency stairs to expedite the evacuation. As occupants on each floor called a lift, a delay occurred due to the lift cars stopping on each floor from which they were called. Consequently, 22 occupants on the 8th, 9th, and 10th floors took approximately 4.1 min to reach the ground floor while 37 occupants on the 2nd, 3rd, 4th, and 5th floors took approximately 7.1 min to reach to the ground floor (the latter being markedly quicker).
Lift use apparently alleviated delays on the main or emergency stairs compared to Scenario 1 but did exasperate crowds on the floors. The 2nd, 5th, 6th, 9th, and 10th floors had an occupant density of between 2.75 and 3.00 occupants/m2 due to those waiting to use the lifts. In total, 162 of 509 building occupants used the lifts. The lifts being called from each floor meant, for example, that two lifts in Block A went up to the top floors to collect more people while carrying 6 occupants who were intending to go to the ground floor. This resulted in a delay of 3.2 min before the lifts could reach the ground floor. In this scenario, no specific age or demographic group favoured using the lift, with the rate of lift use approximately uniform across all occupants.
An interesting observation was that 61 occupants who initially started using the main stairs subsequently decided to use the lift at an intermediate floor, further exacerbating queues at the lifts. After 9 min, the 3rd and 4th floors were the most crowded as many occupants waited for the lifts, whereas they could easily have opted for the stairs.
3.3. Overview of Scenario 3: Instructed to Evacuate via Main Stairs and Nearest Exit
Although the evacuation times in Scenario 6 and Scenario 3 are generally close, there was a difference of 0.43–2.4 min, depending on which specific simulation results are compared for each scenario. Moreover, Scenario 3 was the only scenario apart from Scenario 6 to have a simulation evacuation completed within 18 min. Furthermore, Scenario 3 was the only scenario in which, for the first five floors, 100% of the occupants on any floor received the same instructions (Appendix A). In this scenario, all occupants on the 1st and 2nd floors used the main stairs, while all occupants on the 3rd to 5th floors used the emergency stairs. This resulted in a steady flow of evacuees and only a 31-s delay while evacuating through the main stairs. The uniform instructions to lower-floor occupants apparently facilitated a quicker evacuation for evacuees from the higher floors. Table 6 shows “First In” and “Last Out” times for the three exit points for a typical Scenario 3 run, Simulation 8.
The second entrance was the most-used exit point, used by 244 occupants, followed by the main entrance, used by 190 occupants. The least-used exit was the emergency exit, used by 75 occupants. This was also the case in Scenarios 1, 2 and 6, as discussed previously.
3.4. Overview of Scenario 6: Instructed to Evacuate via Main Stairs and Nearest Exit
In this scenario, there was a steady flow of occupants through the main stairs and emergency stairs. The occupants above the 8th floor reached the lower floors without having to queue or reduce their walking speed because the occupants on the 6th to 8th floors were waiting for the lifts, invariably creating an opportunity for occupants on upper floors to use the main and emergency stairs without any delay. A total of 139 occupants used the lift in Scenario 6. Table 7 presents “First In” and “Last Out” times for a typical Scenario 6 run. Use of the emergency exit resulted in the longest times for occupants to leave the building when compared to Scenarios 1 and 2, despite being the least-used exit for Scenario 6.
In Scenario 6, the main entrance was used by 167 occupants with the second entrance used by 180 occupants and the emergency exit by 162 occupants. While this scenario had the same ranking of exit doors as in Scenario 1, the distribution between the three exits is more even in Scenario 6. This facilitated a clear flow of occupants, and after 7.1 min 324 occupants had evacuated the building. However, the last group of occupants to evacuate the building were those using the lifts even though not all occupants on the 6th–8th floors could use the lifts due to restricted lift capacity. This resulted in the lifts conducting eight trips between the upper floors and the ground level. Evacuation speed from the 3rd and 4th floors dropped to 0.67 m/s (compared to 0.94 m/s on average in other floors) due children and elderly evacuees coming to the front of the queue. In Scenario 6, it was also found that 78% of the building had a density of 1.04–1.75 occupants/m2, which is less than all other scenarios where the density was in the range 1.77–2.75 occupants/m2.
The impact of evacuee demographics on the evacuation process needs to be appraised holistically from the results. Only 3% of the 139 occupants who used the lift were disabled (comparable to the percentage of disabled occupants in the building as a whole). This surprisingly small number of disabled evacuees suggests that many able-bodied but slow-walking evacuees chose to take the lift. This clearly helped to reduce queues at the stairs, leading to faster evacuation.
3.5. Scenario 8: Instructed to Evacuate via Main Stairs and Emergency Stairs
The third-worst evacuation performance was for Scenario 8, with an average evacuation time of 20.7 min. Specifically, the worst simulation from this scenario was Simulation 5, where occupants needed 21.2 min to evacuate. Table 8 gives “First In” and “Last Out” times for the three exits. In contrast to the scenarios discussed above, use of the emergency exit resulted in the longest times out of the three exits for Scenario 8.
The most-used exit was the emergency exit with 183 occupants using it; the main entrance was second with 177 occupants while the second entrance was used by 149 occupants. These results are in stark contrast to all other scenarios discussed previously. Although the other scenarios provided instructions to occupants to use emergency stairs (Appendix A), Scenario 8 had the highest percentage of occupants using this route. Around 50% of occupants on the 1st and 2nd floors used the emergency exit in addition to 70% of occupants on the 3rd to 5th floors and 20% of occupants on the 6th to 8th floors. However, although Scenarios 3 and 5 also had a large percentage of occupants using the emergency stairs/exit, they also had the least number of occupants using the emergency door on the ground floor. For example, Scenario 3 had only 75 occupants exiting from the emergency door on the ground floor. Further analysis is required to investigate why the simulations led to such results, particularly why occupants deviated from the expected choice of exit upon arriving on the ground floor. The analysis showed that after the agent-based simulated occupants had calculated the queue time and the distance to be covered in exiting the building, some opted for a longer walk to an exit but ended up with a faster evacuation. However, it is arguable that this would not have been the case in an actual fire evacuation from a high-rise building as the emergency stairs usually lead directly to the emergency exit on the ground floor, making it (logically) difficult for occupants to suddenly change their point of egress. This sort of seemingly irrational decision demonstrates the need for bespoke, customised instructions to be sent to inform individuals about their best possible evacuation routes based on their location and circumstances.
In summary, the key scenarios presented (i.e., 3, 4, 5, 6, 7 and 8) all had relatively small differences in evacuation time amongst them and compared to Scenario 1 and Scenario 2. The ranking of the scenarios (Table 9) reveals that Scenario 6 resulted in the fastest evacuation with an average of 18.7 min.
Six out of the eight scenarios (2, 3, 5, 6, 7 and 8) allowed lift use as an evacuation option, but Scenario 6 was the only scenario in which at least one occupant from all floors used the lift. The evidence suggests that allowing lift use expediates evacuation, despite the possibility of queues while waiting for lifts. The evacuation time for the scenario with the optimum instructions (Scenario 6) was, on average, 17.6 min shorter than for the base case scenario with no instructions. This is an almost 50% reduction and can conceivably have a significant life-saving impact.
4. Conclusions
This research investigated how sending bespoke instructions to high-rise residential building occupants during a fire evacuation could reduce evacuation time when compared to occupants without any instructions. A reduction in evacuation time of over 17 min, or almost 50%, was observed from fire egress simulations. This principle of sending instructions to occupants, customised based on their locations and other building conditions, constitutes an important theoretical contribution. As a practical contribution, this research demonstrates how a BIM platform, combined with agent-based fire egress simulations, can be used to customise such instructions. Smartphones are proposed as a medium for delivering these instructions.
The egress simulations did highlight interesting issues for the case study building in particular, and by extension for fire egress more generally. The choice of the narrower second entrance as an exit route by some evacuees was seemingly irrational and highlights the need for bespoke instructions. A detrimental issue that was observed to delay evacuation in most simulations was less-able or less-mobile evacuees at the front of queues, reducing the speed for more able evacuees behind them in the queue. This suggests the need for further research to customise instructions based on demographic data and not merely based on the evacuee’s location as in this research. Simulation results also suggest that lift use (if safe) has the potential to reduce evacuation time but needs careful coordination based on research. Such lines of enquiry would raise fundamental ethical issues.
This research has important limitations. It is based on simulations using Pathfinder. Although the platform is frequently used in research (e.g., [8,37,38,39]), it would be prudent to experiment with other simulation engines to check whether the results are sensitive to the choice of the simulator. The gist of this research was to measure the impact of bespoke messages sent to occupants’ smartphones. It was not possible to simulate this directly and constraining the simulated agent’s egress route in a particular way was deemed to be the most feasible mechanism to model the effect of an evacuee receiving and following such instructions. The validity of such a model can be questioned, as some occupants might not receive the instructions, might receive them but not read then, or might read them but disregard them. Occupants with impaired eyesight might struggle to read the instructions on their smartphones, particularly in difficult fire conditions. Further research might investigate how bespoke individual instructions can complement general instructions broadcast, for example, through a public announcement system. Evacuee behaviour and average evacuation times in these circumstances is difficult to simulate.
Future research can focus more directly on modelling the effects of smoke and heat. The related simulation platform FDS uses computational fluid dynamics to model smoke and heat transfer from fires. As they have complementary modelling emphases, the two platforms, Pathfinder and FDS, are able to exchange geometry files and results data. This extended simulation scope can supplement real-time building condition data from sensors. This is a promising avenue for modelling the interaction between the behaviour of fires and the behaviour of humans.
Author Contributions
Conceptualization, M.G., P.D., Z.A.; methodology, M.G., P.D., and Z.A.; software, M.G.; writing—original draft preparation, M.G.; writing—review and editing, M.G., P.D., and Z.A. All authors have read and agreed to the published version of the manuscript.
Funding
This research received no external funding.
Acknowledgments
The authors thank the Thunderhead Engineering technical support team for providing guides and help with evacuation modelling using the Pathfinder software.
Conflicts of Interest
The authors declare no conflict of interest.
Appendix A
Summary of instructions sent to evacuees for different scenarios.
| Scenario 1 | Scenario 2 | Scenario 3 | Scenario 4 | Scenario 5 | Scenario 6 | Scenario 7 | Scenario 8 | |
| Message to be sent to floor 1 and floor 2 | No instructions provided. Evacuate through nearest exit. No lifts to be used. | No instructions provided. Evacuate through nearest exit. Lifts can be used. | Evacuate through main entrance using main stairs. 100% of occupants use main stairs. | Evacuate through emergency exit stairs. 100% of occupants use emergency stairs. | Evacuate through main stairs to main entrance. Evacuate through emergency stairs. 50% of occupants use main stairs. 50% of occupants use emergency stairs. | Evacuate through main stairs and nearest exits. 60% of occupants use main stairs. 40% of occupants use emergency stairs. | Evacuate through main stairs and emergency exit. 40% of occupants evacuate through main stairs and 60% evacuate through emergency exit. | Evacuate through emergency exit. 50% of occupants evacuate through main stairs. 50% of occupants evacuate using emergency stairs. |
| Message to be sent to floors 3–5 | No instructions provided. Evacuate through nearest exit. No lifts to be used. | No instructions provided. Evacuate through nearest exit. Lifts can be used. | Evacuate using emergency exit stairs through the emergency door. 100% of occupants use emergency stairs. | Evacuate through main stairs and emergency exits stairs. 60% of occupants use main stairs and 40% of occupants use emergency exit stairs. | Evacuate using lifts and main stairs. 25% of occupants use lifts. 75% use main stairs. | Evacuate through emergency exit and main entrance. 50% of occupants evacuate through emergency stairs. 50% of occupants evacuate through main entrance. | Evacuate through main stairs and lifts. 70% of occupants evacuate through main stairs. 30% of occupants use lifts. | Evacuate through emergency stairs and main stairs. 30% of occupants use main stairs. 70% of occupants use emergency stairs. |
| Message to be sent to floors 6–8 | No instructions provided. Evacuate through nearest exit. No lifts to be used. | No instructions provided. Evacuate through nearest exit. Lifts can be used. | Evacuate using lifts and emergency stairs. 50% of occupants use lifts. 50% of occupants use emergency stairs. | Evacuate through main stairs. 100% of occupants evacuate through main stairs. | Evacuate using nearest exit (stairs only). 50% of occupants use emergency stairs. 50% of occupants use main stairs. | Evacuate using lifts. 100% of occupants use lifts. | Evacuate using emergency stairs. 100% of occupants evacuate using emergency stairs. | Evacuate using emergency exit, main stairs, and lifts. 20% of occupants use lifts. 50% of occupants use main stairs. 30% of occupants use emergency stairs. |
| Message to be sent to floors 9–11 | No instructions provided. Evacuate through nearest exit. No lifts to be used. | No instructions provided. Evacuate through nearest exit. Lifts can be used. | Evacuate using main stairs, using lifts, and emergency stairs. 30% of occupants use main stairs. 40% of occupants use lifts. 30% of occupants use emergency stairs. | Evacuate using emergency exit stairs. 100% of occupants evacuate using emergency stairs. | Evacuate using lifts. 100% of occupants use lifts. | Evacuate through main stairs and emergency exit. 60% of occupants use main stairs. 40% of occupants use emergency stairs. | Evacuate through emergency stairs, main stairs, and lifts. 20% of occupants evacuate through emergency stairs. 20% of occupants evacuate through main stairs. 60% of occupants evacuate using lifts. | Evacuate through lifts and main stairs. 80% of occupants use lifts and 20% use main stairs. |
| % of men | 46 | 46 | 46 | 46 | 46 | 46 | 46 | |
| % of women | 35 | 35 | 35 | 35 | 35 | 35 | 35 | |
| % of children | 19 | 19 | 19 | 19 | 19 | 19 | 19 | |
| Wait time to evacuate after hearing fire alarm | 3 min–5 min (75% of occupants awake) 6 min–8 min (25% of occupants sleeping) | 3 min–5 min (75% of occupants awake) 6 min–8 min (25% of occupants sleeping) | 3 min–5 min (75% of occupants awake) 6 min–8 min (25% of occupants sleeping) | 3 min–5 min (75% of occupants awake) 6 min–8 min (25% of occupants sleeping) | 3 min–5 min (75% of occupants awake) 6 min–8 min (25% of occupants sleeping) | 3 min–5 min (75% of occupants awake) 6 min–8 min (25% of occupants sleeping) | 3 min–5 min (75% of occupants awake) 6 min–8 min (25% of occupants sleeping) |
Appendix B
Demographic breakdown of occupants per floor in scenario building.
| 1st Floor | 2nd Floor | 3rd Floor | 4th Floor | 5th Floor | 6th Floor | 7th Floor | 8th Floor | 9th Floor | 10th Floor | 11th Floor |
| 49 | 42 | 35 | 52 | 37 | 46 | 42 | 51 | 42 | 62 | 38 |
| 11% children | 8% children | 6% children | 11% children | 14% children | 3% children | 5% children | 12% children | 4% children | 5% children | 6% children |
| 14% females under 30 | 11% females under 30 | 7% females under 30 | 9% females under 30 | 19% females under 30 | 11% females under 30 | 8% females under 30 | 21% females under 30 | 7% females under 30 | 22% females under 30 | 20% females under 30 |
| 16% females aged 30–50 | 15% females aged 30–50 | 24% females aged 30–50 | 21% females aged 30–50 | 13% females aged 30–50 | 32% females aged 30–50 | 7% females aged 30–50 | 15% females aged 30–50 | 11% females aged 30–50 | 14% females aged 30–50 | 17% females aged 30–50 |
| 9% females above 50 | 26% females above 50 | 8% females above 50 | 4% females above 50 | 0% females above 50 | 4% females above 50 | 15% females above 50 | 0% females above 50 | 8% females above 50 | 13% females above 50 | 5% females above 50 |
| 17% males under 30 | 6% males under 30 | 12% males under 30 | 15% males under 30 | 16% males under 30 | 18% males under 30 | 12% males under 30 | 1% females above 50 and disabled | 10% males under 30 | 6% males under 30 | 14% males under 30 |
| 24% males aged 30–50 | 19% males aged 30–50 | 31% males aged 30–50 | 37% males aged 30–50 | 12% males aged 30–50 | 16% males aged 30–50 | 38% males aged 30–50 | 28% males under 30 | 40% males aged 30–50 | 17% males aged 30–50 | 26% males aged 30–50 |
| 9% males above 50 | 15% males above 50 | 12% males above 50 | 3% males above 50 | 23% males above 50 | 16% males above 50 | 13% males above 50 | 18% males aged 30–50 | 19% males above 50 | 21% males above 50 | 12% males above 50 |
| 3% ales above 50 and disabled | 2% males above 50 and disabled | 5% males above 50 | 1% males above 50 and disabled | 2% males above 50 and disabled |
References
- Wang, S.-H.; Wang, W.-C.; Wang, K.-C.; Shih, S.-Y. Applying Building Information Modeling to support Fire Safety Man-agement. Autom. Constr. 2015, 35, 158–167. [Google Scholar] [CrossRef]
- National Fire Protection Association. National Electrical Code; National Fire Protection Association: Quincy, MA, USA, 2016. [Google Scholar]
- Kavilkar, R.; Patil, S. Study of High Rise Residential Buildings in Indian Cities (A Case Study–Pune City). Int. J. Eng. Technol. 2014, 6, 86–90. [Google Scholar] [CrossRef] [Green Version]
- Hackitt, J. Building a Safer Future. Independent Review of Building Regulations and Fire Safety: Final Report 2017. Available online: https://bit.ly/2SXRZyf (accessed on 2 November 2019).
- Shildrick, T. Lessons from Grenfell: Poverty propaganda, stigma and class power. Sociol. Rev. 2018, 66, 783–798. [Google Scholar] [CrossRef] [Green Version]
- Hassanain, M.A. On the challenges of evacuation and rescue operations in high-rise buildings. Struct. Surv. 2009, 27, 109–118. [Google Scholar] [CrossRef]
- Qianli, M.; Wei, G. Discussion on the Fire Safety Design of a High-Rise Building. International Symposium on Safety Sci-ence and Technology. Procedia Eng. 2012, 45, 685–689. [Google Scholar]
- Ronchi, E.; Nilsson, D. Fire evacuation in high-rise buildings: A review of human behaviour and modelling research. Fire Sci. Rev. 2013, 2, 7. [Google Scholar] [CrossRef] [Green Version]
- Kobes, M.; Helsloot, I.; Vries, B.D.; Post, J. Exit Choice, (Pre)-movement time and (Pre)-evacuation beahviour in hotel fire evacuation-behavioural analysis and validation of the use of serious gaming in experimental research. Procedia Eng. 2010, 3, 37–51. [Google Scholar] [CrossRef] [Green Version]
- Kuligowski, E.D. Human Behaviour in Fire. In SFPE Handbook of Fire Protection Engineering, 5th ed.; Harley, M.J., Ed.; Springer: Berlin/Heidelberg, Germany, 2016. [Google Scholar]
- Kobes, M.; Post, J.; Helsot, I.; Vries, B.D. Fire Risk of High-Rise Building based on Human Behaviour in Fire. In Proceedings of the First Interna-tional Conference on Fire Safety of High-Rise Buildings, Bucharest, Romania, 7–9 May 2008. [Google Scholar]
- Groner, N.E. A Decision Model for Recommending Which Building Occupants Should Move where during Fire Emergen-cies. Fire Saf. J. 2016, 80, 20–29. [Google Scholar] [CrossRef] [Green Version]
- Yenumula, K.; Kolmer, C.; Pan, J.; Su, X. BIM-controlled signage system for building evacuation. Procedia Eng. 2015, 118, 284–289. [Google Scholar] [CrossRef] [Green Version]
- Xie, Q.; Wang, P.; Li, S.; Wang, J.; Lo, S.; Wang, W. An uncertainty analysis method for passenger travel time under ship fires: A coupling technique of nested sampling and polynomial chaos expansion method. Ocean Eng. 2020, 195, 106604. [Google Scholar] [CrossRef]
- El mostafa Bourhim, R.T.; Cherkaoui, R.T.A. Efficacy of Virtual Reality for Studying People’s Pre-evacuation Behavior under Fire. Int. J. Hum. Comput. Stud. 2020, 142, 102484. [Google Scholar] [CrossRef]
- Rehman, A.U.; Lyche, T.; Awuah-Offei, K.; Nadendla, V. Effect of text message alerts on miners evacuation decisions. Saf. Sci. 2020, 130, 104875. [Google Scholar] [CrossRef]
- Succar, B. Building information modelling framework: A research and delivery foundation for industry stakeholders. Autom. Constr. 2009, 18, 357–375. [Google Scholar] [CrossRef]
- Eastman, C.; Teicholz, P.; Sacks, R.; Liston, K. BIM Handbook, A Guide to Building Instructions Modelling for Owners, Managers, Designers, Engineers, and Contractors, 2nd ed.; John Wiley and Sons: Hoboken, NJ, USA, 2011. [Google Scholar]
- Spearpoint, M. Extracting fire engineering simulation data from the IFC building information model. In Handbook of Re-search on Building Information Modeling and Construction Informatics: Concepts and Technologies; IGI Global: Hershey, PA, USA, 2010. [Google Scholar]
- Boguslawski, P.; Mahdjoubi, L.; Zverovich, V.; Fadli, F.; Barki, H. BIM-GIS modelling in support of emergency response applications. Build. Inf. Model. (BIM) Des. Constr. Oper. 2015, 149, 381. [Google Scholar]
- Wang, K.C.; Shih, S.Y.; Chan, W.S.; Wang, W.C.; Wang, S.H.; Gansonre, A.A.; Liu, J.J.; Lee, M.T.; Cheng, Y.Y.; Yeh, M.F. Ap-plication of building information modeling in designing fire evacuation-a case study. In Proceedings of the International Symposium on Automation and Robotics in Construction; IAARC Publications: Sydney, Australia, 2014; Volume 31, p. 1. [Google Scholar]
- Cheng, M.-Y.; Chiu, K.-C.; Hsieh, Y.-M.; Yang, I.-T.; Chou, J.-S.; Wu, Y.-W. BIM integrated smart monitoring technique for building fire prevention and disaster relief. Autom. Constr. 2017, 84, 14–30. [Google Scholar] [CrossRef]
- Sun, Q.; Turkan, Y. A-BIM Based Simulation Framework for Fire Evacuation Planning. In Advances in Informatics and Computing in Civil and Construction Engineering; Mutis, I., Hartmann, T., Eds.; Springer: Berlin/Heidelberg, Germany, 2019. [Google Scholar]
- Mirahadi, F.; McCabe, B.; Shahi, A. IFC-centric performance-based evaluation of building evacuations using fire dynamics simulation and agent-based modeling. Autom. Constr. 2019, 101, 1–16. [Google Scholar] [CrossRef]
- Chen, X.-S.; Liu, C.-C.; Wu, I.-C. A BIM-based visualization and warning system for fire rescue. Adv. Eng. Inform. 2018, 37, 42–53. [Google Scholar] [CrossRef]
- Li, N.; Becerik-Gerber, B.; Krishnamachari, B.; Soibelman, L. A BIM centered indoor localization algorithm to support building fire emergency response operations. Autom. Constr. 2014, 42, 78–89. [Google Scholar] [CrossRef]
- Eftekharirad, R.; Nik-Bakht, M.; Hammad, A. Linking Sensory data to BIM by Extending IFC—Case Study of Fire Evacuation. In ECPPM 2018, eWork and eBusniess in Architecture, Engineering, and Construction; Karlshoj, J., Scherer, R., Eds.; CRC Press: Copenhagen, Denmark, 2018. [Google Scholar] [CrossRef]
- Dimyadi, J.A. Generating FDS Fire Simulation Input Using IFC-Based Building Information Model; University of Canterbury: Christchurch, New Zealand, 2007. [Google Scholar]
- Dimyadi, J.; Spearpoint, M.; Amor, R. Sharing building information using the IFC data model for FDS fire simula-tion. Fire Saf. Sci. 2008, 9, 1329–1340. [Google Scholar] [CrossRef] [Green Version]
- Dimyadi, J.; Solihin, W.; Amor, R. Using IFC to support enclosure fire dynamics simulation. In Workshop of the European Group for Intelligent Computing in Engineering; Springer: Cham, Switzerland, 2018; pp. 339–360. [Google Scholar]
- Rüppel, U.; Schatz, K. Designing a BIM-based serious game for fire safety evacuation simulations. Adv. Eng. Inform. 2011, 25, 600–611. [Google Scholar] [CrossRef]
- Cheng, J.C.; Gan, V.J. Integrating agent-based human behavior simulation with building information modeling for build-ing design. Int. J. Eng. Technol. 2013, 5, 473. [Google Scholar] [CrossRef] [Green Version]
- Shi, J.; Liu, P. An Agent-Based Evacuation Model to Support Fire Safety Design Based on an Integrated 3D GIS and BIM Platform. Comput. Civ. Build. Eng. 2014, 1893–1900. Available online: https://ascelibrary.org/doi/abs/10.1061/9780784413616.235 (accessed on 23 April 2021).
- Wang, B.; Li, H.; Rezgui, Y.; Bradley, A.; Ong, H.N. BIM Based Virtual Environment for Fire Emergency Evacuation. Sci. World J. 2014, 2014, 1–22. [Google Scholar] [CrossRef]
- Feng, Z.; González, V.A.; Mutch, C.; Amor, R.; Rahouti, A.; Baghouz, A.; Cabrera-Guerrero, G. Towards a customizable im-mersive virtual reality serious game for earthquake emergency training. Adv. Eng. Inform. 2020, 46, 101134. [Google Scholar] [CrossRef]
- Thornton, C.; O’Konski, R.; Hardeman, B.; Swenson, D. Pathfinder: An agent-based egress simulator. In Pedestrian and Evacuation Dynamics; Springer: Boston, MA, USA, 2011; pp. 889–892. [Google Scholar]
- Qin, J.; Liu, C.; Huang, Q. Simulation on fire emergency evacuation in special subway station based on Pathfinder. Case Stud. Therm. Eng. 2020, 21, 100677. [Google Scholar] [CrossRef]
- Long, X.; Zhang, X.; Lou, B. Numerical simulation of dormitory building fire and personnel escape based on Pyrosim and Pathfinder. J. Chin. Inst. Eng. 2017, 33, 1–10. [Google Scholar] [CrossRef]
- Straková, J.; Pártlová, P.; Váchal, J. Logistics principles for the emergency evacuation of people. Naše More Znan. Stručni Časopis Za More Pomor. 2016, 63, 217–222. [Google Scholar]
- Campbell, M.J.; Page, W.G.; Dennison, P.E.; Butler, B.W. Escape route index: A spatially-explicit measure of wildland fire-fighter egress capacity. Fire 2019, 2, 40. [Google Scholar] [CrossRef] [Green Version]
- Tavares, R.M.; Ronchi, E. Uncertainties in Evacuation Modelling: Current Flaws and Future Improvements. In Interscience Communications; Boyce, K., Ed.; 2015; pp. 185–196. Available online: https://www.researchgate.net/profile/Rodrigo-Tavares-8/publication/283072361_Uncertainties_in_evacuation_modelling_Current_flaws_and_future_improvements/links/569cdcca08ae2f0bdb8c3512/Uncertainties-in-evacuation-modelling-Current-flaws-and-future-improvements.pdf (accessed on 23 April 2021).
- Ronchi, E.; Reneke, P.A.; Peacock, R.D. A Method for the Analysis of Behavioural Uncertainty in Evacuation Modelling. Fire Technol. 2014, 50, 1545–1571. [Google Scholar] [CrossRef]
- Proulx, G. Evacuation time and movement in apartment buildings. Fire Saf. J. 1995, 24, 229–246. [Google Scholar] [CrossRef]
- Proulx, G.; Fahy, R.F. The Time Delay to start Evacuation; Review of Five Scenario Studies. Fire Saf. Sci. 1997, 5, 783–794. [Google Scholar]
- Guanquan, C.; Jinhua, S. The Effect of Pre-movement Time and Occupant Density on Evacuation Time. J. Fire Sci. 2006, 24, 237–259. [Google Scholar] [CrossRef]
- Golmohammadi, D.; Shimshak, D. Estimation of the evacuation time in an emergency situation in hospitals. Comput. Ind. Eng. 2011, 61, 1256–1267. [Google Scholar] [CrossRef]
- Liu, M.; Lo, S.M. The Quantitative Investigation on people’s Pre-Evacuation Behaviour under Fire. Autom. Constr. 2011, 20, 620–628. [Google Scholar] [CrossRef]
- Mu, H.L.; Wang, J.H.; Mao, Z.L.; Sun, J.H.; Lo, S.M.; Wang, Q.S. Pre-evacuation human reactions in fires: An attribution analysis considering psychological process. Procedia Eng. 2013, 52, 290–296. [Google Scholar]
- International Maritime Organization. Revised Guidelines on Evacuation Analysis for New and Existing Passenger Ships; International Maritime Organizatio: London, UK, 2016. [Google Scholar]
- Pathfinder. Technical Reference; Thunderhead Engineering: Manhattan, NY, USA; Available online: https://www.thunderheadeng.com/files/com/pathfinder/tech_ref.pdf (accessed on 1 April 2021).
Figure 1.
Building models: (a) ground floor plan, (b) plan of upper floors, (c) 3D Revit model, (d) 3D Pathfinder model, (e) emergency exit, (f) main entrance and second entrance.
Figure 1.
Building models: (a) ground floor plan, (b) plan of upper floors, (c) 3D Revit model, (d) 3D Pathfinder model, (e) emergency exit, (f) main entrance and second entrance.

Figure 2.
An evacuation flow model based on defined scenarios and human behaviour [4].
Figure 2.
An evacuation flow model based on defined scenarios and human behaviour [4].


Table 1.
Total number of occupants on each floor.
| Floor Level | Number of Occupants |
|---|---|
| Ground Floor | 11 |
| 1st Floor | 49 |
| 2nd Floor | 42 |
| 3rd Floor | 35 |
| 4th Floor | 53 |
| 5th Floor | 37 |
| 6th Floor | 46 |
| 7th Floor | 42 |
| 8th Floor | 51 |
| 9th Floor | 43 |
| 10th Floor | 62 |
| 11th Floor | 38 |
| Total | 509 |
Table 2.
Walking speed of demographic groups on a flat terrain [49].
Table 2.
Walking speed of demographic groups on a flat terrain [49].
| Population Group, Passengers | Walking Speed on Flat Terrain (e.g., Corridors) | |
|---|---|---|
| Minimum (m/s) | Maximum (m/s) | |
| Females younger than 30 years | 0.93 | 1.55 |
| Females 30–50 years old | 0.71 | 1.19 |
| Females older than 50 years | 0.56 | 0.94 |
| Females older than 50, mobility impaired (1) | 0.43 | 0.71 |
| Females older than 50, mobility impaired (2) | 0.37 | 0.61 |
| Males younger than 30 years | 1.11 | 1.85 |
| Males 30–50 years old | 0.97 | 1.62 |
| Males older than 50 years | 0.84 | 1.4 |
| Males older than 50, mobility impaired (1) | 0.64 | 1.06 |
| Males older than 50, mobility impaired (2) | 0.55 | 0.91 |
Table 3.
Summary of evacuation times for 12 simulations done for 8 different scenarios.
| Scenario 1 | Scenario 2 | Scenario 3 | Scenario 4 | Scenario 5 | Scenario 6 | Scenario 7 | Scenario 8 | |
|---|---|---|---|---|---|---|---|---|
| Simulation 1 | 37.40 | 21.34 | 19.10 | 20.04 | 19.42 | 18.46 | 20.25 | 20.55 |
| Simulation 2 | 36.52 | 21.51 | 19.35 | 20.09 | 20.11 | 18.33 | 19.11 | 20.31 |
| Simulation 3 | 35.22 | 21.38 | 19.22 | 20.45 | 20.57 | 19.26 | 20.12 | 20.52 |
| Simulation 4 | 36.27 | 20.59 | 19.25 | 19.59 | 20.51 | 17.57 | 19.56 | 20.46 |
| Simulation 5 | 37.21 | 22.19 | 20.26 | 20.42 | 20.46 | 19.37 | 19.32 | 21.16 |
| Simulation 6 | 36.37 | 21.46 | 18.53 | 20.02 | 19.55 | 20.08 | 20.48 | 21.10 |
| Simulation 7 | 35.43 | 22.36 | 20.06 | 20.12 | 21.03 | 18.09 | 20.13 | 20.48 |
| Simulation 8 | 37.20 | 21.54 | 20.32 | 19.29 | 21.13 | 17.55 | 20.27 | 21.13 |
| Simulation 9 | 36.07 | 21.31 | 19.28 | 19.17 | 20.18 | 18.25 | 20.30 | 21.02 |
| Simulation 10 | 35.26 | 20.21 | 18.55 | 20.16 | 20.30 | 18.19 | 20.56 | 20.50 |
| Simulation 11 | 36.25 | 20.48 | 20.22 | 19.54 | 21.05 | 19.52 | 20.42 | 20.43 |
| Simulation 12 | 35.48 | 21.06 | 19.07 | 19.36 | 21.19 | 19.13 | 20.21 | 21.12 |
| AVERAGE | 36.223 | 21.286 | 19.434 | 19.854 | 20.458 | 18.650 | 20.061 | 20.732 |
| MINIMUM | 35.22 | 20.21 | 18.53 | 19.17 | 19.42 | 17.55 | 19.11 | 20.31 |
| MAXIMUM | 37.40 | 22.36 | 20.32 | 20.45 | 21.19 | 20.08 | 20.56 | 21.16 |
Table 4.
Time spent by the first and last occupants through each route for Scenario 1 in Simulation 1.
Table 4.
Time spent by the first and last occupants through each route for Scenario 1 in Simulation 1.
| First In (Time) | Last Out (Time) | |
|---|---|---|
| Main Entrance | 195.0 (3.25 min) | 2260 (37.6 min) |
| Second Entrance | 202.6 (3.37 min) | 1721.5 (28.7 min) |
| Emergency Exit | 189.5 (3.15 min) | 725.0 (12.08 min) |
Table 5.
Time spent by the first and last occupants for Scenario 2 in Simulation 7.
| First In (Time) | Last Out (Time) | |
|---|---|---|
| Main Entrance | 229.6 (9.82 min) | 1356.0 (22.6 min) |
| Second Entrance | 227.4 (3.79 min) | 1172.4 (19.54 min) |
| Emergency Exit | 227.7 (3.8 min) | 675.7 (11.26 min) |
Table 6.
Time spent by the first and last occupants for Scenario 3 in Simulation 8.
| First In (Time) | Last Out (Time) | |
|---|---|---|
| Main Entrance | 245.3 (4.08 min) | 1231.8 (20.53 min) |
| Second Entrance | 223.7 (3.72 min) | 1037.8 (17.29 min) |
| Emergency Exit | 227.7 (3.80 min) | 623.7 (10.39 min) |
Table 7.
Time spent by the first and last occupants for Scenario 6 in Simulation 6.
| First In (Time) | Last Out (Time) | |
|---|---|---|
| Main Entrance | 217.9 (3.63 min) | 1055.4 (17.59 min) |
| Second Entrance | 220.6 (3.67 min) | 908.0 (15.13 min) |
| Emergency Exit | 198.5 (3.30 min) | 1208.7 (20.14 min) |
Table 8.
Time spent by the first and last occupants for Scenario 8 in Simulation 5.
| First In (Seconds) | Last Out (Seconds) | |
|---|---|---|
| Main Entrance | 203.5 (3.39 min) | 1113.7 (18.56 min) |
| Second Entrance | 201.4 (3.35 min) | 1018.0 (16.96 min) |
| Emergency Exit | 216.4 (3.60 min) | 1276.7 (21.27 min) |
Table 9.
Ranking of scenarios (3–8) based on average time from 12 simulations.
| Scenario | Ranking | Average Time (minutes) |
|---|---|---|
| Scenario 6 | 1st | 18.650 |
| Scenario 3 | 2nd | 19.434 |
| Scenario 4 | 3rd | 19.854 |
| Scenario 7 | 4th | 20.061 |
| Scenario 5 | 5th | 20.485 |
| Scenario 8 | 6th | 20.732 |
Publisher’s Note: MDPI stays neutral with regard to jurisdictional claims in published maps and institutional affiliations. |
© 2021 by the authors. Licensee MDPI, Basel, Switzerland. This article is an open access article distributed under the terms and conditions of the Creative Commons Attribution (CC BY) license (https://creativecommons.org/licenses/by/4.0/).
Share and Cite
MDPI and ACS Style
Gerges, M.; Demian, P.; Adamu, Z. Customising Evacuation Instructions for High-Rise Residential Occupants to Expedite Fire Egress: Results from Agent-Based Simulation. Fire 2021, 4, 21. https://0-doi-org.brum.beds.ac.uk/10.3390/fire4020021
AMA Style
Gerges M, Demian P, Adamu Z. Customising Evacuation Instructions for High-Rise Residential Occupants to Expedite Fire Egress: Results from Agent-Based Simulation. Fire. 2021; 4(2):21. https://0-doi-org.brum.beds.ac.uk/10.3390/fire4020021
Chicago/Turabian StyleGerges, Michael, Peter Demian, and Zulfikar Adamu. 2021. "Customising Evacuation Instructions for High-Rise Residential Occupants to Expedite Fire Egress: Results from Agent-Based Simulation" Fire 4, no. 2: 21. https://0-doi-org.brum.beds.ac.uk/10.3390/fire4020021