Article

Atmospheric Trends of CO and CH4 from Extreme Wildfires in Portugal Using Sentinel-5P TROPOMI Level-2 Data

1
Department of Physics, NOVA School of Science and Technology, NOVA University Lisbon, 2829-516 Caparica, Portugal
2
CENSE—Center for Environmental and Sustainability Research, Department of Environmental Sciences and Engineering, NOVA School of Science and Technology, NOVA University Lisbon, 2829-516 Caparica, Portugal
3
Centre for Applied Ecology “Professor Baeta Neves” (CEABN), InBIO, School of Agriculture, University of Lisbon, 1349-017 Lisbon, Portugal
4
Centro de Química Estrutural, Faculdade de Ciências, Universidade de Lisboa, 1749-016 Lisboa, Portugal
5
Departamento de Química e Bioquímica, Faculdade de Ciências, Universidade de Lisboa, 1749-016 Lisboa, Portugal
*
Authors to whom correspondence should be addressed.
Submission received: 30 March 2021 / Revised: 26 April 2021 / Accepted: 29 April 2021 / Published: 5 May 2021

Abstract

:
Large forest fires have repeatedly affected Europe, in particular the Mediterranean countries. It is now crucial to continue the effort to feed the several layers of prediction models and understand how wildfire spreads in order to develop modern preventative and mitigation methods. The present study evaluates the performance of Sentinel 5-P TROPOMI for the monitoring of carbon monoxide (CO) and methane (CH4) during extreme fire events in Portugal, focusing on the Monchique (2018) and Vila de Rei/Mação (2019) wildfires, which devastated 27,154 ha and 9249 ha, respectively. The spatial distribution and trend of CO and CH4 prior to, during, and following the fire event were accessed and linked with in situ data in a qualitative and quantitative exploration. Large CO plumes were observed with CO columns exceeding 4.5 × 10¹⁸ and 6 × 10¹⁸ molecules/cm2 on 21 July 2019, and 7 August 2018, respectively. CO distribution profiles after consecutive digital processing steps showed the ability to follow CO fluctuations according to the fire spread. Furthermore, statistically significant differences were found between CO emissions inside and outside the burning area in both fire events. Finally, the CO2 estimated through CO column data presented an emission of 7.6 × 10¹⁹ molecules/cm2 for the uppermost emission day on 7 August 2018. Although CH4 monitoring is still unwavering to draw exact conclusions, the CO patterns during extreme fire events show promising and consistent data when compared with in situ data.

1. Introduction

Forests cover over a third of the total land area of Europe [1]. Climate change is drastically intensifying the threats to the forests, which are more pronounced in the Mediterranean climate-intense rain in winter and drier summers [2]. Such factors foster higher levels of vegetation growth and the accumulation of fuel, which both contribute to extreme wildfires. The environmental impact of events between 2000 and 2017 in Europe resulted in losses of 8.5 million burned ha, approximately 480,000 ha/year [3]. In Portugal’s mainland territory, the burned area in 2018 and 2019 amounted to 44,578 ha and 42,084 ha, respectively, according to the Forest Fires in Europe, Middle East and North Africa report for 2018 and 2019 [4,5]. In terms of economic fire impact on the most affected countries, Portugal, for example, may see an increase in losses of over EUR 5 billion/year by 2070–2100 (2.4% of Portugal GDP in 2019, Instituto Nacional de Estatística, INE data).
According to the European Commissioner for Research, Science and Innovation in 2018 [3], “Making the wealth of knowledge and the implications of such knowledge available to develop forest fires risk mitigation strategies is a pre-requisite to implementing adequate policies and to better protecting European citizens, the economy and the environment against megafires.” Environmental changes, in particular, drainage and forest clearing, threaten the stability of forests [6], making them susceptible to wildfire events. Wildfires are one of the most significant disturbances to land ecosystems on a regional and global scale, and generate large quantities of critical greenhouse gases [7]. Extreme wildfires are a major hazard throughout Europe; however, these events are not fully understood. The current models of wildfire spread are still not sufficiently robust to effectively explain the fire’s behavior. Therefore, increasing the resilience and knowledge of society as far as these extreme events are concerned by taking advantage of new technologies such as satellites to gather new and critical data is pivotal to building science-based forest fire management strategies and for risk-informed decision-making.
Wildland fires emit large amounts of trace gases and particles [8,9,10,11] and these emissions are believed to significantly influence the chemical composition of the atmosphere [12,13] and the earth’s climate system. Combustion is a chemical process that results in the oxidation and breakdown of organic matter from living and dead vegetation. The wide variety of pollutants released by wildfires, due to complete or incomplete combustion, include greenhouse gases, carbon dioxide (CO2) [14], methane (CH4), and photochemically reactive compounds such as carbon monoxide (CO) [15]. In particular, the lifespan of CH4 in the atmosphere is much shorter than that of CO2; however, CH4 is more efficient at trapping radiation than CO2. The comparative impact of CH4 is 25 times greater than CO2 over a 100-year period [16]. On the other hand, CO is a trace gas in the atmosphere that does not have a direct effect on the global temperature, as does methane; nonetheless, CO plays a major role in atmospheric chemistry, and it affects the ability of the atmosphere to cleanse itself of many other polluting gases and combined with other pollutants and solar radiation, it also takes part in the formation of lower-atmospheric ozone and urban smog. Thus, to enable the development of a mechanistic understanding of the changing role of these drivers (extreme wildfires and their by-product gases) and their impact on atmospheric composition, long-term wildfire records are needed. Satellites are important in improving the knowledge regarding fire events. They are commonly used after the fire to measure the burned area and fire severity, but are also useful to record smoke and gas emissions during the fire, to provide information on firefighting hazards [17], to predict fire danger, to map fuels, to monitor fire dynamics [18], and to assess air quality. Many of these objectives are better achieved by merging satellite information and in situ data [19].
Global Monitoring for Environment and Security (GMES) is a joint initiative of the European Community (EC) and the European Space Agency (ESA). The overall objective of the GMES initiative is to support Europe’s goals regarding sustainable development and the global governance of the environment by providing timely and high-quality data, information, services, and knowledge. The Sentinel-5 Precursor (S5-P) mission is applicable for further integration of the air quality and climate issues at policy level [20]. The S5-P mission is a single-payload satellite in a low Earth orbit that provides daily global information on concentrations of trace gases and aerosols that are important for air quality [10]. The payload of the mission is the TROPOspheric Monitoring Instrument (TROPOMI). TROPOMI is a spectrometer with spectral bands in ultraviolet, visible, near-infrared, and shortwave infrared (SWIR). The selected wavelength range for TROPOMI allows for observation of key atmospheric constituents, including ozone, nitrogen dioxide (NO2), carbon monoxide (CO), sulfur dioxide, methane (CH4), formaldehyde, aerosols, and clouds [21]. In addition to other objectives, the S5-P TROPOMI holds the understanding of the atmospheric chemistry related to climate and the chemistry–long-term observational records that are essential to validating the new generation of climate and Earth system models [20]. Recent studies have shown the potential of TROPOMI for various pollutant emissions. Lama et al. [22] investigated the use of co-located NO2 and CO retrievals from the TROPOMI satellite to improve the quantification of burning efficiency and emission factors over different megacities. Additionally, Rooney et al. [23] conducted a comprehensive investigation of air quality impacts, regarding PM2.5 emissions on the Camp Fire using a combined analysis of ground-based and space-borne observations and WRF-Chem simulations. A year after, Van der Velde et al. [24] examined different fire-prone regions around the world by means of an analysis of the biomass burning pollutants through the column measurements of nitrogen dioxide and carbon monoxide provided by TROPOMI, by using space-borne data to investigate the spatiotemporal efficiency of fire combustion.
On this basis, it is key to understand that the increase in CH4 concentrations, which may be attributed to the increased tropospheric ozone observed in the 20th century [25], and the transformation of gaseous precursors (e.g., CO) into radiative active constituents, are still poorly quantified. Further insights into these transformation processes are needed to link the climate impact of the primary forcing agents to mitigation options that are related to the gaseous precursor emissions [20]. Hence, to tackle such challenges, the aim of this study is to ascertain the potential of the S5-P TROPOMI satellite for the monitoring and supervision of CO and CH4 during wildfire events toward the analysis of (i) Level-2 data products and (ii) their connection with in situ data. Its potentiality is discussed for two particular Portuguese extreme wildfires: Monchique in 2018 and Vila de Rei/Mação in 2019.

2. Materials and Methods

2.1. Wildfire Areas and In Situ Data

Table 1 presents the geographical fire starting points and the Sentinel 3 satellite images during a day when the fire occurred, and the total burned area following both wildfires. Both days were chosen as those on which either sufficient satellite information was contained or when the size of the fire was significant.
The in situ data was obtained from the Independent Technical Observatory report for the Monchique and Vila de Rei/Mação Fires Assessment [26,27], the preparation of which was carried out by some of the authors of this paper.
According to these reports, the Monchique wildfire began on 3 August and was extinguished on 9 August. The Monchique area, in particular Serra de Monchique, is characterized by a Mediterranean climate surrounded by eucalyptus (Eucalyptus globulus) (40%) and shrubs (40%), reflecting its high propensity to wildfires (Figure S1 in the supplementary data) and as expected, affected the spread of the Monchique fire. The wildfire started to spread to the west, on the left bank of the Ribeira de Odelouca, where it was limited by low fuel accumulated as a consequence of a significant wildfire in 2016 (a more detailed description of the area and wildfire details is available in the Monchique Fire Assessment report [24]).
Regarding the Vila de Rei/Mação wildfire, the fire began on 21 July and was extinguished on 23 July. The burned area was characterized as a homogeneous landscape with 95% of the area occupied by pine (Pinus pinaster) and eucalyptus (Eucalyptus globulus) (4000 ha) in a Mediterranean climate environment Thus, the Vila de Rei/Mação fire spread and behavior were also affected by fuel management (Figure S2 in the supplementary data), resulting in Mação presenting 55% of the burned area with low severity, where the corresponding values for Vila de Rei were 22% (a more detailed description of the area and wildfire details is available in the Vila de Rei/Mação Fire Assessment report [25]).

2.2. Sentinel-5 P TROPOMI

The Sentinel-5 Precursor (S5-P), launched on 13 October 2017, is the first Copernicus mission to monitor the atmosphere [28]. The TROPOMI (TROPOspheric Monitoring Instrument) spectrometer is on board the S5-P and measures ultraviolet, visible, and infrared earthshine radiances at high spectral resolution. The TROPOMI maps the global atmosphere at a spatial resolution of 7 × 7 km2 (across × along track; 7 × 5.5 km2 since 6 August 2019) [28]. This allows the resolution of fine details, including the detection of much smaller gas plumes. The satellite carries the most advanced TROPOMI instrument for measuring ultraviolet-visible (270–500 nm), near-infrared (675–775 nm), and shortwave infrared (SWIR) (2305–2385 nm) spectral bands, which means it can image different air pollutants such as CH4 and CO [28]. For SWIR bands, the spatial resolution of the nadir measurements are almost 40 times finer than for SCIAMACHY [29]. TROPOMI retrieves the global CO abundance, exploiting clear-sky and cloudy-sky Earth radiance measurements in the 2.3 µm spectral range of the SWIR (2305–2385 nm; pixel size 7 × 7 km2) part of the solar spectrum [30]. TROPOMI clear sky observations provide total CO columns with sensitivity to the tropospheric boundary layer. For cloudy atmospheres, the column sensitivity changes according to the light path [30]. To monitor CH4 abundances in the Earth’s atmosphere, TROPOMI uses absorption information from the Oxygen-A band (760nm) and the SWIR spectral (2305–2385 nm; pixel size 7 × 7 km2) range [31].
To analyze CO and CH4 in the two wildfires under study, level-2 data from S5-P TROPOMI were selected, covering the period from 27 July to 19 August 2018, and 12 July to 3 August 2019, in a matrix area of 77 × 77 km2. For both CO and CH4, errors in data acquisition resulted in data gaps and therefore missing data for some days in the analyzed period. Along with the discussion, the data regarding CO was presented either in mol/m2 or in molecule/cm2 (using the multiplication factor = 6.02214 × 10¹⁹, suggested by [31]).

2.3. CO and CH4 Level-2 Data Analysis—Spatial Distribution and Trends

TROPOMI Offline or the reprocessing stream of CO column and XCH4 Level-2 datasets were imported (CSV format) using Panoply Software 4.11.6. Data files can be built in Panoply for data analysis and visualization.
Spatial distribution of the CO column and XCH4 were determined from the selected Level-2 data through an algorithm developed in MatLab version 2005b, with a number of consecutive digital processing steps, presented in Figure 1.
Thus, the CO and CH4 spatial distribution images were built from the starting geographical coordinate (Table 1 data) of each wildfire, enabling the observation of the fire’s orientation and consequently the plume of emissions for both gases. Furthermore, the CO column and XCH4 trends for pre-fire, during-fire, and post-fire were performed upon the geographical coordinate of the highest and lowest (to understand the wildfire disturbance) value observed during each wildfire, to apprehend whether Sentinel 5-P TROPOMI is capable of monitoring the sudden change in gas emissions when a forest fire begins and ends.

2.4. Spatio-Temporal Analysis

A spatio-temporal analysis was performed in an attempt to understand the influence of an extreme wildfire on CO emissions and dynamics through the S5-P TROPOMI measurements.
The areas under analysis were 77 × 77 km2 squares centered at points in the middle of the total area burned by two of the most significant wildfires in recent years: (1) the Monchique wildfire—lat. 37°17′55.644″ N, long. 8°30′35.064″ W and the Vila de Rei/Mação wildfire—lat. 39°45′5.688″ N, long. 8°3′26172″ W. The days considered in the analysis were chosen as those with more active area burning where satellite information was available: Monchique wildfire—6, 7, 8, and 9 August and Vila de Rei/Mação wildfire—21 July. The squared area was subdivided into 7 × 7 km2 cells corresponding to those where CO column data was available. These cells were overlaid with the burned area propagation map (Figures S3 and S4 in the supplementary data) to classify the cells as having active fire (1) or no active fire (0). The binary information on fire activity was graphically represented in a matrix in which the cells were also represented with a color scheme: lighter colors indicating lower CO emissions, darker colors representing higher CO emissions. A simplified scheme for this analysis is provided in Figure S5 in supplementary data.
The CO emissions of the burning cells and the surrounding background cells were statistically compared for each location and date by ANOVA analysis. The resulting F values and significance levels are provided for both the wildfires and dates.

2.5. Estimation of CO2 Emissions

The amount of CO2 released into the atmosphere during the two wildfires under study was estimated by combustion completeness, as proposed by Drysdale [32] and Ward et al. [33], which is based on the mole ratio of carbon released as CO2 to the sum of the moles of carbon released as CO2 and CO:
Modified   Combustion   Efficiency   ( MCE ) = mol   of   CO 2   mol   of   CO 2 +   mol   of   CO
For Equation (1), the MCE for wildfires with smoldering and/or flaming combustion yielded values between 0.75 and 0.92.

3. Results and Discussion

The influence of weather conditions on the spread of any wildfire is fundamental. In the initial attack phase and the first hours of the extended attack, there is a very sharp increase in the energy of the fire, corresponding to a rapid progression with a combined effect of the different factors: fuel, temperature, and wind [26,27]. The fuel consists of the vegetation in the area covered by the fire and influences the type of combustion during the wildfire event and, consequently, the CO and CH4 emissions [26]. The relative humidity of the air and, in turn, the humidity of the dead fine fuels, typically varies, unlike the temperature of the air. Finally, the wind, the most difficult feature to predict, varies temporally and spatially in its speed and direction, which normally determines the direction of the fire. However, in order to build a solid understanding of wildfire incidents not only requires consideration of these factors but also a body of knowledge correlating in situ and remote sensing data. In Zheng et al. [34], over the period of one year, the NO2 column concentration based on remote sensing was found to be strongly correlated (R2 = 0.72) with ground-based data provided by surface monitoring stations [35,36]. Accordingly, 
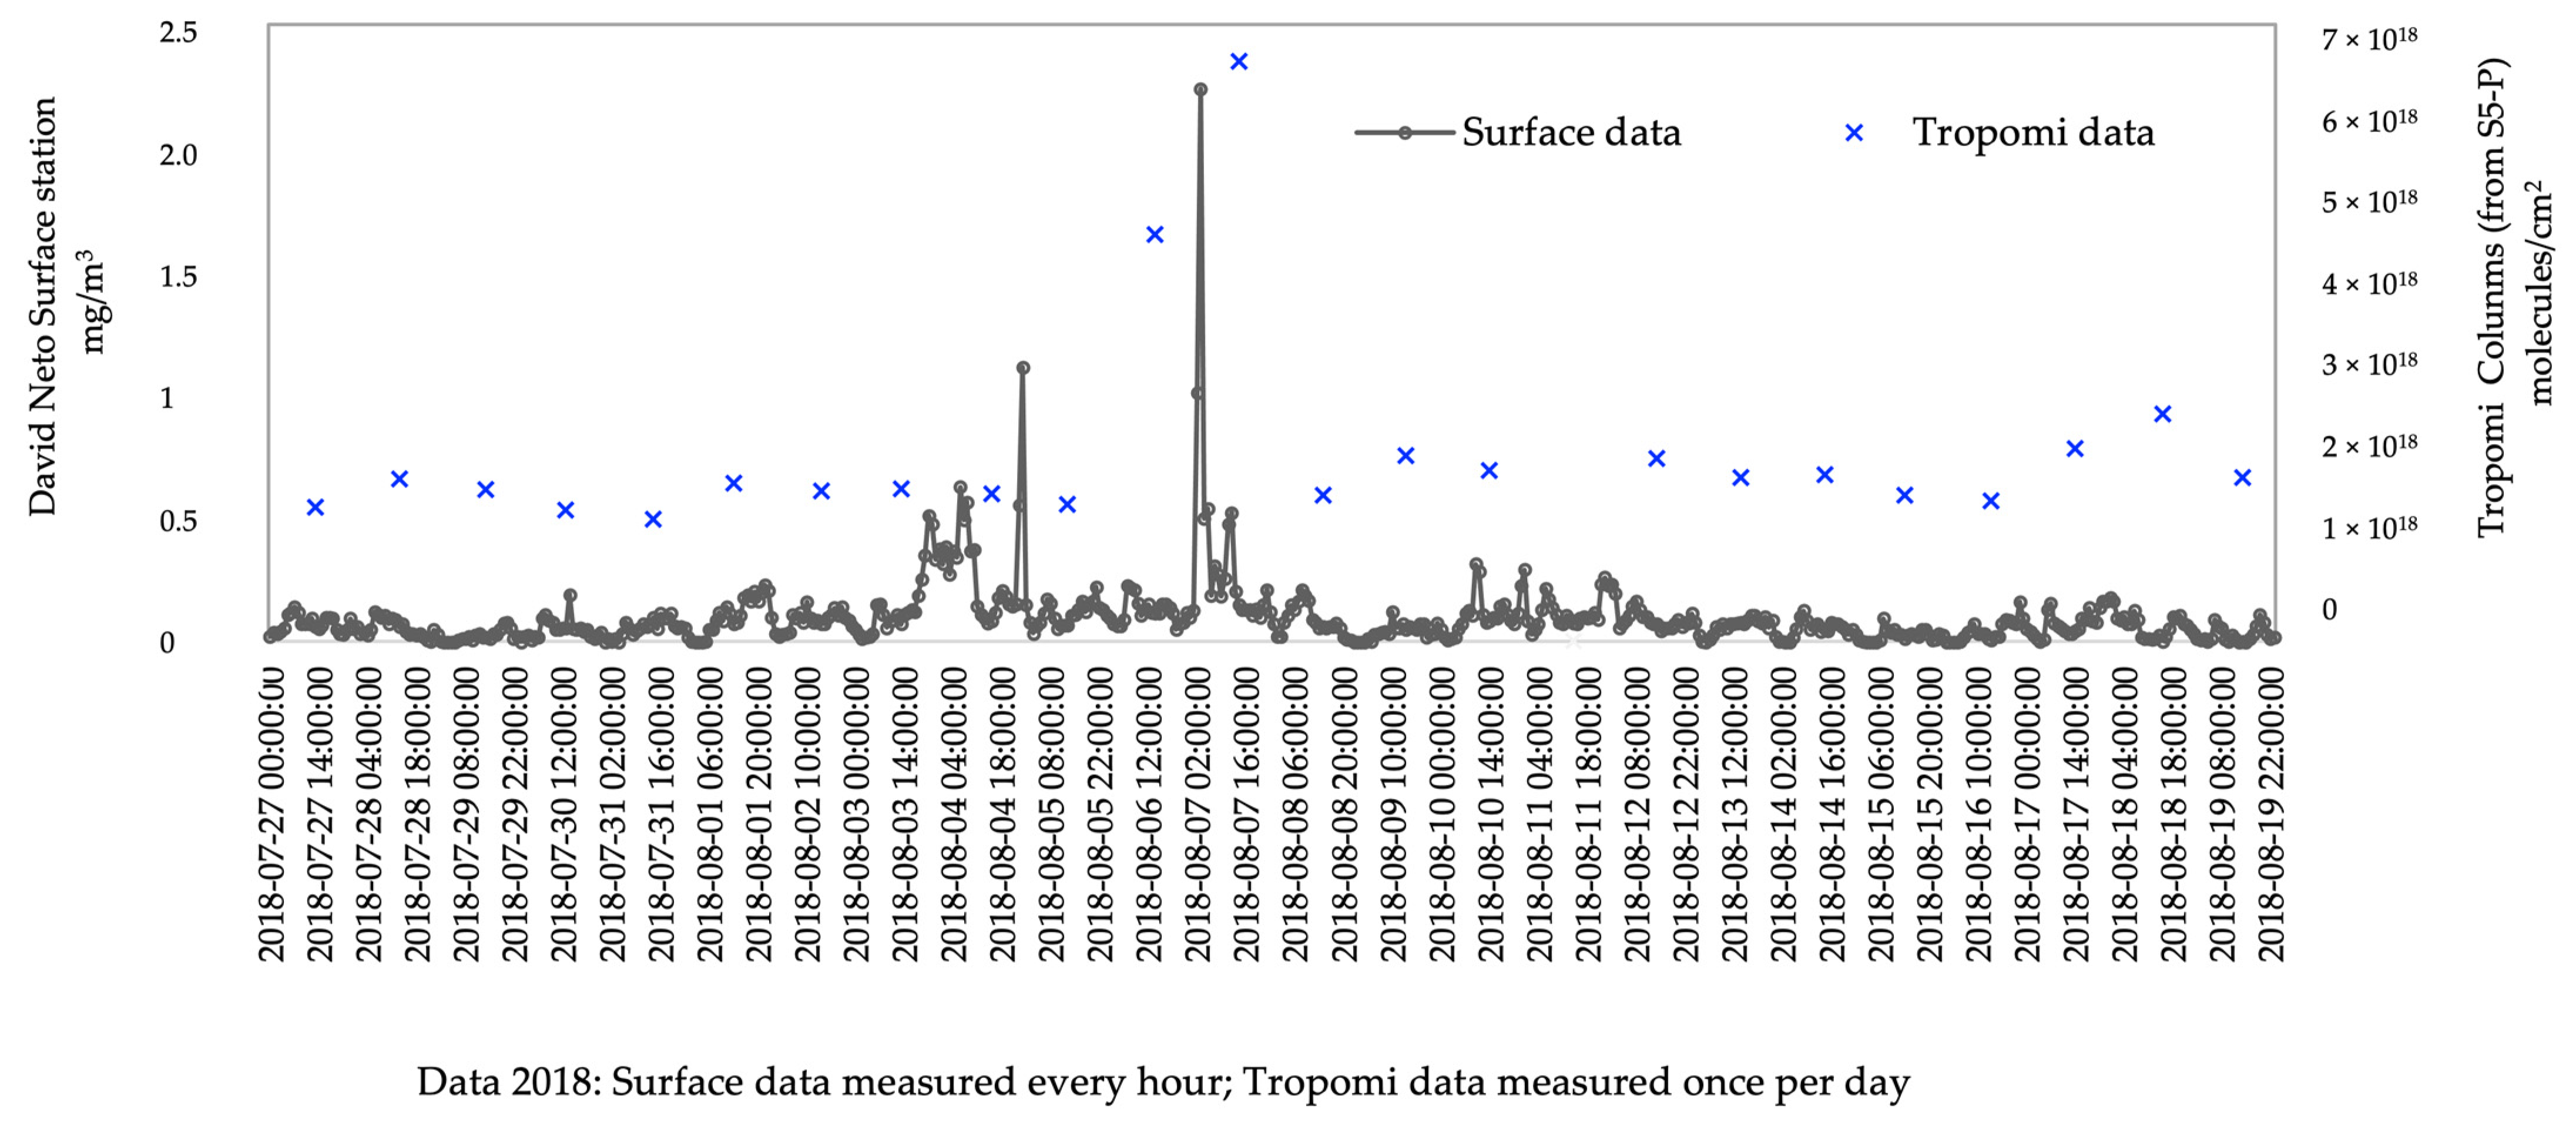
Figure 2 illustrates the CO pattern for S5-P TROPOMI and the measurements made by the surface monitoring station. The David Neto station, located in Portimão, Portugal (lat. 37°8′17.988″ N, long. 8°32′31.992″ W), is included in the matrix area (77 × 77 km2), and was therefore selected to validate the data provided by the satellite. It should be noted that as the results correspond to a short period (from 27 July to 19 August 2018), the coherence analysis of the Sentinel-5P TROPOMI CO data and the surface monitoring data is ancillary.
It is critical to emphasize that S5-P TROPOMI monitors the geolocated points of interest between 12:00 a.m. and 1:30 p.m. and the surface monitoring data is recorded hourly. Nonetheless, when the data was linked for the timeframe where the measurement corresponded to the overpassing time of the satellite, it was possible to observe a similar pattern in both surface and S5-P TROPOMI data, with a correlation of 50% (multiple R). This correlation shows that the accuracy of the S5-P TROPOMI CO measurements, even with fewer points (when compared to the surface data), was not compromised [37]. In Figure 2, a sharp increase for both datasets may be observed on the days of the fire, in particular between 6 and 7 August, the most intense days of fire.
Based on these observations (correlation coefficient and comparable CO emission trend), SP5-P TROPOMI appears to present possible potential to monitor and follow CO fluctuations in each of the fires under study. To evaluate this hypothesis, in the following sections, the Monchique and Vila de Rei/Mação wildfires were explored in consideration of the CO and CH4 spatial distribution, trends, and spatio-temporal analysis provided by S5-P TROPOMI.
Through these analyses, the retrieval uncertainty of CO column and XCH4 mean average were 0.0011 mol/m2 and 1.4697 ppb, respectively (the total CO column precision and XCH4 mixing ratio precision are in Table S1). It may be noted that for XCH4 the measurements presented a higher frequency of NaN when compared to the CO column data.

3.1. CO and CH4 Emission: Spatial Distribution

3.1.1. Monchique Wildfire, 2018

The Monchique wildfire is estimated to have burned 27,154 ha, of which shrubs and eucalyptus comprised 35% and cork oak forest 15%. Additionally, according to the in situ reports, the Monchique wildfire pointed to considerable irregularity in the expansion of the burned area, characterized by rapid fire spread due to plant formations prone to rapid and intense combustion (eucalyptus and shrubs, cork oak with abundant shrub development). In fact, in this particular wildfire, the meteorological and vegetation contexts favored the development of the Monchique fire due to the combination of strong winds, low relative humidity, and thin dead fuel. Thus, for the analysis of both CO and CH4 emissions, a matrix of 77 × 77 km2 was attained. 
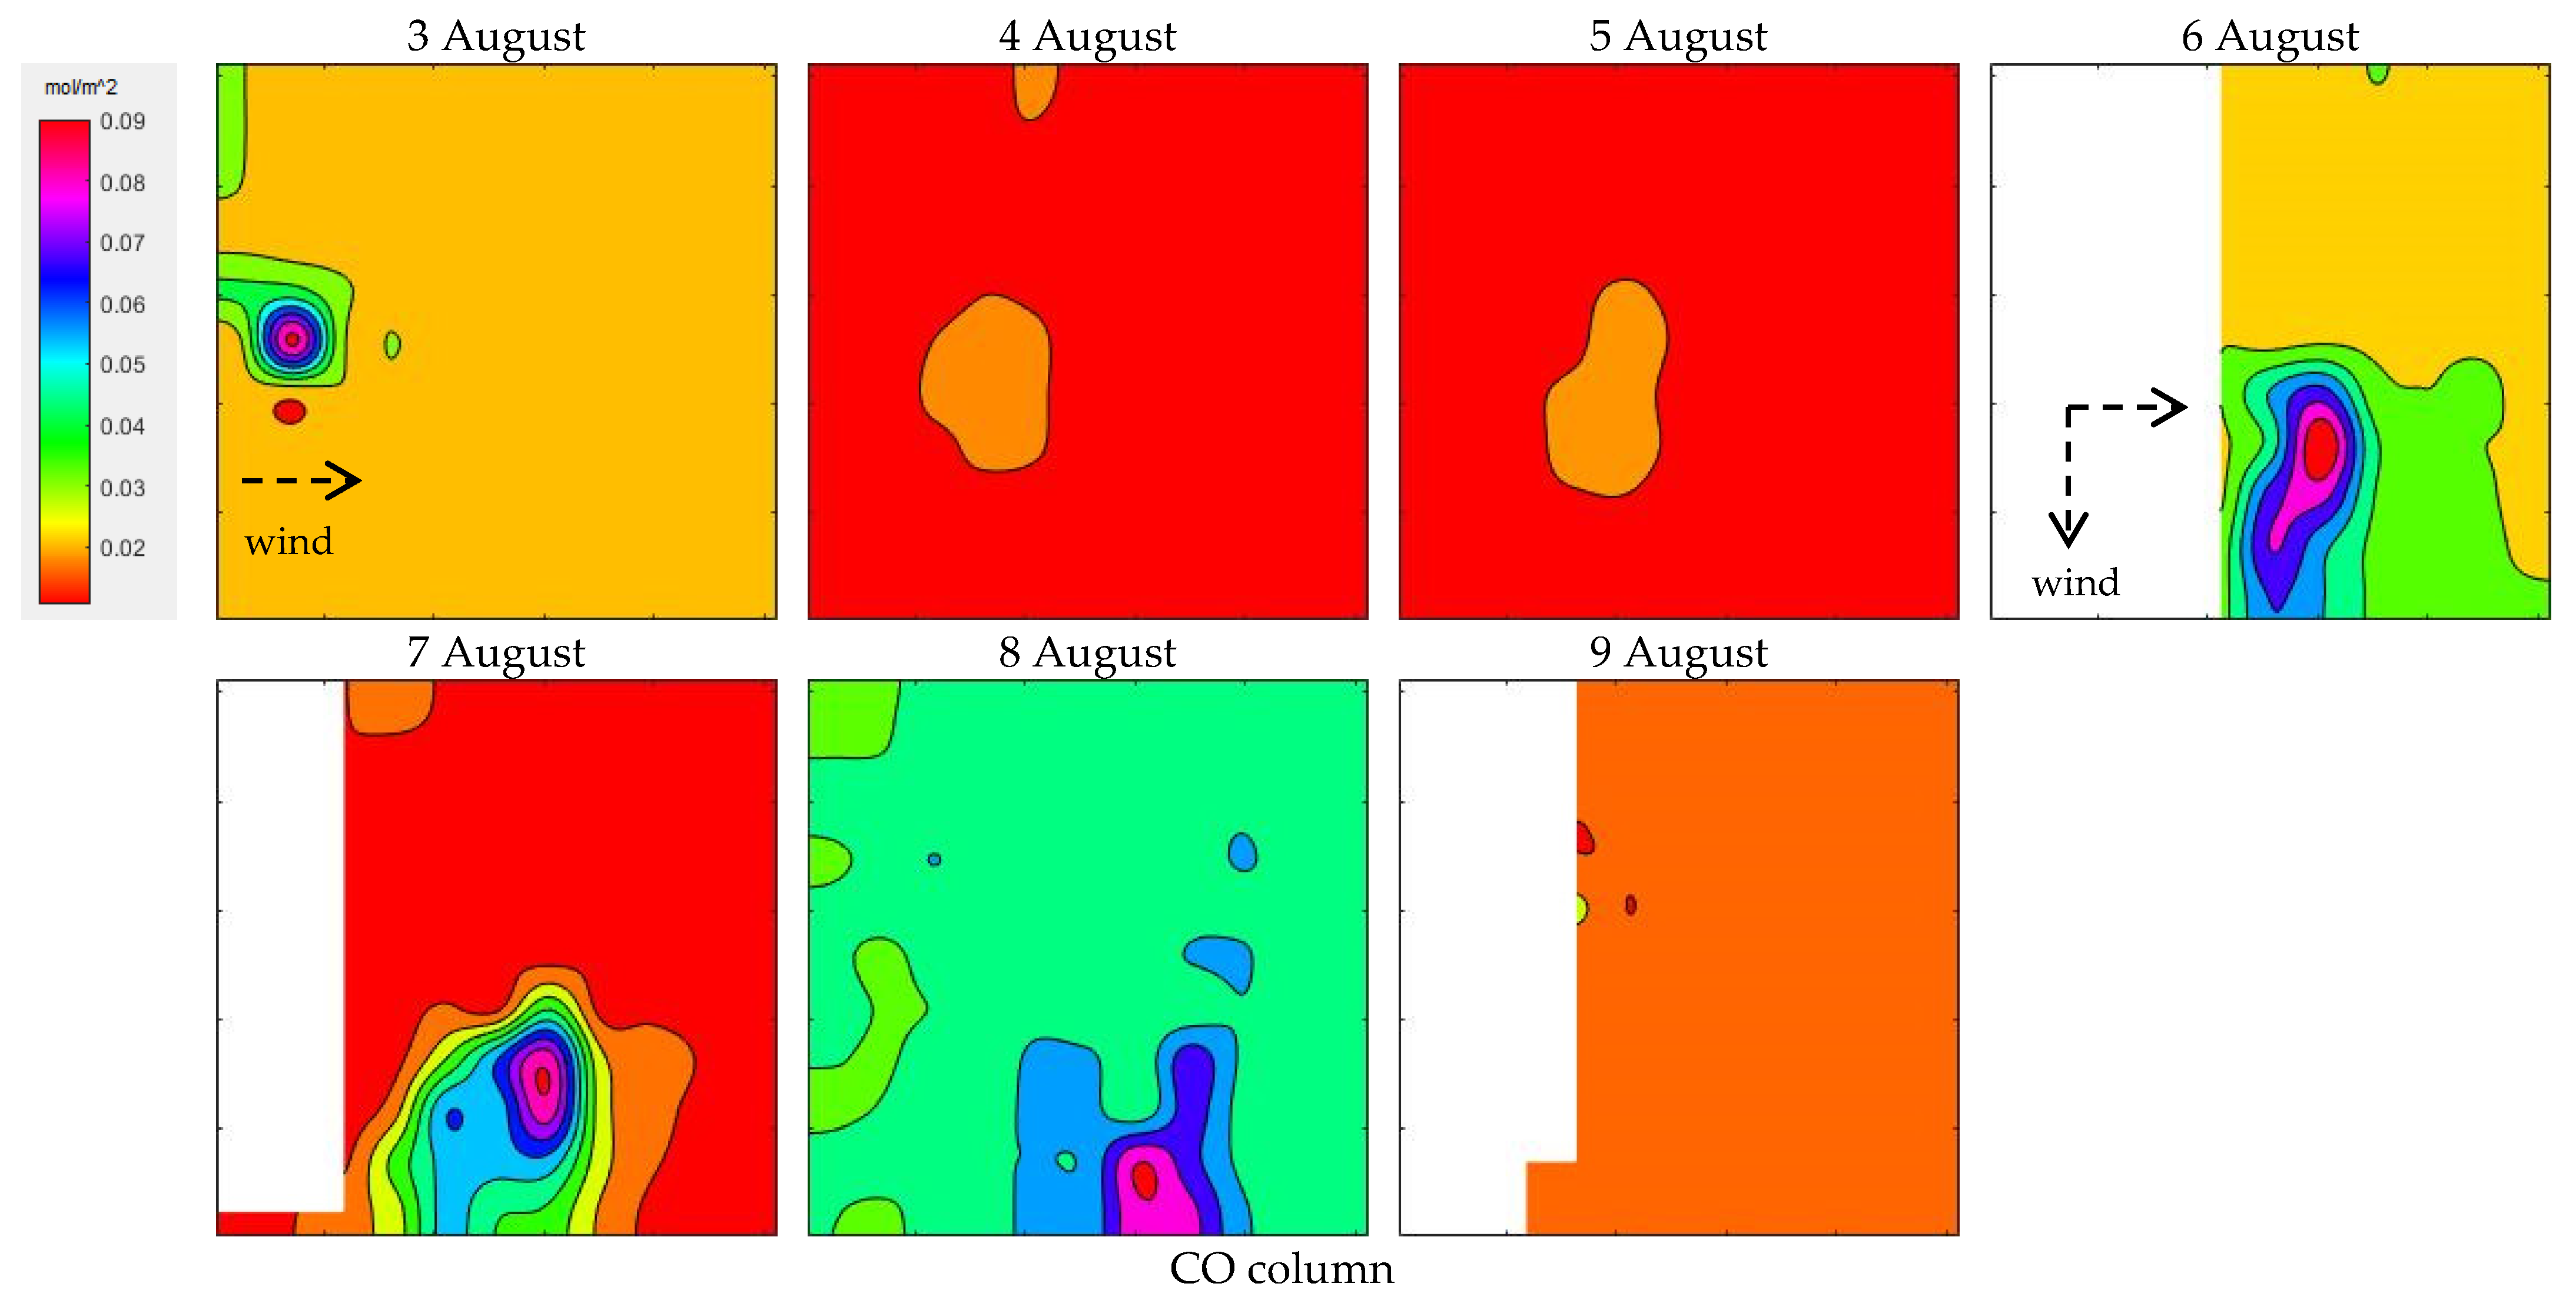
Figure 3 shows the spatial distribution of the total CO column retrievals (sum of partial columns) between 3 August and 9 August 2018. Throughout the analysis of the XCH4 total retrievals (sum of partial columns), no relevant spatial distribution was found. Thus, for this fire event, the XCH4 data was not shown since it presented several NaN results due to acquisition errors. In that regard, it may be noted that the presence of radiometric artefacts may be a contributor to spectral errors arising from the spatially heterogeneous nature of the radiance emanating from the Earth’s surface (due to irregular cloud cover, e.g., intense smoke plumes or albedo variations within a spatial sample) [38].
The wildfire began on 3 August 2018, burning 325 ha. It is possible to observe in Figure 3 that the higher intensities of CO column were located predominantly to the west, as confirmed by the in situ data [26]. The largest expansion of the fire occurred at the end of 5 August, with two fire fronts corresponding to 31.6% of the total burned area (8587 ha) [26]. As S5-P TROPOMI covered this region around 12:00 a.m. and 1:30 p.m. every day (small variations depending on the day), the 5 August large fire expansion was not recorded in the data shown in Figure 3 for this day. It should be noted that the intensity of the flame front depends on the speed of propagation and the fuel load consumed in the propagation. The most severe phase of the fire occurred on 6 and 7 August [26]. The evolution of the fire may also be explained through its radiative power (for detailed information, please see the Monchique Independent Technical Observatory report [26]). Through the analysis of each day, the fire was seen to be almost inactive on the mornings of 4 and 5 August, which is in line with the distribution illustrated in Figure 3 for these days. The highest peaks of radiative power were observed at the end of the day on 5 August [26] (not recorded by the S5P-TROPOMI) and in the early afternoon of 7 and 8 August, with values of up to 700 MW (recorded by the S5P-TROPOMI). These fire behaviors are visible in Figure 3. Thus, the uppermost CO columns measured were in the average of 5.82 × 10¹⁸ ± 2.47 × 10¹⁸ molecules/cm2 (attained on 3, 6 and 7 August in different geographic coordinates).

3.1.2. Vila de Rei/Mação Wildfire, 2019

The total burned area estimated in the Vila de Rei/Mação wildfire was 9249 ha, in which 6881 ha were forest stands, 1862 ha shrubs, and 506 ha agricultural areas.
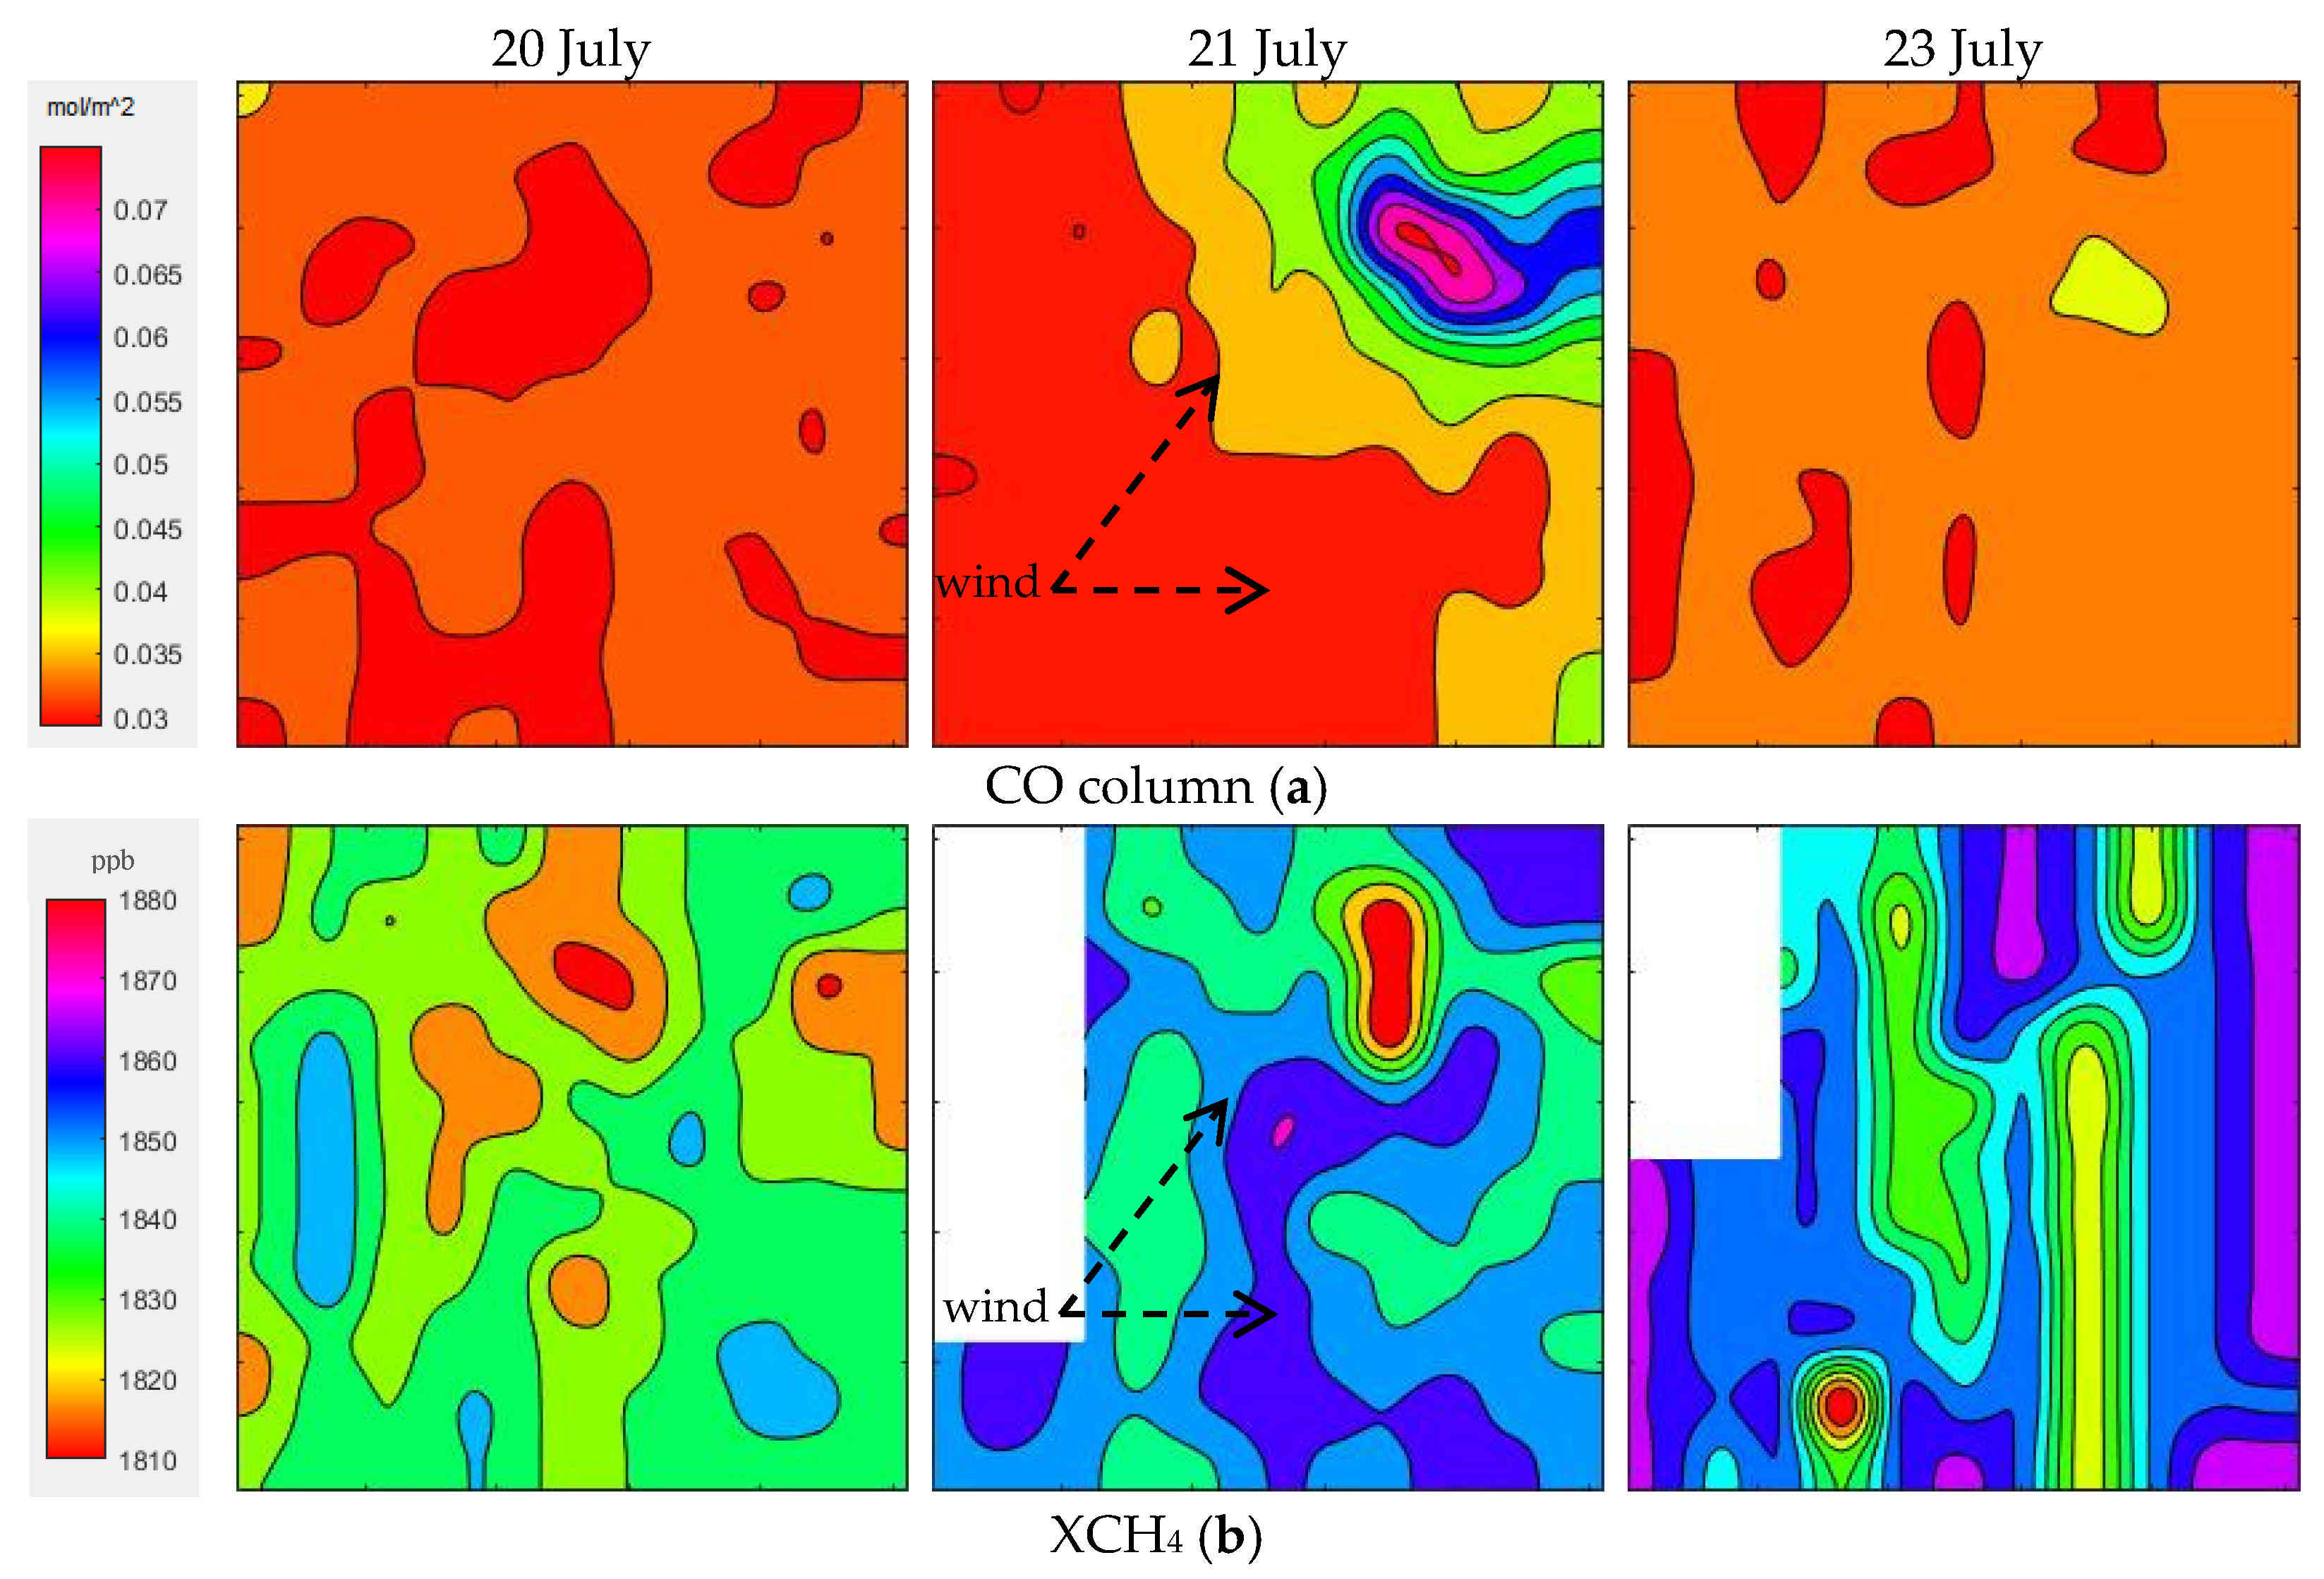
Figure 4 shows the spatial distribution profile of the CO column and XCH4 total retrievals (sum of partial columns) between 20 July and 23 July 2019, where the largest plume of CO was observed on 21 July 2019 (up to 4.6 × 10¹⁸ molecules/cm2).
In the Vila de Rei/Mação wildfire the direction of the wind was highly unstable, as may also be observed in the spatial distribution of both the CO column and XCH4 in Figure 4. During this wildfire, the wind varied temporally and spatially in its speed and direction [27]. These different wind patterns may justify the unusual forms of dispersion of the smoke plumes presented in Figure 4, from the Vila de Rei/Mação wildfire during the afternoon of 20 July and the unclear distribution provided by S5-P TROPOMI both for CO column (20 and 23 July) and XCH4 (20 and 23 July).
Moreover, the temperature fluctuations that occurred in this fire event may have screened critical instabilities in remote measurements [39] (observed on 23 July for the CO column and XCH4, Figure 4). Furthermore, analyzing the fire radiation power data presented in the Vila de Rei Independent Technical Observatory report [27], it was concluded that it is in line with the spatial distribution presented in Figure 4a (presented for 21 July), where a sharp increase in the energy of the fire (up to 850 MW) was observed. Additionally, as observed in Figure 4, the radiative power reached almost zero on 23 July.
It is clear by observation of Figure 4 that the fuel, and therefore the characteristics of the forest’s vegetation, were critical for clear monitoring measurements of the CO column and XCH4. The high quantity of smoke observed for this fire may have decreased the capacity of S5-P TROPOMI to draw a robust and clear spatial distribution of these gas emissions and follow the path of the wildfire. Nevertheless, for 21 July it was possible to pinpoint the highest peaks of CO emissions, contrary to CH4 measurements. The measurements of the CH4 emissions, a gas with low density when compared to CO, appeared to be greatly affected by the wind direction and intensity, moving away according to the wind’s behavior. Additionally, it should be noted that the most observed XCH4 NaN readings ranged from 1853 ppb to 1862 ppb.

3.2. Combustion and Fuel Types: CO and CH4 Emission Trends

CO and CH4 fluctuations during wildfires are complex and difficult to explain, and even more complicated in the case of wildland fuels such as wood, blades of grass, and tree leaves. These types of fuels will consequently affect the type of combustion profile. Wildfires can be broadly divided into two types: smoldering (heterogeneous combustion) and flaming (homogeneous combustion) [40]. Both are important in wildfires, and despite being fundamentally different, one can lead to the other [40]. These different types of combustion vary in their rates of spread, heat release, and gas emissions. In particular, CO and CH4 emissions during a wildfire vary according to the type and quantity of fuel consumed, fuel moisture, ignition pattern, wind, temperature, and other factors. Flaming combustion results from a rapid oxidation reaction at high temperatures with an abundant oxygen supply, resulting in the release of carbon dioxide and water vapor [40]. Smoldering combustion is a non-flaming form of combustion recognized by an abundant production of smoke with large quantities of particulate matter (mostly carbon) and carbon monoxide [41]. The type of vegetation will influence the type of combustion during a wildfire, and therefore variation in the emissions of detected CO and CH4. 
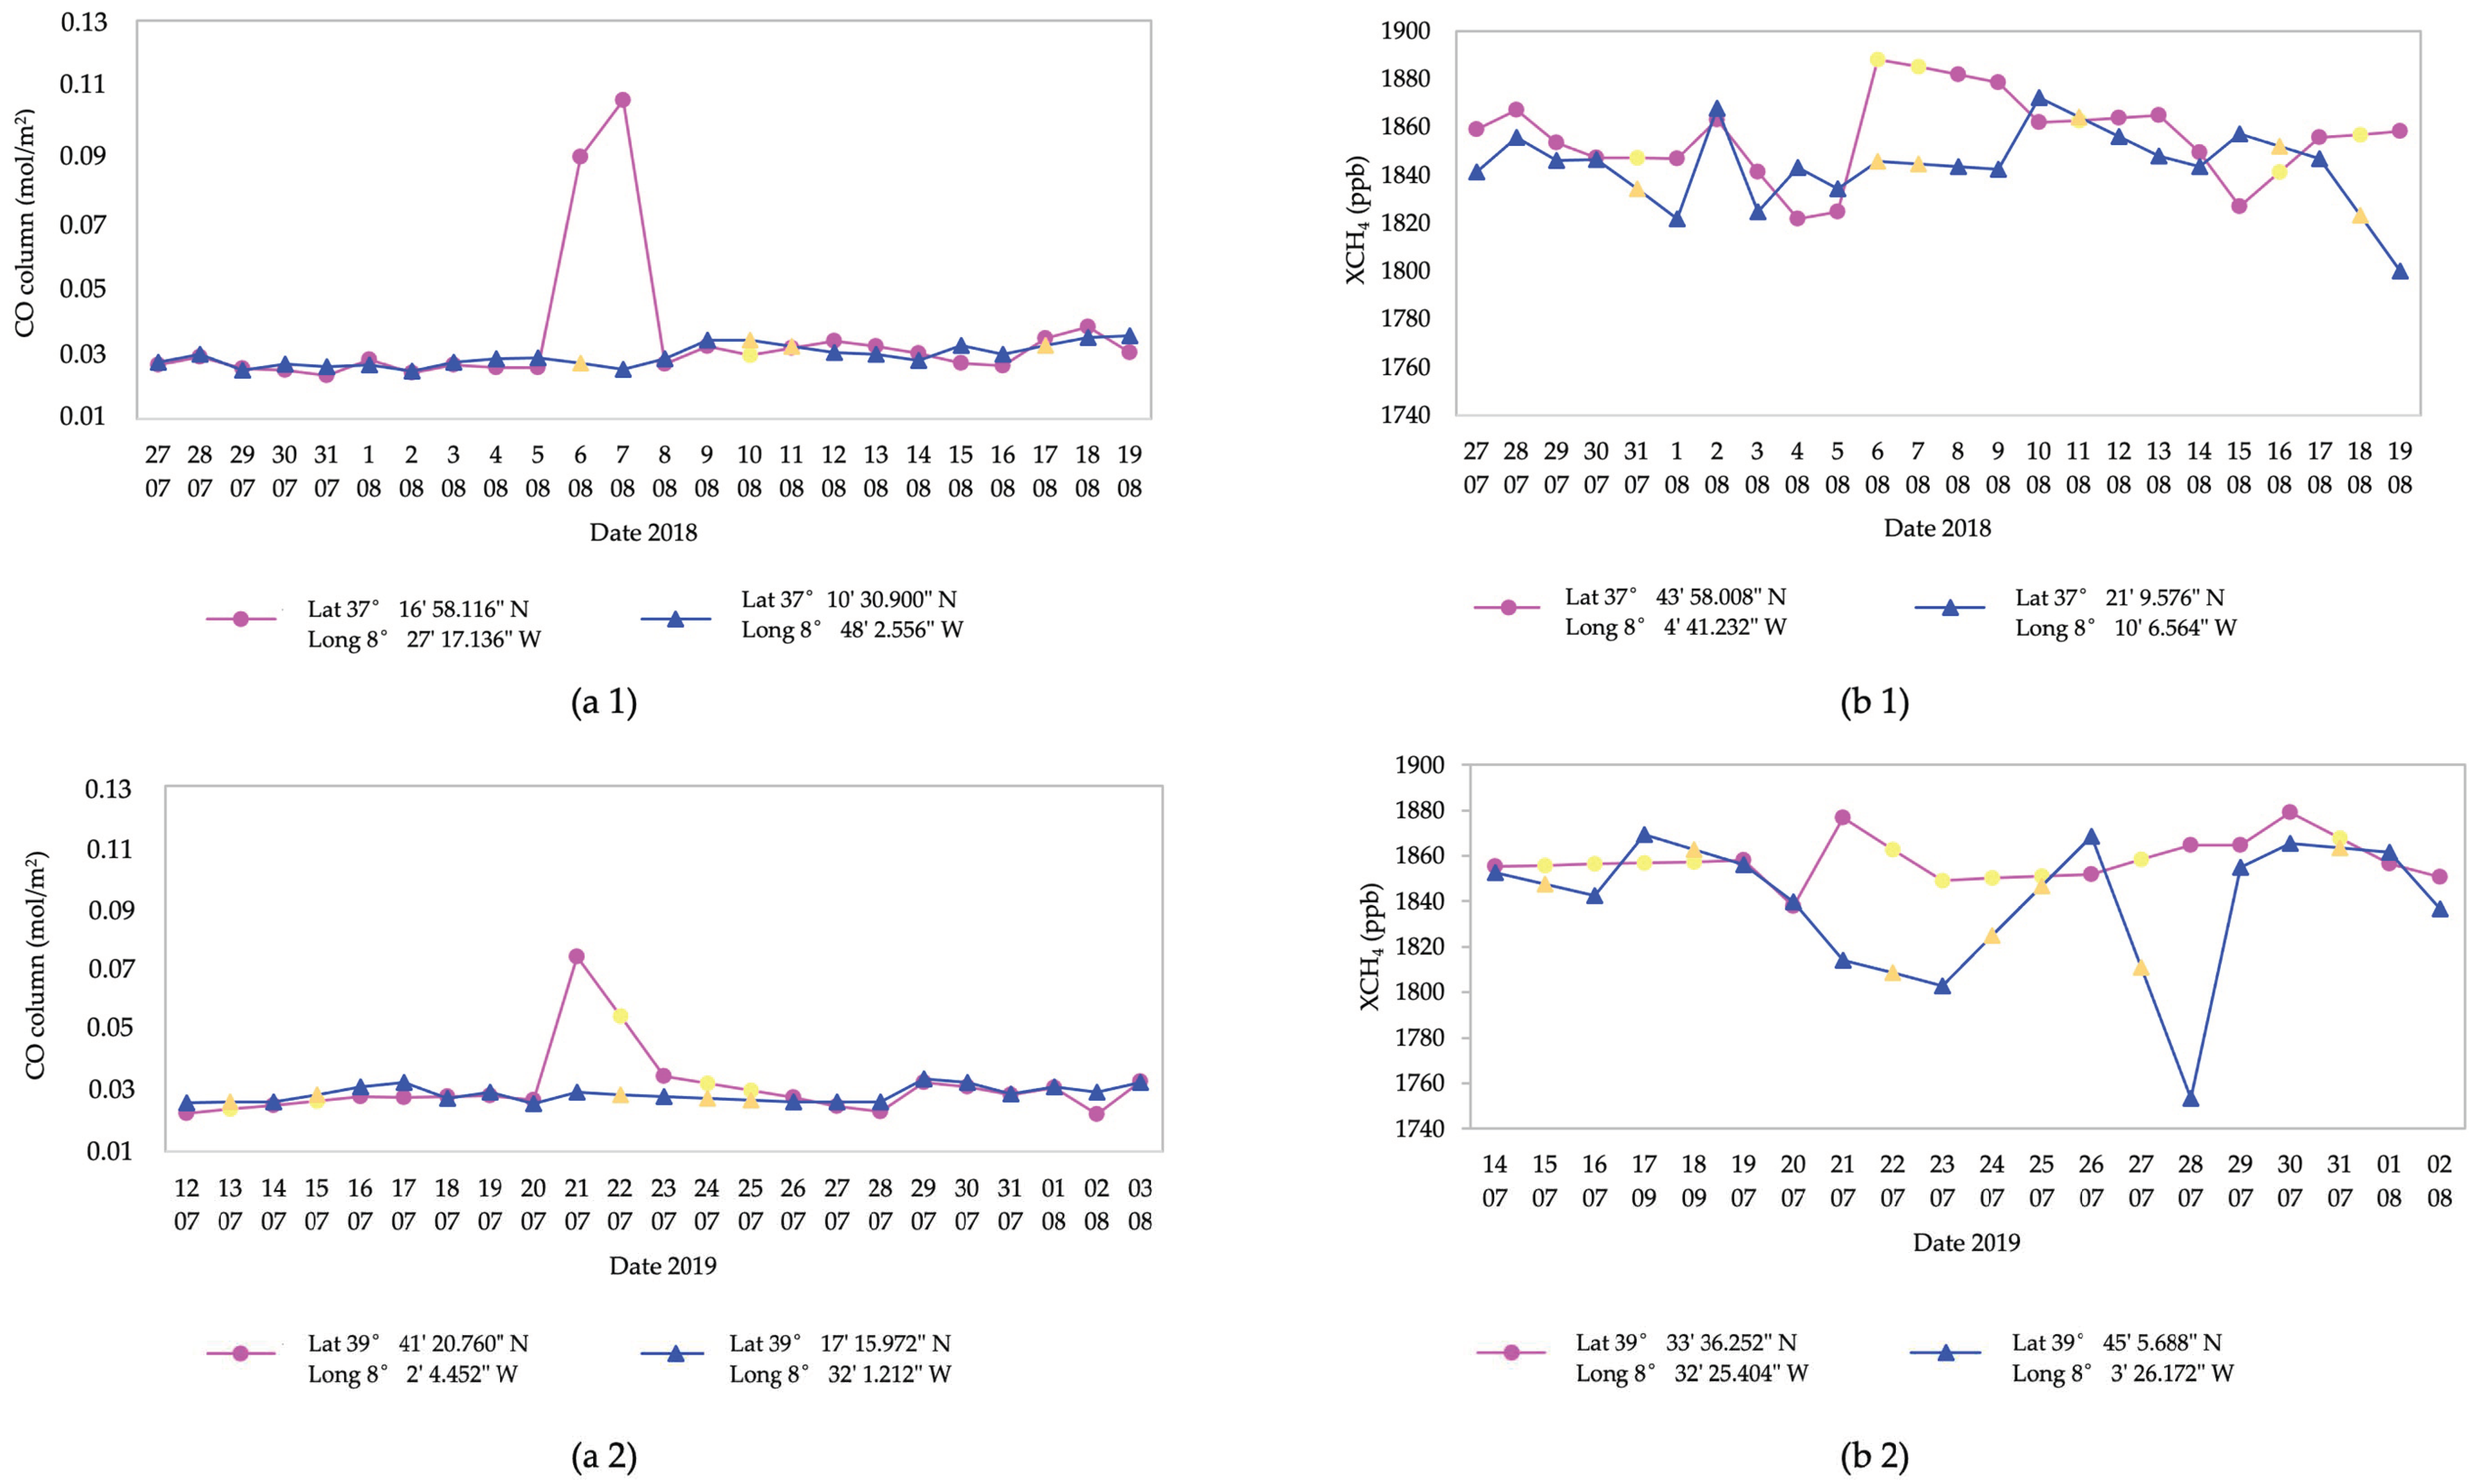
Figure 5 shows the CO column and XCH4 trend prior to, during, and following the wildfires under study (for full geo-localization the geographic location maps for both fires are in Figures S6 and S7 in the supplementary data). The geographic coordinates presented in Figure 5 are related to the CO column and XCH4 peaks considered the highest and lowest emissions observed during all the days studied for both fire events. In Figure 5, a linear interpolation was performed to overcome the missing data points due to S5-P TROPOMI acquisition errors.
Regarding the Monchique wildfire, the in situ data stated that not only wind speed explained the fire propagation, with a proportion of 53%, but also the humidity of the dead fuel (28%), associated with the relative humidity of the air and type of vegetation (19%). The graph (a.1) clearly shows that prior to and following the forest fire the emission of CO remained steady and between 6 August and 7 August, this CO emission plummeted dramatically to a further 34% when comparing both days. The XCH4 in the atmosphere in pre-and post-moments was slightly lower compared to the highest emission (Figure 5(b1) day and did not present an evident increment as in the CO column trend. In fact, even though the CH4 emissions stabilized in 1999 [42], this gas has been on the increase since 2007 for essentially unknown reasons [43]. Furthermore, an in-depth discussion may be warranted due to the fact that according to the in situ data provided, during the first two days (3 and 4 August) the fire mainly affected eucalyptus (55% of the burned area) and other forest (29%) and its spread was not particularly rapid, possibly due to the defense of young eucalyptus stains. The largest expansion of the fire occurred on 5 August, having affected eucalyptus in around 50% of the burned area during that period. On 6 and 7 August, the burned shrub area (41% of the total) gained ground compared to the eucalyptus (44%) [26]. These types of fuels (shrub) typically result in smoldering combustion, which is characterized by higher emissions of incomplete combustion products, including CO and CH4. On 8 August, the fire essentially consumed areas of shrubs (70%). On 9 August, the coniferous species, the most representative of which is the pine species, recorded a reduced burned area. Both days revealed flaming combustion, which is more efficient than smoldering combustion, emitting lower quantities of CO and CH4.
On the other hand, the fire fuel of Vila de Rei/Mação was mainly constituted by forest stands (60% maritime pine and 15% eucalyptus) and 20% shrub areas and small agricultural patches. According to the analysis of the in situ data [27], the fuel mainly consisted of old wood or stands resulting from natural regeneration and with no forest management, with an average height of 2 m, high horizontal and vertical continuity, and a high load containing a significant quantity of fine suspended dead material. Thus, the behavior of the fire was expected to present a high speed of propagation and intensity. As far as Figure 5(a2) is concerned, comparing the CO column trend prior to, during, and following the wildfire, the peak in CO column is evident, which decreased on day 23 and gradually adjusted to typical CO emission values for non-fire days. Regarding XCH4, there were some days with data acquisition errors, probably caused by wind direction instability and high smoke intensity, which enabled the ability of S5-P TROPOMI to consistently measure XCH4 emissions. Smoke intensity is also related to the humidity of the dead fine fuels. Considering the in situ data and using the physical model of Anderson et al. [44], which estimates the moisture of the dead fine fuels, from 20 to 23 August, a relative humidity of between 20% and 40% in the mid-afternoon to a maximum of around 90% during the night was recorded. Thus, minimum and maximum values corresponding to the moisture content of the fine fuels standing at approximately 7.5% and 20% were obtained, which may have affected the quantity of smoke emitted during this period.
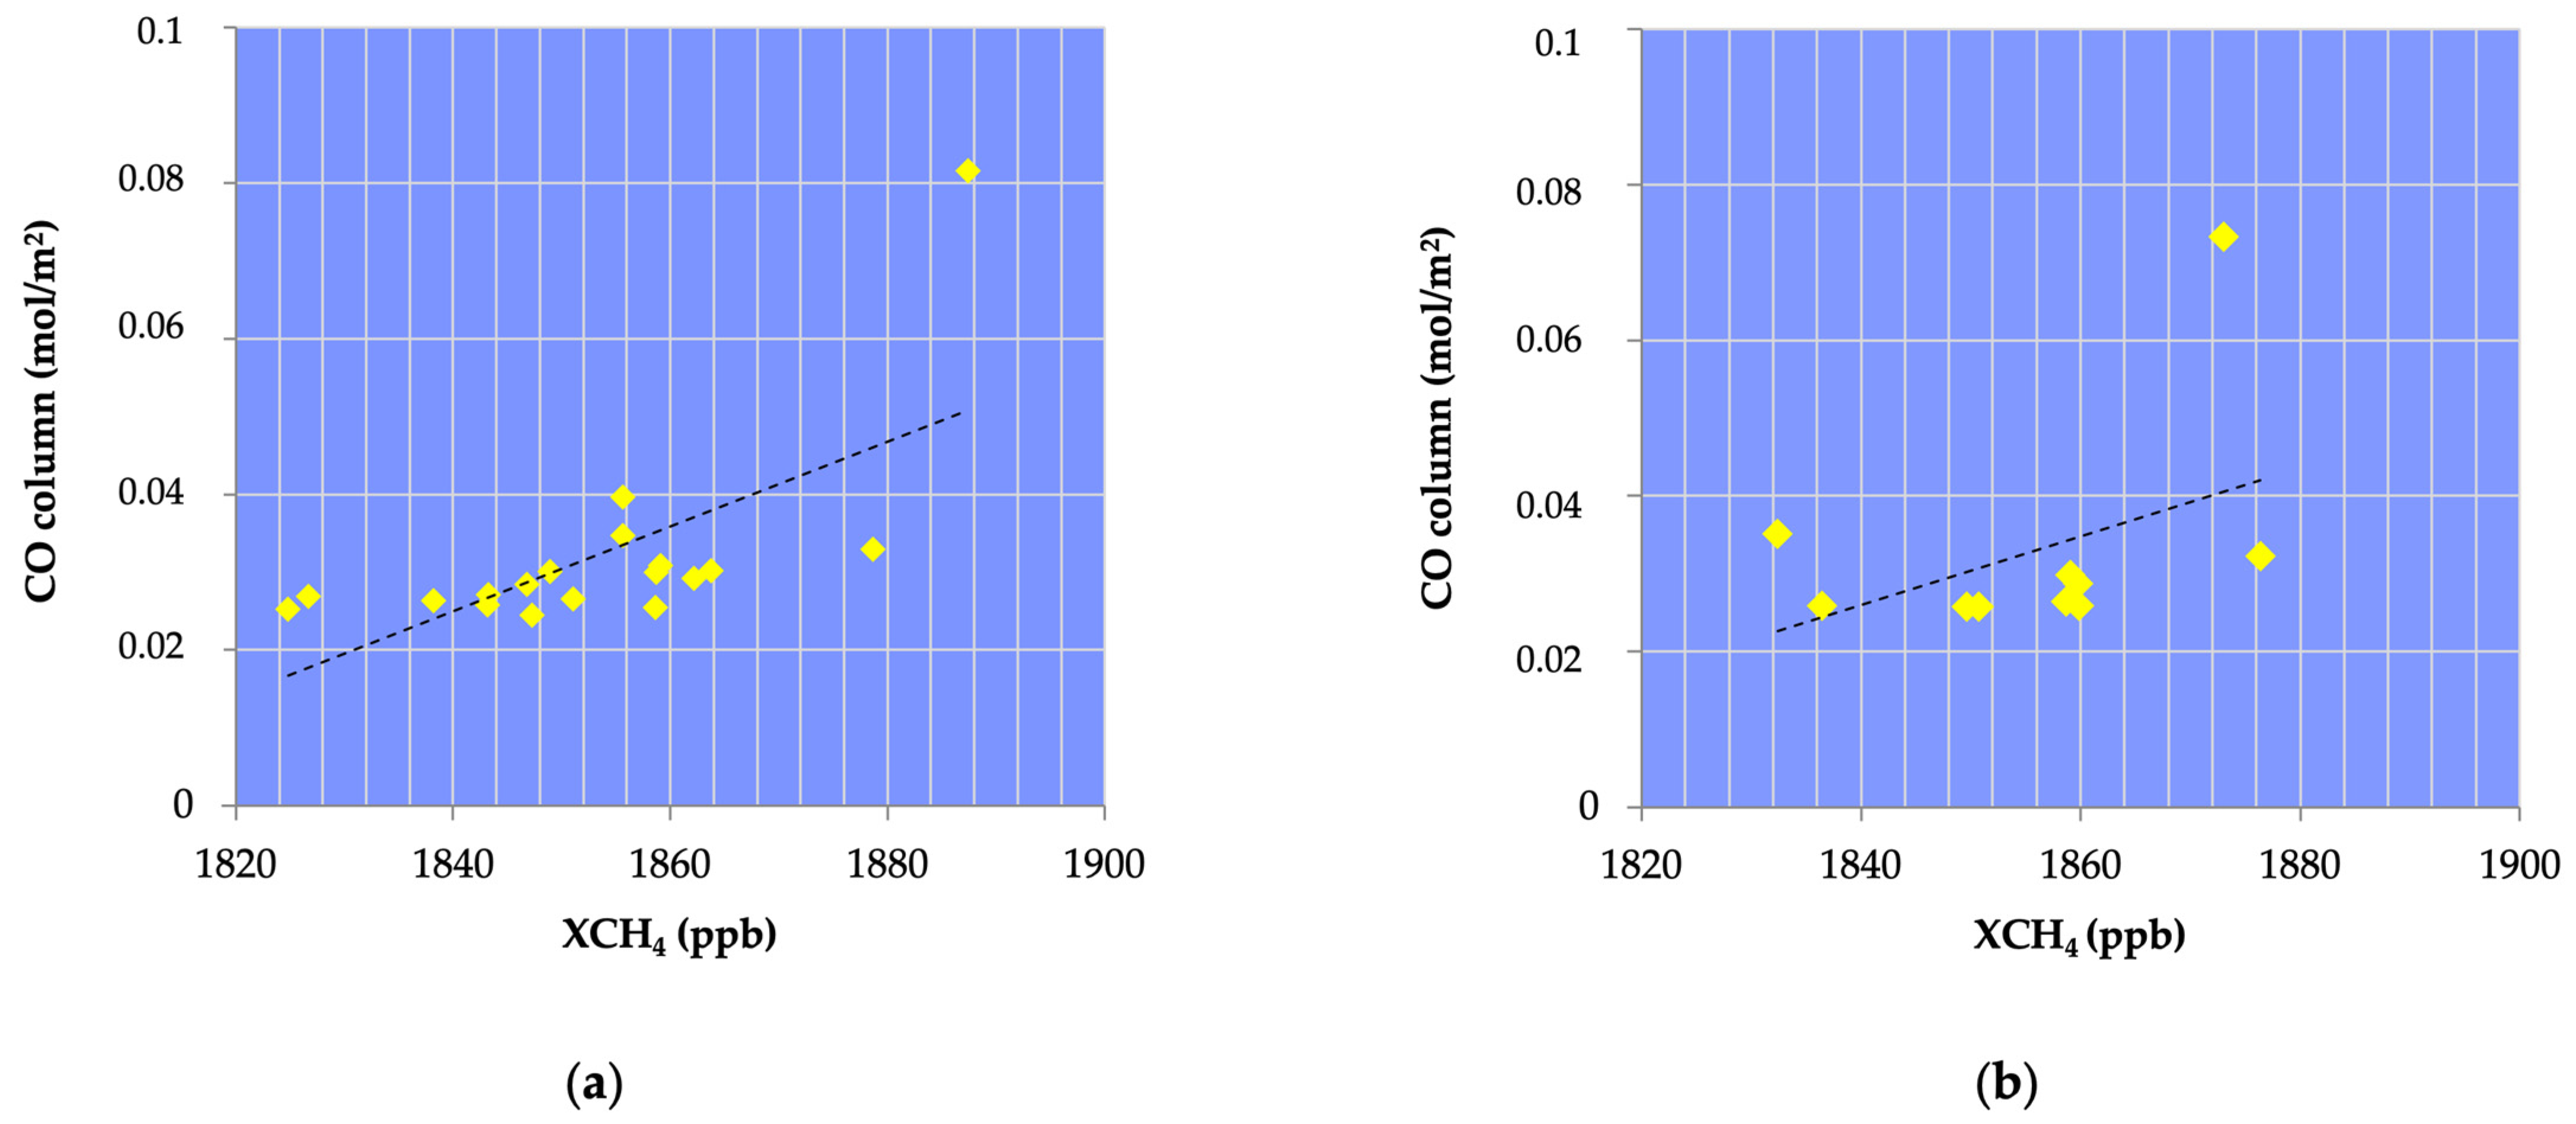
It is also important to establish the relationship between the CO column and XCH4 S5-P TROPOMI data, as these two gases are related to wildfire emissions with incomplete combustion and they are expected to have an upward trend during the fire and a downward, steady profile pre- and post-fire. To understand this relationship, a linear regression was performed for the data, which is presented in Figure 5. Figure 6 presents a line fit plot for 95% of the confidence level between the CO column and XCH4 S5-P TROPOMI data.
Analyzing the regression, the CO column and XCH4 distributions were moderately correlated, with a correlation coefficient of 0.66 (18 mutual observations) for the Monchique fire and 0.42 (10 mutual observations) for the Vila de Rei/Mação fire. It should be noted that these correlations were primarily limited by the few days of analysis and missing measurement files, mostly in the Vila de Rei/Mação fire. From the regression analysis, profiles and trends may be observed, and CO, as expected, had a higher expression in the emission when an extreme wildfire occurred compared to XCH4.

3.3. Spatio-Temporal Analysis of CO Emission

To assess the performance of S5-P TROPOMI, a quantitative analysis was carried out to evaluate the association of CO emissions with the actively burning areas according to the propagation maps (Figures S3 and S4 in the supplementary data).
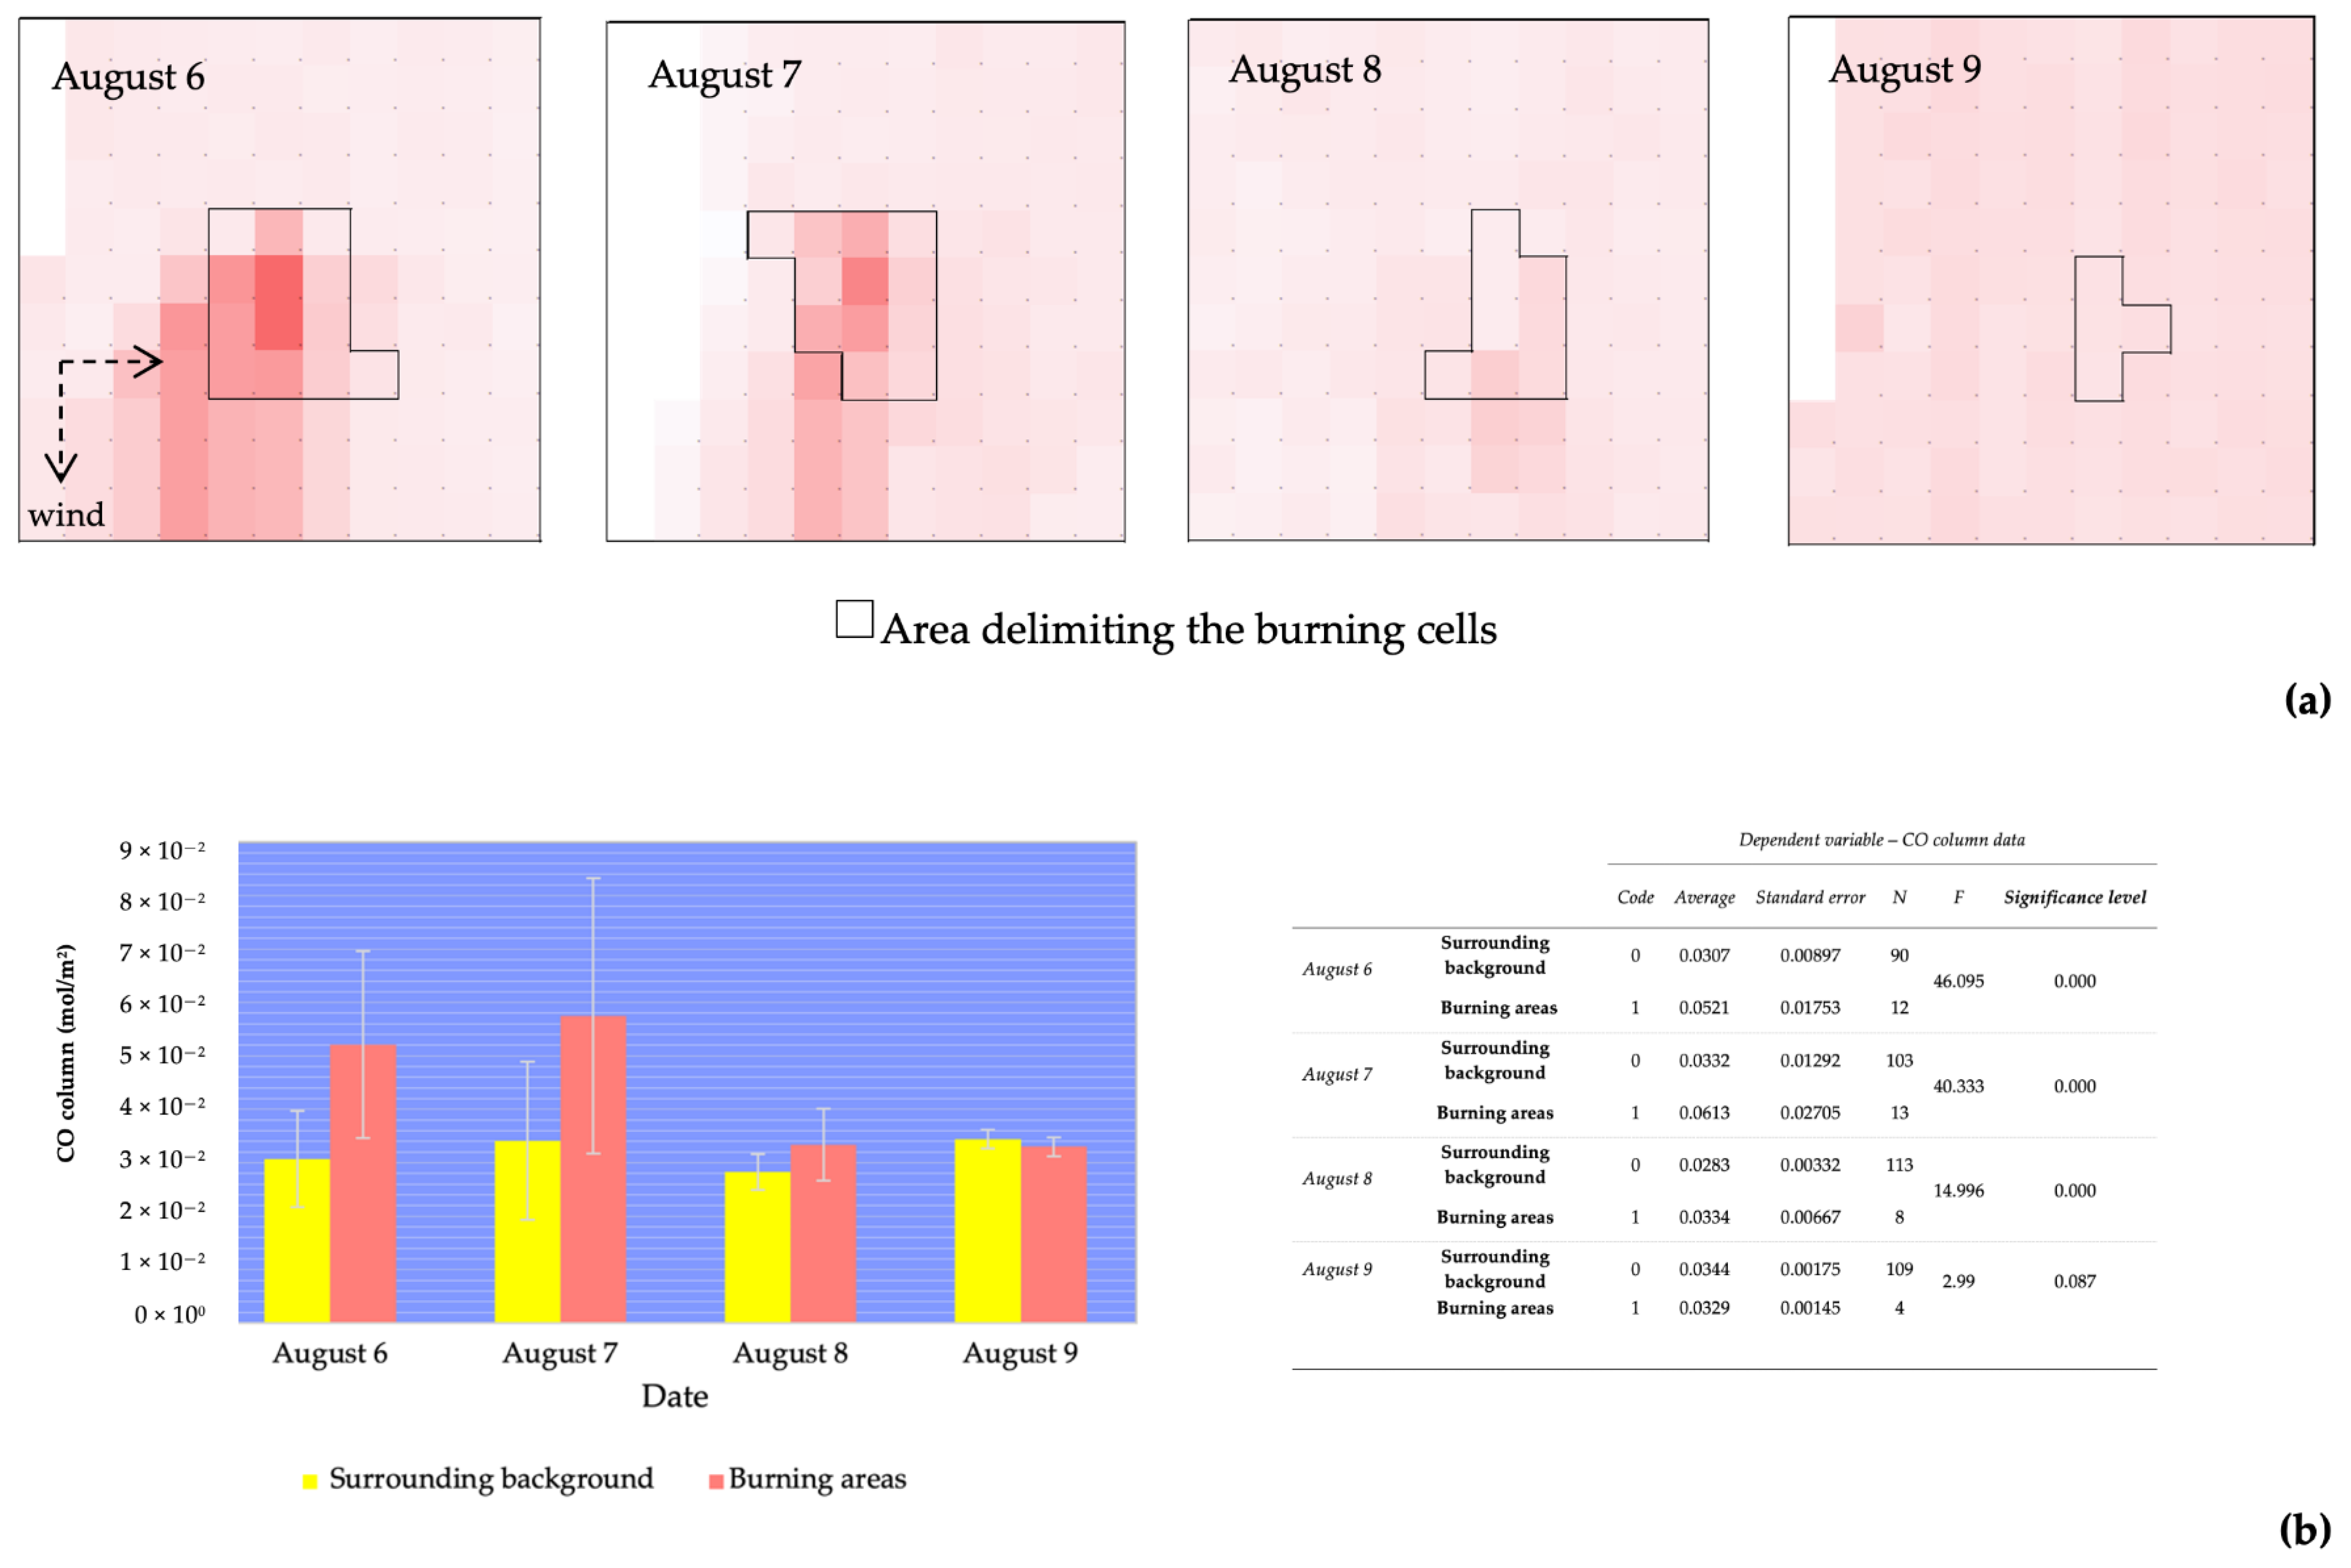
Figure 7 shows the squared 77 × 77 km2 (centered at lat. 37°17′55.644″ N, long. 8°30′35.064″ W) for the Monchique wildfire for the most significant days recorded by S5-P TROPOMI (6, 7, 8, and 9 August), indicating the area of active burning. A statistical comparison of the CO column data in the cells with active burning and those of the surrounding background is shown with ANOVA tables and a graphical display.
As previously mentioned, high wind speed was observed on 6, 7, and 8 August with an evident northwest-southwest direction, as validated by the more intense CO plume for the higher CO emissions (darker red squares, Figure 7a). According to the ANOVA tables and plots in Figure 7b, it is possible to conclude that the CO columns measured by the S5P-TROPOMI were significantly higher over cells with active burning, especially on 6 and 7 August, but also on 8 August, with p < 0.000 (high level of significance). It may also be noted that as on 9 August the fire was almost extinct, the burning areas and the surrounding background were similar in terms of CO emissions, showing (as in Figure 4) that the CO plume was more diffuse and presented low values on that day. It may be concluded that there was a strong and statistically significant influence of the wildfire on the CO emissions measured by S5-P TROPOMI, as the remarkable decrease and increase when burning and background areas were compared were evident.
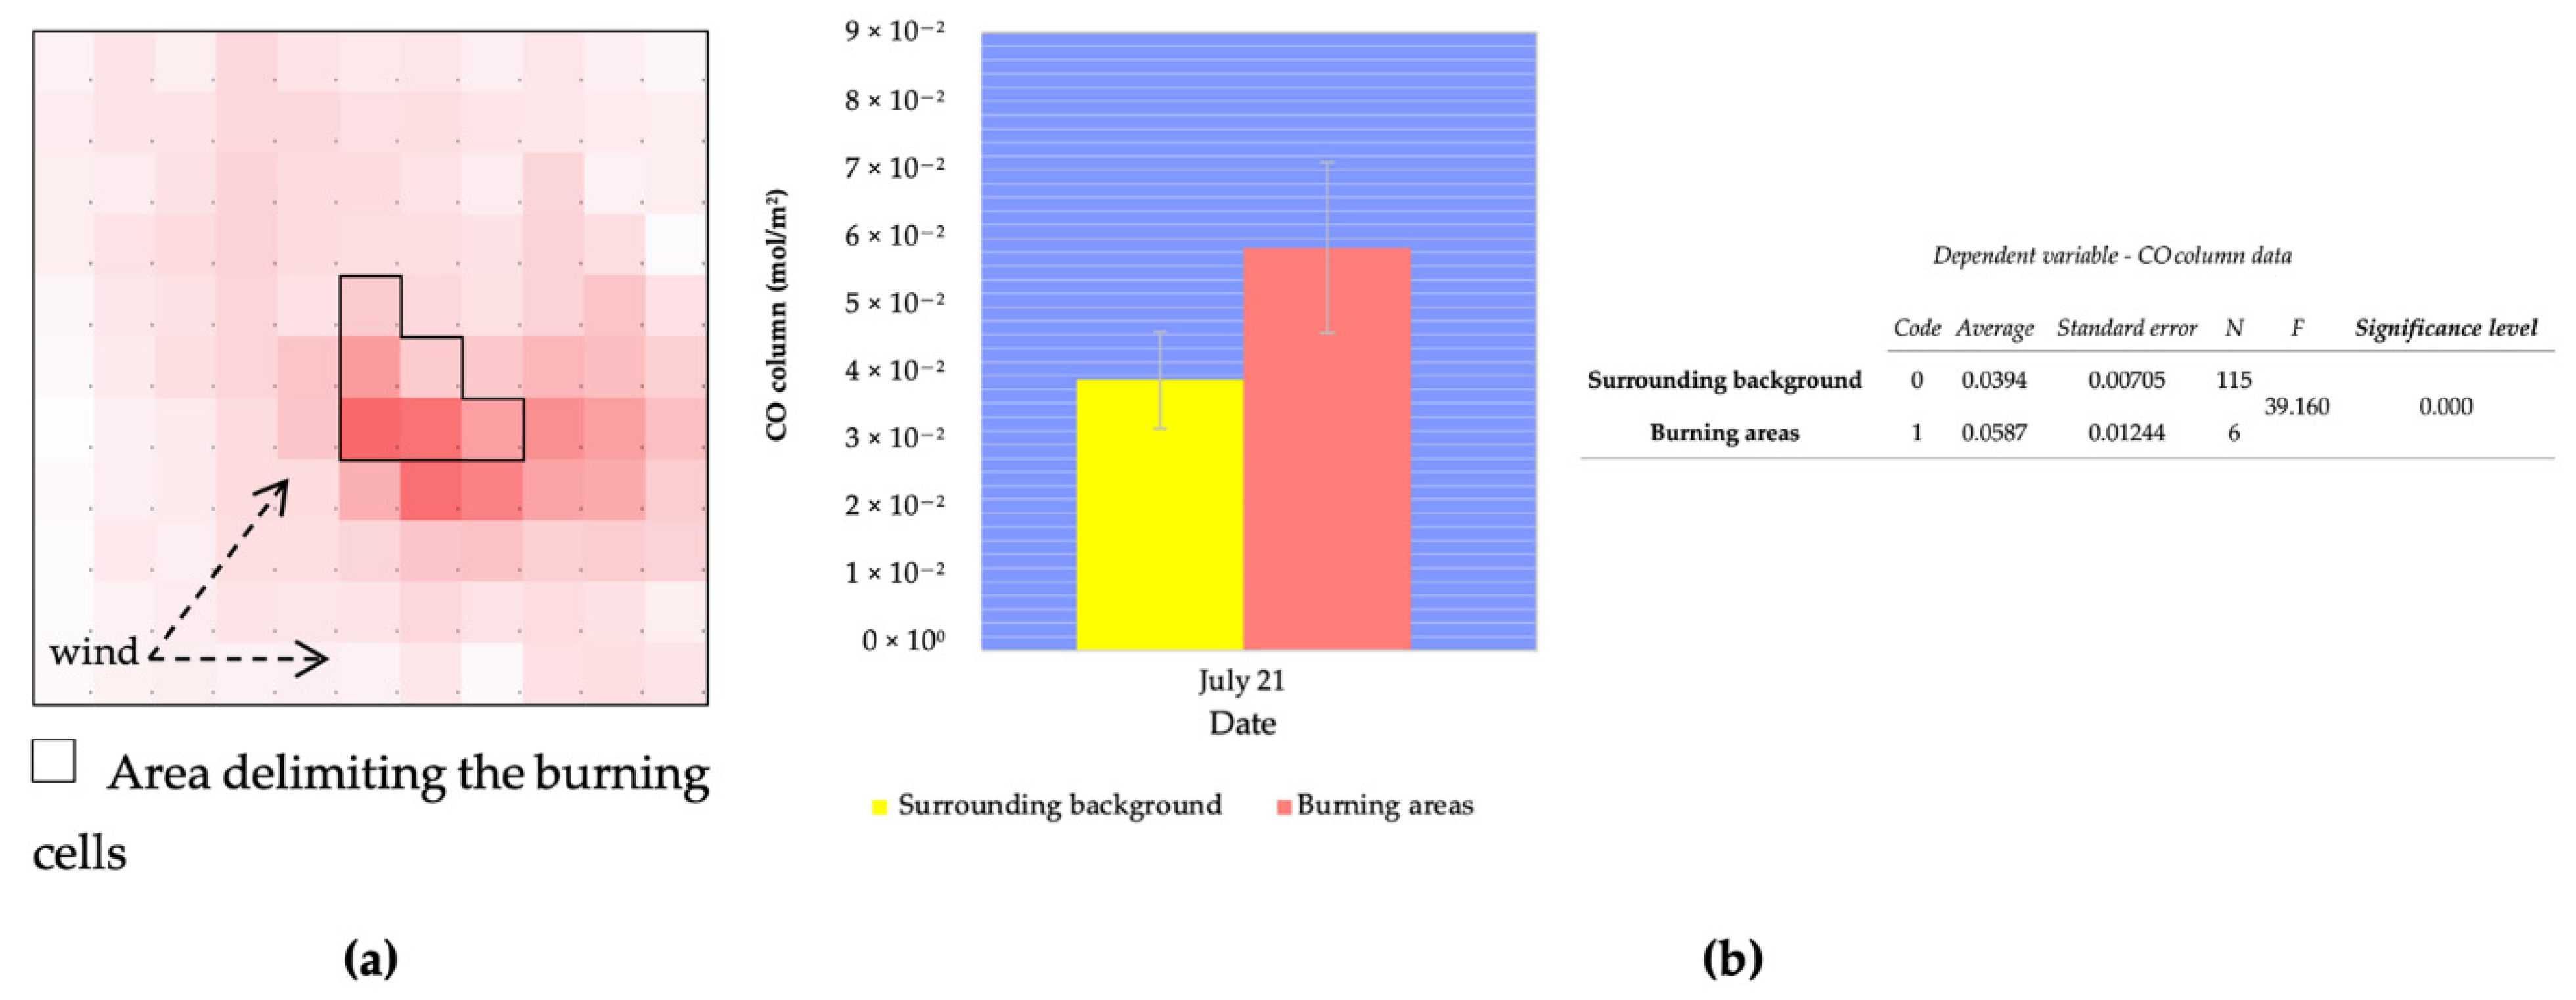
Figure 8, referring to 21 July, the most representative CO emissions day for the Vila de Rei/Mação wildfire, shows the assimilated observations for CO dynamics for this day.
Figure 8 shows the high representativeness of S5-P TROPOMI measurements for each in situ observation in the burned area of 21 July (centered at lat. 39°45′5.688″ N, long. 8°3′26.172″ W), which presented a p-value of < 0.000 (high level of significance) when burning areas and the surrounding background were compared according to CO emission levels. As is also observed in Figure 7, for the Monchique wildfire, the wind orientation influenced the CO plume. In the Vila de Rei/Mação wildfire, the wind orientation was unstable; nevertheless, the moderate westerly and southwesterly winds were dominant, as may be noted with the more intense red color in Figure 8a.
This spatial and/or temporal cross-validation made possible the quantitative evaluation of the changing patterns of CO columns measured by S5-P TROPOMI. The spatial and/or temporal analysis described in Figure 7 and Figure 8, which consider the link between in situ observations and S5-P TROPOMI CO measurements, was a crucial step to accurately infer the potential of monitoring CO emissions during an extreme wildfire, using satellite data time series.

3.4. CO2 Emissions

In addition to the significance of CO emissions by means of the S5-P TROPOMI data, it was also relevant to predict the quantity of carbon dioxide (CO2) emitted by the two fires under study, since it is known that climate change and, consequently, its associated wildfires are expected to increase atmospheric CO2 [45]. Considering that combustion is never 100% complete in vegetation fires, the potential of Equation (1), proposed by Drysdale [32] and Ward et al. [33], was explored. Table 2 presents the predicted CO2 concerning CO column data provided by S5-P TROPOMI, considering that the MCE yield values for wildland fires with smoldering and flaming combustion ranged between 0.75 and 0.92.
As previously mentioned, smoldering combustion is less efficient than flaming combustion and results in lower emissions of carbon dioxide (CO2), but higher emissions of CO and CH4 [46]. On 7 August, in the Monchique wildfire, an estimated CO2 quantity of 7.6 × 10¹⁹ molecules/cm2 was emitted, considering 92% combustion efficiency, in an area of 7 × 7 km2 for each geolocation. Regarding the Vila de Rei/Mação wildfire, the higher emission of predicted CO2 revealed up to 1.4 × 10¹⁹ molecules/cm2 when 75% combustion efficiency was considered and 5.3 × 10¹⁹ molecules/cm2 considering 92% combustion efficiency. When the uppermost peaks of CO2 were compared to other research articles, the estimated emissions were higher according to the values found by Al-Saadi et al. [47], who reported 4.4 × 10¹⁷ molecules/cm2 of CO emission for biomass burning, and therefore, for both 92% and 75% combustion efficiency, a CO2 emission was estimated to record an average of 4.9 × 10¹⁸ or 1.3 × 10¹⁸ molecules/cm2, respectively. Conversely, close to the Senegal region, Buchwitz et al. [48] monitored a CO2 emission plume of 8.1 × 10²¹ molecules/cm2, showing that CO2 emissions are also highly dependent on the burned area estimation, in particular for short-lived wildfires [48]. The CO2 emissions present high spatial heterogeneity, since they will be highly dependent on the fuel and weather conditions [7].

4. Conclusions and Final Remarks

In this study, the potential of the S5-P TROPOMI satellite for the monitoring and supervision of CO and CH4 during wildfire events was assessed to analyze Level-2 data products and their correspondence with in situ data for two particular Portuguese extreme wildfires: Monchique in 2018 and Vila de Rei/Mação in 2019.
From the spatial distribution profiles created for the CO column and XCH4 emissions through the S5-P TROPOMI Level-2 data, it was concluded that, firstly, the in situ data is key to the construction of a more in-depth understanding of the patterns of these two gases during an extreme wildfire event.
Secondly, when comparing the robustness of S5-P TROPOMI for both gases, the CO column measurements presented a clear trend, patterns, and evident distribution, in line with the fire behavior and intensity. On the contrary, for XCH4 measurements, it was not possible to explain the fire direction, only the intensified emission when the fire occurred. In the XCH4 measurements, NaN results were mostly found in up to 1853 ppb, together with the higher burning intensity during the wildfire event. It should also be noted that as CH4 is lighter than CO, the gas may be carried away with sea winds, therefore compromising its measurements. Consequently, the wind and smoke plumes may be contributing factors in spectral errors, namely for XCH4 measurements.
Thirdly, it was concluded that S5-P TROPOMI’s potential for screening CO fluctuations during a fire event (namely, Pinus pinaster and Eucalyptus globulus burning fuel) is highly affected by the type of forest fire under study. For the Monchique fire, in CO column measurements, as the wildfire formed loft smoke plumes above the boundary layer and promoted the long-distance transport of gases and particulate matter, the S5-P TROPOMI was able not only to sense fluctuations in the emissions’ trends but also to monitor the direction of the fire’s propagation. However, for Vila de Rei/Mação, due to high wind instability, the smoke aerosols remained in the near-ground layer and were not sufficiently high to enable S5-P TROPOMI to clearly follow the CO direction in the last two days of the fire event.
Fourthly, by means of a spatio-temporal analysis, the quantitative influence of the fire events on CO emissions correlated with burned propagation maps, showing with a significant difference that S5-P TROPOMI was able to provide prospects in assessing and quantifying the CO columns during wildfire events. This analysis corroborates the data found in the qualitative and descriptive analysis.
Thus, it is important to highlight that S5-P TROPOMI’s potential for screening patterns and CO columns, contrary to XCH4 monitoring, which may be ambiguous, can provide a wealth of knowledge on mapping wildfire events.

Supplementary Materials

The following are available online at https://0-www-mdpi-com.brum.beds.ac.uk/article/10.3390/fire4020025/s1, Table S1. Total CO column precision and CH4 mixing ratio precision data from S5-P TROPOMI in the two geographic locations where the highest CO and XCH4 emissions were achieved (Figure 3 and Figure 4 related); Figure S1. Wildfire Danger Forecast for 7 August 2018 (data collected from https://effis.jrc.ec.europa.eu/static/effis_current_situation/public/index.html, accessed on 15 March 2021); Figure S2. Wildfire Danger Forecast for 21 July 2019 (data collect from https://effis.jrc.ec.europa.eu/static/effis_current_situation/public/index.html, accessed on 15 March 2021); Figure S3. Burned area: propagation during the Monchique wildfire event [26] (centered at lat. 37°17′55.644″ N, long. 8°30′35.064″ W, represented by the x in the map); Figure S4. Burned area: propagation during the Vila de Rei/Mação wildfire event [27] (centered at lat. 39°45′5.688″ N, long. 8°3′26.172″ W, represented by the x in the map); Figure S5. Spatio-temporal analysis flow chart process; Figure S6. Highest and lowest CO and XCH4 emissions geographic locations map for Monchique fire; Figure S7. Highest and lowest CO and XCH4 emissions geographic locations map for Vila de Rei/Mação fire.

Author Contributions

Conceptualization, C.M. and P.V.; data curation, C.M.; formal analysis, C.M., J.M.F.N., F.C.R. and P.V.; funding acquisition, J.M.F.N., F.C.R. and P.V.; investigation, C.M. and P.V.; methodology, C.M. and P.V.; project administration, P.V.; resources, P.V.; software, C.M. and P.V.; validation, L.N., N.R.N., F.C.R. and P.V.; visualization, C.M. and P.V.; writing—original draft, C.M.; writing—review and editing, C.M., L.N., O.C.G., N.R.N., J.M.F.N. and F.C.R. All authors have read and agreed to the published version of the manuscript.

Funding

This research was funded by the project PCIF/GFC/0078/2018—Influence of forest VOCs (volatile organic compounds) on extreme fire behaviour from Fundação para a Ciência e a Tecnologia (FCT). The authors thank FCT for the financial support (UIDB/00100/2020). The authors also acknowledge the support given to CENSE by the Portuguese Foundation for Science and Technology (FCT) through the strategic project UIDB/04085/2020.

Institutional Review Board Statement

Not applicable.

Informed Consent Statement

Not applicable.

Acknowledgments

C. Magro acknowledges NOVA.ID of NOVA-FCT for her postdoc fellowship. N.R. Neng thanks FCT for the contract established from DL 57/2016.

Conflicts of Interest

The authors declare no conflict of interest.

References

  1. Forest Europe. State of Europe’s Forests 2020 Report; Forest Europe: Bonn, Germany, 2020. [Google Scholar]
  2. Cramer, W.; Guiot, J.; Fader, M.; Garrabou, J.; Gattuso, J.-P.; Iglesias, A.; Lange, M.A.; Lionello, P.; Llasat, M.C.; Paz, S.; et al. Climate change and interconnected risks to sustainable development in the Mediterranean. Nat. Clim. Chang. 2018, 8, 972–980. [Google Scholar] [CrossRef] [Green Version]
  3. Rego, F.C.; Rodríguez, J.M.M.; Calzada, V.R.V.; Xanthopoulos, G. Forest Fires—Sparking Firesmart Policies in the EU; Faivre, N., Ed.; European Commission: Brussels, Belgium, 2018; ISBN 978-92-79-77493-5. [Google Scholar]
  4. San-Miguel-Ayanz, J.; Durrant, T.; Boca, R.; Maianti, P.; Liberta, G.; Artes Vivancos, T.; Jacome Felix Oom, D.; Branco, A.; De Rigo, D.; Ferrari, D.; et al. Forest fires in Europe, Middle East and North Africa 2018; European Commission: Brussels, Belgium, 2019. [Google Scholar]
  5. San-Miguel-Ayanz, J.; Durrant, T.; Boca, R.; Maianti, P.; Liberta, G.; Artes Vivancos, T.; Jacome Felix Oom, D.; Branco, A.; De Rigo, D.; Ferrari, D.; et al. Forest Fires in Europe, Middle East and North Africa 2019; European Commission: Brussels, Belgium, 2020. [Google Scholar]
  6. Page, S.E.; Siegert, F.; Rieley, J.O.; Boehm, H.-D.V.; Jaya, A.; Limin, S. The amount of carbon released from peat and forest fires in Indonesia during 1997. Nature 2002, 420, 61–65. [Google Scholar] [CrossRef]
  7. Guo, L.; Wen, H. Estimation of CO2 Emissions from Wildfires Using OCO-2 Data. Atmosphere 2019, 10, 581. [Google Scholar] [CrossRef] [Green Version]
  8. Ito, A. Global estimates of biomass burning emissions based on satellite imagery for the year 2000. J. Geophys. Res. 2004, 109, D14S05. [Google Scholar] [CrossRef]
  9. Michel, C. Biomass burning emission inventory from burnt area data given by the SPOT-VEGETATION system in the frame of TRACE-P and ACE-Asia campaigns. J. Geophys. Res. 2005, 110, D09304. [Google Scholar] [CrossRef] [Green Version]
  10. van der Werf, G.R.; Randerson, J.T.; Giglio, L.; Collatz, G.J.; Kasibhatla, P.S.; Arellano, A.F. Interannual variability in global biomass burning emissions from 1997 to 2004. Atmos. Chem. Phys. 2006, 6, 3423–3441. [Google Scholar] [CrossRef] [Green Version]
  11. Wiedinmyer, C.; Quayle, B.; Geron, C.; Belote, A.; McKenzie, D.; Zhang, X.; O’Neill, S.; Wynne, K.K. Estimating emissions from fires in North America for air quality modeling. Atmos. Environ. 2006, 40, 3419–3432. [Google Scholar] [CrossRef]
  12. Lapina, K.; Honrath, R.E.; Owen, R.C.; Val Martín, M.; Pfister, G. Evidence of significant large-scale impacts of boreal fires on ozone levels in the midlatitude Northern Hemisphere free troposphere. Geophys. Res. Lett. 2006, 33, L10815. [Google Scholar] [CrossRef]
  13. Simpson, I.J.; Rowland, F.S.; Meinardi, S.; Blake, D.R. Influence of biomass burning during recent fluctuations in the slow growth of global tropospheric methane. Geophys. Res. Lett. 2006, 33, L22808. [Google Scholar] [CrossRef] [Green Version]
  14. Rego, F.C.; Rigolot, E.; Fernandes, P.; Montiel, C.; Silva, S.S. EFI Policy Brief; European Commission: Brussels, Belgium, 2010. [Google Scholar]
  15. Urbanski, S.P.; Hao, W.M.; Baker, S. Chapter 4 chemical composition of wildland fire emissions. In Developments in Environmental Science; Elsevier Ltd.: Amsterdam, The Netherlandes, 2008; pp. 79–107. ISBN 9780080556093. [Google Scholar]
  16. IPOCC. Intergovernmental Panel On Climate Change, Climate Change 2007—The Physical Science Basis: Working Group I Contribution to the Fourth Assessment Report of the IPCC; Cambridge University Press: Cambridge, UK, 2007. [Google Scholar]
  17. Gutro, R. Covers Wildfires Using Many Sources. Available online: https://www.nasa.gov/mission_pages/fires/main/missions/index.html (accessed on 29 March 2021).
  18. Tian, X.-R.; Mcrae, D.J.; Shu, L.-F.; Wang, M.-Y.; Li, H. Satellite remote-sensing technologies used in forest fire management. J. For. Res. 2005, 16, 73–78. [Google Scholar] [CrossRef]
  19. van der Werf, G.R.; Randerson, J.T.; Giglio, L.; van Leeuwen, T.T.; Chen, Y.; Rogers, B.M.; Mu, M.; van Marle, M.J.E.; Morton, D.C.; Collatz, G.J.; et al. Global fire emissions estimates during 1997–2016. Earth Syst. Sci. Data 2017, 9, 697–720. [Google Scholar] [CrossRef] [Green Version]
  20. Veefkind, J.P.; Aben, I.; McMullan, K.; Förster, H.; de Vries, J.; Otter, G.; Claas, J.; Eskes, H.J.; de Haan, J.F.; Kleipool, Q.; et al. TROPOMI on the ESA Sentinel-5 Precursor: A GMES mission for global observations of the atmospheric composition for climate, air quality and ozone layer applications. Remote Sens. Env. 2012, 120, 70–83. [Google Scholar] [CrossRef]
  21. Rozemeijer, N.C.; Kleipool, Q. S5P Mission Performance Centre Level 1b V01.00.00. Available online: https://sentinel.esa.int/documents/247904/3541451/Sentinel-5P-Level-1b-Product-Readme-File (accessed on 29 March 2021).
  22. Lama, S.; Houweling, S.; Folkert Boersma, K.; Eskes, H.; Aben, I.; Denier Van Der Gon, H.A.C.; Krol, M.C.; Dolman, H.; Borsdorff, T.; Lorente, A. Quantifying burning efficiency in megacities using the NO2ĝ•CO ratio from the Tropospheric Monitoring Instrument (TROPOMI). Atmos. Chem. Phys. 2020, 20, 10295–10310. [Google Scholar] [CrossRef]
  23. Rooney, B.; Wang, Y.H.; Jiang, J.; Zhao, B.; Zeng, Z.C.H.; Seinfeld, J. Air quality impact of the Northern California Camp Fire of November 2018. Atmos. Chem. Phys. 2020, 20, 14597–14616. [Google Scholar] [CrossRef]
  24. van der Velde, I.R.; van der Werf, G.R.; Houweling, S.; Eskes, H.J.; Veefkind, J.P.; Borsdorff, T.; Aben, I. Biomass burning combustion efficiency observed from space using measurements of CO and NO2 by the TROPOspheric Monitoring Instrument (TROPOMI). Atmos. Chem. Phys. 2021, 21, 597–616. [Google Scholar] [CrossRef]
  25. Shindell, D.T.; Faluvegi, G.; Bell, N.; Schmidt, G.A. An emissions-based view of climate forcing by methane and tropospheric ozone. Geophys. Res. Lett. 2005, 32, L04803. [Google Scholar] [CrossRef]
  26. Rego, F.C.; Fernandes, P.; Sande Silva, J.; Azevedo, J.; Moura, J.M.; Oliveira, E.; Cortes, R.; Viegas, D.X.; Caldeira, D.; Duarte Santos, F. Avaliação do Incêndio de Monchique, Relatório Observatório Técnico Independente; Assembleia da República: Lisboa, Portugal, 2018. [Google Scholar]
  27. Rego, F.C.; Fernandes, P.; Sande Silva, J.; Azevedo, J.; Moura, J.M.; Oliveira, E.; Cortes, R.; Viegas, D.X.; Caldeira, D.; Duarte Santos, F. Relatório de AvaliaÇão do incêndio de Fundada (Vila de Rei—Mação), Relatório Observatório Técnico Independente; Assembleia da República: Lisboa, Portugal, 2019. [Google Scholar]
  28. ESA, E.S.A. ESA, European Spacial Agency, Sentinel Online. Available online: https://sentinel.esa.int/web/sentinel/missions/sentinel-5p (accessed on 29 March 2021).
  29. Schneising, O.; Buchwitz, M.; Reuter, M.; Bovensmann, H.; Burrows, J.P.; Borsdorff, T.; Deutscher, N.M.; Feist, D.G.; Griffith, D.W.T.; Hase, F.; et al. A scientific algorithm to simultaneously retrieve carbon monoxide and methane from TROPOMI onboard Sentinel-5 Precursor. Atmos. Meas. Tech. 2019, 12, 6771–6802. [Google Scholar] [CrossRef] [Green Version]
  30. Apituley, A.; Pedergnana, M.; Sneep, M.; Pepijn, J.; Loyola, D.; Landgraf, J.; Borsdorff, T. Sentinel-5 Precursor/TROPOMI Level 2 Product User Manual Carbon Monoxide; Royal Netherlands Meteorological Institute: De Bilt, The Netherlands, 2018. [Google Scholar]
  31. Apituley, A.; Pedergnana, M.; Sneep, M.; Veefkind, J.P.; Loyola, D.H.O. Sentinel-5 Precursor/TROPOMI Level 2 Product User Manual Methane; Royal Netherlands Meteorological Institute: De Bilt, The Netherlands, 2015. [Google Scholar]
  32. Drysdale, D. An Introduction to Fire Dynamics; John Wiley & Sons, Ltd.: Chichester, UK, 2011; ISBN 9781119975465. [Google Scholar]
  33. Ward, D.E.; Hao, W.M.; Susott, R.A.; Babbitt, R.E.; Shea, R.W.; Kauffman, J.B.; Justice, C.O. Effect of fuel composition on combustion efficiency and emission factors for African savanna ecosystems. J. Geophys. Res. Atmos. 1996, 101, 23569–23576. [Google Scholar] [CrossRef]
  34. Zheng, Z.; Yang, Z.; Wu, Z.; Marinello, F. Spatial Variation of NO2 and Its Impact Factors in China: An Application of Sentinel-5P Products. Remote Sens. 2019, 11, 1939. [Google Scholar] [CrossRef] [Green Version]
  35. Kramer, L.J.; Leigh, R.J.; Remedios, J.J.; Monks, P.S. Comparison of OMI and ground-based in situ and MAX-DOAS measurements of tropospheric nitrogen dioxide in an urban area. J. Geophys. Res. 2008, 113, D16S39. [Google Scholar] [CrossRef]
  36. Wheeler, D.C. Geographically weighted regression. In Handbook of Regional Science; Springer: Berlin/Heidelberg, Germany, 2014; pp. 1435–1459. ISBN 9783642234309. [Google Scholar]
  37. Marchand, M.; Ghennioui, A.; Wey, E.; Wald, L. Comparison of several satellite-derived databases of surface solar radiation against ground measurement in Morocco. Adv. Sci. Res. 2018, 15, 21–29. [Google Scholar] [CrossRef]
  38. ESA. ESA Earth Observation Portal. Available online: https://directory.eoportal.org/web/eoportal/satellite-missions/c-missions/copernicus-sentinel-5#references (accessed on 8 December 2020).
  39. Kganyago, M.; Shikwambana, L. Assessing Spatio-Temporal Variability of Wildfires and their Impact on Sub-Saharan Ecosystems and Air Quality Using Multisource Remotely Sensed Data and Trend Analysis. Sustainability 2019, 11, 6811. [Google Scholar] [CrossRef] [Green Version]
  40. Santoso, M.A.; Christensen, E.G.; Yang, J.; Rein, G. Review of the transition from smouldering to flaming combustion in wildfires. Front. Mech. Eng. 2019, 5, 49. [Google Scholar] [CrossRef]
  41. Ward, D. Combustion Chemistry and Smoke. In Forest Fires; Elsevier: Amsterdam, The Netherlands, 2001; pp. 55–77. [Google Scholar]
  42. Rigby, M.; Prinn, R.G.; Fraser, P.J.; Simmonds, P.G.; Langenfelds, R.L.; Huang, J.; Cunnold, D.M.; Steele, L.P.; Krummel, P.B.; Weiss, R.F.; et al. Renewed growth of atmospheric methane. Geophys. Res. Lett. 2008, 35, L22805. [Google Scholar] [CrossRef] [Green Version]
  43. Worden, J.; Wecht, K.; Frankenberg, C.; Alvarado, M.; Bowman, K.; Kort, E.; Kulawik, S.; Lee, M.; Payne, V.; Worden, H. CH4 and CO distributions over tropical fires during October 2006 as observed by the Aura TES satellite instrument and modeled by GEOS-Chem. Atmos. Chem. Phys. 2013, 13, 3679–3692. [Google Scholar] [CrossRef] [Green Version]
  44. Anderson, W.R.; Cruz, M.G.; Fernandes, P.M.; McCaw, L.; Vega, J.A.; Bradstock, R.A.; Fogarty, L.; Gould, J.; McCarthy, G.; Marsden-Smedley, J.B.; et al. A generic, empirical-based model for predicting rate of fire spread in shrublands. Int. J. Wildl. Fire 2015, 24, 443. [Google Scholar] [CrossRef] [Green Version]
  45. Nunes, L.; Gower, S.T.; Peckham, S.D.; Magalhaes, M.; Lopes, D.; Rego, F.C. Estimation of productivity in pine and oak forests in northern Portugal using Biome-BGC. Forestry 2015, 88, 200–212. [Google Scholar] [CrossRef] [Green Version]
  46. Kasischke, E.S.; Bruhwiler, L.P. Emissions of carbon dioxide, carbon monoxide, and methane from boreal forest fires in 1998. J. Geophys. Res. 2002, 108, 8146. [Google Scholar] [CrossRef] [Green Version]
  47. Al-Saadi, J.A.; Soja, A.J.; Pierce, R.B.; Szykman, J.J.; Wiedinmyer, C.; Emmons, L.K.; Kondragunta, S.; Zhang, X.; Kittaka, C.; Schaack, T.; et al. Intercomparison of near-real-time biomass burning emissions estimates constrained by satellite fire data. J. Appl. Remote Sens. 2008, 2, 021504. [Google Scholar]
  48. Buchwitz, M.; de Beek, R.; Burrows, J.P.; Bovensmann, H.; Warneke, T.; Notholt, J.; Meirink, J.F.; Goede, A.P.H.; Bergamaschi, P.; Körner, S.; et al. Atmospheric methane and carbon dioxide from SCIAMACHY satellite data: Initial comparison with chemistry and transport models. Atmos. Chem. Phys. 2005, 5, 941–962. [Google Scholar] [CrossRef] [Green Version]
Figure 1. Sentinel 5-P Level-2 data processing steps.
Fire 04 00025 g001
Figure 2. CO surface monitoring concentration and TROPOMI tropospheric CO column concentration. Surface station located in Portimão, Portugal (lat. 37°8′17.988″ N, long. 8°32′31.992″ W); Monchique fire starting point located at lat. 37°23′51.547″ N, long. 8°35′40.682″ W at 13:32 (local time).
Fire 04 00025 g002
Figure 3. CO spatial distribution during the Monchique wildfire. Matrix of analysis centered at lat. 37°23′51.547″ N, long. 8°35′40.682″ W related to the fire starting point. The NaN result (NaN when there is no number that is a sensible result) is represented in white. S5-P TROPOMI covered these spatial distribution profiles at 12:51 (orbit 4173; granule 6), 12:32 (orbit 4188; granule 6), 13:02 (orbit 4203; granule 6), 13:35 (orbit 4216; granule 4), 13:16 (orbit 4230; granule 3), 12:57 (orbit 4244; granule 2), and 12:38 (orbit 4258; granule 1) on 3, 4, 5, 6, 7, 8, and 9 August, respectively.
Fire 04 00025 g003
Figure 4. CO (a) and XCH4 (b) spatial distribution during the Vila de Rei/Mação wildfire. Matrix analysis centered at lat. 39°44′33.562″ N, long. 8°10′45.509″ W related to the fire starting point. The NaN result (NaN when there is no number that would be a sensible result) is represented in white. S5-P TROPOMI covered these spatial distribution profiles at 13:10 (orbit 9153; granule 6), 12:51 (orbit 9167; granule 5), and 12:13 (orbit 9195; granule 3) on 20, 21, and 23 July, respectively.
Fire 04 00025 g004
Figure 5. Trends depicting the highest (pink) and lowest (blue) peak in the CO column (a) and XCH4 (b) prior to, during, and following the Monchique (a1,b1) and Vila de Rei/Mação (a2,b2) wildfires, located in the two geographic coordinates. The estimated data (linear interpolation) is represented in orange and yellow.
Fire 04 00025 g005
Figure 6. Distribution of the CO column and XCH4 across the two wildfires under study. The S5-P TROPOMI data for CO column and XCH4 are shown in yellow (average). The prediction data (adjusted with the CO column data) is represented by a linear fit shown as a dashed black line. (a) Monchique fire and (b) Vila de Rei/Mação fire.
Fire 04 00025 g006
Figure 7. Spatio-temporal analysis on 6, 7, 8, and 9 August for the Monchique wildfire: (a) the spatial representation of CO in the 77 × 77 km2 matrix centered at lat. 37°17′55.644”N, long. 8°30′35.064”W is represented in different tones, with darker colors indicating higher emissions; the burning cells on each of the days are also represented. (b) The results of the ANOVA and plot of the CO column data in both surrounding background and burning areas.
Fire 04 00025 g007
Figure 8. Temporal analysis on 21 July for the Vila de Rei/Mação wildfire: (a) the spatial representation of CO in the 77 × 77 km2 matrix centered at lat. 39°45′5.688″ N, long. 8°3′26.172″ W is represented in different tones, with darker colors indicating higher emissions; the burning cells on each of the days are also represented. (b) The results of the ANOVA and plot of the CO column data in both surrounding background and burning areas.
Fire 04 00025 g008
Table 1. Fire location map and images used for the land cover mapping of the area of the wildfire; data extracted from * Google Earth pro application and from # Sentinel 3-OLCI.
Area of Study *Fire Image #Burned Area #
Fire 04 00025 i001Fire 04 00025 i002Fire 04 00025 i003
Table 2. Predicted CO2 estimated through S5-P TROPOMI CO column data.
CO2 Emission (Molecules/cm2)
MCE = 75%MCE = 92%
Monchique 2018 *
3 084.91 × 10181.89 × 1019
4 084.78 × 10181.84 × 1019
5 084.76 × 10181.82 × 1019
6 081.65 × 10196.35 × 1019
7 081.98 × 10197.59 × 1019
8 084.98 × 10181.91 × 1019
9 085.94 × 10182.28 × 1019
Vila de Rei/Mação 2019 #
20 075.03 × 10181.93 × 1019
21 071.38 × 10195.30 × 1019
23 076.49 × 10182.49 × 1019
* The highest value (attained on 7 August 2018) observed in the corresponding eight matrices (77 × 77 km2 per fire day). Geographic coordinates: lat. 37°16′58.116″ N, long. 8°27′17.136″ W. # The highest value (attained on 21 July 2019) observed in the corresponding eight matrices (77 × 77 km2 per fire day). Geographic coordinates: lat. 39°41′20.760″ N, long. 8° 2′4.452″ W.
Publisher’s Note: MDPI stays neutral with regard to jurisdictional claims in published maps and institutional affiliations.

