Article

Assessing Wildfire Regimes in Indigenous Lands of the Brazilian Savannah-Like Cerrado

1
Graduate Program in Development and Environment, Federal University of Piauí (UFPI), Teresina 64049-550, Brazil
2
Centro de Ecología y Recursos Naturales Renovables, Universidad Nacional de Córdoba, Córdoba X5000HUA, Argentina
*
Author to whom correspondence should be addressed.
Submission received: 15 May 2021 / Revised: 25 June 2021 / Accepted: 30 June 2021 / Published: 5 July 2021

Abstract

:
The Brazilian savannah-like Cerrado is classified as a fire-dependent biome. Human activities have altered the fire regimes in the region, and as a result, not all fires have ecological benefits. The indigenous lands (ILs) of the Brazilian Cerrado have registered the recurrence of forest fires. Thus, the diagnosis of these events is fundamental to understanding the burning regimes and their consequences. The main objective of this paper is to evaluate the fire regimes in Cerrado’s indigenous lands from 2008 to 2017. We used the Landsat time series, at 30 m spatial resolution, available in the Google Earth Engine platform to delineate the burned areas. We used precipitation data from a meteorological station to define the rainy season (RS), early dry season (EDS), middle dry season (MDS), and late dry season (LDS) periods. During 2008–2017, our results show that the total burned area in the indigenous lands and surrounding area was 2,289,562 hectares, distributed in 14,653 scars. Most fires took place between June and November, and the annual burned area was quite different in the years studied. It was also possible to identify areas with high fire recurrence. The fire regime patterns described here are the first step towards understanding the fire regimes in the region and establishing directions to improve management strategies and guide public policies.

1. Introduction

Fire is among the central disturbance and stress agents in the scope of different biomes. In addition, fire is a potential modifier of species’ diversity, distribution, and composition [1,2]. Even though fires occur instinctively in many environments, human-induced burnings have been increasingly frequent around the world. Anthropogenic fires in areas destined for agricultural and livestock activities potentially change regimes’ natural intensity and frequency and significantly alter the biological communities where fire occurs naturally. In addition, other factors—such as climate—can influence fire regimes, which can interact synergistically with human activities and cause or worsen fires [3,4,5,6].
Quantifying and assessing these damages and establishing proper protective policies against wildfires are necessary actions to preserve biodiversity, ensure local and regional atmospheric quality, and reduce the emission of CO2 and equivalent gases [7,8,9]. In addition to registering the number, spatio-temporal distribution, and burned area, it is essential to define the seasonal periods with the highest occurrence of fires and their relations to the local climatic dynamics [10,11,12].
Identifying the probable causes of wildfires also represents an essential factor when planning prevention actions. Wildfires are defined as uncontrolled fires that affect vegetation derived from human actions or natural sources. In turn, burning events are examples of fires resulting from farming and forest practices controlled and acting as a production factor [5,13,14].
The Brazilian savannah-like Cerrado is classified as a fire-dependent biome with dynamics strongly influenced by the climate varying according to the local phytophysiognomy [15]. However, the current livestock practices and agrarian conflicts have altered the fire regime in the region. In this context, fires are not always ecologically beneficial but can, in some circumstances, worsen environmental degradation [16,17,18].
Livestock activities have led to a fast and sharp reduction of the natural Cerrado area, in addition to other human pressures, such as changes in fire regimes, permanently threatening the remaining areas [4]. These pressures have been increasingly intensive and frequent, primarily due to the expansion of the agricultural frontier. As a result, although the productivity per hectare has increased considerably over the last decades, the substitution rate of natural vegetation with cultivated areas in the Cerrado remains with the highest values among the Brazilian biomes [19,20,21,22]. A good example is the region named Matopiba, concerning its localization among the Brazilian states of Maranhão (MA), Tocantins (TO), Piauí (PI), and Bahia (BA) [23,24,25].
In this regard, the Matopiba region has been the focus of studies on different topics of scientific knowledge, such as research discussing the incorporation of former territories of natural reserve into capitalist modes of globalized production, forming a new regionalization in the ‘North–Northeast Cerrado’ of Brazil. In addition, these researchers are often addressing the conflicts involving rural and indigenous communities due to the dispute process of lands traditionally occupied or used by farmers and local livestock breeders, aggregating new dynamics and identities to the territorial domains in this part of the country [26,27,28,29].
Wildfires have been recorded in the indigenous lands (ILs) of the Cerrado. Naturally, these events’ diagnosis is utterly fundamental to understanding the relations between the burning regimes in these areas and their consequences. In this context, our general goal is to analyze the fire regimes in the indigenous lands of the Brazilian Cerrado during 2008–2017 by investigating the spatial and temporal patterns resulting from the relation between rainfall and fires. The study area reaches approximately 1.2 million hectares. Then, our strategy was to use remote sensing data to obtain a historical and comprehensive analysis. The analyses involved the temporal series of the Landsat images at 30 m spatial resolution and precipitation data from the National Institute of Meteorology (INMET—acronym in Portuguese) available for the study area.

2. Materials and Methods
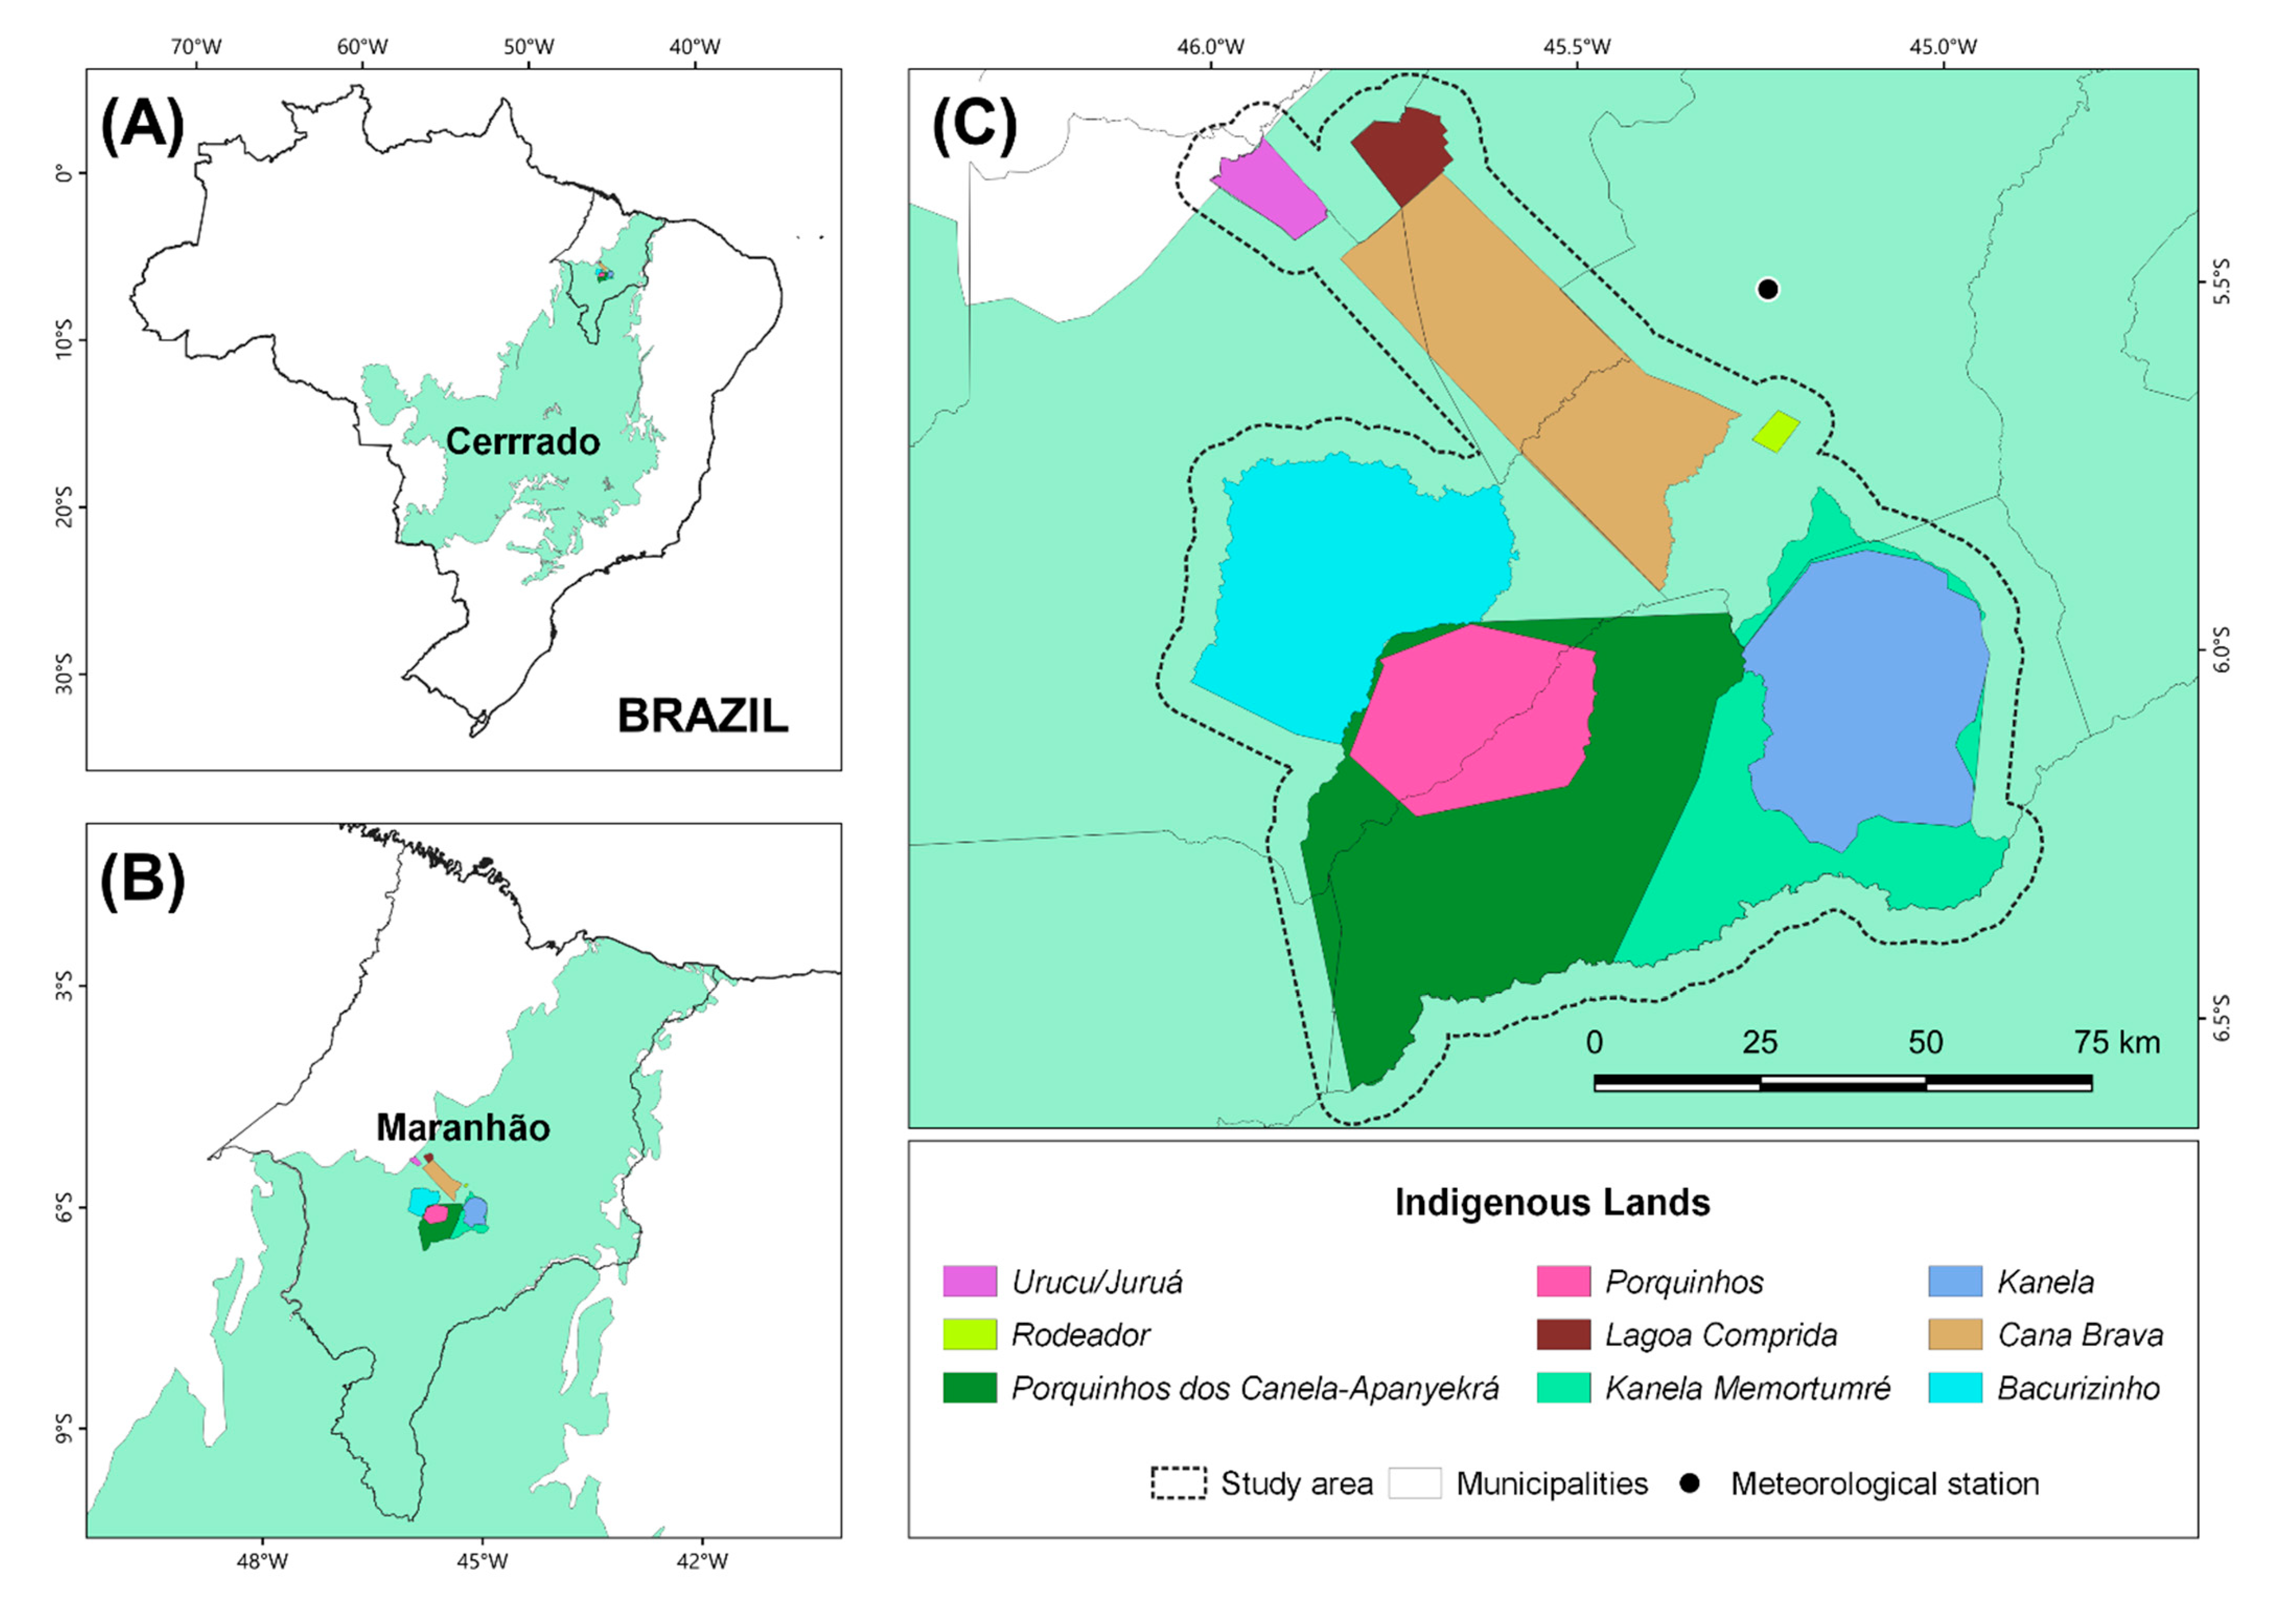
2.1. Study Area

The study area is located in the central part of the Maranhão Brazilian state (Figure 1), in the Brazilian Cerrado biome. The area assembles nine indigenous lands (ILs) (Figure 1 and Table 1) and a buffer of 5 km from the outer limit of the territories, encompassing a total area of approximately 1.2 million hectares.
The indigenous lands in the study area are under distinct legal situations and classified as the following phases (Table 1): (i) delimited: lands that had the assessment published in the Official Gazette of the Federal Government and are under analysis by the Ministry of Justice for the issuance of a Declaratory Ordinance of the Indigenous Traditional Possession; (ii) declared: lands that obtained the expedition of the Declaratory Ordinance by the Minister of Justice and are authorized to be physically demarcated, with the materialization of the landmarks; (iii) regularized: lands that were registered at a notary public in the name of the Union and at the Federal Patrimony Secretariat.
As shown in Table 1, most ILs are at the ‘regularized phase’. However, few ILs are still undergoing the regularization process. The Kanela Memortumré IL represents a proposal of territory expansion for the Memortumré people, currently at the ‘delimited phase’. At the same time, the Porquinhos dos Canela-Apanyekrá IL is an expansion of the Apanyekrá territory, also at the ‘delimited phase’. In turn, the Bacurizinho IL has an 82 thousand hectares at the ‘regularized phase’ and a 52 thousand hectares at the ‘declared phase’. Some of these processes languish for decades and generate intense legal dispute, which favors these traditionally occupied territories’ invasion and illegal occupation.
These indigenous territories have been demarked and regularized since the early 1980s [30,31], and are formed majorly by sandy soils covered with Cerrado vegetation and gallery forests following the streams [32,33]. The Corda River crosses the Porquinhos IL, which shelters more significant forest resources than Kanela IL. The areas surrounding the current indigenous lands of Kanela and Porquinhos are formed mainly by lands of the Mirador State Park Conservation Unit [34,35]. We emphasize that the study area is part of a set of frontiers in the state territories that constitute the Matopiba. In the particular case of Maranhão, the fragment is a late addition to the agricultural modernization patches of this new frontier [23].

2.2. Determination of Seasons

We worked with daily precipitation data from the ‘OMM 82571’ INMET meteorological station, located in the city of Barra do Corda, Maranhão (MA) (latitude: −5.50°; longitude: −45.23°; Figure 1). The station is located approximately 50km from the center of the study area. We manually checked all data from 1983 to 2018 and organized them in climatological years beginning on July 1 (driest month) of each year and ending on June 30 of the following year. We excluded climatological years 1988–1989 and 1989–1990 because they presented missing data that would have compromised the subsequent analysis (more than 30 days of unavailable data). Therefore, we worked with data from 33 years, which is longer than the 30-year period used in climatology to define normal.
The onset and end of the rainy season for each climatological year was established following the methodology of Liebmann, et al. [36] (Equation (1)). If R(j) is the daily precipitation on day j for our study area and R ¯ is its annual average, we define a quantity called anomalous accumulation, A(j), in the following way:
A ( j ) = i = 1 j [ R ( i ) R ¯ ]
where Day 1 is taken to be July 1 (in the dry period).
Thus, the onset of the rainy season of a given climatological year will be the day after that, for which A(j) reaches its minimum value. Similarly, the end of the rainy season corresponds to the day in which A(j) reaches its maximum value.
Then, we calculated the rainy season length, the rain rate and identified the dry season periods. The rainy season length is calculated as the difference (in days) between the onset and the end. The rain rate is the average of the daily precipitation within the dates corresponding to the rainy season. The dry seasons are the periods between those of the rainy seasons. Thus, it is possible to identify the beginning and end of each dry season from the dates corresponding to the previous and posterior rainy seasons.
We report averages and standard deviations because we are interested in the quantities’ central tendencies and interannual variability. Trends were evaluated performing linear regressions, and results were considered significant for p < 0.05.
Furthermore, we identified three possible stages within each dry season following Alves and Pérez-Cabello [37]. First, we identified the middle dry season (MDS) each year by searching for the longest consecutive days with daily precipitation lower than 5 mm. The MDS is usually preceded by a transition period from the previous rainy season with an intermediate level of precipitation, which we call early dry season (EDS), and followed by another transition period towards the next rainy season (RS), that we call late dry season (LDS). As a result of this analysis, we classify every date of each year on one of four different seasonal periods: RS, EDS, MDS, or LDS.

2.3. Delimitation of Fire Scars

This stage involved the selection of the temporal series of Landsat-5, Landsat-7, and Landsat-8 images (Thematic Mapper (TM), Enhanced Thematic Mapper Plus (ETM+), and Operational Terra Imager (OLI) sensors, respectively), from the 2008–2017 period, with 30 m spatial resolution, 221/64 path-row, and Level 2 (surface reflectance) (Table 2), freely available on the catalogs of the Google Earth Engine (GEE) [38], and the Earth Explore United States Geological Survey (USGS) platforms [39].
We mapped the fire scars by adapting the algorithm developed by Bastarrika, et al. [40] in the GEE platform. The Burned Area (BA) algorithm is based on the Automatic Burned Area Mapping Software (ABAMs), developed by Bastarrika, et al. [41]. Firstly, ten multitemporal composites were built by aggregating all available Landsat images for the same year, according to Table 2. Then, for each annual composite, a cloud mask was applied, and three spectral indices were calculated: Normalized Burning Index (NBR), Normalized Burning Index 2 (NBR2), and Normalized Difference Vegetation Index (NDVI), as shown in Equations (2)–(4).
N B R = ( SWIR 2 NIR ) ( SWIR 2 + NIR )
N B R 2 = ( SWIR SWIR 2 ) ( SWIR + SWIR 2 )
N D V I = ( NIR RED ) ( NIR RED )
where RED = red; NIR = near-infrared, SWIR = short-wave infrared, and SWIR2 = short-wave infrared 2.
The preliminary identification of the burned areas, SWIR2, NIR, and red false-color composites was visualized. The algorithm employs a two-phase strategy. In the first phase, the user defines the selection of some pixels in the burned area. In the second phase, the algorithm analyzes the pixels next to those initially selected according to restrictive criteria: assessing the maximum NDVI values of the pre-fire images and the maximum NBR2 values of the post-fire images. Finally, polygons corresponding to the burned areas were generated using the original image’s date as an attribute [40,41].
We also generated false-color images using SWIR, NIR, and green bands to validate burned areas. Thus, the fire scars were visualized in magenta tones. The NIR and SWIR bands are generally applied when studying the behavior of the fire—such as the severity of the burned area—since the NIR has a natural positive reaction to leaf area and productivity. At the same time, the SWIR reacts positively to drought and non-vegetated surfaces [42,43]. Therefore, the combination of high-reflectance NIR and low-reflectance SWIR allows distinguishing burned and non-burned vegetation [44].
We defined the temporal sampling of these false-color composites (SWIR, NIR, and green) based on the seasonality analysis and availability of high-quality images [45]. Preferably for the same year, we considered images from the most humid month in the rainy season and the driest month in the dry season. These annual false-color composites were used to validate the burned areas manually and visually, including the scan line corrector failure of the ETM+ sensor. Subsequently, the images and the burned areas polygons were analyzed and converted into maps to constitute a geographical database [46].

2.4. Spatio-Temporal Dynamics of Fire

According to the seasonal classification from 2008 to 2017, we used the database generated at the previous stages (Section 2.2 and Section 2.3) to establish the seasonal patterns of fire occurrence. Firstly, we generated ten annual synthetic maps containing the delimited scars and subsequently attributed each scar to a corresponding sub-season according to its occurrence date and based on Alves and Pérez-Cabello [37]. Next, we categorized the scars according to the total area, year, season of the year, and month, which enabled us to diagnose the periods with the most occurrences of fires, the periods with the most areas affected by fire, the ILs that were most affected by fire, and other related information. The analyses were performed in QGIS version 3.12 [47].

3. Results

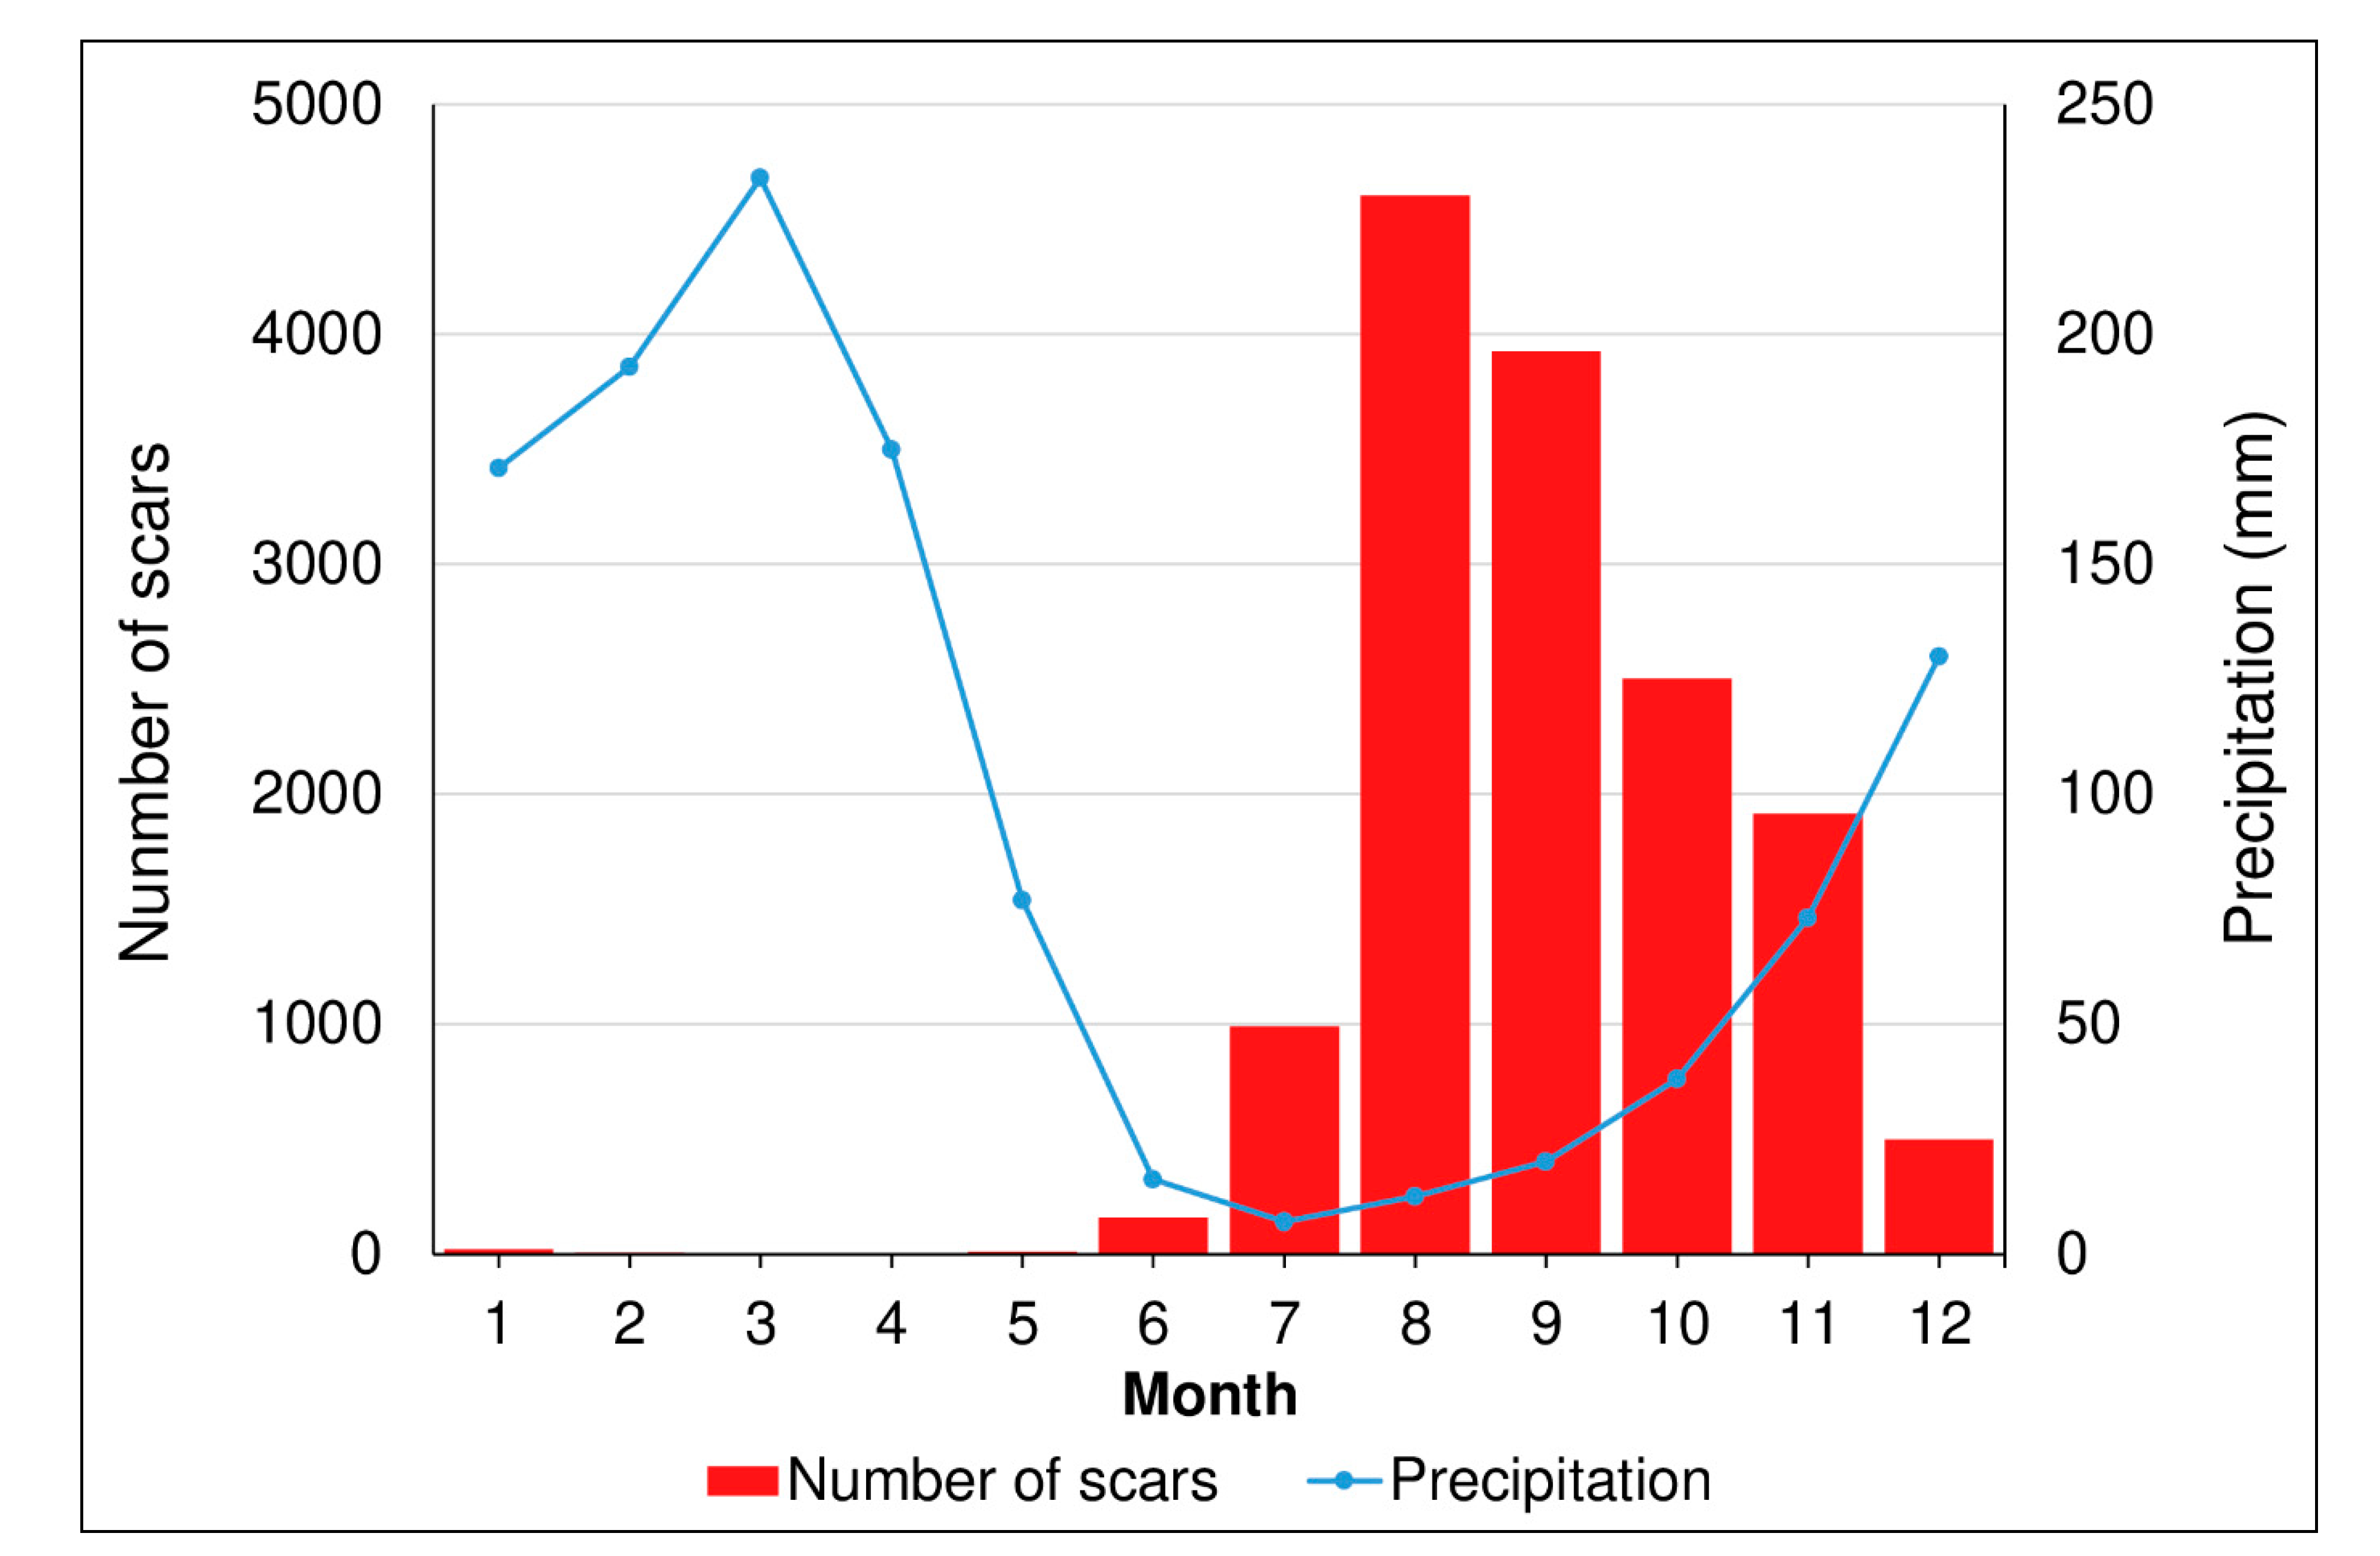
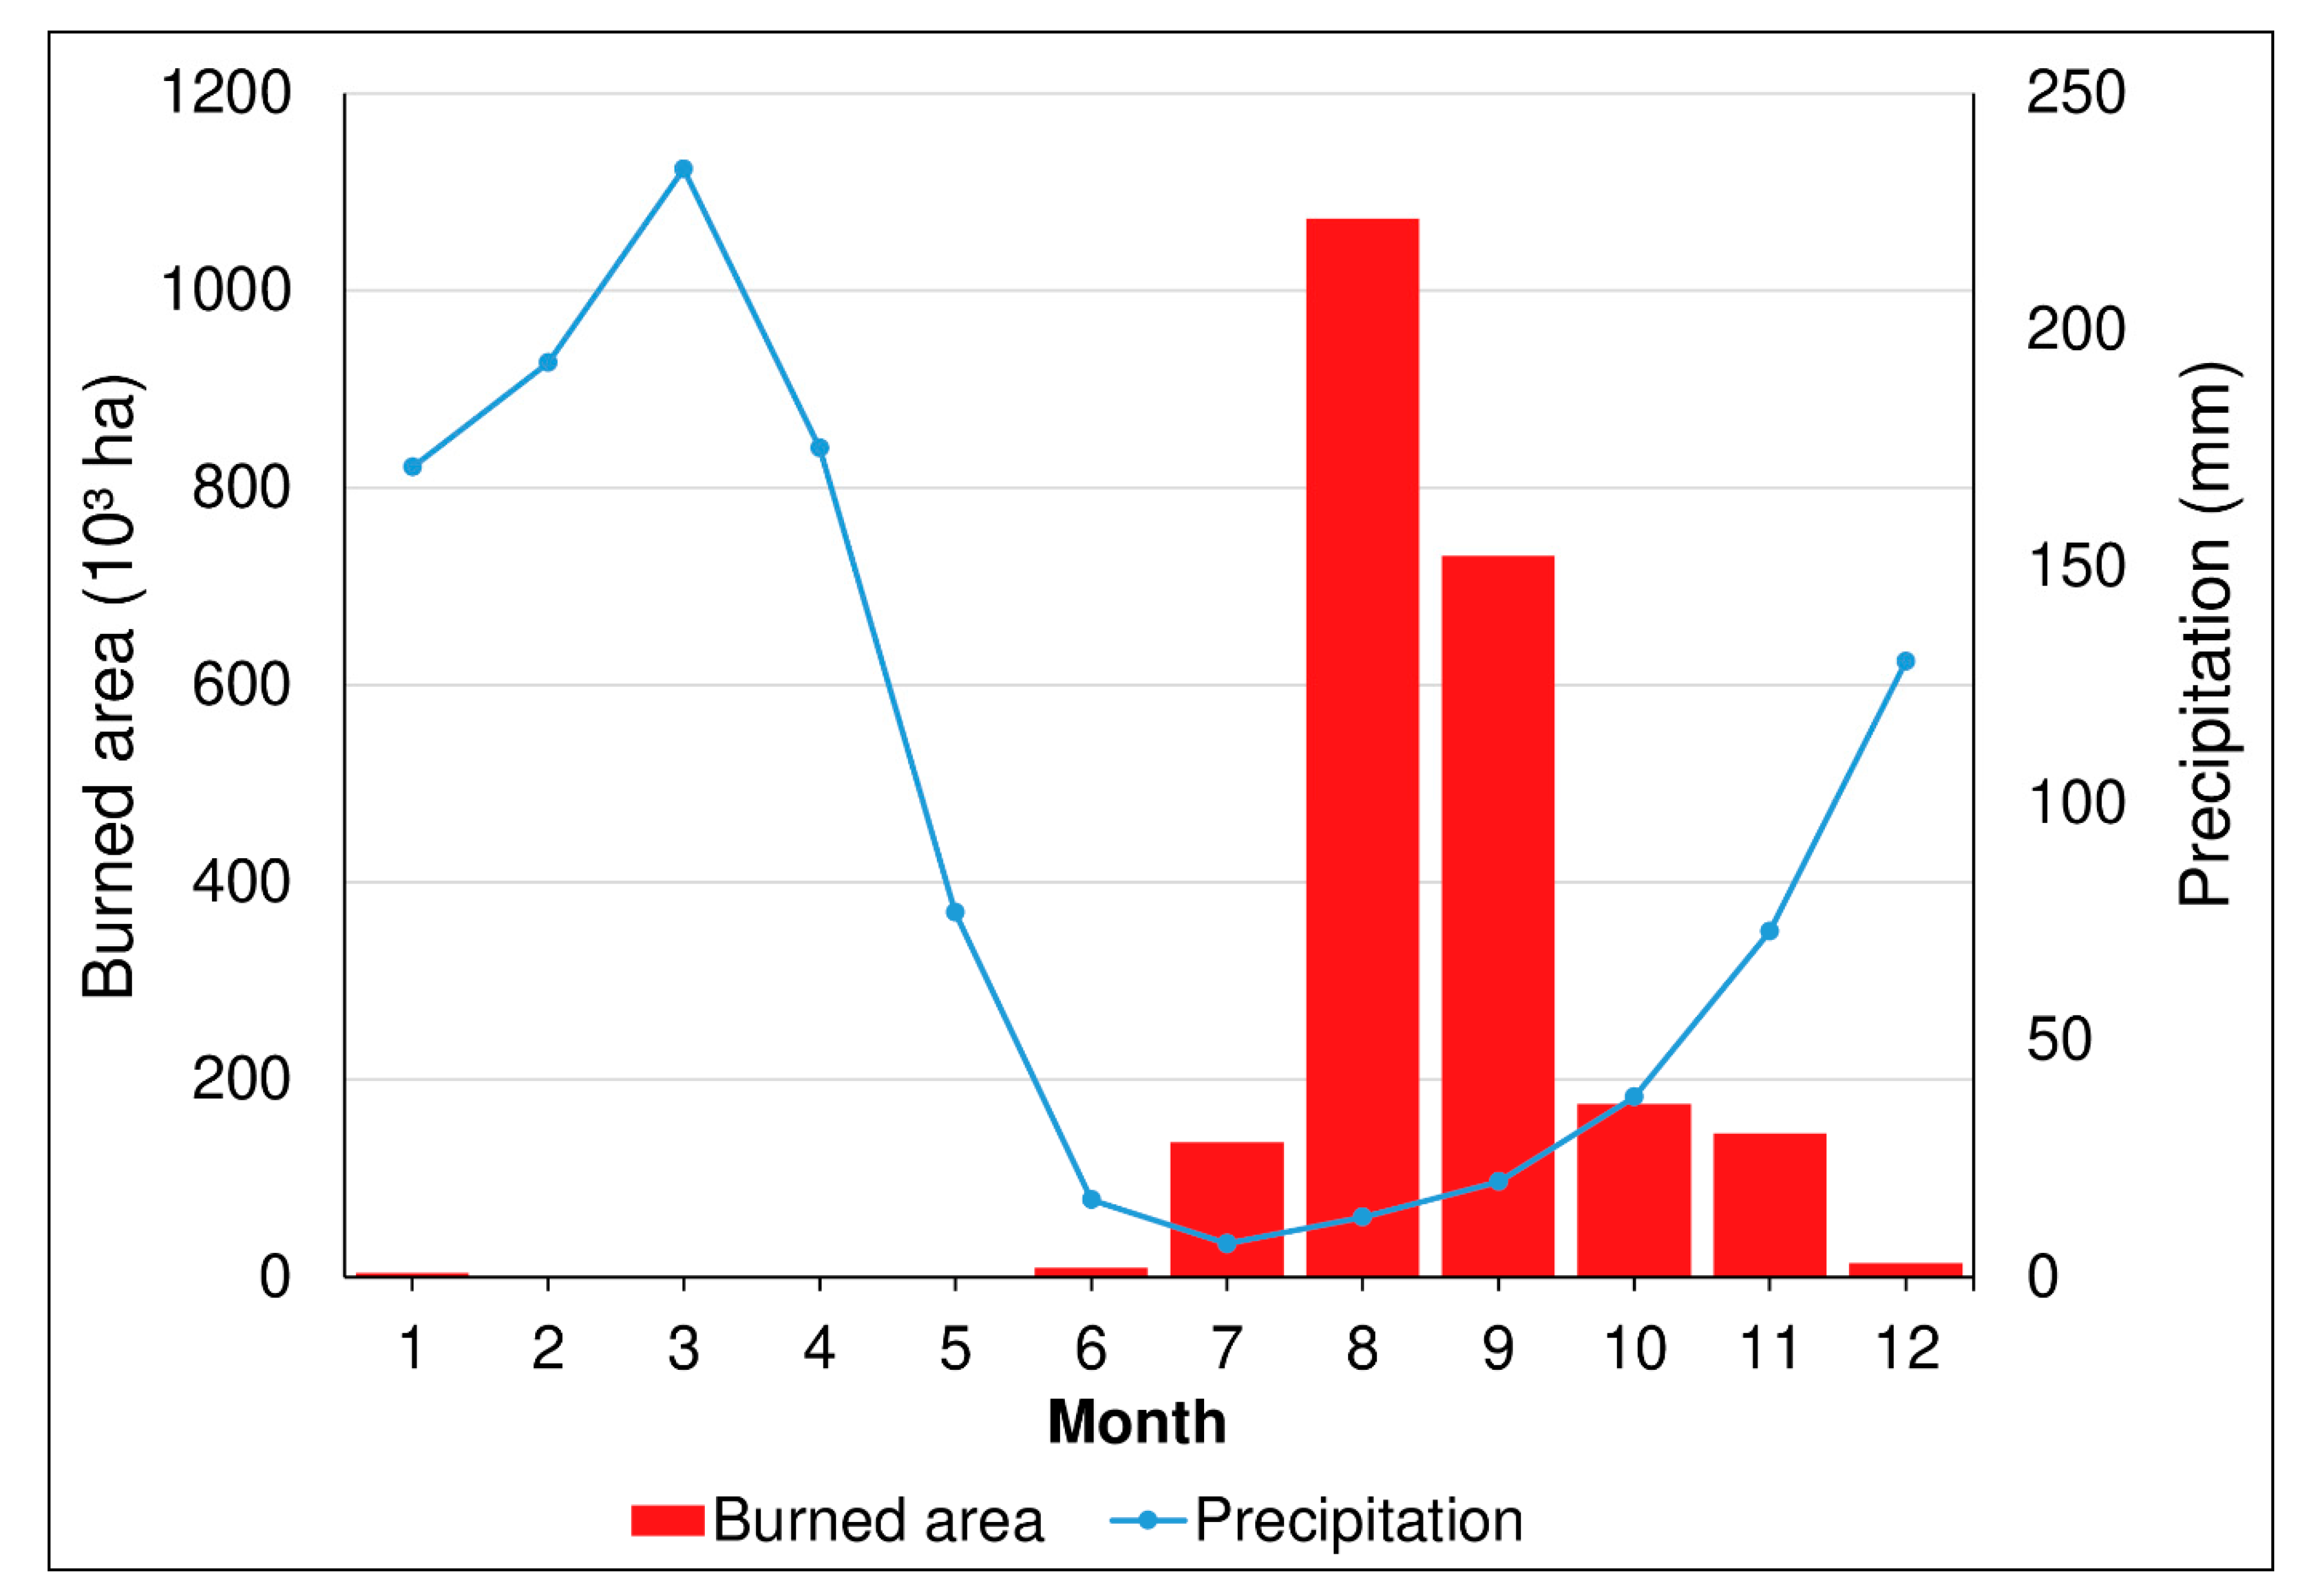
3.1. Local Climate Aspects and Seasonal Classification

We identified significant variability in the year-to-year precipitation-associated quantities calculated considering a 33-year dataset to reflect the local climate scenario in the region. We found annual precipitation of 1146 ± 323 mm, with the months from June to October being the driest ones. The rainiest months occurred between December and April, with a peak in monthly rainfall during March. The average start date of the rainy season was found to be December 7 with a variability of 27 days, while the average end date of the rainy season occurred on April 28, with a variability of 28 days.
The earliest start date of the rainy season was October 18 (corresponding to the climatological year 1997–1998), and the latest start date was January 22 (2002–2003). For the end of the rainy season, the earliest date was March 19 (2006–2007), and the latest date was May 25 (found on both 2012–2013 and 2013–2014). Thus, the 58-day long interval between January 22 and March 19 is the longest period that always belongs to the rainy season (considering the 33 years of study).
The average length of the rainy season is 143 days. The climatological year 2014–2015 had the shortest rainy season (85 days). In contrast, the climatological year with the longest rainy season was 2013–2014 (209 days). The average rainfall rate (average daily rainfall in the rainy period) is 7mm/day. The total annual rainfall occurring within the rainy season dates has been used to measure seasonality [36]. For our study area, it reaches an average of 85%, indicating an intense seasonality.
The annual precipitation for the region presented a significant decreasing tendency of −12 ± 5 mm/year (p = 0.0358, R2 = 0.1345). Interestingly, no significant tendency was found in the temporal attributes of the rainy season: start date (p = 0.7777), end date (p = 0.9933), and length (p = 0.7870). However, the rainfall rate presented a decreasing tendency of −0.07 ± 0.03 (mm/day)/year (p = 0.0374, R2 = 0.1324). Altogether this means that the decreasing tendency in annual precipitation could not be associated with temporal changes in the precipitation regime, such as later arrival of rainfall or earlier withdrawal, but to the fact that the amount of rainfall during the rainfall period is decreasing, which is reflected on the decreasing tendency observed for the rainfall rate.
The dry season, as a whole, was found to have a length of 221 ± 35 days, with 49 ± 34 days corresponding to EDS; 93 ± 41, to MDS; and 78 ± 51 days, to LDS. Table 3 presents the start and end dates of the dry seasons for the ten years relevant to the fire categorization (period from 2008 to 2017).

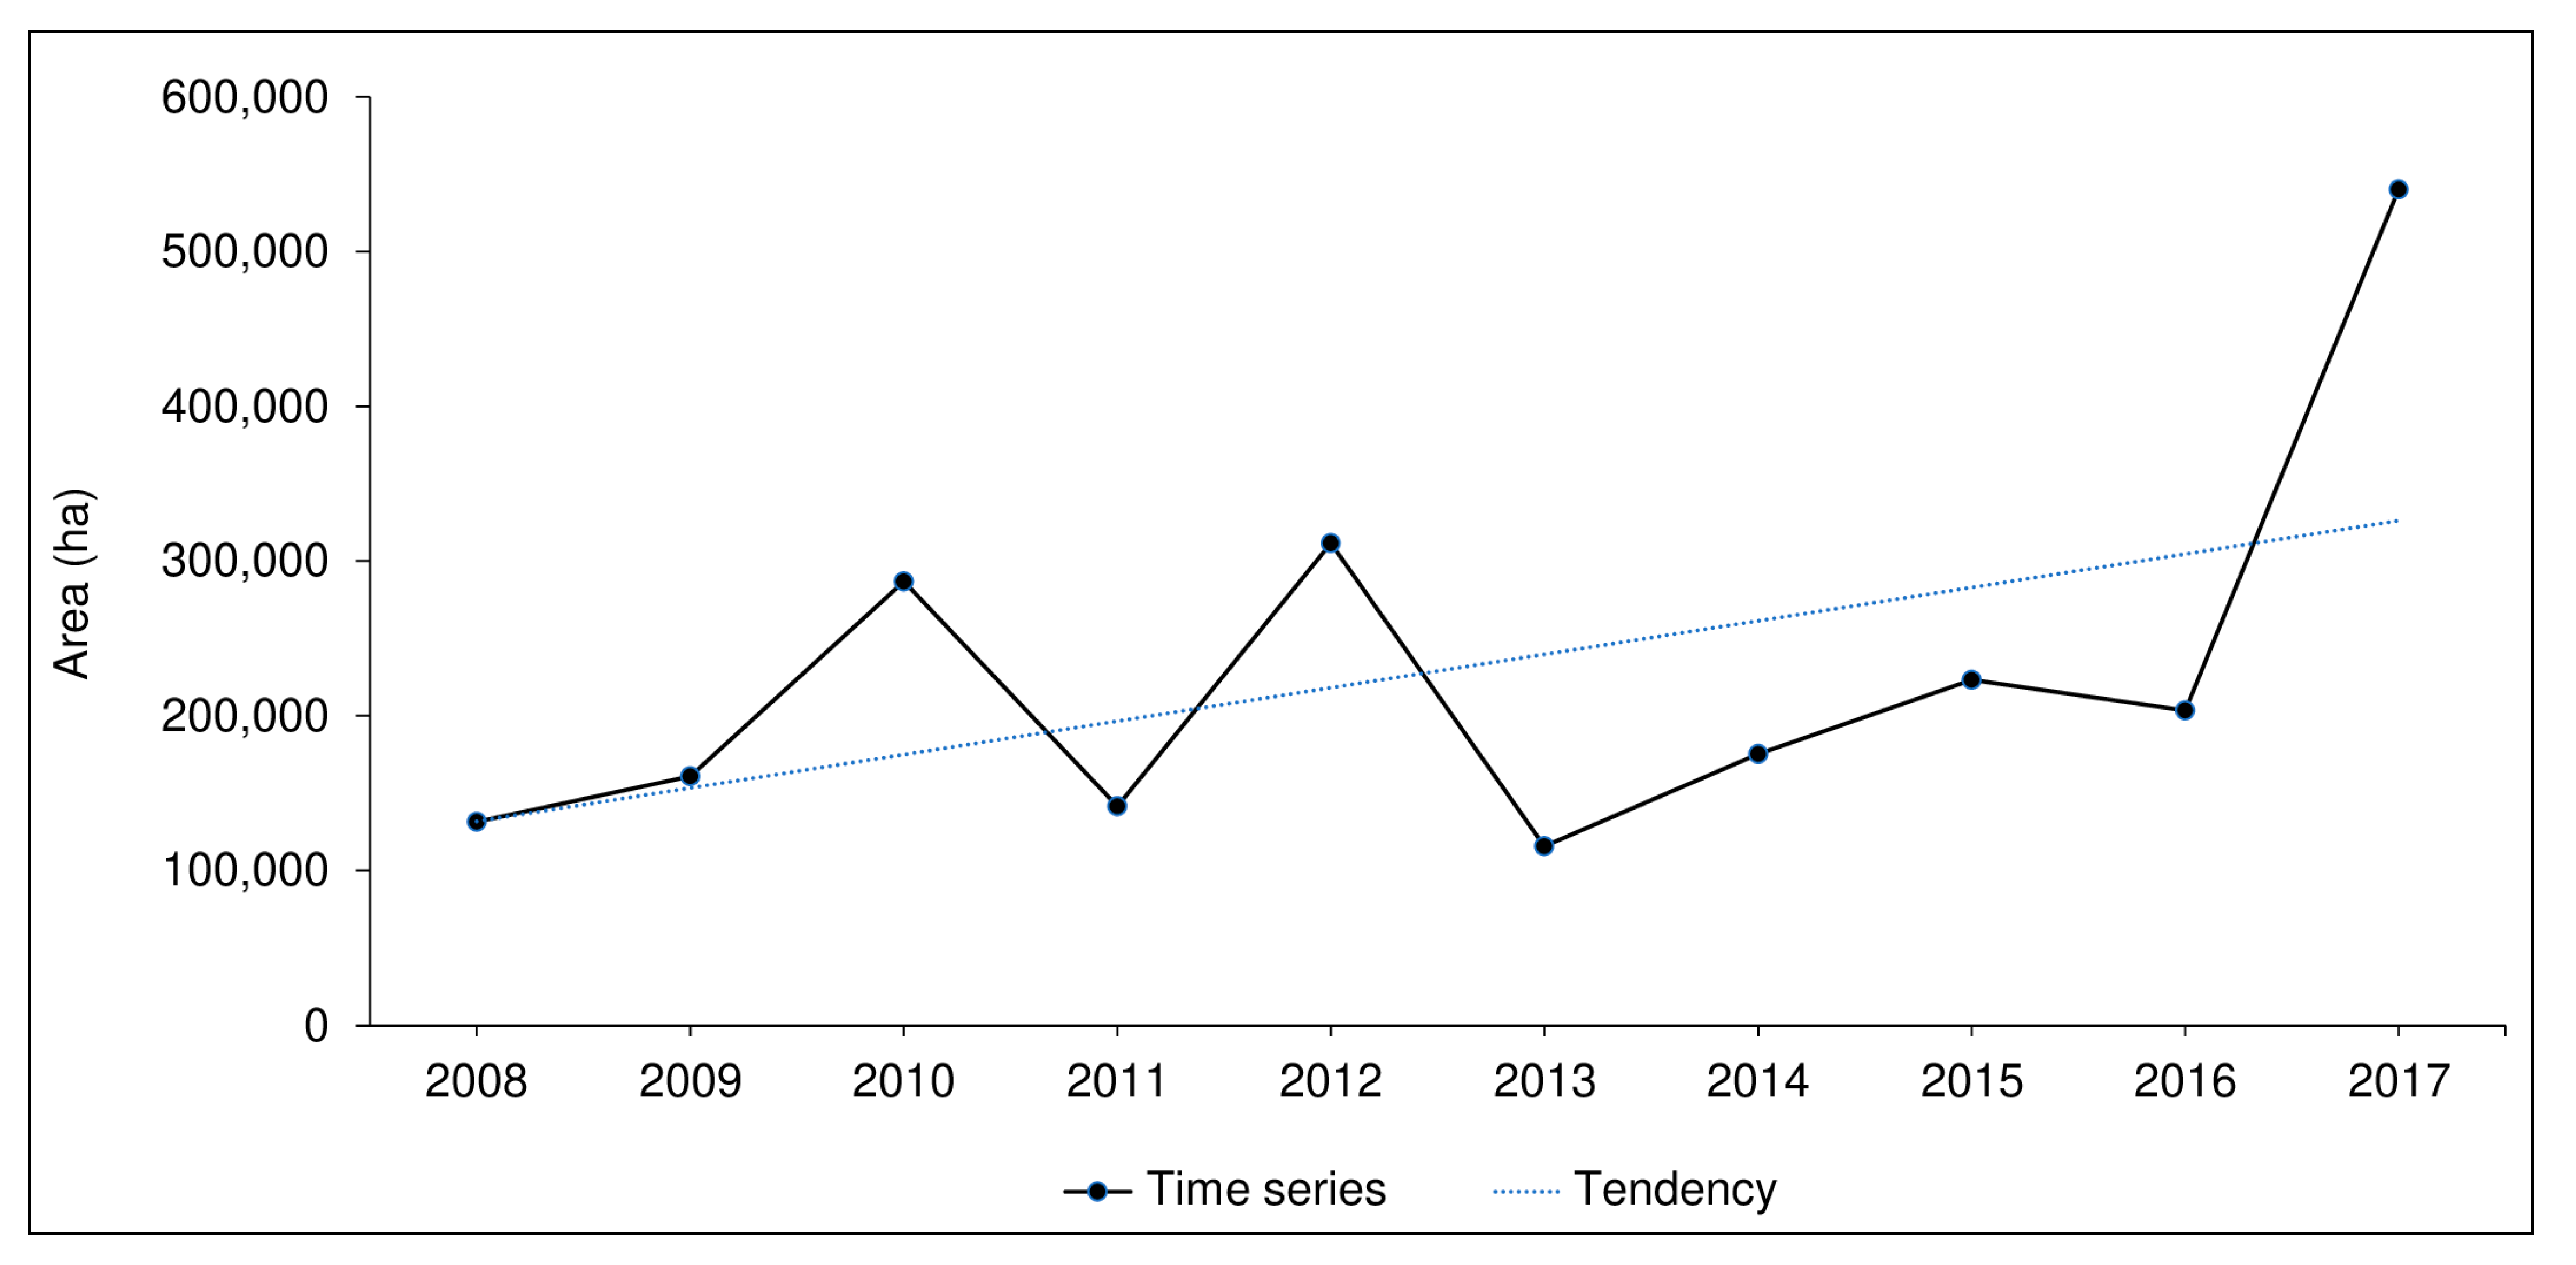
3.2. Annual Patterns of Burned Area

From 2008 to 2017, the total burned area in the ILs and surrounding area reached 2,289,562 ha (Table 4), distributed in 14,653 scars. The entire dry season (DS) concentrated 2,258,250 ha (98.63%) of this total, of which the middle dry season (MDS) consisted of 1,937,430 ha, corresponding to 84.62% of the total accumulated along the ten studied years.
The EDS corresponded to 47,572 ha (2.08%), while the LDS represented 273,248 ha (11.93%) burned. During the rainy season (RS), 31,312 ha (1.37%) were burned (Table 4 and Figure 2). Although the rainy seasons were identified considering the climatological years, the burned areas in the rainy seasons were assigned to the previous corresponding calendar year.
Still, here the rates were accumulated, as in 2012, 2014, and 2015, which presented large extent of the burned area during the DS (ignition season) despite its low production in the RS (growth season). The 2014–2015 RS had the lowest rainfall rate throughout the studied period (549 mm), with a prolonged drought that occurred between 2012 and 2016. Incidentally, the most significant extent of burned areas (2010, 2012, 2016, 2017) occurred in years of prolonged drought (Figure 3).
The annual burned area was quite different over the ten years studied. The years of 2012 and 2017 had the most significant extent of burned areas, with 311,400 and 540,386 ha, respectively, while the years with fewer burned areas were 2008 and 2013, with 131,428 and 115,621 ha, respectively. Table 4 and Figure 2 and Figure 3 illustrate the detailed results. The years with the most significant extent of the burned area occurred with a short return interval between one and two years, a typical pattern in the Cerrado.

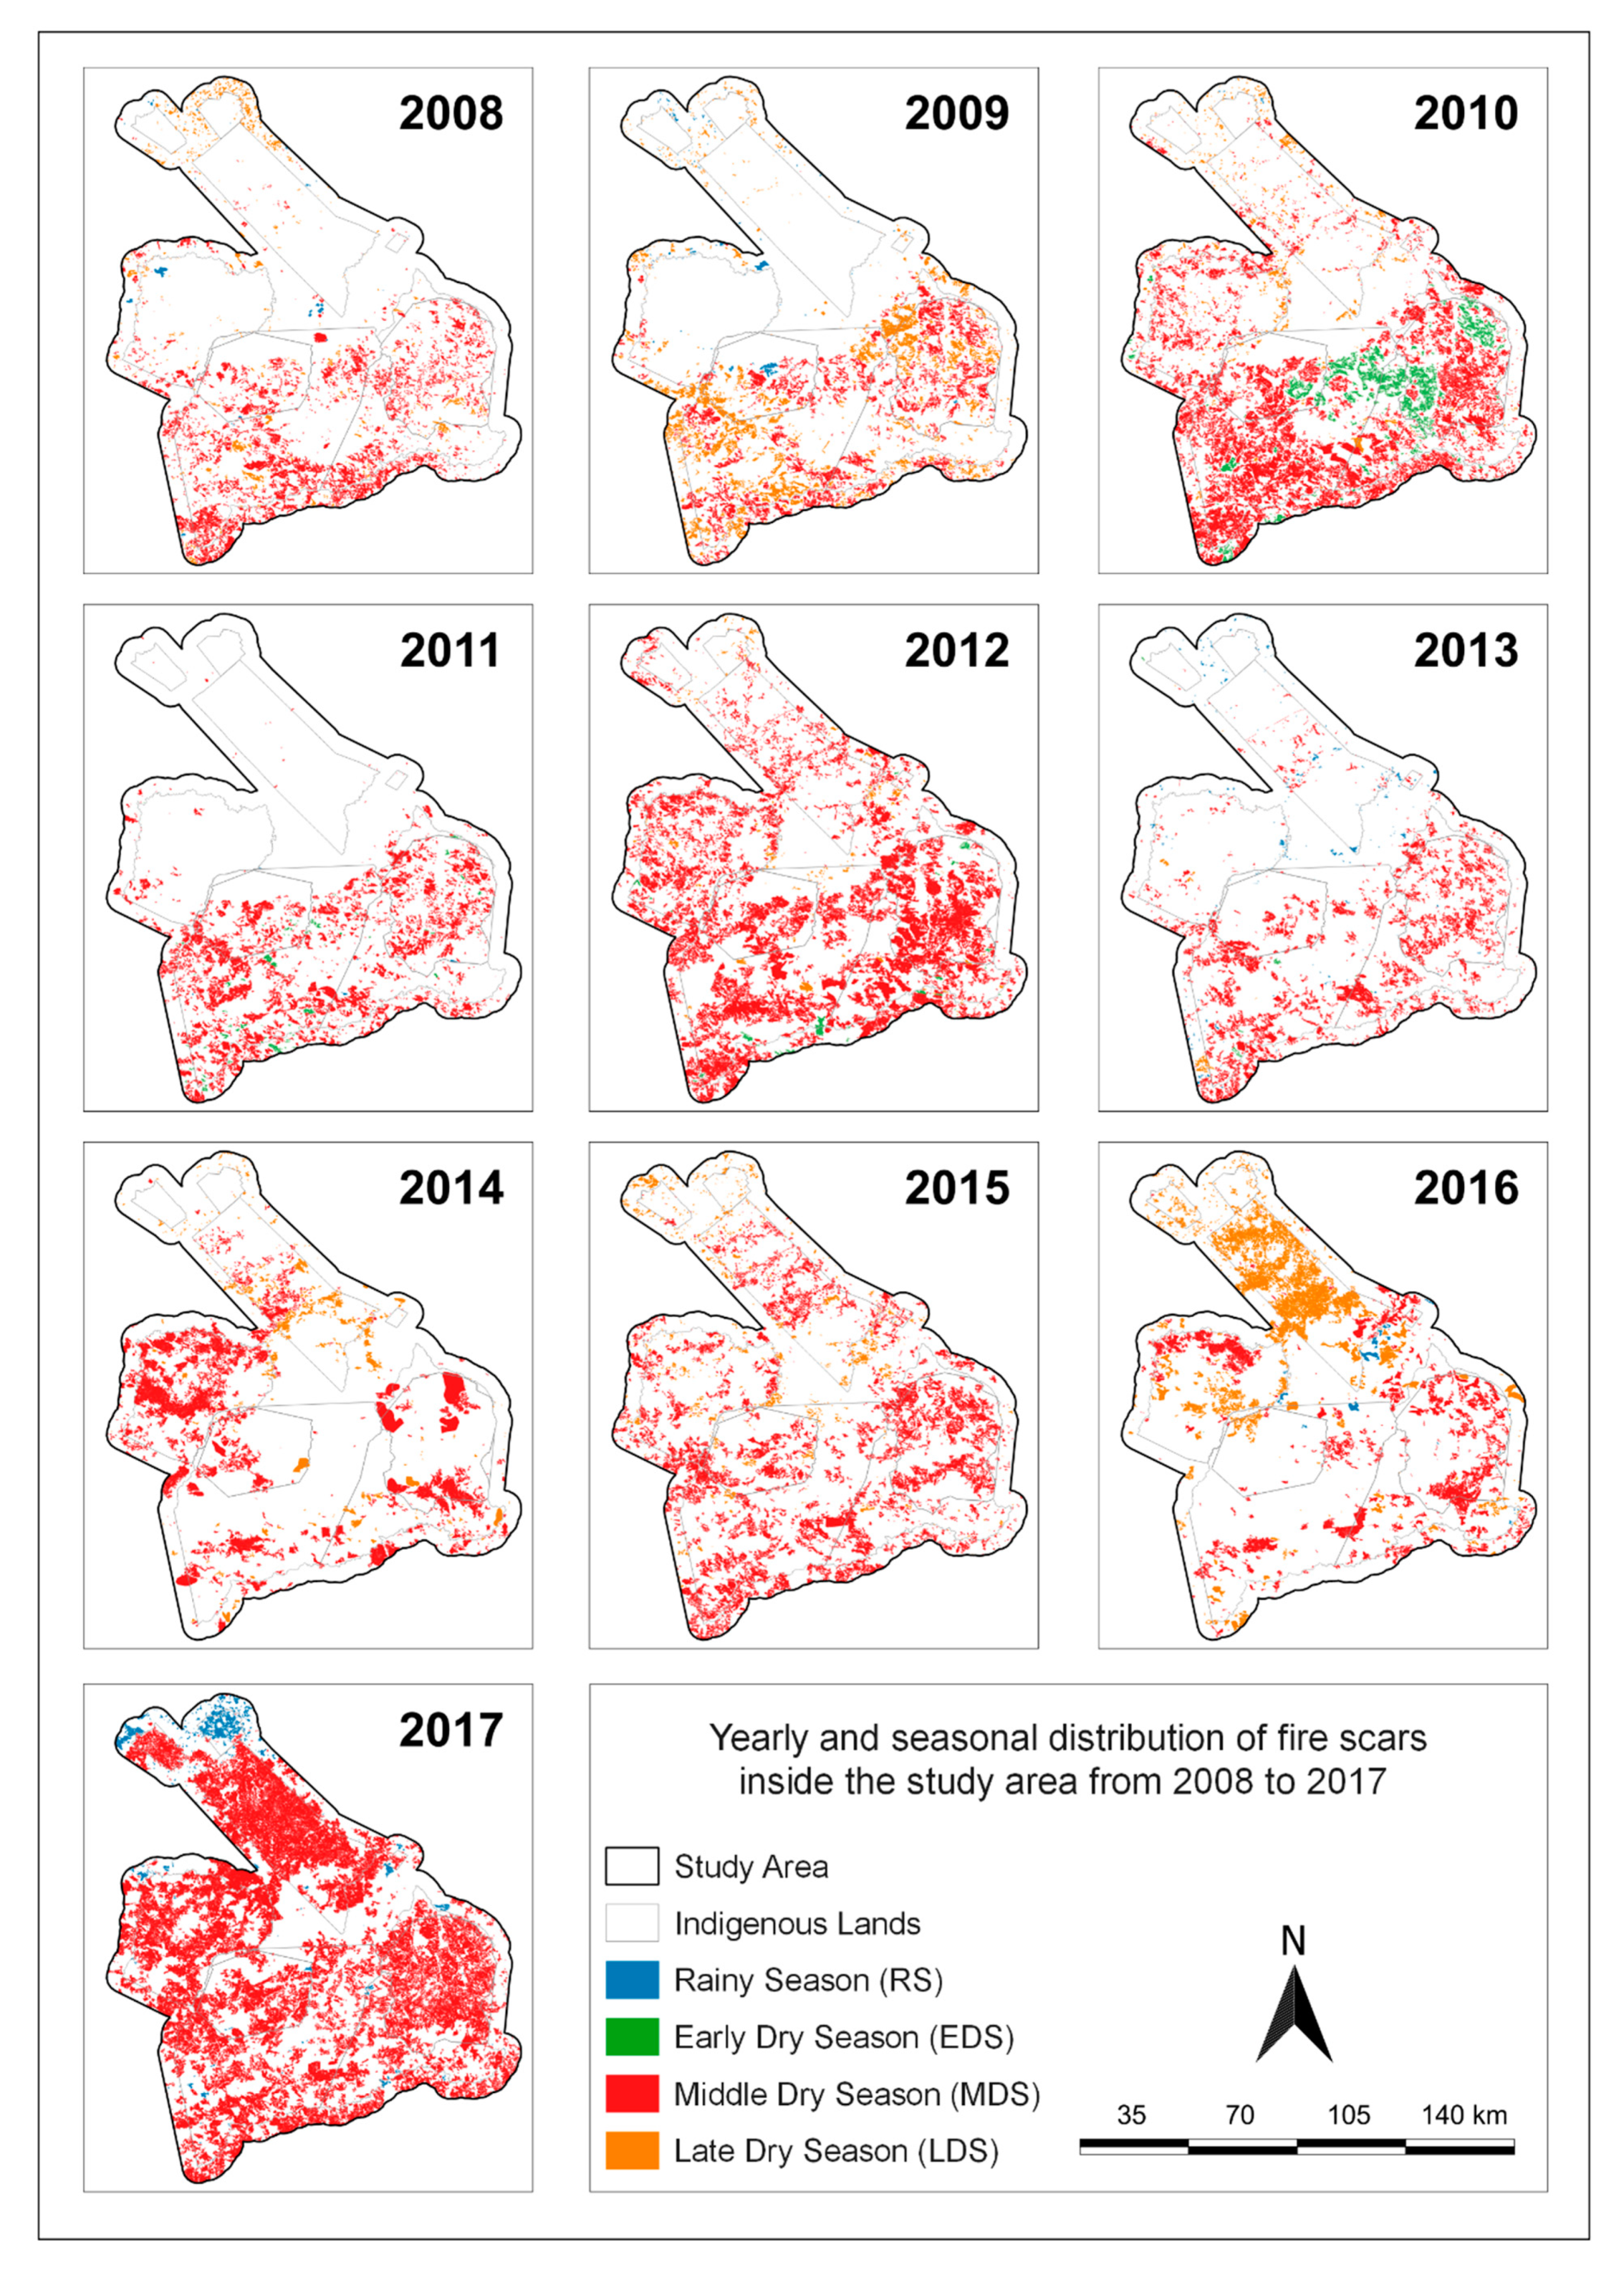
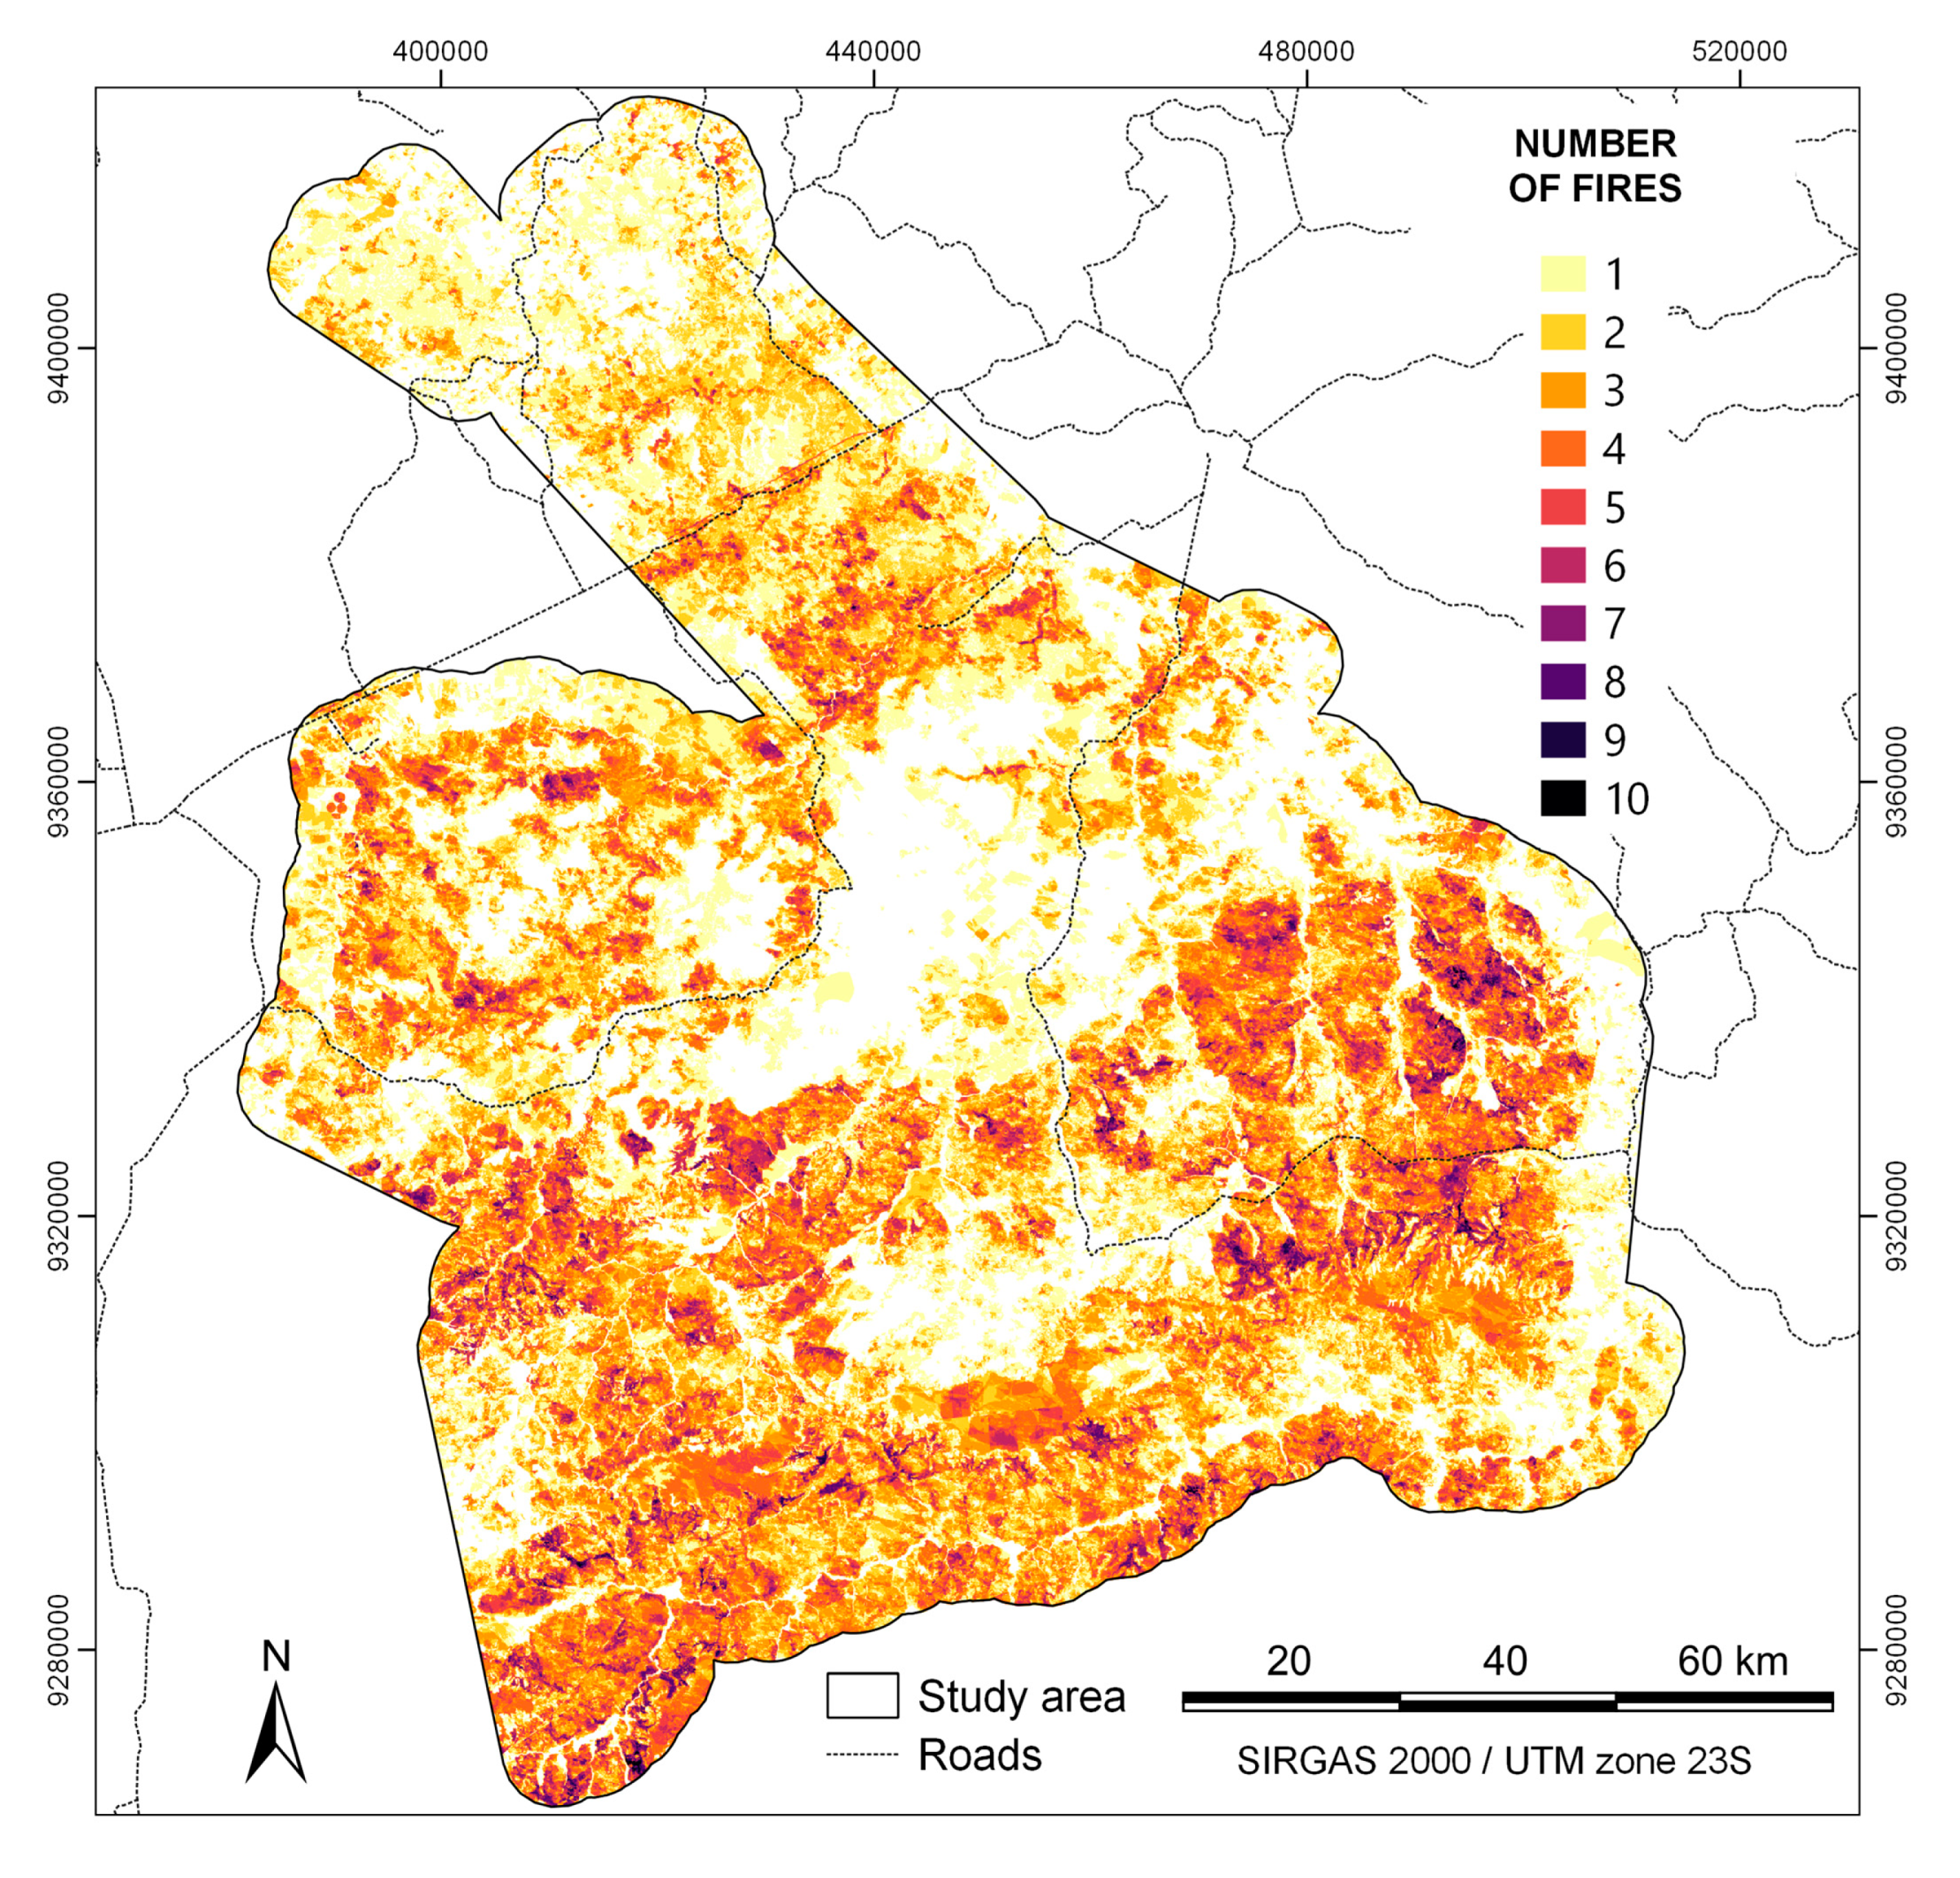
3.3. Spatial and Seasonal Distribution of Fire Scars

Our results demonstrate that the central region was not affected by major burning events and remained intact, which can be associated with their more excellent protection from external ignition agents, a context in which the borders are more susceptible to the occurrence of fires—a pattern found by Alvarado, et al. [48]. Despite the higher recurrence closer to the borders, many scars appeared fully within the ILs limits, suggesting the existence of activities that perform ignitions internally. Burnings for the preparation of coivara (slash-and-burn technique) plantations can be a reasonable explanation for representing one of the most common practices in the region [49] and a potential source of ignition [50].
Figure 4 illustrates the annual maps of the spatial distribution of burnings classified according to the season, which allows visual analysis of the scars’ size, spatial distribution throughout the area, and especially the seasonal occurrence patterns. The maps reveal that the most extensive scars always occur during the MDS, such as the one with a significant extent in 2012 in Bacurizinho IL, and in 2017, with an event that started in the Cana Brava IL and extended to the Bacurizinho IL. These were the most extensive scars in the period, corresponding to 50,795 and 67,977 hectares, respectively.
The most considerable amount of burned area occurred during the MDS for each year (~1000 fires). The only exception is the year of 2016, when the largest burned area occurred during the LDS (104,379 ha), while the MDS reached 95,709 ha, which much likely resulted from the short duration of MDS in 2016 (97 days). In turn, the LDS was one long season (92 days). Even though its quantity of burned area remained relatively similar, demonstrating that the MDS is the most critical period in the year.
Separately, the MDS presented 84.62% of the total burned area, which was expected since the driest period in the year favors the occurrence of ignitions, a pattern commonly recorded for the Cerrado [37] and likely to have resulted from the low humidity content in the accumulated biomass. The MDS had a longer duration (average of 93 days) than the other sub-seasons. Even though, no relation between the MDS duration and the annual burned area (simple linear regression: p = 0.595, R² = 0.030) was found. Additionally, the year with the longest MDS (2008) presented few burned areas (110,001 ha).
Both the EDS and LDS had similar durations, which were regular and relatively close to the MDS. Only two years did not present all dry seasons: 2014 did not have an EDS, while LDS was absent in 2017, differing from a Caatinga-Cerrado ecotone in the adjacent Piauí state, which had less stable EDS and LDS, as presented by Argibay, Sparacino and Espindola [6].
Most fires took place between June and ends in November, reaching a maximum peak in August. Most fires occurred between July and October, a pattern already found in the Cerrado formations of Maranhão state [51]. Nearly no burned areas occurred from December to May, except for January 2016 (11,063 ha), likely due to the drought that occurred during those years [5], with short RSs and low rainfall. Figure 5 illustrates the monthly variation of accumulated burned area and mean precipitation.
August, September, and October correspond to 86.44% of the burned area throughout the studied years, with 1,072,901, 731,080, and 175,017 ha, respectively. The highest percentage of the burned area (38%) in August can be explained because it is following the driest month of the year, July, which suggests that the produced biomass needs little time to dry out and become a fuel susceptible for ignition. Although the highest percentage of the burned area occurred in August, the most significant number of scars was found in September, whose burned area is lower than in the former month, according to the illustrations in Figure 5 and Figure 6.

3.4. Map of Fire Recurrence

Figure 7 illustrates the map of fire recurrence with colors representing the number of fires throughout the ten years of study, following a pattern in which the darker the color, the higher the recurrence. Approximately 864,986 ha burned at least once, representing 68.52% of the study area.
The recurrence parameter varied between one and ten, implying those fire events occurred in the most burned areas approximately every year, and 69.28% of the total burned area had some level of recurrence (599,261 ha). Similar results were found in the National Park of Serra do Tombador [52] and other protected areas, characterizing that it is common for the Cerrado to present a high recurrence of fires [53] with short return intervals.
Approximately 13.34% of the area (115,408 ha) burned five times or more, which is expected considering that the burned area in a year generally does not burn in the following year. The areas that burned five times or more were proportionally much fewer than those that burned four times or less. A preliminary understanding of these results suggests that an area that burned once is likely to burn again over the years.

4. Discussion

Our results show that the years with the largest extent of the burned area were followed by years presenting smaller extent, which can imply that the burned area in a year controls the next year’s rate. This pattern occurs because the biomass accumulated is burned and consequently is not enough to act as fuel able to cause major fires, which had been observed in a study by Alves and Pérez-Cabello [37]. Such tendency emerges when comparing the three years with the highest rates of burning events (2017 not included) and the subsequent corresponding year (2010–2011, 2012–2013, 2015–2016).
The years with the largest extent of the burned area occurred between an interval of one or two years, a behavior common in Cerrado environments also observed in national parks and other indigenous lands [37,48]. This short return interval can be related to the intrinsic high recovery of grasslands during the rainy season, a physiognomies that predominates the Cerrado formations, which implies a great accumulation of biomass susceptible to fire [54,55].
Biomass is produced during the RS and increases with higher rainfall rates, especially after the DS [56]. We assume that the biomass produced throughout the RS that was not consumed by fire in the immediate DS is accumulated along with the new biomass generated in the following RS, thus becoming a fuel much likely to burn. This can be demonstrated by analyzing the years before those with large extent of burned areas. The years 2010, 2012, and 2017 were preceded by years with a rate of the burned area close to or below the average found for the studied period—2009, 2011, and 2016, respectively.
The year 2017 had the highest percentage of the burned area (540,386 ha) considering the entire study period. A possible explanation is that the previous years (2013, 2014, 2015, 2016) presented few burned areas, leading the accumulated fuel to result in major fires in the following year. Rainfall can control fire activity indirectly through the production and availability of fuel [57]. We found a relation between the RS rainfall and the subsequent annual burned area so that the years with the lowest rainfall rates had larger extent of burned areas.
This demonstrates that the quantity of biomass produced (proportional to the rainfall amount) does not represent a satisfactory parameter to define the quantity of burned area during the immediate DS. Therefore, the RS was related to the extent of burned area in the immediate DS not due to productivity, but likely because of the fuel humidity, which also modulates the extent of fires since the driest years favor the loss of fuel humidity, leaving it more susceptible to ignition [4].
When years with rain deficit in respect to the historical average occur, the tendency is that the extent of burned areas increases—a pattern found in the Cerrado portion of Maranhão as a whole [51], and in other regions of Brazil, as reported by Darbyshire, et al. [58] and Dionizio, et al. [59]. Such tendency is quite important since our analyses found that the period in the study tended to have lower rainfall rates in the region, which was also observed by Argibay, Sparacino and Espindola [6].
This scenario demonstrates the sensitivity of the Cerrado to fire occurrence in the driest years, a phenomenon that occurs mainly due to the more intense water deficit in the vegetation. Even though low annual rainfall has been found to influence the extent of burned area, we emphasize that such relation is not determinant, since other aspects should be considered, such as sources of ignition, wind, and temperature [53,60].
It is possible to observe a pattern that could explain the large dimensions of the burned areas in some years. Firstly, all rainy seasons with rainfall rates above or close to the average were followed by a dry season with few burned areas. However, when another RS with low rainfall rate followed the RS, the immediate DS presented large extent of burned area, which may have occurred in 2017, when the burned fuel was likely generated in the RS of 2015–2016, with a rainfall rate of 830 mm—below the annual average (~1146 mm).
Some factors may have contributed to the large extent presented in 2017. In addition to the absence of large extent of the burned area between 2013 and 2016, the RSs of 2012–2013, 2013–2014, and 2015–2016 had satisfactory rainfall rates, favoring biomass accumulation. The 2016–2017 RS was particularly dry and had low biomass production. However, accumulation had occurred during the previous years. Associated with a long DS, a low rainfall rate led the accumulated fuel to dry out, becoming more susceptible to burning, as found by de L. Dantas, et al. [61].
A similar pattern appeared between 2013 and 2015. Even though 2012–2016 is considered a drought period when analyzed as a set, the rainy season of 2013–2014 had a rainfall rate close to the average value (1179 mm). Thus, the biomass produced was supposedly dried out during the 2014–2015 RS, which was the shortest in the study period, with only 85 days—below the annual average (143 days).
A tendency to a more considerable extent of the burned area has appeared over the last years: magnitude was much more prominent in the second half of the study period, which may have resulted from the prolonged drought between 2012 and 2016 in Maranhão state, regarded as highly severe. Some authors explain its relation to events of La Niña (2011–2012) and El Niño (2015) [62,63], also described to have triggered fire events in the Cerrado and the Amazon [64,65,66].
Drought events can lead to changes in the patterns of fire occurrence, and studies have demonstrated their effects on the dynamics of fire in the Cerrado of Maranhão state [51]. This is a complex natural phenomenon that causes severe environmental, social, and economic consequences [67], affecting water availability, death of trees, which leads to lower absorption of carbon in the ecosystems [68], and mainly greater vulnerability of the vegetation to the occurrence of burnings [48,69,70].
Regarding the spatial and seasonal distributions of fire scars, we demonstrated that almost no fire scars appeared during the EDS. The total accumulated for the season is 47,572 ha, around 2.08% of the burned area in the period. Despite short duration, the lower rainfall levels seem to be enough to maintain the biomass humidity or indicate that there is no reasonable time frame for the biomass to dry out and become susceptible to burning, as recorded by Hoffmann, et al. [71] in the scope of forest areas. The absence of ignition events associated with the slash-and-burn practice can also represent a determinant factor since it occurs at the stage in which the green vegetation is cut to dry out during the remaining DS.
After the MDS, the LDS presented the most significant burning events (273,248 ha). The RS presented mostly small scars; in addition, a great extent corresponding to this season occurred in 2017 (17,514 ha), when no LDS occurred. Thus, the RS was only slightly less susceptible to fire than the EDS. We highlight that most of the fires detected in the RS occurred at the beginning of this season, during the months of November and December, when the vegetation would be relatively dry (similarly to LDS). Furthermore, from January to May (RS) almost no new fire scars were detected and only those from the previous years remained visible.
Considering the fire recurrence patterns, our results reinforce the marked characteristics of the Cerrado, experiencing burning cycles interspersed in one, two, or three years. However, the burned areas are usually the same, generally associated with the savannah and grassland physiognomies [4,72].
The combined mapping of all scars allows describing the general patterns of occurrence/recurrence of fire and their association with different spatial parameters, regarded as a satisfactory method to identify risky areas [73]. For example, it is possible to identify high recurrence regions in the center of Bacurizinho IL—where some of the fires gained significant media repercussion—which is an area that presented the most fire outbreaks in Brazil in 2018, as previously mentioned.
There seems to be a relation between the recurrence of burning and the region of Cana Brava IL cut by the BR 222 highway. Studies by Alvarado, Fornazari, Cóstola, Morellato and Silva [48], Argibay, Sparacino and Espindola [6], and Fonseca, et al. [74] also found such relation of high-flow highways and burning recurrence. The areas of northeastern borders of Kanela IL and southeast of Porquinhos dos Canela-Apanyekrá IL also present considerable recurrence rates. A possible explanation is that the borders of indigenous territories and environmental parks are more susceptible to ignition events because of their facilitated access to frontiers with private lands.
It is worth emphasizing that fire recurrence is a natural characteristic of the Cerrado found in different agricultural contours in the biome, such as indigenous lands [48], national parks [52], and private lands [71]. In the Cerrado of Maranhão state, the recurrence of grassland physiognomy has been demonstrated to be higher than forest areas [51].
Such recurrence is also related to the characteristics of the Cerrado vegetation, which has different levels of adaptation to fire. These areas shelter many plant species that are adapted to fire, in addition to reproduction purposes, such as seed dormancy break [4,16,72,75,76,77,78]. Natural ignitions occur especially between the end of the dry season and the start of the rainy season due to lightning strikes [76,77]. Our results suggest that most ignitions are human-induced since the burning events occurred majorly in the middle dry season—the driest period, without storms.
Another critical factor is that large-scale natural fires are sporadic in forest vegetation sensitive to fire and have no continuous grass layer [79]. These plants did not evolve with fire and had a high mortality rate when damaged by increasingly frequent human-induced fires.
Over the last 50 years, the fire regimes in the region have been particularly intensified: fires have become more frequent and concentrated at the end of the dry season (August to October) [4]. In addition, significant wildfires spread throughout the vegetation, both resistant and susceptible to fire, causing severe adverse ecological effects [5,80,81].

5. Conclusions

Our study introduced a database of burned area scars in the context of indigenous lands in the Cerrado of the Maranhão Brazilian state. The patterns identified allowed us to understand the fire regimes and the relation between fire occurrence dimensions and climate. We also presented annual and seasonal fire patterns and recurrence dynamics and discussed the different interactions among rainfall, productivity, biomass humidity, and proximity to roads, among others. Furthermore, we addressed a possible relation between fire and socio-environmental issues, especially regarding land regularization in ILs and risks to the native populations.
Our study explained the importance of monitoring fire regimes by integrating climatic variables and remote sensing techniques in the scope of the Cerrado. The integration of satellite images and meteorological data allowed us to address an essential area for biome conservation, with fine spatial resolution and landscape scale. Ecological studies on the interaction between fire and vegetation can aggregate the description of fire regimes and their consequences to biodiversity and ecosystem functioning.
We used the availability of Landsat temporal series to encompass a ten-year study with a resolution of 30 m that allowed us to identify small burned areas. The use of daily rainfall data from a local meteorological station proved a practical approach to describe year-to-year and seasonal climate heterogeneity. Studies associating fire and climatic data are of great interest, considering that climate is a major determinant of fire activity. Identifying regions with a high recurrence of fire in indigenous lands and surroundings can contribute to implementing preventive policies and management instruments to preserve local integrity and the health of residents.

Author Contributions

Conceptualization, P.M., J.S. and D.A.; methodology, P.M., J.S., D.A. and G.E.; software, V.S.J.; validation, P.M. and D.A; writing—original draft preparation, P.M. and R.B.; writing—review and editing, G.E.; visualization, V.S.J.; supervision, R.B. and G.E.; funding acquisition, G.E. All authors developed and discussed the manuscript together and finally wrote the paper. All authors have read and agreed to the published version of the manuscript.

Funding

This research was funded by the Brazilian National Council for Scientific and Technological Development (CNPq)—Grant Number 441950/2018-3.

Data Availability Statement

Not Applicable.

Acknowledgments

The authors would like to thank UFPI for supporting this research.

Conflicts of Interest

The authors declare no conflict of interest. The funder had no role in the design of the study, in the collection, analysis, or interpretation; in the writing of the manuscript; or in the decision to publish the results.

References

  1. Tyukavina, A.; Hansen, M.C.; Potapov, P.V.; Stehman, S.V.; Smith-Rodriguez, K.; Okpa, C.; Aguilar, R. Types and rates of forest disturbance in Brazilian Legal Amazon, 2000–2013. Sci. Adv. 2017, 3, e1601047. [Google Scholar] [CrossRef] [Green Version]
  2. Hislop, S.; Haywood, A.; Jones, S.; Soto-Berelov, M.; Skidmore, A.; Nguyen, T.H. A satellite data driven approach to monitoring and reporting fire disturbance and recovery across boreal and temperate forests. Int. J. Appl. Earth Obs. Geoinf. 2020, 87, 102034. [Google Scholar] [CrossRef]
  3. Durigan, G.; Ratter, J.A. The need for a consistent fire policy for Cerrado conservation. J. Appl. Ecol. 2016, 53, 11–15. [Google Scholar] [CrossRef]
  4. Schmidt, I.B.; Eloy, L. Fire regime in the Brazilian Savanna: Recent changes, policy and management. Flora 2020, 268, 151613. [Google Scholar] [CrossRef]
  5. Fidelis, A.; Alvarado, S.T.; Barradas, A.C.S.; Pivello, V.R. The year 2017: Megafires and management in the Cerrado. Fire 2018, 1, 49. [Google Scholar] [CrossRef] [Green Version]
  6. Argibay, D.S.; Sparacino, J.; Espindola, G.M. A long-term assessment of fire regimes in a Brazilian ecotone between seasonally dry tropical forests and savannah. Ecol. Indic. 2020, 113, 106151. [Google Scholar] [CrossRef]
  7. Ward, D.S.; Shevliakova, E.; Malyshev, S.; Rabin, S. Trends and variability of global fire emissions due to historical anthropogenic activities. Glob. Biogeochem. Cycles 2018, 32, 122–142. [Google Scholar] [CrossRef]
  8. Jones, M.W.; Santín, C.; van der Werf, G.R.; Doerr, S.H. Global fire emissions buffered by the production of pyrogenic carbon. Nat. Geosci. 2019, 12, 742–747. [Google Scholar] [CrossRef] [Green Version]
  9. Werf, G.R.; Randerson, J.T.; Giglio, L.; Leeuwen, T.T.V.; Chen, Y.; Rogers, B.M.; Mu, M.; Van Marle, M.J.; Morton, D.C.; Collatz, G.J.; et al. Global fire emissions estimates during 1997–2016. Earth Syst. Sci. Data 2017, 9, 697–720. [Google Scholar] [CrossRef] [Green Version]
  10. Abatzoglou, J.T.; Williams, A.P.; Boschetti, L.; Zubkova, M.; Kolden, C.A. Global patterns of interannual climate–fire relationships. Glob. Chang. Biol. 2018, 24, 5164–5175. [Google Scholar] [CrossRef] [PubMed]
  11. Yang, J.; Tian, H.; Tao, B.; Ren, W.; Kush, J.; Liu, Y.; Wang, Y. Spatial and temporal patterns of global burned area in response to an-thropogenic and environmental factors: Reconstructing global fire history for the 20th and early 21st centuries. J. Geophys. Res. Biogeosci. 2014, 119, 249–263. [Google Scholar] [CrossRef]
  12. Abatzoglou, J.T.; Williams, A.P.; Barbero, R. Global emergence of anthropogenic climate change in fire weather indices. Geophys. Res. Lett. 2019, 46, 326–336. [Google Scholar] [CrossRef] [Green Version]
  13. Ramos-Neto, M.B.; Pivello, V.R. Lightning fires in a Brazilian savanna National Park: Rethinking management strategies. Environ. Manag. 2000, 26, 675–684. [Google Scholar] [CrossRef] [PubMed]
  14. Rissi, M.N.; Baeza, M.J.; Gorgone-Barbosa, E.; Zupo, T.; Fidelis, A. Does season affect fire behaviour in the Cerrado? Int. J. Wildland Fire 2017, 26, 427–433. [Google Scholar] [CrossRef]
  15. Durigan, G. Zero-fire: Not possible nor desirable in the Cerrado of Brazil. Flora 2020, 268, 151612. [Google Scholar] [CrossRef]
  16. Klink, C.A.; Machado, R.B. Conservation of the Brazilian cerrado. Conserv. Biol. 2005, 19, 707–713. [Google Scholar] [CrossRef]
  17. Eloy, L.; Schmidt, I.B.; Borges, S.L.; Ferreira, M.C.; Dos Santos, T.A. Seasonal fire management by traditional cattle ranchers prevents the spread of wildfire in the Brazilian Cerrado. Ambio 2019, 48, 890–899. [Google Scholar] [CrossRef]
  18. Welch, J.R.; Coimbra, C.E., Jr. Indigenous fire ecologies, restoration, and territorial sovereignty in the Brazilian Cerrado: The case of two Xavante reserves. Land Use Policy 2019, 104055. [Google Scholar] [CrossRef]
  19. Mataveli, G.A.V.; Pereira, G.; Chaves, M.E.D.; Cardozo, F.D.S.; Stark, S.C.; Shimabukuro, Y.E.; Aragão, L.E.; de Oliveira, G.; Chen, J.M. Deforestation and land use and land cover changes in protected areas of the Brazilian Cerrado: Impacts on the fire-driven emissions of fine particulate aerosols pollutants. Remote Sens. Lett. 2021, 12, 79–92. [Google Scholar] [CrossRef]
  20. zu Ermgassen, E.K.; Ayre, B.; Godar, J.; Lima, M.G.B.; Bauch, S.; Garrett, R.; Green, J.; Lathuillière, M.J.; Löfgren, P.; MacFarquhar, C. Using supply chain data to monitor zero deforestation commitments: An assessment of progress in the Brazilian soy sector. Environ. Res. Lett. 2020, 15, 035003. [Google Scholar] [CrossRef]
  21. Trigueiro, W.R.; Nabout, J.C.; Tessarolo, G. Uncovering the spatial variability of recent deforestation drivers in the Brazilian Cerrado. J. Environ. Manag. 2020, 275, 111243. [Google Scholar] [CrossRef] [PubMed]
  22. Parente, L.; Nogueira, S.; Baumann, L.; Almeida, C.; Maurano, L.; Affonso, A.G.; Ferreira, L. Quality assessment of the PRODES Cerrado deforestation data. Remote Sens. Appl. Soc. Environ. 2021, 21, 100444. [Google Scholar] [CrossRef]
  23. de Espindola, G.M.; de Silva Figueredo, E.; Júnior, P.P.; dos Reis Filho, A.A. Cropland expansion as a driver of land-use change: The case of Cerrado-Caatinga transition zone in Brazil. Environ. Dev. Sustain. 2021, 1–15. [Google Scholar] [CrossRef]
  24. de Araújo, M.L.S.; Sano, E.E.; Bolfe, É.L.; Santos, J.R.N.; dos Santos, J.S.; Silva, F.B. Spatiotemporal dynamics of soybean crop in the Matopiba region, Brazil (1990–2015). Land Use Policy 2019, 80, 57–67. [Google Scholar] [CrossRef]
  25. Calmon, D. Shifting frontiers: The making of Matopiba in Brazil and global redirected land use and control change. J. Peasant Stud. 2020, 1–25. Available online: https://0-www-tandfonline-com.brum.beds.ac.uk/doi/full/10.1080/03066150.2020.1824183 (accessed on 1 July 2021).
  26. Silva, P.; Rodrigues, J.; Santos, F.; Pereira, A.; Nogueira, J.; DaCamara, C.; Libonati, R. Drivers Of Burned Area Patterns In Cerrado: The Case Of Matopiba Region. In Proceedings of the 2020 IEEE Latin American GRSS & ISPRS Remote Sensing Conference (LAGIRS), Santiago, Chile, 21–26 March 2020; pp. 542–547. [Google Scholar]
  27. Spadotto, B.R.; Martenauer Saweljew, Y.; Frederico, S.; Teixeira Pitta, F. Unpacking the finance-farmland nexus: Circles of cooperation and intermediaries in Brazil. Globalizations 2021, 18, 461–481. [Google Scholar] [CrossRef]
  28. Vieira, R.M.D.S.P.; Tomasella, J.; Barbosa, A.A.; Polizel, S.P.; Ometto, J.P.H.B.; Santos, F.C.; da Cruz Ferreira, Y.; de Toledo, P.M. Land degradation mapping in the MATOPIBA region (Brazil) using remote sensing data and decision-tree analysis. Sci. Total Environ. 2021, 782, 146900. [Google Scholar] [CrossRef]
  29. Dos Reis, L.C.; e Silva, C.M.S.; Bezerra, B.G.; Mutti, P.R.; Spyrides, M.H.C.; Da Silva, P.E. Analysis of Climate Extreme Indices in the MATOPIBA Region, Brazil. Pure Appl. Geophys. 2020, 177, 4457–4478. [Google Scholar] [CrossRef]
  30. Marques, A.R.; Amorim, A.; Fonsesca, A.A.P. Forest restoration activities with the indigenous community in Maranhão. Biodivers. Bras. BioBrasil 2020, 1, 27. [Google Scholar] [CrossRef]
  31. Varga, I.V.D. The unbearable lightness of State: Devastation, genocide, illnesses and misery in the contemporary frontiers of Amazon, in Maranhão. Acta Amaz. 2008, 38, 85–100. [Google Scholar] [CrossRef] [Green Version]
  32. Hunke, P.; Mueller, E.N.; Schröder, B.; Zeilhofer, P. The Brazilian Cerrado: Assessment of water and soil degradation in catchments under intensive agricultural use. Ecohydrology 2015, 8, 1154–1180. [Google Scholar] [CrossRef]
  33. Maranhão, D.D.C.; Pereira, M.G.; Collier, L.S.; dos Anjos, L.H.C.; Azevedo, A.C.; de Souza Cavassani, R. Pedogenesis in a karst environment in the Cerrado biome, northern Brazil. Geoderma 2020, 365, 114169. [Google Scholar] [CrossRef]
  34. Rodrigues, M.D.S.; da Conceição, G. Floristic diversity of different Cerrado, the State Park Mirador, Maranhão, Brazil. Braz. Geogr. J. Geosci. Humanit. Res. Medium 2014, 5, 139–156. [Google Scholar]
  35. Barbosa, D.D.A.; Brasil, L.S.; Azevêdo, C.A.S.D.; Lima, L.R.C. The role of spatial and environmental variables in shaping aquatic insect assemblages in two protected areas in the transition area between Cerrado and Amazônia. Biota Neotrop. 2020, 20. Available online: https://www.scielo.br/j/bn/a/FmLbvR9kyn4RdFksrfSdFrq/?lang=en (accessed on 1 July 2021). [CrossRef]
  36. Liebmann, B.; Camargo, S.J.; Seth, A.; Marengo, J.A.; Carvalho, L.M.; Allured, D.; Fu, R.; Vera, C.S. Onset and end of the rainy season in South America in observations and the ECHAM 4.5 atmospheric general circulation model. J. Clim. 2007, 20, 2037–2050. [Google Scholar] [CrossRef] [Green Version]
  37. Alves, D.B.; Pérez-Cabello, F. Multiple remote sensing data sources to assess spatio-temporal patterns of fire incidence over Campos Amazônicos Savanna Vegetation Enclave (Brazilian Amazon). Sci. Total Environ. 2017, 601, 142–158. [Google Scholar] [CrossRef] [PubMed]
  38. Gorelick, N.; Hancher, M.; Dixon, M.; Ilyushchenko, S.; Thau, D.; Moore, R. Google Earth Engine: Planetary-scale geospatial analysis for everyone. Remote Sens. Environ. 2017, 202, 18–27. [Google Scholar] [CrossRef]
  39. Woodcock, C.E.; Allen, R.; Anderson, M.; Belward, A.; Bindschadler, R.; Cohen, W.; Gao, F.; Goward, S.N.; Helder, D.; Helmer, E.; et al. Free access to Landsat imagery. Science 2008, 320, 1011. [Google Scholar] [CrossRef] [PubMed]
  40. Long, T.; Zhang, Z.; He, G.; Jiao, W.; Tang, C.; Wu, B.; Zhang, X.; Wang, G.; Yin, R. 30 m resolution global annual burned area mapping based on Landsat Images and Google Earth Engine. Remote Sens. 2019, 11, 489. [Google Scholar] [CrossRef] [Green Version]
  41. Bastarrika, A.; Chuvieco, E.; Martín, M.P. Mapping burned areas from Landsat TM/ETM+ data with a two-phase algorithm: Balancing omission and commission errors. Remote Sens. Environ. 2011, 115, 1003–1012. [Google Scholar] [CrossRef]
  42. Key, C.H.; Benson, N.C.; Lutes, D.C.; Keane, R.E.; Caratti, J.F.; Key, C.H.; Benson, N.C.; Sutherland, S.; Gangi, L.J. Landscape assessment (LA). In FIREMON: Fire Effects Monitoring and Inventory System; Gen. Tech. Rep. RMRS-GTR-164-CD; US Department of Agriculture, Forest Service, Rocky Mountain Research Station: Fort Collins, CO, USA, 2006; Volume 164, p. LA-1-55. [Google Scholar]
  43. Lutes, D.C.; Keane, R.E.; Caratti, J.F.; Key, C.H.; Benson, N.C.; Sutherland, S.; Gangi, L.J. FIREMON: Fire Effects Monitoring and Inventory System; Gen. Tech. Rep. RMRS-GTR-164; US Department of Agriculture, Forest Service, Rocky Mountain Research Station. 1 CD.: Fort Collins, CO, USA, 2006.
  44. Meng, R.; Zhao, F. Remote sensing of fire effects: A review for recent advances in burned area and burn severity mapping. In Remote Sensing of Hydrometeorological Hazards; CRC Press: Boca Raton, FL, USA, 2017; pp. 261–283. [Google Scholar]
  45. Vermote, E.; Justice, C.; Claverie, M.; Franch, B. Preliminary analysis of the performance of the Landsat 8/OLI land surface reflectance product. Remote Sens. Environ. 2016, 185, 46–56. [Google Scholar] [CrossRef] [PubMed]
  46. Muenchow, J.; Schratz, P.; Brenning, A. RQGIS: Integrating R with QGIS for Statistical Geocomputing. R J. 2017, 9, 409–428. [Google Scholar] [CrossRef]
  47. Jaya, M.T.S.; Fajar, A.N. Analysis of The Implementation Quantum GIS: Comparative Rffect and User Performance. J. Theor. Appl. Inf. Technol. 2019, 97, 2596–2605. [Google Scholar]
  48. Alvarado, S.T.; Fornazari, T.; Cóstola, A.; Morellato, L.P.C.; Silva, T.S.F. Drivers of fire occurrence in a mountainous Brazilian cerrado savanna: Tracking long-term fire regimes using remote sensing. Ecol. Indic. 2017, 78, 270–281. [Google Scholar] [CrossRef] [Green Version]
  49. Varga, I.V.D. A insustentável leveza do estado: Devastação, genocídio, doenças e miséria nas fronteiras contemporâneas da Amazônia, no Maranhão. Acta Amaz. 2008, 38, 85–100. [Google Scholar] [CrossRef] [Green Version]
  50. Pausas, J.G.; Keeley, J.E. A burning story: The role of fire in the history of life. BioScience 2009, 59, 593–601. [Google Scholar] [CrossRef] [Green Version]
  51. Junior, C.H.L.S.; Anderson, L.O.; Oliveira, L.E.; de Aragão, C.; Rodrigues, B.D. Dinâmica das queimadas no Cerrado do Estado do Maranhão, Nordeste do Brasil. Rev. Dep. Geogr. 2018, 35, 1–14. [Google Scholar] [CrossRef] [Green Version]
  52. Daldegan, G.A.; De Carvalho, O.A.; Guimarães, R.F.; Gomes, R.A.T.; Ribeiro, F.D.F.; McManus, C. Spatial patterns of fire recurrence using remote sensing and GIS in the Brazilian savanna: Serra do Tombador Nature Reserve, Brazil. Remote Sens. 2014, 6, 9873–9894. [Google Scholar] [CrossRef] [Green Version]
  53. Pereira Júnior, A.C.; Oliveira, S.L.; Pereira, J.M.; Turkman, M.A.A. Modelling fire frequency in a Cerrado savanna protected area. PLoS ONE 2014, 9, e102380. [Google Scholar] [CrossRef] [PubMed] [Green Version]
  54. Costa-Milanez, C.; Ribeiro, F.; Castro, P.; Majer, J.; Ribeiro, S. Effect of fire on ant assemblages in Brazilian cerrado in areas containing vereda wetlands. Sociobiology 2015, 62, 494–505. [Google Scholar] [CrossRef] [Green Version]
  55. Grace, J.; Jose, J.S.; Meir, P.; Miranda, H.S.; Montes, R.A. Productivity and carbon fluxes of tropical savannas. J. Biogeogr. 2006, 33, 387–400. [Google Scholar] [CrossRef]
  56. Martínez-Ramos, M.; Balvanera, P.; Villa, F.A.; Mora, F.; Maass, J.M.; Méndez, S.M.-V. Effects of long-term inter-annual rainfall variation on the dynamics of regenerative communities during the old-field succession of a neotropical dry forest. For. Ecol. Manag. 2018, 426, 91–100. [Google Scholar] [CrossRef]
  57. Mayr, M.J.; Vanselow, K.A.; Samimi, C. Fire regimes at the arid fringe: A 16-year remote sensing perspective (2000–2016) on the controls of fire activity in Namibia from spatial predictive models. Ecol. Indic. 2018, 91, 324–337. [Google Scholar] [CrossRef]
  58. Darbyshire, E.; Morgan, W.T.; Allan, J.D.; Liu, D.; Flynn, M.J.; Dorsey, J.R.; O’Shea, S.J.; Lowe, D.; Szpek, K.; Marenco, F.; et al. The vertical distribution of biomass burning pollution over tropical South America from aircraft in situ measurements during SAMBBA. Atmos. Chem. Phys. 2019, 19, 5771–5790. [Google Scholar] [CrossRef] [Green Version]
  59. Dionizio, E.A.; Heil Costa, M.; de Almeida Castanho, A.D.; Ferreira Pires, G.; Schwantes Marimon, B.; Hur Marimon-Junior, B.; Lenza, E.; Martins Pimenta, F.; Yang, X.; Jain, A.K. Influence of climate variability, fire and phosphorus limitation on vegetation structure and dynamics of the Amazon–Cerrado border. Biogeosciences 2018, 15, 919–936. [Google Scholar] [CrossRef] [Green Version]
  60. Hoffmann, W.A.; Orthen, B.; Nascimento, P.K.V.D. Comparative fire ecology of tropical savanna and forest trees. Funct. Ecol. 2003, 17, 720–726. [Google Scholar] [CrossRef]
  61. de Dantas, L.V.; Batalha, M.A.; Pausas, J.G. Fire drives functional thresholds on the savanna–forest transition. Ecology 2013, 94, 2454–2463. [Google Scholar]
  62. Nobre, C.A.; Marengo, J.A. Mudanças Climáticas em Rede: Um Olhar Interdisciplinar; Canal6 Editora: São Paulo, Brazil, 2017. [Google Scholar]
  63. Sano, E.E.; Rosa, R.; Scaramuzza, C.A.D.M.; Adami, M.; Bolfe, E.L.; Coutinho, A.C.; Esquerdo, J.C.D.M.; Maurano, L.E.P.; da Silva Narvaes, I.; de Oliveira Filho, F.J.B.; et al. Land use dynamics in the Brazilian Cerrado in the period from 2002 to 2013. Pesqui. Agric. Bras. 2019, 54. Available online: https://www.scielo.br/j/pab/a/GQYcBYK993bQksGszxwkcsf/?lang=en (accessed on 1 July 2021). [CrossRef]
  64. Alencar, A.A.; Brando, P.M.; Asner, G.P.; Putz, F.E. Landscape fragmentation, severe drought, and the new Amazon forest fire regime. Ecol. Appl. 2015, 25, 1493–1505. [Google Scholar] [CrossRef] [PubMed]
  65. Alencar, A.; Nepstad, D.; Diaz, M.C.V. Forest understory fire in the Brazilian Amazon in ENSO and non-ENSO years: Area burned and committed carbon emissions. Earth Interact. 2006, 10, 1–17. [Google Scholar] [CrossRef]
  66. Jimenez, J.C.; Takahashi, K. Tropical Climate Variability and Change: Impacts in the Amazon. Front. Earth Sci. 2019, 7, 215. [Google Scholar] [CrossRef]
  67. Ji, L.; Peters, A.J. Assessing vegetation response to drought in the northern Great Plains using vegetation and drought indices. Remote Sens. Environ. 2003, 87, 85–98. [Google Scholar] [CrossRef]
  68. Levine, N.M.; Zhang, K.; Longo, M.; Baccini, A.; Phillips, O.L.; Lewis, S.L.; Alvarez-Dávila, E.; de Andrade, A.C.S.; Brienen, R.J.; Erwin, T.L.; et al. Ecosystem heterogeneity determines the ecological resilience of the Amazon to climate change. Proc. Natl. Acad. Sci. 2016, 113, 793–797. [Google Scholar] [CrossRef] [PubMed] [Green Version]
  69. Dwomoh, F.K.; Wimberly, M.C.; Cochrane, M.A.; Numata, I. Forest degradation promotes fire during drought in moist tropical forests of Ghana. For. Ecol. Manag. 2019, 440, 158–168. [Google Scholar] [CrossRef]
  70. Morgan, W.T.; Darbyshire, E.; Spracklen, D.V.; Artaxo, P.; Coe, H. Non-deforestation drivers of fires are increasingly important sources of aerosol and carbon dioxide emissions across Amazonia. Sci. Rep. 2019, 9, 1–15. [Google Scholar] [CrossRef] [Green Version]
  71. Hoffmann, W.A.; Jaconis, S.Y.; McKinley, K.L.; Geiger, E.L.; Gotsch, S.G.; Franco, A.C. Fuels or microclimate? Understanding the drivers of fire feedbacks at savanna–forest boundaries. Austral Ecol. 2012, 37, 634–643. [Google Scholar] [CrossRef]
  72. Franco, A.C.; Rossatto, D.R.; Silva, L.D.C.R.; da Silva Ferreira, C. Cerrado vegetation and global change: The role of functional types, resource availability and disturbance in regulating plant community responses to rising CO 2 levels and climate warming. Theor. Exp. Plant Physiol. 2014, 26, 19–38. [Google Scholar] [CrossRef]
  73. Lemes, P.; Loyola, R. Mudanças climáticas e prioridades para a conservação da biodiversidade. Rev. De Biol. Neotrop. 2014, 11, 1. [Google Scholar]
  74. Fonseca, M.G.; Alves, L.M.; Aguiar, A.P.D.; Arai, E.; Anderson, L.O.; Rosan, T.M.; Shimabukuro, Y.E.; de Aragão, L.E.O.E.C. Effects of climate and land-use change scenarios on fire probability during the 21st century in the Brazilian Amazon. Glob. Chang. Biol. 2019, 25, 2931–2946. [Google Scholar] [CrossRef]
  75. Mistry, J.; Berardi, A.; Andrade, V.; Krahô, T.; Krahô, P.; Leonardos, O. Indigenous fire management in the cerrado of Brazil: The case of the Krahô of Tocantíns. Hum. Ecol. 2005, 33, 365–386. [Google Scholar] [CrossRef]
  76. Pivello, V.R. The use of fire in the Cerrado and Amazonian rainforests of Brazil: Past and present. Fire Ecol. 2011, 7, 24–39. [Google Scholar] [CrossRef]
  77. Ribeiro, J.F.; Walter, B.M.T. As principais fitofisionomias do bioma Cerrado. Cerrado Ecol. Flora 2008, 1, 151–212. [Google Scholar]
  78. Strassburg, B.B.; Brooks, T.; Feltran-Barbieri, R.; Iribarrem, A.; Crouzeilles, R.; Loyola, R.; Latawiec, A.E.; Oliveira Filho, F.J.; de M. Scaramuzza, C.A.; Scarano, F.R.; et al. Moment of truth for the Cerrado hotspot. Nat. Ecol. Evol. 2017, 1, 1–3. [Google Scholar] [CrossRef]
  79. Hoffmann, W.A.; Adasme, R.; Haridasan, M.; de Carvalho, M.T.; Geiger, E.L.; Pereira, M.A.; Gotsch, S.G.; Franco, A.C. Tree topkill, not mortality, governs the dynamics of savanna–forest boundaries under frequent fire in central Brazil. Ecology 2009, 90, 1326–1337. [Google Scholar] [CrossRef] [Green Version]
  80. Pilon, N.A.; Hoffmann, W.A.; Abreu, R.C.; Durigan, G. Quantifying the short-term flowering after fire in some plant communities of a cerrado grassland. Plant Ecol. Divers. 2018, 11, 259–266. [Google Scholar] [CrossRef]
  81. Stanaway, J.D.; Afshin, A.; Gakidou, E.; Lim, S.S.; Abate, D.; Abate, K.H.; Abbafati, C.; Abbasi, N.; Abbastabar, H.; Abd-Allah, F.; et al. Global, regional, and national comparative risk assessment of 84 behavioural, environmental and occupational, and metabolic risks or clusters of risks for 195 countries and territories, 1990–2017: A systematic analysis for the Global Burden of Disease Study 2017. Lancet 2018, 392, 1923–1994. [Google Scholar]
Figure 1. Location of the study area: (A) Cerrado biome in Brazil; (B) Maranhão (MA) Brazilian state; (C) indigenous lands (ILs) and the buffer area.
Fire 04 00034 g001
Figure 2. Yearly distribution of burned area categorized by season in the calendar year from 2008 to 2017. The rainy season’s fires occur primarily during the beginning of the rainy season after the dry season of the year labelled on the axis.
Fire 04 00034 g002
Figure 3. Yearly distribution of burned area from 2008 to 2017 and the linear tendency of increase.
Fire 04 00034 g003
Figure 4. Mapping of the yearly and seasonal distribution of fire scars inside the study area from 2008 to 2017. Areas not colored represent unburned areas during the respective year.
Fire 04 00034 g004
Figure 5. Burned area by month (red bars), together with mean monthly precipitation in the ILs and the surrounding areas (blue line).
Fire 04 00034 g005
Figure 6. Number of burn scars by month (red bars), together with mean monthly precipitation in the ILs and the surrounding areas (blue line).
Fire 04 00034 g006
Figure 7. Mapping of fire recurrence from 2008 to 2017 in the ILs and its surroundings. The palette of colors represents the number of times that the same area burned. White areas were never burned during this period. Landsat 5 TM, Landsat 7 ETM+ and Landsat 8 OLI images were used for the delimitation of burned areas. Spatial resolution is 30 m.
Fire 04 00034 g007
Table 1. Characterization of the indigenous lands (ILs) within the study area.
ILs NameEthnicityLegal SituationModalitiesPopulationArea (ha)
KanelaCanela RamkokamekráRegularizedTraditionally Occupied2103125.577
Kanela MemortumréCanela RamkokamekráDelimitedTraditionally Occupied1961100.301
PorquinhosCanela ApanyekráRegularizedTraditionally Occupied67779.410
Porquinhos dos Canela-ApanyekráCanela ApanyekráDeclaredTraditionally Occupied569221.838
BacurizinhoGuajajaraRegularized and DeclaredTraditionally Occupied3663133.978
Urucu/JuruáGuajajaraRegularizedTraditionally Occupied83512.751
Cana BravaGuajajaraRegularizedTraditionally Occupied4510136.473
Lagoa CompridaGuajajaraRegularizedTraditionally Occupied80513.245
RodeadorGuajajaraRegularizedDominial Land1262.324
ILs 5 km buffer----386.488
TotalIndigenous Population: 15.836
ILs area: 825.897 ha
Study area: 1.212.385 ha
Table 2. Description and temporal coverage of spectral information of the different bands and sensors used.
Sensor/SatelliteSpectral Bands
Blue, Green, Red, NIR, SWIR, and SWIR2
Filtered CollectionSpatial Resolution
TM Landsat-5B1, B2, B3, B4, B5, and B72008 to 201130 m
ETM+ Landsat-7B1, B2, B3, B4, B5, and B72008 to 201730 m
OLI Landsat-8B2, B3, B4, B5, B6, and B72013 to 201730 m
Table 3. Dates of beginning and end, and length of each dry season between July 2008 and June 2017. The precipitation accumulated in the rainy season is also shown.
Dry Season
YearEarly Dry Season (EDS)Middle Dry Season (MDS)Late Dry Season (LDS)Precipitation (Rainy Season—RS) (mm)
StartEndLength (Days)StartEndLength (Days)StartEndLength (Days)
200812/0525/051426/0518/1014619/1012/12551084
200921/0512/062313/0622/087123/0808/121081396
201020/0415/078716/0723/1010024/1012/1250829
201121/0509/075010/0730/098301/1017/10171239
201226/0321/0711822/0714/108515/1003/1250792
201326/0520/075621/0706/107807/1028/1022728
2014--026/0523/0912124/0918/011171179
201514/0406/065407/0619/1013520/1030/1272549
201617/0511/062612/0616/099717/0917/1292611
201703/0512/064113/0630/10140--0830
Table 4. Area burned in hectares (ha) categorized by climatic season.
YearDry SeasonRainy SeasonTotal (ha)
EDSMDSLDS
20088110,00119,4231996131,428
20091884,43572,7423578160,773
201037,631232,14616,915145286,837
20115037135,9800274141,291
20124248298,82683260311,400
2013620108,77016784553115,621
20140149,37125,8796175,256
20150199,32023,9067223,233
20161095,709104,3793239203,337
20170522,872017,514540,386
Burned Area (ha)47,5721,937,430273,24831,3122,289,562
Publisher’s Note: MDPI stays neutral with regard to jurisdictional claims in published maps and institutional affiliations.

