
Adding to Fire Fighter Safety by Including Real-Time Radar Data in Short-Range Forecasts of Thunderstorm-Induced Wind Shifts


Center for Forest Disturbance Science, USDA Forest Service, Athens, GA 30602, USA
*
Author to whom correspondence should be addressed.
†
Retired.
Fire 2021, 4(3), 55; https://0-doi-org.brum.beds.ac.uk/10.3390/fire4030055
Submission received: 27 July 2021
/
Revised: 27 August 2021
/
Accepted: 30 August 2021
/
Published: 1 September 2021
(This article belongs to the Special Issue Wind Fire Interaction and Fire Whirl)
Abstract
:Abrupt changes in wind direction and speed caused by thunderstorm-generated gust fronts can, within a few seconds, transform slow-spreading low-intensity flanking fires into high-intensity head fires. Flame heights and spread rates can more than double. Fire mitigation strategies are challenged and the safety of fire crews is put at risk. We propose a class of numerical weather prediction models that incorporate real-time radar data and which can provide fire response units with images of accurate very short-range forecasts of gust front locations and intensities. Real-time weather radar data are coupled with a wind model that simulates density currents over complex terrain. Then two convective systems from formation and merger to gust front arrival at the location of a wildfire at Yarnell, Arizona, in 2013 are simulated. We present images of maps showing the progress of the gust fronts toward the fire. Such images can be transmitted to fire crews to assist decision-making. We conclude, therefore, that very short-range gust front prediction models that incorporate real-time radar data show promise as a means of predicting the critical weather information on gust front propagation for fire operations, and that such tools warrant further study.
1. Introduction
Thunderstorm-generated gust fronts can pose a threat to the safety of fire crews [1]. Sudden wind shifts have been implicated in a number of fire investigations over the years such as the Ransom Road Fire Report [2], the Dude Fire [3] and the Waldo Canyon Fire [4]. One particularly tragic event occurred in 2013 at Yarnell Hill, Arizona, when a wind shift associated with thunderstorm outflows overran a wildfire changing its direction and rate of spread. Nineteen firefighters were killed [5].
Unless thunderstorm outflows are deep enough and/or close enough to be detected by weather radars, they can travel for great distances unobserved. Some gust fronts can travel 50–100 km from source regions to arrive at burn sites without any visible signs of impending changes in the weather. Thus, predicting the approach of thunderstorm-related gust fronts, the timing of arrival, and the magnitude of outflow winds at a particular fire site, which may be located over a limited area within complex terrain, poses a challenging problem for fire weather forecasters. This situation often leaves response units and public safety officials unaware of the evolution of the fire environment.
Detailed morphologies of gust fronts in Colorado [6] and Arizona/New Mexico [7] revealed temperature breaks, wind shifts, and cold pool depths typical of thunderstorm climatology for the area. Although these studies added to our knowledge of the structure and movement of gust fronts that occurred over complex terrain, the critical issue of accurate prediction of these events was not addressed.
By using ensembles of high-resolution numerical weather prediction models, Powers et al. [8] reported significant progress on identifying and predicting locations of gust fronts. High-resolution refers to model configurations in which the model horizontal grid spacing is typically 4 km or less. These ‘convection-permitting’ models can simulate thunderstorms, or more likely, clusters of thunderstorms, and their rainfall. Thunderstorm outflows and gust fronts are part of the solutions. As the authors point out, the difficulty is not so much in the simulation of thunderstorm gust fronts but in finding an objective methodology to identify them apart from other disturbances in the wind fields.
Model variables from which to construct an objective gust front tool were investigated. These included model-simulated surface winds, temperature, relative humidity, and potential temperature. Model-derived or calculated fields such as simulated radar reflectivity, frontogenesis, planetary boundary layer height, temperature advection, and moisture convergence were also considered. From these quantities, the authors [8] determined that frontogenesis, hourly vector wind difference, and horizontal potential temperature gradient were most strongly related to gust fronts. An objective gust front tool was developed with the aid of the Multiple Directional Non-Maximum Suppression method (MDNMS) [9].
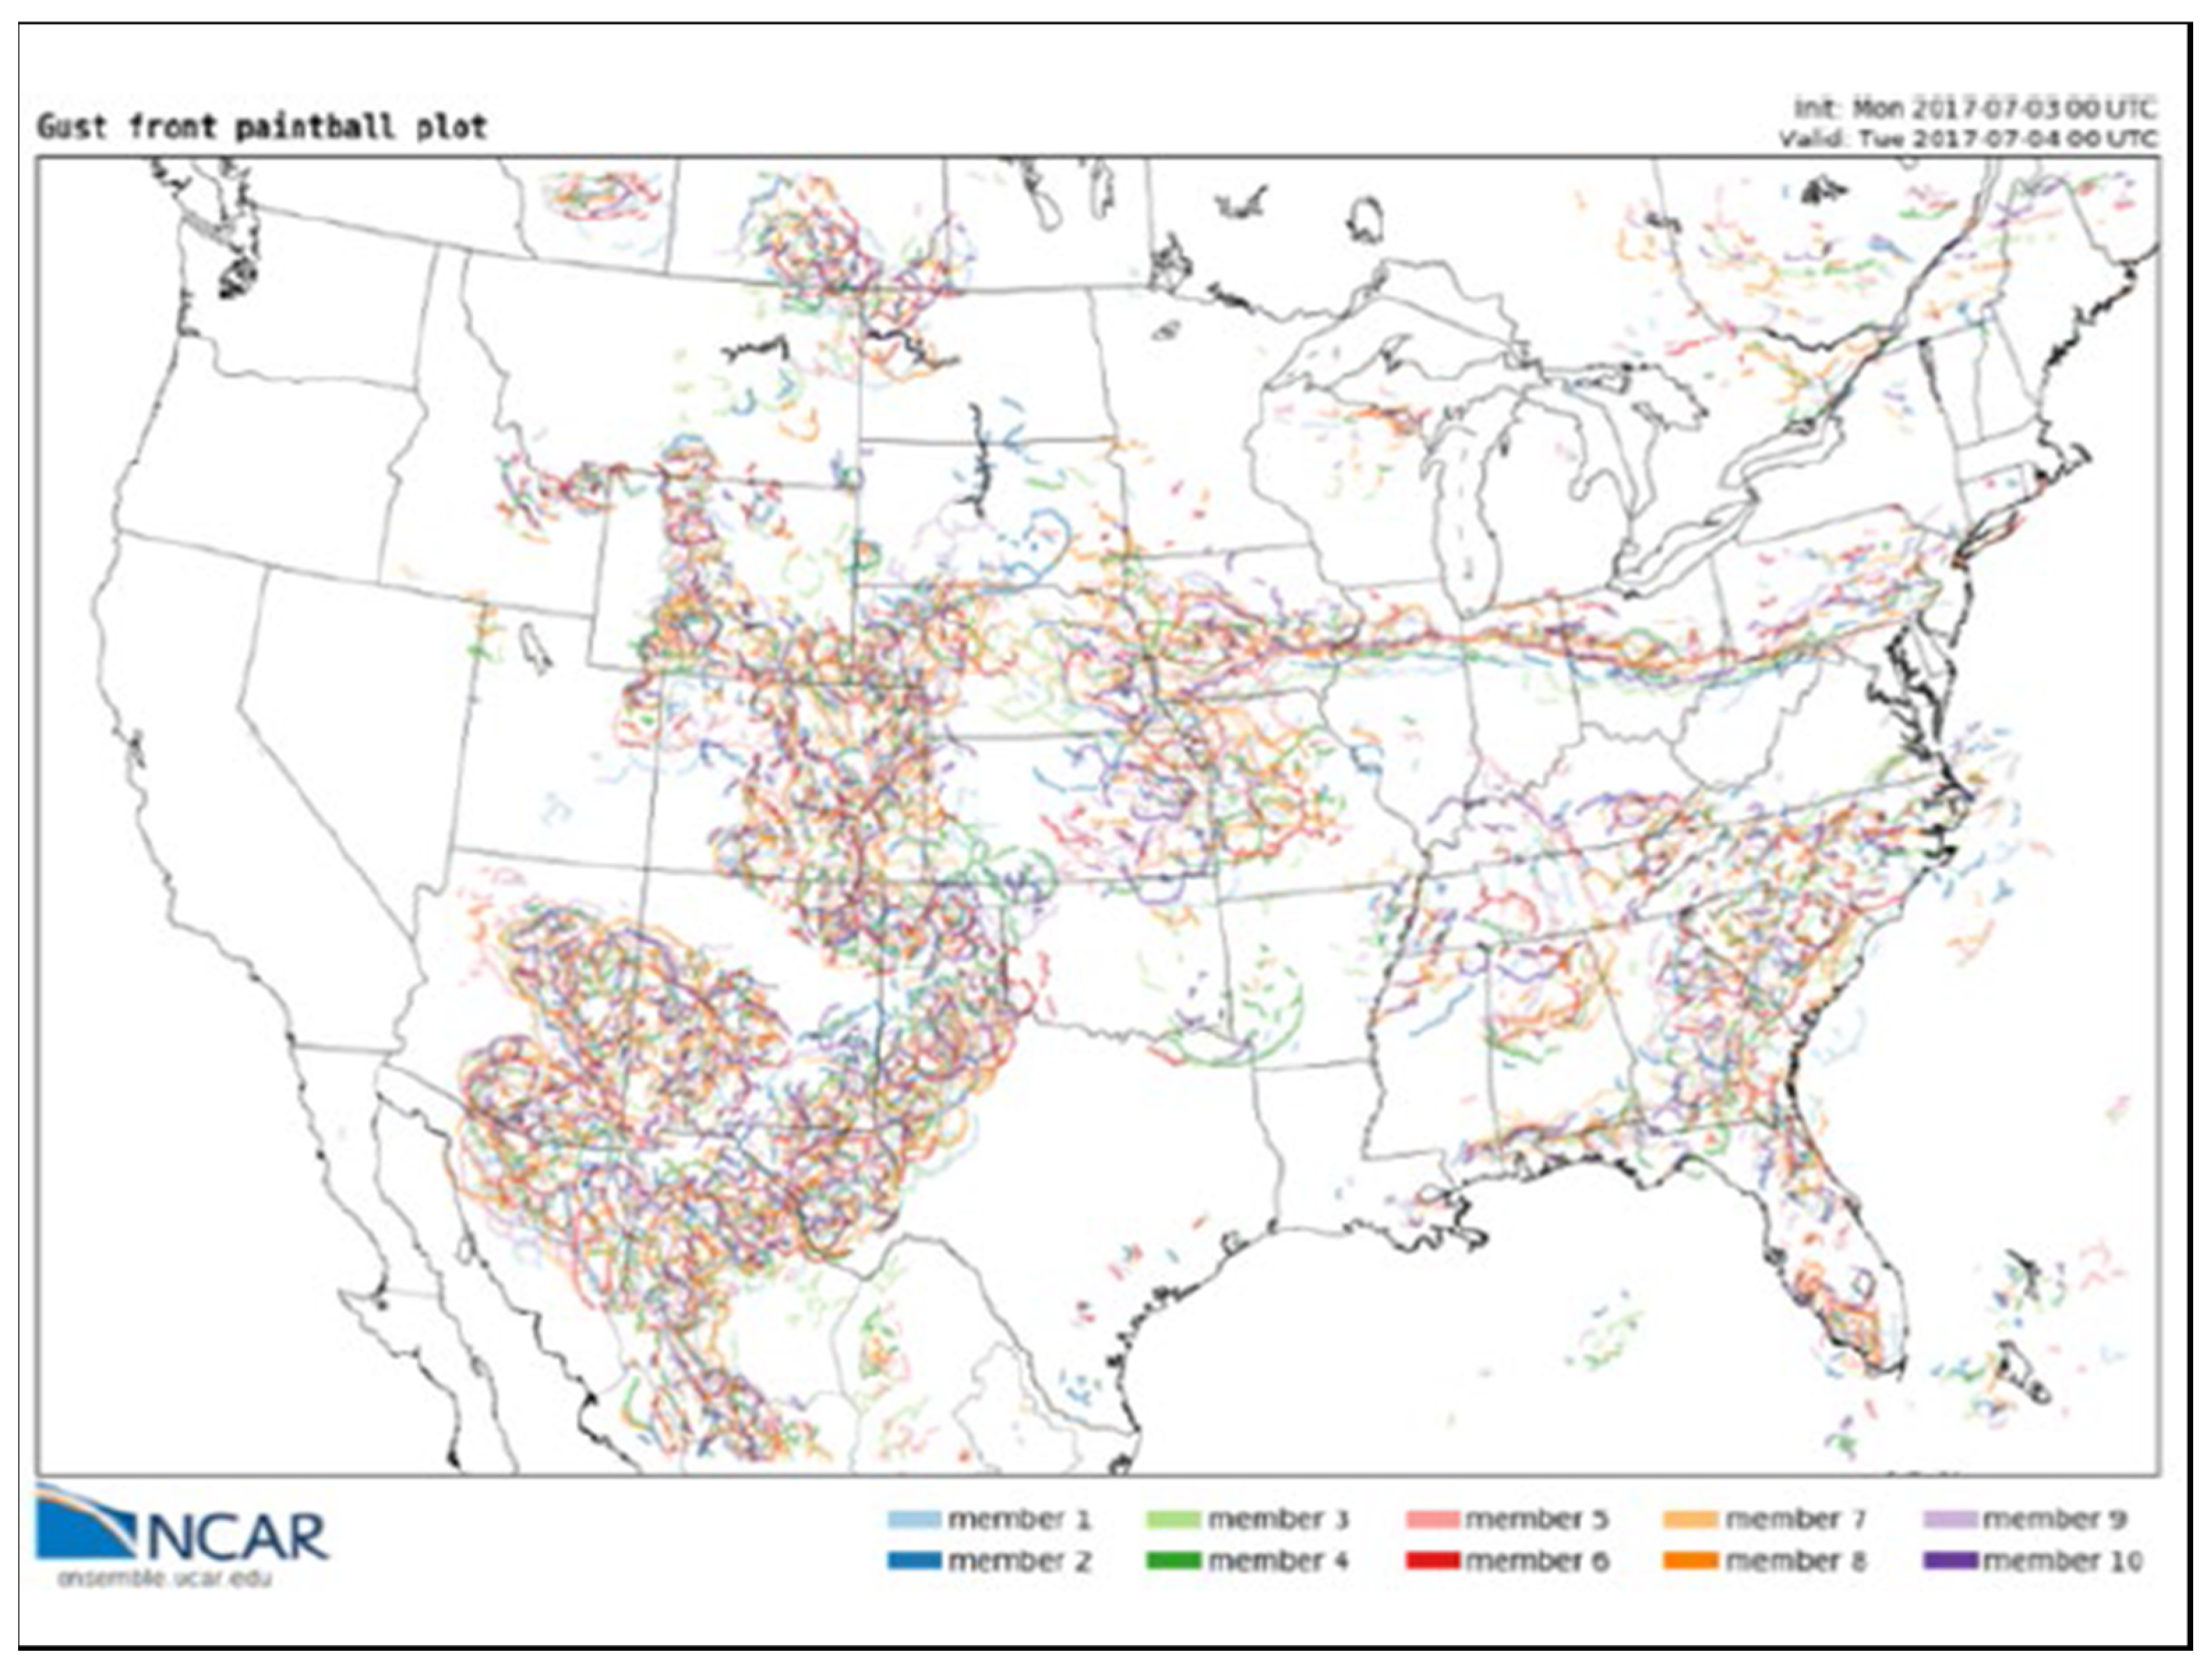
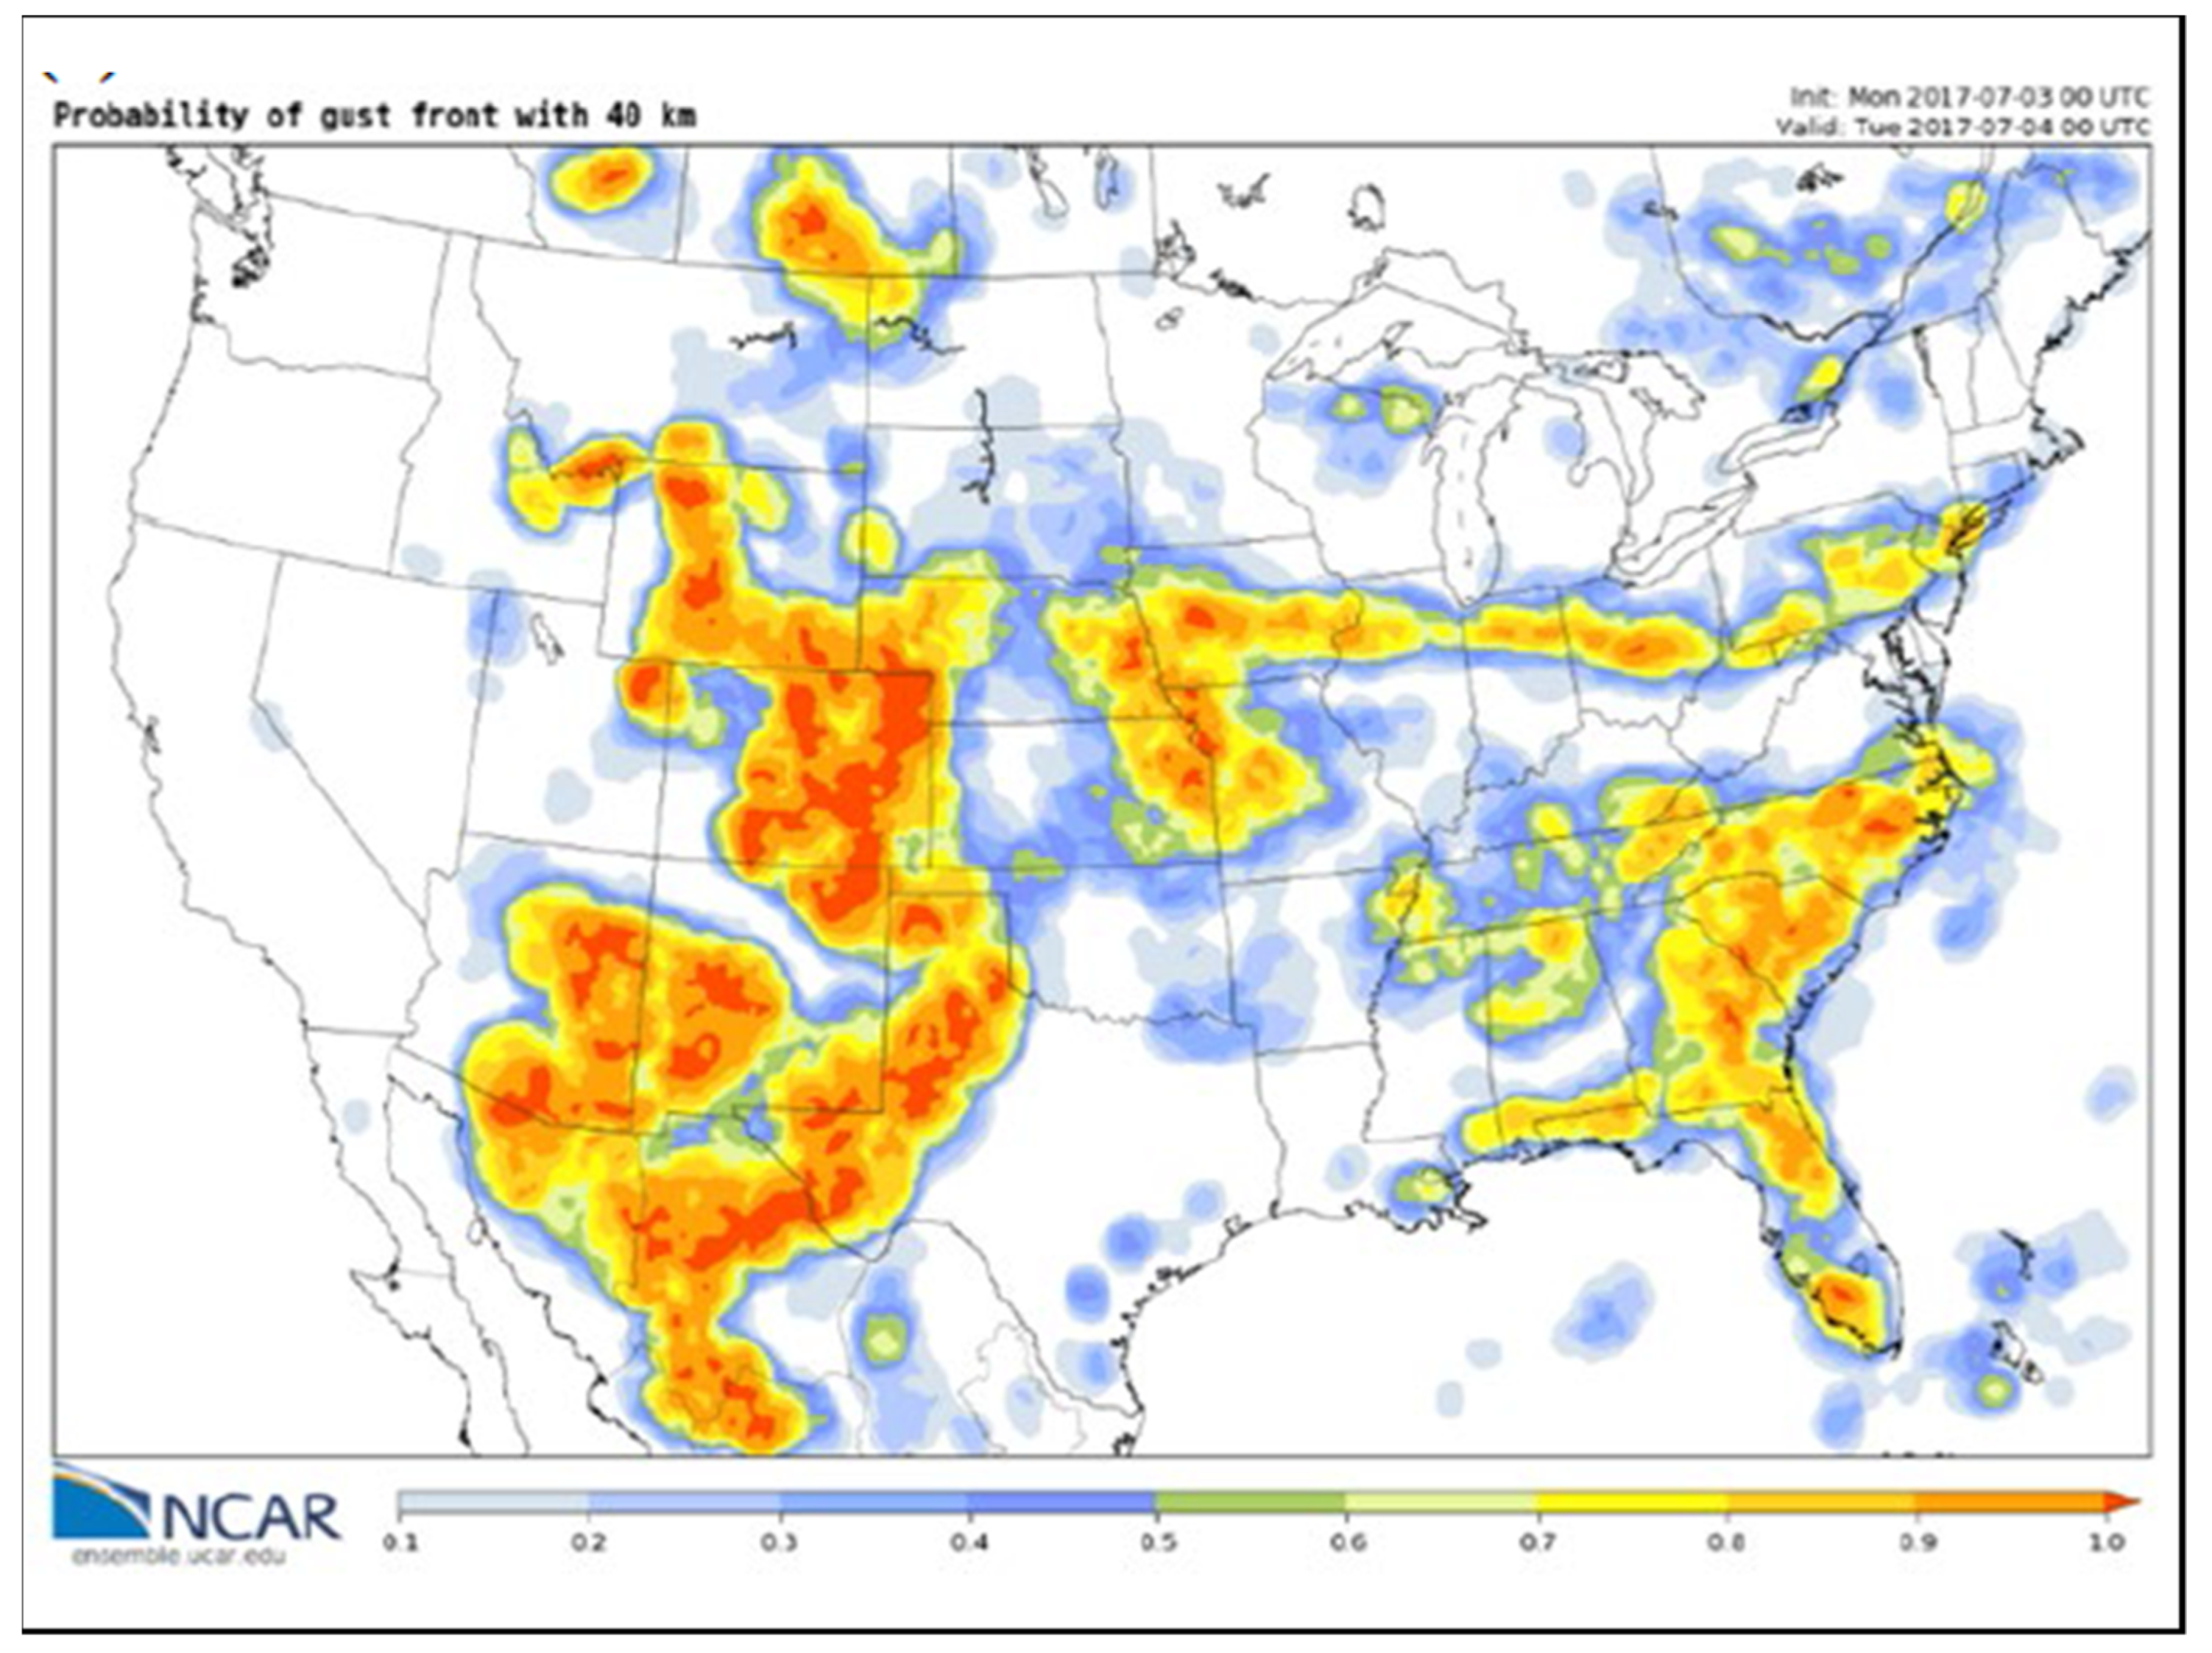
Figure 1 shows gust front boundaries identified by the MDNMS algorithm with each ensemble member a different color. The results are valid for a 24 h ensemble forecast valid at 0000 UTC 4 July 2017. The ensemble gust front forecasts identified large areas over the contiguous United States where atmospheric conditions were favorable for deep convection. However, not all models simulated gust fronts in the same place at the same time. Thus, the results were converted into gust front probability forecasts as shown in Figure 2. These probabilities can assist fire weather forecasters in identifying which fire sites may be subject to the threat of gust fronts during the next 24 h. This information can alert response units and public safety officials to the potential danger from gust fronts.
Although the results by [8] represent a significant advance in short-range forecasts of the threat of gust fronts to fire response units, they also identify challenges and limitations inherent in high-resolution numerical weather models in predicting these events. Not all models of the ensemble produced gust fronts. Furthermore, when ensemble members did simulate gust fronts, the placements could be a few tens of kilometers or more distant relative to the simulation’s other ensemble members.
In addition, though high-resolution numerical weather prediction models can accurately locate regions with convective instability, these models will seldom place thunderstorm cells at locations where they are observed because of the stochasticity of the formation process. Thus, though the probabilistic forecast can alert the fire weather forecaster to the potential hazards of gust fronts over fire sites, a deterministic forecast needed by response units of if, when, from what direction, and how strong a gust front will be, remains elusive.
We propose that there exists a class of numerical weather prediction models that can provide fire response units with the gust front information they need. It is recognized that the only tool that can provide the fire weather forecaster with the locations and intensities of thunderstorm cells is the weather radar. We demonstrate this concept by coupling real-time weather radar data with a wind model to build a numerical weather prediction model capable of very short-range forecasts (on the order of an hour) of gust fronts arriving at a fire site. In the sections to follow, a prototype model is described and demonstrated with the Yarnell Hill disaster as a case study.
2. Materials and Methods
Materials and methods for the gust front modeling problem are partitioned into four parts—model philosophy, the wind model, modeling real-time radar data, and case study.
2.1. Model Philosophy
All of the modeling issues involving the onset of convective instability in the atmosphere and the release of the instability via thermodynamic and kinematic processes of thunderstorm development are solved by the appearance of a thunderstorm cell on radar. Regarding precipitation production, all physical processes that go on above cloud base are solved by precipitation intensity as measured by radar reflectivity. Therefore, our approach does not involve numerical modeling of the growth of thunderstorms. Thus, the modeling effort is simplified to modeling just the thunderstorm outflow and the subsequent gust front. The thunderstorm becomes a ‘black box’ through the bottom of which flows downdraft air at a speed and temperature specified by the intensity of precipitation. On reaching the ground, this air piles up, creating a mound of cooled air below the cloud base. Pressure gradients within the mound of cooled air, and between the mound and the surrounding ambient air, drive the air outward away from the source in the form of an outflow or gust front. Only bulk properties of the outflow need be modeled.
As summarized in Figure 3, the thunderstorm is envisioned as a black box (irregular grey area) that communicates with the ground via a rain-cooled downdraft that produces a cool outflow (blue area). The black elliptical lines represent contours of the height of the cool dome of air which attains to maximum depth beneath the storm. The contours can also represent lines of constant pressure anomaly which also attain to a maximum beneath the storm. As shown by the arrows representing wind direction and speed, the outflow expands outward at speeds proportional to the magnitude of the pressure gradient driving the winds. The strongest pressure gradient usually is at the leading edge of the storm which moves from left to right in the diagram. The boundary between the cool outflow and displaced warm air (red area) is a line of discontinuity (the gust front) characterized by a temperature break, wind shift, and change in wind speed.
2.2. The Wind Model
We extracted the wind model used in this study from the smoke transport model Planned Burn-Piedmont (PB-P) [10], a local numerical meteorological model for tracking smoke along the ground at night. PB-P is an operational very-high-resolution semi-Lagrangian numerical model designed for simulating bulk properties of shallow density currents as they move through interlocking ridge-valley terrain typical of the Piedmont of the Southern United States. The model has been applied to other areas of the United States, including Arizona [11] (p. 580).
For the lower boundary condition, the model is linked to the U.S. Geological Survey’s digital elevation model (DEM) data set. The horizontal grid spacing is set by the user within the range 30 m (the minimum spacing of the DEM elevation data) to any choice that is an integer multiple of 30 m. A detailed mathematical description of the wind model is found in [10].
The wind model was modified to receive at any specified grid point a boundary layer growth proportional to the flux of downdraft air from a thunderstorm. On finding a radar echo value at a model grid point, the boundary layer growth per time step was calculated via an empirical equation,
where the downdraft velocity at the base of the cloud, wei, is a function of the radar-detected precipitation echo intensity as shown in Table 1 and ∆t is the model time step (20 s). The coefficient, c1, is a downdraft ‘efficiency weight’ intended to weight the downdraft velocity according to the potential for the ambient atmosphere to produce strong downdrafts. Estimates for the efficiency weight were not available to us in reference to case studies of past wildfire events. Therefore, we used c1 = 0.75 which was found to generate ‘reasonable’ cold pool growth rates and gust front spread rates as modeled for thunderstorms at various locations east of the Rocky Mountains, especially for the southeastern United States.
h1 = h0 + c1wei ∆t
As thunderstorm outflows consist of rain-cooled air, the temperature of the air at the ground beneath the storm is represented by,
where Ta is the ambient ground-level temperature at a location undisturbed by thunderstorm outflows and usually found several tens of kilometers to the south of precipitation. Tad is the ambient dew point temperature for the same location. The cooling coefficient, C, is related empirically to the radar echo intensity (dBZ) in Table 1. For very light precipitation, which may produce nothing to weak downdrafts, C = 0, meaning no cooling at the ground takes place. For intense storms with heavy precipitation, the cooling coefficient is C = 1.0, meaning ground-level temperatures are cooled to the dew point temperature. Both the depths of the outflow layer and its temperatures are factors in the amplitude of the pressure anomaly that drives the gust front (Figure 3).
T = Ta − C (Ta − Tad)
Once having formed, the outflow layer is subjected to slow warming as a function of the depth of the layer. The empirical equation for rate of temperature increase is,
where hm is the maximum depth (2000 m) permitted for the outflow layer and h > 0. Equation (3) permits the rate of temperature growth to increase as the depth of the outflow layer decreases. The function has little impact on gust front spread during the early stages of the outflow. However, over several hours as the outflow layer subsides, heating can slow gust fronts by decreasing the internal pressure gradients that drive them.
T = T0 + (Ta − T0) (hm/25h) (∆t/3600)
PB-P was designed to simulate wind direction and speed under near calm conditions at night over complex terrain. Measurements of wind variables under these conditions are often unreliable. Therefore, the wind field is driven by the pressure field. In our prototype gust front model, wind direction and speed are supplied by a single weather station deemed ‘representative’ of the ambient conditions near local convective systems. The wind data are converted to a pressure gradient field that drives the observed wind.
2.3. Real-Time Radar Data
The U.S. Weather Service routinely supplies national radar data in graphical map form to the public at intervals of from 5 to 10 min. These maps show locations and intensities of precipitation systems. Each pixel in the radar image represents an area of approximately one square kilometer. We set the grid space for the prototype gust front model to 900 m and interpolated the radar data into the model grid. The model then moves the radar data through the grid at the reported speed and direction of the storm.
Precipitation intensities are depicted through a color-coded reference to the energies returned to the radar relative to a reference energy (Z). The non-dimensional ratio is expressed in decibels relative to Z (dBZ). The ratio for most weather precipitation systems ranges from 10–70 dBZ.
This relationship between color and energy returned to the radar is shown in the first two lines of Table 1. Regarding the color codes, the ‘blues’ represent very light precipitation which most likely does not reach the ground; the ‘greens’ represent light rainfall; yellow represents light to moderate rainfall; yellow-orange represents moderate rainfall; red and moderate red represent heavy rainfall; and dark red represents very heavy (torrential) rainfall. Magenta and purple represent hail.
The model decodes the colors and converts them into cloud base downdraft velocities as is shown on the third line of Table 1. These downdrafts are transported over the grid according to the reported speed and direction of the radar-observed precipitation systems.
Regarding validation, the prototype gust front model has been run on numerous occasions for precipitation systems ranging from single thunderstorm cells to clusters of storms to squall lines to mesoscale convective systems. Coefficients in the above equations have been ‘tuned’ in accordance with how well the model predicted the timing and wind speed of gust front passages as observed at weather stations in the path of storms and as ‘clear-air echoes’ when gust fronts passed near weather radars.
2.4. Case Study
On 30 June 2013, a gust front generated by two clusters of thunderstorms over complex terrain of central Arizona produced a sudden 90 degree wind shift over a wildfire near Yarnell Hill [5]. The changes in fire intensity and spread rate caused the fire to explode, overtake, and trap a fire crew. Nineteen firefighters were killed. Interactions between complex terrain, thunderstorm development and propagation, and channeled outflows caused the gust front to approach the fire site from the north, a direction from which the weather did not appear to be threatening.
The prototype gust front model was set up with terrain data from the USGS DEM elevation data set at the 900 m grid spacing. Digital radar data from the Flagstaff, AZ, weather radar were converted to the standard color-coded form and input to the model. The model was initialized with temperature, relative humidity, and wind speed and direction data from Peeples Valley (1209–1509 local standard time (LST)) about 6 km north of Yarnell and then from Phoenix (1509–1709 LST) about 115 km to the southeast.
Additional information pertinent to this study from [5] made note of a weather update at 1526 LST warning of the approach of a gust front that could turn the winds to blow from the north or northeast with a velocity range around 20 ms−1. Shortly thereafter, at approximately 1530 LST, the wind shifted from blowing from the southwest to blowing from the northwest. The wildfire turned toward the town of Yarnell. Our weather data from Peeples Valley ended at 1509 LST and the wind shift did not appear in the weather data from Phoenix. The event was not considered as the passage of a gust front and it is possible that the wind shift occurred in response to a pressure-induced indraft into developing strong storms over the valley east of Yarnell.
The gust front reached the north perimeter of the fire at 1618 LST 30 June and the south perimeter at 1630 LST. We infer from this observation that the gust front was moving south and driven by winds blowing from the north or north-northeast. It is noteworthy that observers at the south perimeter of the fire reported winds blowing from the east and northeast at speeds estimated at 50 mph (22.4 ms−1).
3. Results
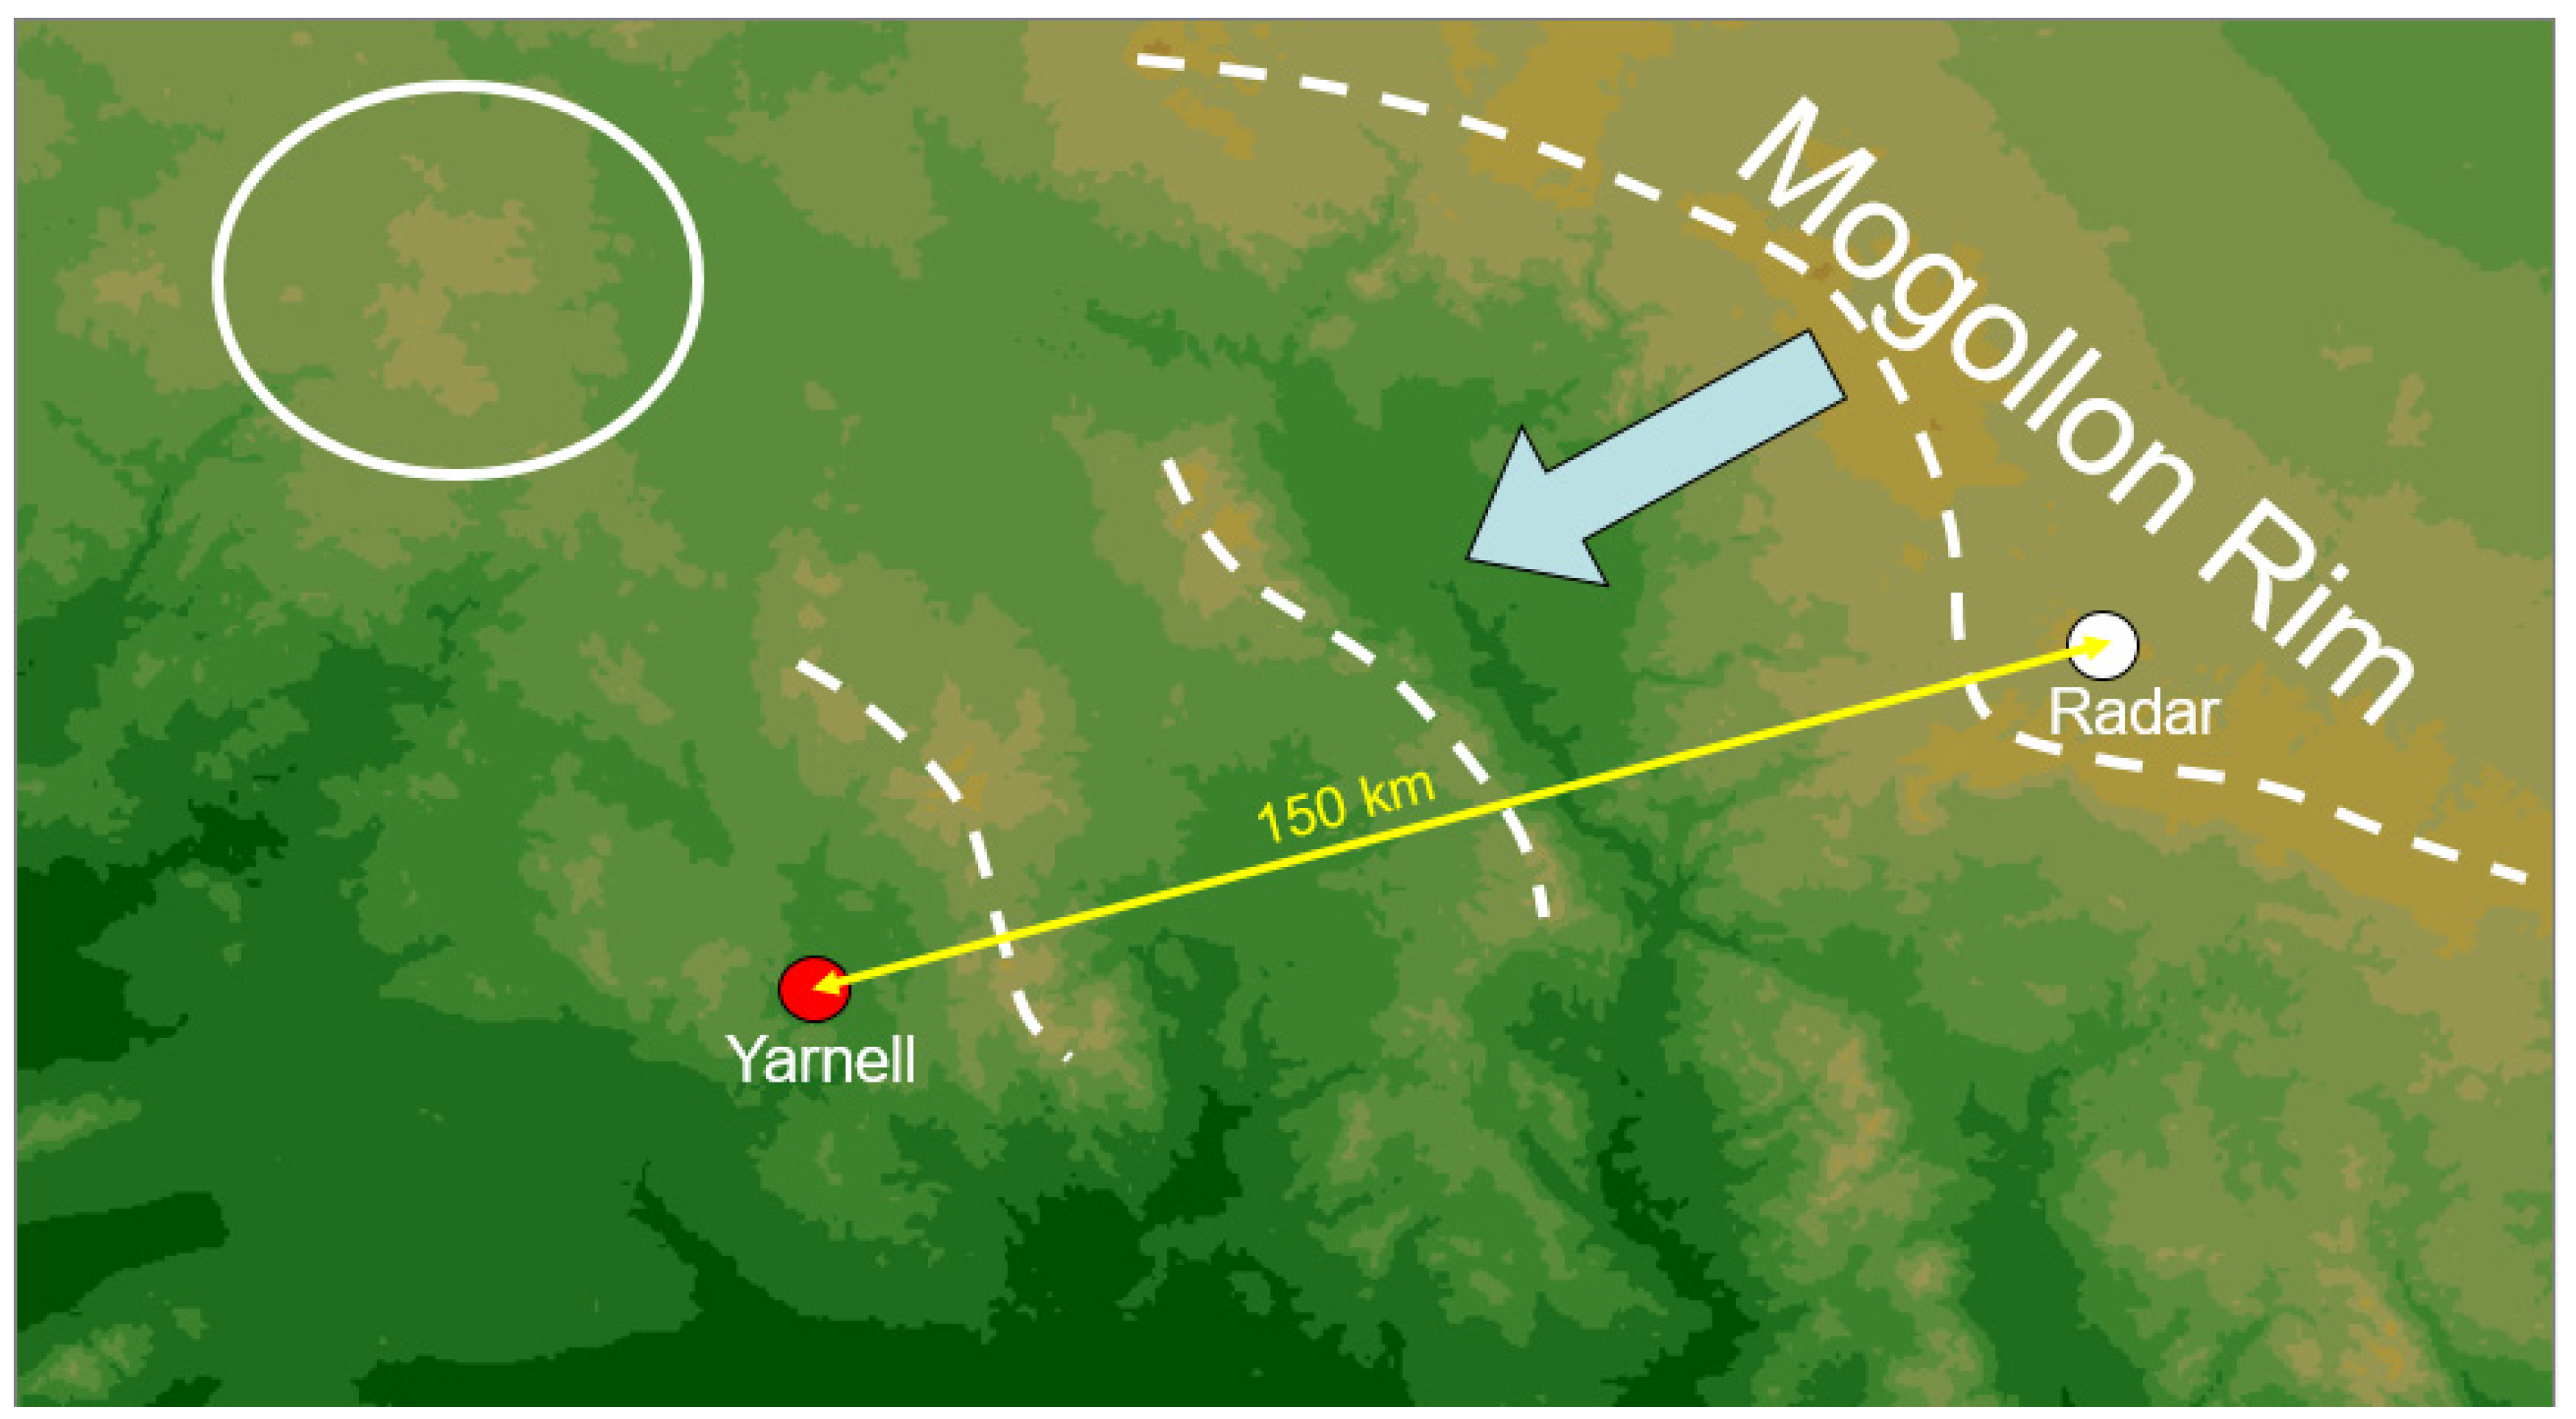
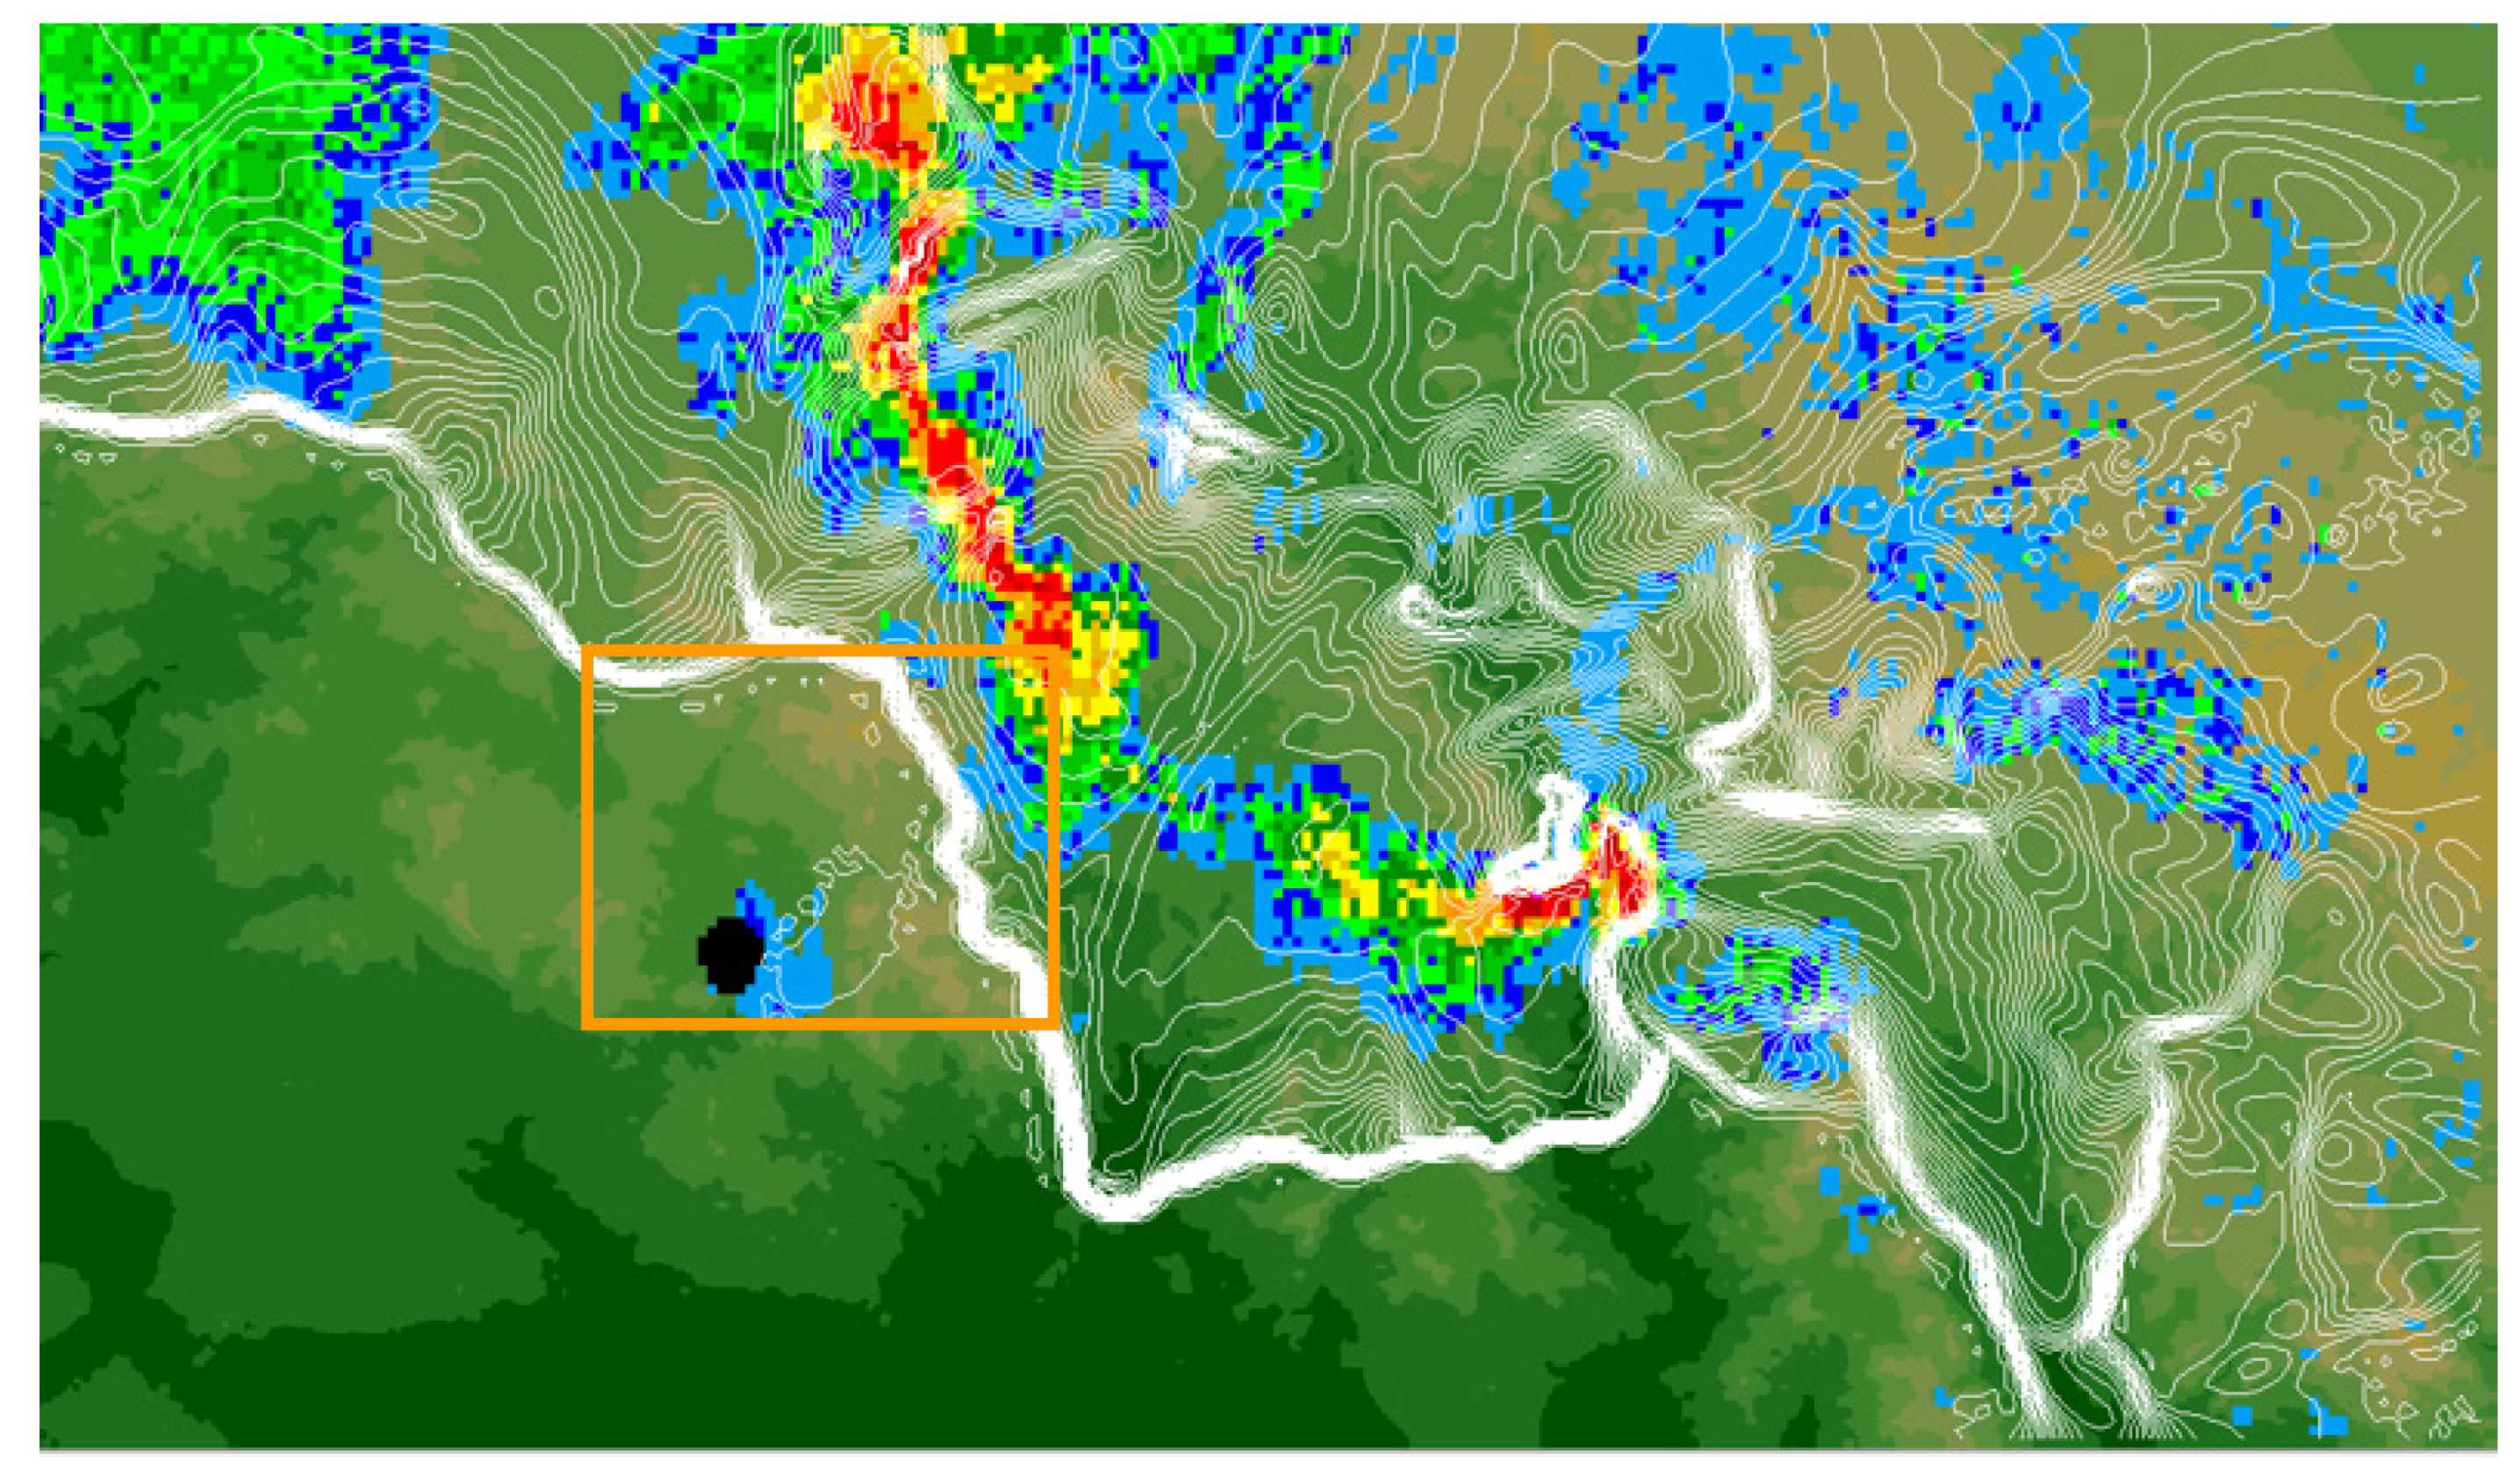
Figure 4 shows the approximately 290 × 160 km area surrounding the events of 30 June 2013. The Flagstaff radar is located 150 km to the east-northeast of Yarnell.
Elevations rise from 550 m (dark green) at the desert floor south of Yarnell to 2300 m (tan) at the Mogollon Rim escarpment (dashed line) which runs diagonally along the upper right of the figure. Initial thunderstorm development occurred along the Mogollon Rim and over high ground (circle) located approximately 90 km north-northwest from Yarnell. Also factors in the results are two lesser mountain ranges (dashed lines) located between Yarnell and the Mogollon Rim at distances of 30 km and 80 km respectively. These mountain ranges rise approximately 500–1000 m above the adjacent valley floors.
Winds at Yarnell blew from the southwest for much of the day. Aloft, winds blew from the northeast (060 degrees at 6.7 ms−1) which steered storms forming over the Mogollon Rim southwestward (arrow). Thus, the bulk of outflows generated by these storms initially fell on southwest-facing slopes which accelerated gust fronts toward Yarnell.
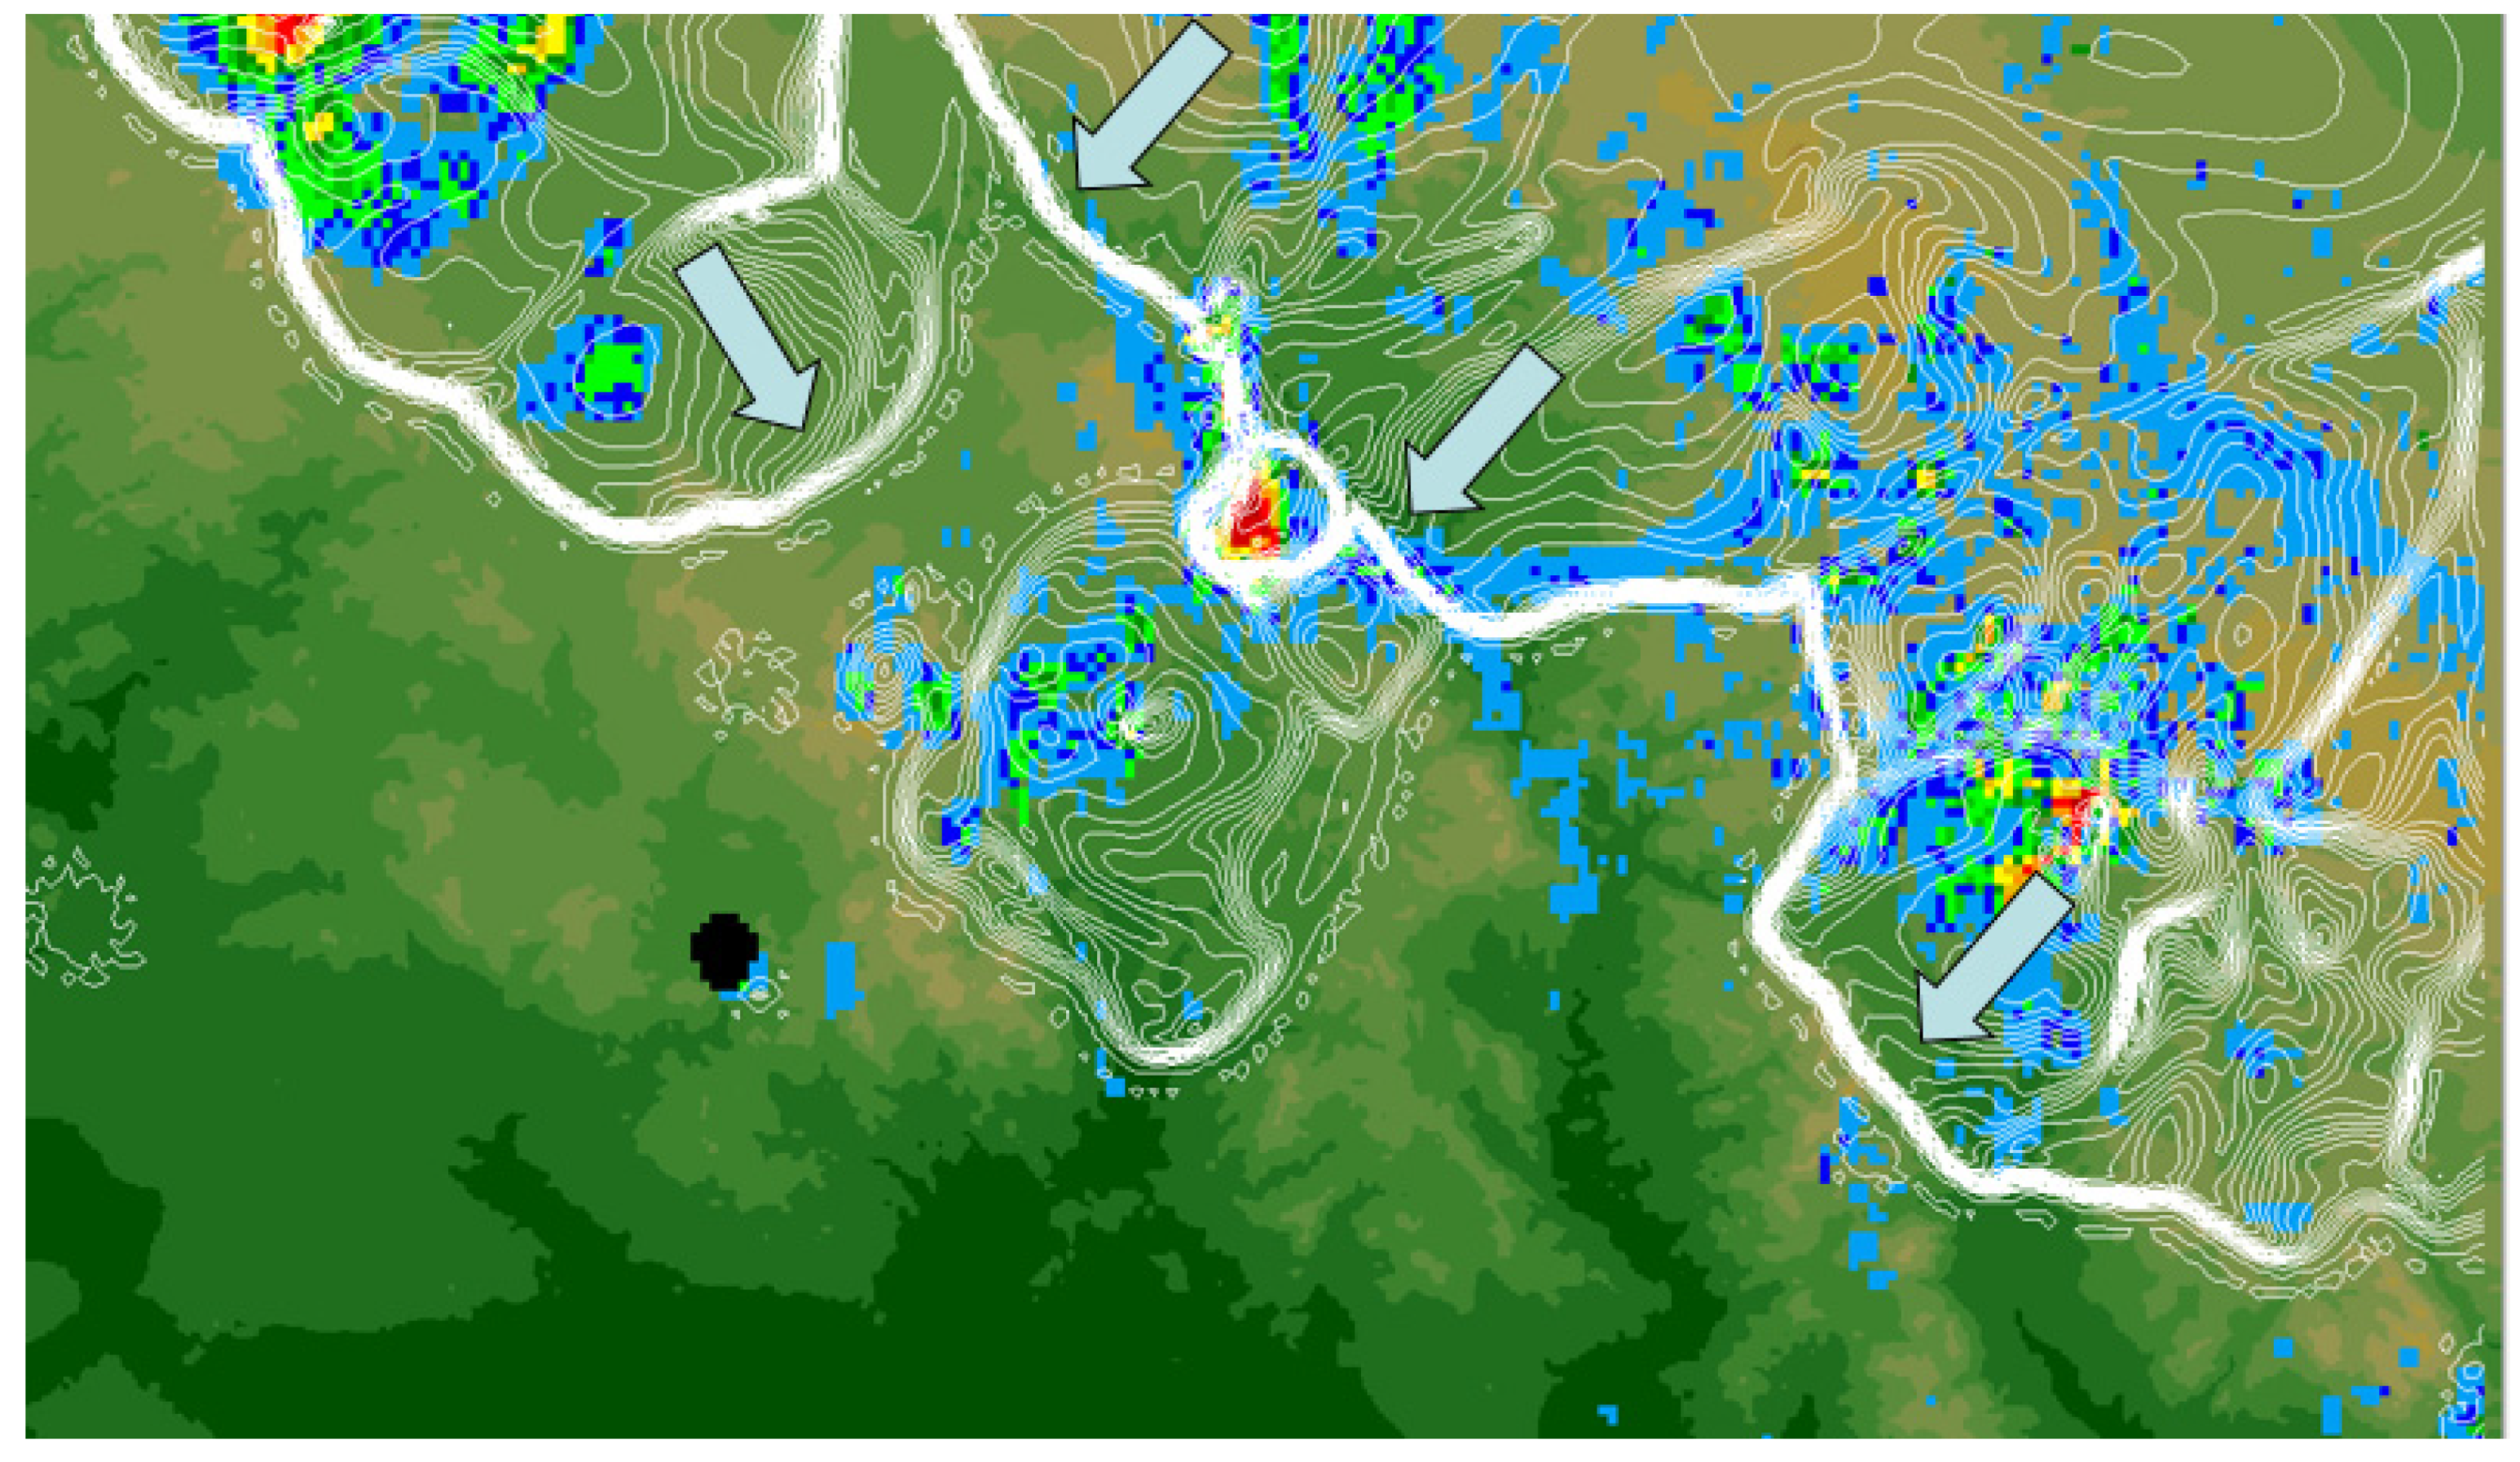
The gust front model plots the radar data over the elevation map of Figure 4. Of the model-generated parameters, the temperature field best identifies gust front boundaries over this large area. On viewing maps such as shown for 1231 LST in Figure 5, the fire weather forecaster might see the evolution of temperature breaks identifying the location of gust fronts. Over the Mogollon Rim, multiple thunderstorms were organizing into a mesoscale convective system. Elsewhere, a smaller cluster of storms had produced an outflow over the high ground north of Yarnell. Several isolated showers, destined to be short-lived, formed over the mountain ranges northeast of Yarnell. The darkened black circle identifies the wildfire smoke plume as observed at 2400 m by the Flagstaff radar.
By 1335 LST (Figure 6), outflows from the mesoscale convective system pushing off the Mogollon Rim had merged into a single boundary advancing toward the southwest (arrows). The gust front had advanced approximately 50 km to the ridge of the first mountain range southwest of the Mogollon Rim. A new strong storm had formed at the ridge. Meanwhile, temperature breaks identifying gust fronts from outflows from the storms that organized over high ground northwest of Yarnell were pushing southeastward toward lower elevations in the valley running from the north to the east beyond the mountain range east of Yarnell.
Figure 7 shows the situation at 1500 LST. The temperature breaks along the gust fronts from the two convective systems had merged into a single line. The cluster of storms over high ground north of Yarnell were dissipating, the outflow dome had subsided and warmed slightly, and the gust front had slowed down. The Mogollon Rim convective system had evolved into a solid line of strong storms (colored red) located over the full length of the valley beyond the mountain range east of Yarnell. The gust front had progressed well up the eastern slopes of these mountains.
By 1500 LST, it was clear that the Yarnell area was threatened by strong wind shifts should the outflow top the mountains just to the east. To get a clearer perspective of the events that occurred at Yarnell during the following 90 min, the remainder of the simulation will focus on the 40 × 60 km area within the orange box in Figure 7.
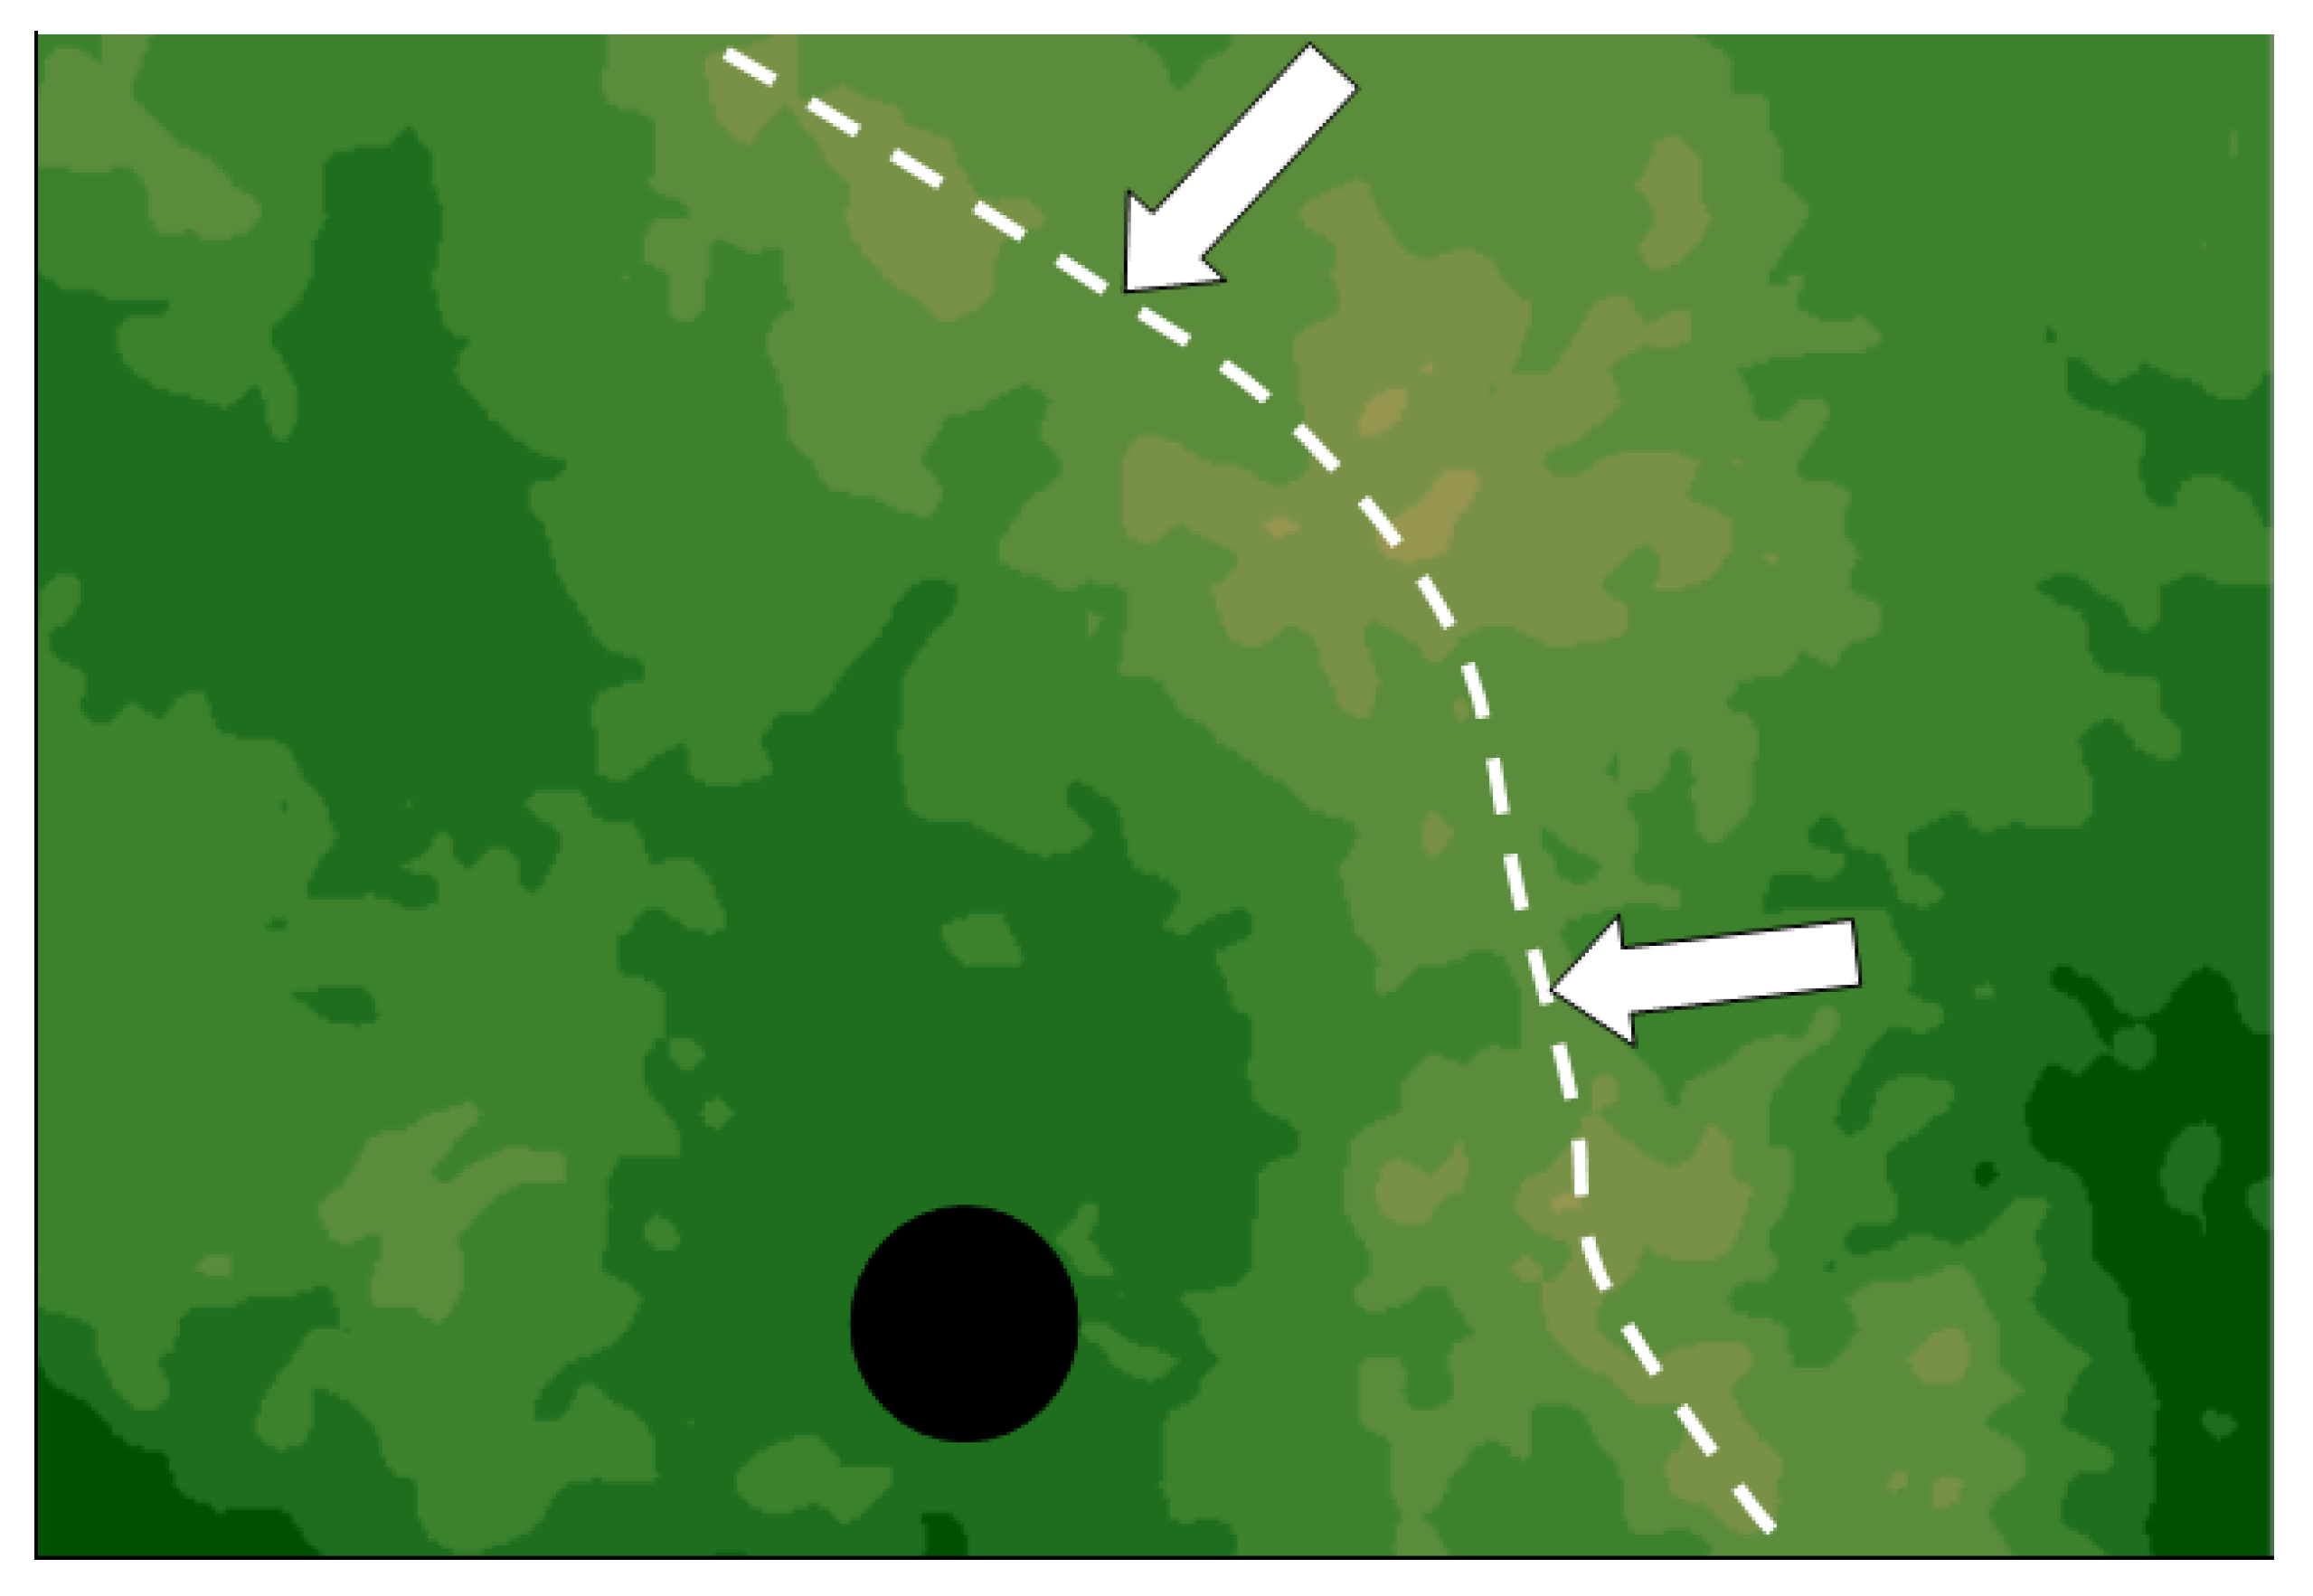
Figure 8 shows a close-up of the mountain range northeast of Yarnell. The mountain range consists of three areas of high ground connected by lower elevation gaps (arrows), one 30 km north and the other 17 km east of Yarnell. The black circle is the smoke plume from the Yarnell Hill fire as observed by the Flagstaff radar.
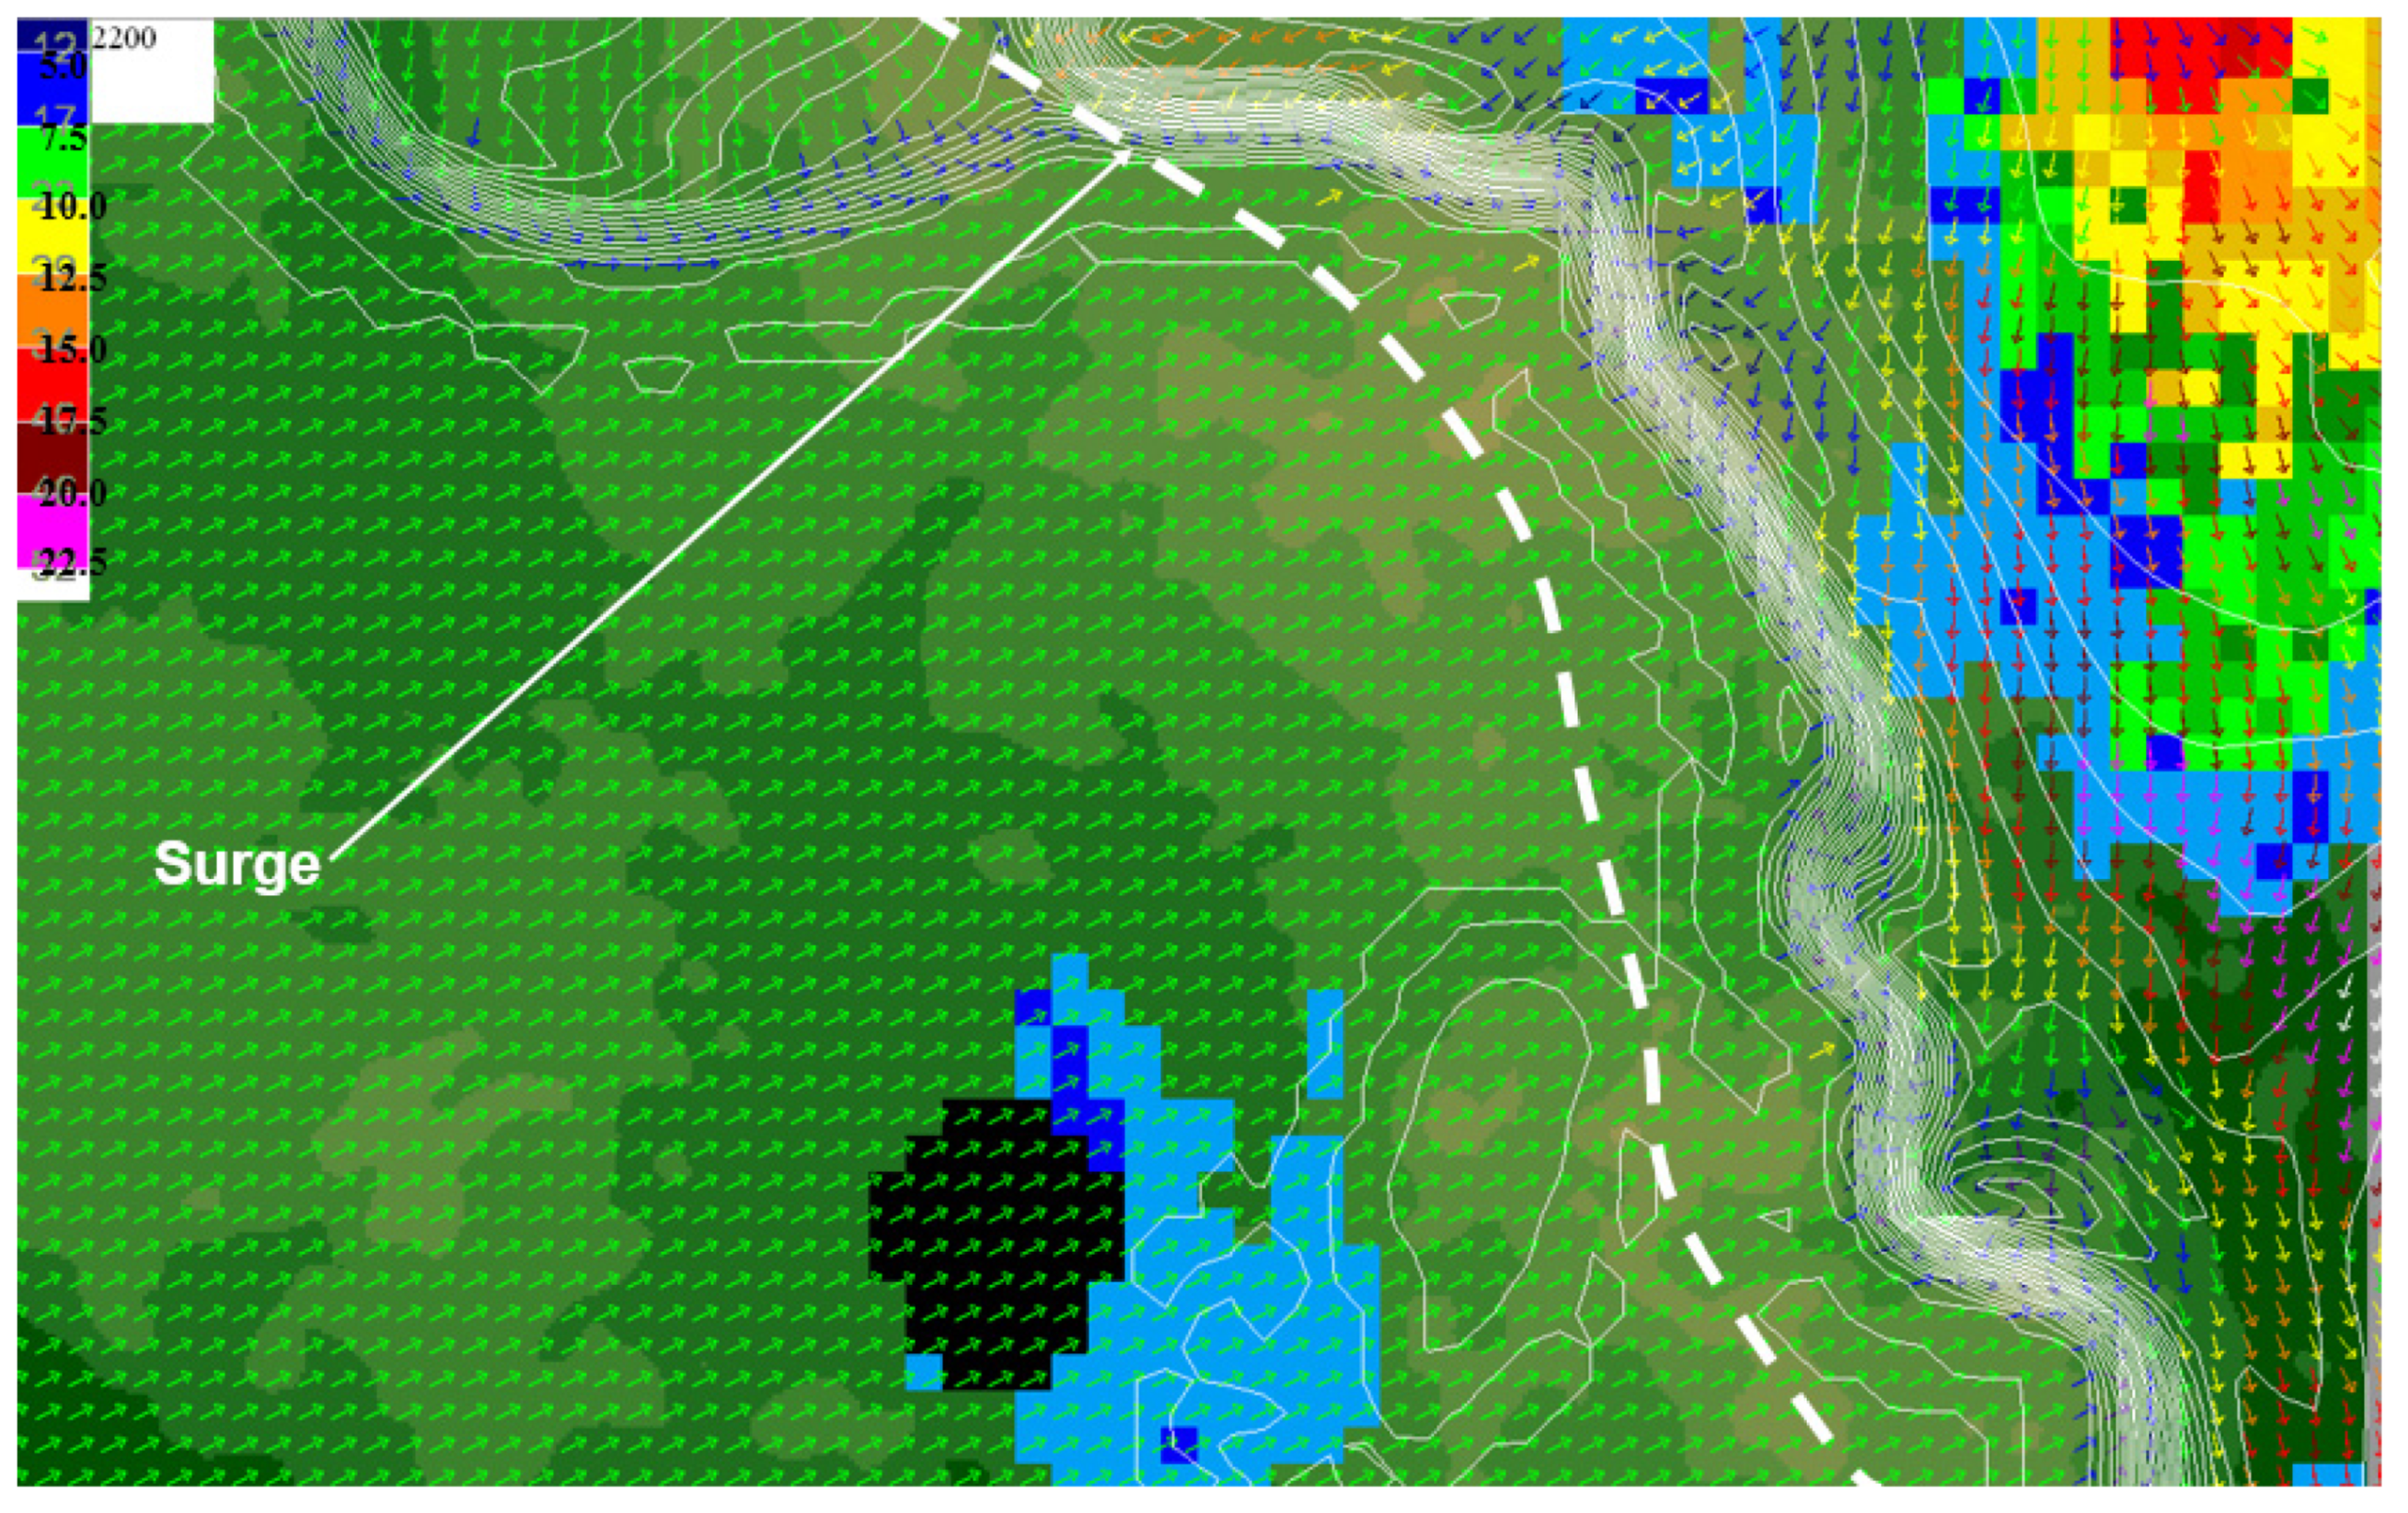
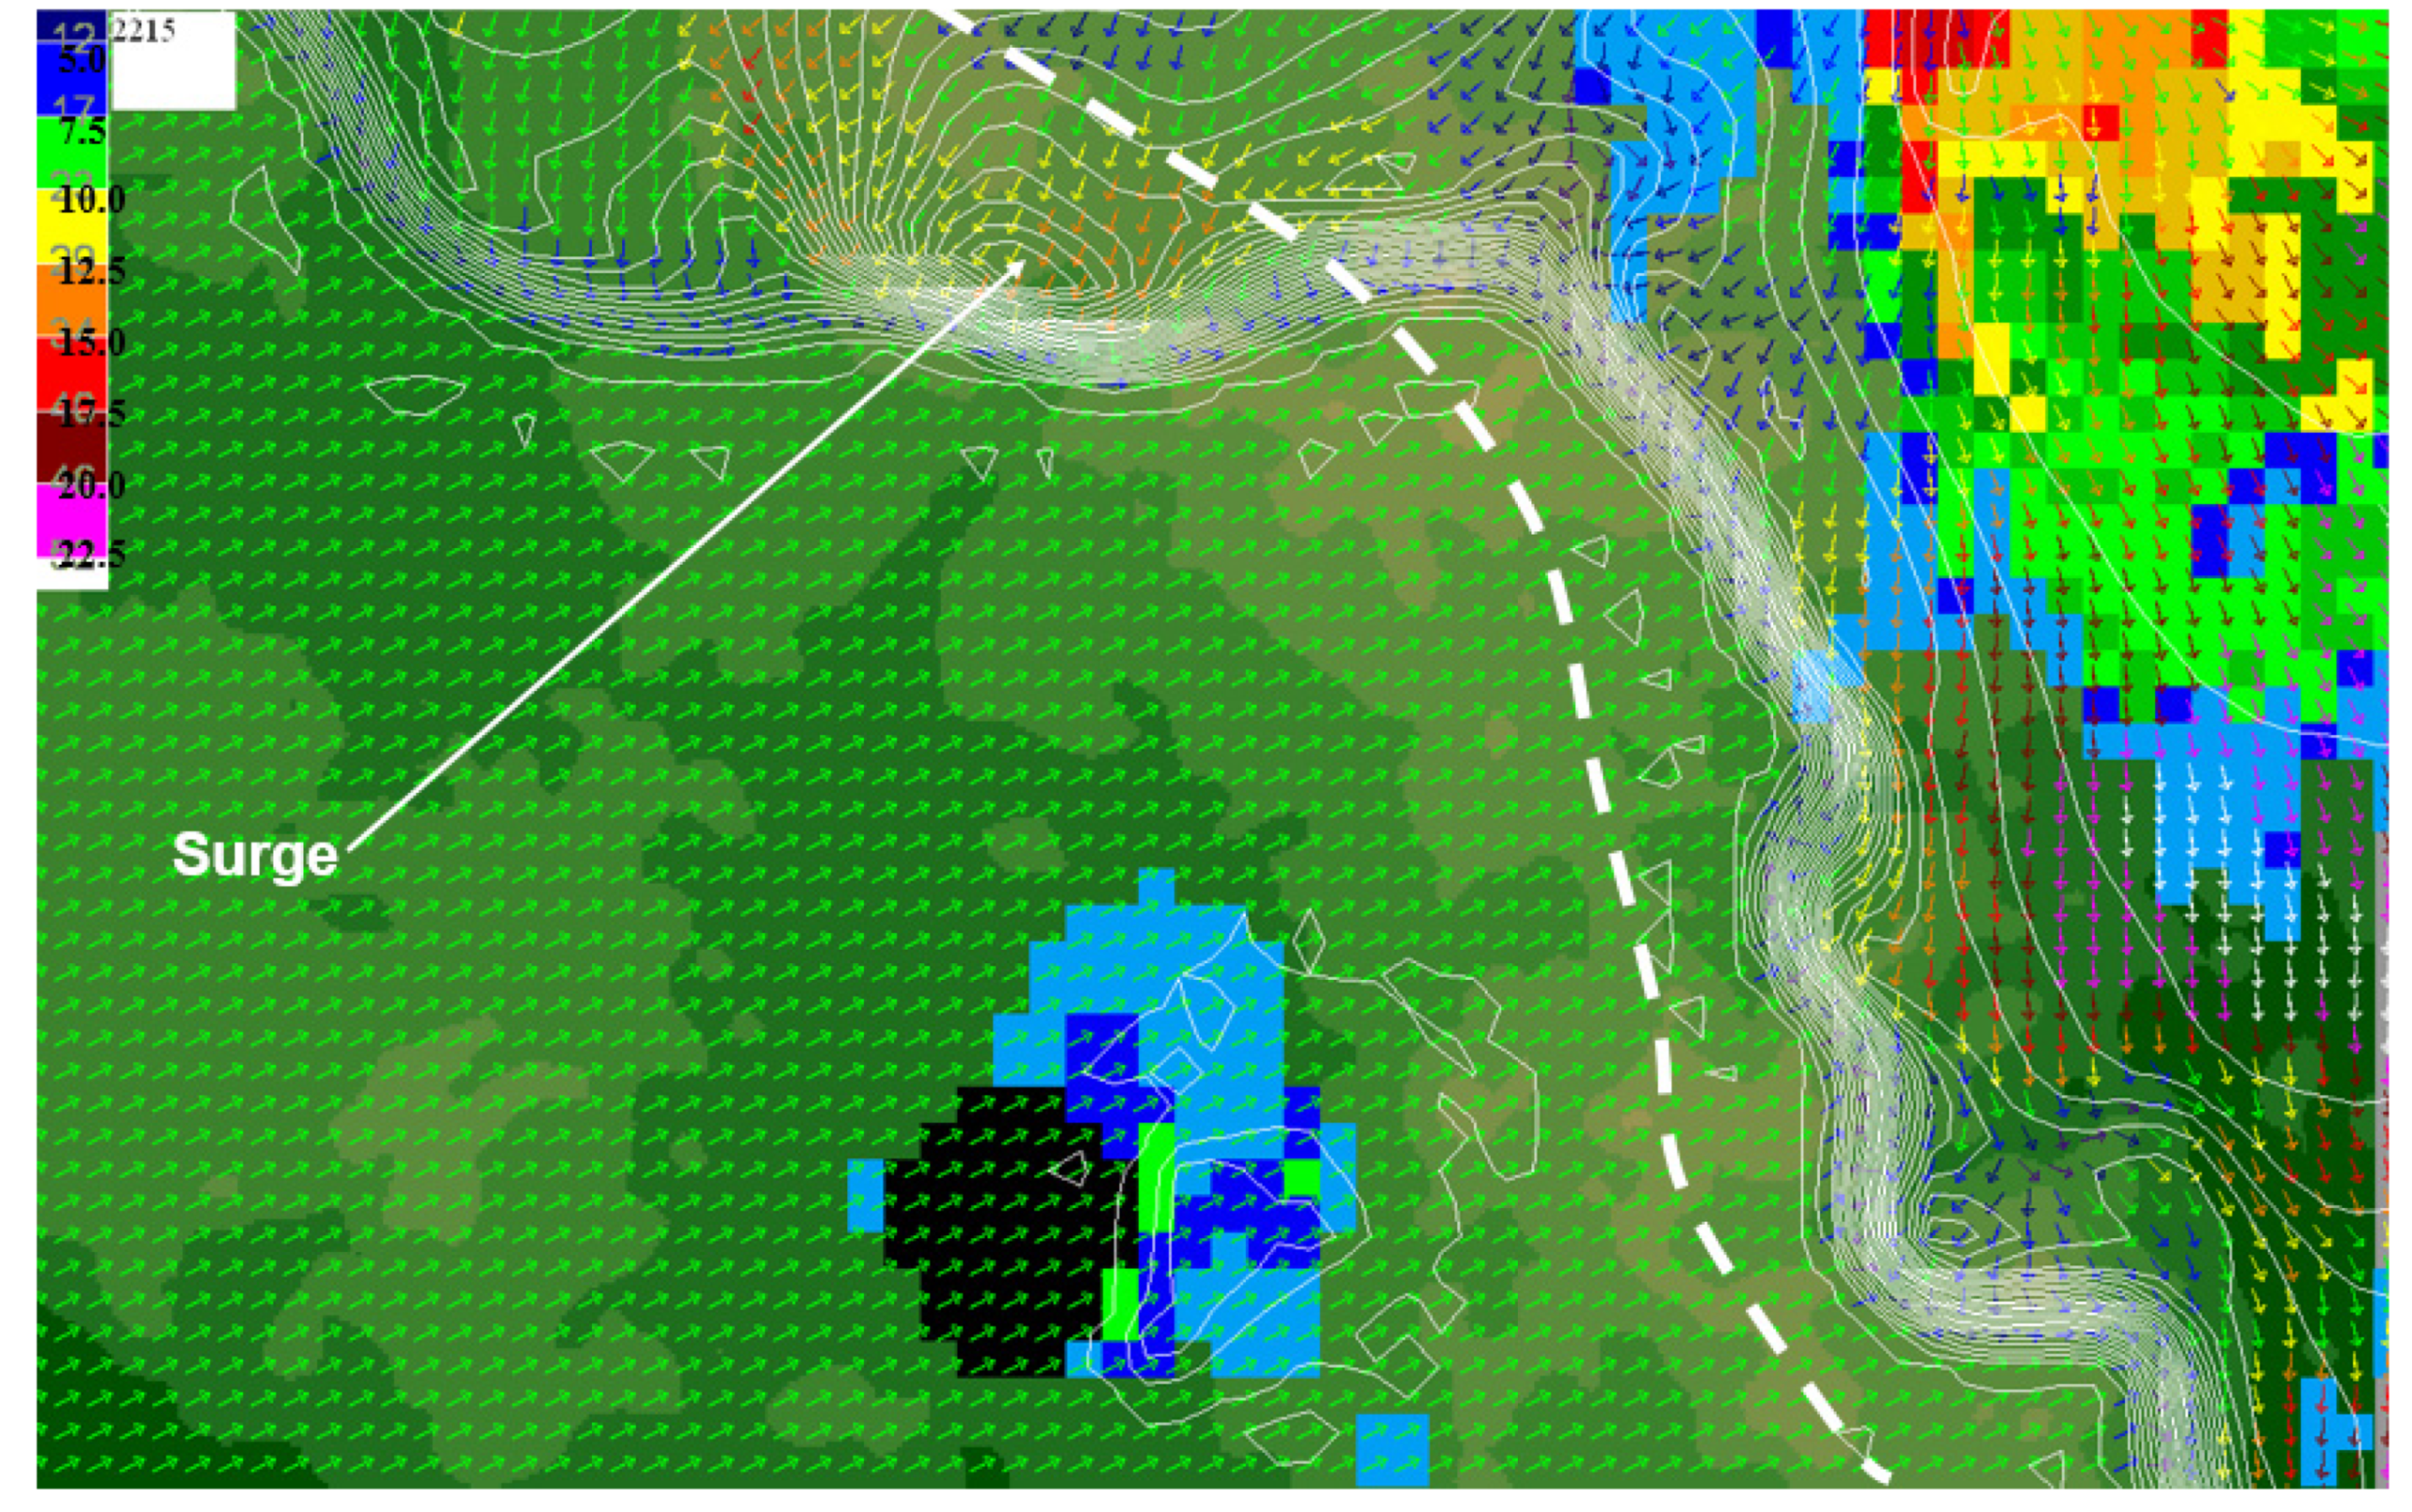
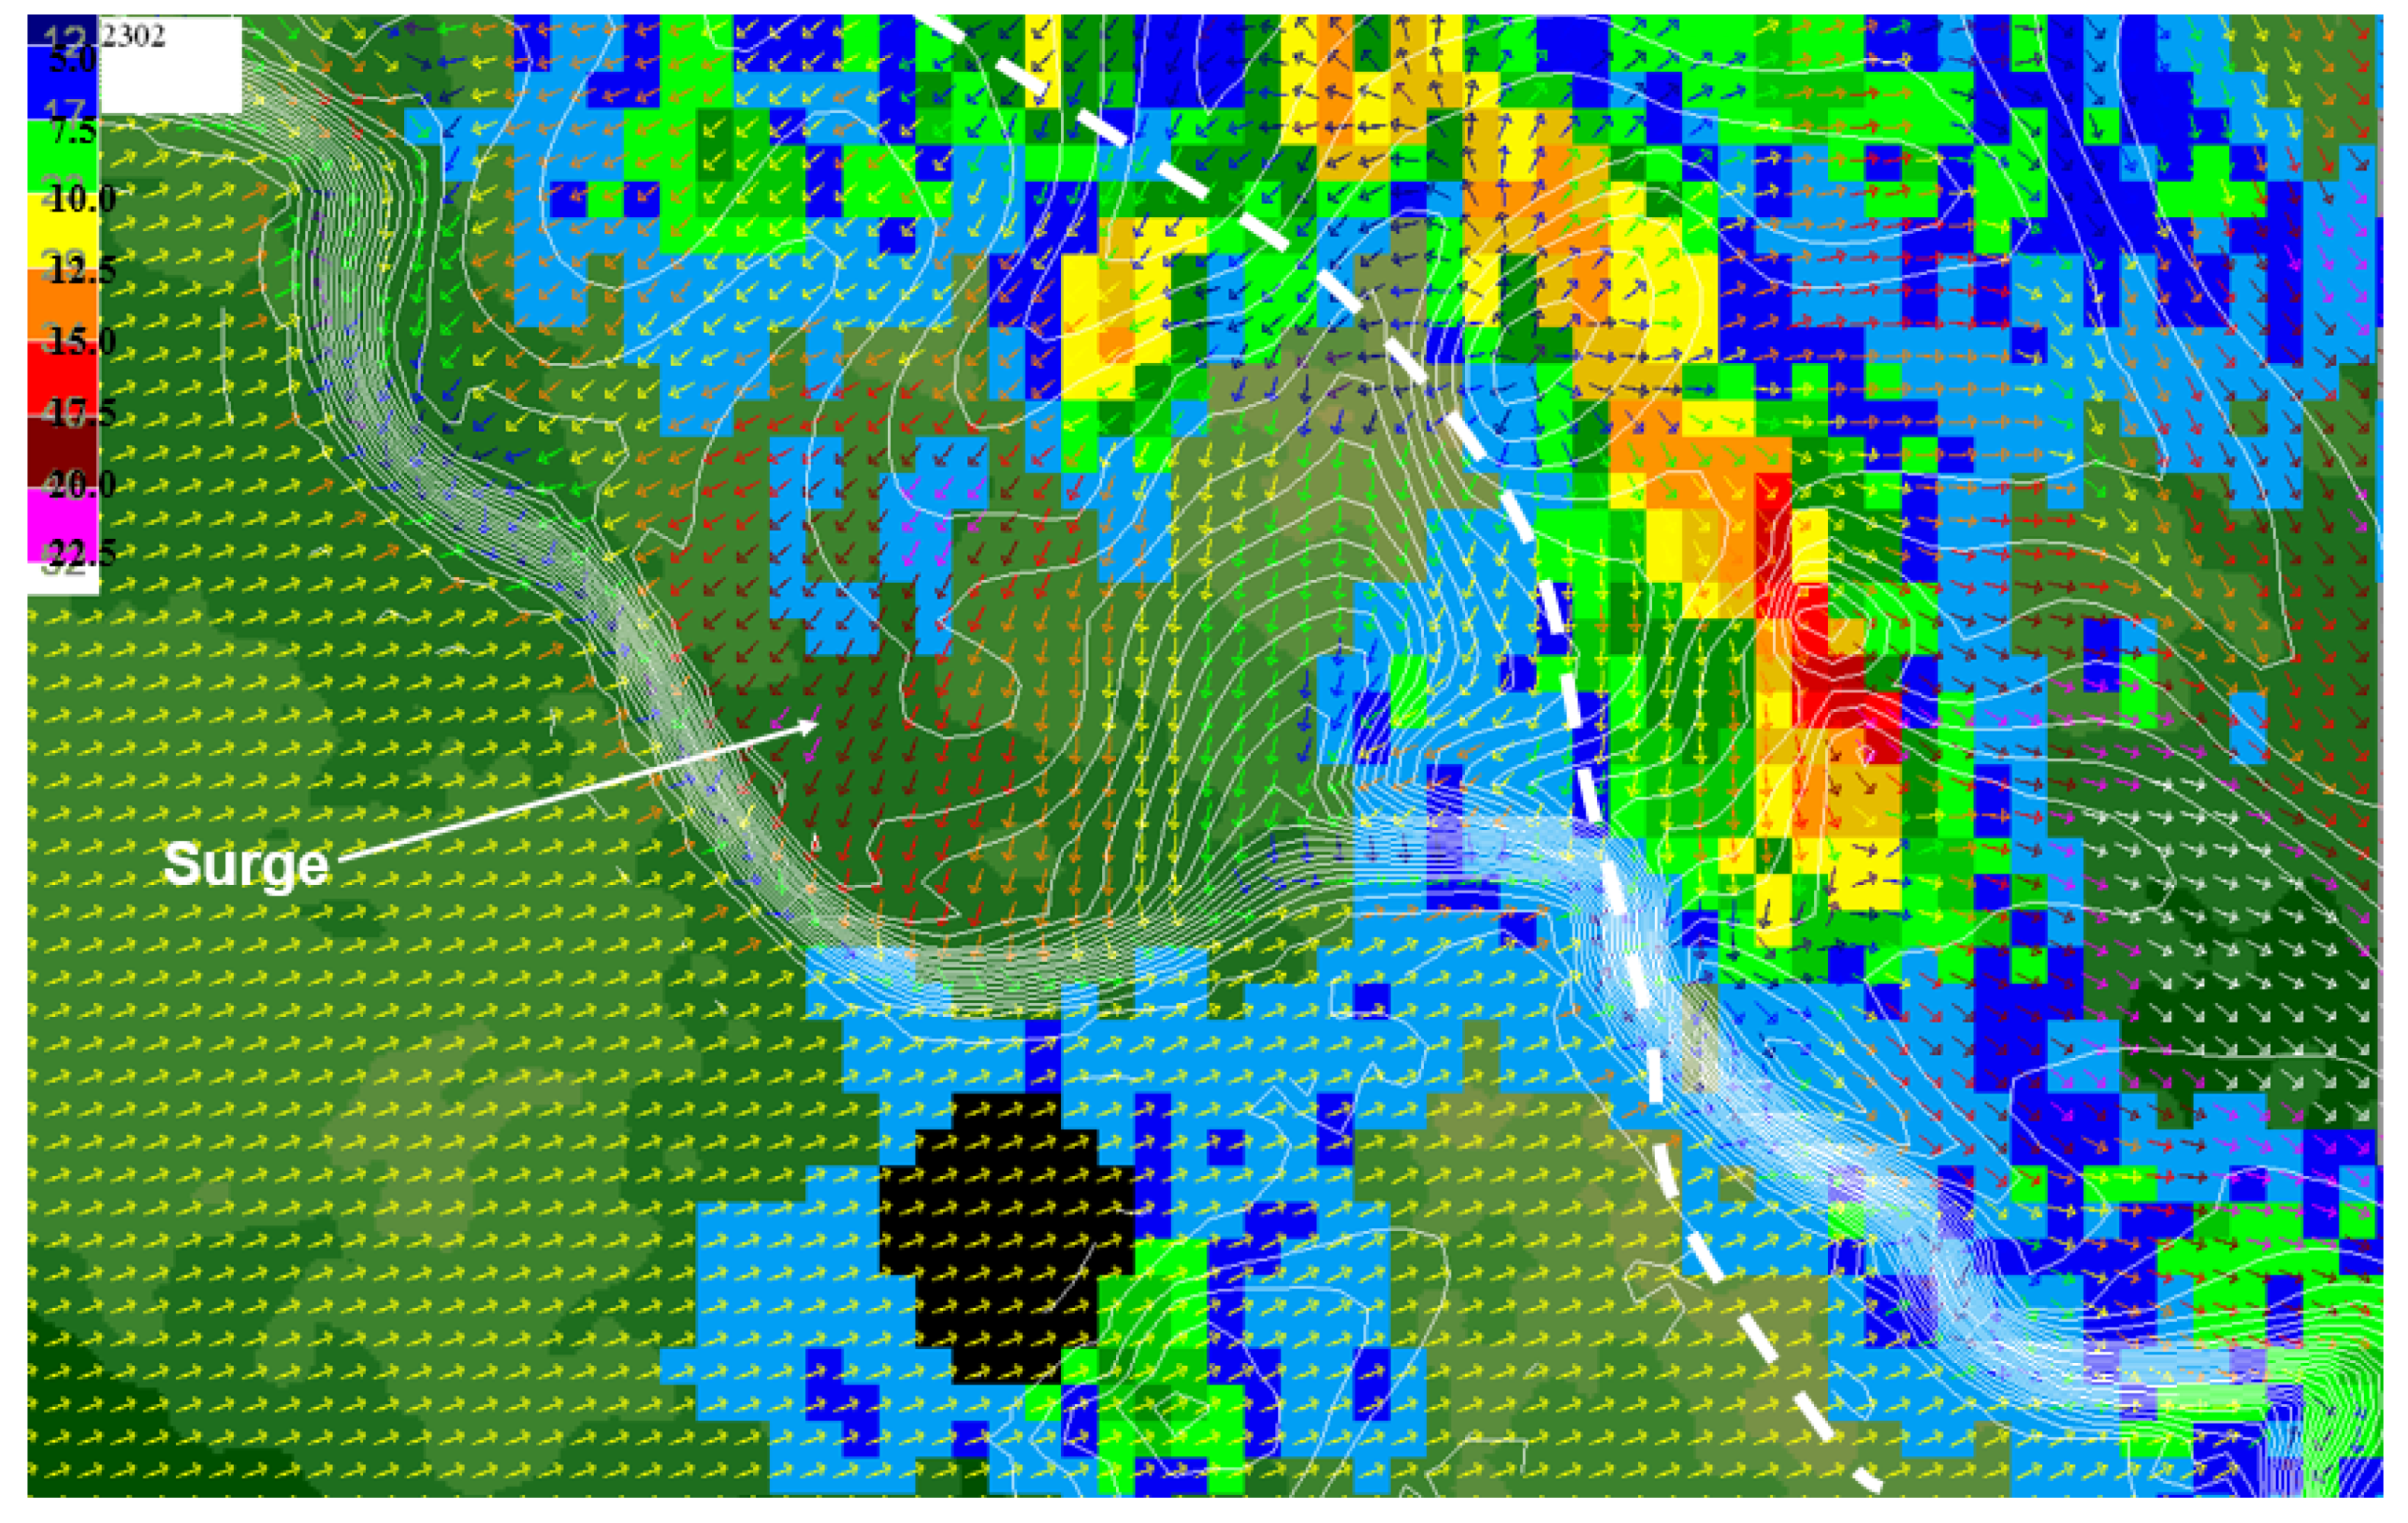
Weather conditions for the local area surrounding Yarnell at 1500 LST are shown in Figure 9. Winds at the fire site were blowing from the southwest at approximately 8 ms−1 (Green arrows). The weakening and slowing gust front from the dissipating convective system over high ground north of Yarnell was pushing south at approximately 8 ms−1. However, the temperature breaks reveal that the intense thunderstorms northeast of Yarnell had produced an outflow ‘surge’ toward the gap in the mountain range there. By 1515 LST (Figure 10), the surge had crossed the gap and, being partially blocked by the gust front from the storm cluster north of Yarnell, had turned southward toward Yarnell. By 1600 LST (Figure 11), the surge had expanded and its gust front was being driven toward the Yarnell Hill fire by winds of almost 20 ms−1 (dark red wind vectors).
4. Discussion
Through a prototype gust front model, we have demonstrated that there exists a class of numerical weather prediction models that, by incorporating real-time radar data, can produce accurate deterministic very short-range gust front forecasts in the range of 30–60 min. The fated fire crew received a weather update at 1526 LST warning of the approach of a gust front that could turn the winds to blow from the north or northeast with a velocity range around 20 ms−1 [5] (p. 34). The period of time from when the modeled outflow surge crossed the gap in the mountain range northeast of Yarnell and turned south toward the fire and its arrival at the fire site was 60 min. The simulation showed the gust front as having arrived at the north side of the radar-observed smoke plume at 1615 LST. This compares with the observed time of gust front arrival at the northern perimeter of the fire being 1618 LST, a difference of 3 min.
The modeled gust front arrived at the southern perimeter of the fire at about 1635 LST (observed arrival at 1630 LST) following a series of events that complicated the wind field. The outflow from the strong storms located east of Yarnell had surged through the second gap in the mountain range shown in Figure 8 by 1616 LST and by 1630 LST, had topped the entire mountain range setting up a powerful gust front that drove southwestward through the fire site with winds from the east-northeast of approximately 20 ms−1.
The official report [5] (p. 43) of the Yarnell Hill accident report made note of the fated fire crew possibly having been confused when the ambient winds at the fire site shifted from blowing from the southwest to blowing from the northwest at around 1530 LST. If the fire crew would have had visual access to weather maps such as produced in this study, would it have been likely that the real hazard approaching the burn site would be noted and appropriate action taken to move the fire crew to a safer location? We pose this sentence as a question because we know that the technology to visually access the weather maps was not available to field personnel in 2013, but today it likely is. Thus, we view our question not as a criticism of decisions made in the past, but as adding to fire fighter safety in the future.
This successful modeling effort has raised additional questions regarding modeling gust fronts in complex terrain. Can the grid resolution be reduced to the scale of the local terrain of the burn site and can the model incorporate wildland fire dynamics into the gust front wind field? In Section 2.2, we noted that the smallest grid resolution of the wind model was 30 m, the minimum range of the U.S. Geological Survey DEM elevation data. Thus, the grid resolution can be reduced but at computational cost. Each halving of the grid spacing involves an increase of the computational load by a factor of eight.
The problem of computational load raises the additional issue of processing time. Convection-permitting numerical weather models require great computer power and some simulations do not run in real time. For the simulations done in this study, we chose the grid resolution of 900 m to closely match with the 1 km resolution of the radar data. The processing time was five to one, meaning that a 15 min simulation could be completed within 3 min of real time on a standard desktop PC.
We have presented a prototype gust front prediction model. Other agencies are not required to use the models we used nor are they as limited in access to computer resources and personnel. The success of any models depends on the availability of the required input datasets. The contiguous United States is covered by a network of weather radars. Few gaps in radar data exist. However, adequate radar data may not be available to fire response units elsewhere. In those instances, the modeling concept we have described cannot be used.
5. Conclusions
We conclude, therefore, that very short-range gust front prediction models that incorporate real-time radar data show promise as a means of predicting the critical weather information on gust front propagation for fire operations, and that such tools warrant further study. The radar data represent ground-truth measurements of locations and intensities of convective storms; and it should therefore be expected that predictions of the locations and severities of gust fronts produced by these storms should be improved over the results of numerical weather prediction models that develop and locate thunderstorms through internal model dynamics.
One reviewer requested to know why the prototype gust front model we have presented in this article has not been developed into an operational model. Some of the weaknesses of the prototype model, such as the lack of an objectively-derived downdraft efficiency weight as defined in Section 2.2 can be addressed with better meteorological data. The major problem we face is in acquiring and georeferencing radar data with elevation data. For our case study of the Yarnell disaster, we had access to digitized historical radar data. For the operational present, the National Weather Service has changed the format for presenting graphical radar data to the public. The gain is that the radar data can be displayed on a local, regional, or national scale. The loss is we have not yet developed a means to georeference the graphical radar data with elevation data. Furthermore, we must screensave the radar image and manually transfer it to the model. Thus, under these constraints, the gust front model is run in real time on occasion but only for areas of the country where complex terrain is not a factor in gust front evolution.
We presume that some agencies such as universities and government have access to real-time radar data in formats no longer available to us and that these agencies have computational facilities and model development manpower needed to incorporate real-time radar data into gust front models.
Author Contributions
Conceptualization, G.L.A. and S.L.G.; methodology, G.L.A.; software, G.L.A.; investigation, G.L.A.; writing—original draft preparation, G.L.A.; writing—review and editing, G.L.A. and S.L.G.; visualization, G.L.A.; supervision, S.L.G. All authors have read and agreed to the published version of the manuscript.
Funding
This research received no external funding.
Data Availability Statement
Publicly available datasets were analyzed in this study. This data can be found here, https://gis.ncdc.noaa.gov/maps/ncei/radar (accessed on 31 August 2021).
Conflicts of Interest
The authors declare no conflict of interest.
References
- Potter, B.E.; Hernandez, J.R. Downdraft outflows: Climatological potential to influence fire behavior. Int. J. Wildland Fire 2017, 26, 685–692. [Google Scholar] [CrossRef]
- Goens, D.W.; Andrews, P.L. Weather and fire behavior factors related to the 1990 Dude Fire near Payson, Arizona. In Proceedings of the 2nd Conference on Fire and Forest Meteorology, Phoenix, AZ, USA, 11–16 January 1998; American Meteorological Society: Boston, MA, USA, 1998; pp. 153–158. [Google Scholar]
- Surveys and Investigation Staff. A Report to the Committee on Appropriations US House of Representatives on Wildfire on Merritt Island. 1981. Available online: https://www.wildfirelessons.net/HigherLogic/System/DownloadDocumentFile.ashx?DocumentFileKey=de70dc82-1760-487f-b1d4-05a8d11293cc&forceDialog=0 (accessed on 31 August 2021).
- Johnson, R.H.; Schumacher, R.S.; Ruppert, J.H., Jr.; Lindsey, D.T.; Ruthford, J.E.; Kriederman, L. The role of convective outflow in the Waldo Canyon Fire. Mon. Weather Rev. 2017, 142, 3061–3080. [Google Scholar] [CrossRef] [Green Version]
- Karels, J.; Dudley, M. Yarnell Hill Serious Accident Investigation Report; Arizona State Forestry Division: Phoenix, AZ, USA, 2013; 116p. Available online: https://www.frames.gov/catalog/15735 (accessed on 31 August 2021).
- Luchetti, N.T.; Friedrich, K.; Rodell, C.E.; Lundquist, J.K. Characterizing Thunderstorm Gust Fronts near Complex Terrain. Mon. Weather Rev. 2020, 148, 3267–3286. [Google Scholar] [CrossRef]
- Luchetti, N.T.; Friedrich, K.; Rodell, C.E. Evaluating Thunderstorm Gust Fronts in New Mexico and Arizona. Mon. Weather Rev. 2020, 148, 4943–4956. [Google Scholar] [CrossRef]
- Powers, J.G.; Bresch, J.F.; Schwartz, C.S.; Coen, J.L.; Sobash, R.A. The Use of NWP Models to Identify Convective Outflows for Fire Weather Forecasting—Final Report to the Joint Fire Science Program; JFSP Project No. 17-1-05-5; University Corporation for Atmospheric Research: Boulder, CO, USA, 2019; 45p. Available online: https://www.frames.gov/catalog/60838 (accessed on 31 August 2021).
- Sun, C.; Vallotton, P. Fast linear feature detection using multiple directional non-maximum suppression. J. Microsc. 2009, 234, 147–157. [Google Scholar] [CrossRef] [PubMed]
- Achtemeier, G.L. Planned Burn-Piedmont. A local operational numerical meteorological model for tracking smoke on the ground at night: Model development and sensitivity tests. Int. J. Wildland Fire 2005, 14, 85–98. [Google Scholar] [CrossRef] [Green Version]
- Liu, Y.; Kochanski, A.; Baker, K.R.; Mell, W.; Linn, R.; Paugam, R.; Mandel, J.; Fournier, A.; Jenkins, M.A.; Goodrick, S.; et al. Fire behaviour and smoke modelling: Model improvement and measurement needs for next-generation smoke research and forecasting systems. Int. J. Wildland Fire 2019, 28, 570–588. [Google Scholar] [CrossRef] [PubMed] [Green Version]
Figure 1.
Gust front boundaries identified by the MDNMS algorithm with each ensemble member a different color. The results are valid for a 24 h ensemble forecast valid at 0000 UTC 4 July 2017. Figure from [8] (their Figure 6).
Figure 1.
Gust front boundaries identified by the MDNMS algorithm with each ensemble member a different color. The results are valid for a 24 h ensemble forecast valid at 0000 UTC 4 July 2017. Figure from [8] (their Figure 6).

Figure 2.
Probability of a gust front within 40 km of a given point. Probabilities run from 0% (white) to 100% (red), color probability scale (0–1) at bottom. The results are valid for a 24 h ensemble forecast valid at 0000 UTC 4 July 2017. Figure from [8] (their Figure 6).
Figure 2.
Probability of a gust front within 40 km of a given point. Probabilities run from 0% (white) to 100% (red), color probability scale (0–1) at bottom. The results are valid for a 24 h ensemble forecast valid at 0000 UTC 4 July 2017. Figure from [8] (their Figure 6).

Figure 3.
Schematic of the gust front modeling approach.

Figure 4.
Highlighted features of the gust front model-generated elevation map.

Figure 5.
Valid at 1231 LST. Gust front model elevation map overlain by radar echoes (multi-colored pixels) and temperature contours (white lines) identifying locations of gust fronts. The location of the smoke plume from the Yarnell Hill fire as observed by radar is given by the blackened circle.
Figure 5.
Valid at 1231 LST. Gust front model elevation map overlain by radar echoes (multi-colored pixels) and temperature contours (white lines) identifying locations of gust fronts. The location of the smoke plume from the Yarnell Hill fire as observed by radar is given by the blackened circle.

Figure 6.
Same as for Figure 5 but valid for 1335 LST.
Figure 6.
Same as for Figure 5 but valid for 1335 LST.

Figure 7.
Same as for Figure 5 but valid for 1500 LST.
Figure 7.
Same as for Figure 5 but valid for 1500 LST.

Figure 8.
The 40 × 60 km area enclosed by the orange box in Figure 7. Shaded elevation data produced by the gust front model. The mountain range is identified by a dashed line with lower elevation gaps identified by arrows. Radar-observed smoke plume of the Yarnell Hill fire shown by the black circle.

Figure 9.
Gust front model derived wind field and temperature breaks showing locations and directions of movement of gust fronts near Yarnell, AZ at 1500 LST. Wind directions are shown by the arrows and relative speeds indicated by arrow colors.
Figure 9.
Gust front model derived wind field and temperature breaks showing locations and directions of movement of gust fronts near Yarnell, AZ at 1500 LST. Wind directions are shown by the arrows and relative speeds indicated by arrow colors.

Figure 10.
Same as for Figure 9 but valid for 1515 LST.
Figure 10.
Same as for Figure 9 but valid for 1515 LST.

Figure 11.
Same as for Figure 9 but valid for 1600 LST.
Figure 11.
Same as for Figure 9 but valid for 1600 LST.


Table 1.
Radar/Wind Model Conversion Factors.
| Intensity (dBZ) | 10 | 15 | 20 | 25 | 30 | 35 | 40 | 45 | 50 | 55 | 60 | 65 | 70 |
|---|---|---|---|---|---|---|---|---|---|---|---|---|---|
| Echo Color | LB | DB | LG | MG | DG | Y | YO | O | R | MR | DR | M | P |
| Wei (ms−1) | 0.0 | 0.0 | 0.2 | 0.4 | 1.0 | 1.4 | 2.0 | 2.5 | 3.5 | 5.0 | 6.0 | 7.0 | 8.0 |
| Cool Factor (C) | 0.00 | 0.00 | 0.10 | 0.10 | 0.15 | 0.25 | 0.65 | 0.85 | 1.00 | 1.00 | 1.00 | 1.00 | 1.00 |
Echo color: LB (light blue), DB (dark blue), LG (light green), MG (medium green), DG (dark green), Y (yellow), YO (yellow-orange), O (orange), R (red), MR (medium red), DR (dark red), M (magenta), P (purple).
Publisher’s Note: MDPI stays neutral with regard to jurisdictional claims in published maps and institutional affiliations. |
© 2021 by the authors. Licensee MDPI, Basel, Switzerland. This article is an open access article distributed under the terms and conditions of the Creative Commons Attribution (CC BY) license (https://creativecommons.org/licenses/by/4.0/).
Share and Cite
MDPI and ACS Style
Achtemeier, G.L.; Goodrick, S.L. Adding to Fire Fighter Safety by Including Real-Time Radar Data in Short-Range Forecasts of Thunderstorm-Induced Wind Shifts. Fire 2021, 4, 55. https://0-doi-org.brum.beds.ac.uk/10.3390/fire4030055
AMA Style
Achtemeier GL, Goodrick SL. Adding to Fire Fighter Safety by Including Real-Time Radar Data in Short-Range Forecasts of Thunderstorm-Induced Wind Shifts. Fire. 2021; 4(3):55. https://0-doi-org.brum.beds.ac.uk/10.3390/fire4030055
Chicago/Turabian StyleAchtemeier, Gary L., and Scott L. Goodrick. 2021. "Adding to Fire Fighter Safety by Including Real-Time Radar Data in Short-Range Forecasts of Thunderstorm-Induced Wind Shifts" Fire 4, no. 3: 55. https://0-doi-org.brum.beds.ac.uk/10.3390/fire4030055