
Unveiling the Factors Responsible for Australia’s Black Summer Fires of 2019/2020


1
Department of Geography, The Hebrew University of Jerusalem, Jerusalem 91905, Israel
2
Remote Sensing Research Centre, School of Earth and Environmental Sciences, University of Queensland, St. Lucia, Brisbane, QLD 4072, Australia
3
Fenner School of Environment and Society, College of Science, Australian National University, Acton, Canberra, ACT 2601, Australia
4
School of Engineering, College of Engineering and Computer Science, Australian National University, Acton, Canberra, ACT 2601, Australia
*
Author to whom correspondence should be addressed.
Fire 2021, 4(3), 58; https://0-doi-org.brum.beds.ac.uk/10.3390/fire4030058
Submission received: 30 July 2021
/
Revised: 1 September 2021
/
Accepted: 1 September 2021
/
Published: 4 September 2021
(This article belongs to the Special Issue Fire in Human Landscapes)
Abstract
:The summer season of 2019–2020 has been named Australia’s Black Summer because of the large forest fires that burnt for months in southeast Australia, affecting millions of Australia’s citizens and hundreds of millions of animals and capturing global media attention. This extensive fire season has been attributed to the global climate crisis, a long drought season and extreme fire weather conditions. Our aim in this study was to examine the factors that have led some of the wildfires to burn over larger areas for a longer duration and to cause more damage to vegetation. To this end, we studied all large forest and non-forest fires (>100 km2) that burnt in Australia between September 2019 and mid-February 2020 (Australia’s Black Summer fires), focusing on the forest fires in southeast Australia. We used a segmentation algorithm to define individual polygons of large fires based on the burn date from NASA’s Visible Infrared Imaging Radiometer Suite (VIIRS) active fires product and the Moderate Resolution Imaging Spectroradiometer (MODIS) burnt area product (MCD64A1). For each of the wildfires, we calculated the following 10 response variables, which served as proxies for the fires’ extent in space and time, spread and intensity: fire area, fire duration (days), the average spread of fire (area/days), fire radiative power (FRP; as detected by NASA’s MODIS Collection 6 active fires product (MCD14ML)), two burn severity products, and changes in vegetation as a result of the fire (as calculated using the vegetation health index (VHI) derived from AVHRR and VIIRS as well as live fuel moisture content (LFMC), photosynthetic vegetation (PV) and combined photosynthetic and non-photosynthetic vegetation (PV+NPV) derived from MODIS). We also computed more than 30 climatic, vegetation and anthropogenic variables based on remotely sensed derived variables, climatic time series and land cover datasets, which served as the explanatory variables. Altogether, 391 large fires were identified for Australia’s Black Summer. These included 205 forest fires with an average area of 584 km2 and 186 non-forest fires with an average area of 445 km2; 63 of the forest fires took place in southeast (SE) Australia (the area between Fraser Island, Queensland, and Kangaroo Island, South Australia), with an average area of 1097 km2. Australia’s Black Summer forest fires burnt for more days compared with non-forest fires. Overall, the stepwise regression models were most successful at explaining the response variables for the forest fires in SE Australia (n = 63; median-adjusted R2 of 64.3%), followed by all forest fires (n = 205; median-adjusted R2 of 55.8%) and all non-forest fires (n = 186; median-adjusted R2 of 48.2%). The two response variables that were best explained by the explanatory variables used as proxies for fires’ extent, spread and intensity across all models for the Black Summer forest and non-forest fires were the change in PV due to fire (median-adjusted R2 of 69.1%) and the change in VHI due to fire (median-adjusted R2 of 66.3%). Amongst the variables we examined, vegetation and fuel-related variables (such as previous frequency of fires and the conditions of the vegetation before the fire) were found to be more prevalent in the multivariate models for explaining the response variables in comparison with climatic and anthropogenic variables. This result suggests that better management of wildland–urban interfaces and natural vegetation using cultural and prescribed burning as well as planning landscapes with less flammable and more fire-tolerant ground cover plants may reduce fire risk to communities living near forests, but this is challenging given the sheer size and diversity of ecosystems in Australia.
1. Introduction
Wildfires are part of the natural functioning of ecosystems [1,2]. However, human activity has transformed the natural regime of wildfires via changes in the ignition causes, the properties of the vegetation that is available to burn (fuel) and the management of natural vegetation (via grazing, agriculture, prescribed burning, deforestation and planting) and, in the last few decades, the global climate crisis and global warming [3,4,5]. For wildfires to start and spread, four conditions have to be satisfied [6]: available biomass to burn, that the moisture content of the vegetation will be low enough so that it can be ignited, that there will be meteorological conditions favouring the propagation of wildfires (high temperatures, low relative humidity, strong winds), and that there be an ignition source, whether natural (e.g., lightning) or anthropogenic (arson, negligence, accidents). Wildfires may develop and present a significant hazard and danger to infrastructure, human life and natural ecosystems, and, in recent years, there have been several cases of wildfires that have attracted the attention of global media, such as the large wildfires in western Canada and California [7,8], the fires in Chile in January 2017 [9], the fires in the Amazon in August 2019 [10,11], and, in the southern hemisphere summer of 2019/2020, the fires in southeast (SE) Australia [12,13]. Given that wildfires in different regions of the world behave differently as a function of local combinations of weather, vegetation and human activity, which affect their ignition and propagation, wildfires in different pyromes should be studied to understand their underlying drivers and behaviours [14,15]. The risk from wildfires to humans is also increasing due to an increase in population, resulting in more people living near forested areas, in the area known as the wildland–urban interface (WUI; [16,17]). The WUI region is more susceptible to wildfires due to its proximity to human settled areas, which are often the source of ignitions [18]; on the other hand, people living in the WUI region are more exposed to risk from wildfires. Within Australia, WUI issues are mostly restricted to forest fires in the south, southwest and southeast of Australia, given that savannah fires in Australia are in remote and sparsely populated areas. Australia is considered a wildfire-prone continent, especially in the grassy savannah landscapes in northern Australia [19], where there are frequent low-intensity fires, whereas, in the forests of southern Australia, fires are less frequent but can be extremely intense [20]. The 2019–2020 fire season in Australia, also known as Australia’s Black Summer, was exceptional in terms of the overall forest area that was burnt in SE Australia [13,21,22] and in the exposure of the Australian population to smoke from the fire [23], in addition to thousands of houses that were destroyed [24] and the impact on the habitat of many Australian faunal, invertebrate and plant species [25,26,27]. A recent study has associated large forest fires (>12.5 km2) in southern Australia (covering the states of New South Wales, Victoria, and South Australia as well as the Australian Capital Territory and the southwest corner of Western Australia) for the period between 1975 and 2014 with fuel dryness and fire weather [28]. What was especially notable in Australia’s Black Summer was that 21% of temperate broadleaf and mixed forest areas was burnt, whereas, in most forest biomes globally, less than 2% of the area is annually burnt [13]. The percentage of forested area burnt was also unprecedented for Australia; the eucalypt forest area burnt was much higher than the annual average for the past 18 years and the largest since at least 1851 [22]. Recent reports have pointed out the role of climate change and extended drought in this exceptional fire season [29,30,31], in addition to logging, the forest management associated with it [32] and the accumulation of fuel loads [33]. However, [34] argued that the hypothesis that fuel loads were the cause of these fires remains to be tested, and it should account for a range of interacting factors of climatic, vegetation and anthropogenic variables. While [35] have analyzed the causes for fire severity at the grid cell level using a range of anthropogenic and climatic variables, so far, an analysis of the drivers of individual wildfires of Australia’s Black Summer has not been undertaken.
In this paper, we aimed to analyze the extent and the climatic, biological and anthropogenic drivers of the large fires (>100 km2) that took place in SE Australia between September 2019 and mid-February 2020 (hereafter referred to as the Black Summer), comparing them with other forest and non-forest fires that took place in other regions of Australia during the Black Summer. Our main objective was to understand what factors have led to some of the fires being larger in area, burning for longer periods and being more destructive than others.
2. Methods
2.1. Study Area and Timeframe
Our study area included all large fires that took place in Australia between September 2019 and mid-February 2020, especially focusing on the fires in SE Australia (Figure 1). We defined SE Australia in this study as the area ranging from K’gari/Fraser Island (located in southeast Queensland) in the north to Karta Pintingga/Kangaroo Island (located in South Australia) in the south (Figure 1).
2.2. Datasets
2.2.1. Mapping the Extent of Burnt Areas
Using remote sensing, wildfires can either be mapped based on thermal anomalies [36] or spectral changes before and after fires [37,38]. We used both of NASA’s active fire products, based on Moderate Resolution Imaging Spectroradiometer (MODIS) (Collection 6) and Visible Infrared Imaging Radiometer Suite (VIIRS) (version 1), both available for download from https://firms.modaps.eosdis.nasa.gov/, accessed 21 February 2020); VIIRS is considered better than MODIS for detecting active fires [39,40]. These are point datasets, including the location, date and time of detection of active fires, as well as estimates of fire radiative power [40], and these datasets have proven very useful for studying the propagation of individual fires [41,42]. Although for fires greater than 0.2 km2, about 90% of all fires are detected using this algorithm [43], active fires cannot be detected by optical sensors in the visible, infrared and thermal spectral ranges when clouds are present and will only be detected and not ‘missed’ if they are burning at satellite overpass time. Therefore, we also used the burnt area product of MODIS (MCD64A1; [44,45]), which provides the global monthly mapping of burnt areas at a spatial resolution of 500 m, with one of the provided layers being the “burn date”, i.e., the estimated date when a pixel was burnt. As the algorithm behind MCD64A1 is also based on change detection, it is less affected by satellite overpass time as the spectral signal of a fire scar is quite persistent [46], especially in comparison with the signal of an active fire. However, the burn date of MCD64A1 is less accurate than the time of fire based on the active fires product. For the fires between September 2019 and February 2020, we calculated the burn date for each grid cell in Australia, at a spatial resolution of 500 m (using Albers equal-area projection), based on the date of the fire from the VIIRS active fires product, and filled in the burnt areas that were not detected due to cloud cover and other interfering factors based on the MCD64A1 product.
2.2.2. Mapping Individual Wildfires
While each fire starts at a certain place from a specific ignition event, there may be several ignition events taking place nearby that are hard to distinguish due to: (1) a wildfire igniting additional wildfires by spot fires as a result of windborne embers [47] or by creating pyrocumulonimbus lightning [48], and (2) wildfires merging into a larger burnt area. Given that for the analysis in this paper, we aimed to analyze the drivers and behaviour of individual wildfires (similar to [49], in their global fire atlas), we created polygons of individual fires using the Segmentation algorithm in TerrSet 18.31 (Clark Labs, ®). The following parameters were used for the segmentation: a window size of 3 pixels, similarity tolerance of 5, weight of mean factor 0.25, weight of variance factor 0.75. The segmentation algorithm was run on all burnt patches with areas larger than 25 km2, and this resulted in 4465 segments across all of Australia (638 were larger than 100 km2). The larger segments were then visually examined and merged into individual wildfires based on their burn date (e.g., adjacent burnt areas that did not belong to the same fire event, based on their dates, were assigned with different ID numbers). Figure 2 presents an example of the methodology followed for the Kangaroo Island fires. Altogether, this resulted in 391 individual wildfires in the fire season of September 2019 to February 2020 in Australia; 65 of these individual wildfires were in SE Australia, and 63 of these, which were forest fires, are the main focus of this study (Figure 1).
2.2.3. Response Variables
For each of the wildfires studied, the response variables included properties of the fires’ size and duration (Table 1): total burnt area, the overall time (days) the fire burnt (fires that burnt for more than 10 days, mostly burnt an area larger than 1000 km2; Figure 3) and the burnt area per day (km2/day). Fire radiative power (FRP) of active fires detected and measured by MODIS was used as a response variable, serving as a proxy of the magnitude of the energy of the fire. To examine the severity of the fires (i.e., their impact on vegetation), four response variables were used, expecting greater changes if the fires were more severe fires: the vegetation health index (VHI), life fuel moisture content (LFMC) and the fractional cover of photosynthetic vegetation (PV) and non-photosynthetic vegetation (NPV) before and after the fire. The VHI index is based on normalising the vegetation condition (VC) and temperature condition (TC) for each grid cell (4 km) (Equations (1)–(3); [50]).
where NDVI, NDVImax and NDVImin are the smoothed weekly NDVI, its multilayer time series absolute maximum, and its minimum (per pixel), respectively; BT, BTmax and BTmin are similar values for brightness temperature. LFMC was obtained from an operational product [51] based on MODIS reflectance data (500 m Nadir BDRF-adjusted reflectance product (MCD43A4 Collection 6), available for download from The Australian Flammability Monitoring System (http://anuwald.science/afms)). The fractional cover layer [52] was derived from MODIS NBAR 16-days fractional cover of Photosynthetic Vegetation (PV), Non-Photosynthetic Vegetation (NPV) and Bare Soil (BS), available from http://dapds00.nci.org.au/thredds/catalog/ub8/au/FractCov/PV/catalog.html (accessed 24 March 2020). In addition to the above fire severity metrics, we used two recent burn severity mapping projects conducted in Australia. In July 2020, a national-wide burn severity map (termed here as AUS FESM) was published for the Black Summer fires [53]. Within the AUS FESM, there are four burn severity classes: unburnt (0), low and moderate (1), high (2) and very high (3). For each wildfire, we calculated an index of its overall burn severity, multiplying each class by its percentage area within each wildfire (the maximum score could, therefore, be 300% if the entire burnt area was assigned to class 3). Burn severity data within the AUS FESM was available for 351 of the Black Summer fires. More than 50% of the area of the remaining 40 Black Summer fires had no data within the AUS FESM dataset and, therefore, were not included in some of the statistical analyses for this variable. An additional response variable that was only available for the Black Summer fires in New South Wales (NSW) was the Fire Extent and Severity Mapping (FESM) v. 2.1 [54]. The NSW FESM methodology recognises six burnt severity classes (from 0, representing unburnt areas, to 5, representing extreme burn severity with complete canopy consumption). For each wildfire in NSW, we calculated an index of its overall burn severity, multiplying each class by its percentage area within each wildfire (the maximum score could, therefore, be 500% if the entire burnt area was assigned to class 5).
VC = (NDVI − NDVImin)/(NDVImax − NDVImin) × 100
TC = (BTmax − BTmin)/(BTmax − BTmin) × 100
VHI = 0.5 × VC + 0.5 × TC
2.2.4. Explanatory Variables
The explanatory variables used included variables related to the state and extent of the fuel (vegetation type and condition), fire propagation (e.g., weather conditions), probable ignition source (lightning/human) and anthropogenic factors to serve as proxies for the motivation and ease to extinguish the wildfires (variables of accessibility and proximity to population) (Table 2). Weather condition variables included the biome, rainfall last year, the time since the last rain and until the next significant rainfall for each wildfire, and the fire danger index (Table 2). The daily fire danger index (FDI) values were computed from 2001 onwards, following [55,56]. The daily grass fire danger index (GFDI) values were computed from 2001 onwards, following [57]. Within forest areas, we used the FFDI, and, within grassland areas, we used the GFDI. In mixed pixels, both FFDI and GFDI were computed, and the highest one was used as the final value. Indigenous Australians have actively monitored and managed fire in the landscape for over 40,000 years to develop and implement their systems of cultural burning practices [58,59,60]. We included land tenure variables (e.g., protected areas, indigenous native title land), given the importance of cultural burning of ‘country’ by indigenous Australians [61,62], and prescribed burning [63,64]. Areas with significant human activity that may result in an ignition have also been associated with the interface between different land cover classes, such as the forest–agricultural interface (FAI), forest–grassland interface (FGI), and the wildland–urban interface (WUI) [65]. Consequently, these interfaces were also included as explanatory variables related to possible human ignition sources (Table 2 and Table S1). An ignition point was defined as being within one of these interfaces when the average value of the interface metric was greater than 25% within a radius of 10 km around the ignition point.
2.3. Statistical Analysis
For the statistical analysis, we separated the fires into the following groups for some of the statistical tests: Black Summer forest fires (>40% tree cover; n = 205) and Black Summer non-forest fires (<40% tree cover; n = 186); Black Summer forest fires in SE Australia (n = 63). We examined whether the explanatory variables varied between these groupings of fires (also separating between forest fires within and outside SE Australia) using Tukey’s HSD test within an ANOVA model (using XLStat 2019.3.2). We calculated univariate correlations between all the variables using the non-parametric Spearman correlation coefficient (Rs) test as well as quantile regression (before and after variable transformation), which is a useful approach to estimate complex interactions when not all of the explanatory factors are accounted for [73]. We ran the quantile regression using various percentiles (0.75, 0.9 and 0.95) and present selected results for the 0.95 percentile, which had the highest adjusted R2 values for most response variables. We calculated multivariate stepwise regression models for the eight response variables, using all explanatory variables, both before and after transformations of the variables (percentages were transformed using arcsin (square root) transformation, count data were transformed using square root transformation, and the other variables were log-transformed, as in [28]).
3. Results
3.1. The Australian Black Summer Season
Overall, in Australia, most of the fires (60% of all active fires detected by MODIS between January 2001 and January 2020) took place in northern Australia (WWF Biome of Tropical & Subtropical Grasslands, Savannas & Shrublands), followed by 22% and 9% in the Deserts & Xeric Shrublands and Temperate Broadleaf & Mixed Forests biomes, respectively (see Figure 2 for the biomes mentioned here). Overall, the 391 Black Summer bushfires (larger than 100 km2) that we mapped across Australia covered a total burnt area of 119,675 km2 (for forest fires) and 82,847 km2 (for non-forest fires). The 391 fires larger than 100 km2 burnt 202,522 km2 out of a total of 264,857 km2. In total, 48% of the area burned by these 391 fires was within the biome of Tropical & Subtropical Grasslands, Savannas & Shrublands, 33% within the biome of Temperate Broadleaf & Mixed Forests, and 8% within Mediterranean Forests, Woodlands & Scrub.
The Black Summer fire season of Australia stood out in the extreme number of forest fires that took place (Figure 4a; 48% of all active fires between Sep 2019 and Jan 2020), with the number of fires in the biome of Temperate Broadleaf & Mixed Forests increasing between Nov 2019 and Jan 2020 by more than 1000% compared with the average monthly active fire numbers for the same months between the years 2001 to 2018 (Figure 4b). During the Black Summer, the fire numbers were also higher than average for the biome of Montane Grasslands & Shrublands (538% more fires than on average) and the biome of Mediterranean Forests, Woodlands & Scrub (470% more fires than on average). The biome of Tropical & Subtropical Grasslands, Savannas & Shrublands (mostly in northern Australia) experienced 74% of the average of active fires between Sep 2019 and Jan 2020, whereas the biome of Deserts & Xeric Shrublands experienced only 33% of its average of active fires (Figure 4b).
3.2. Characteristics of the Response Variables of the Fires
The forest fires of the Black Summer in SE Australia were exceptionally large in their area and long in the number of days they burnt in comparison with the non-forest fires (Table 3). Comparing the forest and non-forest fires of the Black Summer, the forest fires had a greater impact on PV and the VHI (Table 3). The greatest changes in PV due to fire took place in fires that were closer to the coastline (note the high PV difference values in SE Australia), and the greatest changes in PV+NPV due to fire took place in fires in northern Australia (Figure S1). Overall, FRP values were lower in the fires taking place in northern Australia, which were mostly non-forest fires.
The variable of fire spread, as measured by average daily burnt area in a wildfire, showed the highest correlations with the rest of the wildfire response variables (Table 4), with the highest correlation found with the variable of overall burnt area in a wildfire (Rs = 0.74 for the forest fires of the Black Summer in southeast Australia; Table 4). The AUS FESM and NSW FESM indices were well correlated (Rs = 0.65, p < 0.001). Both the AUS FESM and NSW FESM fire severity indices showed strong correlations with the change in PV and NPV before and after the fire (Rs = 0.52 and 0.69, respectively, for the SE forest fires, p < 0.001; Table 4) and with FRP as measured by MODIS (Rs = 0.52 and 0.65, respectively, for the SE forest fires, p < 0.001; Table 4).
Figure 5 presents the time series of some of the explanatory and response variables used in this study for three specific fires, showing how these fires evolved, the impact of the fires on vegetation, and the recovery following the fires. Some of the response variables were correlated, as we have shown above (Table 3), e.g., fires that were associated with high FRP values burnt more rapidly (as measured by their daily burnt area), which was especially noticeable for forest fires (Figure 6, Table 3). While some of the fires were probably ignited by lightning strikes (as in fire #1, shown in Figure 5c), this was not found to be the case for most fires. Peaks in fire radiative power were sometimes associated with peaks in the FDI (see, for example, the fire shown in Figure 5a). However, this was not very common, and, for the forest fires, Spearman’s correlation coefficients between daily FDI values and daily FRP values were above 0.5 only in 43 out of 205 forest fires. The forest fires showed a clear decline in VHI, PV, and PV+NPV during fire (Table 2, Figure 5).
3.3. Characteristics of the Explanatory Variables of the Fires
The values of most explanatory variables varied between the Black Summer forest fires of SE Australia and the Black Summer non-forest fires (Table S2). In comparison with the forest fires, the non-forest fires were associated with drier conditions (considering rainfall, FDI and LFMC) and lower vegetation and forest cover. The non-forest fires were located in more remote areas (from population and roads), which were more likely to be under native title than being part of protected areas, and, within the burnt areas of non-forest fires, there were less forest–agriculture and wildland–urban interfaces (Table S2). Lightning strikes were identified on the days when fires started (i.e., on the day the fire was first detected or in the two preceding days) for 27% of the wildfires and 23% of the forest fires in SE Australia. Lightning strikes were also much more frequent in the savannah regions of northern Australia than in SE Australia. With regards to the interface between different land cover classes, only 2 of the 391 fires started in proximity to the wildlife–urban interface (WUI); 61% of all non-forest fires and 30% of all forest fires (excluding the forest fires in SE Australia) started in proximity to the forest–grassland interface (FGI). For the forest fires in SE Australia, only 4 out of 63 started in proximity to the FGI. Out of the 63 Black Summer forest fires in SE Australia, 10% (DLCD-FAI) to 21% (AGRI-FAI) of all fires were found to have started in proximity to the forest–agricultural interface (FAI).
3.4. Statistical Modelling of the Wildfires
3.4.1. Univariate Correlations
Spearman’s correlation coefficients between all explanatory variables and all response variables are presented in Figure 7a–c for the Black Summer forest fires in SE Australia (n = 63), the Black Summer forest fires (n = 205), and the Black Summer non-forest fires (n = 186), respectively. Across both forest fires and non-forest fires, land management (native title, protected areas) was hardly correlated with any of the response variables (Figure 7). For forest fires in SE Australia (Figure 7a), some of the prominent explanatory variables that were correlated with the response variables referred to the conditions of vegetation (i.e., the fuel) before the fires started. For the forest fires (n = 205), positive correlations were found between some of the interfaces and burn severity (AUS FESM; Figure 7b), for example, with the wildland–urban interface (AGRI WUI; Rs = 0.597; Figure S2). For non-forest fires (Figure 7c), the response variables that were best correlated with the explanatory variables were FRP, the change in VHI and the change in PV+NPV (Figure 8). For the forest fires, the response variables that were best correlated with the explanatory variables were FRP and the changes in PV (Figure 8). For the forest fires in SE Australia, the response variables that were best correlated with the explanatory variables were the change in PV and the change in LFMC (Figure 8 and Figure S3). The response variables for the Black Summer non-forest fires were mostly correlated with climatic and vegetation variables (Figure 9; e.g., Rs = 0.579 between the overall rainfall in the year before the fire and the change in VHI due to the fire). The response variables for the Black Summer forest fires were mostly correlated with vegetation and climatic variables (Figure 9; e.g., Rs = 0.679 between PV before the fire and the change in PV due to the fire), whereas the response variables for the Black Summer forest fires in SE Australia were mostly correlated with vegetation variables (e.g., Rs = 0.665 between VHI at the start of the fire and the change in PV due to the fire; Figure 9). Quantile regression analysis revealed some additional trends for the Black Summer fires: the duration (number of days) of the fires was associated with the time until significant rain arrived (Figure S4) as well as with forest cover continuity (Figure S5) and with the amount of rainfall in the previous year (Figure S6); the burnt area in a wildfire was negatively correlated with the number of times it experienced fires in the previous eight years (Figure S7); FRP was negatively correlated with the percentage of areas that were burnt in the previous 8 months within 25 km of the ignition point (Figure S8).
3.4.2. Multivariate Models
Overall, the stepwise regression models (Figure 10 and Figure 11) were most successful at explaining the response variables for the forest fires in SE Australia (median-adjusted R2 value of 64.3%; Figure 12), followed by all forest fires (median-adjusted R2 value of 55.8%; Figure 12), and all non-forest fires (median-adjusted R2 value of 48.2%; Figure 12). Across all stepwise regression models, the two response variables that were best explained by the explanatory variables were change in PV (median-adjusted R2 value of 69.1%; Figure 12) and change in VHI (median-adjusted R2 value of 66.3%; Figure 12) due to the fire. The two response variables that were least explained by the explanatory variables were the length of the fires in days (median-adjusted R2 value of 38.8%; Figure 12) and area burnt per day (median-adjusted R2 value of 38.5%; Figure 12). On average, vegetation-related variables were most commonly included in the stepwise regression models (2.4 variables on average across the 48 models (8 response variables × 3 subsets × 2 with or without variable transformation)), whereas, on average, 1.8 climatic or anthropogenic variables were included in the stepwise regression models (Figure 13). The relative prevalence of anthropogenic variables was more pronounced in the stepwise models for the forest fires in SE Australia (Figure 13). Amongst all explanatory variables across all regression models (n = 48 models), the following five explanatory variables had, on average, the highest standardised coefficients: number of times there was a fire in the previous 8 years, number of active fires detected in the previous 8 years, and the vegetation conditions before the fire started (LFMC, VHI and PV+NPV). For the stepwise regression models explaining the forest fires in SE Australia (n = 16 models), PV and VHI before the fire started were the two explanatory variables that had, on average, the highest standardised coefficients.
4. Discussion
4.1. The Factors Affecting the Size and Impact of the Black Summer Fires
Previous research has shown that the spatial patterns of ignitions and large wildfires differ [18] and that large wildfires are more likely to occur in forests and shrublands that are more remote and where population density is low [74,75]. Our focus was to study only large (>100 km2) wildfires, and, to that end, we used a range of explanatory variables (11 climatic variables, 9 vegetation variables and 15 anthropogenic variables) to test what led to some of the fires burning over larger areas, for more days, and in greater intensity, leading to a more negative impact on vegetation. Overall, amongst the variables we examined, vegetation- and fuel-related variables (such as previous frequency of fires and the conditions of the vegetation before the fire) were found to be more prevalent in the multivariate models for explaining the response variables in comparison with the climatic and anthropogenic variables.
For the Black Summer fires, the duration (number of days) of the fires was associated with the time until significant rain arrived (aiding in extinguishing the fires; Figure S4). Rainfall is a major factor in extinguishing small (<5 km2) savannah fires [76]. When forest fires are very large, suppression efforts are often impossible [77], and the onset of rainfall is necessary to aid fire extinction [78]. An additional constraint on the propagation of forest fires and the damage caused by forest fires is forest cover continuity (i.e., the extent of continuous forest cover; Figure S3). More destructive forest fires (considering the changes in VHI, LFMC, PV, and PV+NPV due to fire) were mostly associated with higher values of VHI, LFMC, PV and PV+NPV before the fire, i.e., when there is more fuel to burn, forest fires can cause more damage (Figure S3). In contrast, the probability of ignition increases with lower dead fuel moisture content values (being very high when moisture is below 30%, as found in various lab experiments; [79,80]); there is a lack of information regarding moisture thresholds for the ignition of live vegetation [81].
The amount of rainfall in the previous year contributes to the amount of available fuel (especially of herbaceous vegetation, which dries out and can subsequently ignite quickly (Figure S6) [82,83]. Fire history was also found to be significant in explaining fire areas and the change in PV due to fire, with fire that burnt in areas where there were fires in previous years or adjacent fires in the previous months being smaller and having lower FRP (Figures S7 and S8). Indeed, fire intensity (e.g., rate of spread, spotting distance) in dry eucalypt forests increases with the age of fuels (time since last fire; [84]). The role of fire history in constraining fires is especially important in slow-maturing communities, such as forests [77], and the intervals between the extreme fires of eucalypt forests in the temperate climate regions of Australia are expected to be over 100 years (Murphy et al., 2013). These eucalypt forests, where most fires took place in the Black Summer, are also characterised by high fire intensities [20]. Compared with the western United States and the Mediterranean Basin, Australia has, relatively, a lot of fires in areas with high forest cover and intermediate population densities [85].
Fire propagation depends not only on vegetation- and climate-related variables but also on human modification to the landscape and fire suppression efforts. Anthropogenic factors have mostly been incorporated as explanatory variables in the multivariate models for the forest fires of SE Australia (Figure 9). However, this may be simply because most of the Australian population resides in SE Australia in areas that were relatively closer to those forest fires, whereas the rest of the fires took place in remote areas. A seeming paradox was found, with the total population having positive coefficients in the models explaining forest fires, whereas the mean population had negative coefficients in the same models (Figure 10 and Figure 11). The total population within a burnt area was not independent of the fire area, while mean population size within a burnt area was normalised by the wildfire area. Given that most fires had ignited in remote areas and not close to the WUI, the correlation between fire size and fire impact and total population exposed to the fires demonstrated that most of the large fires were simply uncontrollable and, later on, expanded to populated areas (overall, the burnt area of the forest fires of SE Australia was home to more than 48,000 people). The largest forest fire of the Black Summer (in terms of the population living within the burnt area) included over 8600 people (i.e., 1.7 persons/km2), which, relative to the size of the fire, is a sparsely populated area.
Wildfires can be ignited on purpose (e.g., arson, prescribed burning) or accidentally from either natural causes (e.g., lightning strikes) or human causes (e.g., from escaped campfires, escaped prescribed burning, electrical infrastructure) [86,87]. Human-caused fires are the dominant source (87%) of ignitions in SE Australia [88]. However, lightning-caused wildfires cannot be disregarded and have led to extensive wildfires as well [19]. Nevertheless, not all fire ignitions are equal in terms of the risk they pose to human lives and assets, and for fires to spread and burn larger areas over a longer period, meteorological conditions of air temperature, relative humidity and wind speed, which can be summarised by fire danger indices and also affect live fuel moisture conditions and the susceptibility of vegetation to ignition, are critical [89]. Heatwaves have been associated with dead fine fuel dryness in SE Australia, even more so in dry seasons with a deficit in rainfall [90], as was the case during Australia’s Black Summer. The interaction between atmospheric parameters with soil and fuel moisture content over the scale of days and weeks to months and years is critical, as compounding of the individual processes at the different scales occurs, and this has been seen in the cumulative effects of antecedent dry years, low winter rainfall and heatwaves during the Black Summer in other studies [91]. In other words, fuel dryness builds up over years—rainfall at different times of the year and heatwaves affect this, and if soils are very dry during the cool season, fuel moisture can rapidly decrease when warm conditions arrive. An increase in vapour pressure deficit leading to lower fuel moisture content is likely to increase the probability of fire ignition (due to either natural or anthropogenic factors) to areas that previously had relatively few fires [92].
Lightning-caused and power-transmission-caused ignitions have been associated with the forest fire danger index in Victoria [93]. We found that about 23% of the Black Summer forest fires in SE Australia were associated with lightning strikes as their likely ignition cause. We associated wildfires with lightning as the likely ignition cause based on temporal and spatial proximity, namely, if a fire ignition point that was identified based on its burn date was within a distance of less than 5 km from a lightning strike that took place on the day of the detected burn date or in the two previous days. Note that given the low temporal frequency of MODIS, fires are usually detected after they actually start [94], and, thus, our 23% may be an underestimation. Indeed, the final report of the NSW bushfire inquiry stated that 24 out of the 32 significant fires in NSW were started by lightning [95]. This share of lightning strikes as an ignition source is relatively high, given that less than 10% of wildfire ignitions in Victoria and New South Wales (between the years 1997/1998 and 2008/2009) have been attributed to lightning [88]. In our study of large fires (>100 km2), hardly any of the fires were associated with the wildland–urban interface. This contrasts with the findings of [93] for fire ignitions in the state of Victoria (between 1997 and 2009), where housing density was the lead factor contributing to explain other causes of fire. In our multivariate models, the FAI was the interface that entered more models than the other interfaces, mostly for explaining non-forest fires (Figure 10 and Figure 11).
4.2. Remote Sensing of Wildfires
Wildfires can be studied at different spatial scales, either within predefined units (e.g., within administrative regions), at the grid cell level (often done when using remote-sensing-derived metrics of fires) or as individual fires (either as points representing fire ignitions or as fire polygons delimiting the area of individual fires, as in this study). Various response variables can be studied, such as fire frequency (or fire interval), the size of a fire, the spotting of fires [96], fire intensity, fire speed, and the ecological impact of a fire. In our study, we focused only on large fires (>100 km2) and, therefore, did not include fire frequency as a response variable, but we did incorporate the time since the last fire as one of our explanatory variables. Given that the various response variables represent different processes, they are not all highly correlated (Table 3), and, therefore, different explanatory factors are relevant for studying each of these response variables. For example, a fire may be of high intensity, causing much damage to vegetation, but may burn over a relatively small area and over just a few days (as in the case of the Black Saturday fires; [97]).
For this study, most of the selected response variables were from globally available datasets derived from coarse spatial resolution sensors such as AVHRR, MODIS and VIIRS. Given that we examined only large fires, we could use the blended VHI dataset, which is distributed at a spatial resolution of about 4 km [98]. Most of the other datasets were available at spatial resolutions ranging between 250 m and 1 km, which was fine for a continental-scale study but may not be detailed enough for studying individual fires, especially if they are relatively small and burn over just a few days. The free and global availability of Sentinel-2 and Landsat-8 enables a high revisit time (<5 days; [99,100]), can lead to the production of new high-resolution time series of fire products (as recommended by [101] and done for the USA, [102]), which should include both the extent of the fire, burn date and burn severity. Such products are currently available globally, mainly from MODIS and VIIRS at spatial resolutions between 250 and 500 m [103]. Australia is one of the most advanced countries in the world with respect to the coordinated use of remote sensing for mapping vegetation, wildfire risk (with the operational generation of fire danger indices, live fuel moisture content and flammability; [51]) and burned areas, with various national products. However, there is currently no operational nationally produced dataset of burnt areas or burn severity for Australia, which is critical for studying fires in greater detail and better understanding the progression of fires such as the Black Summer fires. Due to the significant differences in ecosystem types and fire regimes from north to south and east to west across Australia, a range of different approaches and standards are used for mapping burnt areas or burn severity. Northern Australian states and territories, in areas of savanna woodlands, are using the North Australian Rangeland and Fire Information System ([104]; https://firenorth.org.au/nafi3, accessed 29 July 2020). Quite different approaches are used across each of the southern states. In Queensland, for example, wildfire extent mapping is routinely done based on Landsat and Sentinel 2 images [105], and new automatic algorithms are now being developed. In New South Wales, an algorithm has been developed for mapping fire severity [54], and the first nationwide Australian dataset of burn severity was released in July 2020 [53].
One of the factors hampering the monitoring of fires from space is the lack of a dedicated geostationary satellite devoted to monitoring active fires in a timely manner. Currently, the available active fire products of MODIS and VIIRS have only a few passes a day [94], and, given frequent cloud cover in different parts of the world, this is not enough for detecting fire ignition, monitoring the propagation of fires in real-time, and mapping FRP on an hourly basis. The first sensor to offer such capabilities for Australia is Himawari-8 (for Africa and Europe, another sensor serves such a purpose: SEVIRI, onboard the Meteosat satellite; [106]), with the best spatial resolution so far compared to previous geostationary satellites, although, compared with MODIS and VIIRS it is relatively coarse (2 km; [94,107,108,109]). One of the outcomes from the national government enquiry into the causes and impacts of the Black Summer fire season is the need to more effectively integrate Earth observation data streams in pre-fire assessments (fuel load and flammability), active fire monitoring (this is the main gap) and post-fire impact and recovery assessments [22].
5. Conclusions
The spatial and temporal extent of Australia’s Black Summer fires was unprecedented with regards to the forest fires in SE Australia and their impact on Australia’s population. The massive scale of these fires has been attributed to an extremely dry summer season; according to some climate projections, the fire weather season in SE Australia may increase in length in the 21st century [110]. Indeed, in their 2007 report, Ref. [111] fortuitously predicted that effects of climate change on the lengthening of the fire season and fire intensity will become apparent by 2020. Positive and extreme positive events of the Indian Ocean Dipole (associated with increased fire risk in SE Australia) are projected to become more frequent in the 21st century [112]. However, there is great uncertainty and variability between different global climate models with regards to their implications on future fire regimes [6,113]. Whereas the global burnt area has decreased between 1998 and 2015, within Australia, the trend was more ambiguous [114]. In our analysis, amongst the variables we have examined, we found that vegetation- and fuel-related variables were more prevalent in the multivariate models for explaining the response variables in comparison with the climatic and anthropogenic variables. Whereas we have less control over future climate, managing vegetation is something that can be and is being done. Cultural (aboriginal) burning in Arnhem Land has succeeded in reducing the frequency of late dry season fires [59]. While prescribed fires are an important and reliable tool (with about just 1% of prescribed fires escaping; [115]), it is doubtful whether, at the grand scale of Australia, prescribed fires will ever succeed in mitigating the risk of large forest fires [95]. While reducing fire hazards is difficult, reducing the exposure of people to risks from fires can be done by better management of, for example, the wildland–urban interface. In addition, a unified approach for monitoring active fires, burnt areas and burn severity in Australia using higher spatial and temporal resolution operational products (which are currently not available) can assist in managing and reducing fire risk. The establishment of the Australian Space Agency in 2018 [116] may lead the way for better monitoring and management of fires in Australia by launching missions specifically designed to support fire management.
Supplementary Materials
The following are available online at https://0-www-mdpi-com.brum.beds.ac.uk/article/10.3390/fire4030058/s1, Table S1: Codes of the raster layers used for calculating the interfaces (following [65]), from Australia’s Dynamic Land Cover Dataset Version 2.1 and from the Land Use and Management Information for Australia dataset. Table S2: Between grouping differences of the explanatory variables (after transformations) using Tukey’s HSD test within an ANOVA model. The values in the tables represent the average values per class (after variable transformation). Groups with different letters were identified as statistically different from each other. The class with the highest value per variable is highlighted using a bold font. Figure S1: The values of the eight response variables for all the wildfires included in this study. Figure S2: The correspondence between the wildland urban interface (AGRI WUI) and AUS FESM burn severity. The trend line if for all forest fires (n = 205) including those in SE Australia. Figure S3: Quantile regression (quantile of 0.95), for the change in LFMC during the fire (as the response variable), and the LFMC at the start of the fire (as the explanatory variable). Figure S4: Quantile regression (quantile of 0.95), for the number of days a fire burnt (as the response variable), and the number of days until there was significant rain since the beginning of a wildfire (as the explanatory variable). Figure S5: Quantile regression (quantile of 0.95), for the number of days a fire burnt (as the response variable), and forest cover continuity (as the explanatory variable). Figure S6: Quantile regression (quantile of 0.95), for the number of days a fire burnt (as the response variable), and the amount of rain in the year before the fire (as the explanatory variable). Figure S7: Quantile regression (quantile of 0.95), for the burnt area (as the response variable), and the number of times there were fires within the boundary of a wildfire in the previous eight years (as the explanatory variable). Figure S8: Quantile regression (quantile of 0.95), for fire radiative power (as the response variable), and the percent area which was burnt in the previous eight months within 25 km of the ignition of the fire (as the explanatory variable).
Author Contributions
Conceptualization, N.L.; methodology, N.L., M.Y. and S.P.; validation, N.L.; formal analysis, N.L.; investigation, N.L.; resources, N.L., M.Y. and S.P.; data curation, N.L.; writing—original draft preparation, N.L.; writing—review and editing, N.L., M.Y. and S.P.; visualization, N.L.; funding acquisition, M.Y. All authors have read and agreed to the published version of the manuscript.
Funding
This research received no external funding.
Data Availability Statement
Data supporting reported results will be uploaded as a supplementary file on this journal, and will also be uploaded to Pangaea.de.
Acknowledgments
We would like to thank Rodney Borrego-Acevedo for writing a code for extracting time series using the Google Earth Engine.
Conflicts of Interest
The authors declare no conflict of interest.
References
- Bowman, D.M.; Balch, J.K.; Artaxo, P.; Bond, W.J.; Carlson, J.M.; Cochrane, M.A.; D’Antonio, C.M.; DeFries, R.S.; Doyle, J.C.; Harrison, S.P. Fire in the Earth System. Science 2009, 324, 481–484. [Google Scholar] [CrossRef]
- Pausas, J.G.; Keeley, J.E. Wildfires as an Ecosystem Service. Front. Ecol. Environ. 2019, 17, 289–295. [Google Scholar] [CrossRef] [Green Version]
- Pausas, J.G.; Keeley, J.E. A Burning Story: The Role of Fire in the History of Life. BioScience 2009, 59, 593–601. [Google Scholar] [CrossRef] [Green Version]
- Bowman, D.M.; Balch, J.; Artaxo, P.; Bond, W.J.; Cochrane, M.A.; D’antonio, C.M.; DeFries, R.; Johnston, F.H.; Keeley, J.E.; Krawchuk, M.A. The Human Dimension of Fire Regimes on Earth. J. Biogeogr. 2011, 38, 2223–2236. [Google Scholar] [CrossRef] [Green Version]
- Bowman, D.M.; Williamson, G.J.; Abatzoglou, J.T.; Kolden, C.A.; Cochrane, M.A.; Smith, A.M. Human Exposure and Sensitivity to Globally Extreme Wildfire Events. Nat. Ecol. Evol. 2017, 1, 1–6. [Google Scholar] [CrossRef]
- Bradstock, R.A. A Biogeographic Model of Fire Regimes in Australia: Current and Future Implications. Glob. Ecol. Biogeogr. 2010, 19, 145–158. [Google Scholar] [CrossRef]
- Kirchmeier-Young, M.C.; Gillett, N.P.; Zwiers, F.W.; Cannon, A.J.; Anslow, F.S. Attribution of the Influence of Human-induced Climate Change on an Extreme Fire Season. Earth Future 2019, 7, 2–10. [Google Scholar] [CrossRef]
- Williams, A.P.; Abatzoglou, J.T.; Gershunov, A.; Guzman-Morales, J.; Bishop, D.A.; Balch, J.K.; Lettenmaier, D.P. Observed Impacts of Anthropogenic Climate Change on Wildfire in California. Earth Future 2019, 7, 892–910. [Google Scholar] [CrossRef] [Green Version]
- Bowman, D.M.; Moreira-Muñoz, A.; Kolden, C.A.; Chávez, R.O.; Muñoz, A.A.; Salinas, F.; González-Reyes, Á.; Rocco, R.; de la Barrera, F.; Williamson, G.J. Human–Environmental Drivers and Impacts of the Globally Extreme 2017 Chilean Fires. Ambio 2019, 48, 350–362. [Google Scholar] [CrossRef]
- Prist, P.R.; Levin, N.; Metzger, J.P.; de Mello, K.; de Paula Costa, M.D.; Castagnino, R.; Cortes-Ramirez, J.; Lin, D.-L.; Butt, N.; Lloyd, T.J. Collaboration across Boundaries in the Amazon. Science 2019, 366, 699–700. [Google Scholar] [PubMed]
- Skipper, M.; Dhand, R.; Pearson, H. Take Action to Stop the Amazon Burning. Nature 2019, 573, 163. [Google Scholar]
- Nolan, R.H.; Boer, M.M.; Collins, L.; Resco de Dios, V.; Clarke, H.G.; Jenkins, M.; Kenny, B.; Bradstock, R.A. Causes and Consequences of Eastern Australia’s 2019–20 Season of Mega-Fires. Glob. Chang. Biol. 2020, 26, 1039–1041. [Google Scholar] [CrossRef] [Green Version]
- Boer, M.M.; de Dios, V.R.; Bradstock, R.A. Unprecedented Burn Area of Australian Mega Forest Fires. Nat. Clim. Chang. 2020, 10, 171–172. [Google Scholar] [CrossRef]
- Nagy, R.; Fusco, E.; Bradley, B.; Abatzoglou, J.T.; Balch, J. Human-Related Ignitions Increase the Number of Large Wildfires across US Ecoregions. Fire 2018, 1, 4. [Google Scholar] [CrossRef] [Green Version]
- Kganyago, M.; Shikwambana, L. Assessment of the Characteristics of Recent Major Wildfires in the USA, Australia and Brazil in 2018–2019 Using Multi-Source Satellite Products. Remote Sens. 2020, 12, 1803. [Google Scholar] [CrossRef]
- Radeloff, V.C.; Hammer, R.B.; Stewart, S.I.; Fried, J.S.; Holcomb, S.S.; McKeefry, J.F. The Wildland–Urban Interface in the United States. Ecol. Appl. 2005, 15, 799–805. [Google Scholar] [CrossRef] [Green Version]
- Bar-Massada, A.; Stewart, S.I.; Hammer, R.B.; Mockrin, M.H.; Radeloff, V.C. Using Structure Locations as a Basis for Mapping the Wildland Urban Interface. J. Environ. Manag. 2013, 128, 540–547. [Google Scholar] [CrossRef]
- Levin, N.; Tessler, N.; Smith, A.; McAlpine, C. The Human and Physical Determinants of Wildfires and Burnt Areas in Israel. Environ. Manag. 2016, 58, 549–562. [Google Scholar] [CrossRef]
- Russell-Smith, J.; Yates, C.P.; Whitehead, P.J.; Smith, R.; Craig, R.; Allan, G.E.; Thackway, R.; Frakes, I.; Cridland, S.; Meyer, M.C. Bushfires ‘down under’: Patterns and Implications of Contemporary Australian Landscape Burning. Int. J. Wildland Fire 2007, 16, 361–377. [Google Scholar] [CrossRef]
- Murphy, B.P.; Bradstock, R.A.; Boer, M.M.; Carter, J.; Cary, G.J.; Cochrane, M.A.; Fensham, R.J.; Russell-Smith, J.; Williamson, G.J.; Bowman, D.M. Fire Regimes of Australia: A Pyrogeographic Model System. J. Biogeogr. 2013, 40, 1048–1058. [Google Scholar] [CrossRef]
- Pickrell, J. Australian Blazes Will ‘Reframe Our Understanding of Bushfire’. Science 2019, 366, 937. [Google Scholar] [CrossRef]
- Bowman, D.; Williamson, G.; Yebra, M.; Lizundia-Loiola, J.; Pettinari, M.L.; Shah, S.; Bradstock, R.; Chuvieco, E. Wildfires: Australia Needs National Monitoring Agency. Nature 2020, 584, 188–191. [Google Scholar] [CrossRef]
- Borchers Arriagada, N.; Palmer, A.J.; Bowman, D.M.; Morgan, G.G.; Jalaludin, B.B.; Johnston, F.H. Unprecedented Smoke-related Health Burden Associated with the 2019–20 Bushfires in Eastern Australia. Med, J. Aust. 2020, 213, 282–283. [Google Scholar] [CrossRef] [PubMed]
- Filkov, A.I.; Ngo, T.; Matthews, S.; Telfer, S.; Penman, T.D. Impact of Australia’s Catastrophic 2019/20 Bushfire Season on Communities and Environment. Retrospective Analysis and Current Trends. J. Saf. Sci. Resil. 2020, 1, 44–56. [Google Scholar] [CrossRef]
- Ward, M.; Tulloch, A.I.; Radford, J.Q.; Williams, B.A.; Reside, A.E.; Macdonald, S.L.; Mayfield, H.J.; Maron, M.; Possingham, H.P.; Vine, S.J. Impact of 2019–2020 Mega-Fires on Australian Fauna Habitat. Nat. Ecol. Evol. 2020, 4, 1321–1326. [Google Scholar] [CrossRef] [PubMed]
- Hyman, I.T.; Ahyong, S.T.; Köhler, F.; McEvey, S.F.; Milledge, G.; Reid, C.A.; Rowley, J.J. Impacts of the 2019–2020 Bushfires on New South Wales Biodiversity: A Rapid Assessment of Distribution Data for Selected Invertebrate Taxa. Tech. Rep. Aust. Mus. Online 2020, 32, 1–17. [Google Scholar] [CrossRef]
- Godfree, R.C.; Knerr, N.; Encinas-Viso, F.; Albrecht, D.; Bush, D.; Cargill, D.C.; Clements, M.; Gueidan, C.; Guja, L.K.; Harwood, T. Implications of the 2019–2020 Megafires for the Biogeography and Conservation of Australian Vegetation. Nat. Commun. 2021, 12, 1–13. [Google Scholar] [CrossRef]
- Clarke, H.; Penman, T.; Boer, M.; Cary, G.J.; Fontaine, J.B.; Price, O.; Bradstock, R. The Proximal Drivers of Large Fires: A Pyrogeographic Study. Front. Earth Sci. 2020, 8, 90. [Google Scholar] [CrossRef] [Green Version]
- Yu, P.; Xu, R.; Abramson, M.J.; Li, S.; Guo, Y. Bushfires in Australia: A Serious Health Emergency under Climate Change. Lancet Planet. Health 2020, 4, e7–e8. [Google Scholar] [CrossRef] [Green Version]
- Hughes, L.; Steffen, W.; Mullins, G.; Dean, A.; Weisbrot, E.; Rice, M. Summer of Crisis. 2020. Available online: https://www.climatecouncil.org.au/wp-content/uploads/2020/03/Crisis-Summer-Report-200311.pdf (accessed on 11 March 2020).
- Van Oldenborgh, G.J.; Krikken, F.; Lewis, S.; Leach, N.J.; Lehner, F.; Saunders, K.R.; van Weele, M.; Haustein, K.; Li, S.; Wallom, D. Attribution of the Australian Bushfire Risk to Anthropogenic Climate Change. Nat. Hazards Earth Syst. Sci. 2021, 21, 941–960. [Google Scholar] [CrossRef]
- Lindenmayer, D.B.; Kooyman, R.M.; Taylor, C.; Ward, M.; Watson, J.E. Recent Australian Wildfires Made Worse by Logging and Associated Forest Management. Nat. Ecol. Evol. 2020, 4, 898–900. [Google Scholar] [CrossRef] [PubMed]
- Adams, M.A.; Shadmanroodposhti, M.; Neumann, M. Causes and Consequences of Eastern Australia’s 2019–20 Season of Mega-fires: A Broader Perspective. Glob. Chang. Biol. 2020, 26, 3756–3758. [Google Scholar] [CrossRef] [PubMed]
- Bradstock, R.A.; Nolan, R.; Collins, L.; Resco de Dios, V.; Clarke, H.; Jenkins, M.E.; Kenny, B.; Boer, M.M. A Broader Perspective on the Causes and Consequences of Eastern Australia’s 2019–20 Season of Mega-Fires: A Response to Adams et al. Glob. Chang. Biol. 2020, 26, e8–e9. [Google Scholar] [CrossRef]
- Bowman, D.M.; Williamson, G.J.; Gibson, R.K.; Bradstock, R.A.; Keenan, R.J. The Severity and Extent of the Australia 2019–20 Eucalyptus Forest Fires Are Not the Legacy of Forest Management. Nat. Ecol. Evol. 2021, 5, 1003–1010. [Google Scholar]
- Schroeder, W.; Prins, E.; Giglio, L.; Csiszar, I.; Schmidt, C.; Morisette, J.; Morton, D. Validation of GOES and MODIS Active Fire Detection Products Using ASTER and ETM+ Data. Remote Sens. Environ. 2008, 112, 2711–2726. [Google Scholar] [CrossRef]
- Miller, J.D.; Thode, A.E. Quantifying Burn Severity in a Heterogeneous Landscape with a Relative Version of the Delta Normalized Burn Ratio (DNBR). Remote Sens. Environ. 2007, 109, 66–80. [Google Scholar] [CrossRef]
- Massetti, A.; Rüdiger, C.; Yebra, M.; Hilton, J. The Vegetation Structure Perpendicular Index (VSPI): A Forest Condition Index for Wildfire Predictions. Remote Sens. Environ. 2019, 224, 167–181. [Google Scholar] [CrossRef]
- Csiszar, I.; Schroeder, W.; Giglio, L.; Ellicott, E.; Vadrevu, K.P.; Justice, C.O.; Wind, B. Active Fires from the Suomi NPP Visible Infrared Imaging Radiometer Suite: Product Status and First Evaluation Results. J. Geophys. Res. Atmos. 2014, 119, 803–816. [Google Scholar] [CrossRef]
- Schroeder, W.; Oliva, P.; Giglio, L.; Csiszar, I.A. The New VIIRS 375 m Active Fire Detection Data Product: Algorithm Description and Initial Assessment. Remote Sens. Environ. 2014, 143, 85–96. [Google Scholar] [CrossRef]
- Veraverbeke, S.; Sedano, F.; Hook, S.J.; Randerson, J.T.; Jin, Y.; Rogers, B.M. Mapping the Daily Progression of Large Wildland Fires Using MODIS Active Fire Data. Int. J. Wildland Fire 2014, 23, 655–667. [Google Scholar] [CrossRef] [Green Version]
- Sá, A.C.; Benali, A.; Fernandes, P.M.; Pinto, R.M.; Trigo, R.M.; Salis, M.; Russo, A.; Jerez, S.; Soares, P.M.; Schroeder, W. Evaluating Fire Growth Simulations Using Satellite Active Fire Data. Remote Sens. Environ. 2017, 190, 302–317. [Google Scholar] [CrossRef] [Green Version]
- Giglio, L.; Schroeder, W.; Justice, C.O. The Collection 6 MODIS Active Fire Detection Algorithm and Fire Products. Remote Sens. Environ. 2016, 178, 31–41. [Google Scholar] [CrossRef] [Green Version]
- Giglio, L.; Boschetti, L.; Roy, D.; Hoffmann, A.A.; Humber, M.; Hall, J.V. Collection 6 Modis Burned Area Product User’s Guide Version 1.0; NASA EOSDIS Land Process; DAAC: Sioux Falls, SD, USA, 2016. [Google Scholar]
- Boschetti, L.; Roy, D.P.; Giglio, L.; Huang, H.; Zubkova, M.; Humber, M.L. Global Validation of the Collection 6 MODIS Burned Area Product. Remote Sens. Environ. 2019, 235, 111490. [Google Scholar] [CrossRef]
- Levin, N.; Levental, S.; Morag, H. The Effect of Wildfires on Vegetation Cover and Dune Activity in Australia’s Desert Dunes: A Multisensor Analysis. Int. J. Wildland Fire 2012, 21, 459–475. [Google Scholar] [CrossRef]
- Cruz, M.G.; Sullivan, A.L.; Gould, J.S.; Sims, N.C.; Bannister, A.J.; Hollis, J.J.; Hurley, R.J. Anatomy of a Catastrophic Wildfire: The Black Saturday Kilmore East Fire in Victoria, Australia. For. Ecol. Manag. 2012, 284, 269–285. [Google Scholar] [CrossRef]
- Dowdy, A.J.; Fromm, M.D.; McCarthy, N. Pyrocumulonimbus Lightning and Fire Ignition on Black Saturday in Southeast Australia. J. Geophys. Res. Atmos. 2017, 122, 7342–7354. [Google Scholar] [CrossRef]
- Andela, N.; Morton, D.C.; Giglio, L.; Paugam, R.; Chen, Y.; Hantson, S.; Van Der Werf, G.R.; Randerson, J.T. The Global Fire Atlas of Individual Fire Size, Duration, Speed and Direction. Earth Syst. Sci. Data 2019, 11, 529–552. [Google Scholar] [CrossRef] [Green Version]
- Kogan, F.N. Operational Space Technology for Global Vegetation Assessment. Bull. Am. Meteorol. Soc. 2001, 82, 1949–1964. [Google Scholar] [CrossRef]
- Yebra, M.; Quan, X.; Riaño, D.; Larraondo, P.R.; van Dijk, A.I.; Cary, G.J. A Fuel Moisture Content and Flammability Monitoring Methodology for Continental Australia Based on Optical Remote Sensing. Remote Sens. Environ. 2018, 212, 260–272. [Google Scholar] [CrossRef]
- Guerschman, J.P.; Hill, M.J.; Renzullo, L.J.; Barrett, D.J.; Marks, A.S.; Botha, E.J. Estimating Fractional Cover of Photosynthetic Vegetation, Non-Photosynthetic Vegetation and Bare Soil in the Australian Tropical Savanna Region Upscaling the EO-1 Hyperion and MODIS Sensors. Remote Sens. Environ. 2009, 113, 928–945. [Google Scholar] [CrossRef]
- Department of Agriculture, Water and the Environment. Australian Google Earth Engine Burnt Area Map, Canberra. 2020. Available online: https://www.environment.gov.au/system/files/pages/a8d10ce5-6a49-4fc2-b94d-575d6d11c547/files/ageebam.pdf (accessed on 27 July 2020).
- Gibson, R.; Danaher, T.; Hehir, W.; Collins, L. A Remote Sensing Approach to Mapping Fire Severity in South-Eastern Australia Using Sentinel 2 and Random Forest. Remote Sens. Environ. 2020, 240, 111702. [Google Scholar] [CrossRef]
- Finkele, K.; Mills, G.A.; Beard, G.; Jones, D.A. National Gridded Drought Factors and Comparison of Two Soil Moisture Deficit Formulations Used in Prediction of Forest Fire Danger Index in Australia. Aust. Meteorol. Mag. 2006, 55, 183–197. [Google Scholar]
- Dowdy, A.J. Climatological Variability of Fire Weather in Australia. J. Appl. Meteorol. Climatol. 2018, 57, 221–234. [Google Scholar] [CrossRef]
- Noble, I.R.; Gill, A.M.; Bary, G.A.V. McArthur’s Fire-danger Meters Expressed as Equations. Aust. J. Ecol. 1980, 5, 201–203. [Google Scholar] [CrossRef]
- Bird, R.B.; Bird, D.W.; Codding, B.F.; Parker, C.H.; Jones, J.H. The “Fire Stick Farming” Hypothesis: Australian Aboriginal Foraging Strategies, Biodiversity, and Anthropogenic Fire Mosaics. Proc. Natl. Acad. Sci. USA 2008, 105, 14796–14801. [Google Scholar] [CrossRef] [Green Version]
- Ansell, J.; Evans, J. Contemporary Aboriginal Savanna Burning Projects in Arnhem Land: A Regional Description and Analysis of the Fire Management Aspirations of Traditional Owners. Int. J. Wildland Fire 2019, 29, 371–385. [Google Scholar] [CrossRef]
- Russell-Smith, J.; Edwards, A.C.; Sangha, K.K.; Yates, C.P.; Gardener, M.R. Challenges for Prescribed Fire Management in Australia’s Fire-Prone Rangelands–the Example of the Northern Territory. Int. J. Wildland Fire 2019, 29, 339–353. [Google Scholar] [CrossRef]
- Preece, N. Aboriginal Fires in Monsoonal Australia from Historical Accounts. J. Biogeogr. 2002, 29, 321–336. [Google Scholar] [CrossRef]
- Royal Commission into National Natural Disaster Arrangements Background Paper: Cultural Burning Practices in Australia. 2020. Available online: https://naturaldisaster.royalcommission.gov.au/publications/background-paper-cultural-burning-practices-australia (accessed on 17 June 2020).
- Penman, T.D.; Christie, F.J.; Andersen, A.N.; Bradstock, R.A.; Cary, G.J.; Henderson, M.K.; Price, O.; Tran, C.; Wardle, G.M.; Williams, R.J. Prescribed Burning: How Can It Work to Conserve the Things We Value? Int. J. Wildland Fire 2011, 20, 721–733. [Google Scholar] [CrossRef]
- Royal Commission into National Natural Disaster Arrangements Background Paper: Land Management—Hazard Reduction: A Literature Review. 2020. Available online: https://apo.org.au/node/306254 (accessed on 17 June 2020).
- Vilar, L.; Camia, A.; San-Miguel-Ayanz, J.; Martín, M.P. Modeling Temporal Changes in Human-Caused Wildfires in Mediterranean Europe Based on Land Use-Land Cover Interfaces. For. Ecol. Manag. 2016, 378, 68–78. [Google Scholar] [CrossRef]
- Guerschman, J.P.; Hill, M.J. Calibration and Validation of the Australian Fractional Cover Product for MODIS Collection 6. Remote Sens. Lett. 2018, 9, 696–705. [Google Scholar] [CrossRef]
- Olson, D.M.; Dinerstein, E. The Global 200: Priority Ecoregions for Global Conservation. Ann. Mo. Bot. Gard. 2002, 89, 199–224. [Google Scholar] [CrossRef]
- Lucas, C. On Developing a Historical Fire Weather Data-Set for Australia. Aust. Meteorol. Oceanogr. J. 2010, 60, 1. [Google Scholar] [CrossRef] [Green Version]
- Jacobson, A.R.; Holzworth, R.; Harlin, J.; Dowden, R.; Lay, E. Performance Assessment of the World Wide Lightning Location Network (WWLLN), Using the Los Alamos Sferic Array (LASA) as Ground Truth. J. Atmos. Ocean. Technol. 2006, 23, 1082–1092. [Google Scholar] [CrossRef]
- Haklay, M. How Good Is Volunteered Geographical Information? A Comparative Study of OpenStreetMap and Ordnance Survey Datasets. Environ. Plan. 2010, 37, 682–703. [Google Scholar] [CrossRef] [Green Version]
- Dobson, J.E.; Bright, E.A.; Coleman, P.R.; Durfee, R.C.; Worley, B.A. LandScan: A Global Population Database for Estimating Populations at Risk. Photogramm. Eng. Remote Sens. 2000, 66, 849–857. [Google Scholar]
- Lymburner, L.; Tan, P.; McIntyre, A.; Thankappan, M.; Sixsmith, J. Dynamic Land Cover Dataset Version 2.1. 2015. Available online: https://researchdata.edu.au/dynamic-land-cover-version-21/1278349 (accessed on 22 May 2020).
- Cade, B.S.; Noon, B.R. A Gentle Introduction to Quantile Regression for Ecologists. Front. Ecol. Environ. 2003, 1, 412–420. [Google Scholar] [CrossRef]
- Ager, A.A.; Preisler, H.K.; Arca, B.; Spano, D.; Salis, M. Wildfire Risk Estimation in the Mediterranean Area. Environmetrics 2014, 25, 384–396. [Google Scholar] [CrossRef]
- Moreira, F.; Catry, F.X.; Rego, F.; Bacao, F. Size-Dependent Pattern of Wildfire Ignitions in Portugal: When Do Ignitions Turn into Big Fires? Landsc. Ecol. 2010, 25, 1405–1417. [Google Scholar] [CrossRef] [Green Version]
- Ramos-Neto, M.B.; Pivello, V.R. Lightning Fires in a Brazilian Savanna National Park: Rethinking Management Strategies. Environ. Manag. 2000, 26, 675–684. [Google Scholar] [CrossRef] [PubMed]
- Minnich, R.A. Fire Mosaics in Southern California and Northern Baja California. Science 1983, 219, 1287–1294. [Google Scholar] [CrossRef] [PubMed] [Green Version]
- Viegas, D.X.; Viegas, M.T. A Relationship between Rainfall and Burned Area for Portugal. Int. J. Wildland Fire 1994, 4, 11–16. [Google Scholar] [CrossRef]
- Blackmarr, W.H. Moisture Content Influences Ignitability of Slash Pine Litter; Res. Note SE-173; Department of Agriculture, Forest Service, Southeastern Forest Experiment Station: Asheville, NC, USA, 1972. [Google Scholar]
- Plucinski, M.P.; Anderson, W.R. Laboratory Determination of Factors Influencing Successful Point Ignition in the Litter Layer of Shrubland Vegetation. Int. J. Wildland Fire 2008, 17, 628–637. [Google Scholar] [CrossRef]
- Cawson, J.G.; Duff, T.J. Forest Fuel Bed Ignitability under Marginal Fire Weather Conditions in Eucalyptus Forests. Int. J. Wildland Fire 2019, 28, 198–204. [Google Scholar] [CrossRef] [Green Version]
- Levin, N.; Saaroni, H. Fire Weather in Israel—Synoptic Climatological Analysis. GeoJournal 1999, 47, 523–538. [Google Scholar] [CrossRef]
- Verhoeven, E.M.; Murray, B.R.; Dickman, C.R.; Wardle, G.M.; Greenville, A.C. Fire and Rain Are One: Extreme Rainfall Events Predict Wildfire Extent in an Arid Grassland. Int. J. Wildland Fire 2020, 29, 702–711. [Google Scholar] [CrossRef]
- McCaw, W.L.; Gould, J.S.; Cheney, N.P.; Ellis, P.F.; Anderson, W.R. Changes in Behaviour of Fire in Dry Eucalypt Forest as Fuel Increases with Age. For. Ecol. Manag. 2012, 271, 170–181. [Google Scholar] [CrossRef]
- Moritz, M.A.; Batllori, E.; Bradstock, R.A.; Gill, A.M.; Handmer, J.; Hessburg, P.F.; Leonard, J.; McCaffrey, S.; Odion, D.C.; Schoennagel, T. Learning to Coexist with Wildfire. Nature 2014, 515, 58–66. [Google Scholar] [CrossRef]
- Miller, C.; Plucinski, M.; Sullivan, A.; Stephenson, A.; Huston, C.; Charman, K.; Prakash, M.; Dunstall, S. Electrically Caused Wildfires in Victoria, Australia Are over-Represented When Fire Danger Is Elevated. Landsc. Urban Plan. 2017, 167, 267–274. [Google Scholar] [CrossRef]
- Plucinski, M.P.; McCaw, W.L.; Gould, J.S.; Wotton, B.M. Predicting the Number of Daily Human-Caused Bushfires to Assist Suppression Planning in South-West Western Australia. Int. J. Wildland Fire 2014, 23, 520–531. [Google Scholar] [CrossRef]
- Collins, K.M.; Price, O.F.; Penman, T.D. Spatial Patterns of Wildfire Ignitions in South-Eastern Australia. Int. J. Wildland Fire 2015, 24, 1098–1108. [Google Scholar] [CrossRef]
- Collins, K.M.; Penman, T.D.; Price, O.F. Some Wildfire Ignition Causes Pose More Risk of Destroying Houses than Others. PLoS ONE 2016, 11, e0162083. [Google Scholar] [CrossRef] [PubMed]
- Sharples, J.J.; Lewis, S.C.; Perkins-Kirkpatrick, S.E. Modulating Influence of Drought on the Synergy between Heatwaves and Dead Fine Fuel Moisture Content of Bushfire Fuels in the Southeast Australian Region. Weather Clim. Extrem. 2021, 31, 100300. [Google Scholar]
- Fox-Hughes, P.; Yebra, M.; Kumar, V.; Dowdy, A.; Hope, P.; Peace, M.; Narsey, S.; Delage, F.; Zhang, H. Soil and Fuel Moisture Precursors of Fire Activity during the 2019-20 Fire Season, in Comparison to Previous Seasons. 2021. Available online: https://www.bnhcrc.com.au/research/understanding-and-mitigating-hazards/7928 (accessed on 1 September 2021).
- De Dios, V.R.; Hedo, J.; Camprubí, À.C.; Thapa, P.; Del Castillo, E.M.; de Aragón, J.M.; Bonet, J.A.; Balaguer-Romano, R.; Díaz-Sierra, R.; Yebra, M. Climate Change Induced Declines in Fuel Moisture May Turn Currently Fire-Free Pyrenean Mountain Forests into Fire-Prone Ecosystems. Sci. Total Environ. 2021, 797, 149104. [Google Scholar] [CrossRef]
- Clarke, H.; Gibson, R.; Cirulis, B.; Bradstock, R.A.; Penman, T.D. Developing and Testing Models of the Drivers of Anthropogenic and Lightning-Caused Wildfire Ignitions in South-Eastern Australia. J. Environ. Manag. 2019, 235, 34–41. [Google Scholar] [CrossRef] [PubMed]
- Xu, W.; Wooster, M.J.; Kaneko, T.; He, J.; Zhang, T.; Fisher, D. Major Advances in Geostationary Fire Radiative Power (FRP) Retrieval over Asia and Australia Stemming from Use of Himarawi-8 AHI. Remote Sens. Environ. 2017, 193, 138–149. [Google Scholar] [CrossRef] [Green Version]
- Owens, D.; O’Kane, M. Final Report of the NSW Bushfire Inquiry. 2020. Available online: https://apo.org.au/node/307786 (accessed on 2 September 2020).
- Storey, M.A.; Price, O.F.; Sharples, J.J.; Bradstock, R.A. Drivers of Long-Distance Spotting during Wildfires in South-Eastern Australia. Int. J. Wildland Fire 2020, 29, 459–472. [Google Scholar] [CrossRef]
- Teague, B.; McLeod, R.; Pascoe, S. Final Report, 2009 Victorian Bushfires Royal Commission; Parliament of Victoria: Melbourne, Australia, 2010. [Google Scholar]
- Kogan, F.N. Global Drought Watch from Space. Bull. Am. Meteorol. Soc. 1997, 78, 621–636. [Google Scholar] [CrossRef]
- Li, J.; Roy, D.P. A Global Analysis of Sentinel-2A, Sentinel-2B and Landsat-8 Data Revisit Intervals and Implications for Terrestrial Monitoring. Remote Sens. 2017, 9, 902. [Google Scholar] [CrossRef] [Green Version]
- Claverie, M.; Ju, J.; Masek, J.G.; Dungan, J.L.; Vermote, E.F.; Roger, J.-C.; Skakun, S.V.; Justice, C. The Harmonized Landsat and Sentinel-2 Surface Reflectance Data Set. Remote Sens. Environ. 2018, 219, 145–161. [Google Scholar] [CrossRef]
- Mouillot, F.; Schultz, M.G.; Yue, C.; Cadule, P.; Tansey, K.; Ciais, P.; Chuvieco, E. Ten Years of Global Burned Area Products from Spaceborne Remote Sensing—A Review: Analysis of User Needs and Recommendations for Future Developments. Int. J. Appl. Earth Obs. Geoinf. 2014, 26, 64–79. [Google Scholar] [CrossRef] [Green Version]
- Hawbaker, T.J.; Vanderhoof, M.K.; Schmidt, G.L.; Beal, Y.-J.; Picotte, J.J.; Takacs, J.D.; Falgout, J.T.; Dwyer, J.L. The Landsat Burned Area Algorithm and Products for the Conterminous United States. Remote Sens. Environ. 2020, 244, 111801. [Google Scholar] [CrossRef]
- Lizundia-Loiola, J.; Otón, G.; Ramo, R.; Chuvieco, E. A Spatio-Temporal Active-Fire Clustering Approach for Global Burned Area Mapping at 250 m from MODIS Data. Remote Sens. Environ. 2020, 236, 111493. [Google Scholar] [CrossRef]
- Fisher, R.; Edwards, A.C. Fire Extent and Mapping: Procedures, Validation and Website Application; Carbon Accounting and Savanna Fire Management; Murphy, B.P., Edwards, A.C., Meyer, C.P., Russell-Smith, J., Eds.; CSIRO Publishing: Melbourne, Australia, 2015; pp. 57–72. [Google Scholar]
- Goodwin, N.R.; Collett, L.J. Development of an Automated Method for Mapping Fire History Captured in Landsat TM and ETM+ Time Series across Queensland, Australia. Remote Sens. Environ. 2014, 148, 206–221. [Google Scholar] [CrossRef]
- Andela, N.; Kaiser, J.W.; Van der Werf, G.R.; Wooster, M.J. New Fire Diurnal Cycle Characterizations to Improve Fire Radiative Energy Assessments Made from MODIS Observations. Atmos. Chem. Phys. 2015, 15, 8831–8846. [Google Scholar] [CrossRef] [Green Version]
- Xu, G.; Zhong, X. Real-Time Wildfire Detection and Tracking in Australia Using Geostationary Satellite: Himawari-8. Remote Sens. Lett. 2017, 8, 1052–1061. [Google Scholar] [CrossRef]
- Liu, X.; He, B.; Quan, X.; Yebra, M.; Qiu, S.; Yin, C.; Liao, Z.; Zhang, H. Near Real-Time Extracting Wildfire Spread Rate from Himawari-8 Satellite Data. Remote Sens. 2018, 10, 1654. [Google Scholar] [CrossRef] [Green Version]
- Hally, B.; Wallace, L.; Reinke, K.; Jones, S.; Skidmore, A. Advances in Active Fire Detection Using a Multi-Temporal Method for next-Generation Geostationary Satellite Data. Int. J. Digit. Earth 2019, 12, 1030–1045. [Google Scholar] [CrossRef]
- Clarke, H.G.; Smith, P.L.; Pitman, A.J. Regional Signatures of Future Fire Weather over Eastern Australia from Global Climate Models. Int. J. Wildland Fire 2011, 20, 550–562. [Google Scholar] [CrossRef]
- Lucas, C.; Hennessy, K.; Mills, G.; Bathols, J. Bushfire Weather in Southeast Australia: Recent Trends and Projected Climate Change Impacts; Bushfire Cooperative Research Centre, Australian Bureau of Meteorology and CSIRO Marine and Atmospheric Research: Melbourne, Australia, 2007. [Google Scholar]
- Abram, N.J.; Hargreaves, J.A.; Wright, N.M.; Thirumalai, K.; Ummenhofer, C.C.; England, M.H. Palaeoclimate Perspectives on the Indian Ocean Dipole. Quat. Sci. Rev. 2020, 237, 106302. [Google Scholar] [CrossRef]
- Moritz, M.A.; Parisien, M.-A.; Batllori, E.; Krawchuk, M.A.; Van Dorn, J.; Ganz, D.J.; Hayhoe, K. Climate Change and Disruptions to Global Fire Activity. Ecosphere 2012, 3, 1–22. [Google Scholar] [CrossRef]
- Andela, N.; Morton, D.C.; Giglio, L.; Chen, Y.; van der Werf, G.R.; Kasibhatla, P.S.; DeFries, R.S.; Collatz, G.J.; Hantson, S.; Kloster, S. A Human-Driven Decline in Global Burned Area. Science 2017, 356, 1356–1362. [Google Scholar] [CrossRef] [PubMed] [Green Version]
- Black, A.E.; Hayes, P.; Strickland, R. Organizational Learning from Prescribed Fire Escapes: A Review of Developments over the Last 10 Years in the USA and Australia. Curr. For. Rep. 2020, 6, 41–59. [Google Scholar] [CrossRef]
- Clark, M. The Australian Space Agency. J. Proc. R. Soc. N. S. Wales 2020, 153, 58–60. [Google Scholar]
Figure 1.
(a) Map of wildfires included in this study (Black Summer fires: Sep 2019 to mid-Feb 2020) classified by forest and not-forest based on their tree cover (below or above 40%, based on Australia’s national tree cover layer; Table 1). The map also shows the seven major biomes of Australia, based on the World Wildlife Foundation (WWF) classification of terrestrial ecosystems. Subset (b) focuses on many of the forest fires in SE Australia, with wildfires greater than 100 km2 outlined by polygons. The approximate starting (ignition) point of all large fires is shown by a red dot. The burn date colours signify the date in which a certain area was burnt (based on VIIRS and MODIS), with the burn date representing the number of days since 1 January 2019 for the Black Summer fires.

Figure 2.
The steps in creating the wildfire polygons, showing Karta Pintingga/Kangaroo Island fires as an example. VIIRS active fires points (a) provide accurate date and time of active fires. However, many burnt areas (shown in brown in the false colour composite of the Landsat 8 image (10 February 2020)) (a) are often missing, probably due to cloud cover (a). The MODIS burnt area product, which includes the burnt date per pixel (at 500 m resolution), provides better spatial coverage of burnt areas (b). The segmentation polygons were visually assessed and joined into individual wildfires based on the burn date and spatial continuity of the wildfires (b). The false colour composite of the Planet Labs imagery (31 December 2019) shows the Kangaroo Island fire a few hours after it had started from lightning strikes (c). The burn date and the day of the year are counted from 1 January 2019 and, thus, day of year greater than 365 refers to fires that burnt at the beginning of 2020.

Figure 3.
Two of the response variables of the wildfires included in this study: burnt area, and days the fires burned. Each point represents a single wildfire; the wildfires of the Black Summer are classified into forest and non-forest based on their pre-fire tree cover: above 40% (forest) and below 40% (not-forest).

Figure 4.
Monthly numbers of MODIS-detected active fires between January 2001 and January 2020, classified by WWF biome (a); monthly anomalies of MODIS-detected active fires, classified by WWF biome (compared with the average monthly number between 2001 and 2018 (b); the figure only includes the three biomes where, overall, most fires in Australia occur). The labels on the x-axis stand for the month of January in the years 2001 to 2020.


Figure 5.
Time series of some of the explanatory and response variables included in this study, averaged over the areas of three Black Summer fires: (a) the largest forest fire in Australia’s Black Summer (in east Gippsland, Victoria, Fire ID 25 in our dataset; 9933 km2); (b) the largest non-forest fire in Australia’s Black Summer (in the eastern Kimberley, Western Australia, Fire ID 344 in our dataset; 5134 km2); (c) a fire in the north of Kangaroo Island, South Australia (Fire ID 1 in our dataset; 170 km2). All variables shown in this figure were normalised between their respective minimum and maximum values to ease the comparison. The acronyms used in the figure are FRP (fire radiative power), FDI (fire danger index), LFMC (live fuel moisture content), VHI (vegetation health index), PV (photosynthetic vegetation), and NPV (non-photosynthetic vegetation) (Table 1 and Table 2).


Figure 6.
The correspondence between FRP and fire rate of spread (area burnt per day) for all fires in this study. The grey trend line is for all 391 fires; the black trend line is for the 63 forest fires in SE Australia.
Figure 6.
The correspondence between FRP and fire rate of spread (area burnt per day) for all fires in this study. The grey trend line is for all 391 fires; the black trend line is for the 63 forest fires in SE Australia.

Figure 7.
Spearman correlation coefficients between all explanatory variables and the 10 response variables for: (a) the Black Summer forest fires in SE Australia (n = 63, except for NSW FESM severity index, where n = 45); (b) the Black Summer forest fires (n = 205); (c) the Black Summer non-forest fires (n = 186). The colour of the bars indicates the response variable. Only statistically significant correlations are shown.

Figure 8.
The number of explanatory variables with statistically significant Spearman correlation coefficients (R2 > 0.2) with the response variables for Black Summer non-forest fires (n = 186), Black Summer forest fires (n = 205) and Black Summer forest fires in SE Australia (n = 63). The variables are summarised here based on the response variables.

Figure 9.
The percentage of explanatory variables (classified into anthropogenic, vegetation or climatic variables) with statistically significant Spearman correlation coefficients (R2 > 0.2) across the eight response variables for Black Summer non-forest fires (n = 186), Black Summer forest fires (n = 205) and Black Summer forest fires in SE Australia (n = 63).

Figure 10.
The standardised coefficients of the explanatory variables that were found to be statistically significant in the stepwise regression models for all response variables for (a) the Black Summer forest fires in SE Australia (n = 63); (b) the Black Summer forest fires (n = 205); (c) the Black Summer non-forest fires (n = 186). The models shown in this figure were calculated based on the untransformed variables. The adjusted R2 values of each of the stepwise models are shown in the legend. The colour of the bars indicates the response variable. Only statistically significant coefficients are shown.

Figure 11.
The standardised coefficients of the explanatory variables that were found to be statistically significant in the stepwise regression models for all response variables for (a) the Black Summer forest fires in SE Australia (n = 63); (b) the Black Summer forest fires (n = 205); (c) the Black Summer non-forest fires (n = 186). The models shown in this figure were calculated based on the transformed variables. The adjusted R2 values of each of the stepwise models are shown in the legend. The colour of the bars indicates the response variable. Only statistically significant coefficients are shown.

Figure 12.
Adjusted R2 values of the stepwise regression models for the Black Summer fires. Models were run for all response variables, the non-forest fires (n = 186), the forest fires (n = 205) and the forest fires in SE Australia (n = 63).
Figure 12.
Adjusted R2 values of the stepwise regression models for the Black Summer fires. Models were run for all response variables, the non-forest fires (n = 186), the forest fires (n = 205) and the forest fires in SE Australia (n = 63).

Figure 13.
The percentage of explanatory variables (classified into anthropogenic, vegetation or climatic variables) entered into the stepwise regression models across all response variables for Black Summer non-forest fires (n = 186), Black Summer forest fires (n = 205) and Black Summer forest fires in SE Australia (n = 63).


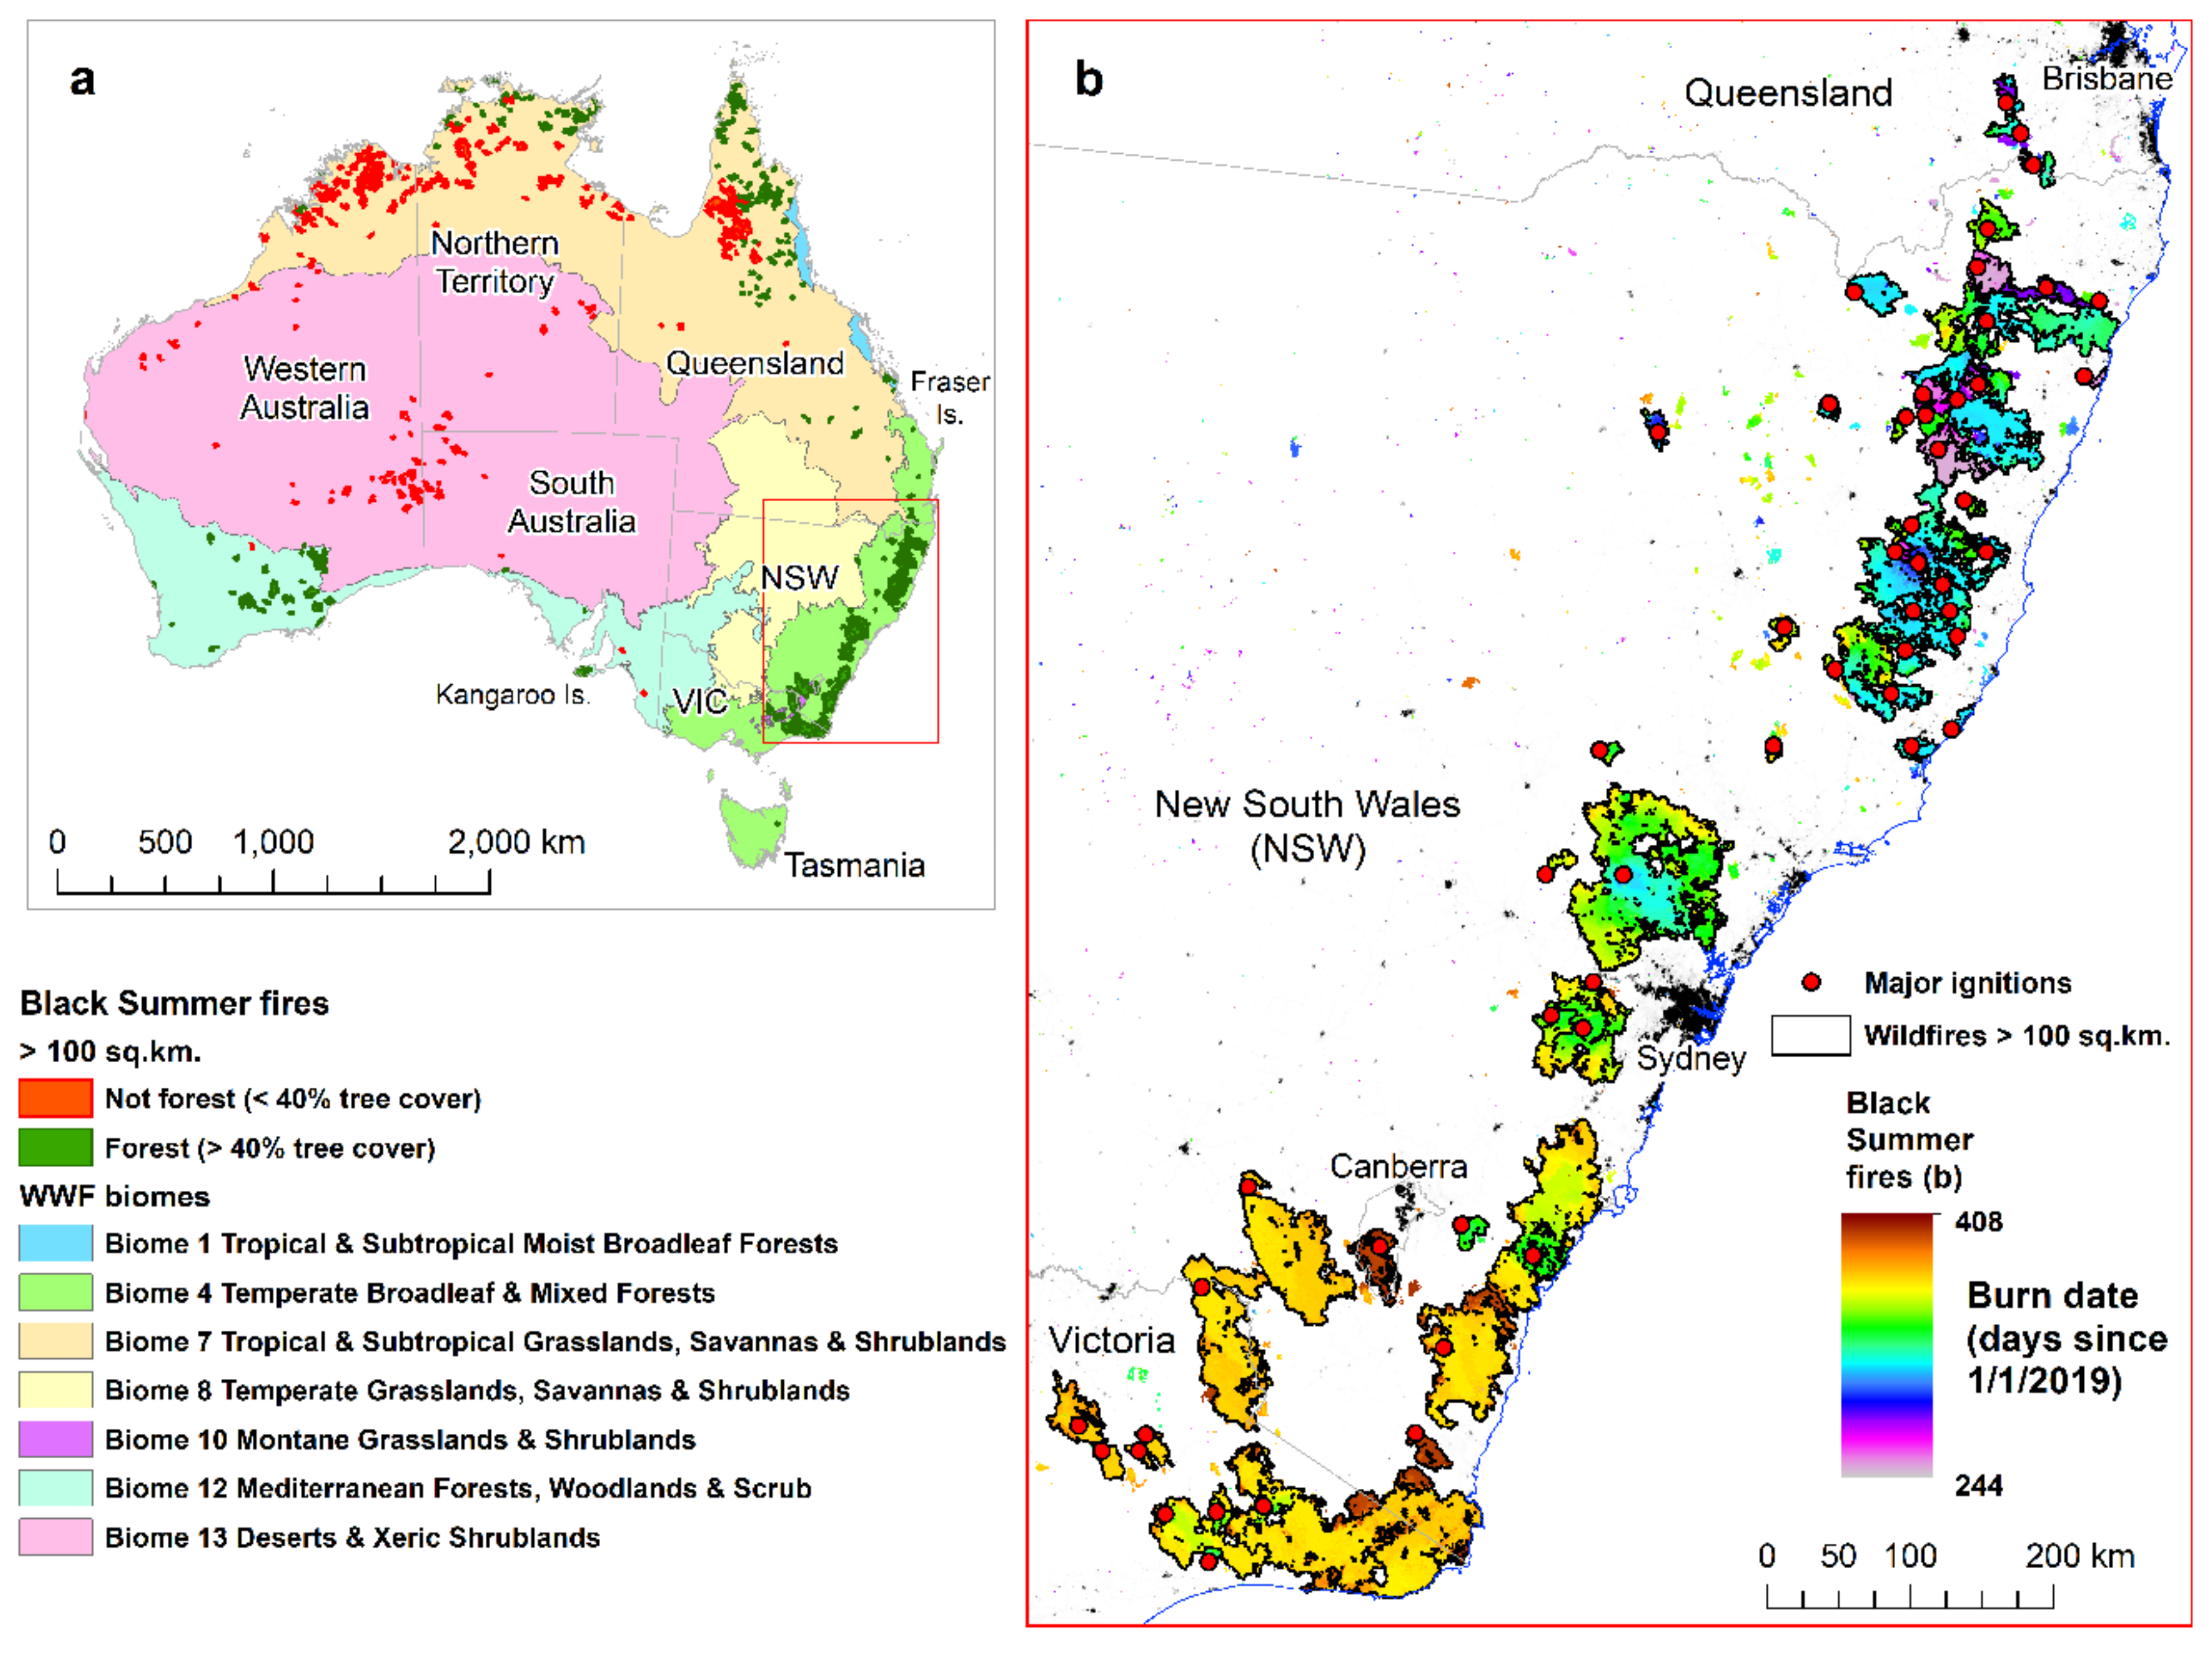
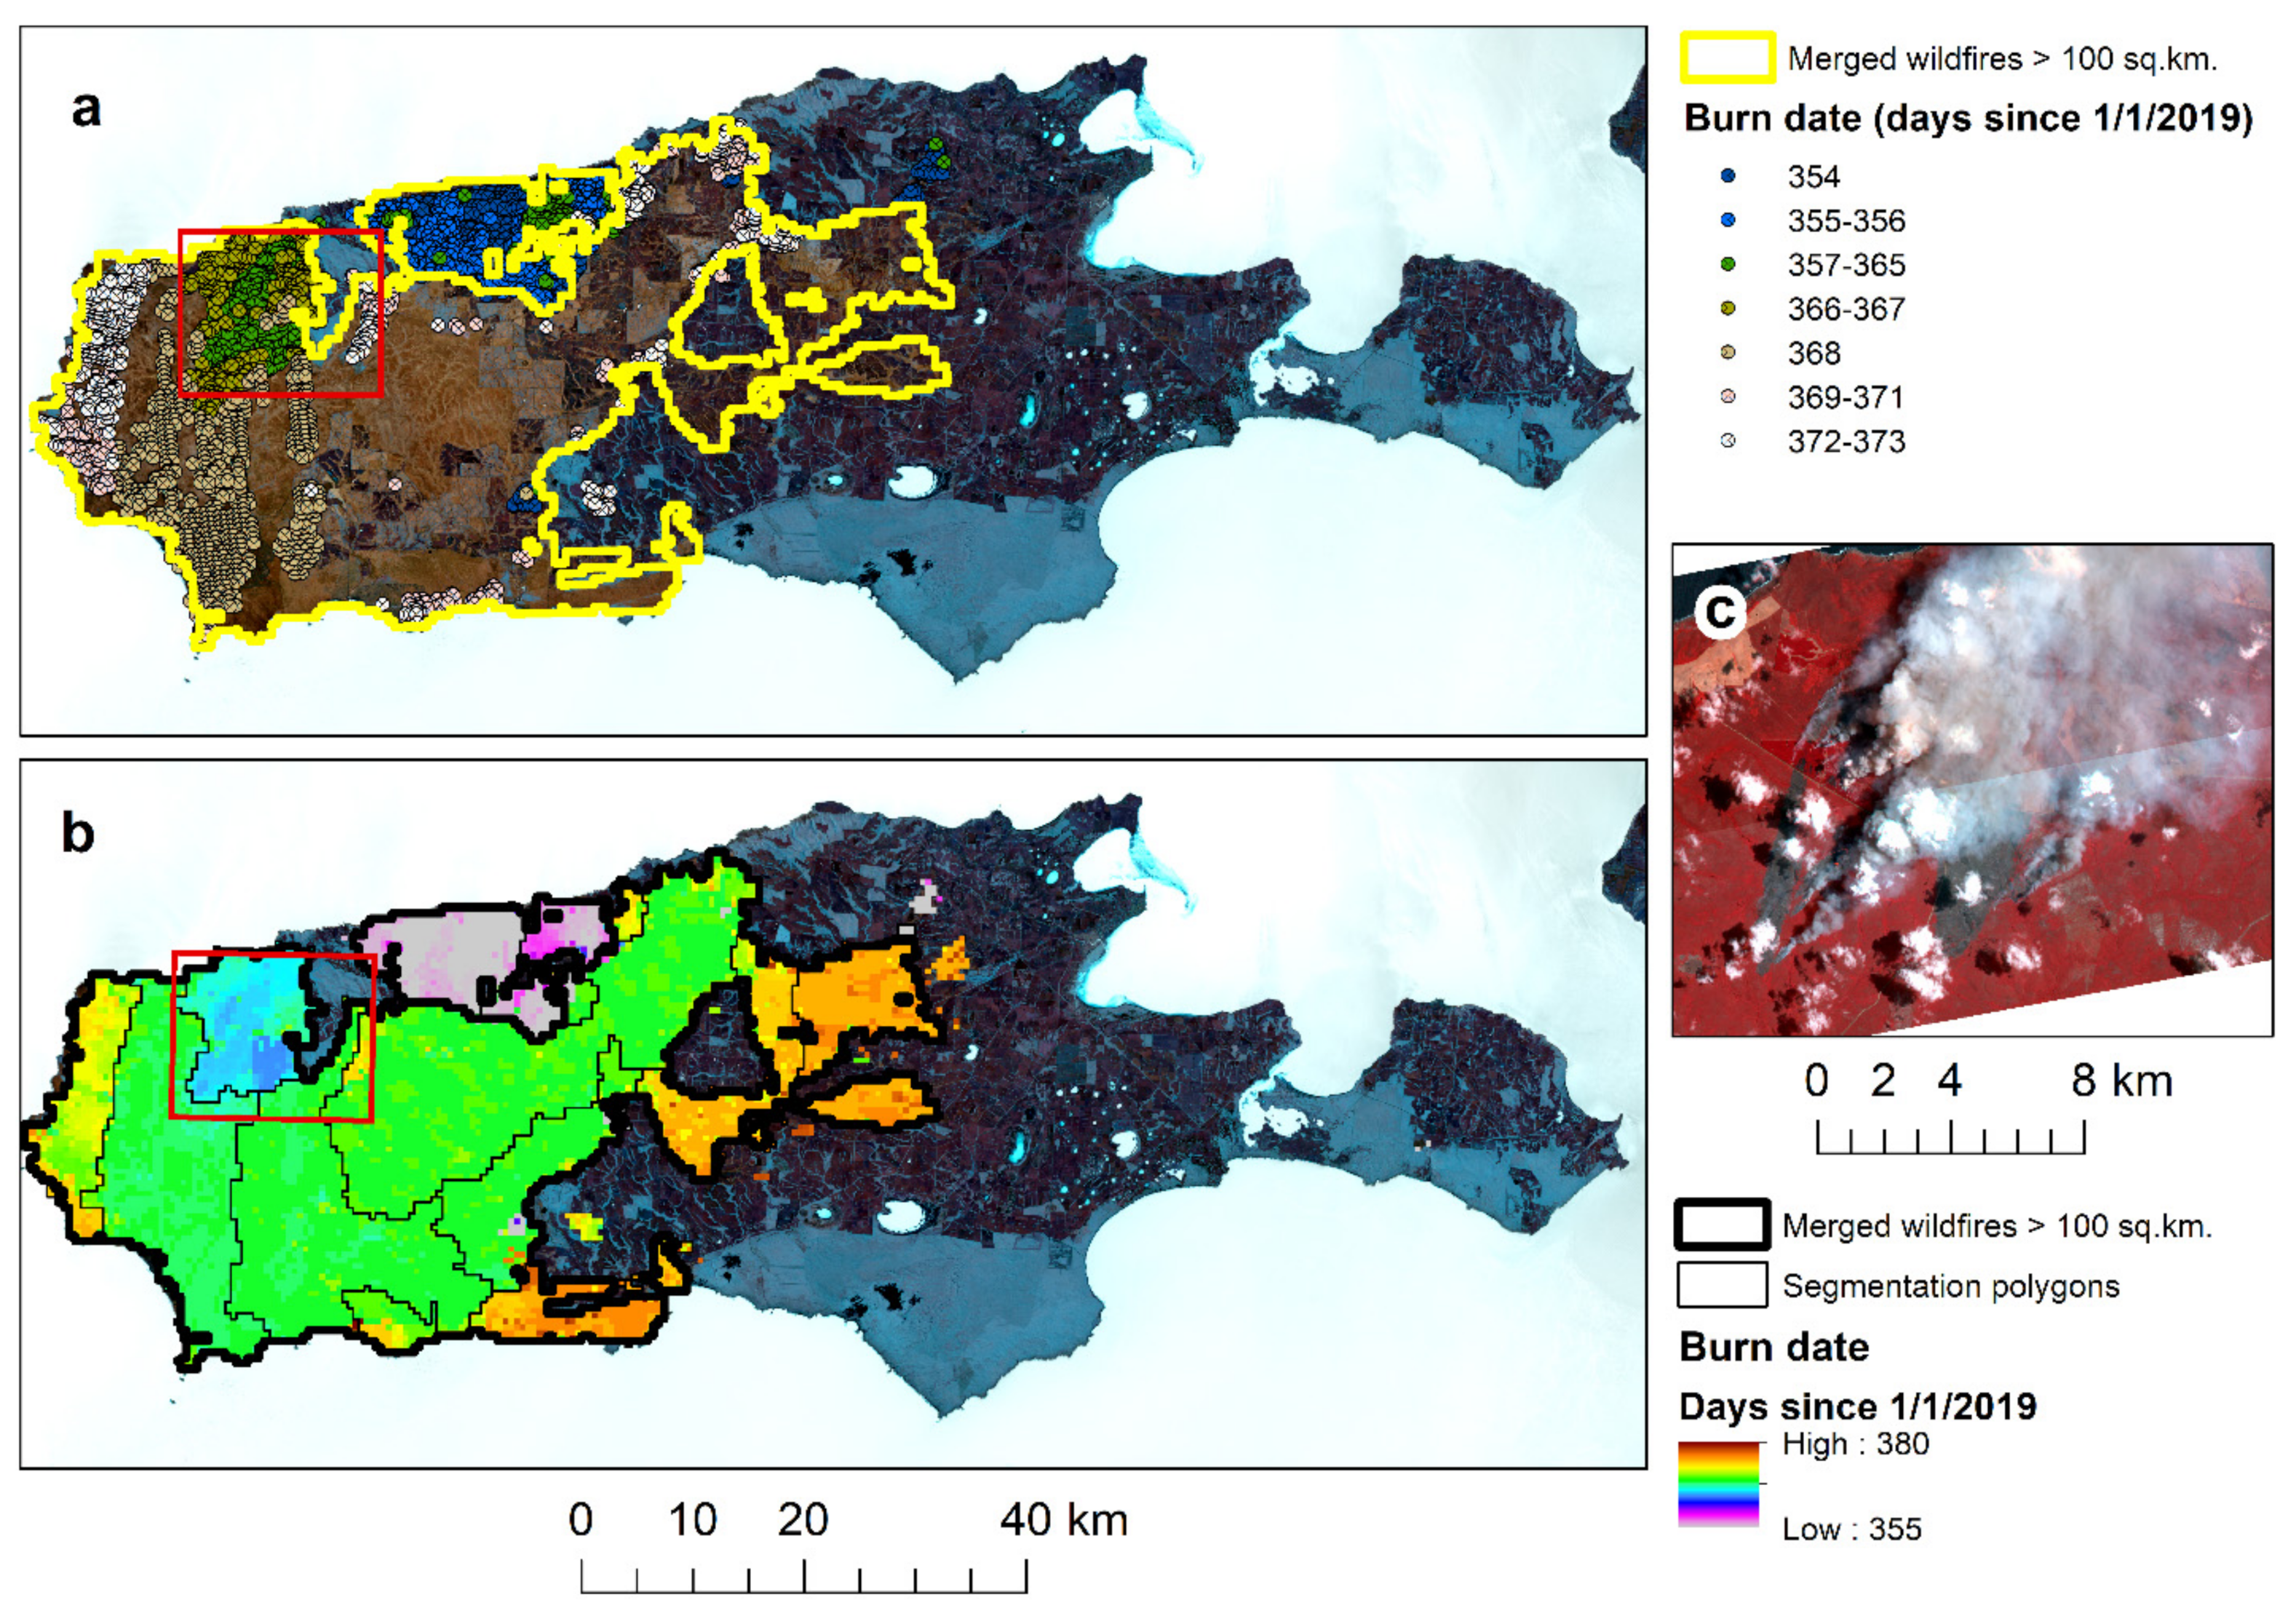
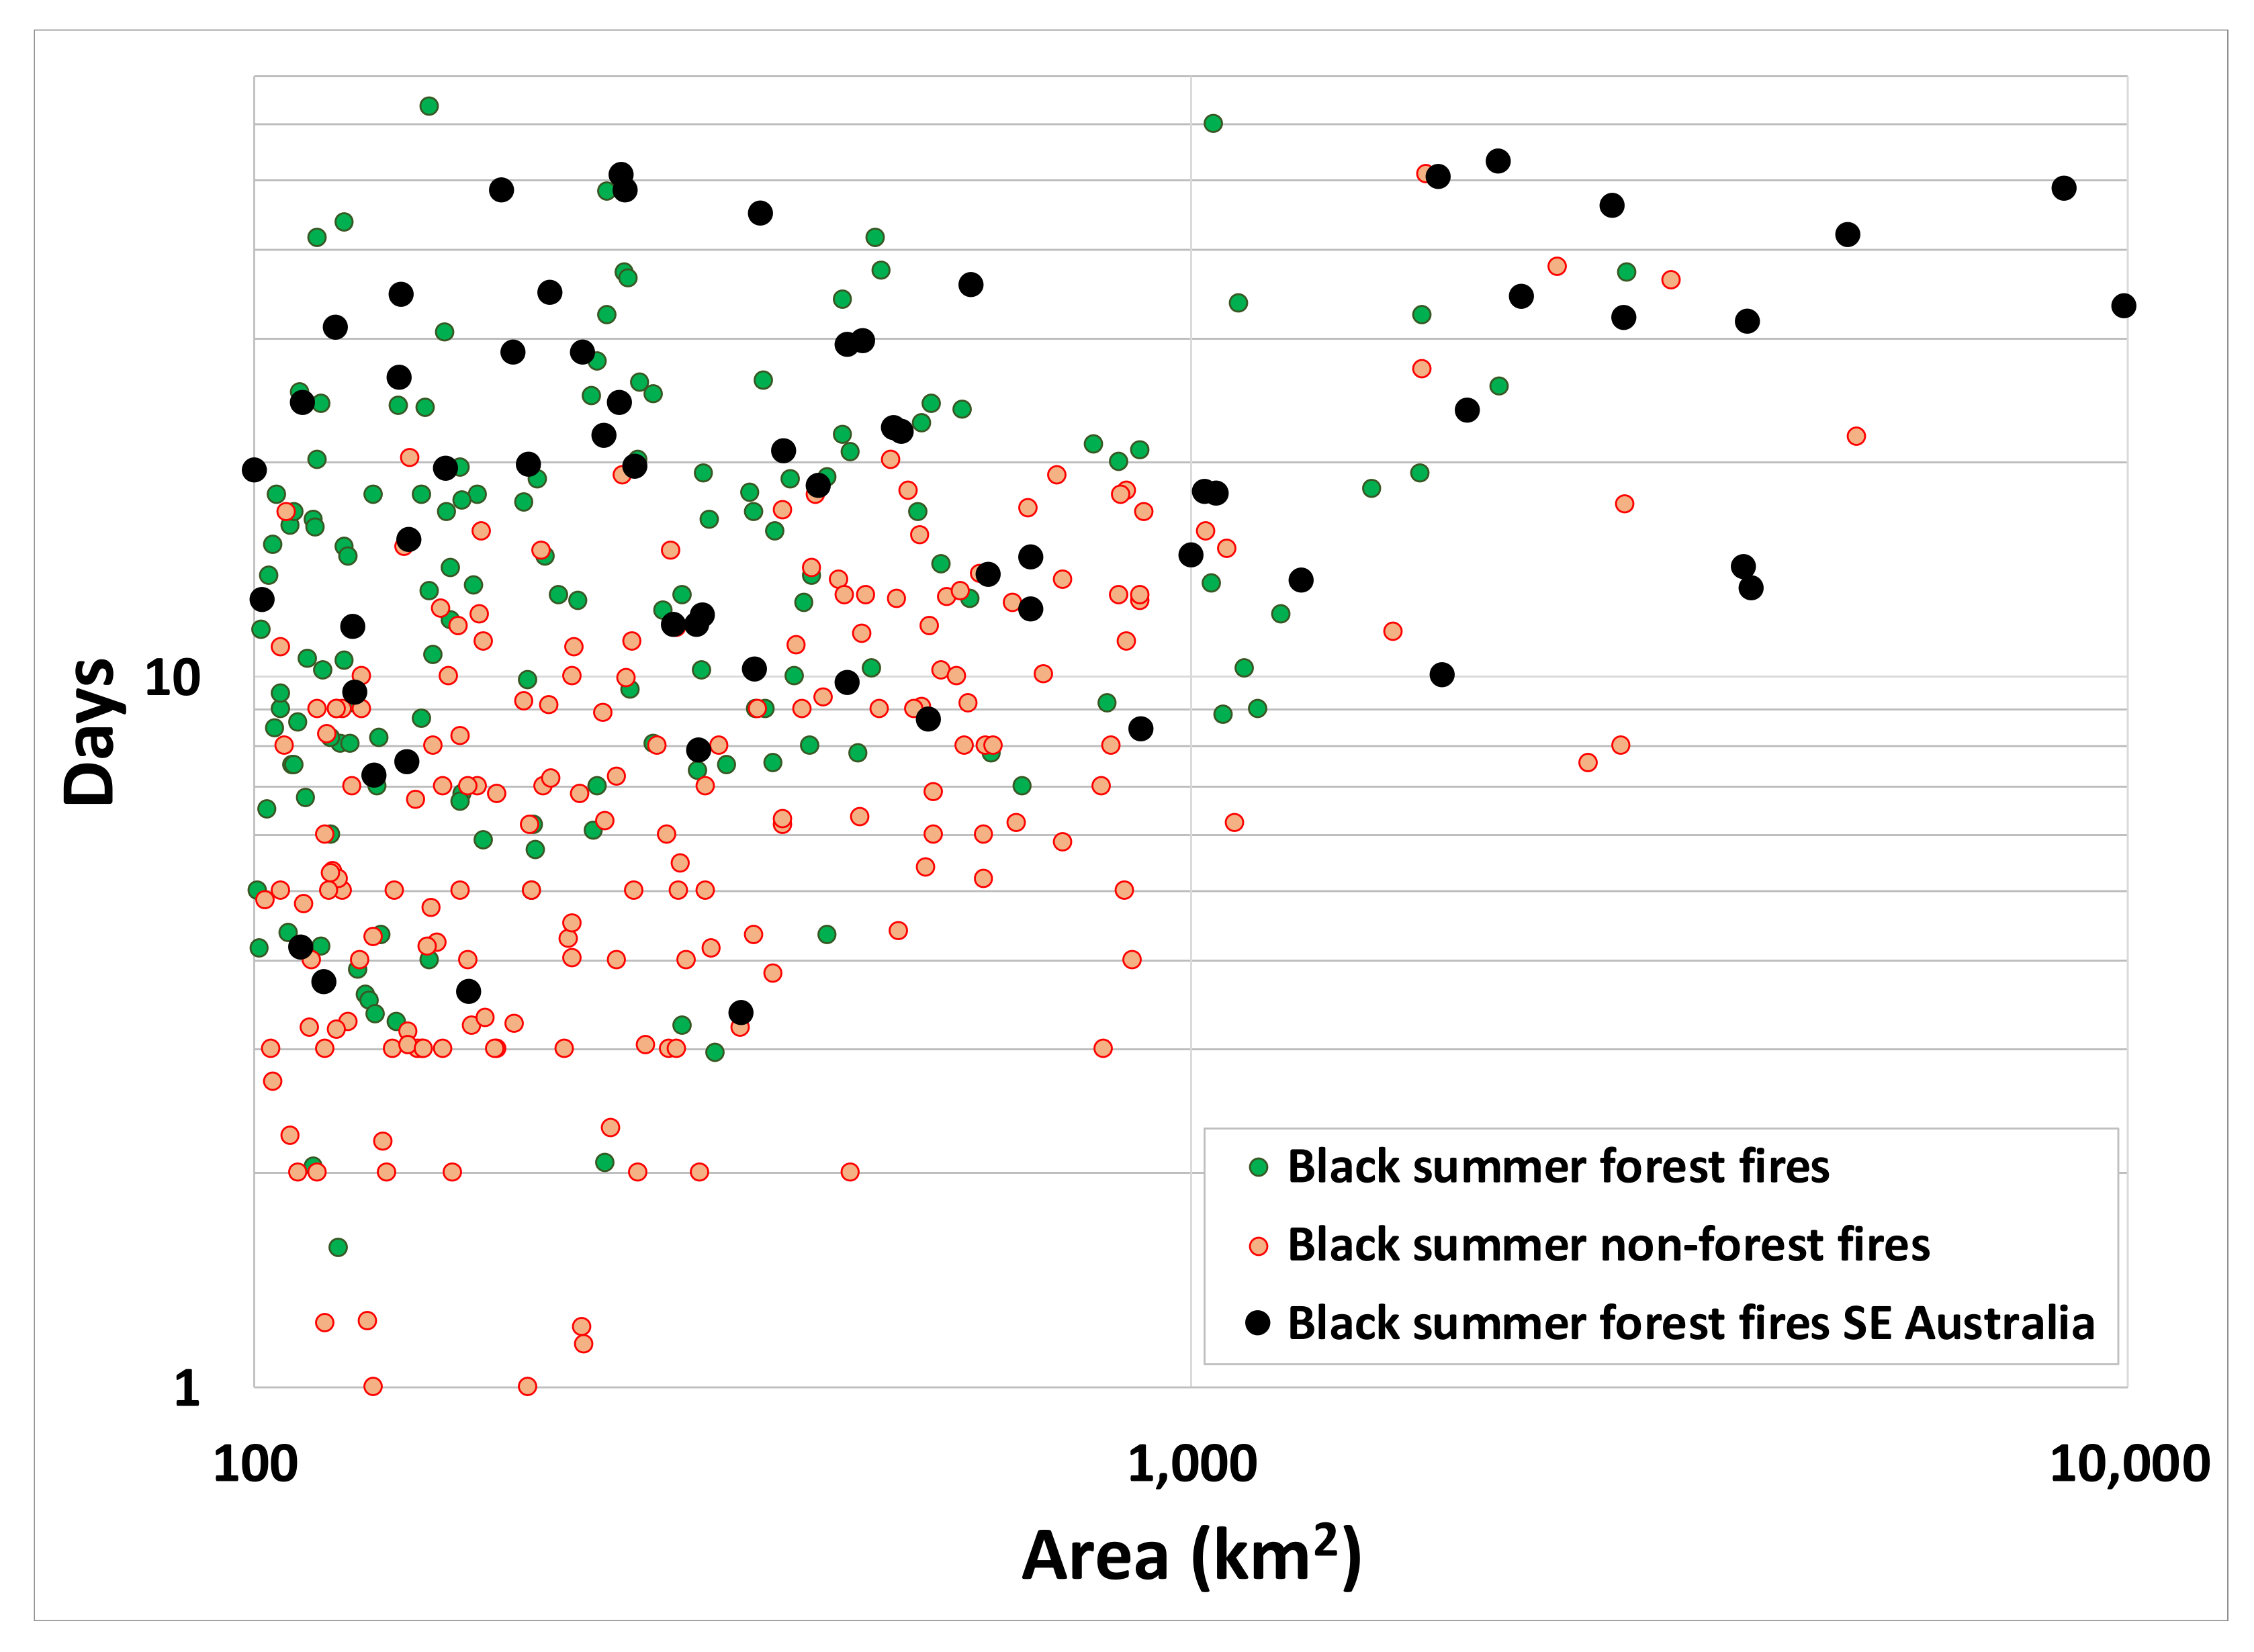
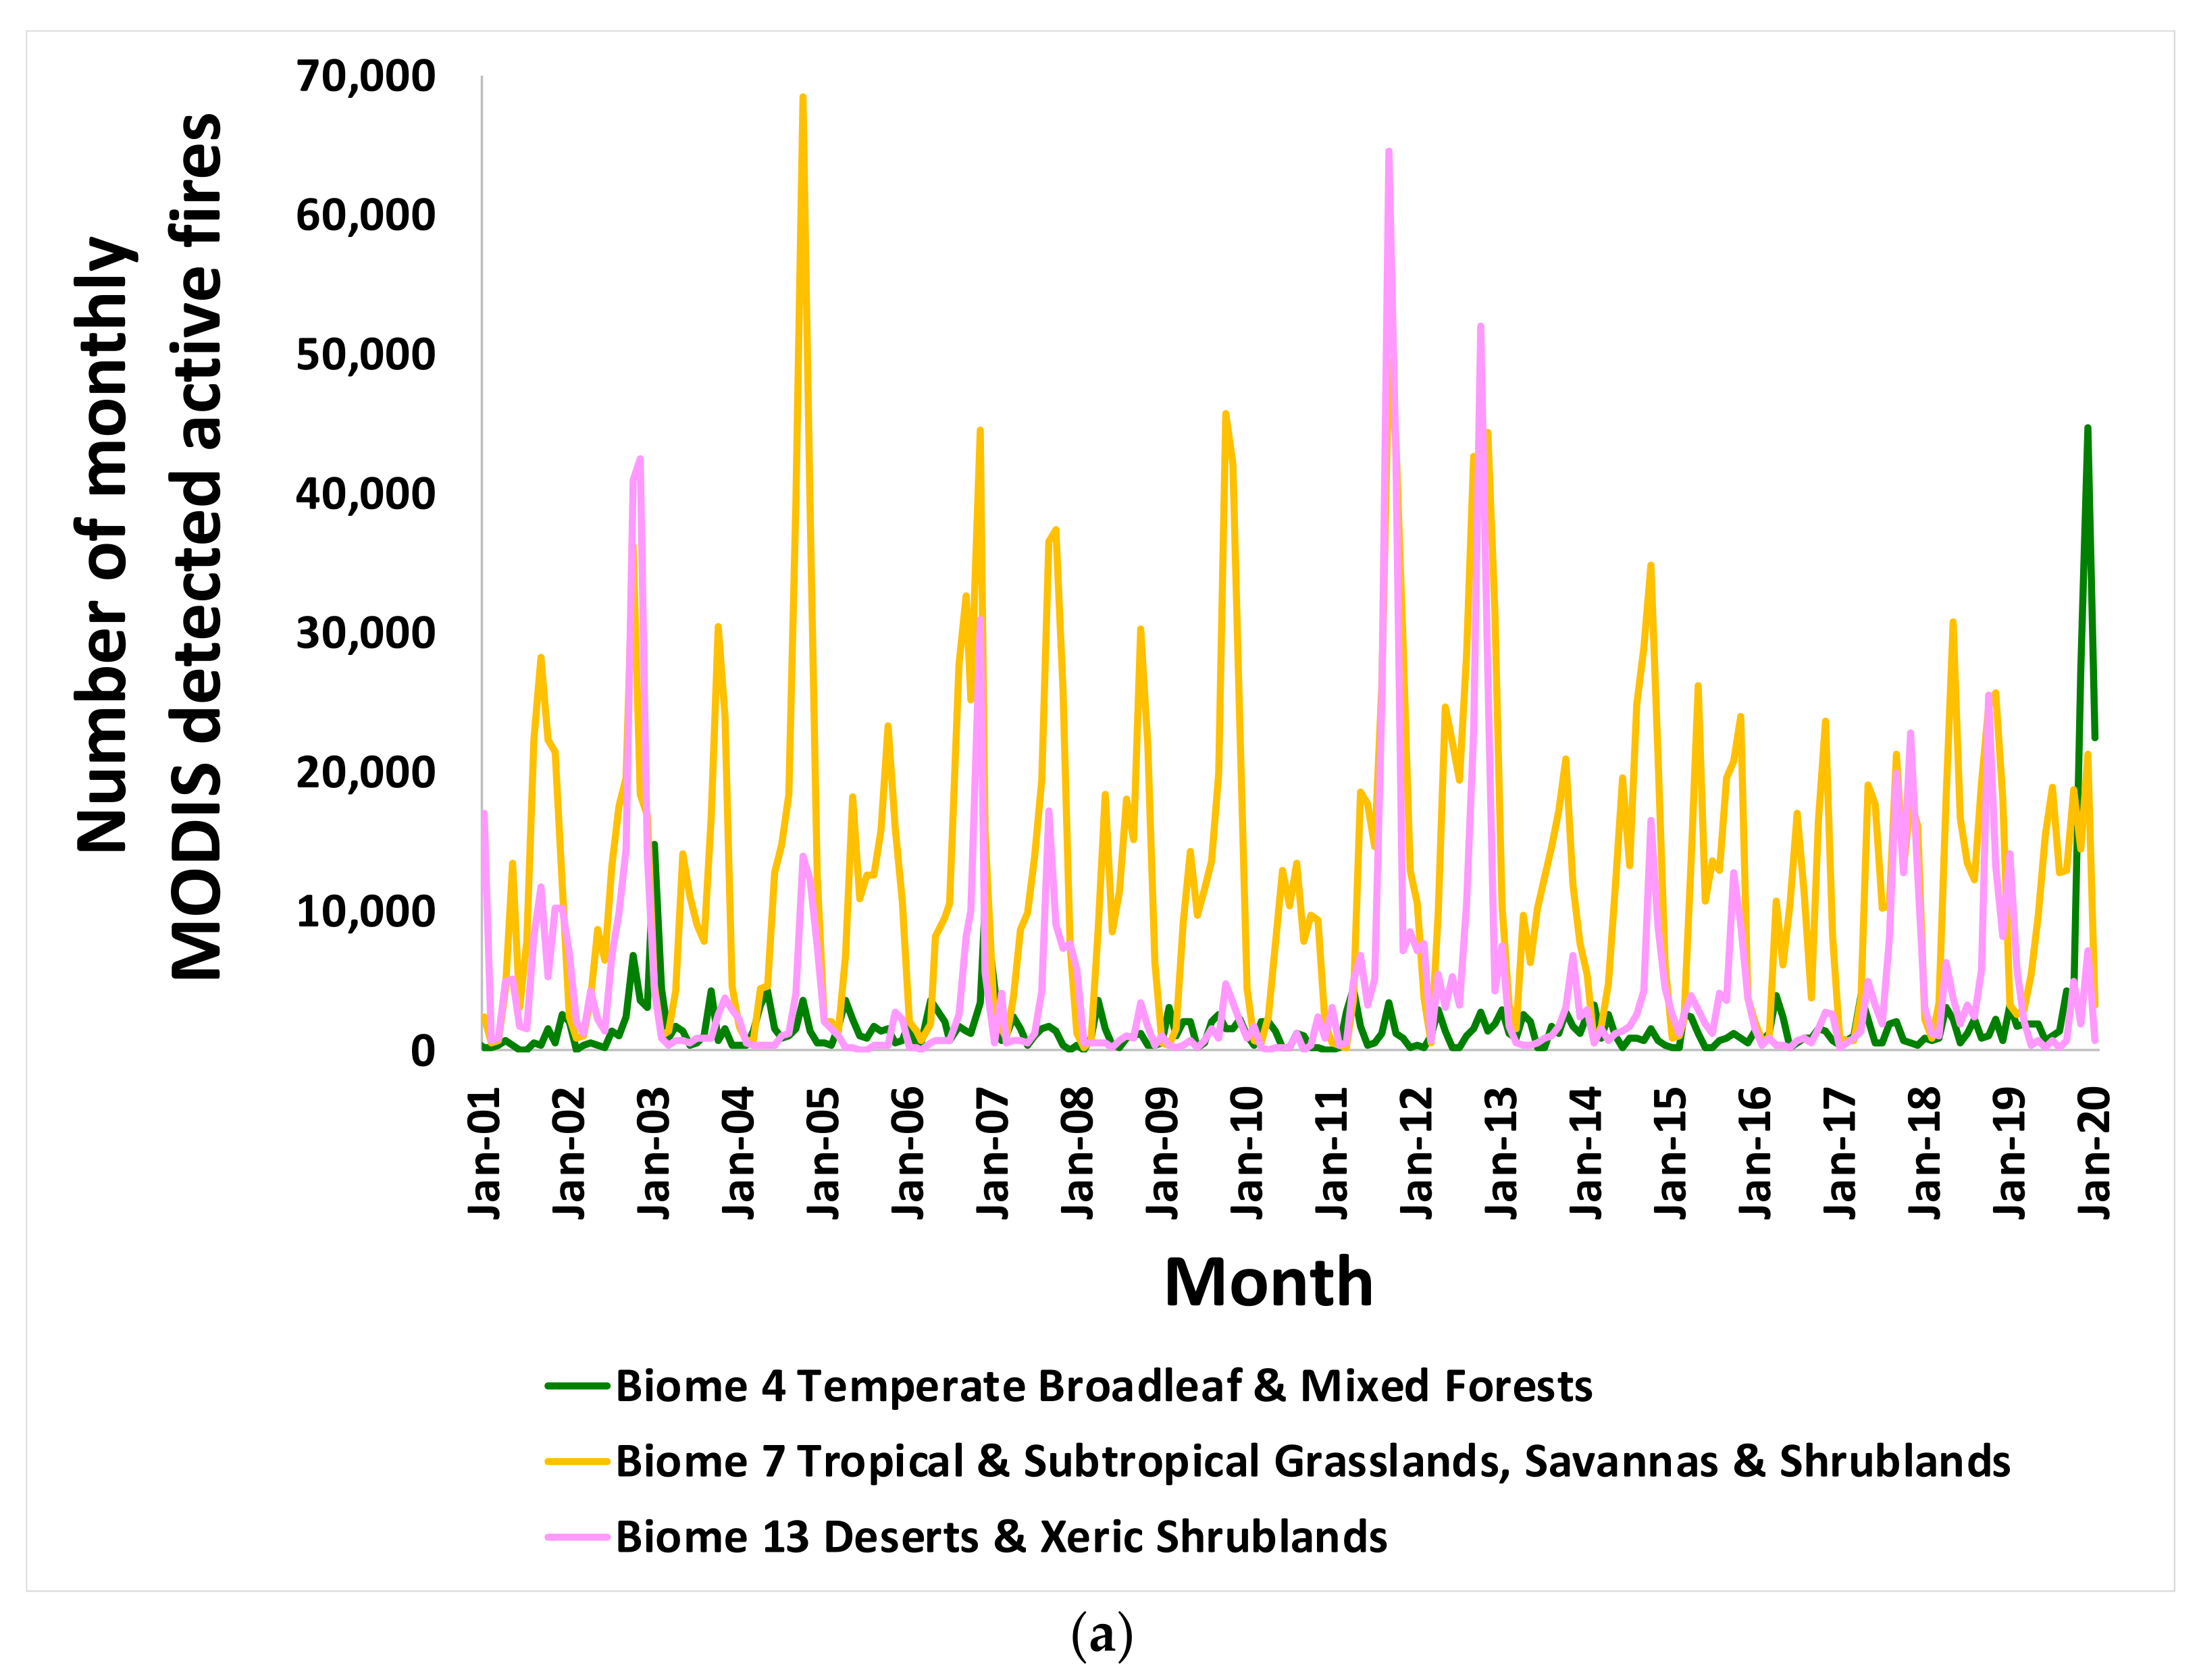
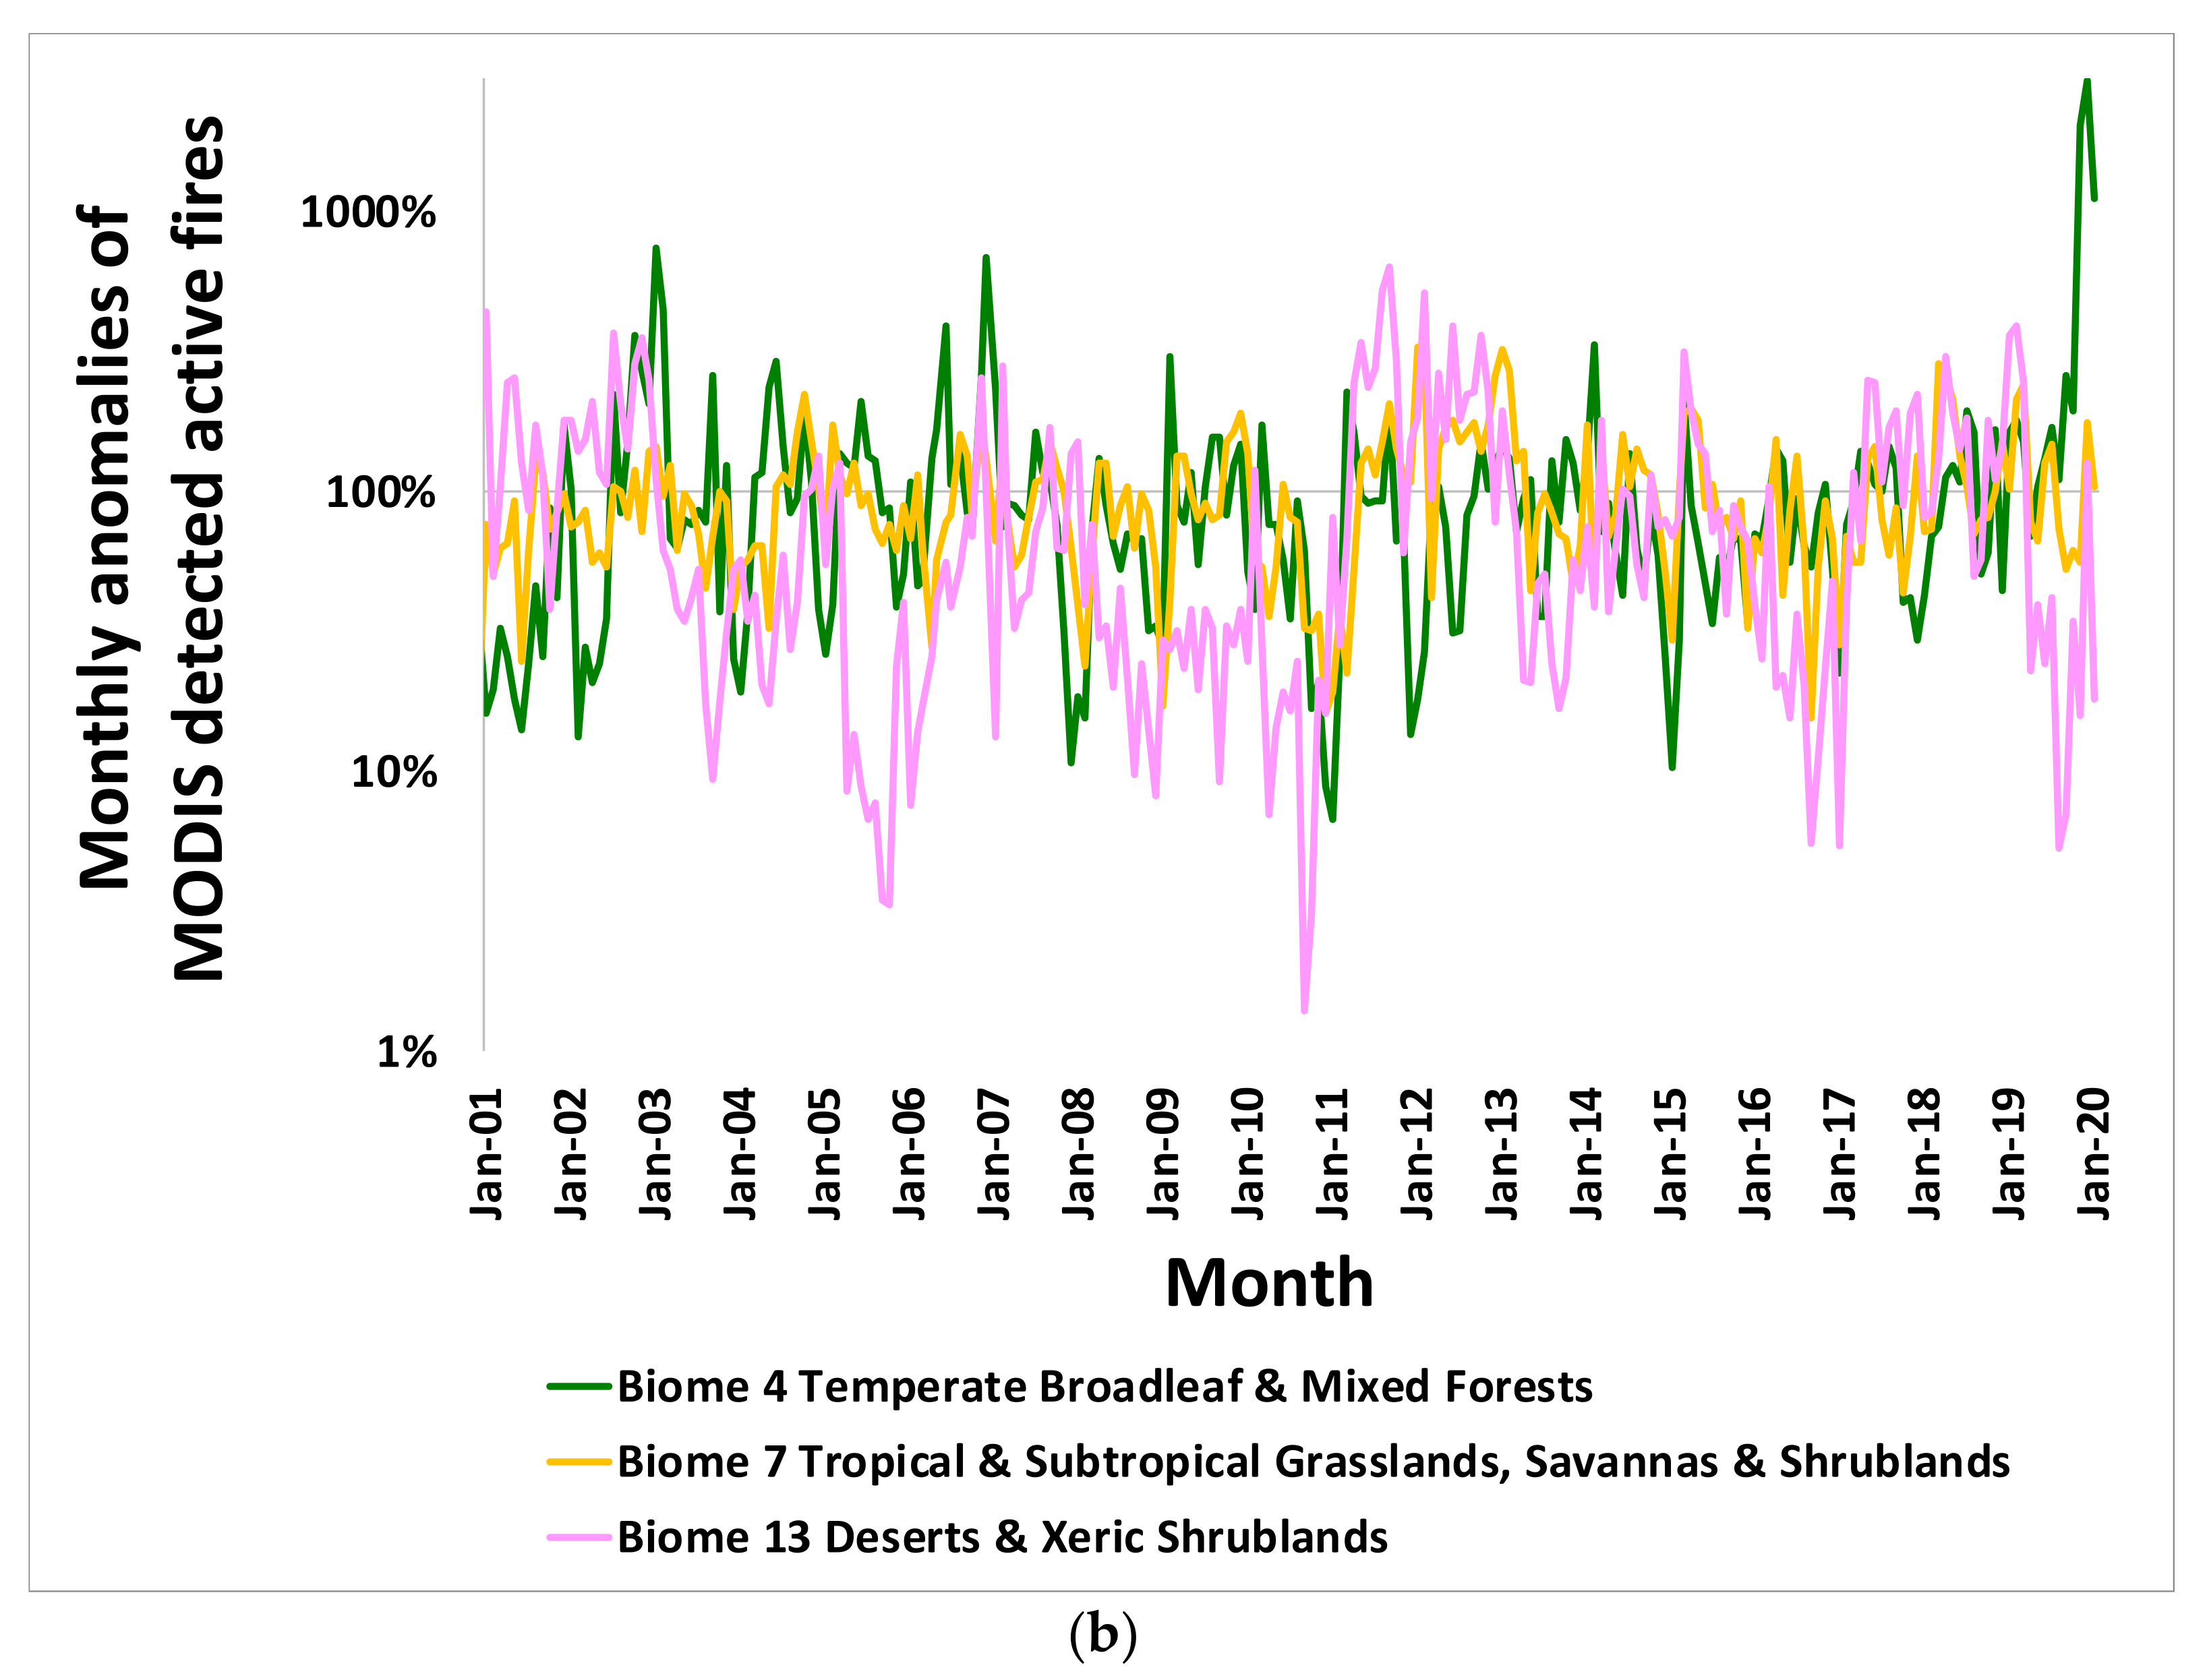
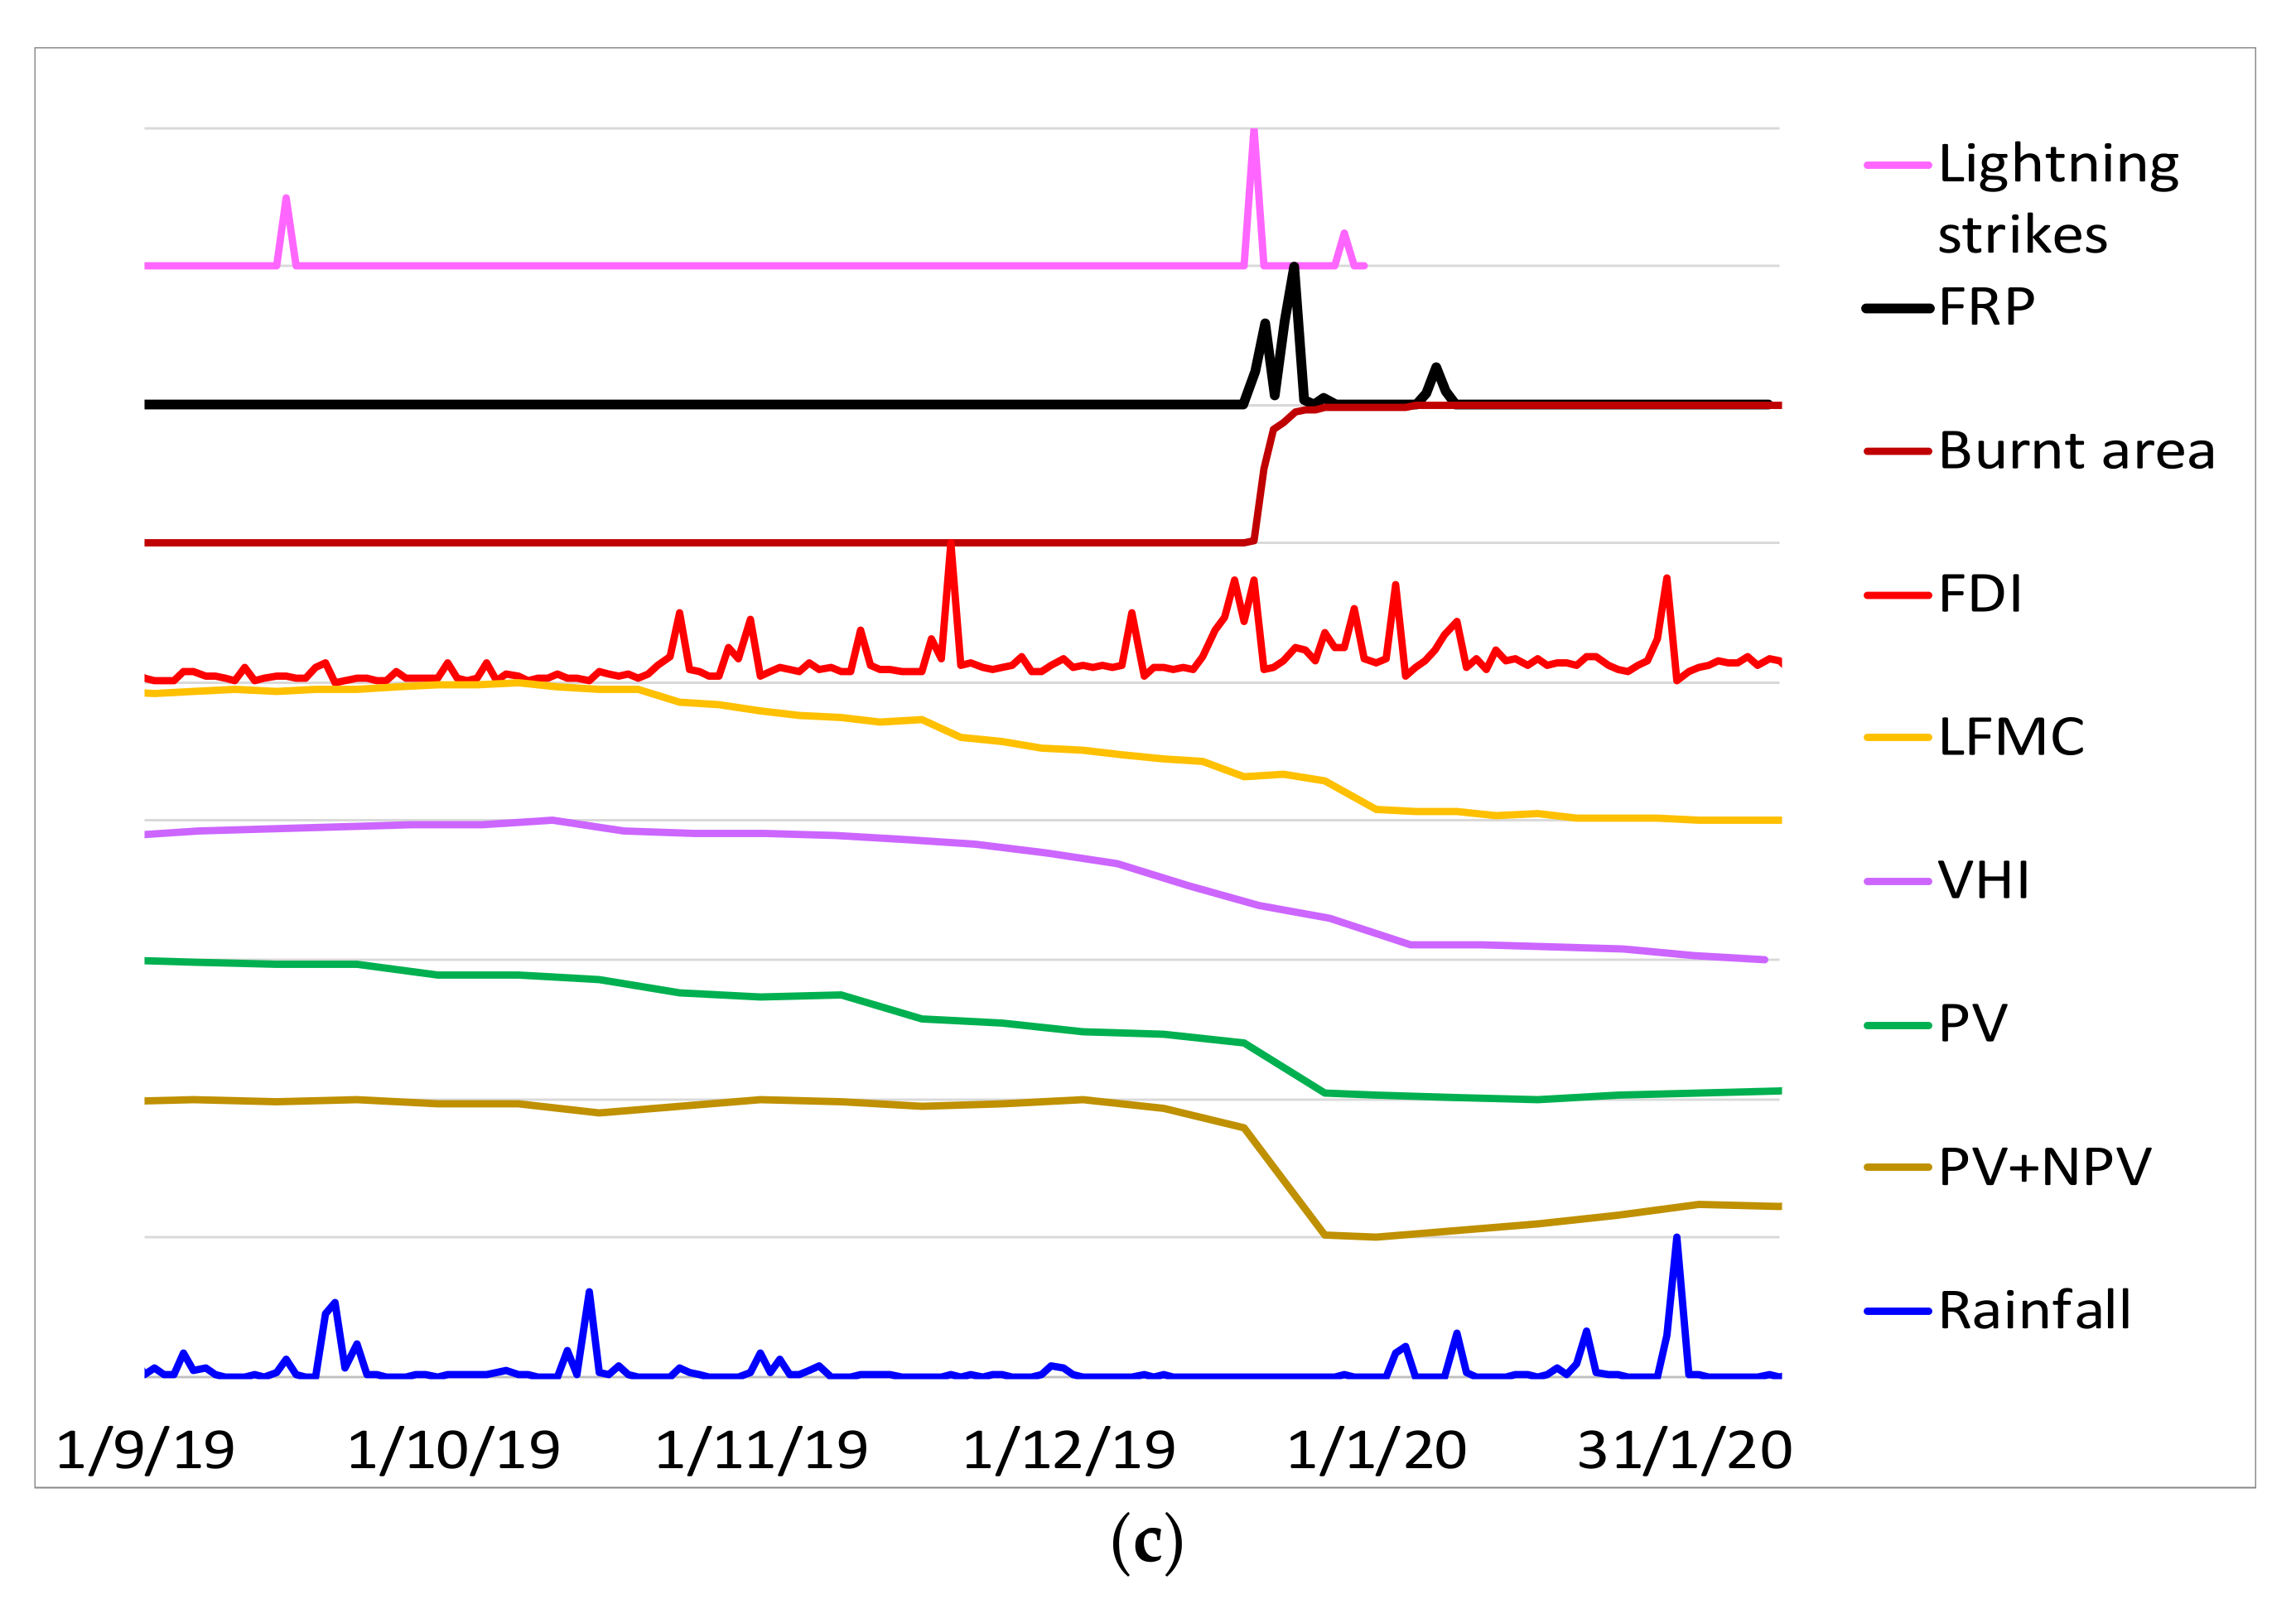
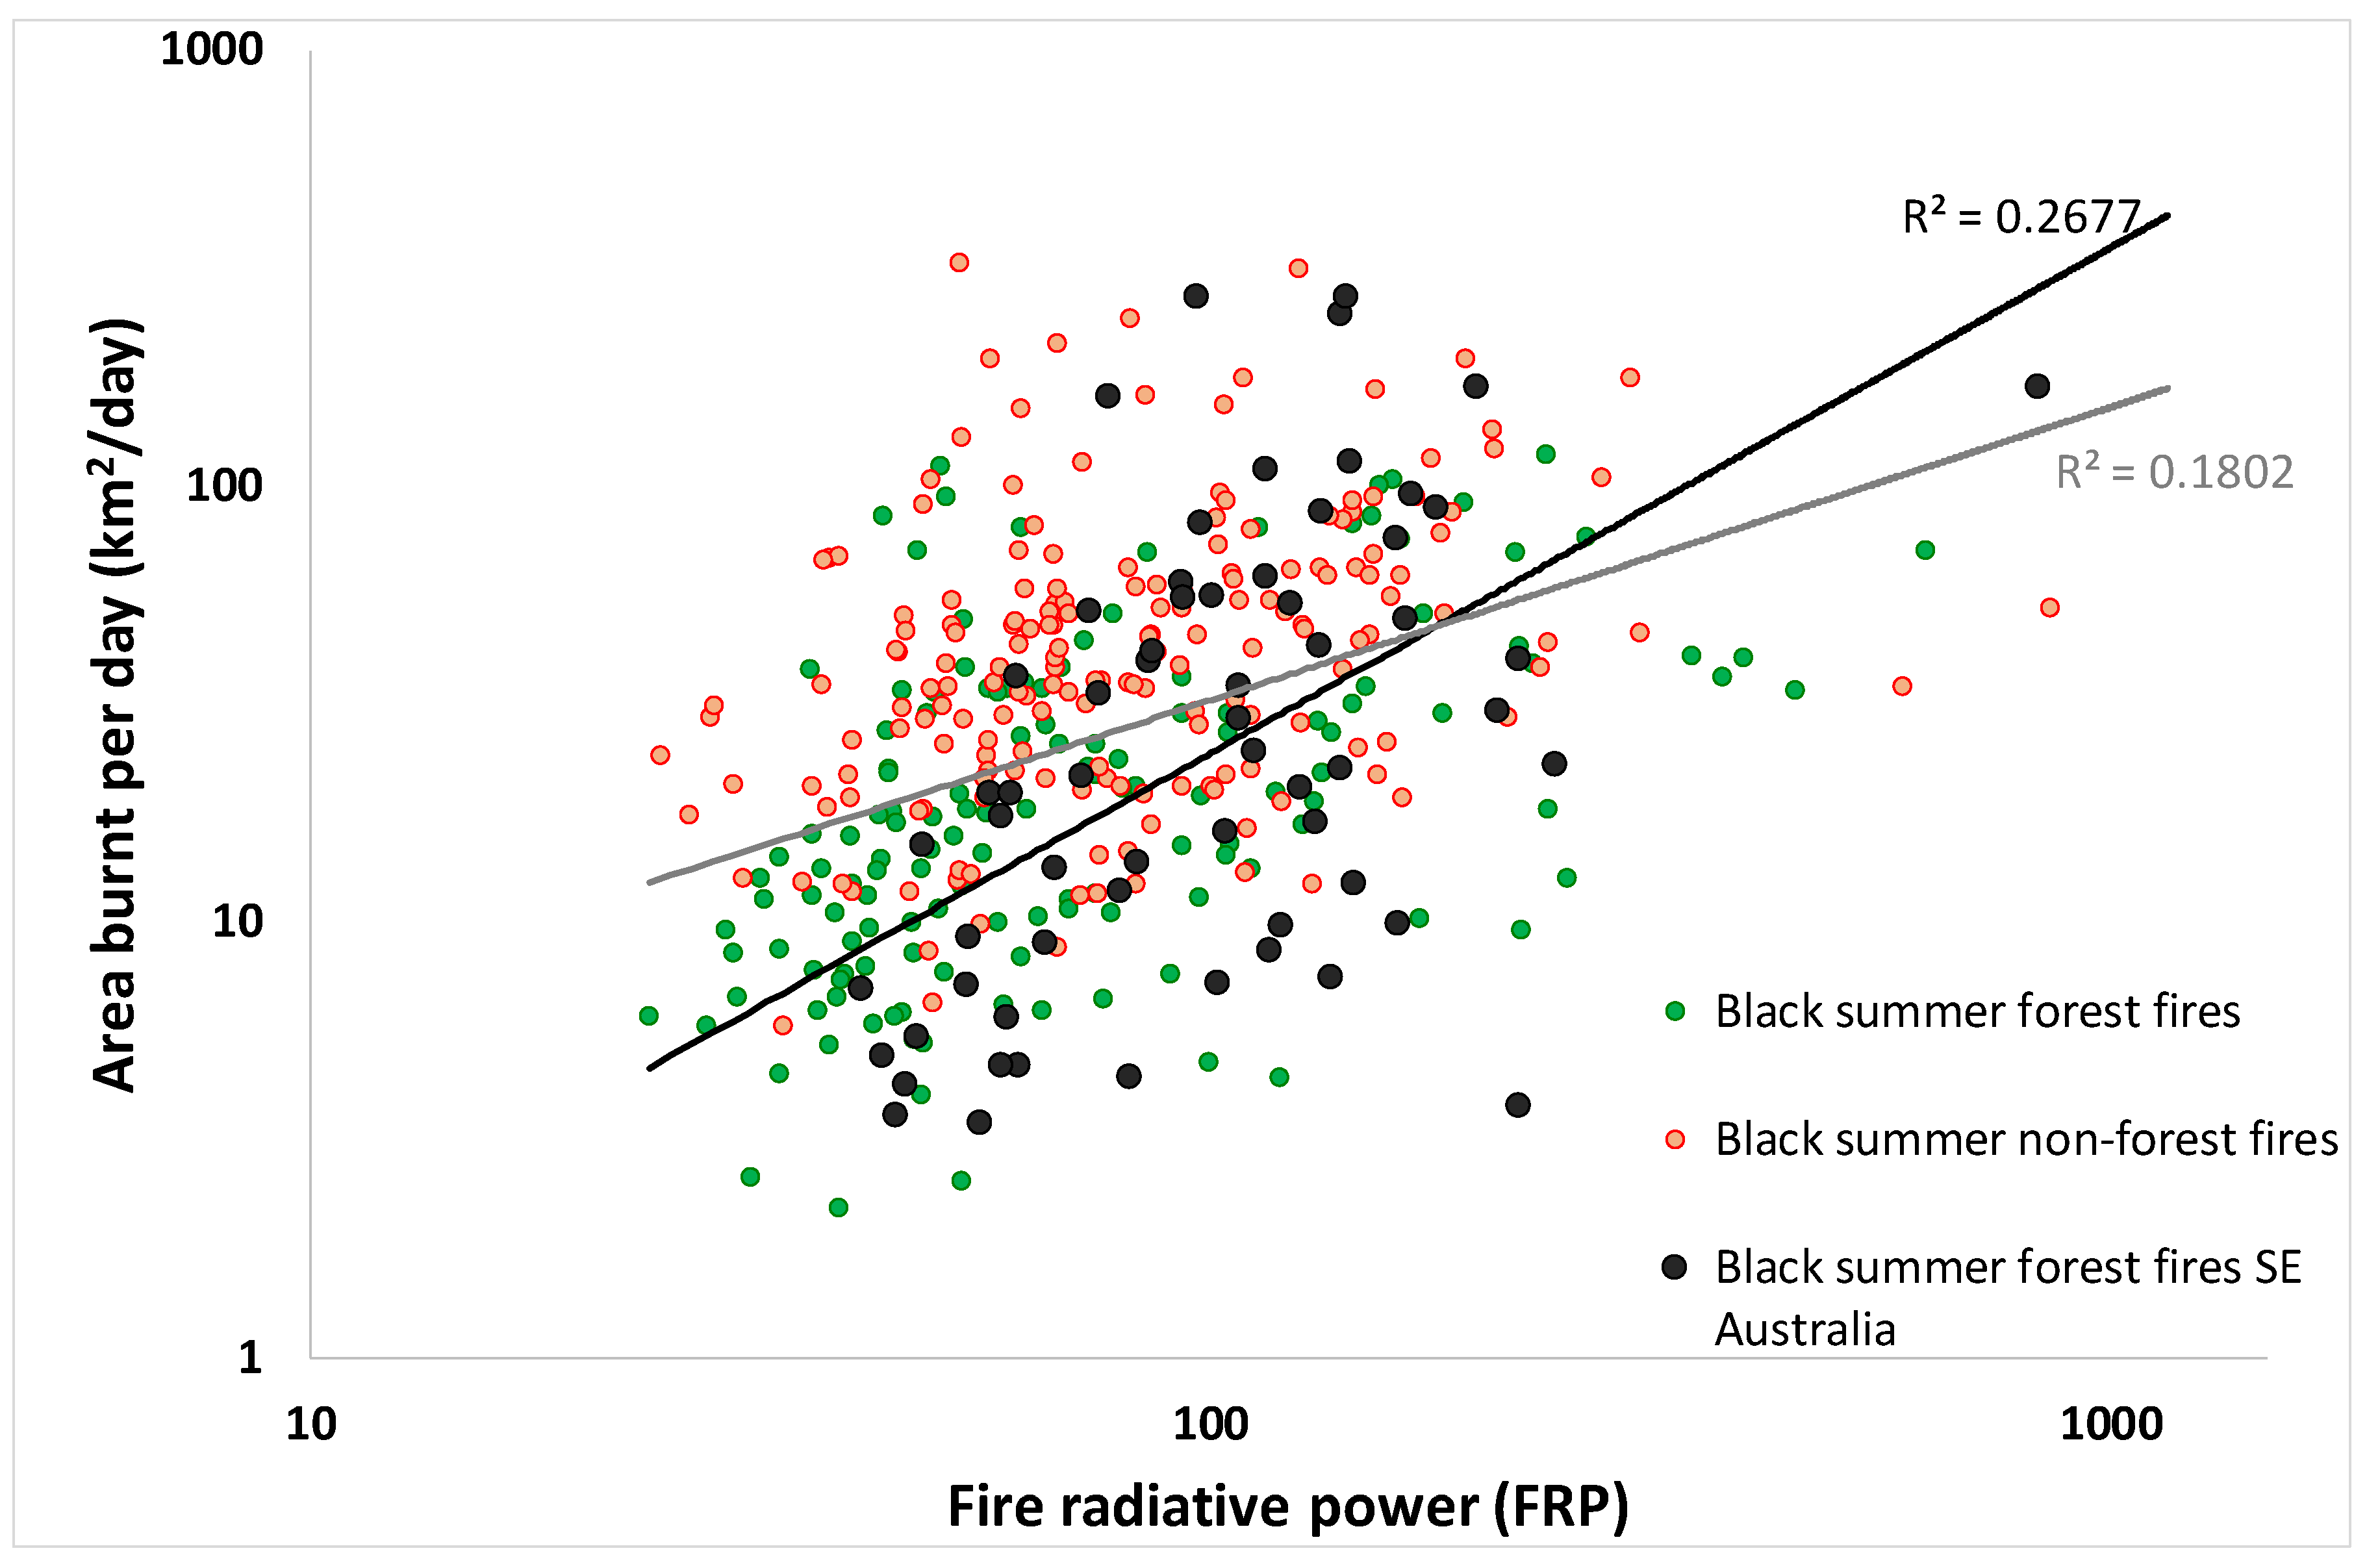
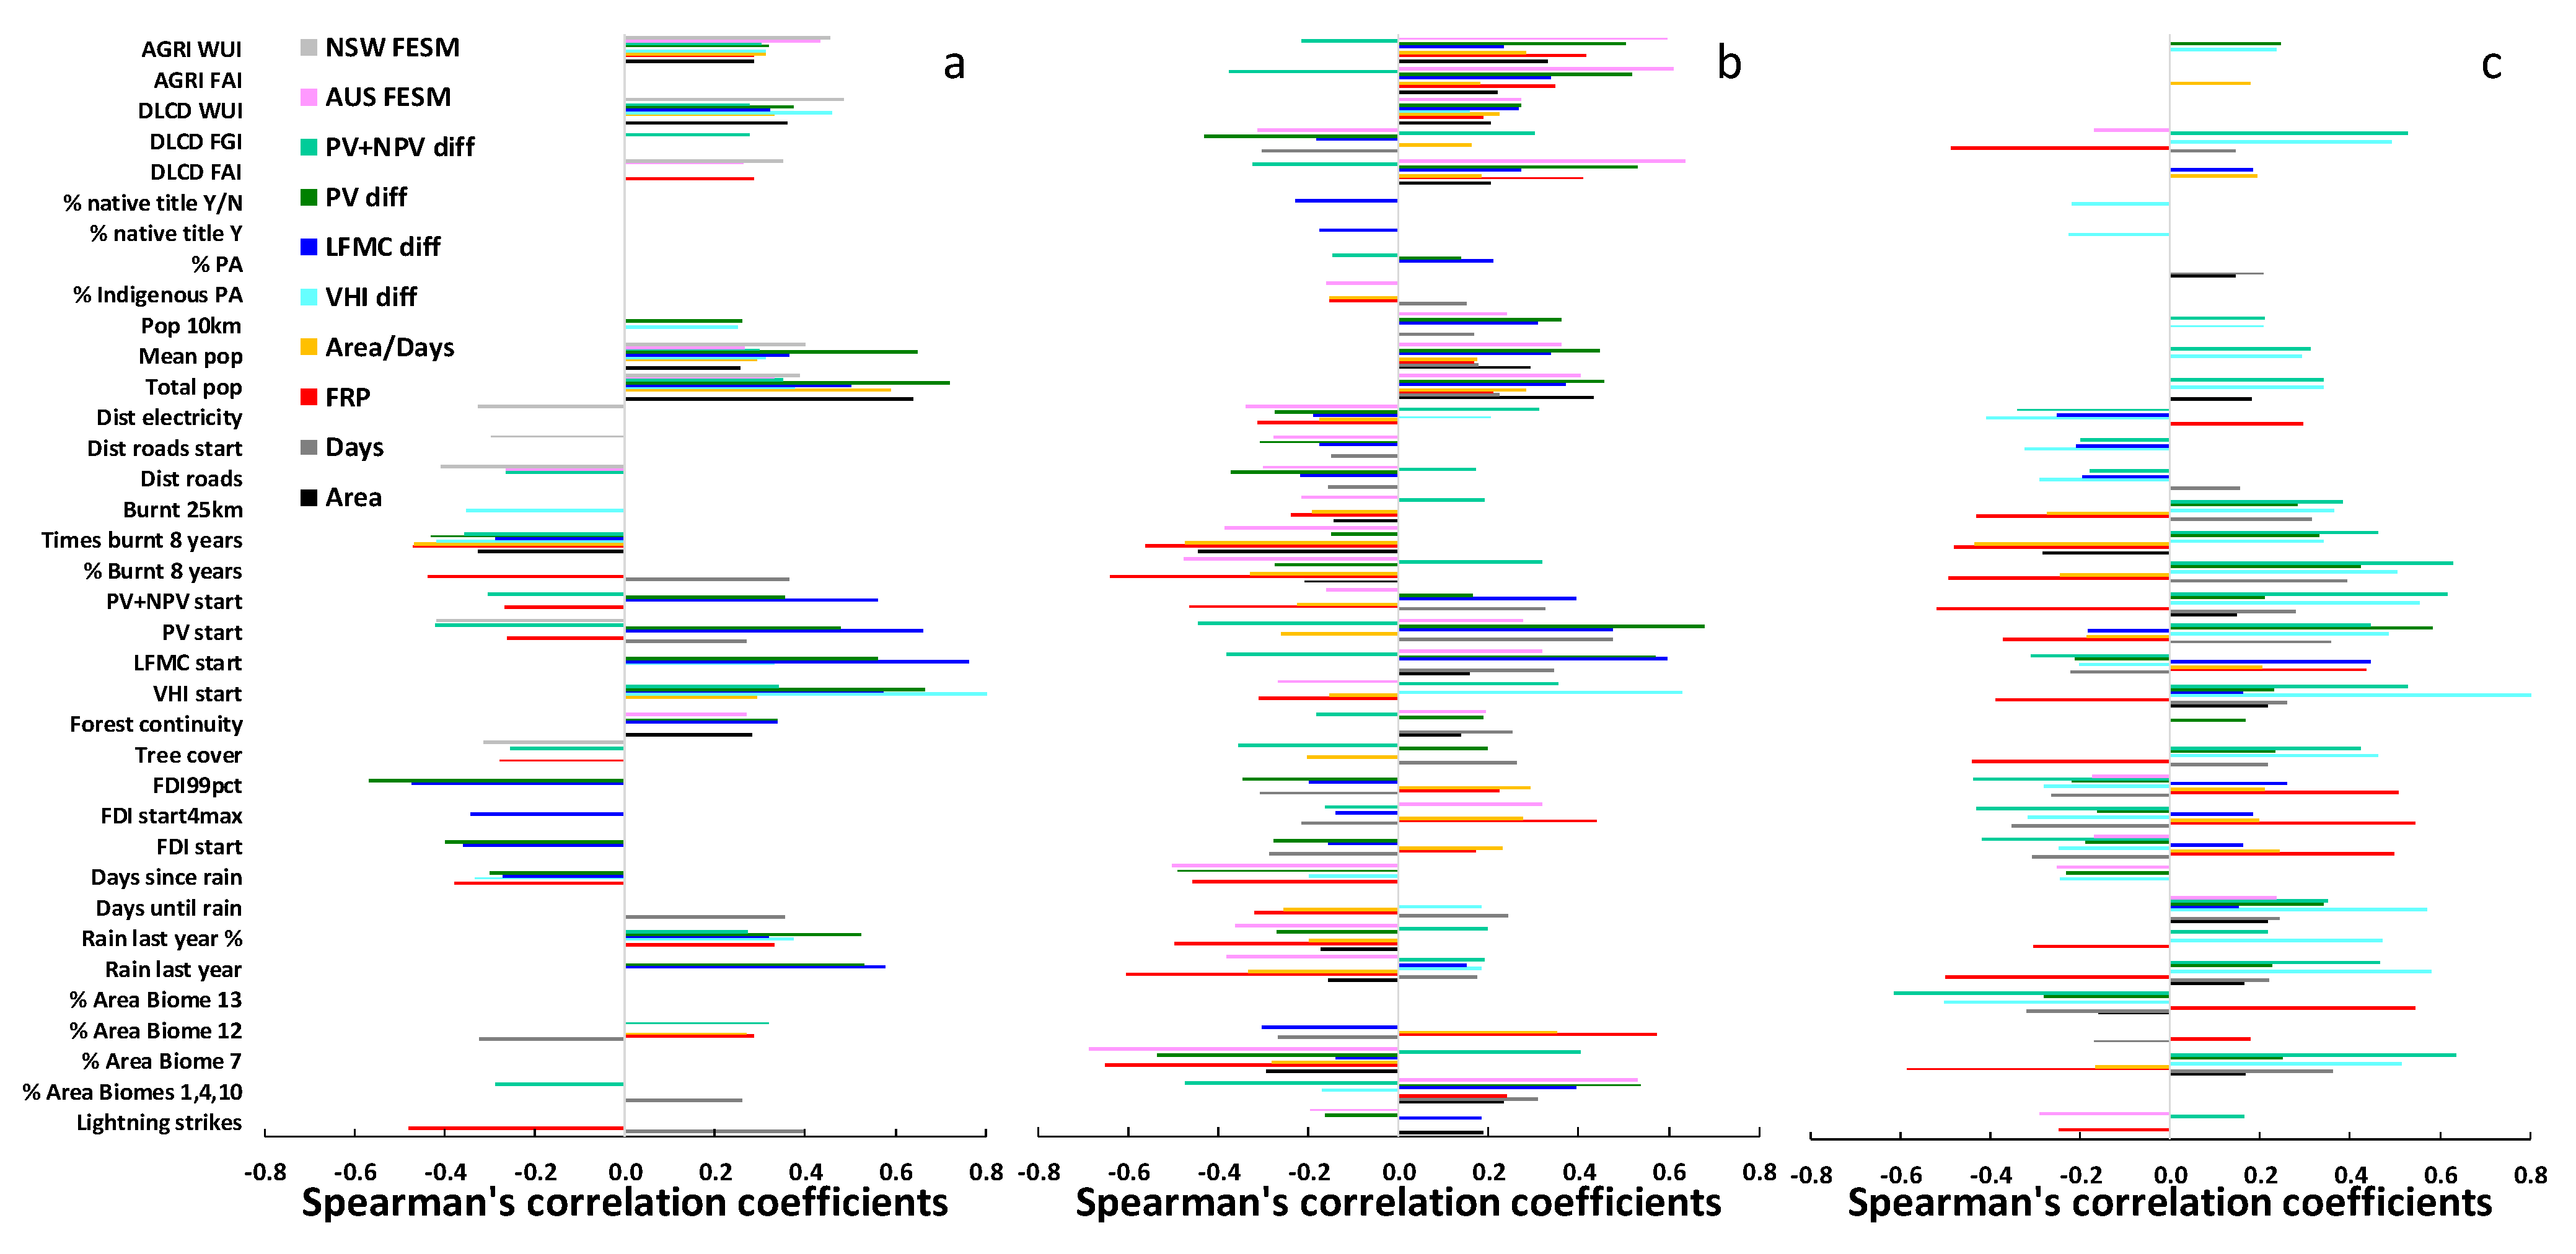
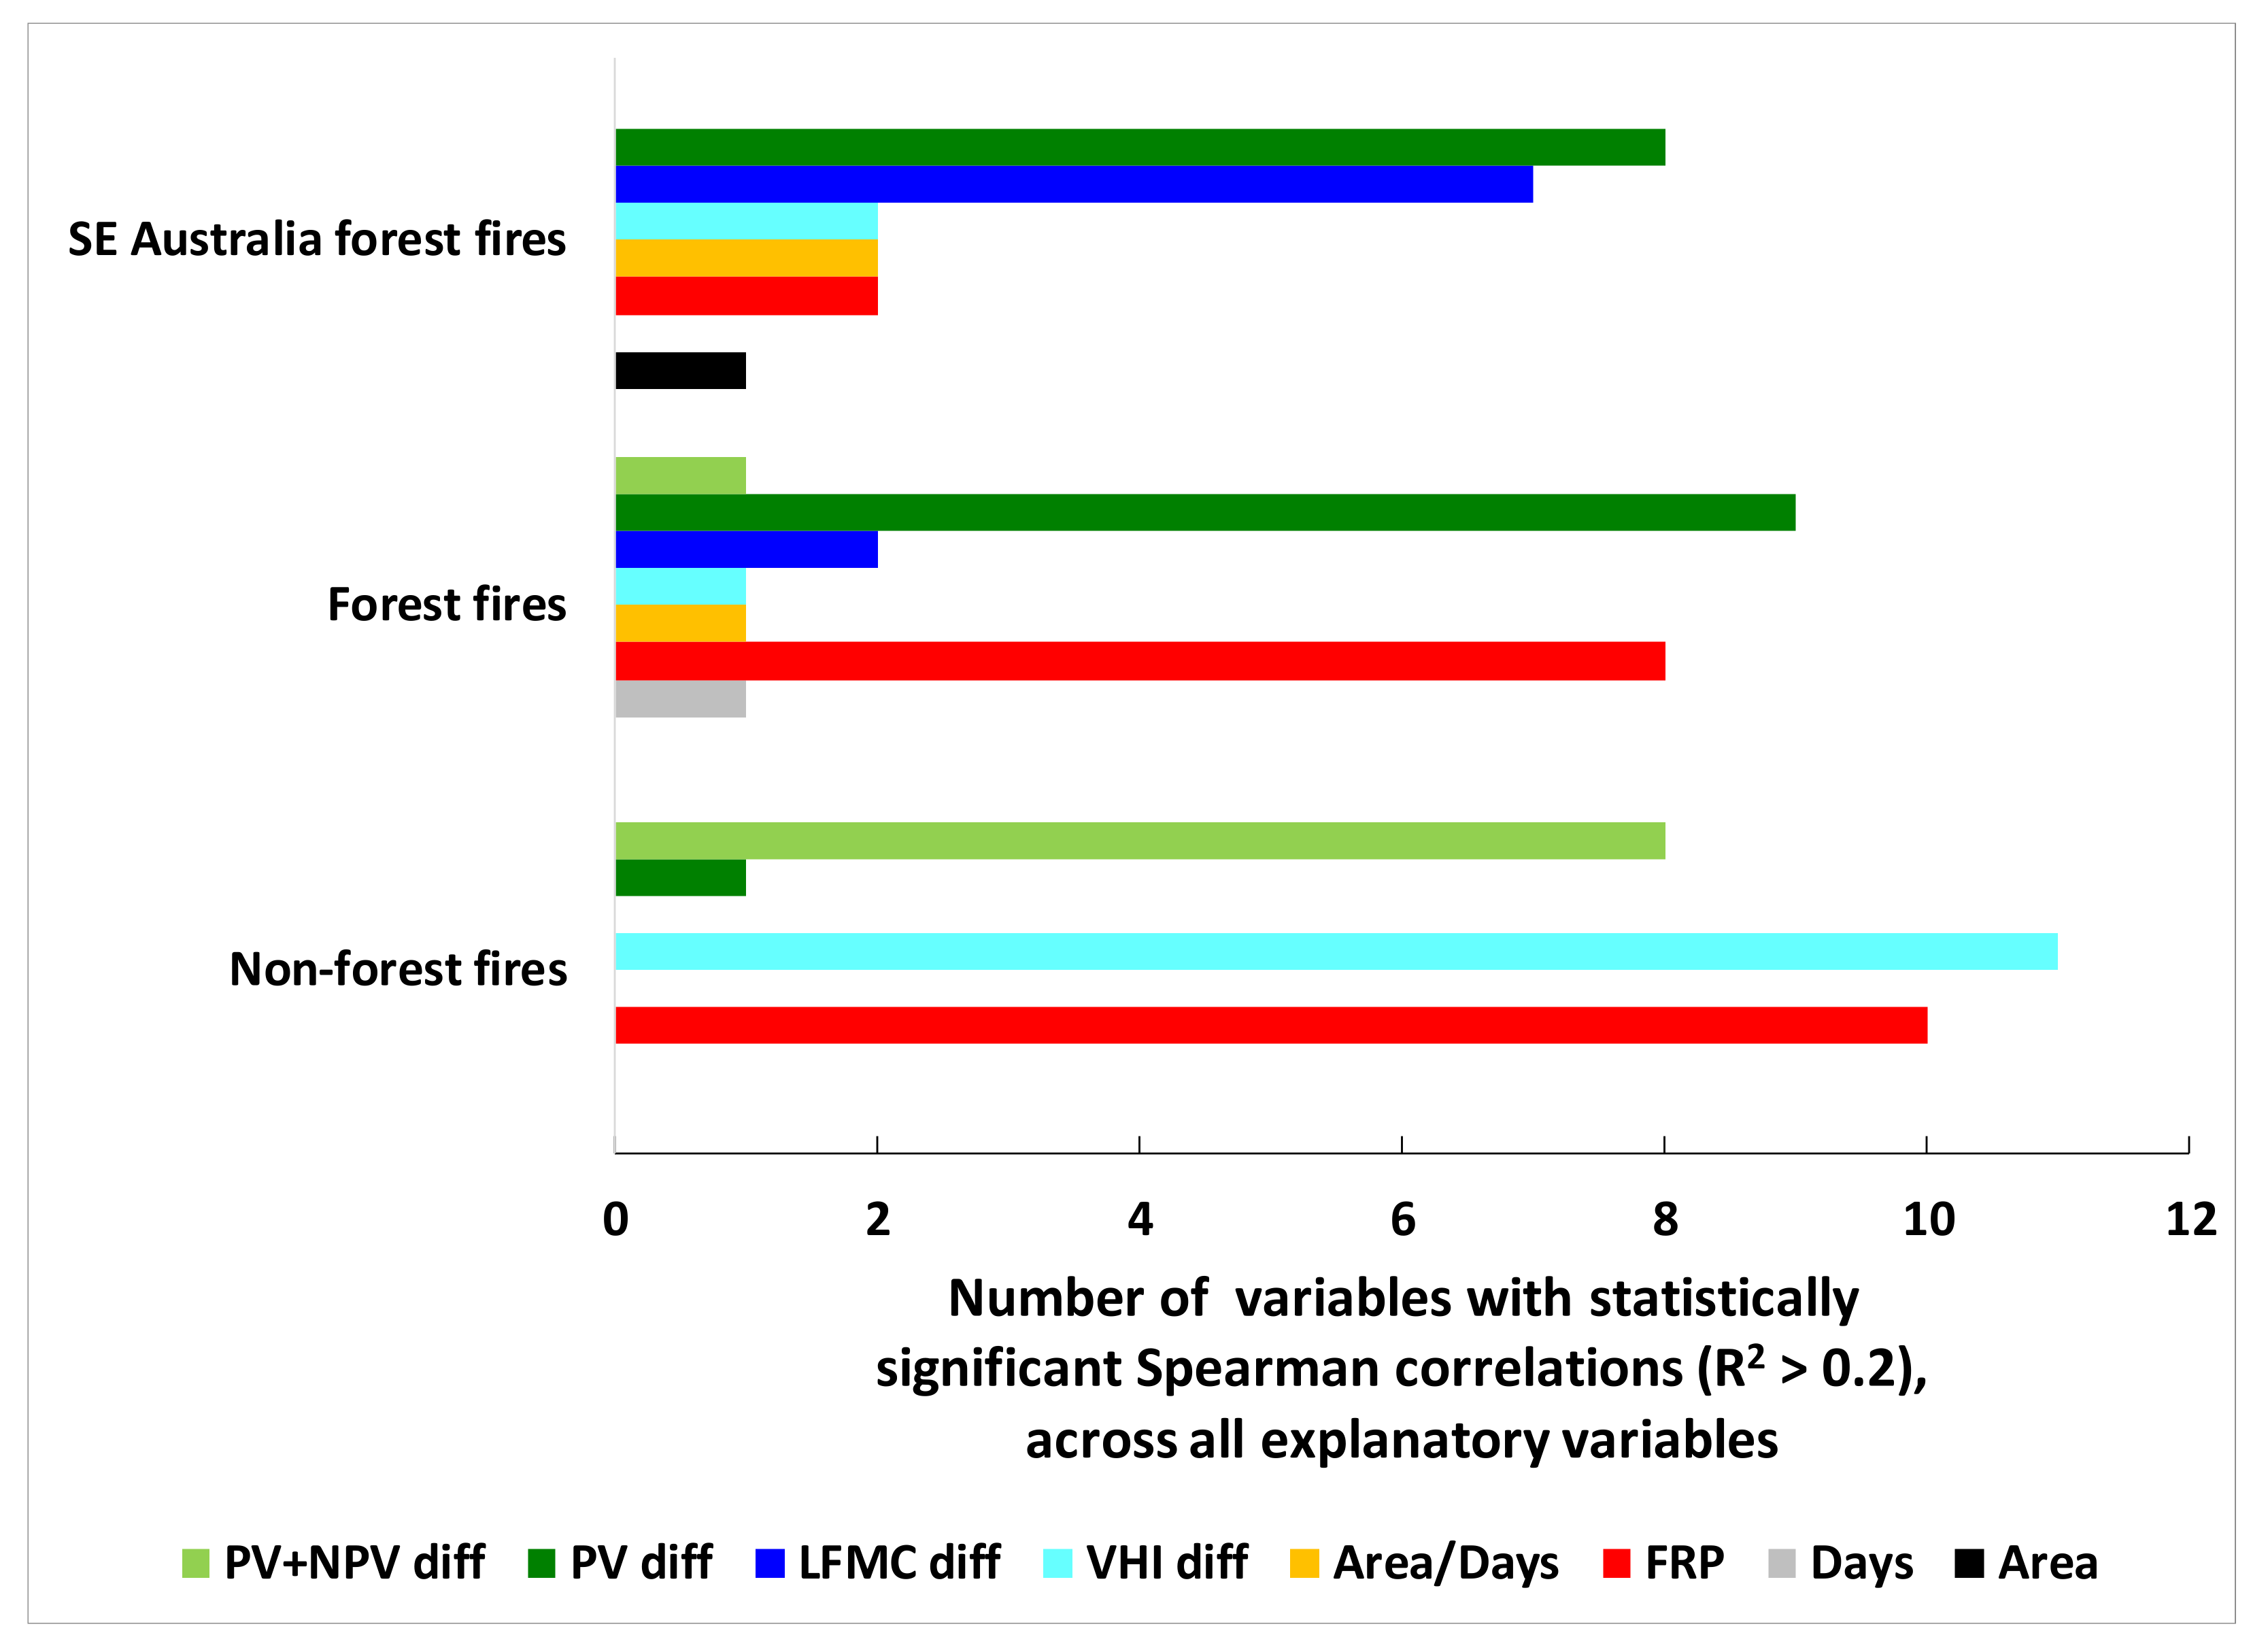
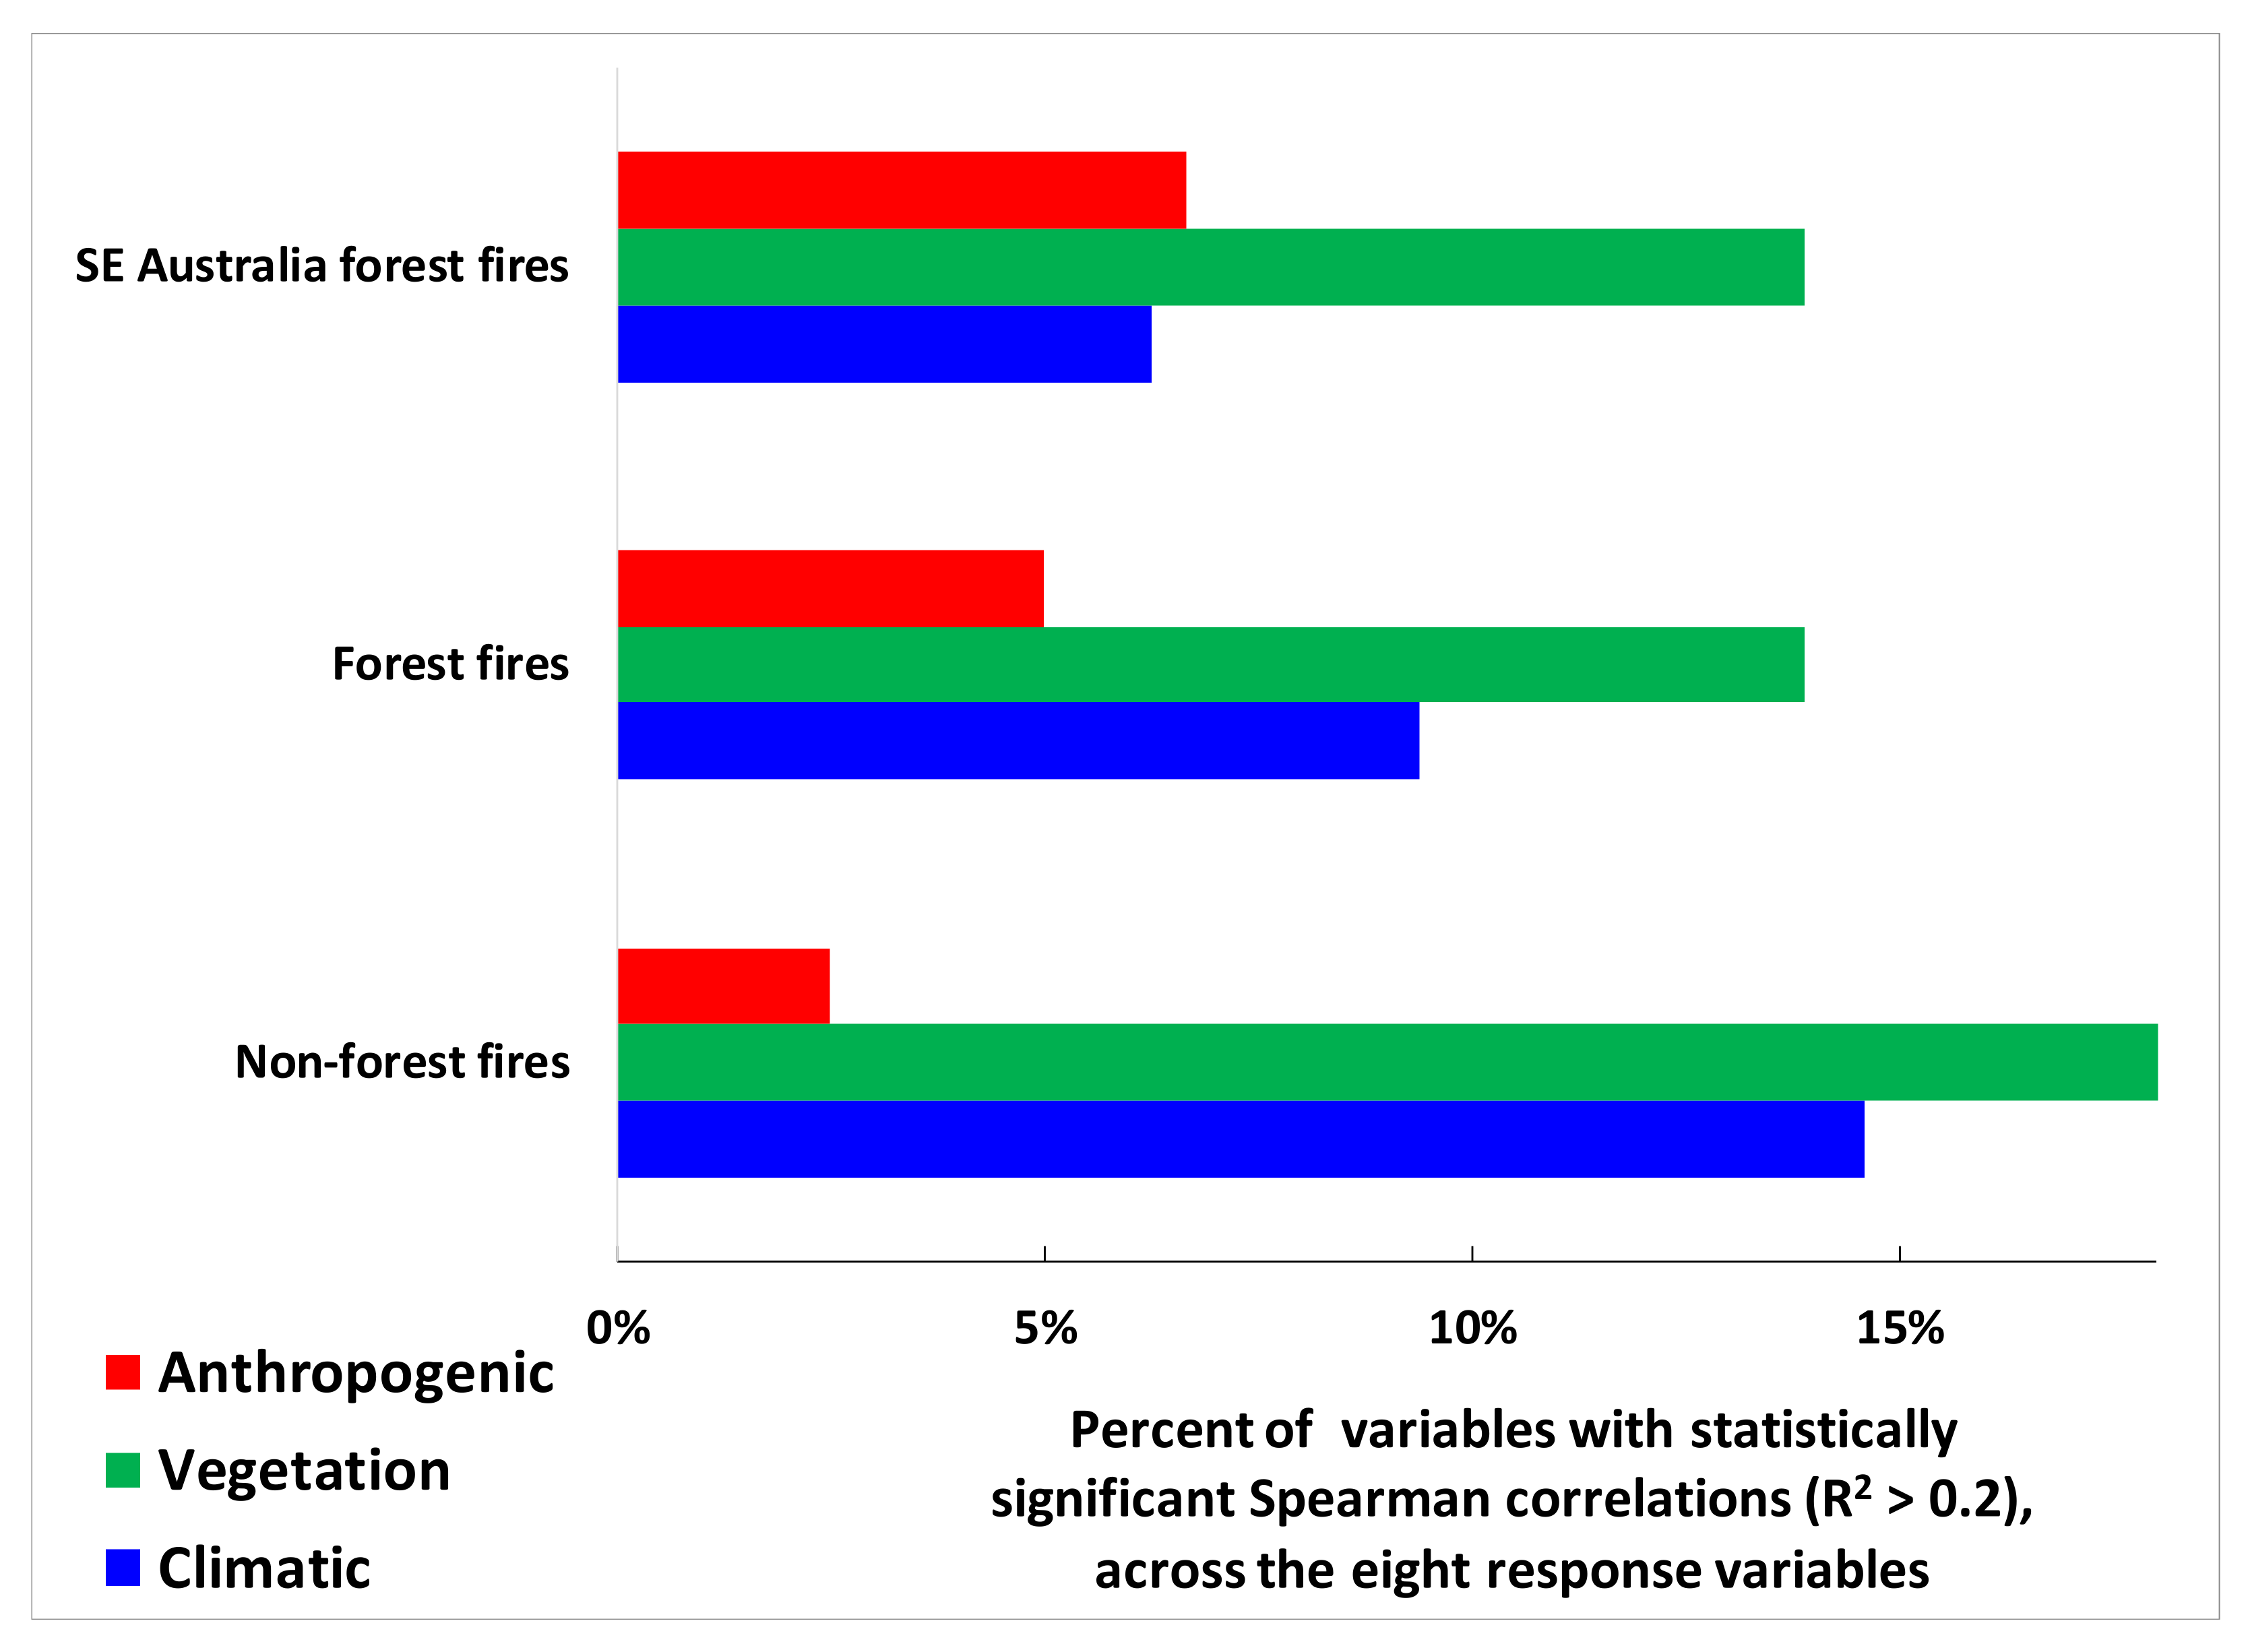
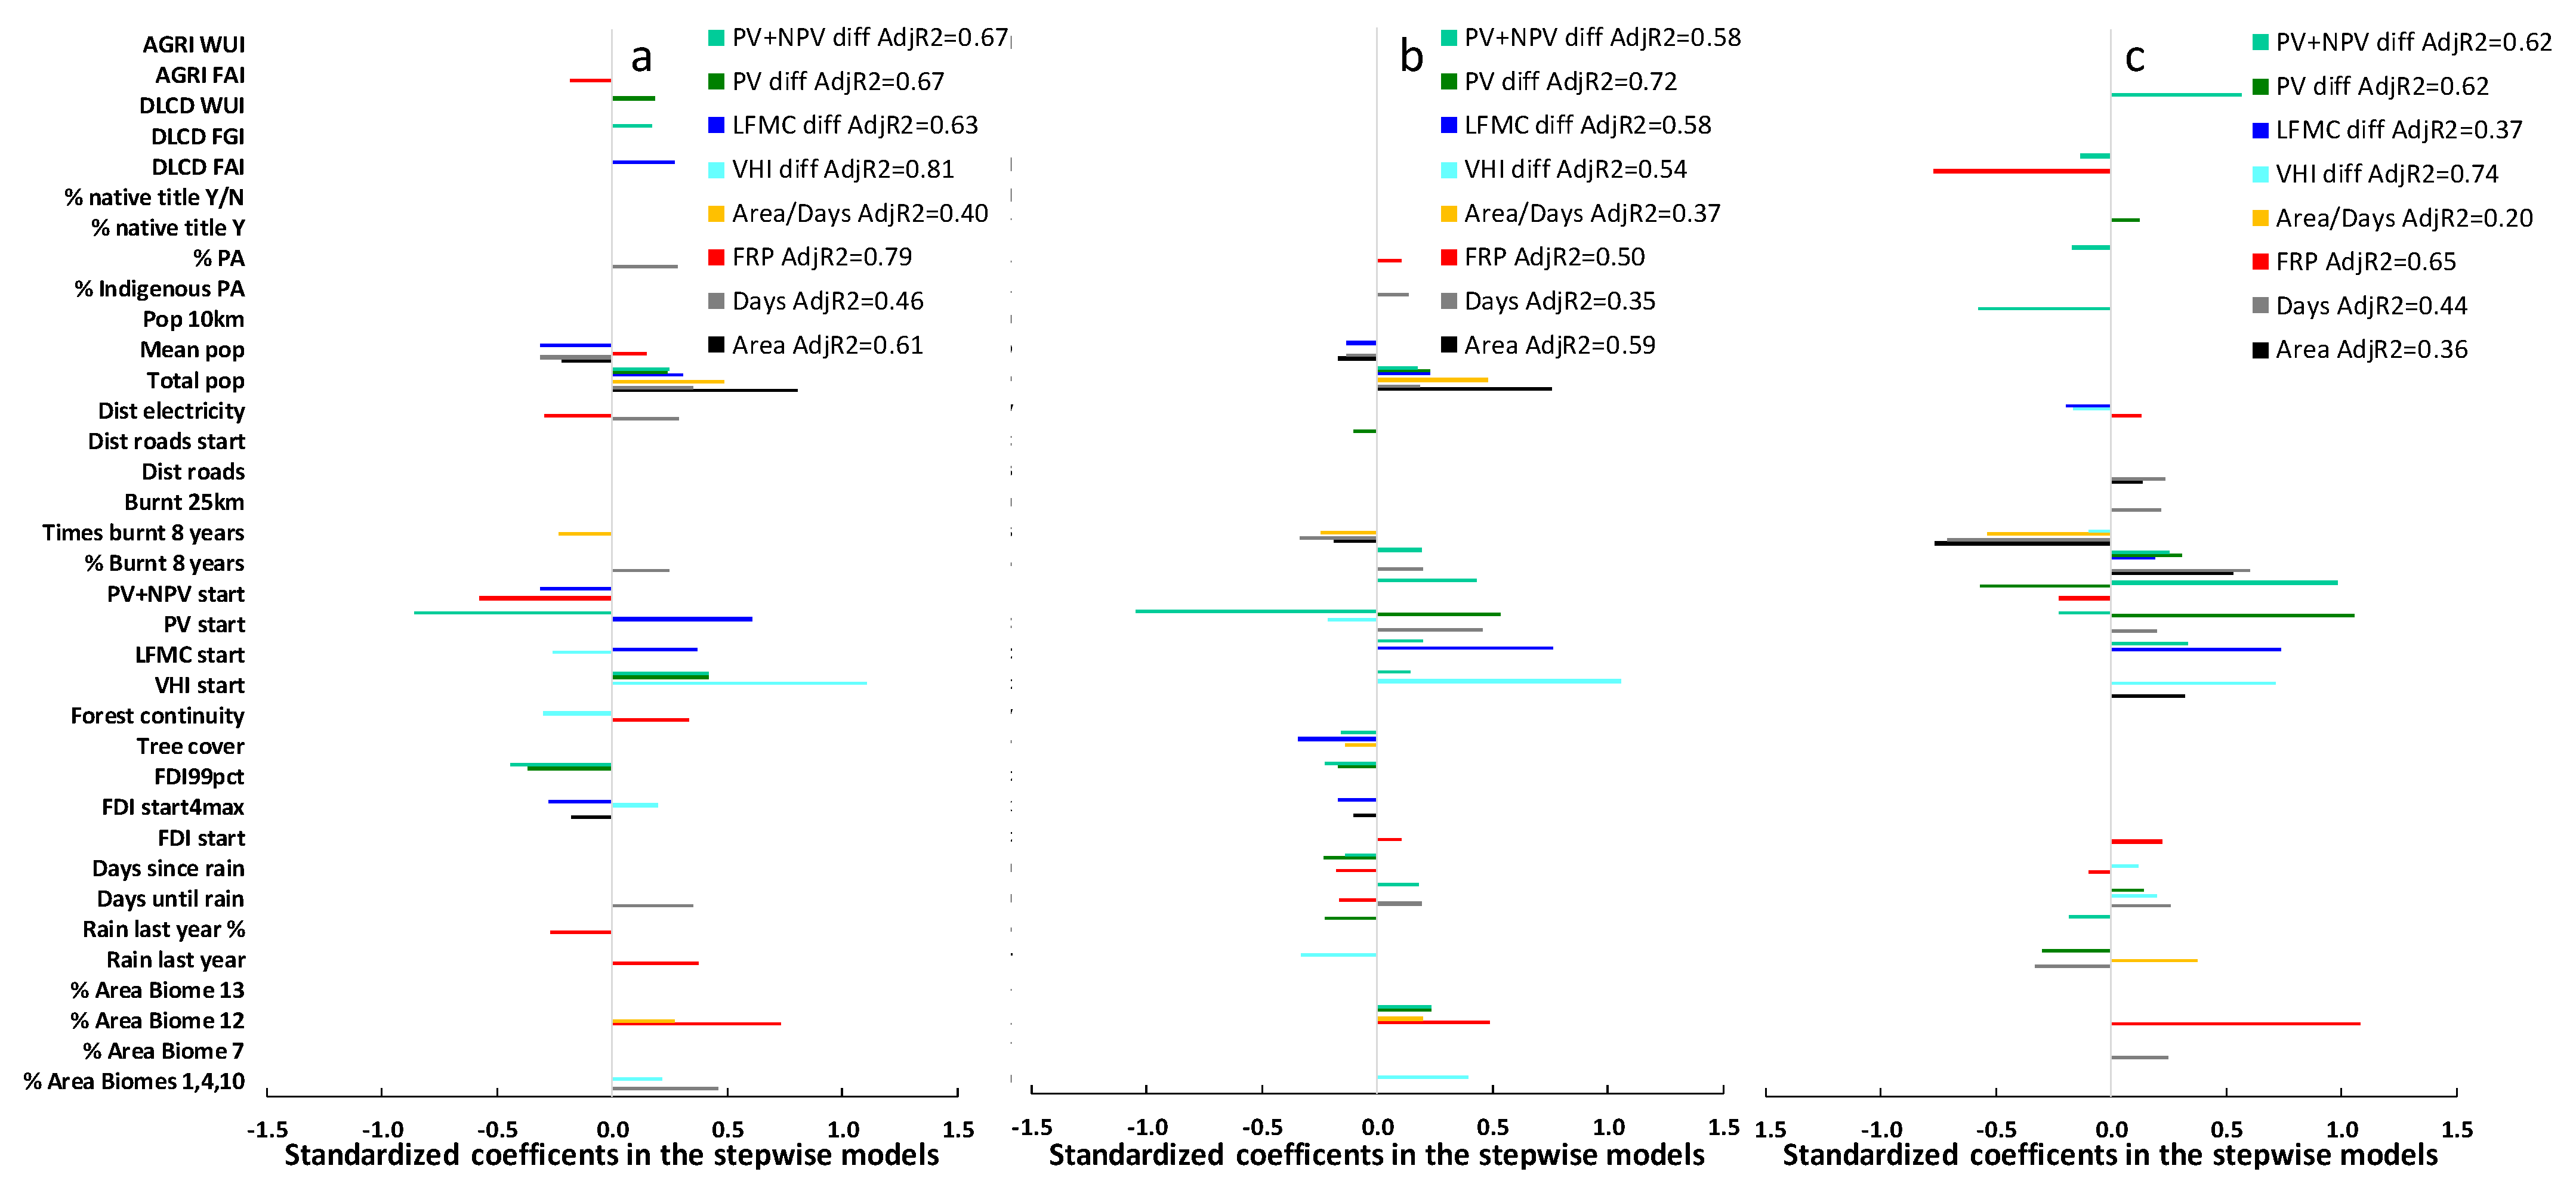
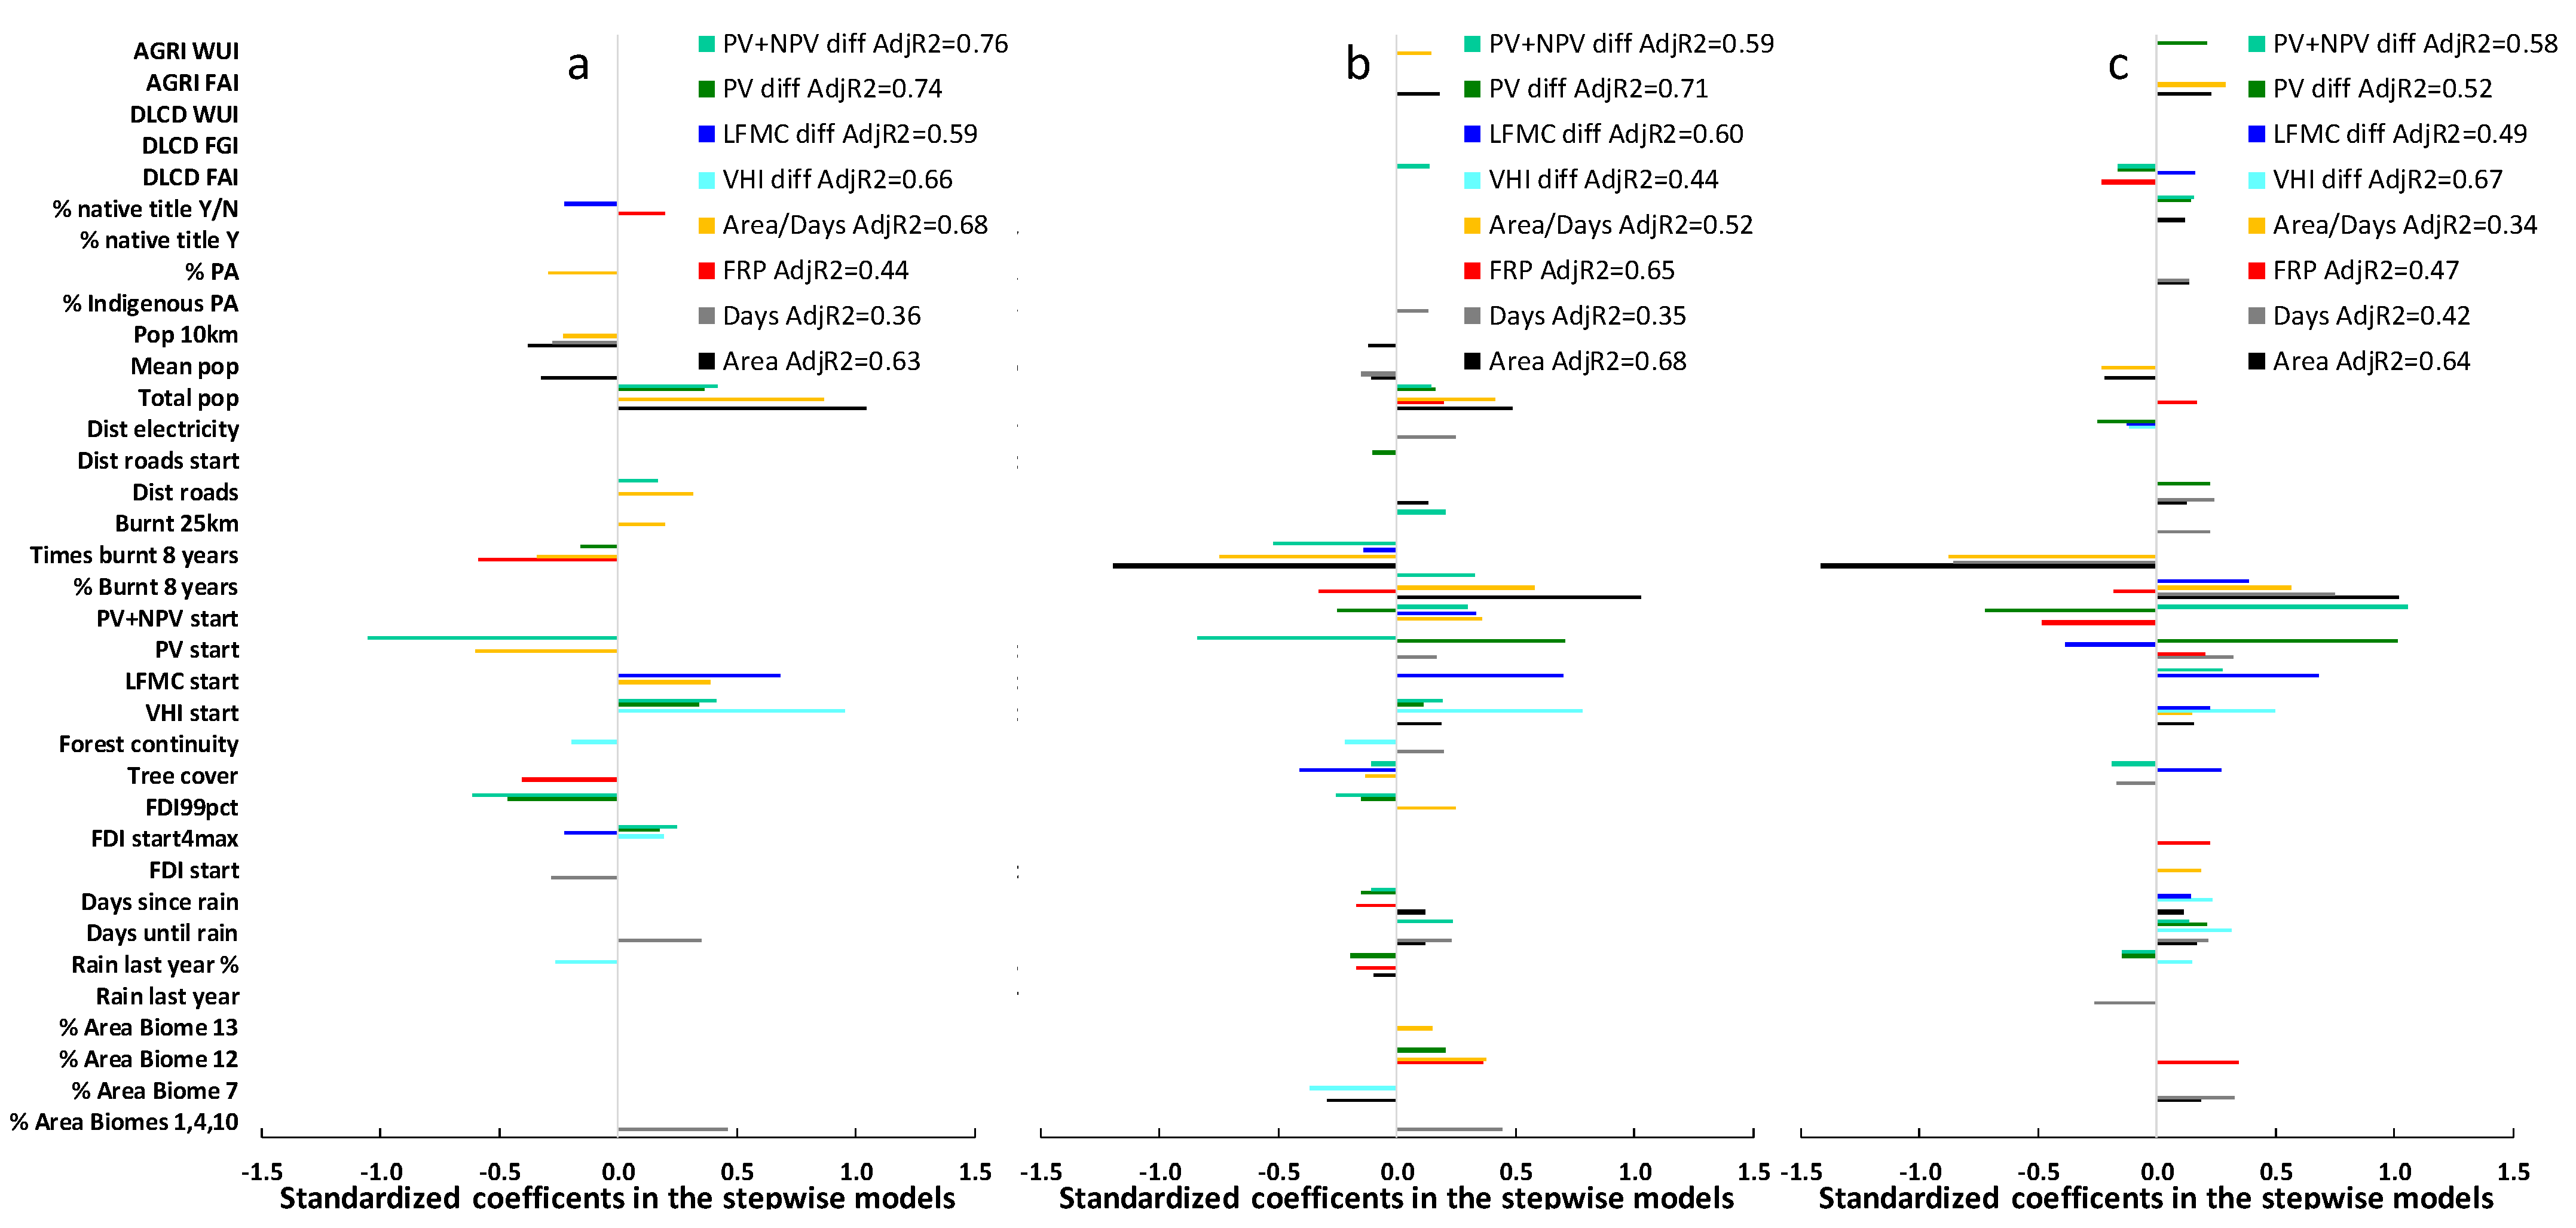
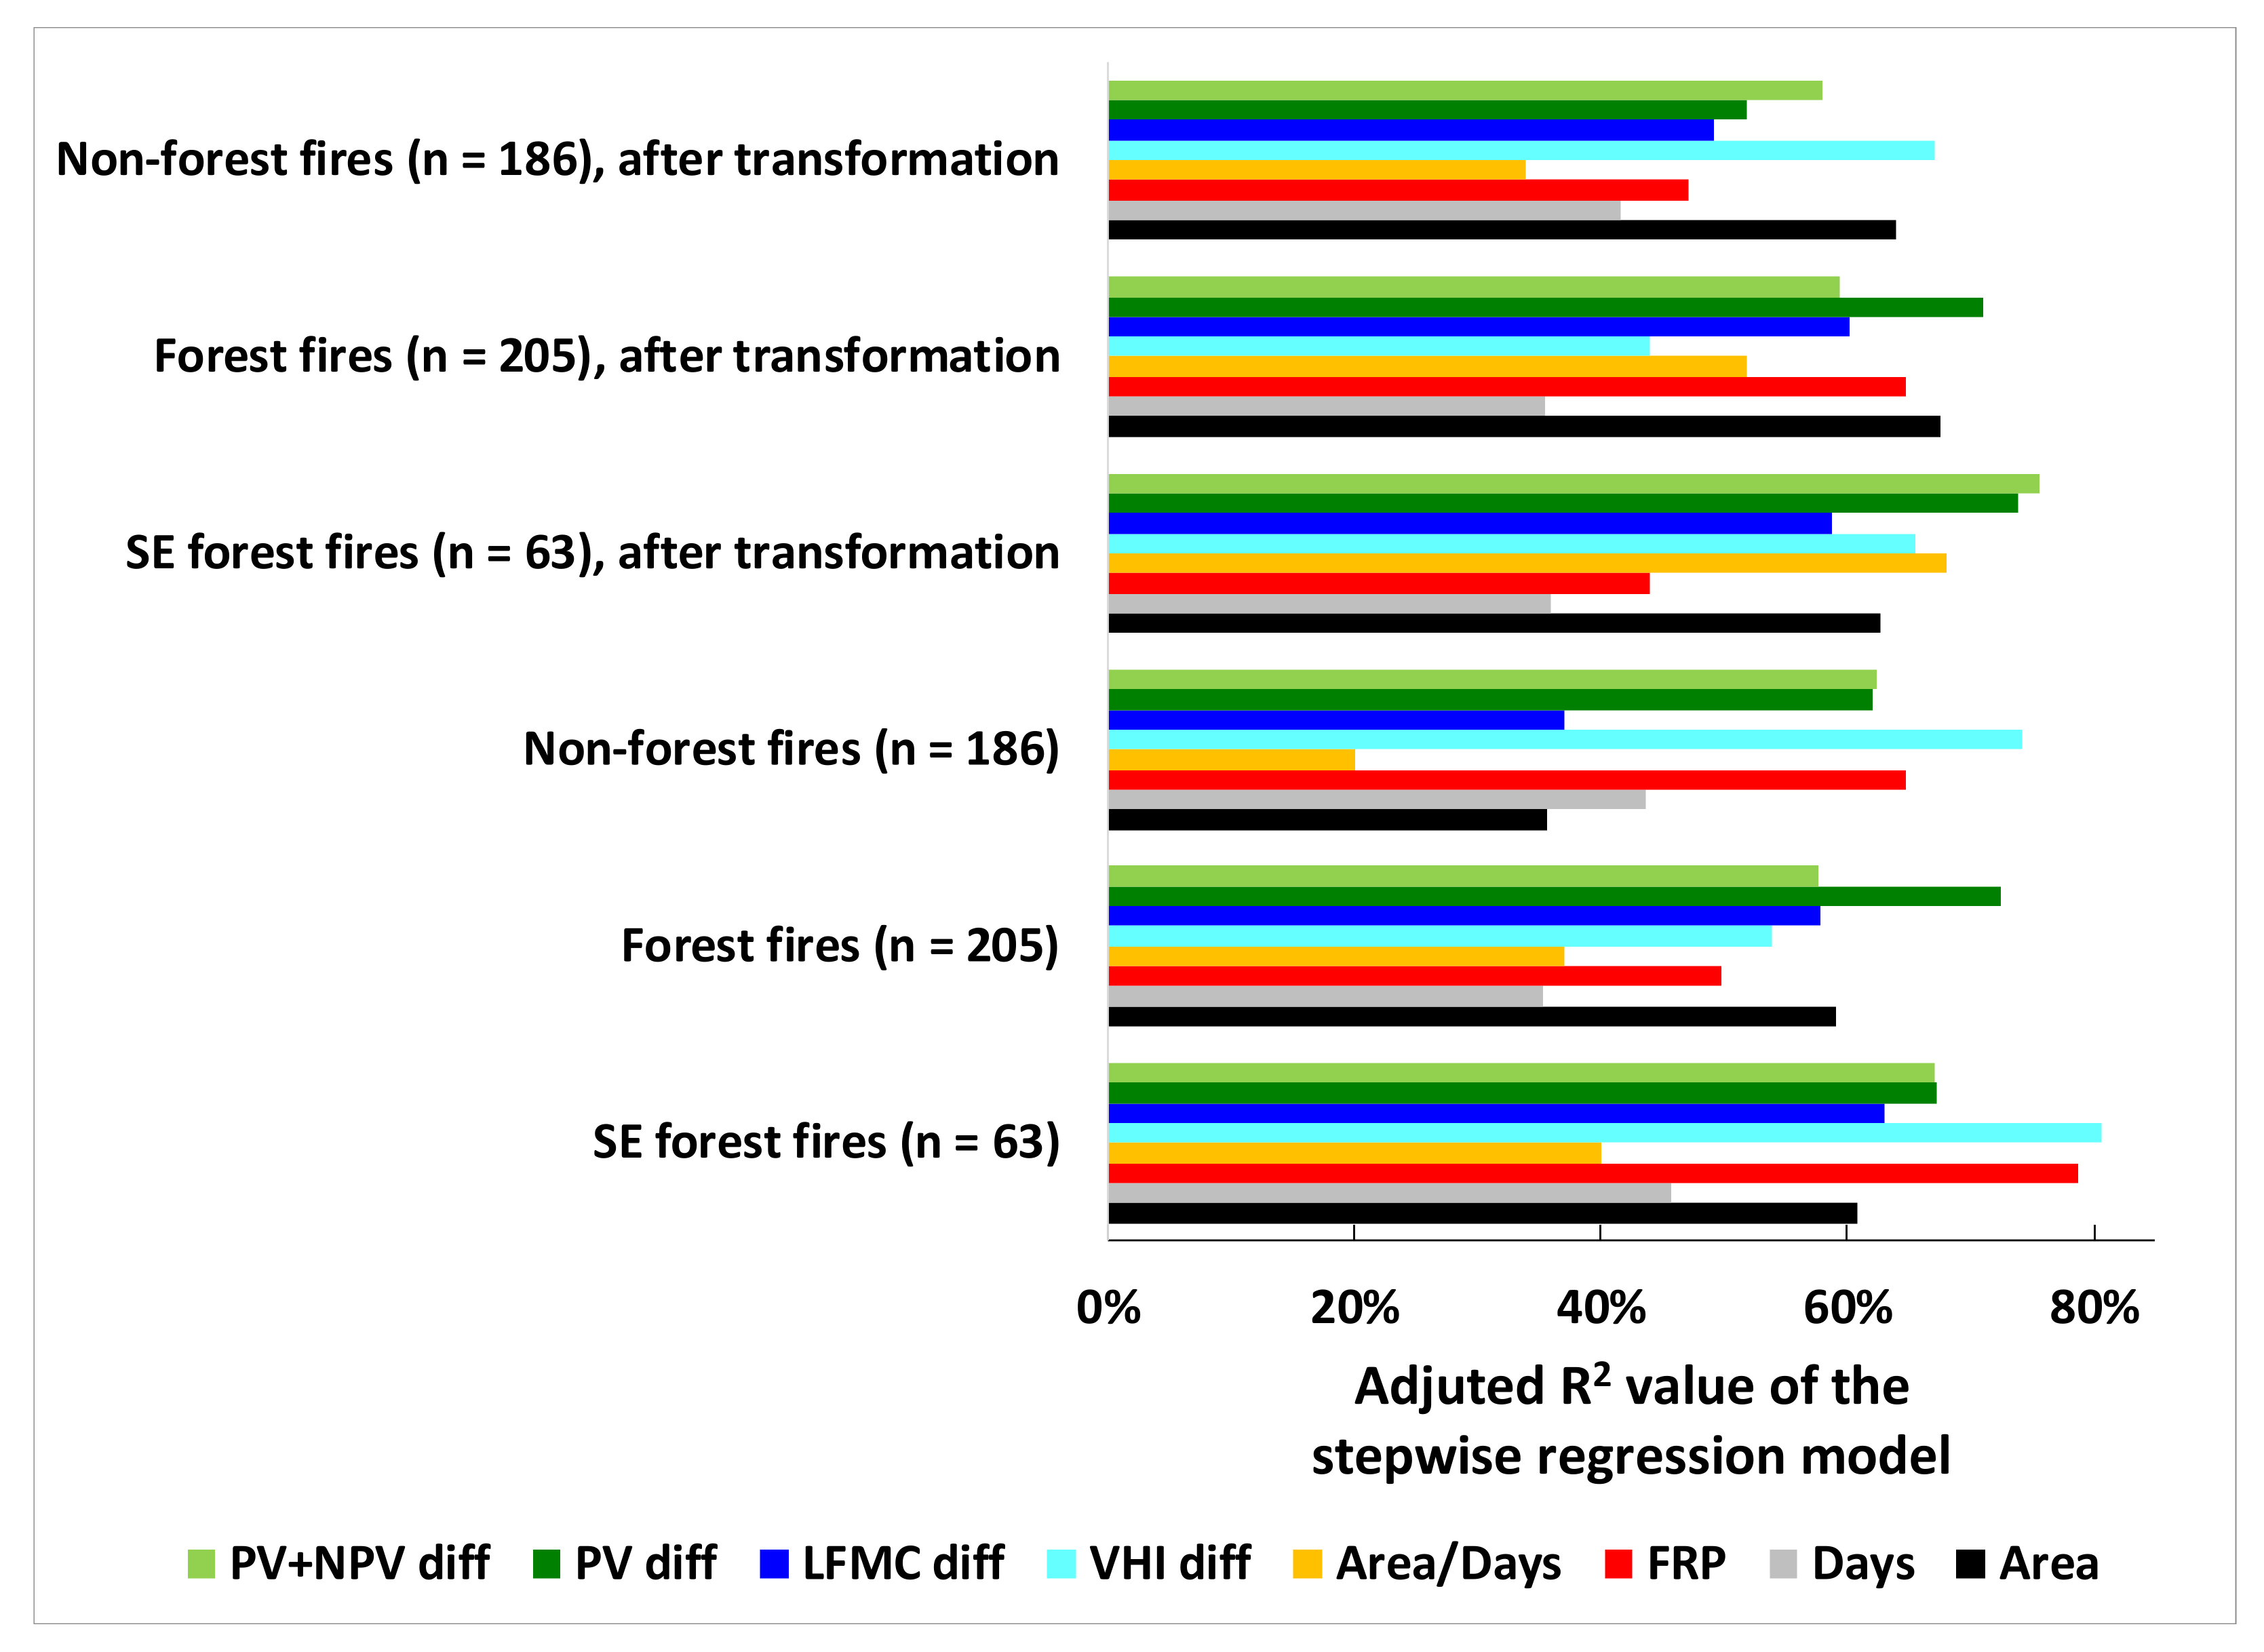
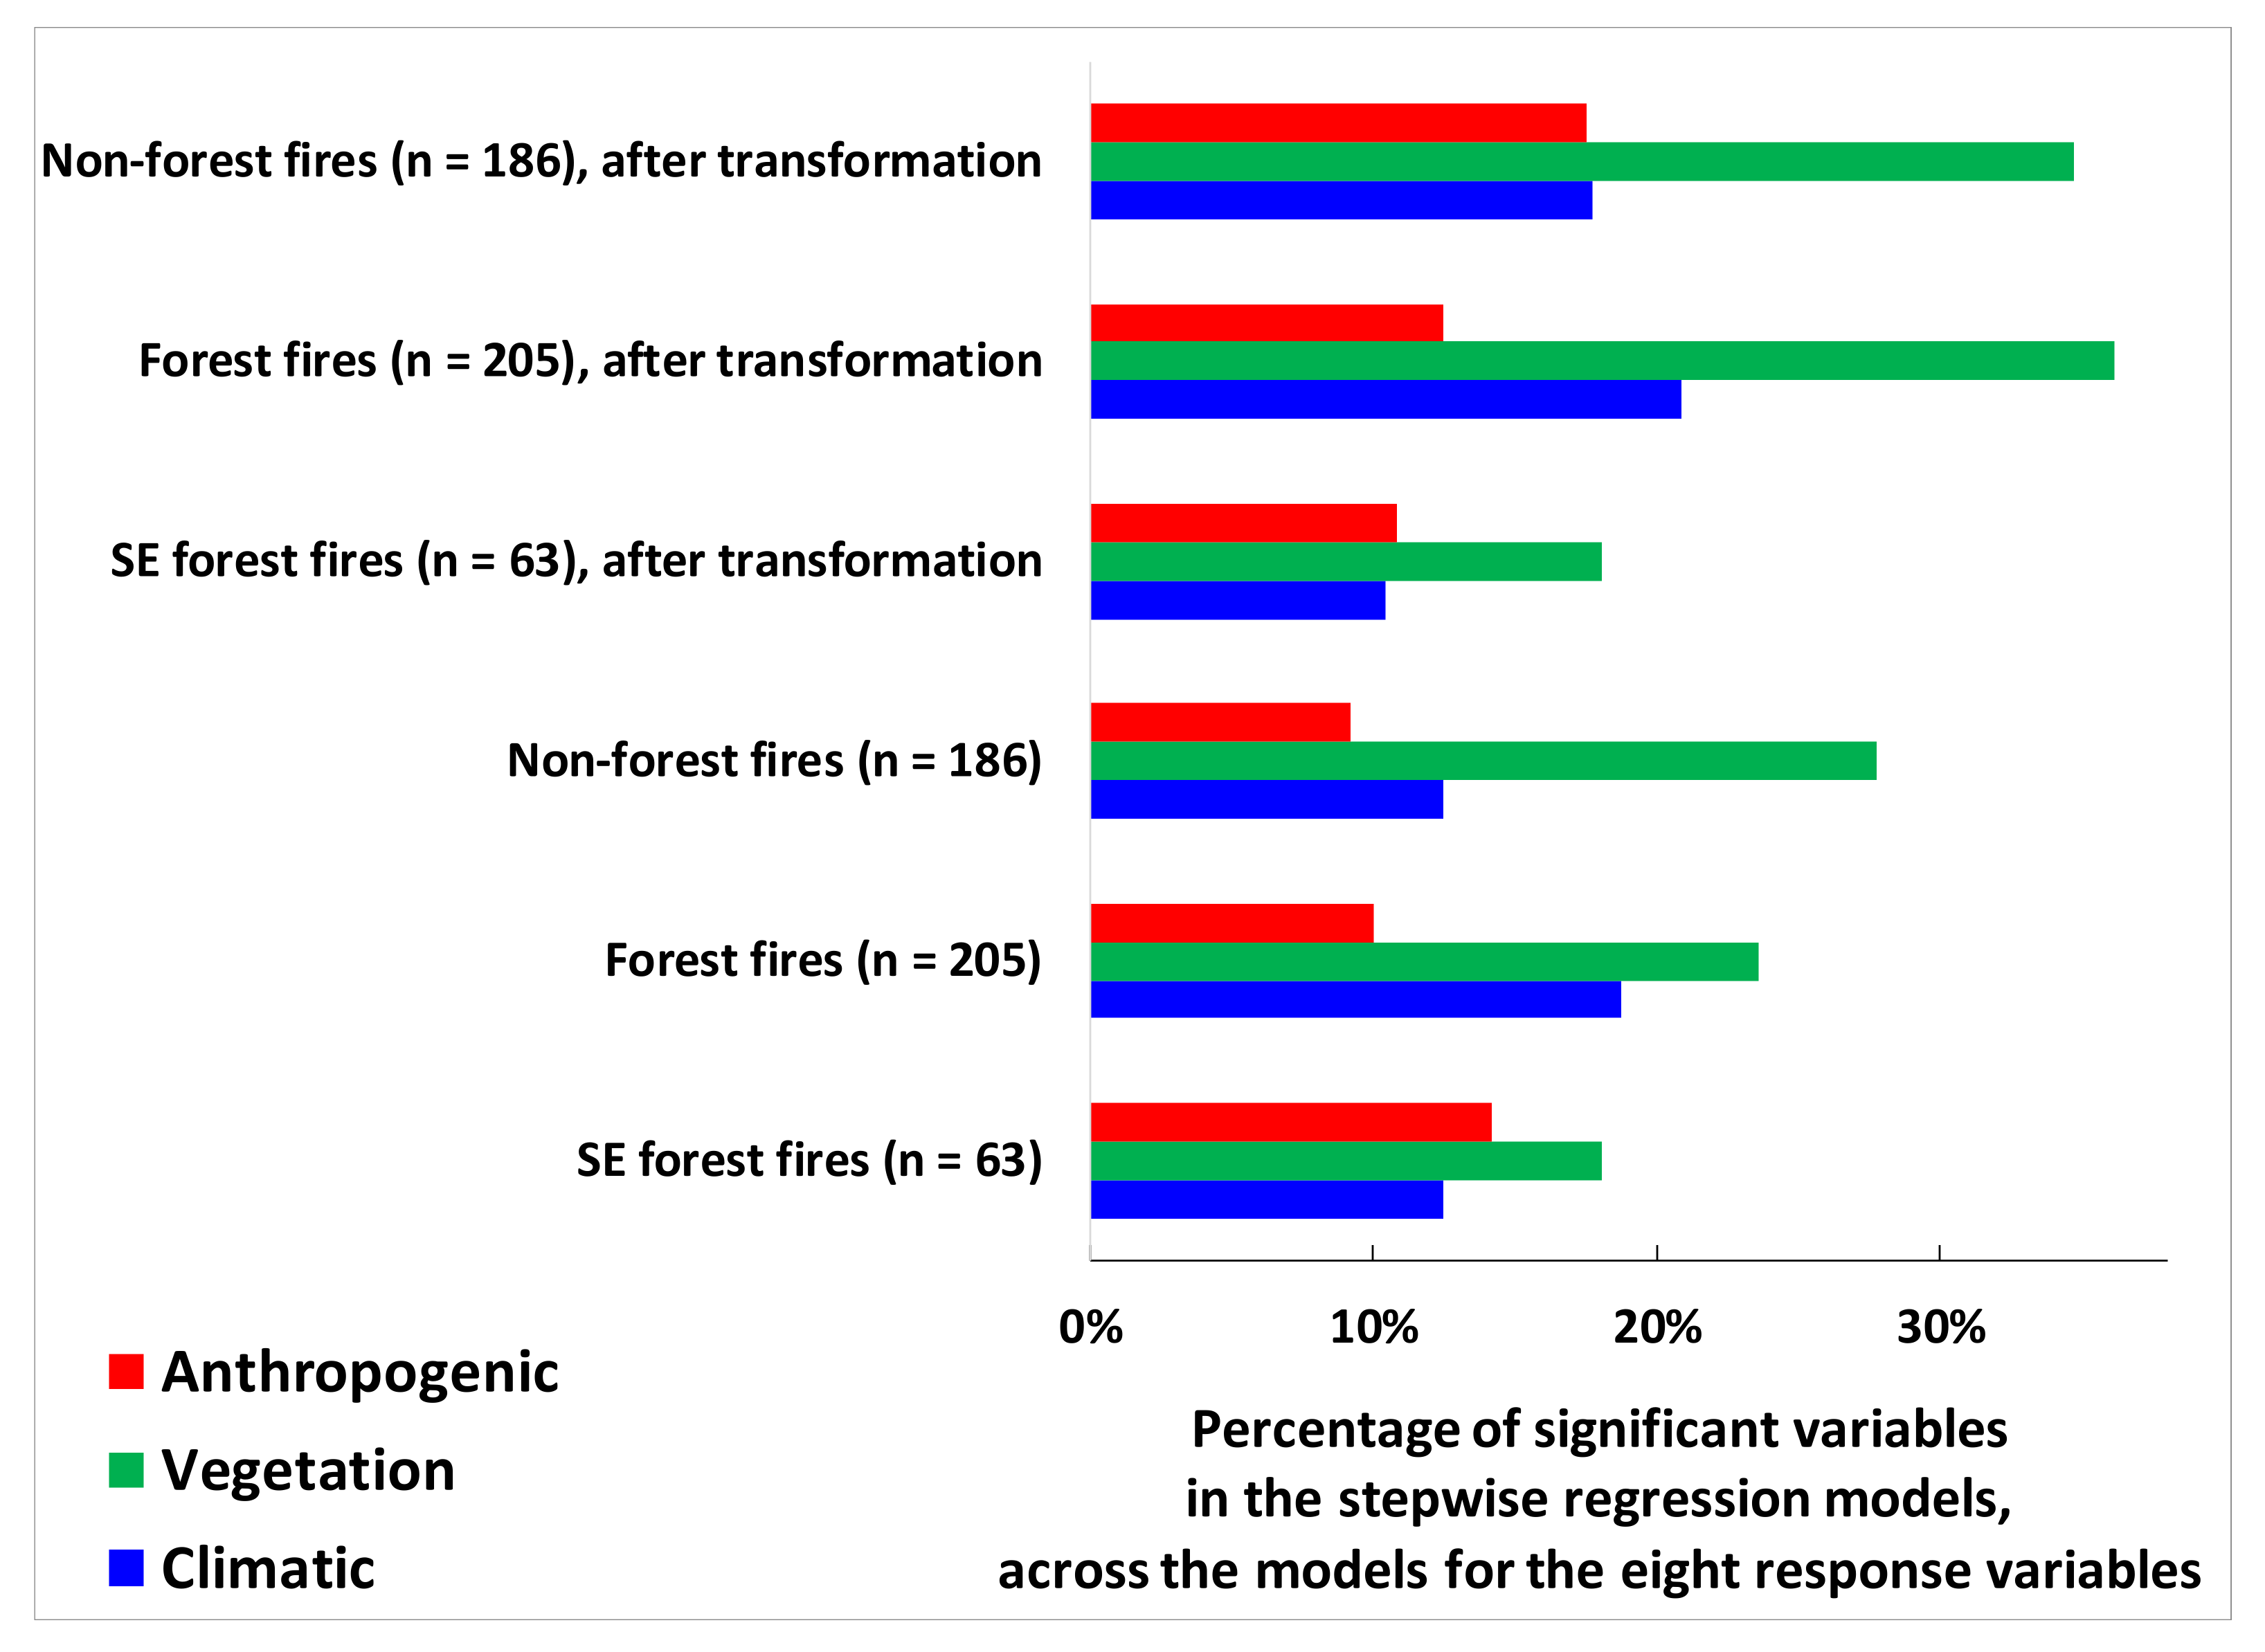
Table 1.
The response variables used in this study.
| Variable | Short Name | Comments | Source |
|---|---|---|---|
| Area | Area | Wildfire area based on burn date mapping from VIIRS active fires and the MODIS burnt area MCD64A1 product | |
| Days | Days | The number of days that it took for 90% of a wildfire to burn, based on burn date mapping from VIIRS active fires and the MODIS burnt area MCD64A1 product | |
| Fire radiative power | FRP | Average FRP values, as recorded for active fires detected by MODIS | https://firms.modaps.eosdis.nasa.gov/ (accessed 21 February 2020) |
| Change in Vegetation Health Index | VHI diff = VHI before–VHI after | Change in VHI, before and after the fire. This index is based on normalising the vegetation condition and temperature condition for each grid cell (4 km). The values of VHI range between 0 and 100. | https://www.star.nesdis.noaa.gov/smcd/emb/vci/VH/vh_ftp.php (accessed 13 February 2020) [50] |
| Change in Live Fuel Moisture Content | LFMC diff = LFMC before–LFMC min | Change in LFMC before the fire and the minimum value of LFMC while the fire was burning | Australian Flammability Monitoring System http://wenfo.org/afms/ (accessed 1 April 2020) [51] |
| Change in fractional cover of photosynthetic vegetation | PV diff = PV before–PV after | Change in PV before and after the fire | https://eo-data.csiro.au/remotesensing/v310/australia/8-day / (accessed 24 March 2020) [66] |
| Change in fractional cover of photosynthetic and non-photosynthetic vegetation | PV+NPV diff = PV+NPV before– PV+NPV after | Change in PV+NPV, before and after the fire | https://eo-data.csiro.au/remotesensing/v310/australia/8-day/ (accessed 24 March 2020) [66] |
| Fire Extent and Severity Mapping v. 2.1 | NSW FESM | Data available for the Black Summer fires in New South Wales | [54] https://data.gov.au/dataset/ds-nsw-c28a6aa8-a7ce-4181-8ed1-fd221dfcefc8/details?q= (accessed 13 May 2020) |
| Australia Google Earth Engine Burnt Area Map (GEEBAM) Fire Severity Map | AUS FESM | Data available for 351 out of the 391 Black Summer fires | [53] http://www.environment.gov.au/biodiversity/bushfire-recovery/research-and-resources (accessed 27 July 2020) |
Table 2.
The explanatory variables used in this study.
| Variable | Short Name | Comments | Source |
|---|---|---|---|
| Climlatic variables (12) | |||
| Biomes | % Area biomes 1,4,10 % Area biome 7 % Area biome 12 % Area biome 13 | Percentage of burnt area within WWF biomes (Figure 2) | [67] |
| Rainfall in the last year before the fire started | Rain last year | This variable will be a proxy of the amount of herbaceous vegetation (fine fuel accumulation) | ERA5 Daily aggregates—Latest climate reanalysis produced by ECMWF/Copernicus Climate Change Service https://developers.google.com/earth-engine/datasets/catalog/ECMWF_ERA5_DAILY#bands https://cds.climate.copernicus.eu/cdsapp#!/dataset/reanalysis-era5-single-levels?tab=overview (accessed 30 April 2020) |
| Rainfall in the last year before the fire started, relative to the average annual rainfall | Rain last year % | This variable will be a proxy of whether this was a drought year | |
| Days since last significant rainfall (week with more than 4% of annual rainfall) | Days since rain | This variable will indicate the drying of the vegetation since the last rainfall event | |
| Days since ignition until rainfall started (week with more than 4% of annual rainfall) | Days until rain | This variable may indicate how much time the fire had to burn until rainfall may have contributed to extinguishing the fire | |
| Fire Danger Index (FDI) | FDI start (FDI value when the fire started) FDIstart4max (FDI maximum value in the four days preceding the fire) FDI99pct (99 percentile of FDI within the burnt area during the fire) | Daily fire weather index, based on a drought factor, air temperature, wind speed and relative humidity. | [68] |
| Total lightning strikes during the fire, within the burnt area | Lightning strikes (lightning strikes per km2 per days the fire burnt) | This variable was not included in the multivariate analysis | The World Wide Lightning Location Network (WWLLN), http://wwlln.net/ (accessed 17 February 2020)[69] |
| Vegetation fuel variables (9) | |||
| Tree cover layer | Tree cover | The amount of tree cover within the wildfire polygon before the fire started (tree cover as of 2017) | http://dapds00.nci.org.au/thredds/catalog/ub8/au/treecover/250m/catalog.html (accessed 6 March 2020) |
| Continuity of vegetation within 10 km of the ignition | Forest continuity | Based on patches of tree cover (>90%), after a spatial filter of minimum 3 × 3, total sum within 10 km buffer of ignition. The greater the continuity of vegetation, the more area that can potentially burn. Based on the Australia tree cover layer (>90%) | |
| VHI LFMC PV PV+NPV | VHI start LFMC start PV start PV+NPV start | The average values of these variables within the area that eventually burnt, based on the temporally closest dataset when the wildfire started | |
| Frequency of fires in the previous 8 years | % Burnt 8 years (% of the wildfire area, which was burnt in the previous 8 years) Times burnt 8 years (number of times fires were detected within the wildfire area, in the previous 8 years, normalised by the fire area) | Based on the number of MODIS active fires that were detected from 2001 onwards | |
| Previously burnt areas by nearby wildfires | Burnt 25 km | Percentage of area burnt within 25 km of the ignition point in the previous eight months | Based on burn date mapping from VIIRS and MODIS |
| Anthropogenic variables (15) | |||
| Average distance to the nearest paved road (Motorway, Trunk, Primary, Secondary, Tertiary) within the burnt area | Dist roads (average distance from roads within the burnt area) Dist roads start (distance from roads where the fire started) | Open Street Map http://download.geofabrik.de/australia-oceania.html (accessed 5 March 2020) [70] | |
| Distance from electricity transmission lines | Dist electricity | Average distance within wildfire polygon to electricity transmission lines | https://data.gov.au/dataset/ds-ga-1185c97c-c042-be90-e053-12a3070a969b/details?q= (accessed 3 March 2020) |
| Population within 10 km of the ignition | Pop 10 km | https://landscan.ornl.gov/ (accessed 14 March 2020) [71] | |
| Total population size within the burnt area | Total pop (population in the burnt area) Mean pop (average population density in the burnt area) | https://landscan.ornl.gov/ (accessed 14 March 2020) [71] | |
| Aboriginal lands | % Indigenous PA % native title Y (percentage of burnt area within native title lands, where native title exists) % native title Y/N (percentage of burnt area within native title lands, whether it exists or does not exist) | Percentage of burnt area within indigenous protected areas and native title lands | http://www.nntt.gov.au/assistance/Geospatial/Pages/DataDownload.aspx https://www.environment.gov.au/land/nrs/science/capad (accessed 6 April 2020) |
| Protected areas (PA) | % PA | Percentage of burnt area within protected areas (based on the Collaborative Australian Protected Area Database, as of 2018) | https://www.environment.gov.au/land/nrs/science/capad (accessed 6 March 2020) |
| Dynamic Land Cover Dataset Version 2.1. | DLCD FAI DLCD FGI DLCD WUI | Used to calculate the forest–agricultural interface (FAI), forest–grassland interface (FGI), and wildland–urban interface (WUI), following [65]. See Table S1 for the codes used to calculate these interfaces. | [72] Geoscience Australia, Canberra. http://pid.geoscience.gov.au/dataset/ga/83868 (accessed 22 May 2020) |
| Land Use and Management Information for Australia | AGRI FAI AGRI WUI | https://www.agriculture.gov.au/abares/aclump (accessed 23 May 2020) | |
Table 3.
Average and standard deviation of the eight response variables describing fire properties for the forest and non-forest fires in the Black Summer and the forest fires in southeast Australia during the same period.
Table 3.
Average and standard deviation of the eight response variables describing fire properties for the forest and non-forest fires in the Black Summer and the forest fires in southeast Australia during the same period.
| Response Variables | Black Summer Non-Forest Fires n = 186 | Black Summer Forest Fires n = 205 | Black Summer Forest Fires in SE Australia n = 63 |
|---|---|---|---|
| Area (km2) | 445 (±607) | 584 (±1137) | 1097 (±1864) |
| Days 90% (days) | 8.5 (±6.6) | 17.5 (±12.4) | 22.2 (±13.8) |
| FRP M6 MODIS (MW) | 97 (±85) | 100 (±93) | 118 (±104) |
| Area 90%/Days 90% (km2/day) | 54 (±50) | 33 (±42) | 48 (±63) |
| Change in vegetation health index (VHI) (%) | 16.2 (±14.7) | 21.7 (±13.5) | 18.0 (±14.2) |
| Change in live fuel moisture content (LFMC) (%) | 11.8 (±11.2) | 14.2 (±19.2) | 26.6 (±23.9) |
| Change in photosynthetic vegetation (PV) (%) | 4.6 (±3.4) | 15.6 (±8.6) | 22.6 (±8.2) |
| Change in PV and non-PV (NPV) (%) | 19.4 (±6.6) | 18.5 (±5.4) | 14.8 (±5.0) |
| AUS FESM (%) | 54.4 (±25.6) | 80.1 (±45.0) | 117.6 (±37.9) |
Table 4.
Spearman correlation coefficient matrix between the response variables for the forest fires of the Black Summer in SE Australia (n = 63). Data for the NSW FESM severity index was only available for the fires in New South Wales (n = 45). The statistical significance of the correlations is given by asterisks (*** p < 0.001; ** p < 0.01; * p < 0.05).
| Area | Days | FRP M6 MODIS | Area/Days | Change in VHI | Change in LFMC | Change in PV | Change in PV+NPV | AUS FESM | NSW FESM | |
|---|---|---|---|---|---|---|---|---|---|---|
| Area (km2) | 0.30 * | 0.15 | 0.74 *** | 0.23 | 0.45 *** | 0.44 *** | 0.26 * | 0.42 *** | 0.24 | |
| Days | −0.56 *** | −0.29 * | 0.06 | 0.36 ** | 0.06 | −0.22 | −0.12 | −0.37 * | ||
| FRP M6 MODIS (MW) | 0.53 *** | 0.20 | −0.05 | 0.38 ** | 0.59 *** | 0.52 *** | 0.65 *** | |||
| Area/Days (km2/day) | 0.23 | 0.23 | 0.43 *** | 0.51 *** | 0.42 ** | 0.43 ** | ||||
| Change in vegetation health index) (%) | 0.37 ** | 0.50 *** | 0.34 ** | 0.19 | 0.18 | |||||
| Change in live fuel moisture content (LFMC) (%) | 0.60 *** | −0.08 | 0.05 | −0.16 | ||||||
| Change in photosynthetic vegetation (PV) (%) | 0.44 *** | 0.39 ** | 0.28 | |||||||
| Change in PV and non-PV (NPV) (%) | 0.52 *** | 0.69 *** | ||||||||
| AUS FESM | 0.65 *** |
Publisher’s Note: MDPI stays neutral with regard to jurisdictional claims in published maps and institutional affiliations. |
© 2021 by the authors. Licensee MDPI, Basel, Switzerland. This article is an open access article distributed under the terms and conditions of the Creative Commons Attribution (CC BY) license (https://creativecommons.org/licenses/by/4.0/).
Share and Cite
MDPI and ACS Style
Levin, N.; Yebra, M.; Phinn, S. Unveiling the Factors Responsible for Australia’s Black Summer Fires of 2019/2020. Fire 2021, 4, 58. https://0-doi-org.brum.beds.ac.uk/10.3390/fire4030058
AMA Style
Levin N, Yebra M, Phinn S. Unveiling the Factors Responsible for Australia’s Black Summer Fires of 2019/2020. Fire. 2021; 4(3):58. https://0-doi-org.brum.beds.ac.uk/10.3390/fire4030058
Chicago/Turabian StyleLevin, Noam, Marta Yebra, and Stuart Phinn. 2021. "Unveiling the Factors Responsible for Australia’s Black Summer Fires of 2019/2020" Fire 4, no. 3: 58. https://0-doi-org.brum.beds.ac.uk/10.3390/fire4030058