
Numerical Analysis of Seismic Performances of Post-Fire Scoria Aggregate Concrete Beam-Column Joints


1
School of Civil Engineering, Jilin Jianzhu University, Changchun 130118, China
2
School of Mathemaics, Computer Science and Engineering, University of London, London EC1V 0HB, UK
*
Author to whom correspondence should be addressed.
Fire 2021, 4(4), 70; https://0-doi-org.brum.beds.ac.uk/10.3390/fire4040070
Submission received: 31 August 2021
/
Revised: 1 October 2021
/
Accepted: 9 October 2021
/
Published: 14 October 2021
(This article belongs to the Collection Technical Forum for Fire Science Laboratory and Field Methods)
Abstract
:In order to analyze the post-fire seismic performances of scoria aggregate concrete (SAC) beam-column joints precisely and effectively, one finite element model (FEM) was developed to simulate the seismic behavior of SAC beam-column joints. The FEM consists of two sequential parts: firstly, the heat transfer analysis of the beam-column joints, and then the seismic analysis of the SAC joints by combining the temperature field distribution obtained from the heat transfer analysis with the mechanical properties of the SAC after fire, both of which were implemented in ABAQUS. In order to make the simulation results more accurate, spring elements were applied to simulate the bond–slip behavior with material degradation due to fire damage in the simulation of seismic analysis. Moreover, in order to validate the FEM, the seismic behavior of the natural aggregate concrete (NAC) beam-column joints after fire was simulated with the established FEM, and the simulation results were compared with the available test data. It is proved that the FEM we built was accurate and effective and provided efficient solutions for evaluating the seismic performance of post-fire beam-column joints so that the effects of various parameters, namely, fire time, longitudinal reinforcement ratio, and axial compression ratio on the seismic performance of SAC beam-column joints after fire were investigated in depth, which indicated the increase of axial compression ratio can improve the strength, initial stiffness, and energy dissipation capacity of SAC joints, while the increase of longitudinal reinforcement ratio can increase the strength and stiffness of SAC joints to a small extent, but too high reinforcement ratio will significantly weaken the energy dissipation capacity of SAC joints.
1. Introduction
The rapid growth of the global economy has led to an increase in the density of urban buildings and of the facility circuits and gas pipelines in the city. When a city is hit by an earthquake, the fracture of public facility circuits and gas pipelines is apt to trigger fires. Moreover, the fire will last for a long time due to the breakdown of traffic, communication, water, and other systems. Prolonged exposure to fire may significantly diminish the performance of structural materials, thereby affecting structural integrity. In this case, buildings are likely to suffer significant damage or even collapse in the subsequent aftershocks. Therefore, it is of great theoretical significance and practical value to systematically research the seismic performance of structures after they have been subjected to fire [1,2].
So far, extensive experimental research has been conducted on the mechanical properties and seismic performance of structural components after exposure to fire. Al-Ameri conducted an experimental study to evaluate the effect of high temperatures on mechanical properties and repeated impact strength of normal strength concrete [3]. The results revealed that the compressive strength was increased by less than 2% after exposure to 100 °C, while it reduced to approximately 50% of the original strength at 600 °C; the impact strength decreased sharply by 74.2% after exposure to 200 °C. Krzysztof studied the thermal and mechanical properties of perlite concrete after exposure to fire and concluded that the thermal load decreased the compressive strength of the perlite concrete blocks; the efficiency of recovering heat from the blocks reached 23–30% [4].
Through the results of axial and biaxial bending tests of reinforced concrete (RC) columns after different duration of fire exposure, Chen et al., found that the residual load-bearing capacity decreased as fire exposure time increased, and the average reductions in ultimate loads were 27% and 38% for fire exposure times of 2 and 4 h, respectively [5]. Xu et al., found that the shear capacity of RC short columns decreased with the increase of fire exposure time and increased with the increase of axial compression ratio through the quasi-static test [6]. Sun et al., carried out the quasi-static tests of super early strength composite fiber RC columns at different temperatures. It was found that the downward trends of hysteretic curves and skeleton curves were the same, but the downward trends were discrepant in different time periods [7]. Li et al., carried out a quasi-static test on an RC frame with a different ratio of beam-to-column after fire under low-frequency cyclic load. The experimental results indicated that the ultimate bearing capacity, the stiffness, the ductility factor, and the energy dissipation capacity of the RC frames decreased after exposure to fire; additionally, the hysteretic loops for the post-fire RC frames were not as full as the corresponding unfired frames and they showed remarkable pinching, which indicated that the seismic performance of the specimens decreased after exposure to fire [8].
Since the earthquake forces affecting structures and buildings are proportional to the structural mass, reducing the self-weight of structures is one of the solutions to reduce the damage caused by earthquakes. Light aggregate concrete has been increasingly used in large-span structures and high-rise buildings because of its low density, low thermal conductivity, and good fire resistance [9]. The application of lightweight aggregates in seismic structures has also been extensively studied. Bo et al., investigated the effects of joint type, axial compression ratio, the stirrup ratio in the joint cores, and longitudinal reinforcement ratio on the strength, stiffness, and energy dissipation capacity of recycled aggregate concrete beam-column joints, and the results demonstrated that the increase of axial load could increase the strength, initial stiffness, ductility, and energy dissipation capacity, thus improving the seismic performance of joints; the increase of longitudinal reinforcement ratio could increase the strength of joints, but it would significantly decrease the ductility and energy dissipation capacity of joints [10]. Faleschini et al., investigated the seismic performance of electric arc furnace (EAF) concrete beam-column joints whose results illustrated that EAF concrete could provide higher load-bearing capacity for beam-column joints on a “sustainable development” basis and that the energy dissipation capacity of EAF concrete joints was better than that of ordinary concrete joints [11]. Xu et al., compared the seismic performance of cold-formed steel (CFS) shear walls incorporating high-strength lightweight foamed concrete (HLFC) with that of ordinary cold-formed steel and found that the use of HLFC reduced the weight and bearing capacity of shear walls by 59.4% and 24.6%, respectively, which indicated that the application of HLFC in cold-formed steel shear walls significantly reduced the resultant self-weight to improve the structural seismic performance while also leading to a small decrease in structural load carrying capacity [12].
As a kind of lightweight aggregate, scoria aggregate can not only improve the seismic performance of the structure due to its light weight but also improve the mechanical properties of the structure after fire due to its excellent heat insulation and heat resistance [13]. In addition, Jilin Province in China has the maximum reserves of scoria aggregate in the country, and the reserves in Huinan County alone are 800 million m³ [14]. Therefore, research on the seismic performance of SAC structures after fire can not only promote the development of research on the seismic performance of lightweight aggregate structures after fire but also save an army of energy for the country and drive the economic growth of the local construction market in Jilin, which brings substantial social and economic benefits to the individuals.
The best way to investigate the seismic behavior of structures is experimental investigations [15]. However, the tests of RC structural components under earthquake loads require good economic conditions and time costs. Consequently, numerical investigations into this topic are indispensable. Shuna performed a numerical analysis to quantify the impact of fire damage on the seismic resistance of flexure-controlled RC structural walls. Additionally, the numerical method was validated against tests of fire-damaged RC walls subject to lateral reversed-cyclic loads [16]. Faleschini et al., analyzed the seismic performance of EAF concrete beam-column joints using an FEM and concluded that the increase in both axial load and column transverse reinforcement ratio improved the seismic performance [17]. Do, T. N. presented a hysteretic damage model that was suitable for the large-scale seismic response simulation of structural systems with strength and stiffness deterioration [18]. Fabio Mazza presented a nonlinear model based on plastic and damage mechanisms for seismic analysis of inelastic structures [19]. Fabio Mazza carried out a series of numerical investigations on six-storey RC base-isolated framed buildings, and the results indicated fire exposure before an earthquake confirms the significant reduction of the mechanical and geometrical properties of High-Damping-Laminated-Rubber Bearings (HDLRBs) and Lead-Rubber Bearings (LRBs), inducing amplification in the structural response of base-isolated structures; seismic retrofit with hysteretic damped braces (HYDBs) represents a satisfactory means of reducing the ductility demand [20,21].
The conventional FEMs for RC seismic performances neglected the bond–slip relationship between rebars and concrete, but the bond failure between them is one of the major causes for the reduction of structural seismic performance [22]. Thus, the seismic performances of structural components were usually overestimated. Nevertheless, there has been a limited number of numerical investigations that have presented FEMs taking bond failure between rebars and lightweight concrete [23,24,25], much less numerical investigations about the impact of fire exposure on bond failure between rebars and lightweight concrete.
To this end, aiming at the seismic performance of SAC beam-column joints after the fire exposure, this paper presented a FEM based on ABAQUS. The post-fire seismic analysis of SAC column joints consisted of thermal analysis and seismic analysis. The thermal analysis captured the temperature distribution of joints during the fire exposure. The temperature was used to establish the modified mechanical material properties of the concrete, which were subsequently used in the seismic analysis. Additionally, the FEM was validated by referring to the dissertation of Wang et al. [26].
2. Analysis Procedure
The seismic response of a SAC joint after fire is greatly affected by the temperature distribution when it is in fire. Therefore, the post-fire seismic behaviors of SAC beam-column joints were analyzed by sequentially thermal and mechanical analysis available in ABAQUS. The process is as follows:
- (1)
- Heat transfer analysis: the heat transfer analysis was performed first in ABAQUS to determine the temperature distributions of the joints. This type of analysis is used when the stress or deformation field in a structure depends on the temperature field in that structure, but the temperature field can be found without knowledge of the stress/deformation response. Additionally, this type of analysis is usually performed by first conducting an uncoupled heat transfer analysis and then a stress/deformation analysis.
- (2)
- Seismic analysis: after the thermal damage of both rebars and SAC was both transmitted to the mechanical model, the seismic analysis considering thermal degradation of the material was implemented. However, the mechanical properties of SAC after fire needed to be measured experimentally. For this reason, before simulating the seismic performance of SAC beam-column joints, an experiment to get the mechanical properties of SAC after fire was designed and conducted in this paper.
- (3)
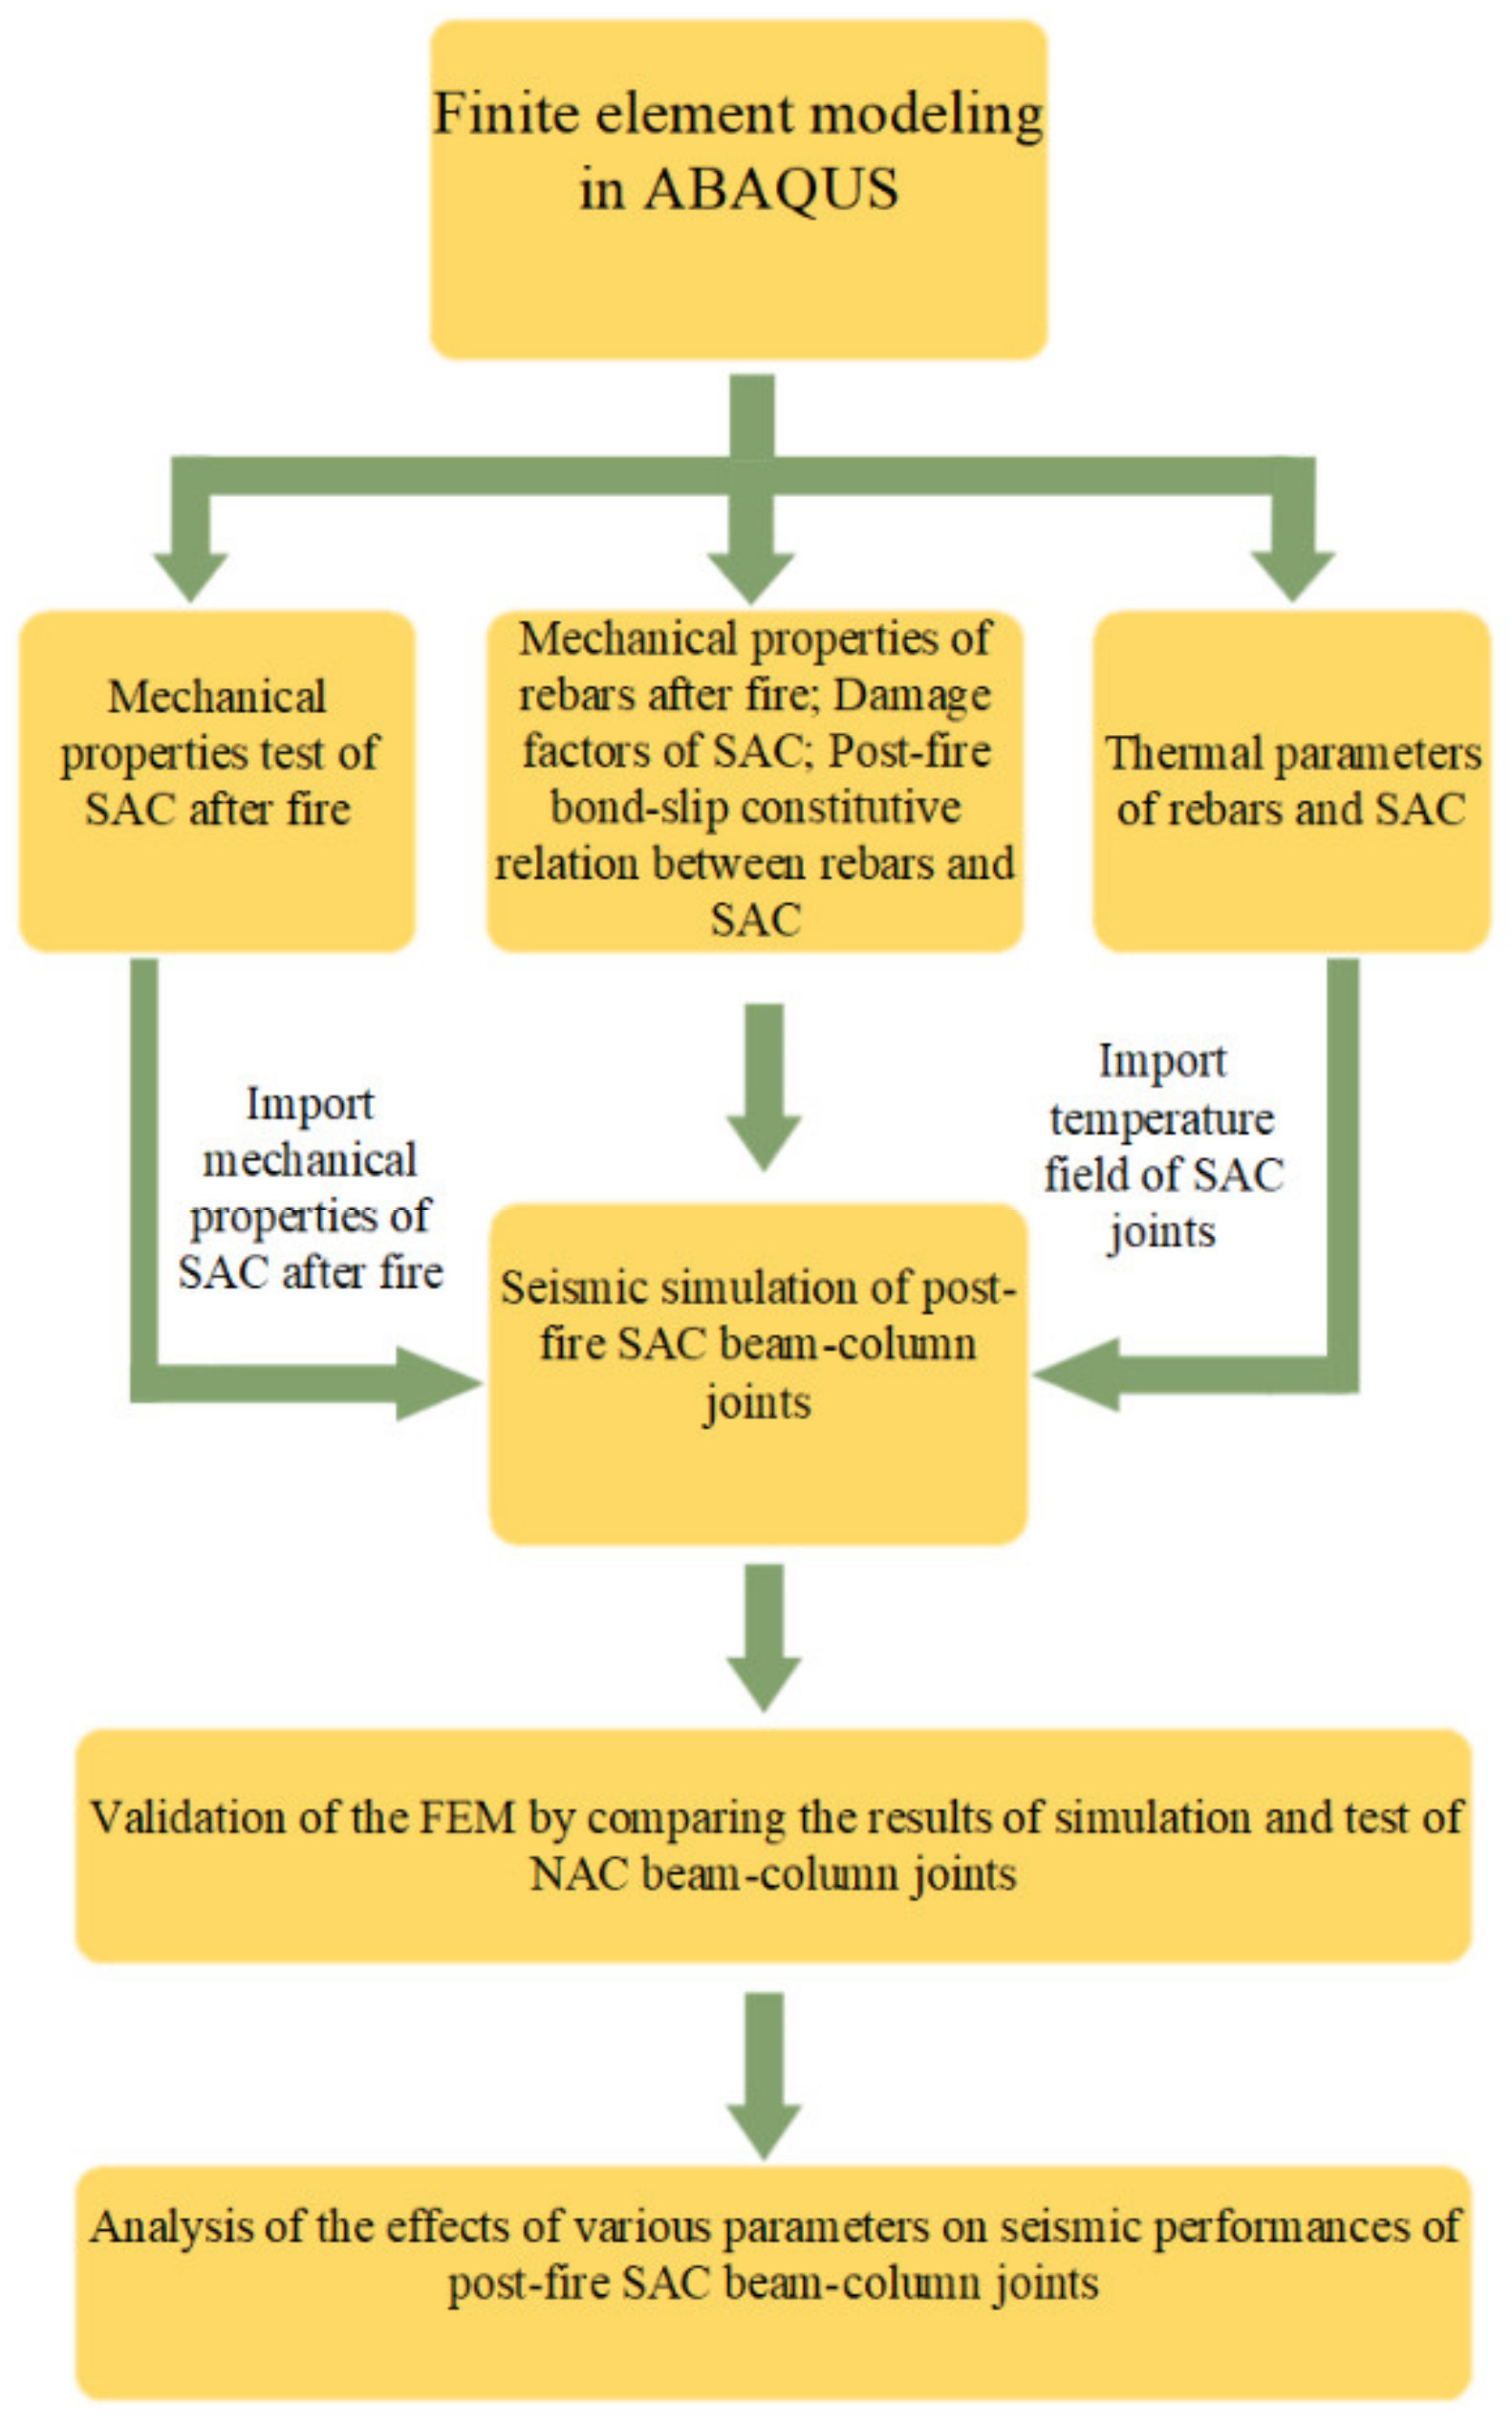
- Validation: to validate the FEM, the results of seismic performance of post-fire NAC joints simulated by the same FEM were compared with the test data of the reference [26] and analyzed. On the basis of this, effects of various parameters on the seismic performance of SAC beam-column joints after fire were investigated in depth reasonably. The workflow is shown in Figure 1.
3. Heat Transfer Analysis of SAC Joints
Since the post-fire performances of real structures are related to both thermal and seismic loading, the effects of fire load density, fire exposure duration, and boundary conditions on the temperature field of SAC beam-column joints were all considered in the simulation. Based on real fire temperature curve, the temperature distribution was simulated according to specific working conditions in the FEM.
3.1. Thermal Material Modelling for SAC
To analyze the temperature fields of SAC beam-column joints, thermal parameters of materials were first determined. The longitudinal reinforcement of the beams and columns in the model was HRB400, while the hoop reinforcement in the beams and columns was HPB300. The thermal parameters of rebars, namely, thermal conductivity and specific heat capacity, were determined following the Eurocode 4, which displayed more realistic results when the temperature fields for RC beams were simulated [27]. Additionally, the thermal parameters of SAC were determined following the formulas for the thermal parameters of lightweight aggregate concrete (LAC) in Eurocode 2 because SAC is one kind of LAC [14,28].
Due to the evaporation of free water, the density of concrete drops after 100 °C but not significantly, which was thus ignored during our computation. Thus, the density of SAC was regarded as constant at ρ = 1900 kg/m3 [29].
3.2. Heat Transferring Analysis in ABAQUS
The numerical model for heat transfer analysis was established in ABAQUS to capture the temperature distribution of RC structural members after exposure to fire. In order to simulate the fire scene more realistically, parametric fire curves from Eurocode 4 were used in the analysis [27]. When structural members were exposed to fire, the heat was transferred to the structural members through convection and radiation [30,31,32,33,34]. The convection coefficients for the exposed and non-exposed surfaces were set as 1500 and 540 J/(min·m²·°C), respectively; the comprehensive radiation coefficient was 0.5, the absolute zero temperature was −273.15 °C, and the Stefan–Boltzmann constant was 3.402 × 10⁻⁶ J/(min·m²·°C4) [35]. The major internal heat transfer inside structural components is conduction.
The SAC members were simulated by using DC3D8 8-node linear hexahedron heat transfer elements, and rebars were simulated by using DC1D2 2-node heat transfer elements. The thermal resistance between rebars and SAC is very low and does not largely affect the temperature fields. Thus, they were ignored.
4. Post-Fire Seismic Analysis of SAC
The results from the heat transferring analysis model were input into the subsequent post-fire seismic analysis using the sequential thermodynamic coupled analysis function available in ABAQUS. Post-fire structural damages of the SAC components are the basis of the further seismic analysis. The mechanical properties of rebars and SAC are both degraded during the fire, including the strength and elastic modulus. Therefore, the seismic performances of structural components and the overall structure are also deteriorated. To replicate these effects, appropriate thermomechanical damage model, element types, contact relations, and mesh sizes needed to be first determined.
4.1. Thermomechanical Damage Modeling for SAC
During post-fire seismic performance simulation, the damage to the mechanical properties due to temperature should be considered. Thus, the damage material model to be used in the simulation should be determined.
Scoria aggregate as a kind of high-quality light aggregate has better thermal resistance than natural aggregate so that the trend in the mechanical properties of SAC when subjected to fire is clearly different from that of NAC. The decisive factor in bringing out this difference in the FEM is the thermomechanical damage model of the concrete. In order to determine the mechanical damage model of SAC after fire, we designed and carried out tests to investigate the mechanical properties of SAC after high temperatures and recorded and analyzed the results.
4.1.1. Test Program
A total of 55 specimens of SAC was prepared as 100 mm × 100 mm × 100 mm cubic specimens and 100 mm × 100 mm × 300 mm prismatic specimens. The test instrumentation follows reference [35,36,37,38,39]. Of these, 30 cubic specimens were used for compressive and splitting tensile strength tests and 25 prismatic specimens were used for constitutive relationship tests. The specimens were divided into five groups according to various temperatures: 20 °C, 200 °C, 400 °C, 600 °C, and 800 °C, respectively. Another 55 test blocks of the same specification of NAC were prepared as the control group.
The uniaxial compressive stress-strain relationship of SAC after exposure to high temperatures, and the peak strain, modulus of elasticity, ultimate strain, and splitting tensile strength of SAC after different temperatures, were obtained by extracting the test results. Based on the regression analysis, the variations of cubic compressive strength, splitting tensile strength, peak strain, ultimate strain, and modulus of elasticity of SAC with temperature were obtained.
4.1.2. Material Simulation through Experimental Tests Results Regression
- (1)
- Compressive and splitting tensile strengths
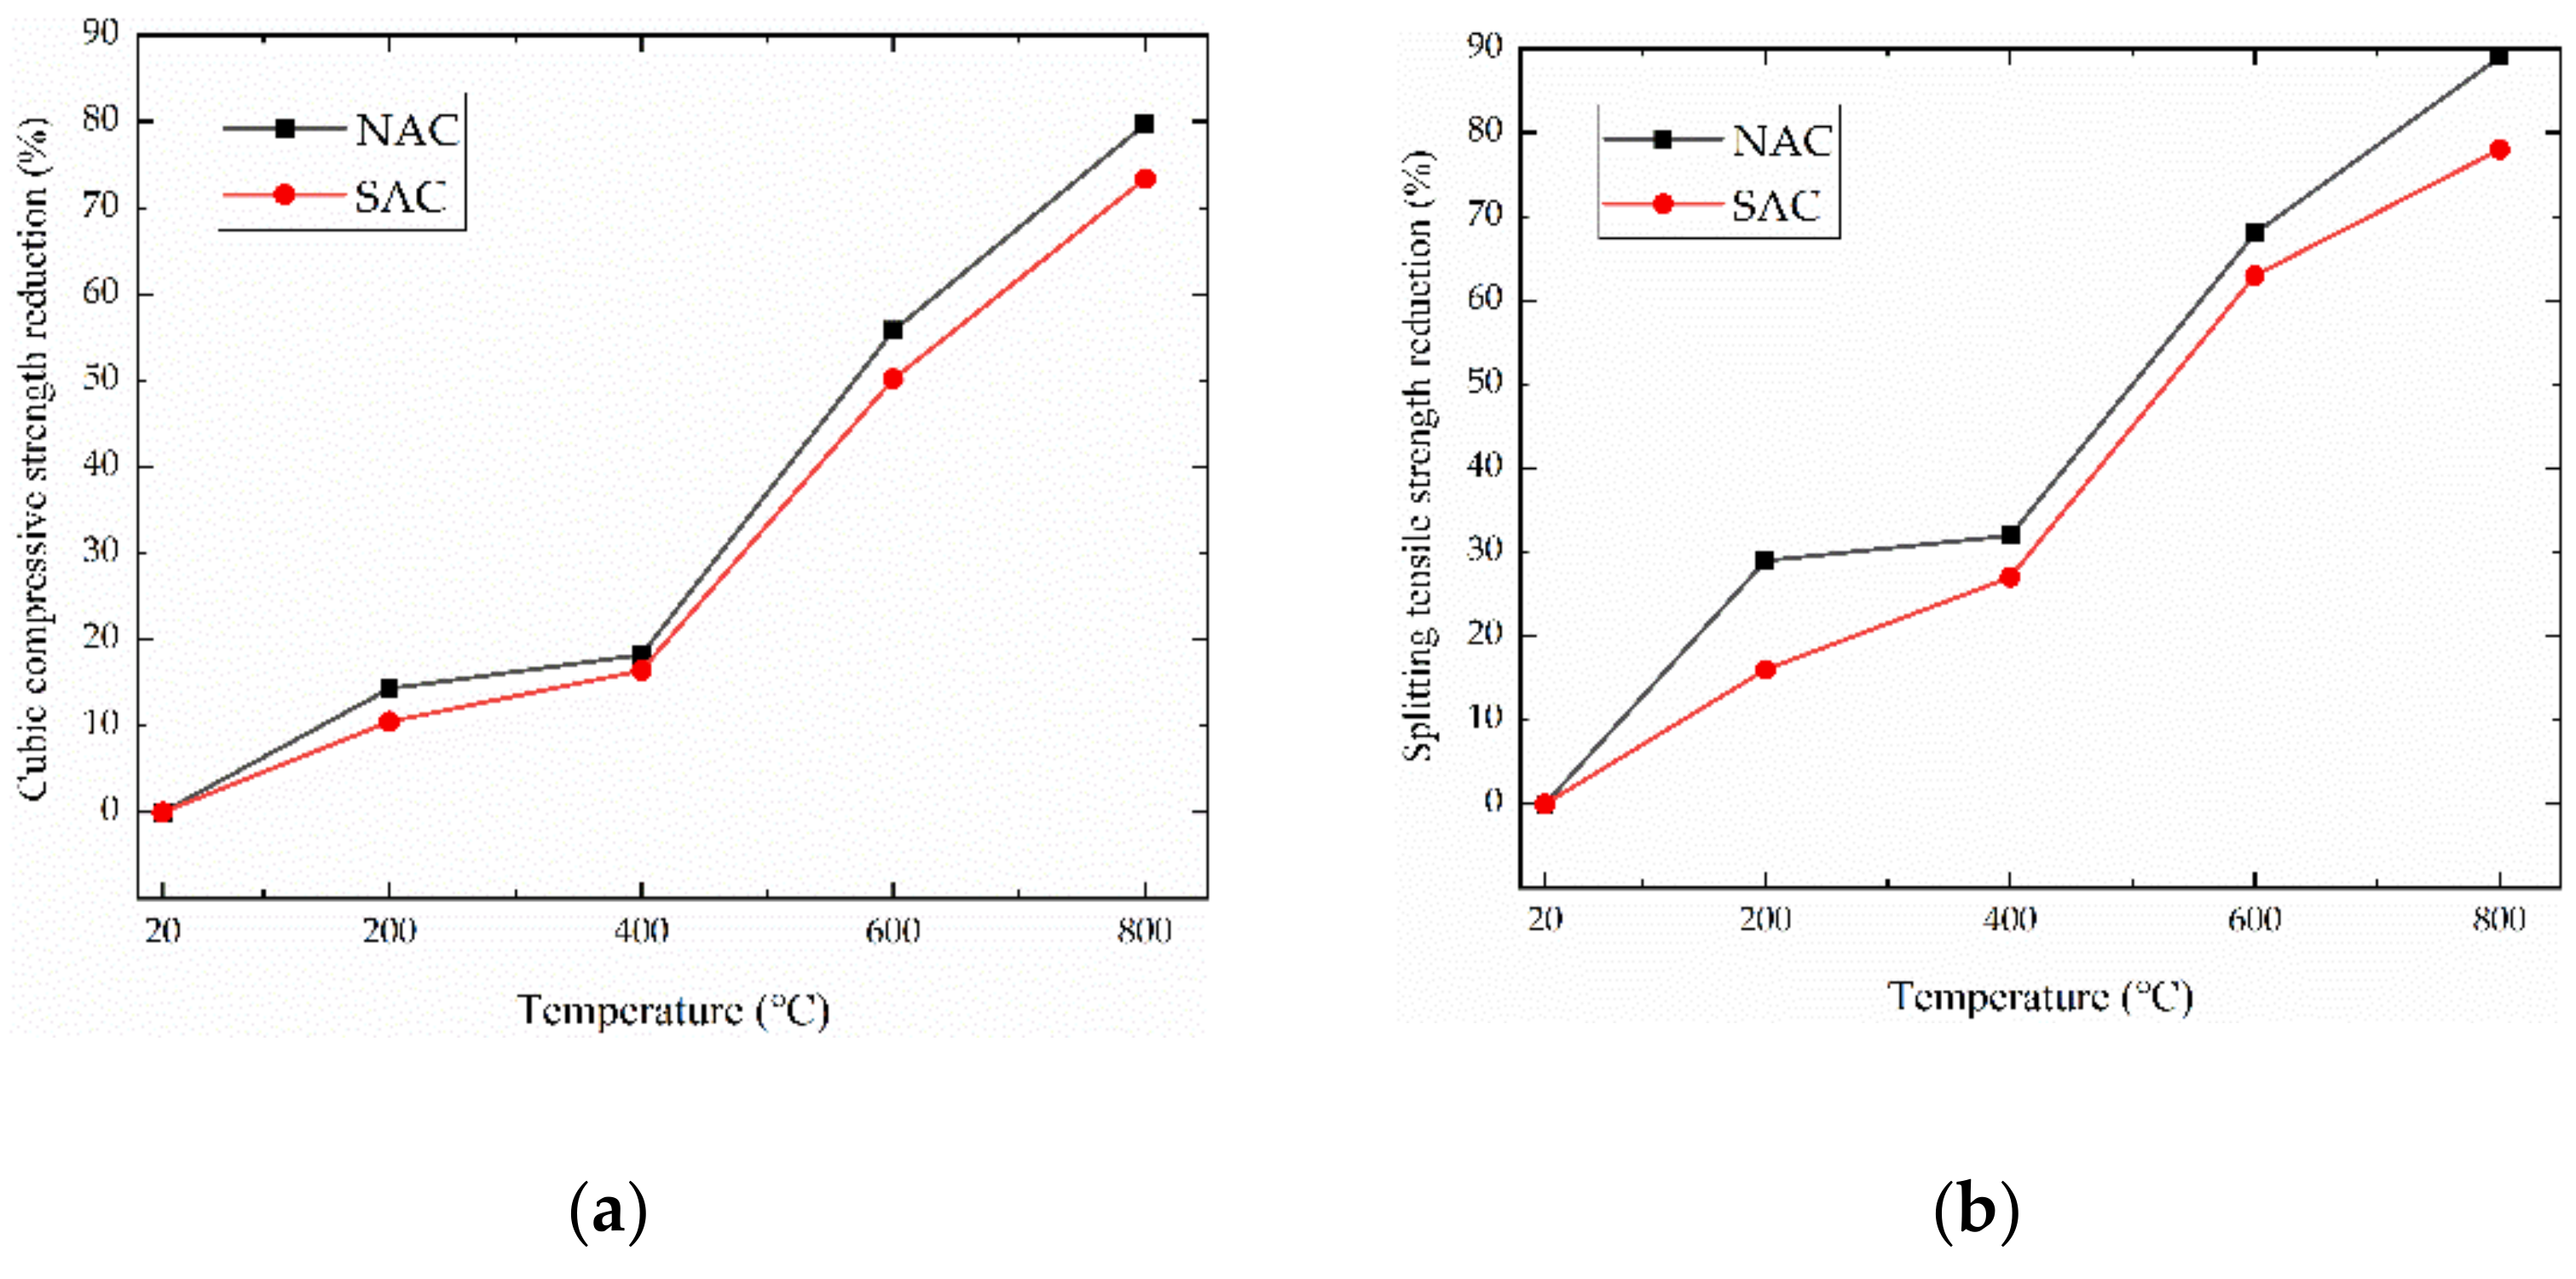
The compressive and splitting tensile strengths of the specimens of SAC and NAC after various temperatures were conducted. The effects of temperatures on the strength of SAC are shown in Table 1. Figure 2 shows the strength reduction of NAC and SAC after different temperatures.
As the water in the calcium hydroxide inside the test block desorbed at about 450 °C and calcium oxide was generated, the hydration products decreased significantly, the cracks inside the concrete increased rapidly, and the strength loss increased, so the strength of the test block decreased significantly. From Table 1 and Figure 2, the trend of strength reduction of SAC was similar to that of NAC, but the strength reduction of SAC after all temperatures was 4.4% less than that of NAC on average, which indicated that the degree of influence of high temperature on the strength of SAC was smaller compared to that of NAC. After 600 °C, the cubic compressive strength and splitting tensile strength of SAC decreased by 55.8% and 63.2%, respectively.
Curve fitting of the data in Table 1 yielded the cubic compressive strength of SAC after high temperature and the splitting tensile strength of SAC after high temperature, as in Table 2.
The axial tensile strength of SAC can be calculated according to calculation method of Hu with the following equation [40],
where fLtk is the axial tensile strength of concrete and fLpt is the splitting tensile strength of concrete.
- (2)
- Peak Strain
Table 3 shows the peak strains of NAC and SAC after different temperatures. From Table 3, the peak strains of both NAC and SAC decreased with temperature between 20 °C and 200 °C. When the temperature exceeded 200 °C, the peak strains of both increased with temperature. After 400 °C, the increase in peak strain with increasing temperature was significantly higher for NAC than for SAC, due to the excellent refractoriness of the scoria aggregate that allowed the SAC to produce fewer cracks and thus smaller peak strains after being subjected to the same high temperatures as NAC.
Curve fitting of the test data in Table 3 yielded the variation law of peak strain versus temperatures for SAC, as in Table 2.
- (3)
- Ultimate strain
The strain at the falling section of the stress-strain curve corresponding to 0.5 times the peak stress value was taken as the ultimate strain, and Table 4 shows the ultimate strain and relative ultimate strain of concrete after elevated temperatures. From Table 4, it can be obtained that the ultimate strains of both NAC and SAC decreased with increasing temperature in the range of 20 °C to 200 °C. Conversely, the ultimate strains of both increased with increasing temperature after the temperature exceeded 200 °C. After the same temperature, the ultimate strain of SAC decreased by 42% on average compared to that of NAC. After the temperature exceeded 400 °C, the ultimate strain of SAC decreased by 26% on average compared to that of NAC.
Curve fitting of the test data in Table 4 yielded the variation law of ultimate strain versus temperature for SAC, as in Table 2.
- (4)
- Elastic modulus
The secant elastic modulus at 40% of the peak stress of the stress-strain curve was taken as the elastic modulus, and Table 5 shows the residual elastic modulus of the test blocks after elevated temperatures. From Table 5, it can be obtained that the residual modulus of elasticity of SAC was on average 5.1 times larger than that of NAC after the same temperature, especially after the temperature reached 400 °C; the former was on average eight times larger than the latter because, on the one hand, the cylinder compressive strength of scoria aggregate was higher and the stiffness was larger; on the other hand, scoria aggregate had better fire resistance. As the temperature increased, the residual modulus of elasticity of both NAC and SAC showed a decreasing trend; after 400 °C, the rate of decrease of SAC began to increase significantly, and the residual modulus of elasticity of SAC after 600 °C and 800 °C was 13% and 3% of that at ambient temperature, respectively.
Curve fitting of the experimental data in Table 5 yielded the variation law of the residual modulus of elasticity versus temperature for SAC, as in Table 2.
- (5)
- Stress-strain curve
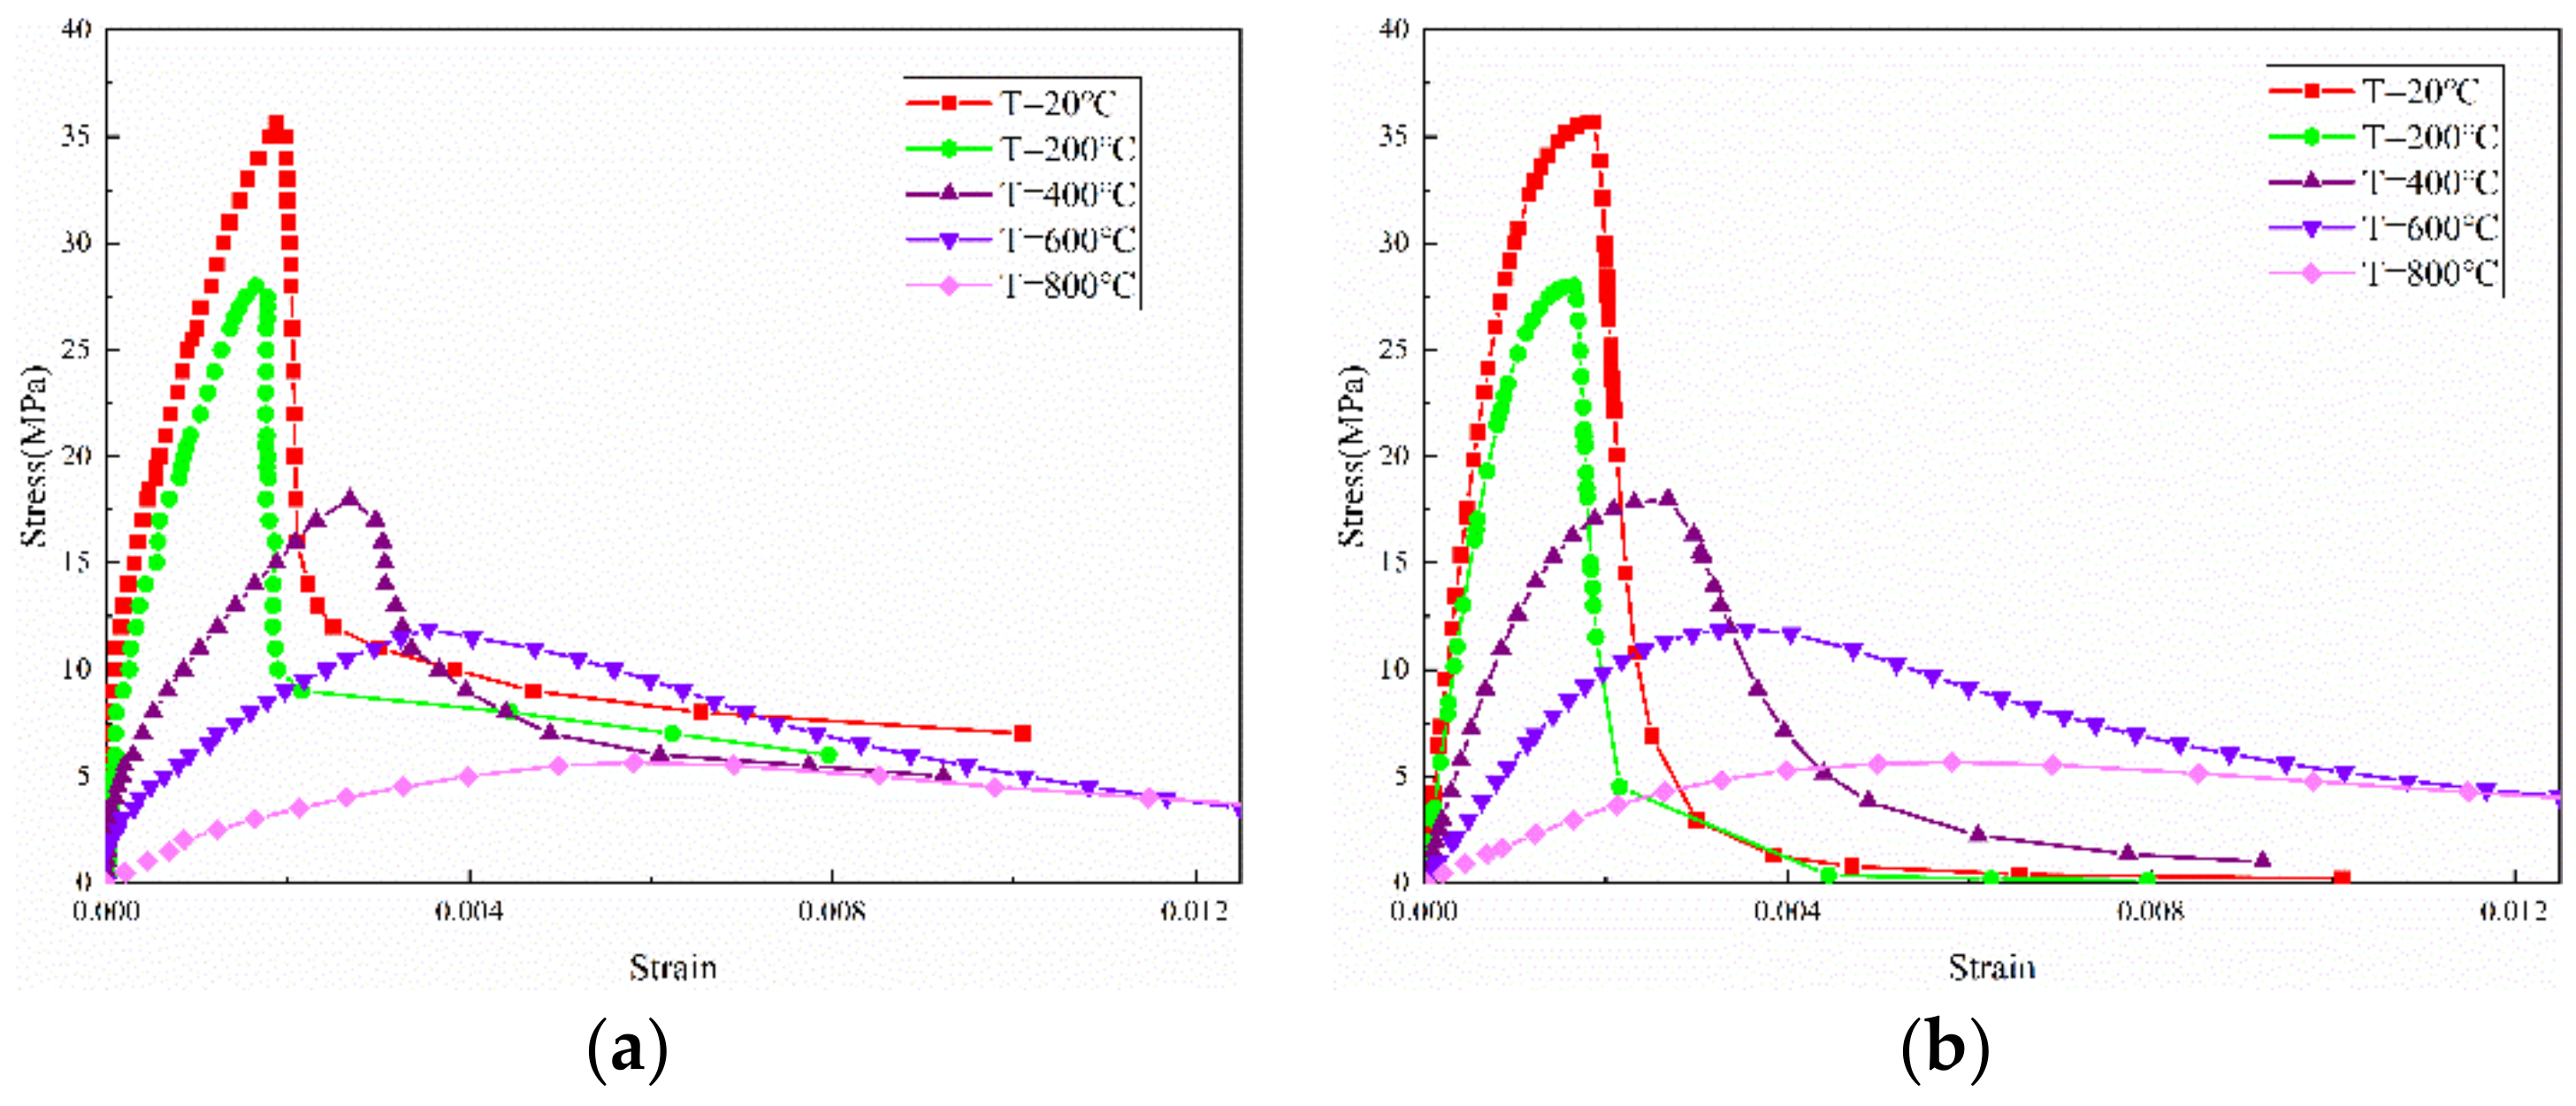
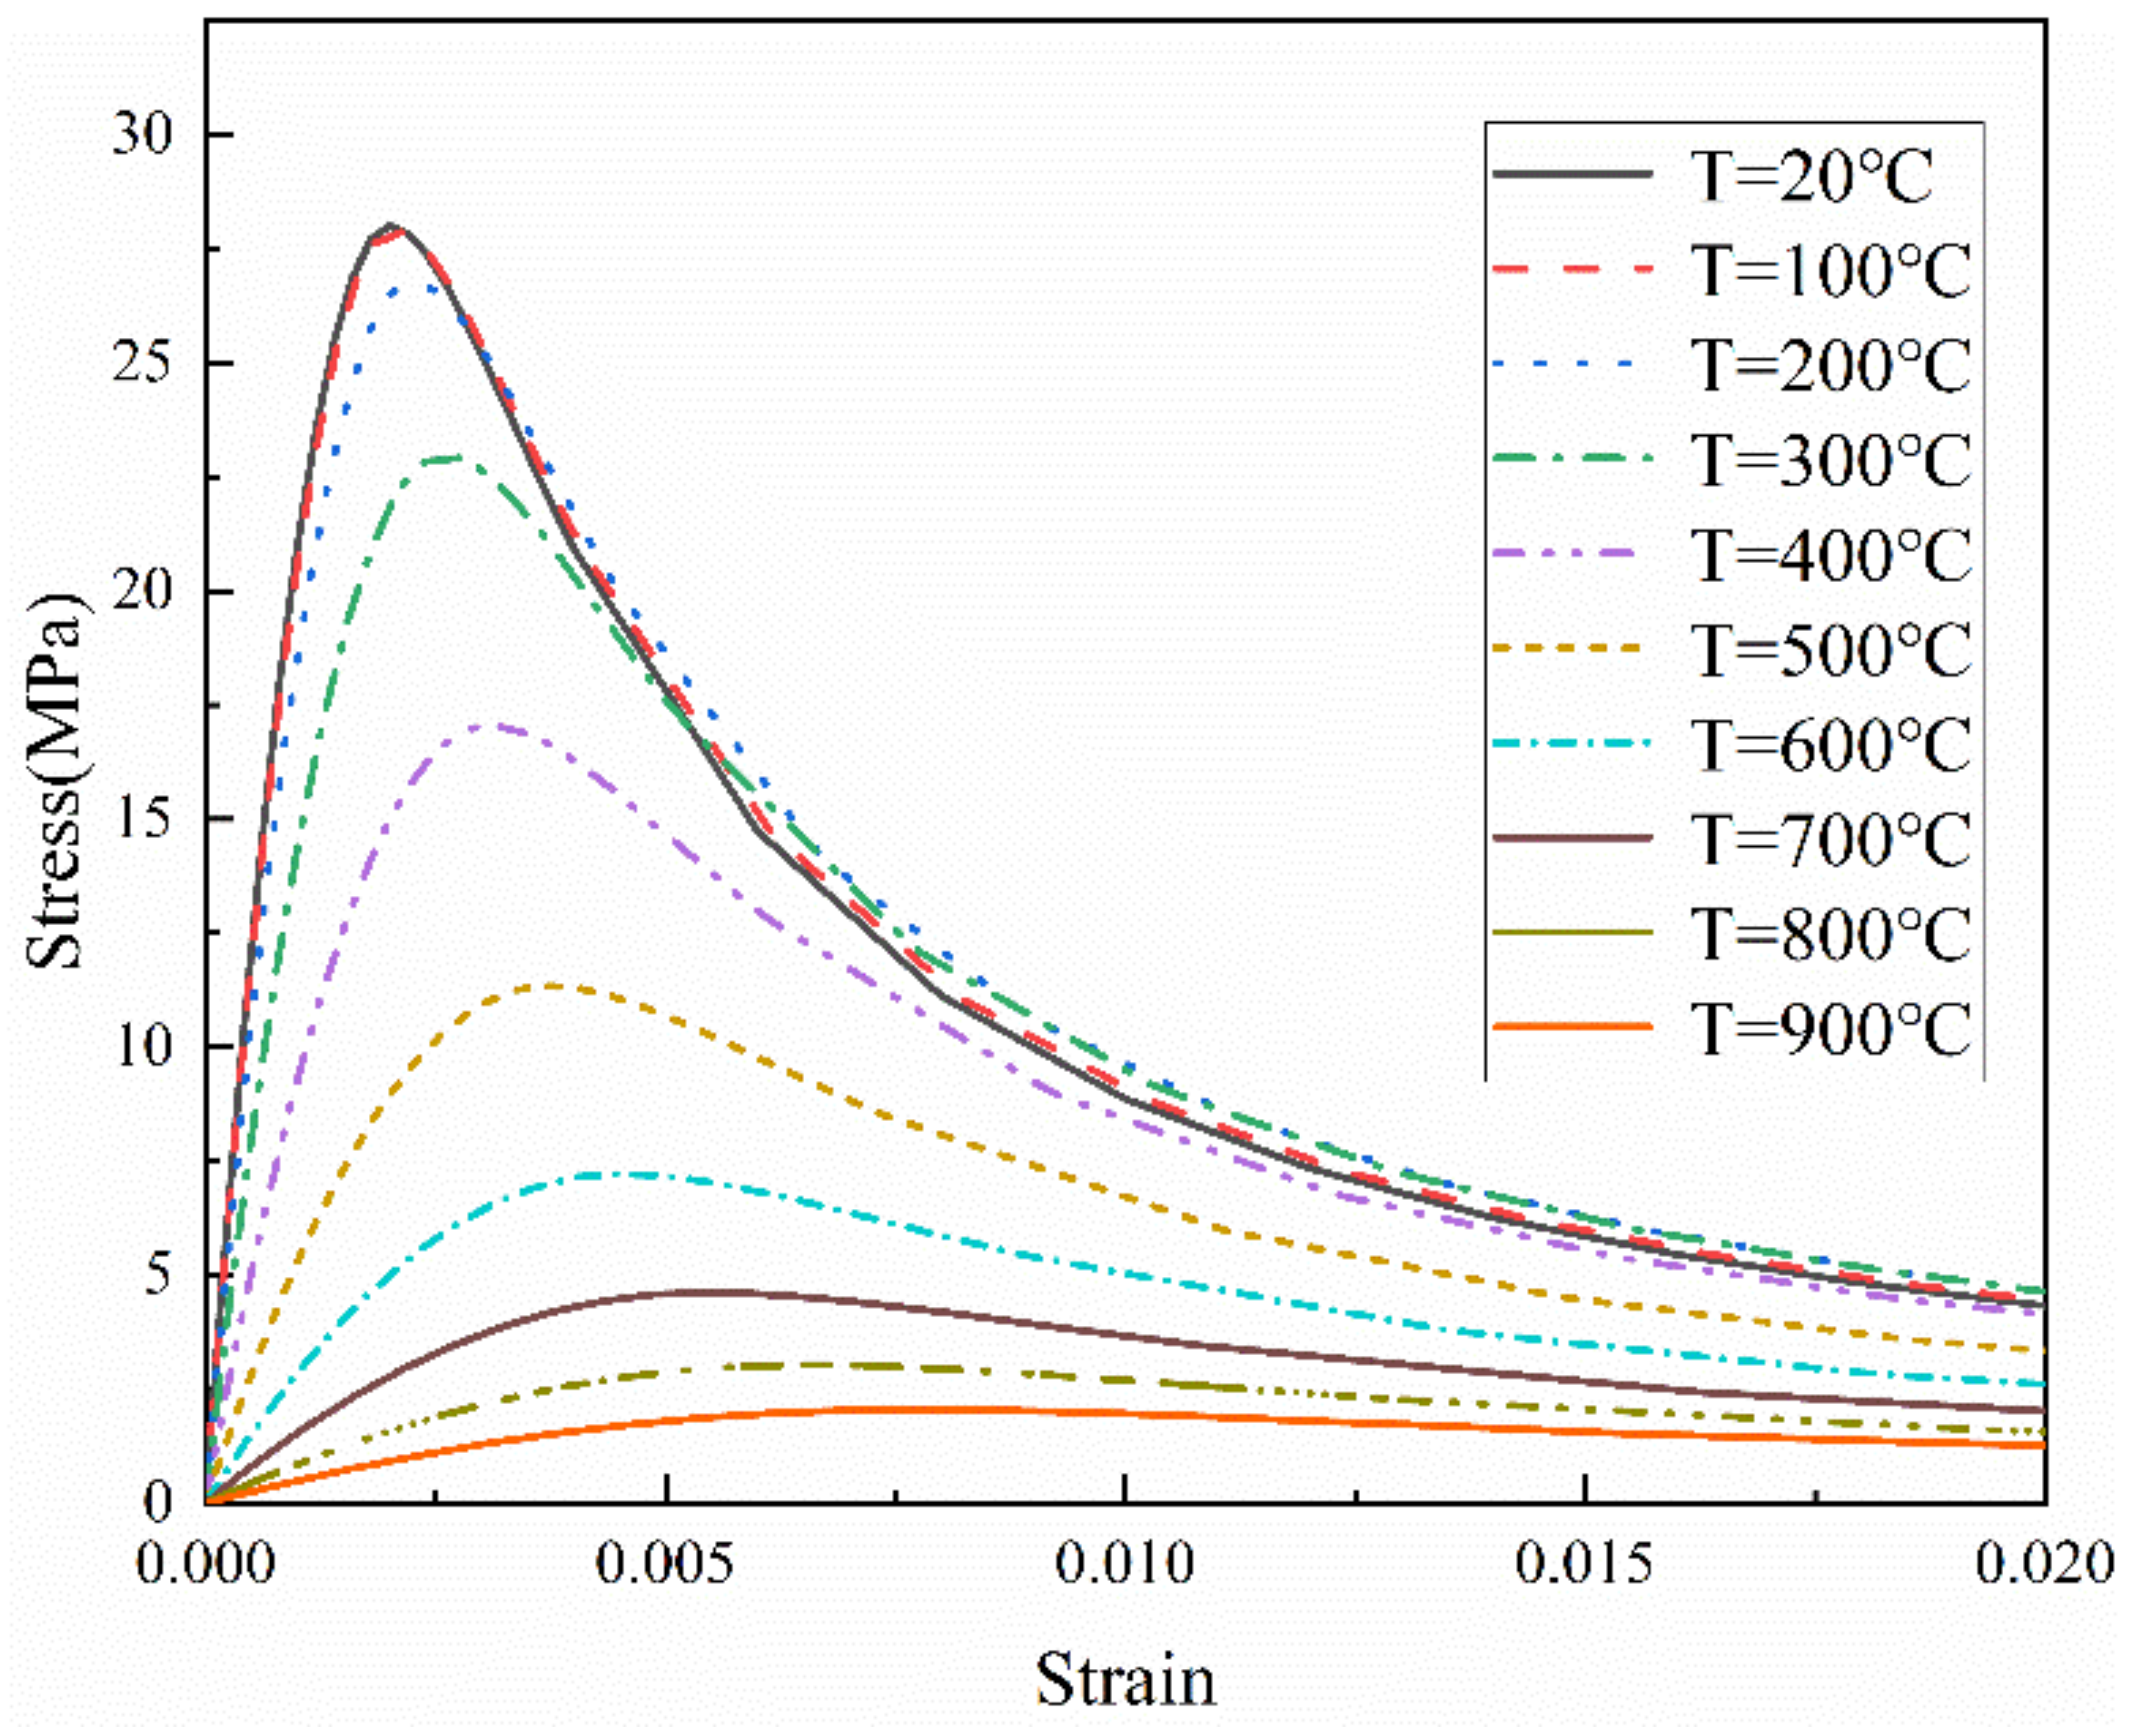
Figure 3a shows in detail the uniaxial compressive stress-strain curves of SAC after different temperatures obtained from the test. Figure 3b shows the stress-strain curves of SAC after different temperatures obtained by regression fitting. As shown in Figure 3a, after the temperature reached 200 °C, the area of the stress-strain curve gradually decreased with the increase of temperature, the peak strain kept moving to the right side of the curve, the peak strain gradually increased, and the elastic modulus sharply decreased.
- (6)
- Constitutive equation
The constitutive relations for steel concrete in the Chinese code for Design of Concrete Structures was selected for the regression fitting of the constitutive equation of SAC after fire, as shown in Equations (2)–(5) [41]. The whole stress-strain curve in the code is divided into ascending and descending portions. The parameters n and α in Equations (2) and (5) are independent parameters to control the shapes of the ascending and descending portions, respectively. Among them, the parameter n is determined by the modulus of elasticity, peak strain, and peak stress of concrete, as shown in Equation (5). Additionally, the value of α is related to the deformation characteristics of concrete and its changes; for example, when the value of α increases, the plasticity deformation capacity of concrete decreases.
where fc, r is the peak stress of concrete, MPa; εc,r is the peak strain corresponding to the peak stress of concrete.
Based on the experimental data, the parameters n and α of the ascending and descending portions of the stress-strain curves of SAC after different temperatures were fitted by regression analysis, and the conclusions are shown in Table 6. Combined with Figure 2b and Table 6, it can be obtained that the ascending portions parameter n did not change much after different temperatures, while the descending portions parameter α was very large at ambient temperature and after 200 °C, and decreased significantly with the increase of temperature, which indicated that the brittleness of SAC was larger and the ductility was poorer after lower temperatures, making the descending portions very steep.
4.1.3. Thermal Damage Coefficient of SAC
When simulating joints under earthquake load, the SAC material under low-cycle repeated loading is partially irrecoverable and degraded. Therefore, the deterioration of the modulus in each cycle should be considered. So, the damage index d (T) from Sidoroff was introduced in the model, as shown in Equation (6) [42]. By reducing the stiffness of SAC, the characteristics of the unloading stiffness of SAC with decreasing damage were simulated.
where Ec(T) is initial elastic modulus of SAC after temperature T, and σ and ε are the stress and strain corresponding to each point on the constitutive curve at each temperature, respectively. Damage factors d (T) is defined in damage plasticity model available in ABAQUS.
4.1.4. Thermomechanical Damage Model for Rebars
The rebars material was simulated by using the bilinear strengthening model in ABAQUS, which considered both the Bauschinger effect and cyclic hardening of rebars material. The longitudinal reinforcement of the beams and columns was HRB400 with a yield tensile strength of 450 MPa and a modulus of elasticity of 20,000 MPa at 20 °C, while the hoop bars in the beams and columns were HPB300 with a yield tensile strength of 330 MPa and a modulus of elasticity of 21,000 MPa at 20 °C.
During reciprocating cyclic loading, the elastic limit of the rebars is significantly reduced during the intersecting change of compression and tension. When the yield reaches the limit, the resistance to failure increases and the strain reduces. When the reciprocating rebars reach the yield strength, Bauschinger effect and cyclic hardening effect are considered. The bilinear strengthening model of ABAQUS fits the curve of linear elasticity and elastoplasticity of rebars under reciprocating load, so this model was selected to model and simulate the rebars [43].
4.2. Bond–Slip Model Considering Material Degradation of Rebars and SAC
The bond strength between rebars and concrete is mainly related to chemical bonding, mechanical interlocking between rebars and concrete, and the friction between rebars and concrete after debonding. Especially before debonding, the bond strength between rebars and concrete is mainly ensured by the mechanical interlocking between rebars and concrete, when the mechanical strength of concrete is crucial.
The bonding failure between rebars and concrete is one of the major causes for the failure of RC elements. It also affects the ductility, moment capacity, and energy dissipation of the joints. However, most of the conventional FEMs ignore the bond–slip between rebars and concrete, leading to the overestimation of seismic performance of structural components. Therefore, in order to accurately analyze the seismic performance of SAC structures after fire, a three-spring rebar-concrete interface bond–slip model was implemented in ABAQUS considering the effect of scoria aggregate on the mechanical strength of concrete with reference to the study [44].
4.2.1. Bond–Slip Model
The constitutive relation curves of bond stress τ and slip S between rebars and SAC after fire in the study [44] were used to calculate the seismic performance of structural components of SAC after fire with good results:
The constitutive relation of bond strength at 20 °C
The constitutive relation of bond strength after 200 °C
The constitutive relation of bond strength after 400 °C
The constitutive relation of bond strength after 600 °C
The constitutive relation of bond strength after 800 °C
4.2.2. Implementation in ABAQUS Using Spring Element
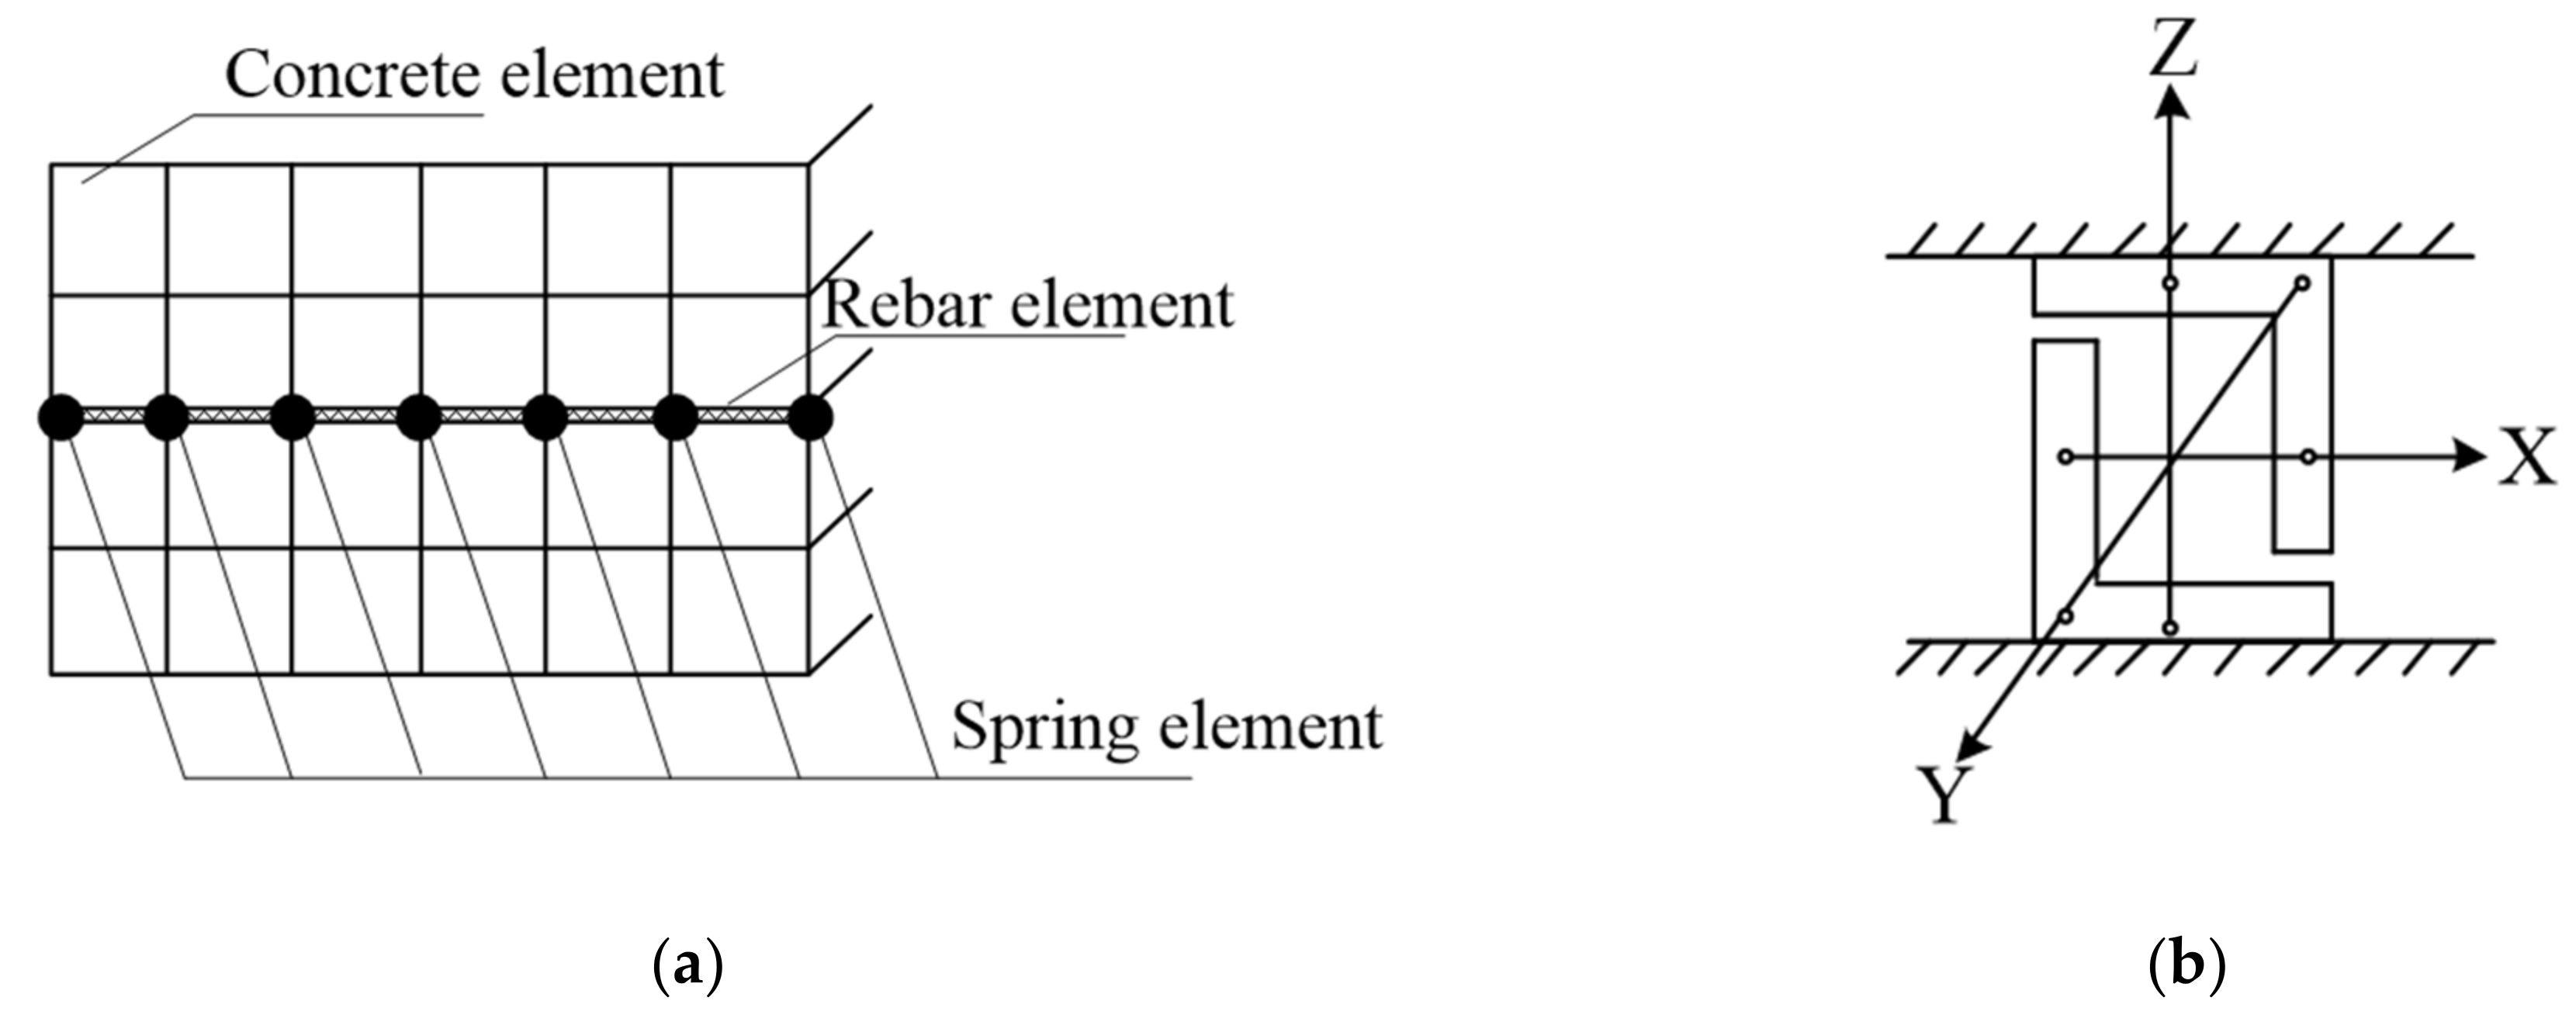
Since the bonding between rebars and SAC is weakened after fire, spring elements were inserted in the X, Y and Z directions between them to simulate the bond–slip behaviors accurately. The spring elements had certain rigidity but no real spatial sizes, so that the bond–slip between rebars and SAC could be well simulated. The linear springs in the Y and Z directions were used to determine the dowel action between rebars and SAC, and their rigidity was cited from the elastic modulus of SAC. The nonlinear spring in the X direction was used to determine the bonding force between rebars and SAC, and its bond–slip relation was converted from the bond stress-slip relation, as in Figure 4.
where F is the bond force between rebars and SAC, N; D is the diameter of the rebar, mm; dx is the half of the length sum from the rebar elements at the two sides of a spring element, mm; and τ is the bond stress between the rebars and SAC, MPa.
4.3. Element Selection
SAC was simulated by using C3D8R 8-node hexahedron linear reduced integration elements, and concrete plastic injury model was adopted as its constitutive model for SAC. Rebars were simulated as T3D2 2-node linear 3D truss elements, and their constitutive model was a bilinear follow-up hardness model. The files (.inp) on ABAQUS were compiled, spring elements were inserted in between longitudinal rebars and SAC, and the bond–slip relation was determined from Equations (7) to (12). The results of the temperature field model were imported as a predefined field into the seismic performance model.
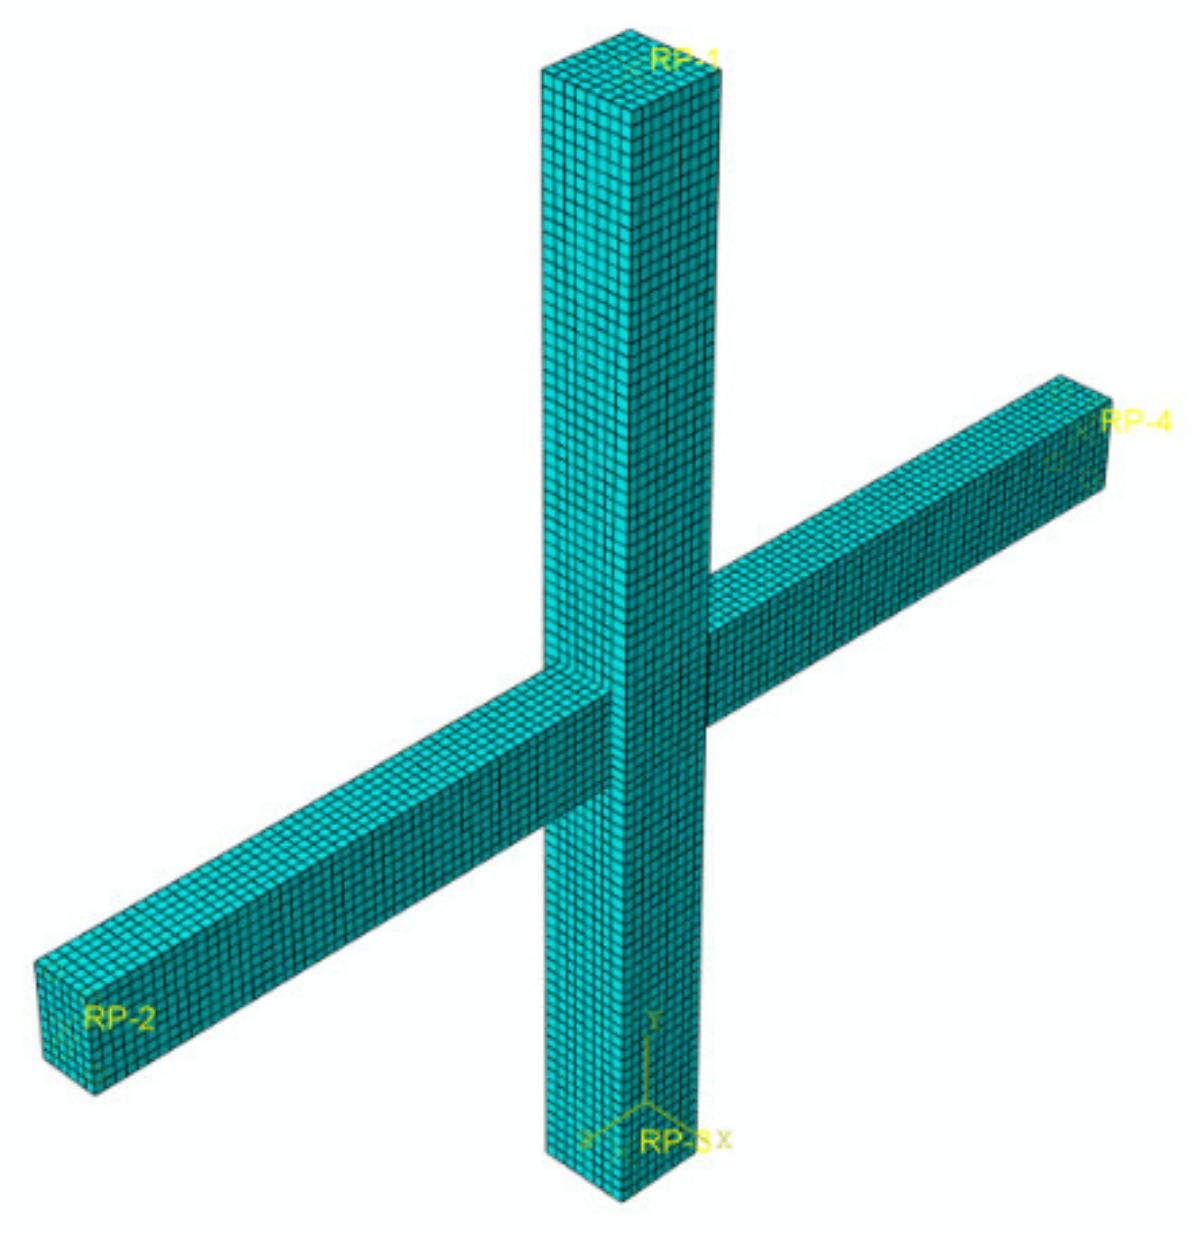
4.4. Geometrical Modeling
The grid division and node numbering were both consistent between the temperature field model and the seismic performance model, which ensured the temperature at each node can be successfully imported into the seismic performance model. In the seismic performance model, the lower end of each column was not allowed to slip in the X, Y, and Z directions, while its upper end could slip in the X and Z directions, and its crest was applied with vertical load according to the axial pressure ratio. The ends of each beam were imposed with cyclic repeated slip. The details of grid sizes are shown in Figure 5.
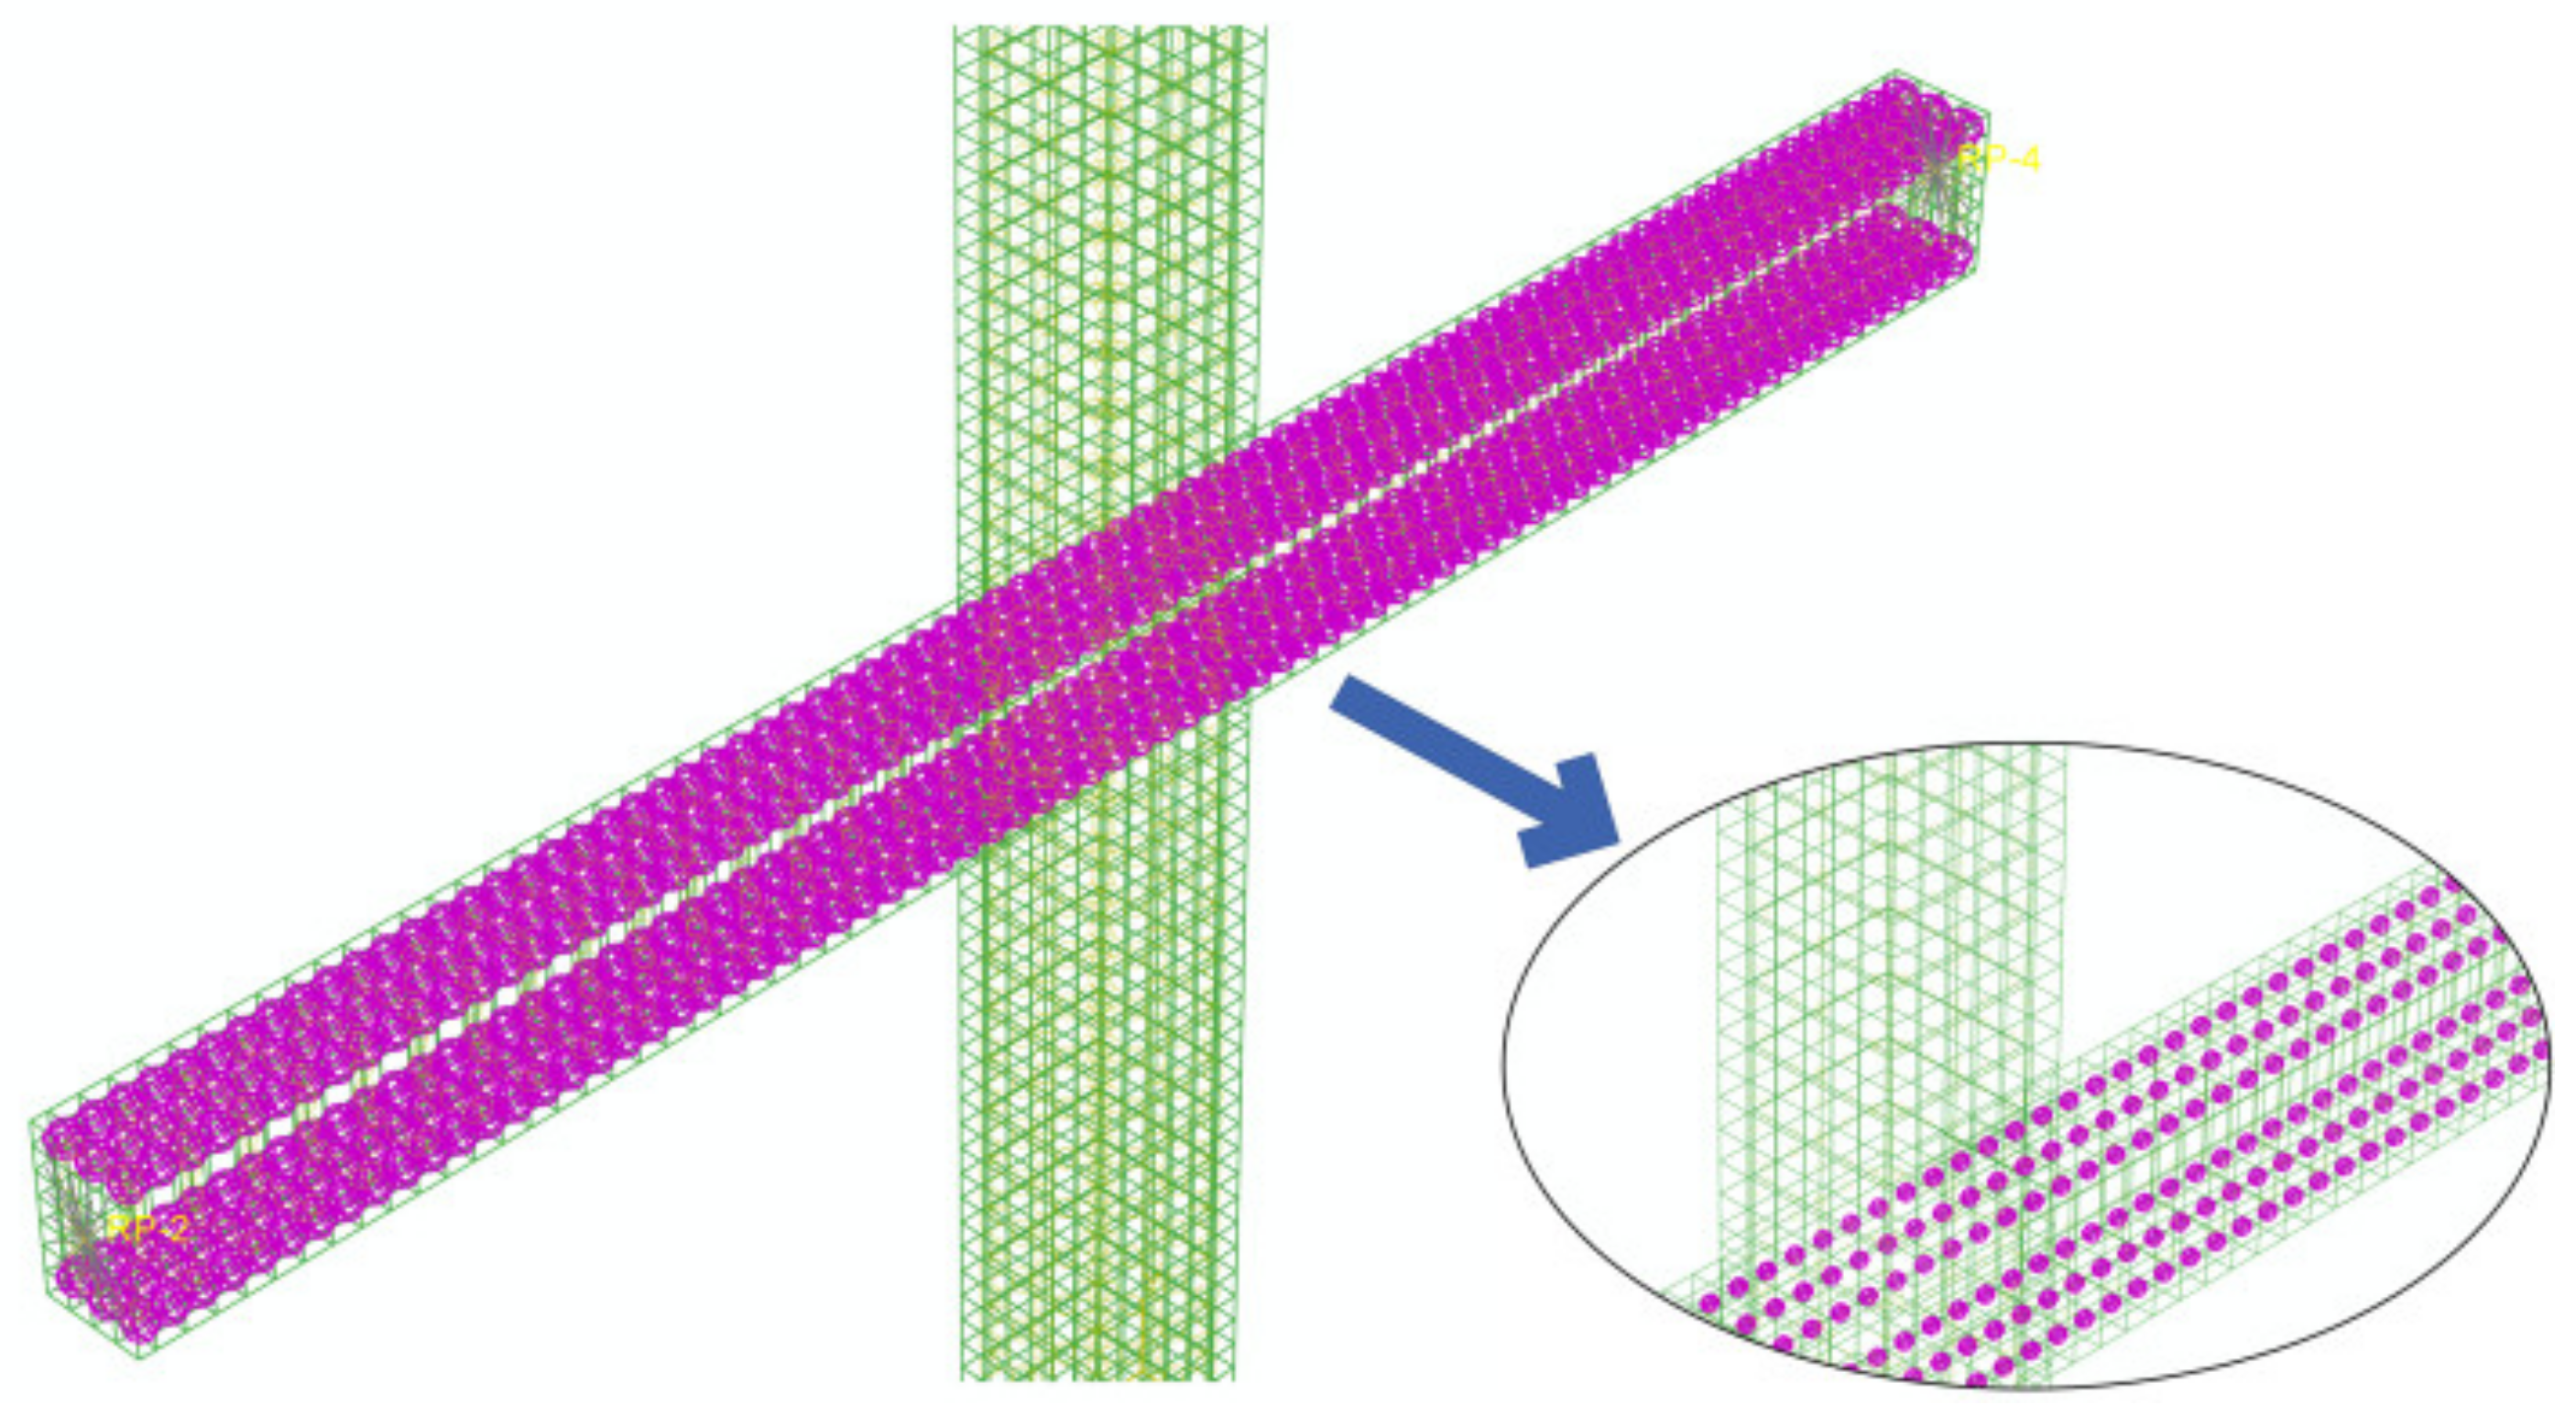
Due to the evident slip between the vertical rebars and SAC in the beams and not between the vertical rebars and SAC in the columns, a three-spring element interface model was set between the vertical rebars and SAC in the beams, which reduced computations. In this way, the effects of rebar-concrete slip on the seismic performance were considered, and the computation was reduced, but the precision was still satisfactory. The spring elements between rebars and SAC were marked red in Figure 6.
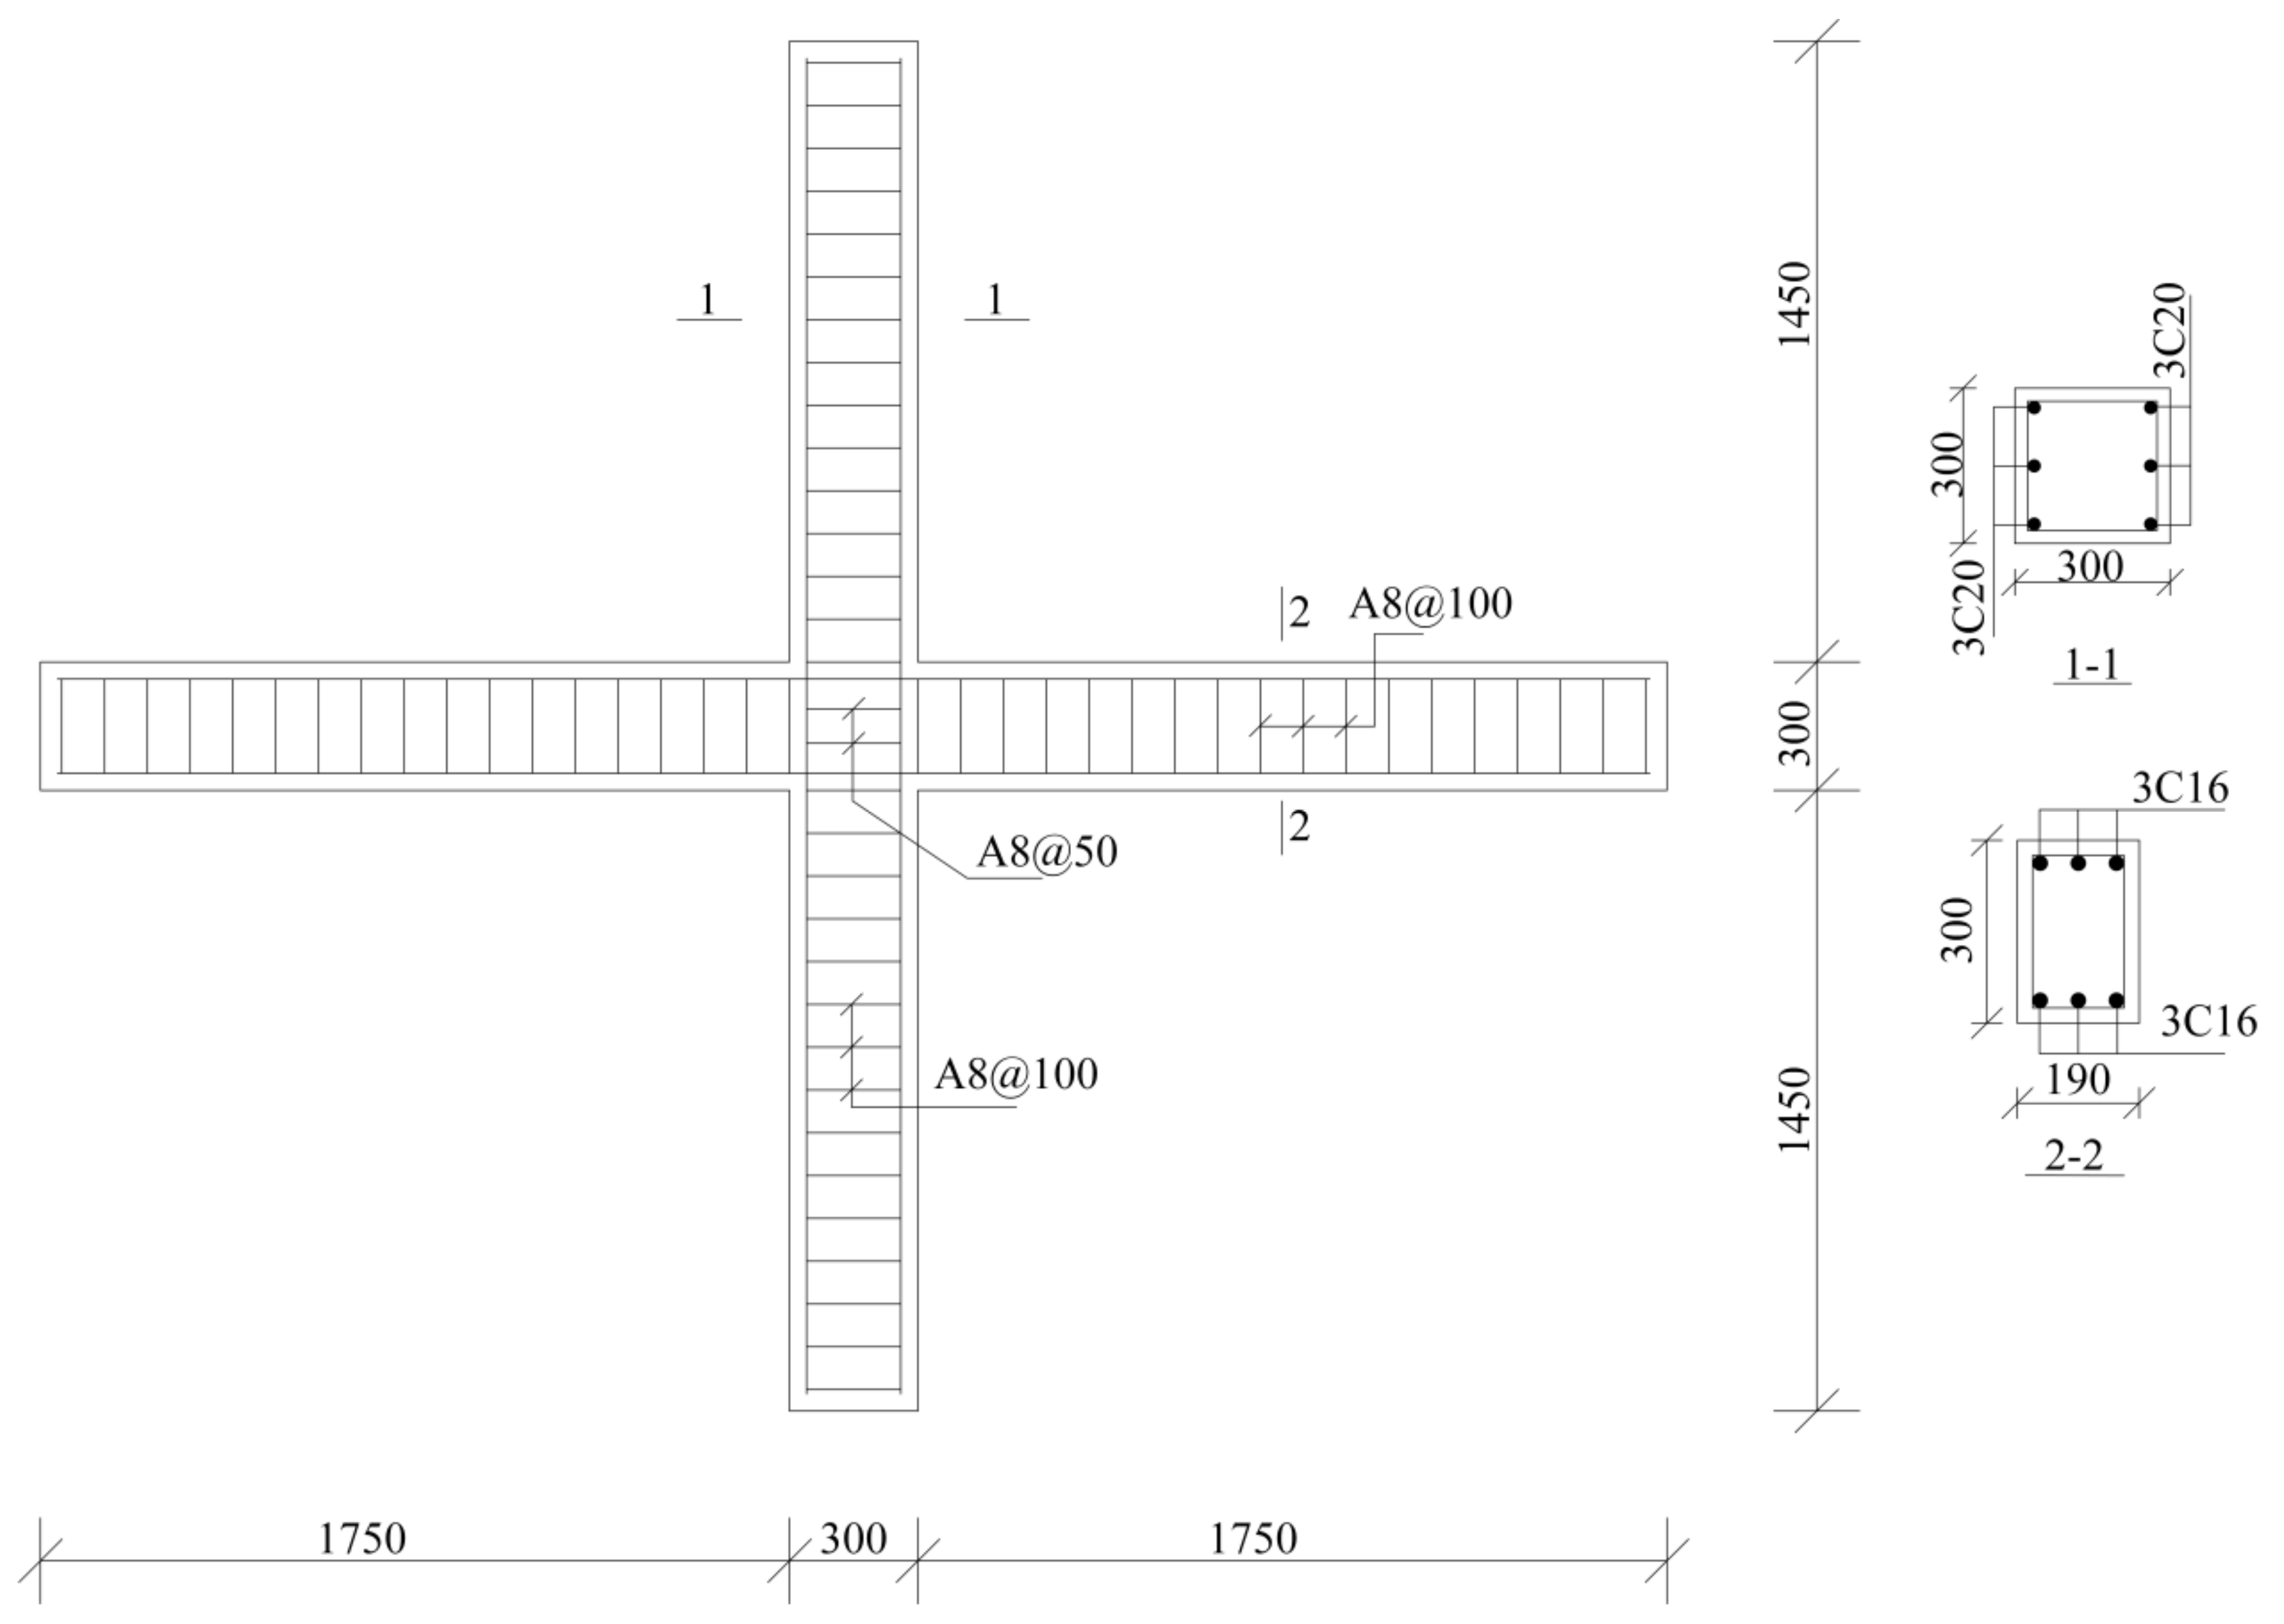
The times subjected to fire for the beam-column joints of SAC were 0 min, 60 min, and 90 min, respectively. The dimensions and rebars conditions of the beam-column joints specimens were as follows: section dimensions of columns and beams were 300 × 300 and 200 × 300 mm2, respectively; the beam-columns were all symmetrically reinforced, and the columns were made as 3C20 on each side, with stirrup B8@100. The beams were set as 3B16 at both upper and lower parts. The covers of beams and columns were 30 mm thick; the stirrup of beams was B8@100, and axial compression ratio was 0.3. Table 7 listed the material parameters of rebars at ambient temperature. The ends of beams were applied with low-cyclic repeated loading. The dimensions and reinforcement of the specimens were as in Figure 7.
Displacement-controlled scheme was used to apply the vertical loading during the entire loading process. The amplitude of longitudinal displacement was 2 mm, 4 mm, 6 mm, 8 mm, 12 mm, 18 mm, 24 mm, and 36 mm for each cycle, respectively. Yield displacement was initially determined with yielding of the longitudinal reinforcements in beams. The amplitude of longitudinal displacement turned to integer multiple of yield displacement when the longitudinal reinforcements yielded. The vertical loading was gradually removed when the residual load-carrying capacity reduced to around 85% of the peak load-carrying capacity.
4.5. Analysis Results
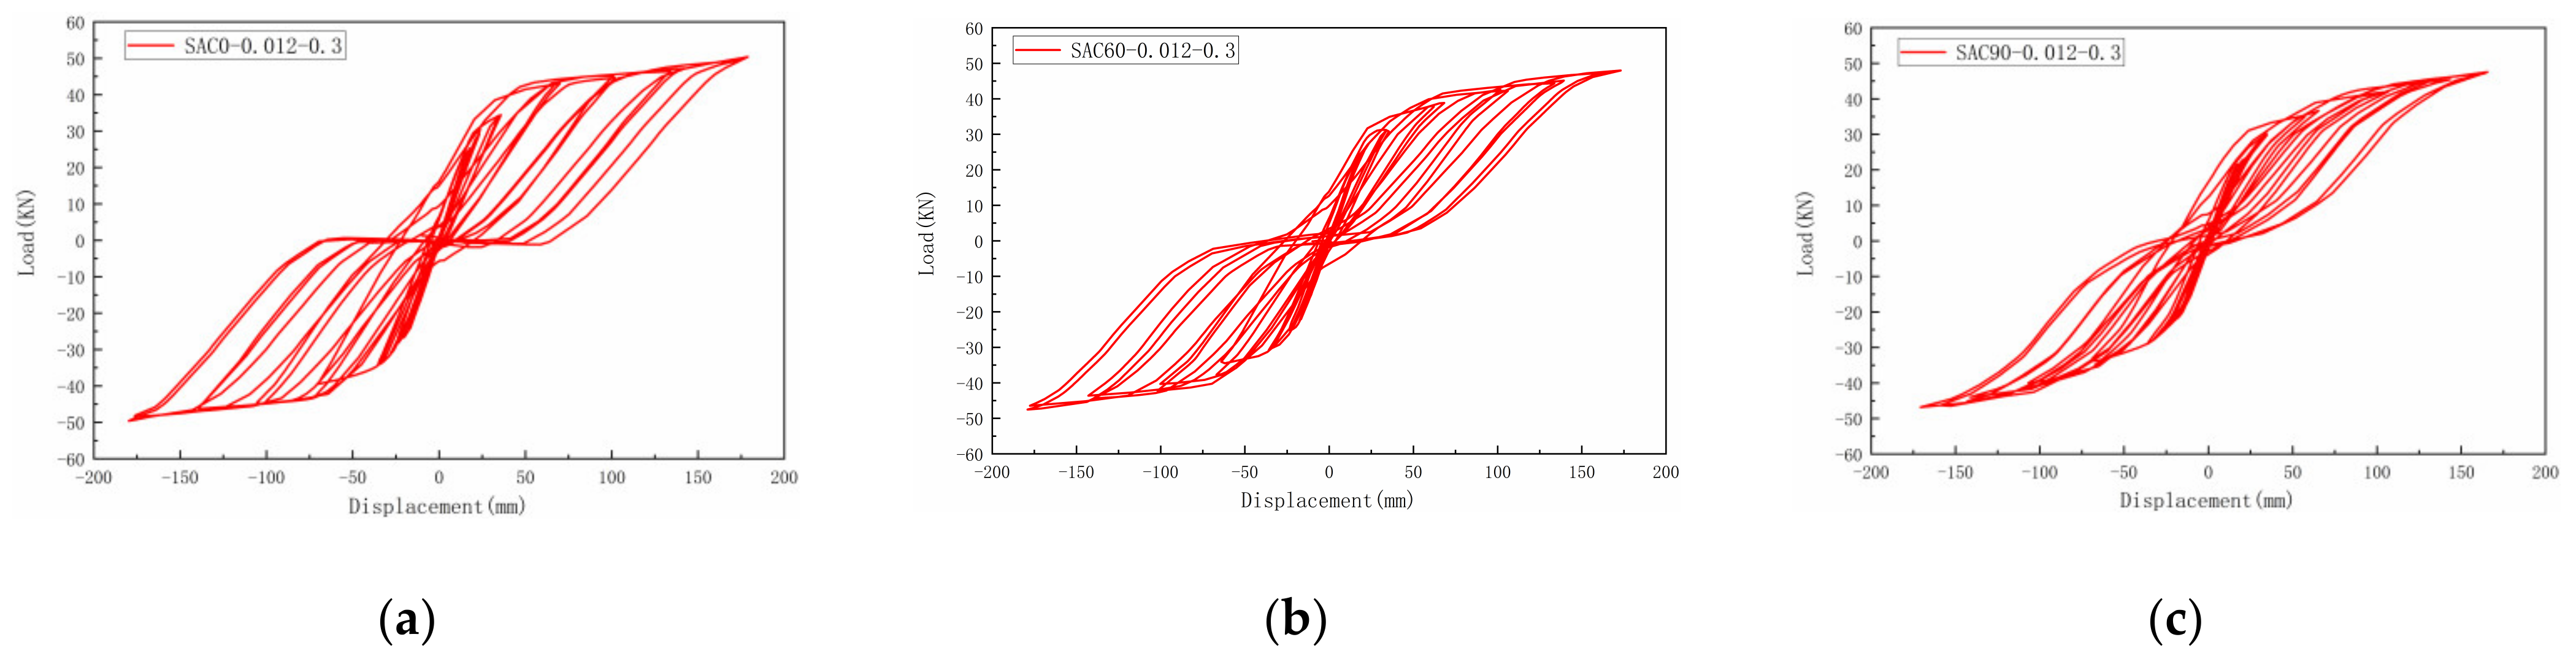
Hysteretic curves show the loaded deformation of structures under cyclic loading and reflect the deformation characteristics, rigidity deterioration, and energy dissipation capacity of structures during repeated enforcement. Hysteretic curves are the foundation for analysis of nonlinear seismic responses and reflect the seismic performance of structures. Figure 8 shows the displacement-load hysteresis curves of the joint specimens after different times subjected to fire, where the specimens after exposure to fire for 0, 60, and 90 min were numbered “SAC0-0.012-0.2”, “SAC60-0.012-0.2”, and “SAC90-0.012-0.2”, respectively. In “SAC60-0.012-0.3”, “SAC” stands for SAC; “60” represents the time exposure to fire in minutes; “0.012” stands for the beam’s longitudinal tensile reinforcement ratio; and “0.3” represents the axial compression ratio.
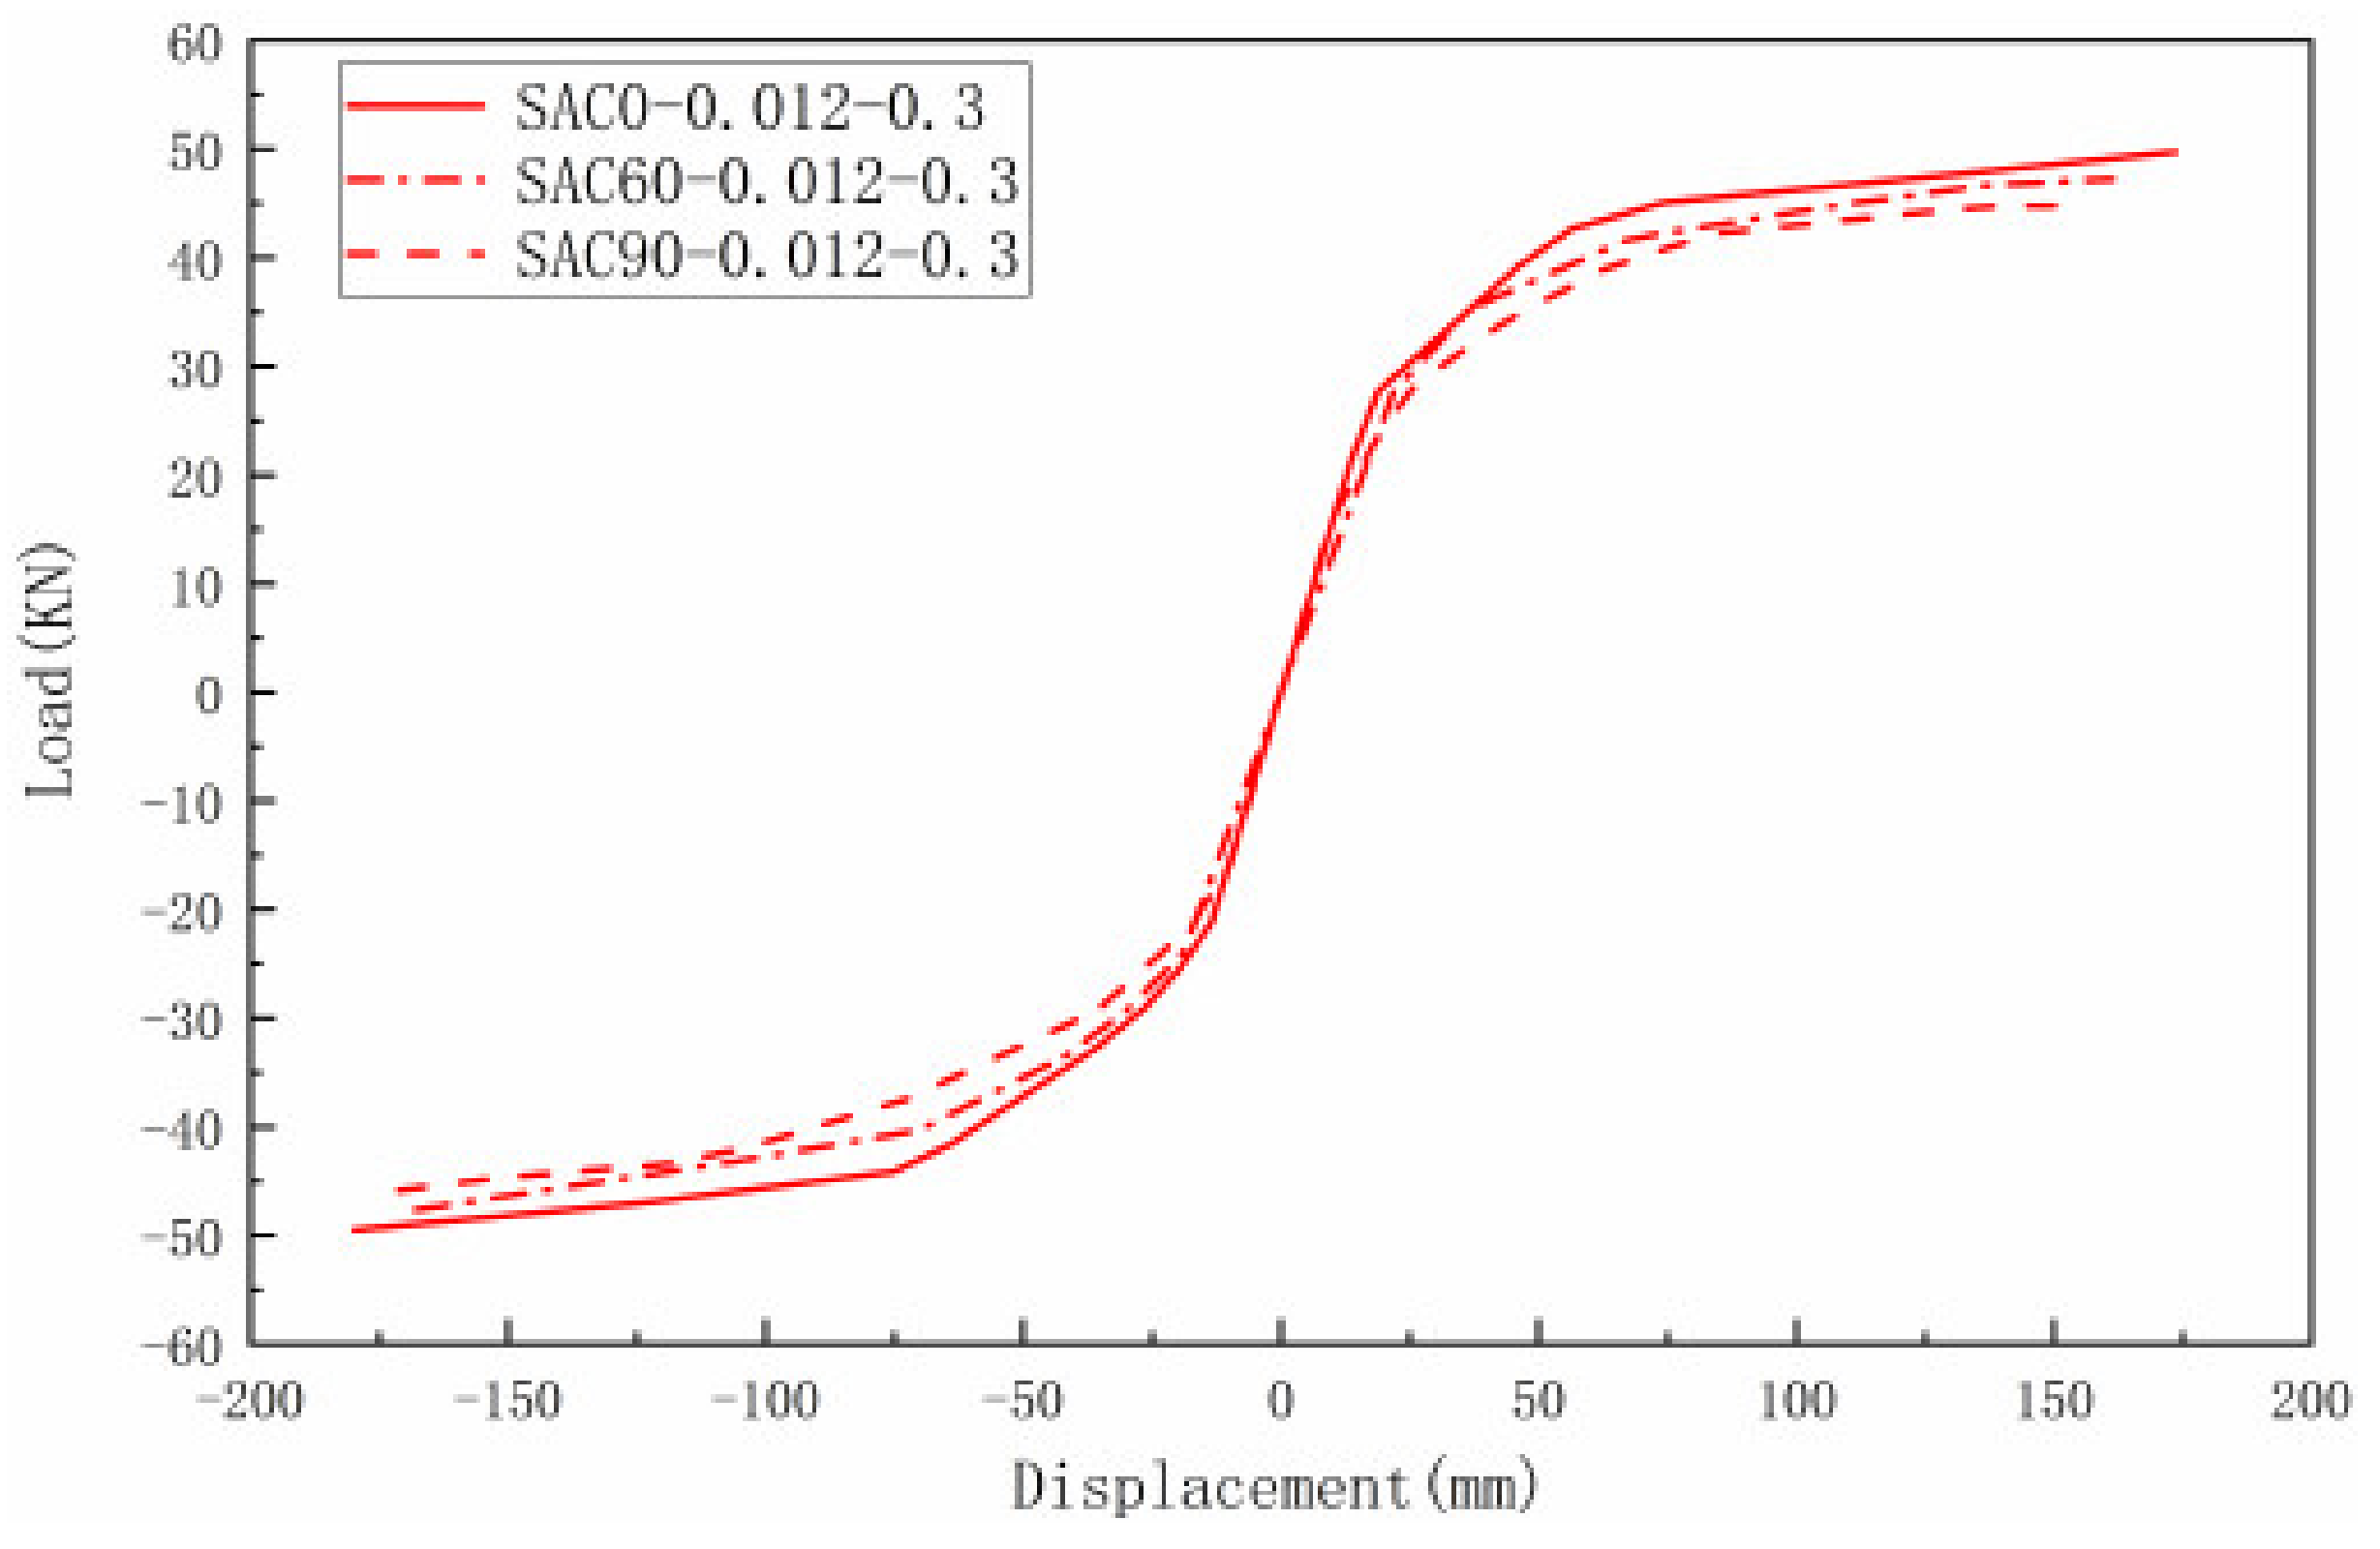
The segment in one loading with the slip exceeding the maximum slip of the previous loading is connected to form a skeleton curve. Figure 9 shows the skeleton curves corresponding to the hysteresis curves above.
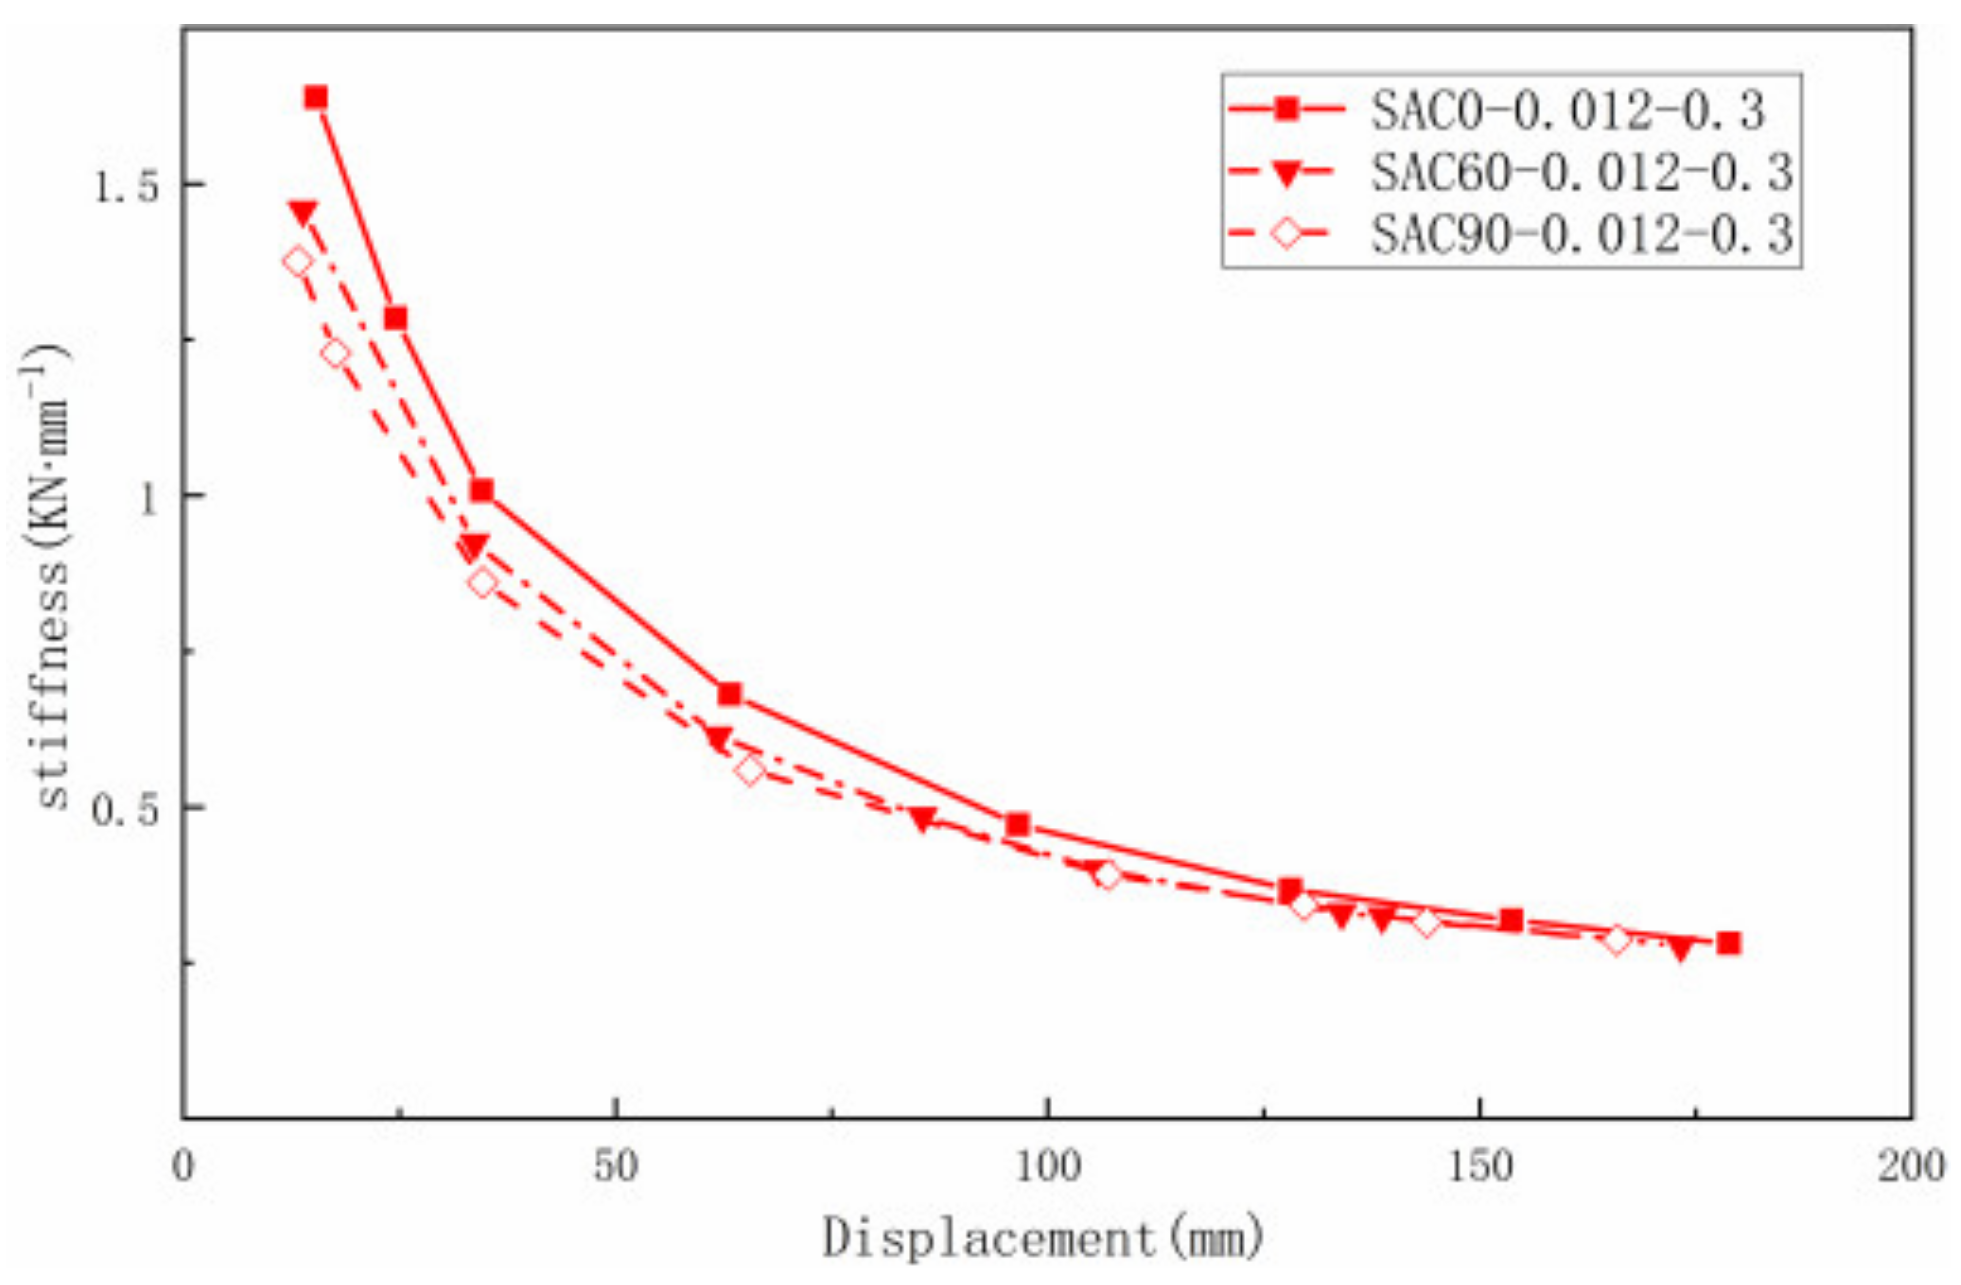
Figure 10 shows the relationship between stiffness degradation and displacement after different fire times. Stiffness is a measure of the deformation capacity of the structure, and this paper refers to the specification for seismic test method to assess the stiffness degradation of each hysteresis loop using the secant stiffness, which is calculated as follows [45]:
where Ki is the secant stiffness of specimen at ith cycle; +Pi and -Pi are lateral pushing and pulling actions at ith cycle, respectively; and +δi and -δi are the corresponding lateral displacement at ith cycle, respectively.
5. Analysis Procedure Validation
In order to validate the effectiveness of the FEM, the FEM established above was used to numerically simulate the seismic performance of NAC beam-column joints after exposure to fire [26].
5.1. Heat Transfer Analysis of NAC Joints
According to the test of the reference [26], a simulation study of the temperature field of NAC after 0, 60, and 90 min of fire was required, which was the same as that of SAC.
5.1.1. Thermal Material Modelling for NAC
In order to simulate the temperature field of NAC beam-column joints, the thermal parameters of the reinforcement and NAC must be determined first. Among them, the thermal parameters such as thermal conductivity and specific heat capacity of reinforcement and the model of thermomechanical damage after fire were consistent with the previous paper and determined following Eurocode 4 and Eurocode 2 [27,28].
The effect of temperature on density of NAC was ignored during our computation which was consistent with SAC. Thus, the density of NAC was regarded as constant at ρ = 2400 kg/m3 [29].
5.1.2. Heat Transferring Analysis in ABAQUS
As with SAC, the temperature field of the members was simulated using DC3D8 8-node linear hexahedron heat transfer elements for NAC and DC1D2 2-node heat transfer elements for rebars. The comprehensive radiation coefficient was set to 0.5, the absolute zero temperature was −273.15 °C, and the Stefan-Boltzmann coefficient was 3.402 × 10⁻⁶ J/(min-m²-°C4). The internal heat of the structure was mainly transferred by heat conduction. The thermal resistance between the NAC and rebars was very small and therefore was neglected.
5.2. Post-Fire Seismic Analysis of NAC
Due to the difference between natural aggregate and scoria aggregate, the thermomechanical damage model and bond–slip model of NAC are different from that of SAC. Consequently, when simulating the seismic performance of NAC joints after exposure to fire, it is essential to determine the thermomechanical damage model of NAC and the bond–slip relationship between NAC and rebars after exposure to fire.
5.2.1. Thermomechanical Damage Model of NAC and Rebars
The thermomechanical damage model of rebars in this part was consistent with the previous paper. From the existing research, the thermomechanical damage model of NAC was established by the references [46,47,48,49]. The stress-strain relationship of post-fire NAC is expressed as Yu and Ding [48]:
where , and σc and εc are the pressure stress and compressive strain of post-fire NAC, respectively. Reference parameter at ambient temperature is ; fcu is the cubic compressive strength of NAC at ambient temperature, MPa; . The stress-strain curves of NAC after different temperatures are shown in Figure 11.
5.2.2. Bond–Slip Model Considering Material Degradation of Rebars and NAC
The cause of the bond strength between rebars and NAC is the same as that between rebars and SAC. However, the difference in aggregates results in significantly different bond–slip models between concrete and rebars. Thus, the bonding stress τ and slip S constitutive relation curves of post-fire rebars from Tianyi were selected to calculate the seismic performances of NAC structure components, which yielded excellent results [50]:
where , , , and are the maximum slips at the minimal slip stage, slip stage, splitting stage, and drop stage, respectively, mm; , , , , and are the control parameters at the curve slip stage and splitting stage; , , , and are the bond stresses corresponding to the maximum slip at the minimal slip stage, slip stage, splitting stage, and drop stage, respectively, MPa; and kτT and ksT are the deduction coefficient of bond strength and ultimate slip of RC after fire, which change with temperature, as in Equations (16) and (17).
Where ft is the tensile strength of concrete, MPa; S is the relative slip, mm; D is the diameter of rebars, mm; c is the thickness of the RC cover, mm; and ρsv is the stirrup ratio per unit area.
The deduction coefficient of post-fire bond strength ksT is:
The deduction coefficient of post-fire limit slip kτT is:
The spring elements used to simulate the bond and slip between the rebars and the NAC were consistent with the previous description. The spring elements were also inserted in the X, Y, and Z directions. Among them, linear springs were used in the Y and Z directions, and nonlinear springs were used in the X direction to simulate the bond–slip relation between rebars and NAC. The bond–slip relationship was also converted from the bond stress-slip relation, as was shown in Equation (12).
5.3. Test from the Reference
In reference, the specimens after exposure to fire for 0 min, 60 min, and 90 min were numbered D1, C1, and C2, respectively. The dimensions and reinforcement conditions of the beam-column joints specimens were consistent with the previous description of that SAC. The elastic modulus of C30 concrete measured at ambient temperature was 33000 MPa, and cubic and axial compressive strengths were 31.9 and 21.3 MPa, respectively. Additionally, the details of fire exposure conditions can be found in reference [26].
5.4. Validation Results
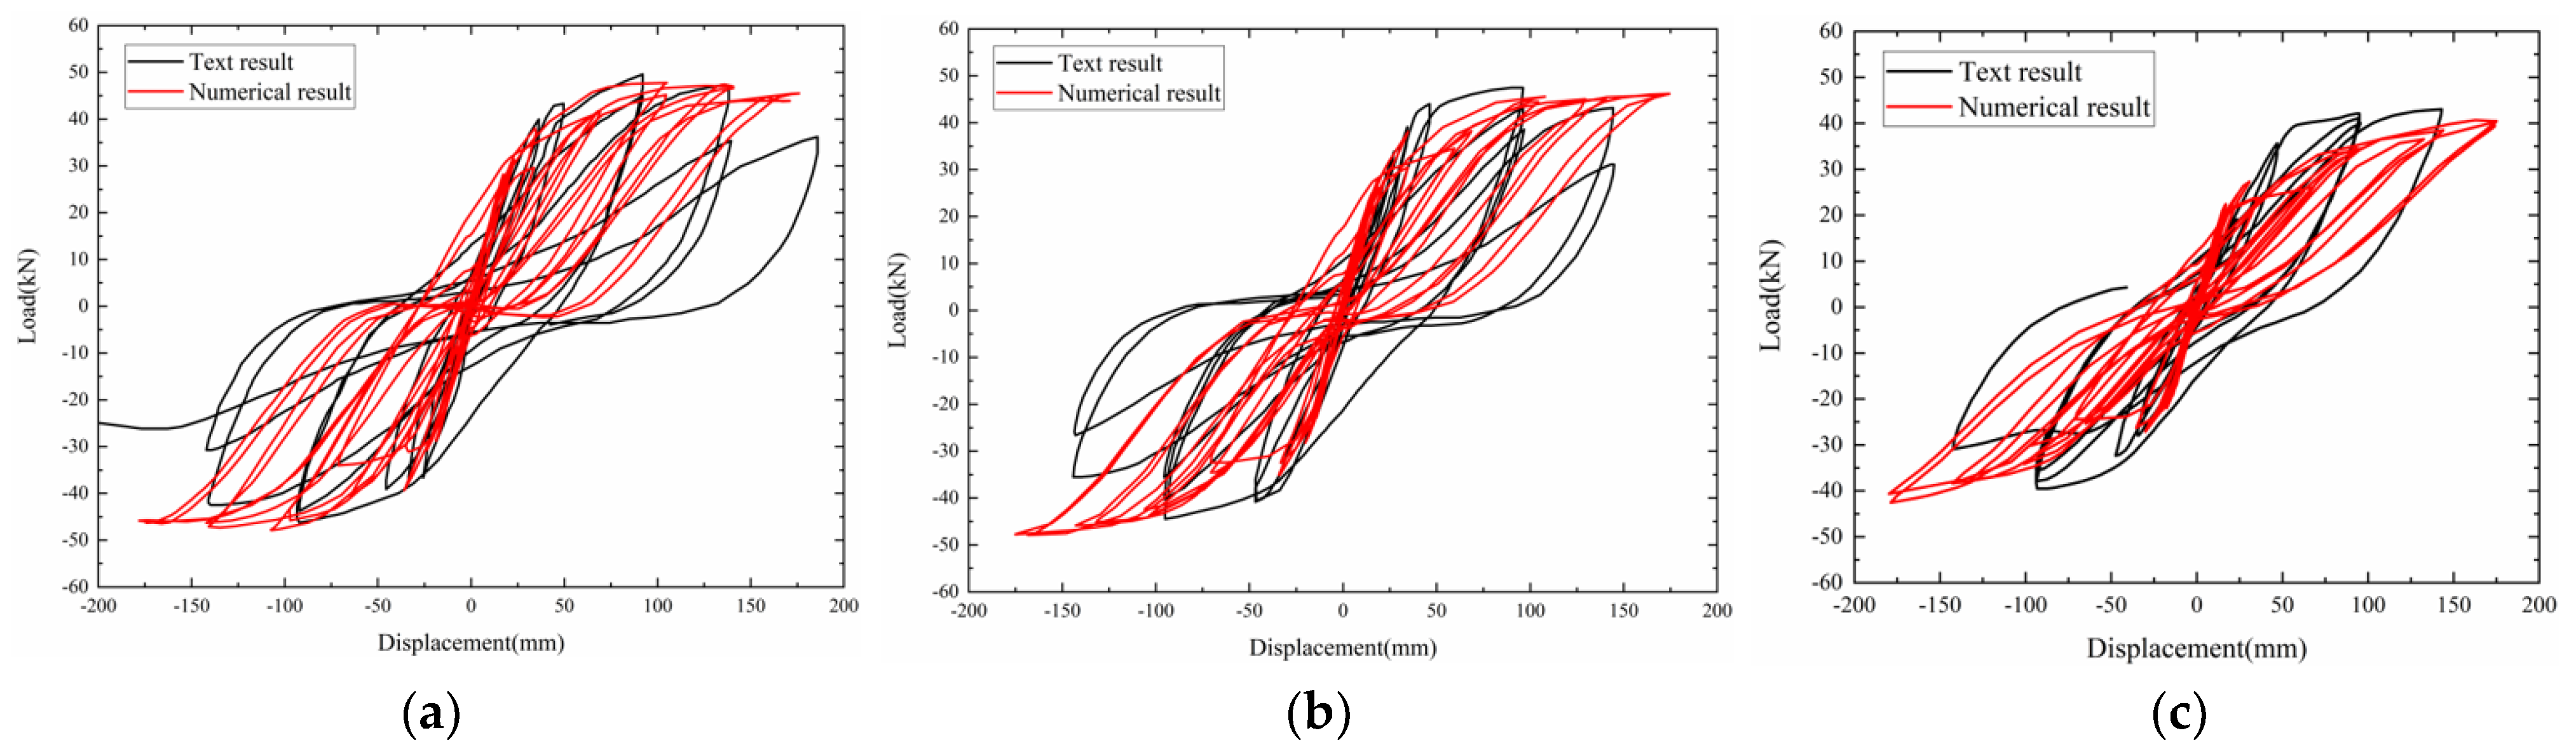
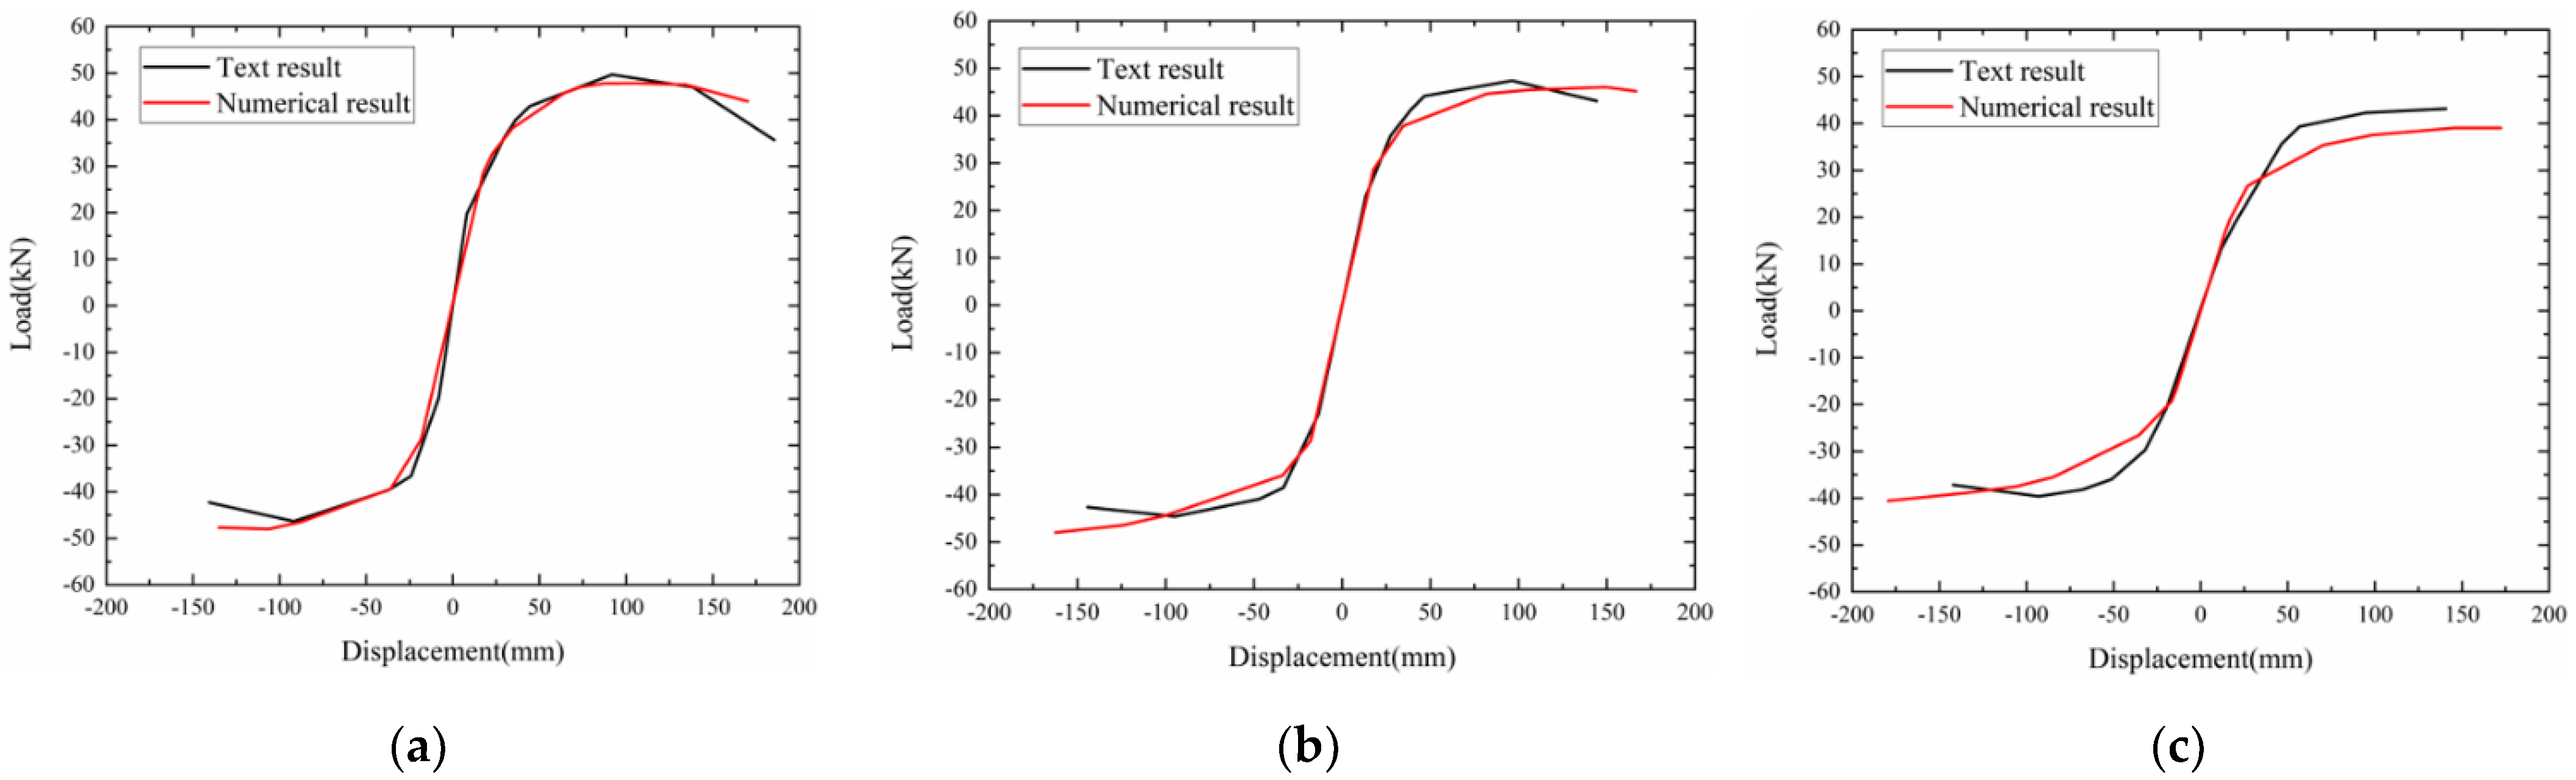
Figure 12 shows the longitudinal load p and longitudinal slip Δ hysteretic curves of beam ends determined by the FEM in comparison with the result of the test [26]. At early loading, the curve slopes changed very slightly, the unload curves and the load curves formed minor hysteretic loops, and the rigidity was nearly unchanged, indicating the specimens were at the elastic stage. After the specimens cracked, the curve slopes gradually decreased with the increment of slip and cycle number, especially after the occurrence of rebars yielding. After the rebars yielding, with the slight increment of slips, the loads peaked, and with the increase of cycles, the rigidity and strength both deteriorated. With the prolonging of fire exposure, the bearing capacity and limit slip from both simulations and tests declined, and the simulations accurately reflected the changing trends of post-fire seismic performances.
Figure 13 shows that the skeleton curves from our simulation and previous tests were both S-shaped, indicating the failure processes were similar. At the elastic stage, the slip linearly increased with the rising load, and the rigidity recovered in the same way during the unloading. At the plastic stage, with the increment of loading, the curve slopes gradually declined, and the rigidity of joint was weakened. At the failure stage, the curves, after reaching the limit bearing capacity, started to decline. After first unloading and then re-loading, the rigidity could not recover and severely decreased. With the prolonging of fire exposure, the slopes and limit deformations on skeleton curves at early loading stage all declined in both the tests and our simulations.
Combining Figure 12 and Figure 13, there were some errors between the simulation results and the test results since the changes of post-fire mechanical properties were random to some extent. For instance, the initial stiffness errors of D1, C1, and C2 specimens were 0.9%, 1.1%, and 2.3%, respectively; the ultimate bearing capacity errors of D1 and C1 were, respectively, 1.3% and 4.7%, and that of C2 was 7.8%. However, the simulation results and the test results were generally consistent, which indicated the FEM was accurate and effective.
Accordingly, the FEM built here could be used to analyze and compute the skeleton curves, bearing capacity, rigidity, energy dissipation ability, and failure modes of post-fire RC beam-column joints. Based on this, the results of the previous simulation analysis of the seismic performance of SAC beam-column joints after fire with our FEM proved to be valid and worthy of study.
6. Analysis of the Effect of Different Parameters on Seismic Performance of Post-Fire SAC Beam-Column Joints
Based on the validated FEM above, the effects of other parameters, namely, ratio of reinforcement and axial compression ratio, on the post-fire seismic performance of SAC beam-column joints were simulated and analyzed in addition to the effects of the time for exposure to fire. The numbers and corresponding parameters of the simulated specimens are shown in Table 8.
6.1. Analysis of the Effects of Fire Time
As can be seen from Figure 8, at the beginning of loading, the slope of the curve after different fire times changed slightly, the hysteresis curve was linear, the unloading curve formed a small hysteresis loop with the loading curve, the stiffness of the joints hardly changed, and the specimen was in the elastic stage. As the displacement and the number of cycles increased, the curves became non-linear and the slope decreased. After yielding the reinforcement, the load increased slightly with displacement, and as the load reached its peak, the hysteresis curves tended to move along the displacement axis and take a spindle shape. The area surrounded by the loops gradually increased, and the energy dissipation capacity increased. After the peak load, the hysteresis curves first changed from a spindle shape to a bow shape and then to an inverse-S-shape.
With the increasing of fire time, the pinching effect of the hysteresis curves became larger, and the bearing capacity and ultimate displacement of the joints both decreased, indicating that the ductility of joints decreased with the increase of fire time. The area enclosed by the hysteresis curves gradually decreased, and the energy dissipation capacity of the joints obviously deteriorated, especially after fire time for 90 min. From Figure 9 and Figure 10 it can be seen that, with the loading of displacement, the stiffness of joints degraded to different degrees, and the stiffness degradation curves before yielding were relatively steep, while they tended to be flat after yielding; with the increasing of fire time, the stiffness of joints degraded continuously; the initial secant stiffness of SAC60-0.012-0.3 and SAC90-0.012-0.3 were approximately 88.9% and 83.9% of that of SAC0-0.012-0.3, respectively; SAC60-0.012-0.3 and SAC90-0.012-0.3 show significant degradation at displacements of 34.51 mm, 33.70 mm, and 34.67 mm, respectively, which might be mainly due to cracking of the concrete, yielding of the reinforcement, and degradation of the concrete in the joint core zone.
6.2. Analysis of the Effects of Reinforcement Ratio
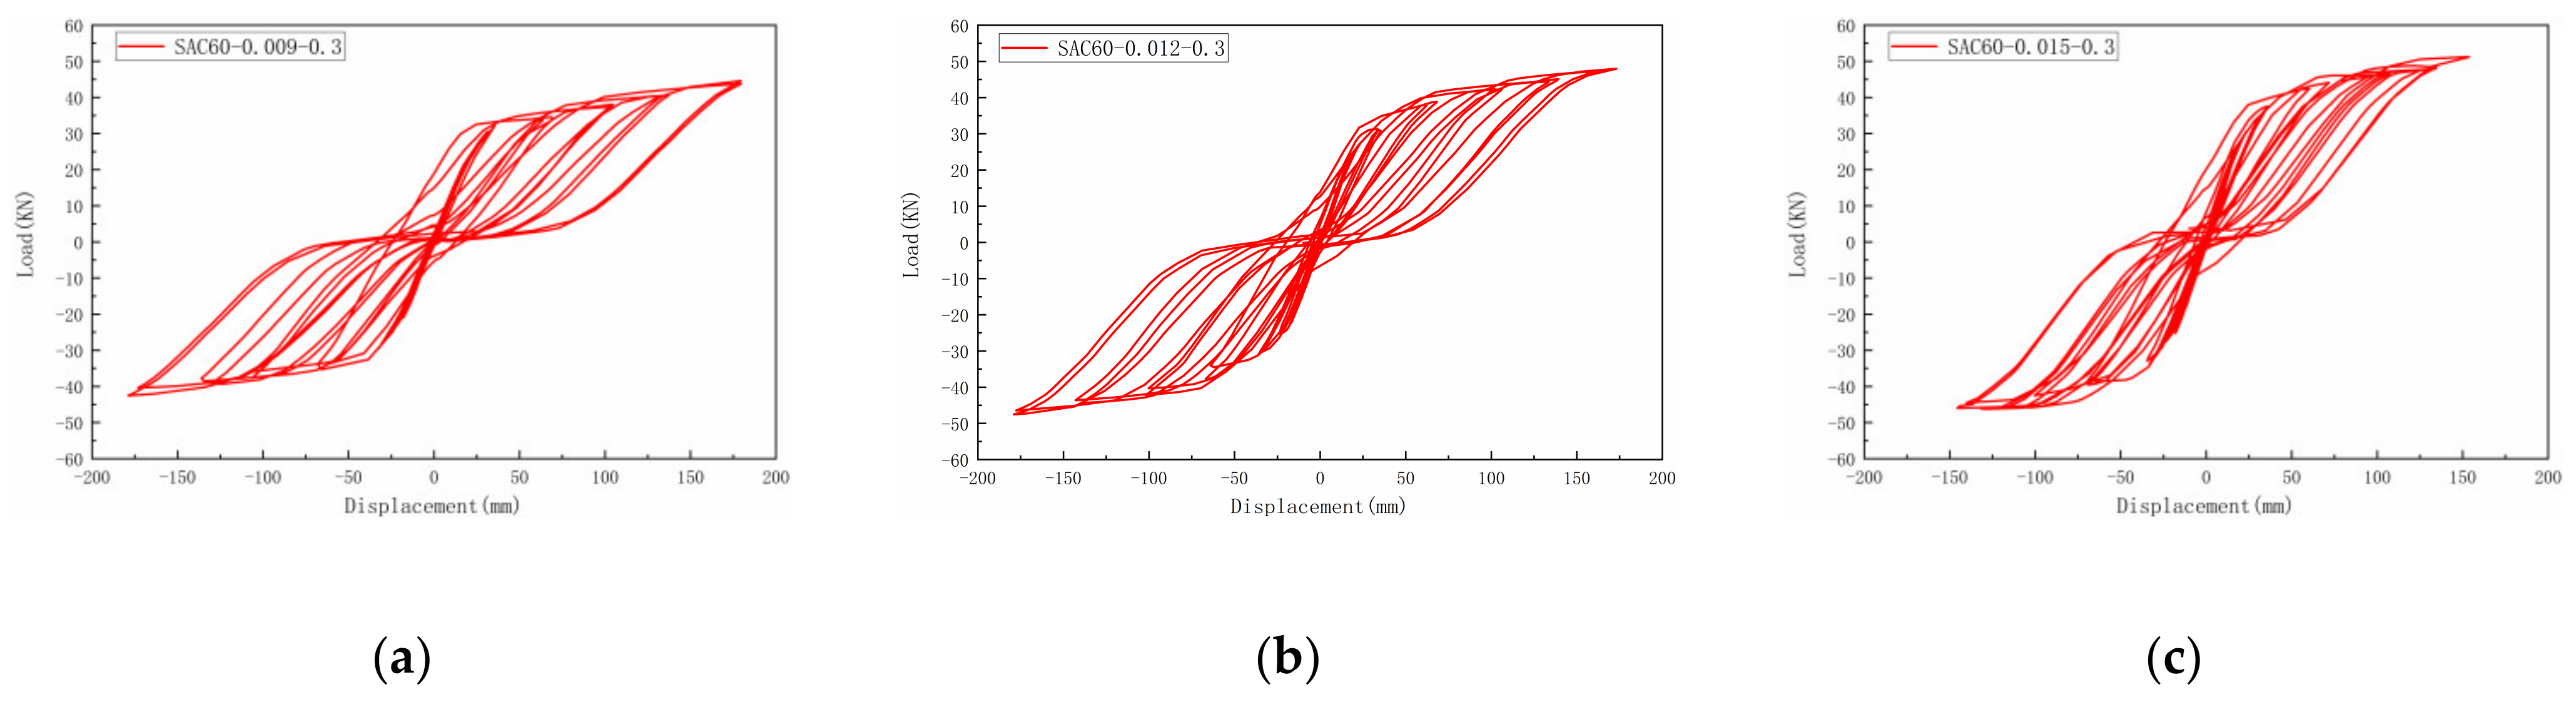
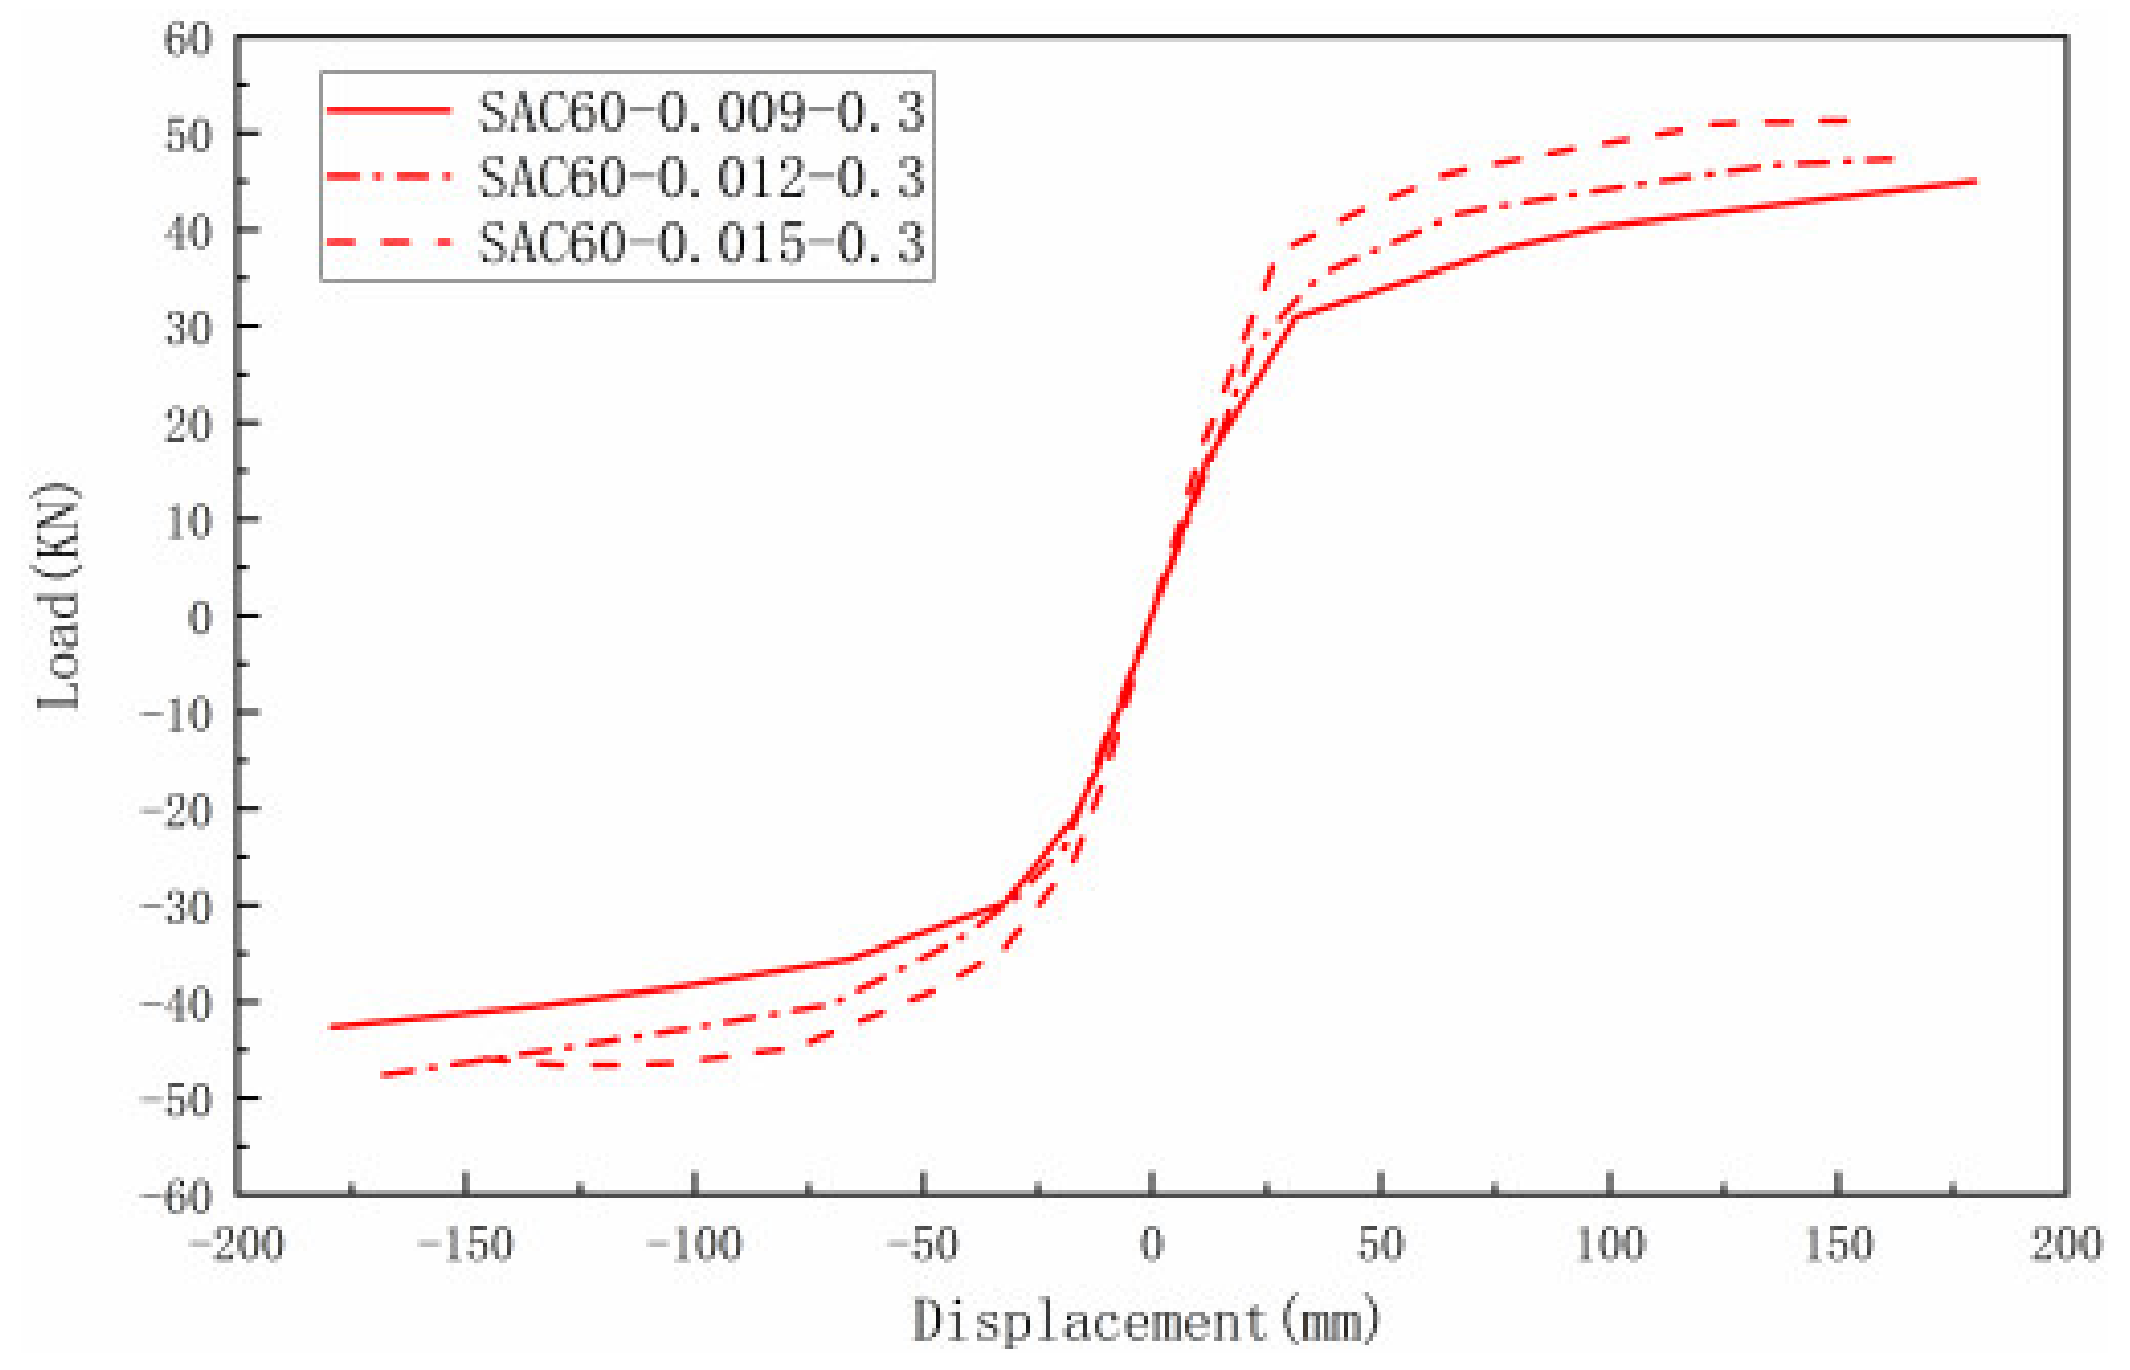
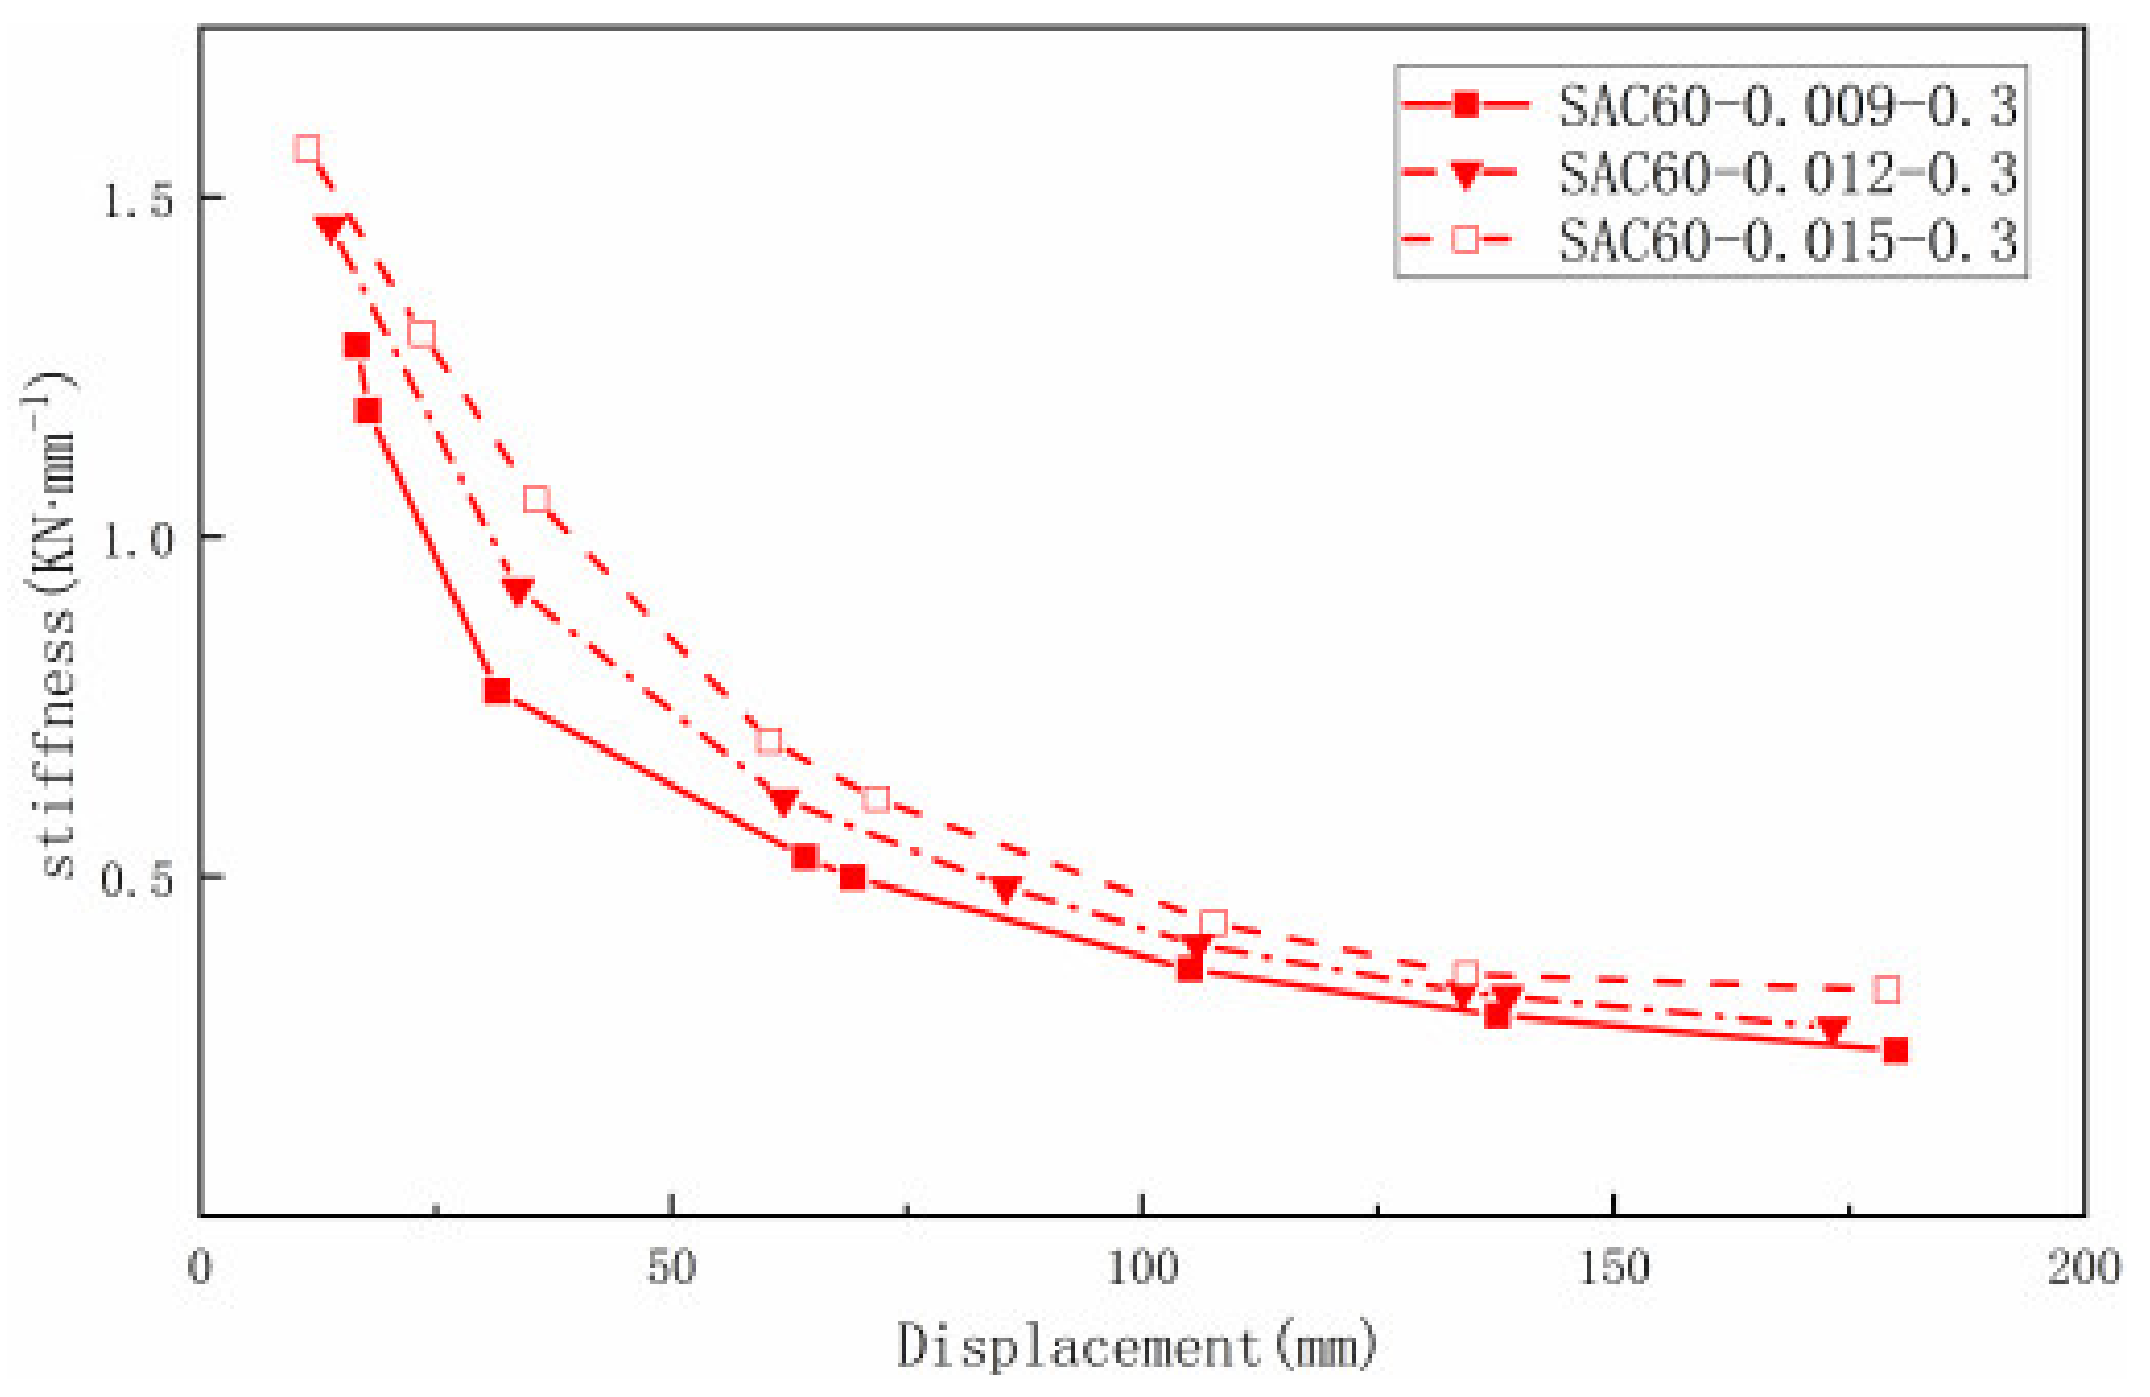
Figure 14 shows the displacement-load hysteresis curves of joint specimens with different tensile reinforcement ratios, and Figure 15 shows the corresponding skeleton curves. Figure 16 shows the relationship between stiffness degradation and displacement for different tensile reinforcement ratios.
From Figure 14, with the increasing of reinforcement ratio, the joints’ bearing capacity slightly increased, but the fullness of the hysteresis curve gradually decreased, and the ultimate displacement gradually decreased; especially, the SAC60-0.015-0.3 ultimate displacement decreased most obviously, which indicated that the increasing of longitudinal tensile reinforcement ratio could improve the strength of the joints, but it also caused the reduction of ductility and energy dissipation capacity, which was consistent with the reference [10]. From Figure 15 and Figure 16, it can be seen that the overall stiffness of the joints increased with the increasing of the reinforcement ratio, indicating that the increasing of the reinforcement ratio in a certain range could enhance the stiffness of the joints, which was due to the fact that after the concrete cracks, the main tensile force was carried by the reinforcement, and the different reinforcement ratios had a greater impact on the position of the neutral axis in the sections of joints and the stiffness of joints. SAC60-0.009-0.3 and SAC60-0.012-0.3 show significant stiffness degradation at displacements of 31.54 mm and 33.69 mm, respectively, while the overall stiffness degradation curve of SAC60-0.015-0.3 was flatter because the increasing of reinforcement ratio increases the bond between the reinforcement and concrete and thus delays the yielding of the joints.
6.3. Analysis of the Effects of Axial Compression Ratio
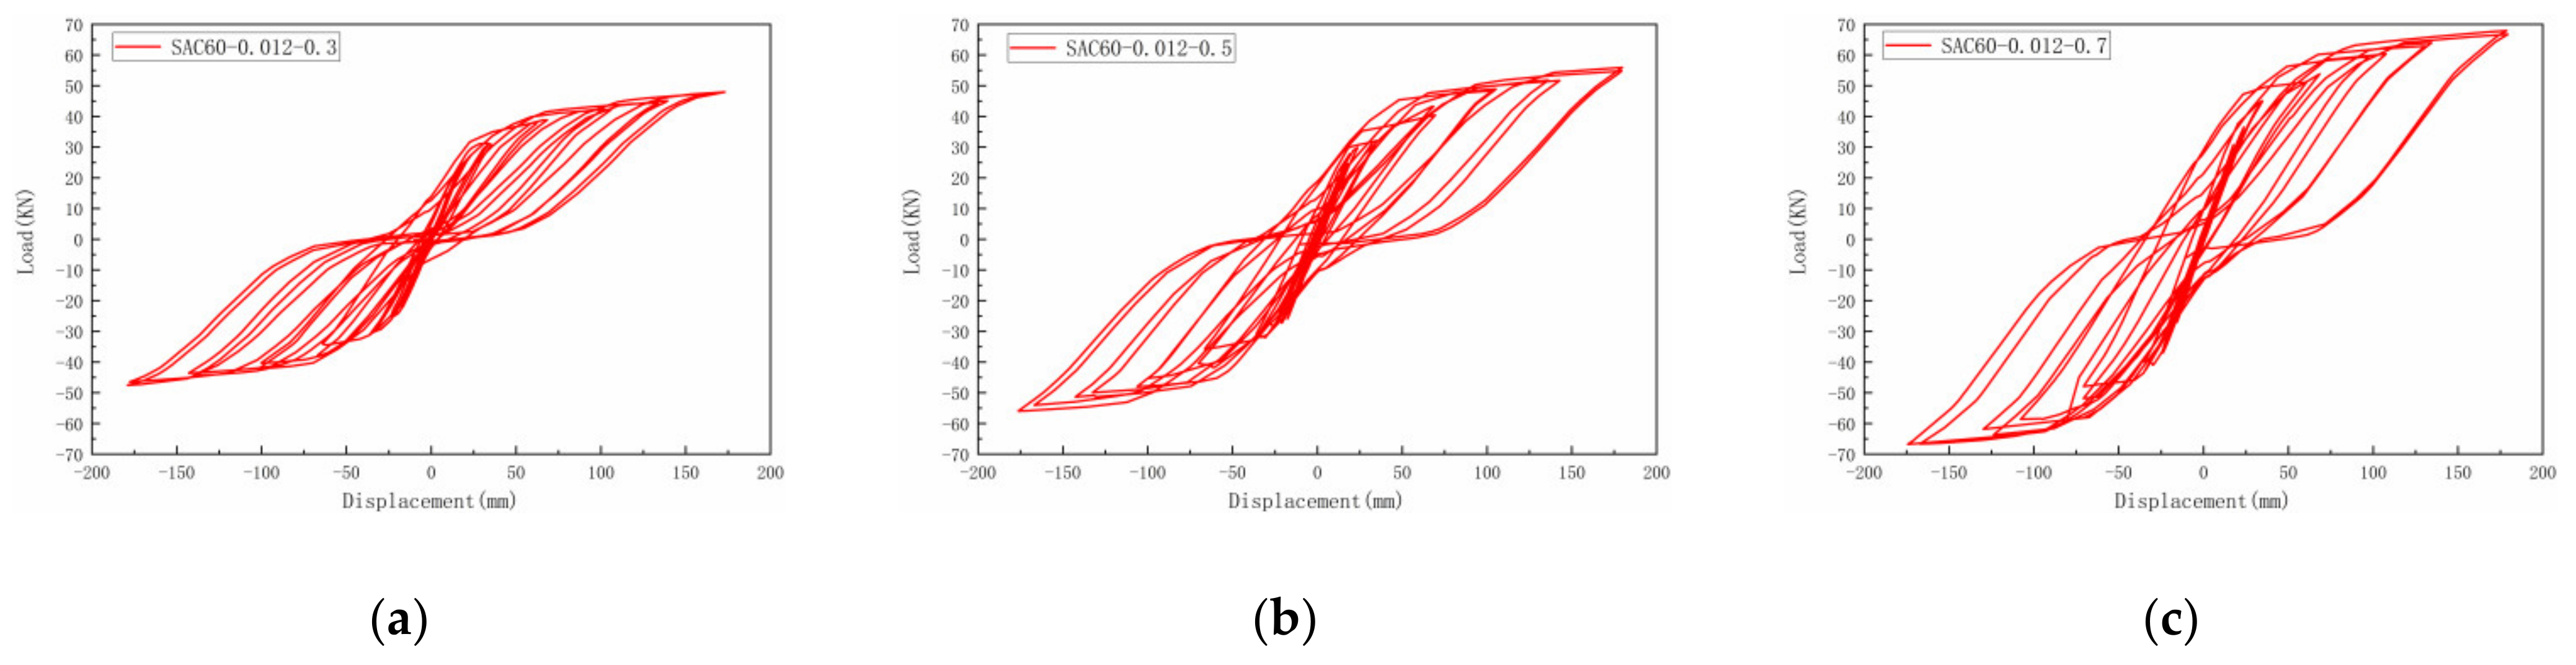
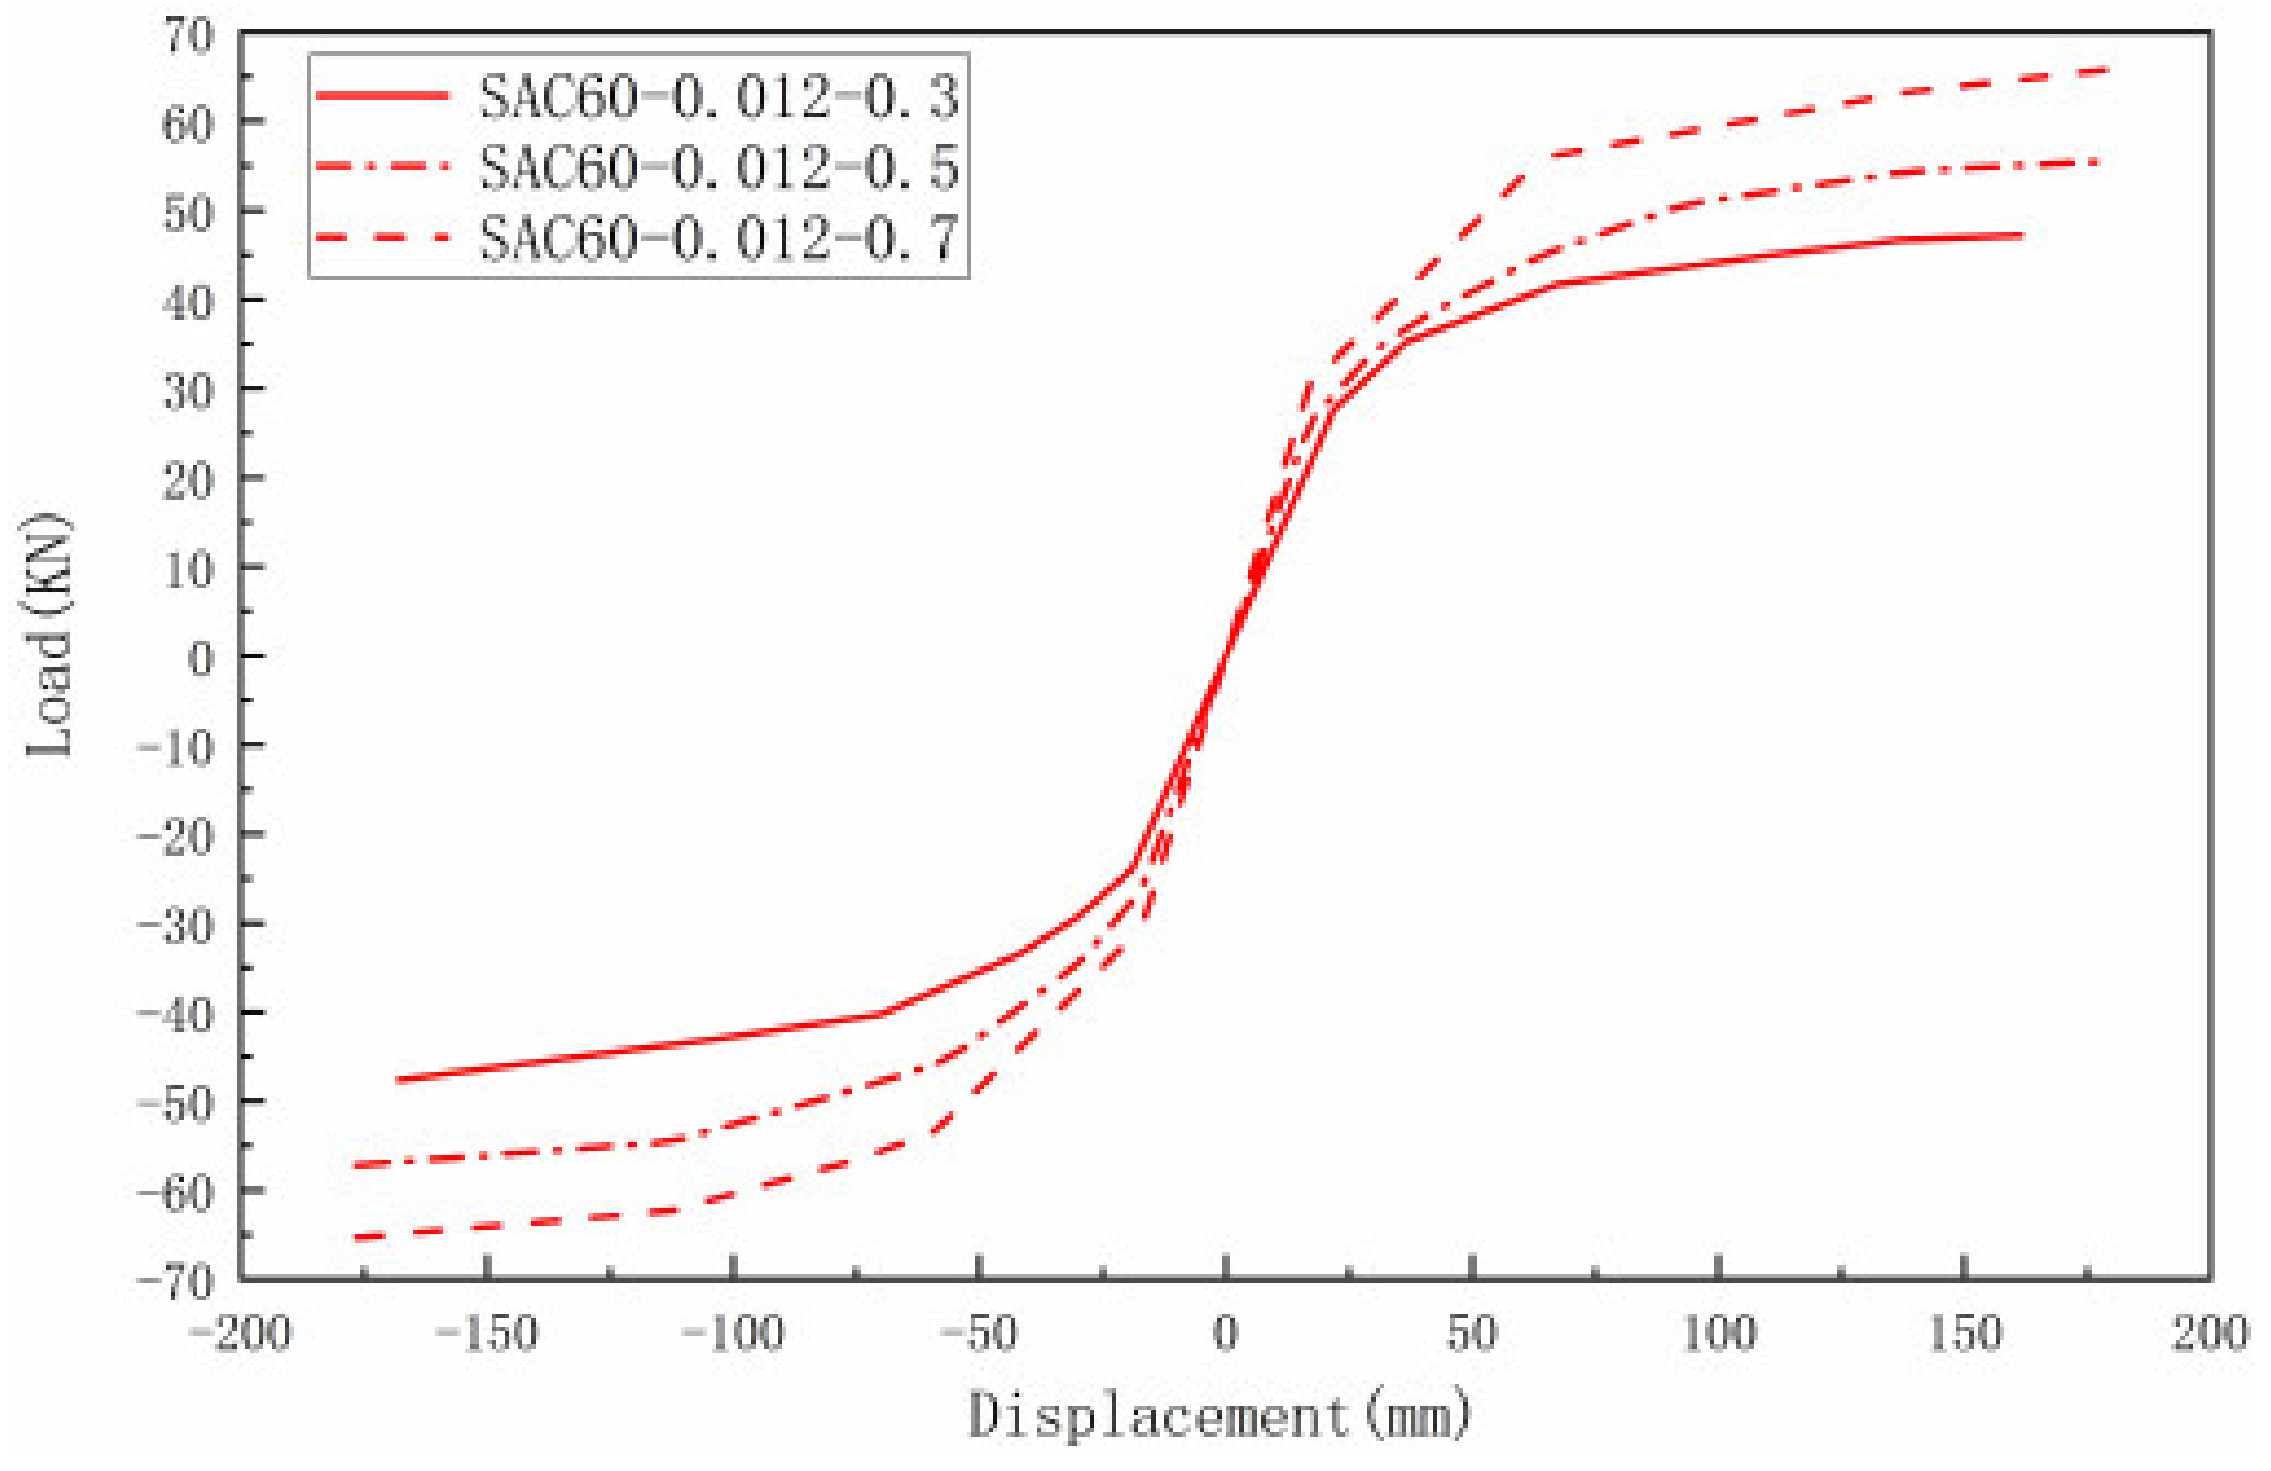
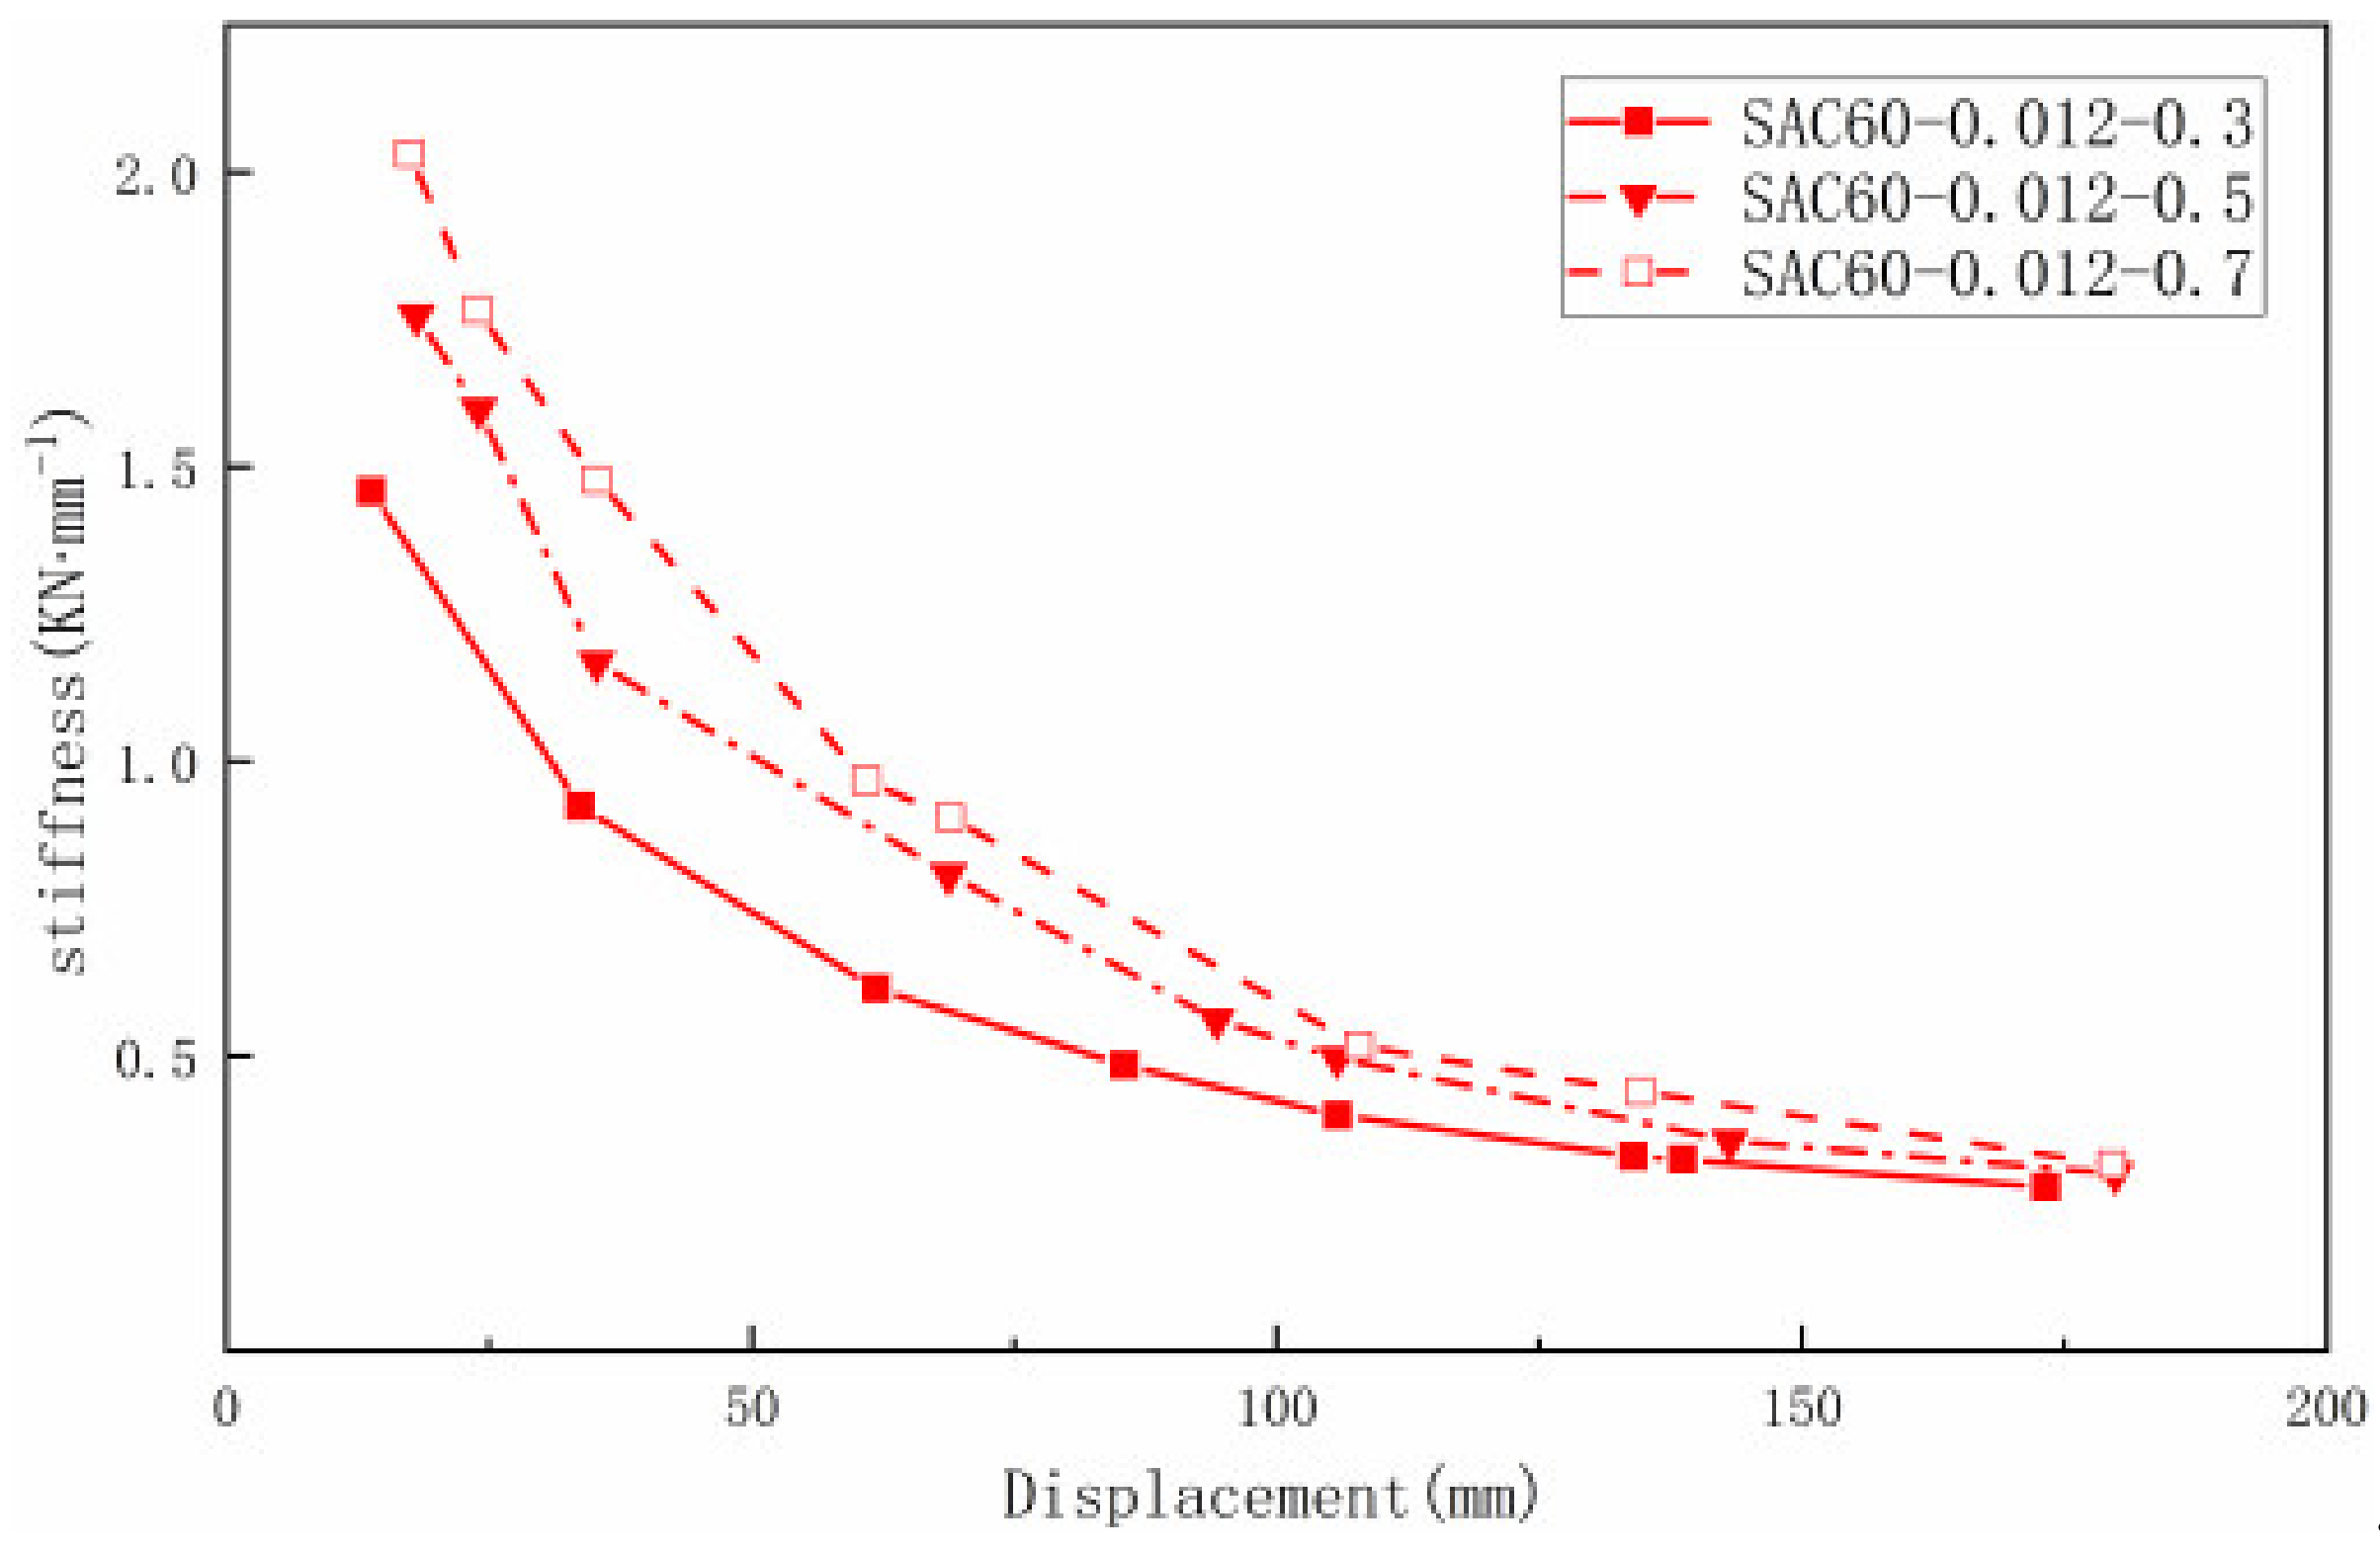
Figure 17 shows the displacement-load hysteresis curves of the joint specimens with different axial compression ratios, and Figure 18 shows the corresponding skeleton curves. Figure 19 shows the relationship between stiffness degradation of joints and displacement with different axial compression ratios.
As can be seen in Figure 17, with the increase of axial compression ratio, the ultimate bearing capacity of the joints increased obviously, the ultimate displacement increased slightly, and the pinching effect of the curves became weaker and the curves became fuller and fuller, which indicated that the increase of axial compression ratio could increase the strength, ductility, and energy dissipation capacity of the joints since, on the one hand, the increase of axial pressure ratio reduced the upward shift of the neutral axis of the beam section in the joint core zone of beam-column joints and increased the compression zone, and, on the other hand, the larger axial loading strengthened the bond between the longitudinal reinforcement and the concrete in the beam, which reduced the effect of the pinching of the curves and thus increased the energy dissipation capacity of the joints. It can be seen from Figure 18 and Figure 19 that SAC60-0.012-0.7 and SAC60-0.012-0.5 were 1.39 times and 1.20 times that of SAC60-0.012-0.3, respectively. This indicates that the increase in axial compression ratio can significantly increase the initial stiffness of the joint, and as the axial compression ratio increases, the degradation of joint stiffness is gradually delayed.
7. Conclusions
In this paper, nonlinear spring elements were used to simulate the bond–slip between rebars and SAC in seismic post-fire analysis. In addition, our FEM was validated by comparing and analyzing the results of simulation and the test [26]. Then, the effects of different parameters on seismic performance of post-fire SAC beam-column joints were analyzed. The main conclusions can be made as follows:
- (1)
- The simulated hysteretic curves and skeleton curves are in good agreement with the test data, indicating the proposed FEM is accurate and can be used to predict the seismic behaviors of post-fire SAC beam-column joints.
- (2)
- Nonlinear spring elements were used between the reinforcement and concrete with both scoria and natural aggregate to simulate the bond–slip behavior. The spring elements can simulate the pinching hysteretic curves well and avoid the overestimation of seismic performance of post-fire RC beam-column joints.
- (3)
- Analysis of the simulation results shows that the increase of fire time causes a significant decrease in the load bearing capacity, stiffness, and energy dissipation capacity of the SAC joints. The application of spring elements can simulate the pinching effect of the hysteresis curves well, but the simulations of the falling section of the curves are not very obvious, which may be caused by the insufficient consideration of the spalling of concrete after high temperature by the FEM delaying the strength degradation of the concrete.
- (4)
- Although the increase in the reinforcement ratio of tensile rebars can slightly increase the strength and stiffness of the SAC joints, an excessively high reinforcement ratio will weaken the energy dissipation capacity and ductility of the SAC joints. Therefore, when the reinforcement ratio exceeds 1.5%, it will be detrimental to the seismic performance of post-fire SAC structures.
- (5)
- The increase of the axial compression ratio can increase the strength and initial stiffness of the SAC joints, reduce the degrees of pinching effects of the hysteretic curves, increase the energy dissipation capacity of the SAC joints, and delay the stiffness degradation of the SAC joints.
In summary, the application of spring elements in the seismic model of post-fire SAC beam-column joints reflects the influence of various parameters on the seismic performance of post-fire SAC beam-column joints well, but there are still certain shortcomings. For instance, the simulations of the falling section of the hysteresis curves are not very obvious; the fitting accuracy for stiffness, bearing strength, and pinching effect by the FEM needs to be improved. Hence, the tests on the seismic performance of post-fire SAC beam-column joints will be designed and carried out to verify the consistency of the FEM and provide a basis for further optimization of the FEM.
Author Contributions
Conceptualization, B.C. and F.F.; methodology, B.C. and F.F.; software, W.-L.H.; validation, W.-L.H.; formal analysis, W.-L.H.; investigation, W.-L.H.; resources, B.C.; data curation, B.C.; writing—original draft preparation, W.-L.H. and F.F.; writing—review and editing, W.-L.H. and F.F.; visualization, B.C.; supervision, B.C.; project administration, B.C.; funding acquisition, B.C. All authors have read and agreed to the published version of the manuscript.
Funding
This research was funded by of Scientific research projects of education department of Jilin province, grant number JJKH20210279KJ; China Scholarship Council, grant number 201805975002; National Science Foundation of China, grant number. 51678274, 51968013; and Science and Technological Planning Project of Ministry of Housing and Urban–Rural Development of the People’s Republic of China, grant number. 2017-K9-047 and The APC was funded by Jilin Jianzhu University.
Institutional Review Board Statement
Not applicable.
Informed Consent Statement
Not applicable.
Data Availability Statement
The data used to support the findings of this study are available from the authors upon request.
Acknowledgments
The authors wish to acknowledge the sponsors. However, any opinions, findings, conclusions, and recommendations presented in this paper are those of the authors and do not necessarily reflect the views of the sponsors.
Conflicts of Interest
The authors declare that they have no competing interest.
References
- Ni, S.; Birely, A.C. Post-fire seismic behavior of reinforced concrete structural walls. Eng. Struct. 2018, 168, 163–178. [Google Scholar] [CrossRef]
- Ni, S.; Birely, A.C. Simulation procedure for the post-fire seismic analysis of reinforced concrete structural walls. Fire Saf. J. 2018, 95, 101–112. [Google Scholar] [CrossRef]
- Al-Ameri, R.A.; Abid, S.R.; Murali, G.; Ali, S.H.; Özakça, M. Residual Repeated Impact Strength of Concrete Exposed to Elevated Temperatures. Crystals 2021, 11, 941. [Google Scholar] [CrossRef]
- Drozdzol, K. Thermal and Mechanical Studies of Perlite Concrete Casing for Chimneys in Residential Buildings. Materials 2021, 14, 2011. [Google Scholar] [CrossRef] [PubMed]
- Chen, Y.-H.; Chang, Y.-F.; Yao, G.C.; Sheu, M.-S. Experimental research on post-fire behavior of reinforced concrete columns. Fire Saf. J. 2009, 44, 741–748. [Google Scholar] [CrossRef]
- Yu-ye, X.; Yan-qing, L.; Qing-wen, Y.; Bi-lan, L. Experimental study on seismic performance of concrete short columns after fire and strengthened with CFRP. Eng. Mech. 2014, 31, 92–100. [Google Scholar] [CrossRef]
- Sun, C.Z.; Wu, R.X.; Zhao, H.N. Research on concrete columns seismic performance of super early-strength composite fibers after high temperature. In Applied Mechanics and Materials; Trans Tech Publications, Ltd.: Zurich, Switzerland, 2014; pp. 2671–2674. [Google Scholar]
- Li, L.-Z.; Liu, X.; Yu, J.-T.; Lu, Z.-D.; Su, M.-N.; Liao, J.-H.; Xia, M. Experimental study on seismic performance of post-fire reinforced concrete frames. Eng. Struct. 2019, 179, 161–173. [Google Scholar] [CrossRef]
- Libre, N.A.; Shekarchi, M.; Mahoutian, M.; Soroushian, P. Mechanical properties of hybrid fiber reinforced lightweight aggregate concrete made with natural pumice. Constr. Build. Mater. 2011, 25, 2458–2464. [Google Scholar] [CrossRef]
- Hu, B.; Kundu, T. Seismic performance of interior and exterior beam–column joints in recycled aggregate concrete frames. J. Struct. Eng. 2019, 145, 04018262. [Google Scholar] [CrossRef]
- Faleschini, F.; Bragolusi, P.; Zanini, M.A.; Zampieri, P.; Pellegrino, C. Experimental and numerical investigation on the cyclic behavior of RC beam column joints with EAF slag concrete. Eng. Struct. 2017, 152, 335–347. [Google Scholar] [CrossRef]
- Xu, Z.; Chen, Z.; Yang, S. Effect of a new type of high-strength lightweight foamed concrete on seismic performance of cold-formed steel shear walls. Constr. Build. Mater. 2018, 181, 287–300. [Google Scholar] [CrossRef]
- Cai, B. Reliability analysis of post-fire flexural load bearing capacity of volcanic slag concrete beams. Fire Sci. Technol. 2019, 38, 874–879. [Google Scholar]
- Yang, D.L.; Bin, L.I.; Wei-Shi, L.I.; Xia, J.L.; Zhou, Y.X. Domestic and Overseas Research and Utilization on Lightweight Aggregate Concrete Prepared with Scoria. World Build. Mater. 2017, 38, 26–30. [Google Scholar]
- Qian, K.; Liang, S.-L.; Xiong, X.-Y.; Fu, F.; Fang, Q. Quasi-static and dynamic behavior of precast concrete frames with high performance dry connections subjected to loss of a penultimate column scenario. Eng. Struct. 2020, 205, 110115. [Google Scholar] [CrossRef]
- Ni, S.; Birely, A. Post-fire earthquake resistance of reinforced concrete structural walls. In Proceedings of the 11th Canadian Conference on Earthquake Engineering, Victoria, BC, Canada, 21–24 July 2015; pp. 1–9. [Google Scholar]
- Faleschini, F.; Hofer, L.; Zanini, M.A.; dalla Benetta, M.; Pellegrino, C. Experimental behavior of beam-column joints made with EAF concrete under cyclic loading. Eng. Struct. 2017, 139, 81–95. [Google Scholar] [CrossRef]
- Do, T.N.; Filippou, F.C. A damage model for structures with degrading response. Earthq. Eng. Struct. Dyn. 2018, 47, 311–332. [Google Scholar] [CrossRef]
- Mazza, F. A plastic-damage hysteretic model to reproduce strength stiffness degradation. Bull. Earthq. Eng. 2019, 17, 3517–3544. [Google Scholar] [CrossRef]
- Mazza, F. Seismic vulnerability and retrofitting by damped braces of fire-damaged rc framed buildings. Eng. Struct. 2015, 101, 179–192. [Google Scholar] [CrossRef]
- Mazza, F. Residual seismic load capacity of fire-damaged rubber bearings of rc base-isolated buildings. Eng. Fail. Anal. 2017, 79, 951–970. [Google Scholar] [CrossRef]
- Miao, J.; Cheng, W.P.; Song, Y.P. Finite element analysis for prefabricated parts of SRC frame beam-column joints. J. Dalian Univ. Technol. 2014, 54, 568–574. [Google Scholar] [CrossRef]
- Li, C.; Li, Q.; Li, X.; Zhang, X.; Zhao, S. Elasto-plastic Bending Behaviors of Steel Fiber Reinforced Expanded-shale Lightweight Concrete Beams Analyzed by Nonlinear Finite-element Method. Case Stud. Constr. Mater. 2020, 13, e00372. [Google Scholar] [CrossRef]
- Zhang, J.W.; Guo, S.H. Finite Element Analysis of the Pull-Out Specimens of Steel Reinforced Lightweight Concrete. In Applied Mechanics and Materials; Trans Tech Publications, Ltd.: Zurich, Switzerland, 2012; pp. 514–519. [Google Scholar]
- Liu, X.; Liu, Y.; Wu, T.; Wei, H. Bond-slip properties between lightweight aggregate concrete and rebar. Constr. Build. Mater. 2020, 255, 119355. [Google Scholar] [CrossRef]
- Wang, Y.; Fu, C.; Qiu, H. Experimental study on seismic behavior of reinforced concrete frame joints after fire. J. Build. Struct. 2009, 30, 121–127. [Google Scholar]
- EN 1994-1-2. Eurocode 4: Design of Composite Steel and Concrete Structures—Part 1–2: General Rules—Structural Fire Design; European Committee for Standardization: Brussels, Belgium, 2005. [Google Scholar]
- EN 1992-1-2. Eurocode 2: Design of Concrete Structures—Part 1–2: General Rules—Structural Fire Design; European Committee for Standardization: Brussels, Belgium, 2004. [Google Scholar]
- Cai, B.; Li, B.; Fu, F. Finite element analysis and calculation method of residual flexural capacity of post-fire RC beams. Int. J. Concr. Struct. Mater. 2020, 14, 1–17. [Google Scholar] [CrossRef]
- Fu, F. Advanced Modelling Techniques in Structural Design; John Wiley & Sons: Oxford, UK, 2015; ISBN 978-1-118-82543-3. [Google Scholar]
- Fu, F. 3D finite element analysis of the whole-building behavior of tall building in fire. Adv. Comput. Des. 2016, 1, 329–344. [Google Scholar] [CrossRef]
- Fu, F. Structural Analysis and Design to Prevent Disproportionate Collapse; CRC Press: Boca Raton, FL, USA, 2016; ISBN 978-1-4987-8820-5. [Google Scholar]
- Fu, F. Design and Analysis of Tall and Complex Structures; Butterworth-Heinemann: Oxford, UK, 2018; ISBN 978-0-08-101018-1. [Google Scholar]
- Fu, F. Fire induced progressive collapse potential assessment of steel framed buildings using machine learning. J. Constr. Steel Res. 2020, 166, 105918. [Google Scholar] [CrossRef]
- European Convention for Constructional Steelwork. N°55 Calculation of Centrally Loaded Composite Steel-Concrete Columns Exposed to the Standard Fire; ECCS: Brussels, Belgium, 1988. [Google Scholar]
- Qian, K.; Liang, S.-L.; Fu, F.; Fang, Q. Progressive collapse resistance of precast concrete beam-column sub-assemblages with high-performance dry connections. Eng. Struct. 2019, 198, 109552. [Google Scholar] [CrossRef]
- Fu, F.; Parke, G.A.R. Assessment of the Progressive Collapse Resistance of Double-Layer Grid Space Structures Using Implicit and Explicit Methods. Int. J. Steel Struct. 2018, 18, 831–842. [Google Scholar] [CrossRef]
- Wang, L.; Shen, N.; Zhang, M.; Fu, F.; Qian, K. Bond performance of Steel-CFRP bar reinforced coral concrete beams. Constr. Build. Mater. 2020, 245, 118456. [Google Scholar] [CrossRef]
- Fu, F.; Lam, D.; Ye, J. Moment resistance and rotation capacity of semi-rigid composite connections with precast hollowcore slabs. J. Constr. Steel Res. 2010, 66, 452–461. [Google Scholar] [CrossRef]
- ShuGuang, H. Light Aggregate Concrete; Chemical Industry Press: Shanghai, China, 2006; ISBN 7-5025-8208-8. [Google Scholar]
- GB 50010-2010. Technical Specification for Concrete Structure; China Architecture & Building Press: Beijing, China, 2015. [Google Scholar]
- Sidoroff, F. Description of anisotropic damage application to elasticity. In Physical Non-Linearities in Structural Analysis; Springer: Berlin/Heidelberg, Germany, 1981; pp. 237–244. [Google Scholar] [CrossRef]
- Shen, R.; Feng, L.; Rong, K. Evaluation of rebar mechanical properties after high temperature (Fire Exposure). Sichuan Build. Sci. 1991, 2, 5–9. [Google Scholar]
- Cai, B.; Wu, A.; Fu, F. Bond behavior of PP fiber-reinforced cinder concrete after fire exposure. Comput. Concr. 2020, 26, 115–125. [Google Scholar]
- JGJ/T101-2015. Specification for Seismic Test of Buildings; China Architecture & Building Press: Beijing, China, 2015. [Google Scholar]
- Yan, J.L.; Hu, Y. The effects of high temperature on compressive strength of concrete. China Civ. Eng. J. 2002, 35, 17–19. [Google Scholar]
- Yu, Z.-W.; Ding, F.-X.; Luo, J.-P. Experimental research on mechanical properties of different type of concrete after high temperature. J. Saf. Environ. 2005, 5, 1–6. [Google Scholar]
- Yu, Z.; Ding, F. Unified calculation method of compressive mechanical properties of concrete. J. Build. Struct. 2003, 24, 41–46. [Google Scholar]
- Hu, C.; Xu, Y.; Luo, Y.; Zheng, Y.; Lin, B. Experimental study on the tensile strength of concrete after high temperature. J. Huaqiao Univ. Nat. Sci. 2014, 35, 196–201. [Google Scholar]
- Song, T. Research on Post-Fire Performance of Steel-Concrete Composite Beam-Column Joints. Ph.D. Thesis, Tsinghua University, Beijing, China, 2010. [Google Scholar]
Figure 1.
Analysis procedure for seismic performance of post-fire beam-column joints.

Figure 2.
The strength reduction of NAC and SAC after fire: (a) the cubic compressive strength reduction of NAC and SAC after fire; (b) the splitting tensile strength reduction of NAC and SAC after fire.
Figure 2.
The strength reduction of NAC and SAC after fire: (a) the cubic compressive strength reduction of NAC and SAC after fire; (b) the splitting tensile strength reduction of NAC and SAC after fire.

Figure 3.
The stress-strain curves of SAC after different temperatures: (a) stress-strain curves after different temperatures obtained from the test; (b) stress-strain curves after different temperatures obtained by regression fitting.
Figure 3.
The stress-strain curves of SAC after different temperatures: (a) stress-strain curves after different temperatures obtained from the test; (b) stress-strain curves after different temperatures obtained by regression fitting.

Figure 4.
Illustration of spring element setting: (a) spring element setting; (b) spring elements.

Figure 5.
Grid division.

Figure 6.
Spring cell setting.

Figure 7.
Dimensions and reinforcement of SAC beam-column joints.

Figure 8.
Hysteretic curves of SAC joints after exposure to different temperatures. (a) Specimen SAC0-0.012-0.3, (b) Specimen SAC60-0.012-0.3, (c) Specimen SAC90-0.012-0.3.
Figure 8.
Hysteretic curves of SAC joints after exposure to different temperatures. (a) Specimen SAC0-0.012-0.3, (b) Specimen SAC60-0.012-0.3, (c) Specimen SAC90-0.012-0.3.

Figure 9.
Skeleton curves of specimens.

Figure 10.
Relationship between stiffness degradation and displacement.

Figure 11.
The stress-strain curves of NAC after different temperatures.

Figure 12.
Comparison of hysteretic curves. (a) Specimen D1, (b) Specimen C1, (c) Specimen C2.

Figure 13.
Comparison of skeleton curves, (a) Specimen D1, (b) Specimen C1, (c) Specimen C2.

Figure 14.
Hysteresis curves with different reinforcement ratios, (a) Specimen SAC60-0.009-0.3, (b) Specimen SAC60-0.012-0.3, (c) Specimen SAC60-0.015-0.3.
Figure 14.
Hysteresis curves with different reinforcement ratios, (a) Specimen SAC60-0.009-0.3, (b) Specimen SAC60-0.012-0.3, (c) Specimen SAC60-0.015-0.3.

Figure 15.
Skeleton curves of specimens.

Figure 16.
Relationship between stiffness degradation and displacement.

Figure 17.
Hysteresis curves with different axial compression ratios, (a) Specimen SAC60-0.012-0.3, (b) Specimen SAC60-0.012-0.5, (c) Specimen SAC60-0.012-0.7.
Figure 17.
Hysteresis curves with different axial compression ratios, (a) Specimen SAC60-0.012-0.3, (b) Specimen SAC60-0.012-0.5, (c) Specimen SAC60-0.012-0.7.

Figure 18.
Skeleton curves of specimens.

Figure 19.
Relationship between stiffness degradation and displacement.


Table 1.
Strength of concrete after different temperatures.
| T (°C) | Cubic Compressive Strength (MPa) | Splitting Tensile Strength (MPa) | ||
|---|---|---|---|---|
| SAC | NAC | SAC | NAC | |
| 20 | 41.66 | 39.95 | 2.69 | 2.02 |
| 200 | 37.33 | 34.25 | 2.26 | 1.44 |
| 400 | 34.83 | 32.67 | 1.96 | 1.37 |
| 600 | 20.74 | 17.66 | 1 | 0.65 |
| 800 | 11.1 | 8.09 | 0.6 | 0.22 |
Table 2.
Mechanical properties of post-fire SAC obtained by regression fitting.
| Mechanical Properties | Equations |
|---|---|
| Cubic compressive strength | |
| Splitting tensile strength | |
| Peak strain | |
| Ultimate strain | |
| Elastic modulus |
Table 3.
Peak strain of concrete after different temperatures.
| T (°C) | Peak Strain | |
|---|---|---|
| SAC | NAC | |
| 20 | 0.00187 | 0.001887 |
| 200 | 0.001646 | 0.001551 |
| 400 | 0.002683 | 0.003564 |
| 600 | 0.003549 | 0.010222 |
| 800 | 0.005809 | 0.011266 |
Table 4.
Ultimate strain of concrete after different temperatures.
| T(°C) | Ultimate Strain | |
|---|---|---|
| SAC | NAC | |
| 20 | 0.00209 | 0.005243 |
| 200 | 0.00184 | 0.003438 |
| 400 | 0.003959 | 0.008294 |
| 600 | 0.008862 | 0.013817 |
| 800 | 0.015472 | 0.018866 |
Table 5.
Residual elastic modulus of concrete after different temperatures.
| T(°C) | Residual Elastic Modulus | |
|---|---|---|
| SAC | NAC | |
| 20 | 57,851 | 33,898 |
| 200 | 40,441 | 23,691 |
| 400 | 17,456 | 7100 |
| 600 | 7861 | 499 |
| 800 | 2039 | 229 |
Table 6.
Parameters of constitutive equation for post-fire SAC.
| T(°C) | n | |
|---|---|---|
| 20 | 1.898 | 49.31 |
| 200 | 2.17 | 72.44 |
| 400 | 1.827 | 9.993 |
| 600 | 2.201 | 1.079 |
| 800 | 1.991 | 0.676 |
Table 7.
Material parameters of rebars.
| Diameter/mm | Elastic Modulus/MPa | Yield Strength/MPa |
|---|---|---|
| 20 | 1.993 × 10⁵ | 484 |
| 16 | 2.053 × 10⁵ | 452.5 |
Table 8.
Numbers and parameters of joint specimens.
| Parameters | Time for Exposure to Fire (min) | Ratio of Reinforcement | Axial Compression Ratio | |
|---|---|---|---|---|
| Numbers | ||||
| SAC0-0.012-0.3 | 0 | 0.012 | 0.3 | |
| SAC60-0.012-0.3 | 60 | 0.012 | 0.3 | |
| SAC90-0.012-0.3 | 90 | 0.012 | 0.3 | |
| SAC60-0.009-0.3 | 60 | 0.009 | 0.3 | |
| SAC60-0.015-0.3 | 60 | 0.015 | 0.3 | |
| SAC60-0.012-0.5 | 60 | 0.012 | 0.5 | |
| SAC60-0.012-0.7 | 60 | 0.012 | 0.7 | |
Note: For example, in “SAC60-0.012-0.3”, “SAC” stands for SAC; “60” represents the time for exposure to fire in 60 min; “0.012” stands for the beam’s longitudinal tensile reinforcement ratio; and “0.3” represents the axial compression ratio.
Publisher’s Note: MDPI stays neutral with regard to jurisdictional claims in published maps and institutional affiliations. |
© 2021 by the authors. Licensee MDPI, Basel, Switzerland. This article is an open access article distributed under the terms and conditions of the Creative Commons Attribution (CC BY) license (https://creativecommons.org/licenses/by/4.0/).
Share and Cite
MDPI and ACS Style
Cai, B.; Hu, W.-L.; Fu, F. Numerical Analysis of Seismic Performances of Post-Fire Scoria Aggregate Concrete Beam-Column Joints. Fire 2021, 4, 70. https://0-doi-org.brum.beds.ac.uk/10.3390/fire4040070
AMA Style
Cai B, Hu W-L, Fu F. Numerical Analysis of Seismic Performances of Post-Fire Scoria Aggregate Concrete Beam-Column Joints. Fire. 2021; 4(4):70. https://0-doi-org.brum.beds.ac.uk/10.3390/fire4040070
Chicago/Turabian StyleCai, Bin, Wen-Li Hu, and Feng Fu. 2021. "Numerical Analysis of Seismic Performances of Post-Fire Scoria Aggregate Concrete Beam-Column Joints" Fire 4, no. 4: 70. https://0-doi-org.brum.beds.ac.uk/10.3390/fire4040070