Comparative Analysis of Skeletal Muscle Metabolites of Fish with Various Rates of Aging

 ,
, 
 and
and
Abstract
:1. Introduction
2. Results
3. Discussion
4. Material and Methods
4.1. Muscle Sampling
4.2. Extraction Method and Sample Preparation
4.3. Mass Spectrometry Analysis
4.4. Data Analysis
4.5. Mass Spectra Peak Identification
5. Conclusions
Author Contributions
Funding
Conflicts of Interest
Ethical Approval
References
- Finch, C.E.; Austad, S.N. History and prospects: Symposium on organisms with slow aging. Exp. Gerontol. 2001, 36, 593–597. [Google Scholar] [CrossRef]
- Valdesalici, S.; Cellerino, A. Extremely short lifespan in the annual fish Nothobranchius furzeri. Proc. R. Soc. B Biol. Sci. 2003, 270, S189–S191. [Google Scholar] [CrossRef] [PubMed]
- Finch, C. Longevity, Senescence, and the Genome; University of Chicago Press: Chicago, IL, USA, 1990. [Google Scholar]
- Patnaik, B.K.; Mahapatro, N.; Jena, B.S. Ageing in fishes. Gerontology 1994, 40, 113–132. [Google Scholar] [CrossRef]
- Craig, C.; Kipling, J.F. Reproduction effort versus the environment; case histories of Windermere perch, Perca fluviatilis L., and pike, Esox lucius L. J. Fish Biol. 1983, 22, 713–727. [Google Scholar] [CrossRef]
- Kirczuk, L.; Domagała, J.; Pilecka-Rapacz, M. Annual Developmental Cycle of Gonads of European Perch Females (Perca fluviatilis L.) from Natural Sites and a Canal Carrying Post-cooling Water from the Dolna Odra Power Plant (NW Poland). Folia Biol. 2015, 63, 85–93. [Google Scholar] [CrossRef]
- Gorbunova, V.; Seluanov, A.; Zhang, Z.; Gladyshev, V.N.; Vijg, J. Comparative genetics of longevity and cancer: Insights from long-lived rodents. Nat. Rev. Genet. 2014, 15, 531–540. [Google Scholar] [CrossRef] [PubMed]
- Selman, C.; Withers, D.J. Mammalian models of extended healthy lifespan. Philos. Trans. R. Soc. Lond. B. Biol. Sci. 2011, 366, 99–107. [Google Scholar] [CrossRef] [PubMed] [Green Version]
- Moskalev, A.A.; Pasyukova, E.G. From theories of aging to anti-aging interventions. Front. Genet. 2014, 5, 276. [Google Scholar] [CrossRef]
- Rosenberg, I.H. Sarcopenia: Origins and clinical relevance. Clin. Geriatr. Med. 2011, 27, 337–339. [Google Scholar] [CrossRef]
- Baumgartner, R.N.; Koehler, K.M.; Gallagher, D.; Romero, L.; Heymsfield, S.B.; Ross, R.R.; Garry, P.J.; Lindeman, R.D. Epidemiology of sarcopenia among the elderly in New Mexico. Am. J. Epidemiol. 1998, 147, 755–763. [Google Scholar] [CrossRef] [PubMed]
- Melton, L.J.; Khosla, S.; Riggs, B.L. Epidemiology of sarcopenia. Mayo Clin. Proc. 2000, 75, S10–S13. [Google Scholar]
- Jeromson, S.; Gallagher, I.J.; Galloway, S.D.R.; Hamilton, D.L. Omega-3 fatty acids and skeletal muscle health. Mar. Drugs 2015, 13, 6977–7004. [Google Scholar] [CrossRef] [PubMed]
- Payne, B.A.I.; Chinnery, P.F. Mitochondrial dysfunction in aging: Much progress but many unresolved questions. Biochim. Biophys. Acta Bioenerg. 2015, 1847, 1347–1353. [Google Scholar] [CrossRef] [Green Version]
- Deberardinis, R.J.; Thompson, C.B. Cellular metabolism and disease: What do metabolic outliers teach us? Cell 2012, 148, 1132–1144. [Google Scholar] [CrossRef] [PubMed]
- Dunn, W.B.; Erban, A.; Weber, R.J.M.; Creek, D.J.; Brown, M.; Breitling, R.; Hankemeier, T.; Goodacre, R.; Neumann, S.; Kopka, J.; et al. Mass appeal: Metabolite identification in mass spectrometry-focused untargeted metabolomics. Metabolomics 2013, 9, 44–66. [Google Scholar] [CrossRef]
- Kahwati, L.; Jacobs, S.; Kane, H.; Lewis, M.; Viswanathan, M.; Golin, C.E. Using qualitative comparative analysis in a systematic review of a complex intervention. Syst. Rev. 2016, 5, 82. [Google Scholar] [CrossRef] [PubMed] [Green Version]
- Gilbert, M.J.H.; Zerulla, T.C.; Tierney, K.B. Zebrafish (Danio rerio) as a model for the study of aging and exercise: Physical ability and trainability decreases with age. Exp. Gerontol. 2014, 50, 106–113. [Google Scholar] [CrossRef]
- Trifonova, O.P.; Maslov, D.L.; Mikhailov, A.N.; Zolotarev, K.V.; Nakhod, K.V.; Nakhod, V.I.; Belyaeva, N.F.; Mikhailova, M.V.; Lokhov, P.G.; Archakov, A.I.; et al. Comparative Analysis of the Blood Plasma Metabolome of Negligible, Gradual and Rapidly Ageing Fishes. Fishes 2018, 3, 46. [Google Scholar] [CrossRef]
- Cajka, T.; Danhelova, H.; Vavrecka, A.; Riddellova, K.; Kocourek, V.; Vacha, F.; Hajslova, J. Evaluation of direct analysis in real time ionization–mass spectrometry (DART–MS) in fish metabolomics aimed to assess the response to dietary supplementation. Talanta 2013, 115, 263–270. [Google Scholar] [CrossRef] [PubMed]
- Dettmer, K.; Aronov, P.A.; Hammock, B.D. Mass Spectrometry-Based Metabolomics. Mass Spectrom. Rev. 2007, 26, 51–78. [Google Scholar] [CrossRef]
- Sérot, T.; Gandemer, G.; Demaimay, M. Lipid and fatty acid compositions of muscle from farmed and wild adult turbot. Aquac. Int. 1998, 6, 331–343. [Google Scholar] [CrossRef]
- Megdal, P.A.; Craft, N.A.; Handelman, G.J. A simplified method to distinguish farmed (Salmo salar) from wild salmon: Fatty acid ratios versus astaxanthin chiral isomers. Lipids 2009, 44, 569–576. [Google Scholar] [CrossRef] [PubMed]
- Özogul, Y.; Özogul, F. Fatty acid profiles of commercially important fish species from the Mediterranean, Aegean and Black Seas. Food Chem. 2007, 100, 1634–1638. [Google Scholar] [CrossRef]
- Özogul, Y.; Özogul, F.; Alagoz, S. Fatty acid profiles and fat contents of commercially important seawater and freshwater fish species of Turkey: A comparative study. Food Chem. 2007, 103, 217–223. [Google Scholar] [CrossRef]
- Jobling, M.; Johansen, S.J.S.; Foshaug, H.; Burkow, I.C.; Jørgensen, E.H. Lipid dynamics in anadromous Arctic charr, Salvelinus alpinus (L.): Seasonal variations in lipid storage depots and lipid class composition. Fish Physiol. Biochem. 1998, 18, 225–240. [Google Scholar] [CrossRef]
- Josrgensen, E.H.; Johansen, S.J.S.; Jobling, M. Seasonal patterns of growth, lipid deposition and lipid depletion in anadromous Arctic charr. J. Fish Biol. 1997, 51, 312–326. [Google Scholar] [CrossRef]
- Hiatt, W.R.; Regensteiner, J.G.; Wolfel, E.E.; Ruff, L.; Brass, E.P. Carnitine and acylcarnitine metabolism during exercise in humans. Dependence on skeletal muscle metabolic state. J. Clin. Investig. 1989, 84, 1167–1173. [Google Scholar] [CrossRef]
- Sabatine, M.S.; Liu, E.; Morrow, D.A.; Heller, E.; McCarroll, R.; Wiegand, R.; Berriz, G.F.; Roth, F.P.; Gerszten, R.E. Metabolomic Identification of Novel Biomarkers of Myocardial Ischemia. Circulation 2005, 112, 3868–3875. [Google Scholar] [CrossRef] [Green Version]
- Koves, T.R.; Ussher, J.R.; Noland, R.C.; Slentz, D.; Mosedale, M.; Ilkayeva, O.; Bain, J.; Stevens, R.; Dyck, J.R.B.; Newgard, C.B.; et al. Mitochondrial overload and incomplete fatty acid oxidation contribute to skeletal muscle insulin resistance. Cell Metab. 2008, 7, 45–56. [Google Scholar] [CrossRef]
- Lehmann, R.; Zhao, X.; Weigert, C.; Simon, P.; Fehrenbach, E.; Fritsche, J.; Machann, J.; Schick, F.; Wang, J.; Hoene, M.; et al. Medium chain acylcarnitines dominate the metabolite pattern in humans under moderate intensity exercise and support lipid oxidation. PLoS ONE 2010, 5, e11519. [Google Scholar] [CrossRef] [PubMed]
- Houtkooper, R.H.; Argmann, C.; Houten, S.M.; Cantó, C.; Jeninga, E.H.; Andreux, P.A.; Thomas, C.; Doenlen, R.; Schoonjans, K.; Auwerx, J. The metabolic footprint of aging in mice. Sci. Rep. 2011, 1, 134. [Google Scholar] [CrossRef]
- Gumucio, J.P.; Mendias, C.L. Atrogin-1, MuRF-1, and sarcopenia. Endocrine 2013, 43, 12–21. [Google Scholar] [CrossRef] [PubMed]
- McCommis, K.S.; Finck, B.N. Mitochondrial pyruvate transport: A historical perspective and future research directions. Biochem. J. 2015, 466, 443–454. [Google Scholar] [CrossRef]
- Darras, B.T.; Friedman, N.R. Metabolic myopathies: A clinical approach; part I. Pediatr. Neurol. 2000, 22, 87–97. [Google Scholar] [CrossRef]
- Baraibar, M.A.; Hyzewicz, J.; Rogowska-Wrzesinska, A.; Bulteau, A.-L.; Prip-Buus, C.; Butler-Browne, G.; Friguet, B. Impaired energy metabolism of senescent muscle satellite cells is associated with oxidative modifications of glycolytic enzymes. Aging 2016, 8, 3375–3389. [Google Scholar] [CrossRef]
- Wan, Q.-L.; Shi, X.; Liu, J.; Ding, A.-J.; Pu, Y.-Z.; Li, Z.; Wu, G.-S.; Luo, H.-R. Metabolomic signature associated with reproduction-regulated aging in Caenorhabditis elegans. Aging 2017, 9, 447–474. [Google Scholar] [CrossRef] [PubMed]
- Li, P.; Mai, K.; Trushenski, J.; Wu, G. New developments in fish amino acid nutrition: Towards functional and environmentally oriented aquafeeds. Amino Acids 2009, 37, 43–53. [Google Scholar] [CrossRef] [PubMed]
- Kimball, S.R.; Jefferson, L.S. Signaling pathways and molecular mechanisms through which branched-chain amino acids mediate translational control of protein synthesis. J. Nutr. 2006, 136, 227S–231S. [Google Scholar] [CrossRef] [PubMed]
- Newgard, C.B.; An, J.; Bain, J.R.; Muehlbauer, M.J.; Stevens, R.D.; Lien, L.F.; Haqq, A.M.; Shah, S.H.; Arlotto, M.; Slentz, C.A.; et al. A branched-chain amino acid-related metabolic signature that differentiates obese and lean humans and contributes to insulin resistance. Cell Metab. 2009, 9, 311–326. [Google Scholar] [CrossRef] [PubMed]
- Miyazaki, T.; Honda, A.; Ikegami, T.; Matsuzaki, Y. The role of taurine on skeletal muscle cell differentiation. Adv. Exp. Med. Biol. 2013, 776, 321–328. [Google Scholar] [PubMed]
- Spriet, L.L.; Whitfield, J. Taurine and skeletal muscle function. Curr. Opin. Clin. Nutr. Metab. Care 2015, 18, 96–101. [Google Scholar] [CrossRef]
- Minois, N. Molecular basis of the “anti-aging” effect of spermidine and other natural polyamines—A mini-review. Gerontology 2014, 60, 319–326. [Google Scholar] [CrossRef] [PubMed]
- Glover, E.I.; Phillips, S.M.; Oates, B.R.; Tang, J.E.; Tarnopolsky, M.A.; Selby, A.; Smith, K.; Rennie, M.J. Immobilization induces anabolic resistance in human myofibrillar protein synthesis with low and high dose amino acid infusion. J. Physiol. 2008, 586, 6049–6061. [Google Scholar] [CrossRef] [PubMed] [Green Version]
- Tesch, F.W. Age and Growth. In Methods for Assessment of Fish Production in Fresh Waters; Ricker, W.E., Ed.; Blackwell Sci. Pub.: Oxford, UK, 1968; pp. 93–123. [Google Scholar]
- Rammouz, R.E.; Létisse, F.; Durand, S.; Portais, J.C.; Moussa, Z.W.; Fernandez, X. Analysis of skeletal muscle metabolome: Evaluation of extraction methods for targeted metabolite quantification using liquid chromatography tandem mass spectrometry. Anal. Biochem. 2010, 398, 169–177. [Google Scholar] [CrossRef] [PubMed]
- Van Scoy, A.R.; Yu Lin, C.; Anderson, B.S.; Philips, B.M.; Martin, M.J.; McCall, J.; Todd, C.R.; Crane, D.; Sowby, M.L.; Viant, M.R.; et al. Metabolic responses produced by crude versus dispersed oil in Chinook salmon pre-smolts via NMR-based metabolomics. Ecotoxicol. Environ. Saf. 2010, 73, 710–717. [Google Scholar] [CrossRef] [PubMed]
- Lin, C.Y.; Wu, H.; Tjeerdema, R.S.; Viant, M.R. Evaluation of metabolite extraction strategies from tissue samples using NMR metabolomics. Metabolomics 2007, 3, 55–67. [Google Scholar] [CrossRef] [Green Version]
- Lokhov, P.G.; Kharybin, O.N.; Archakov, A.I. Diagnosis of lung cancer based on direct-infusion electrospray mass spectrometry of blood plasma metabolites. Int. J. Mass Spectrom. 2012, 309, 200–205. [Google Scholar] [CrossRef]
- Lynn, K.-S.; Cheng, M.-L.; Chen, Y.-R.; Hsu, C.; Chen, A.; Lih, T.M.; Chang, H.-Y.; Huang, C.; Shiao, M.-S.; Pan, W.-H.; et al. Metabolite identification for mass spectrometry-based metabolomics using multiple types of correlated ion information. Anal. Chem. 2015, 87, 2143–2151. [Google Scholar] [CrossRef]


| Mass of Ion | |||||||
|---|---|---|---|---|---|---|---|
| № | Metabolite | HMDB ID | Measured (m/z) | Calculated (m/z) | Monoisotopic Mol Weight (Da) | Ion Form | Elemental Composition |
| metabolites a high level of which was observed in the samples relating to negligible | |||||||
| 1 | hypotaurine | HMDB00965 | 110,0175 | 110,027 | 110,0275 | M+H | C2H7NO2S |
| 2 | creatinine | HMDB00562 | 114,0634 | 114,0661 | 113,0589 | M+H | C4H7N3O |
| 3 | creatinine | HMDB00562 | 136,0027 | 136,0481 | 113,0589 | M+Na | C4H7N3O |
| 4 | L-carnitine | HMDB00062 | 162,1123 | 162,1124 | 161,10519 | M+H | C7H15NO3 |
| 5 | n/a | --- | 635,3064 | --- | --- | --- | --- |
| 6 | PC * | HMDB08531 | 844,6487 | 844,679 | 843,6717 | M+H | C48H94NO8P |
| metabolites a high level of which was observed in the samples relating to negligible and gradual | |||||||
| 7 | alanine | HMDB00161 | 90,0518 | 90,0549 | 89,04767 | M+H | C3H7NO2 |
| 8 | alanine | HMDB00161 | 112,0307 | 112,0368 | 89,04767 | M+Na | C3H7NO2 |
| 9 | valine | HMDB00883 | 118,0851 | 118,0862 | 117,0789 | M+H | C5H11NO2 |
| 10 | sarcosine | HMDB00271 | 128,0106 | 128,0108 | 89,04767 | M+K | C3H7NO2 |
| 11 | taurine | HMDB00251 | 126,0186 | 126,0219 | 125,0146 | M+H | C2H7NO3S |
| 12 | creatine | HMDB00064 | 132,0764 | 132,0767 | 131,0694 | M+H | C4H9N3O2 |
| 13 | leucine | HMDB00687 | 132,1024 | 132,1019 | 131,0946 | M+H | C6H13NO2 |
| 14 | valine | HMDB00883 | 140,0617 | 140,0681 | 117,0789 | M+Na | C5H11NO2 |
| 15 | taurine | HMDB00251 | 147,9842 | 148,0038 | 125,0146 | M+Na | C2H7NO3S |
| 16 | creatine | HMDB00064 | 154,0571 | 154,0586 | 131,0694 | M+Na | C4H9N3O2 |
| 17 | spermidine | HMDB01257 | 146,1466 | 146,1651 | 145,1578 | M+H | C7H19N3 |
| 18 | maleylacetate | HMDB60348 | 159,0280 | 159,0288 | 158,0215 | M+H | C6H6O5 |
| 19 | leucine | HMDB00687 | 170,0253 | 170,0577 | 131,0946 | M+K | C6H13NO2 |
| 20 | maleylacetate | HMDB60348 | 196,9787 | 196,9847 | 158,0215 | M+K | C6H6O5 |
| 21 | n/a | --- | 713,4983 | --- | --- | --- | --- |
| metabolites a high level of which was observed in the samples relating to gradual | |||||||
| 22 | itaconic acid | HMDB02092 | 152,9764 | 153,0158 | 130,0266 | M+Na | C5H6O4 |
| 23 | n/a | --- | 771,6006 | --- | --- | --- | --- |
| 24 | PC * | HMDB08136 | 802,5179 | 802,5357 | 779,5465 | M+Na | C44H78NO8P |
| 25 | PC * | HMDB08138 | 804,5363 | 804,5513 | 781,5621 | M+Na | C44H80NO8P |
| 26 | PC * | HMDB08136 | 822,5332 | 822,5410 | 783,5778 | M+K | C44H82NO8P |
| 27 | PC * | HMDB08589 | 826,6635 | 826,6684 | 825,6611 | M+H | C48H92NO7P |
| 28 | PC * | HMDB08304 | 832,5702 | 832,5827 | 809,5934 | M+Na | C46H84NO8P |
| 29 | PC * | HMDB08272 | 834,5845 | 834,5983 | 811,6091 | M+Na | C46H86NO8P |
| 30 | PC * | HMDB08467 | 844,5150 | 844,5253 | 805,5621 | M+K | C46H80NO8P |
| metabolites a high level of which was observed in the samples relating to rapid | |||||||
| 31 | n/a | --- | 100,1074 | --- | --- | --- | --- |
| 32 | serine | HMDB00187 | 106,0391 | 106,0498 | 105,0425 | M+H | C3H7NO3 |
| 33 | pyruvate | HMDB00243 | 110,996 | 111,0053 | 88,01604 | M+Na | C3H4O3 |
| 34 | lactic acid | HMDB00190 | 113,0268 | 113,0209 | 90,03169 | M+Na | C3H6O3 |
| 35 | cysteine | HMDB00574 | 122,0211 | 122,0270 | 121,0197 | M+H | C3H7NO2S |
| 36 | choline | HMDB00097 | 127,0841 | 127,0967 | 104,1075 | M+Na | C5H14NO |
| 37 | lactic acid | HMDB00190 | 128,9881 | 128,9948 | 90,03169 | M+K | C3H6O3 |
| 38 | n/a | --- | 137,1283 | --- | --- | --- | --- |
| 39 | fumaric acid | HMDB00134 | 138,9945 | 139,0002 | 116,0109 | M+Na | C4H4O4 |
| 40 | niacinamide | HMDB01406 | 145,0250 | 145,0372 | 122,048 | M+Na | C6H6N2O |
| 41 | malate | HMDB00156 | 156,998 | 157,0107 | 134,0215 | M+Na | C4H6O5 |
| 42 | α-ketoglutarate | HMDB00208 | 168,9989 | 169,0107 | 146,0215 | M+Na | C5H6O5 |
| 43 | serinyl-alanine | HMDB29032 | 177,0656 | 177,0869 | 176,0797 | M+H | C6H12N2O4 |
| 44 | methylenesuccinic acid | HMDB59762 | 180,9791 | 180,9898 | 142,0266 | M+K | C6H6O4 |
| 45 | α-ketoglutarate | HMDB00208 | 184,9788 | 184,9846 | 146,0215 | M+K | C5H6O5 |
| 46 | threoninyl-alanine | HMDB29054 | 191,0972 | 191,1026 | 190,0953 | M+H | C7H14N2O4 |
| 47 | serinyl-alanine | HMDB29032 | 190,0210 | 190,0689 | 176,0797 | M+Na | C6H12N2O4 |
| 48 | citric acid | HMDB00094 | 215,0120 | 215,0162 | 192,0270 | M+Na | C6H8O7 |
| 49 | n/a | --- | 227,1875 | --- | --- | --- | --- |
| 50 | tridecanoic acid | HMDB00910 | 237,1446 | 237,1825 | 214,1932 | M+Na | C13H26O2 |
| 51 | palmitoleic acid | HMDB03229 | 279,2001 | 279,2294 | 256,2402 | M+Na | C16H30O2 |
| 52 | n/a | --- | 285,2529 | --- | --- | --- | --- |
| 53 | linolenic acid | HMDB013 | 301,1796 | 301,2138 | 278,2245 | M+Na | C18H30O2 |
| 54 | linoleic acid | HMDB00673 | 303,2024 | 303,2294 | 280,2402 | M+Na | C18H32O2 |
| 55 | oleic acid | HMDB020 | 305,2036 | 305,2451 | 282,2558 | M+Na | C18H34O2 |
| 56 | linolenic acid | HMDB013 | 317,1567 | 317,1877 | 278,2245 | M+K | C18H30O2 |
| 57 | linoleic acid | HMDB00673 | 319,1922 | 319,2033 | 280,2402 | M+K | C18H32O2 |
| 58 | eicosapentaenoic acid | HMDB01999 | 325,2039 | 325,2138 | 302,2245 | M+Na | C20H30O2 |
| 59 | eicosapentaenoic acid | HMDB01999 | 341,1619 | 341,1877 | 302,2245 | M+K | C20H30O2 |
| 60 | eicosadienoic acid | HMDB05060 | 347,2045 | 347,2346 | 308,2715 | M+K | C20H36O2 |
| 61 | docosahexaenoic acid | HMDB00021 | 351,2073 | 351,2294 | 328,2402 | M+Na | C22H32O2 |
| 62 | docosatrienoic acid | HMDB02823 | 357,2388 | 357,2764 | 334,2871 | M+Na | C22H38O2 |
| 63 | d-maltose | HMDB00163 | 365,0830 | 365,1054 | 342,1162 | M+Na | C12H22O11 |
| 64 | MG * | HMDB11539 | 375,2064 | 375,2505 | 352,2613 | M+Na | C21H36O4 |
| 65 | MG * | HMDB00115 | 379,2473 | 379,2818 | 356,2926 | M+Na | C21H40O4 |
| 66 | tetradecenoylcarnitine | HMDB02014 | 392,2518 | 392,2771 | 369,2879 | M+Na | C21H39NO4 |
| 67 | MG * | HMDB11547 | 419,2218 | 419,2558 | 380,2926 | M+K | C23H40O4 |
| 68 | hydroxycholesterol | HMDB02103 | 425,3057 | 425,339 | 402,3497 | M+Na | C27H46O2 |
| 69 | MG * | HMDB11551 | 437,3341 | 437,3601 | 414,3709 | M+Na | C25H50O4 |
| 70 | LPA * | HMDB07854 | 439,2501 | 439,2819 | 438,2746 | M+H | C21H43O7P |
| 71 | n/a | --- | 445,0474 | --- | --- | --- | --- |
| 72 | PA * | HMDB11144 | 447,2502 | 447,2845 | 424,2953 | M+Na | C21H45O6P |
| 73 | LPA * | HMDB07855 | 459,2192 | 459,2482 | 436,2589 | M+Na | C21H41O7P |
| 74 | LysoPC * | HMDB10379 | 468,2750 | 468,3084 | 467,3011 | M+H | C22H46NO7P |
| 75 | LysoPC * | HMDB10383 | 494,3033 | 494,3241 | 493,3168 | M+H | C24H48NO7P |
| 76 | n/a | --- | 538,4796 | --- | --- | --- | --- |
| 77 | n/a | --- | 551,3859 | --- | --- | --- | --- |
| 78 | DG * | HMDB56009 | 591,4606 | 591,4959 | 568,5066 | M+Na | C35H68O5 |
| 79 | DG * | HMDB56010 | 619,4817 | 619,5272 | 596,5379 | M+Na | C37H72O5 |
| 80 | n/a | --- | 647,3752 | --- | --- | --- | --- |
| 81 | DG * | HMDB56204 | 655,4883 | 655,5272 | 632,5379 | M+Na | C40H72O5 |
| 82 | DG * | HMDB56298 | 663,4551 | 663,4959 | 640,5066 | M+Na | C41H68O5 |
| 83 | DG * | HMDB56037 | 675,5749 | 675,5898 | 652,6005 | M+Na | C41H80O5 |
| 84 | DG * | HMDB07430 | 693,4931 | 693,5428 | 670,5536 | M+Na | C43H74O5 |
| 85 | PC * | HMDB08519 | 892,6545 | 892,6790 | 891,6717 | M+H | C52H94NO8P |
| Metabolite | Precursor Ion | Product Ion | ||||||
|---|---|---|---|---|---|---|---|---|
| Registered m/z, Da | Calculated m/z, Da | Chemical Formula | Ion Type | Registered m/z, Da | Reference m/z, Da | Chemical Formula | Ion Type | |
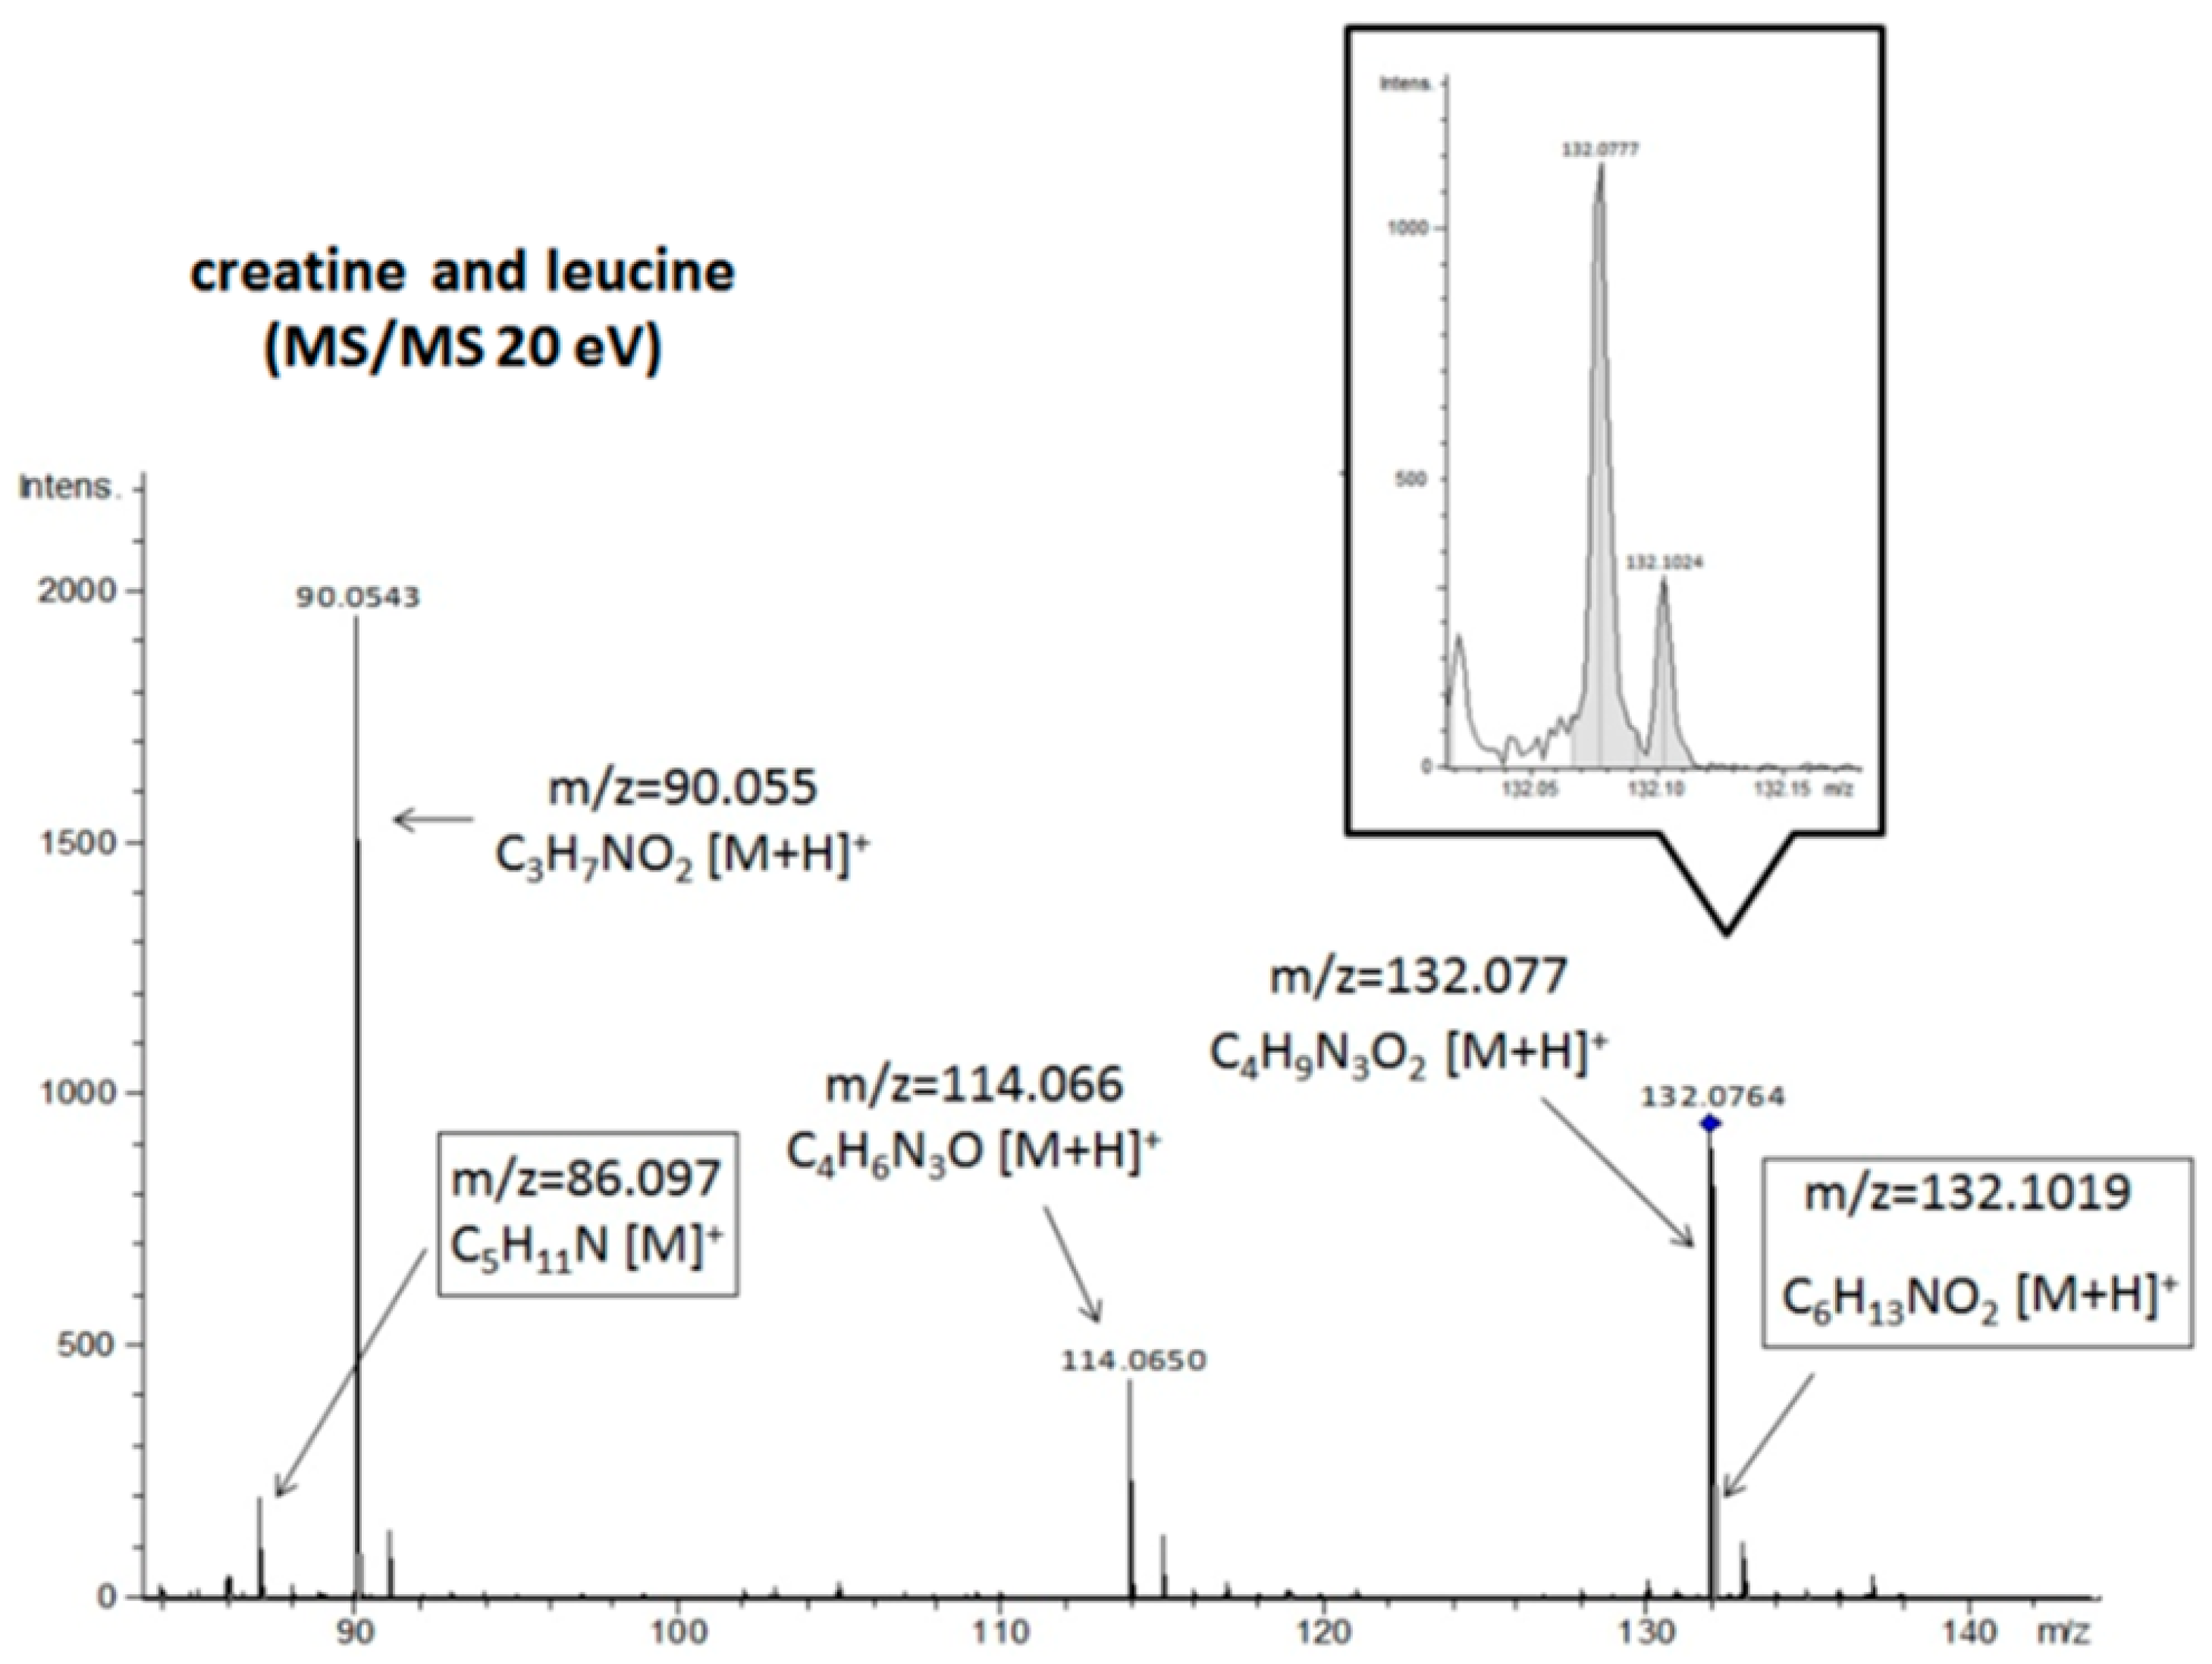
| leucine | 132,1024 | 132,1019 | C6H13NO2 | [M + H]+ | 86,097 | 86,0969 * | C5H11N | [M]+ |
| --- | 44,0499 * | C2H5N | [M + H]+ | |||||
| --- | 43,0546 * | C3H6 | [M + H]+ | |||||
| creatine | 132,0777 | 132,0764 | C4H9N3O2 | [M + H]+ | 114,065 | 114,0664 * | C4H6N3O | [M + H]+ |
| 90,0543 | 90,0552 * | C3H7NO2 | [M + H]+ | |||||
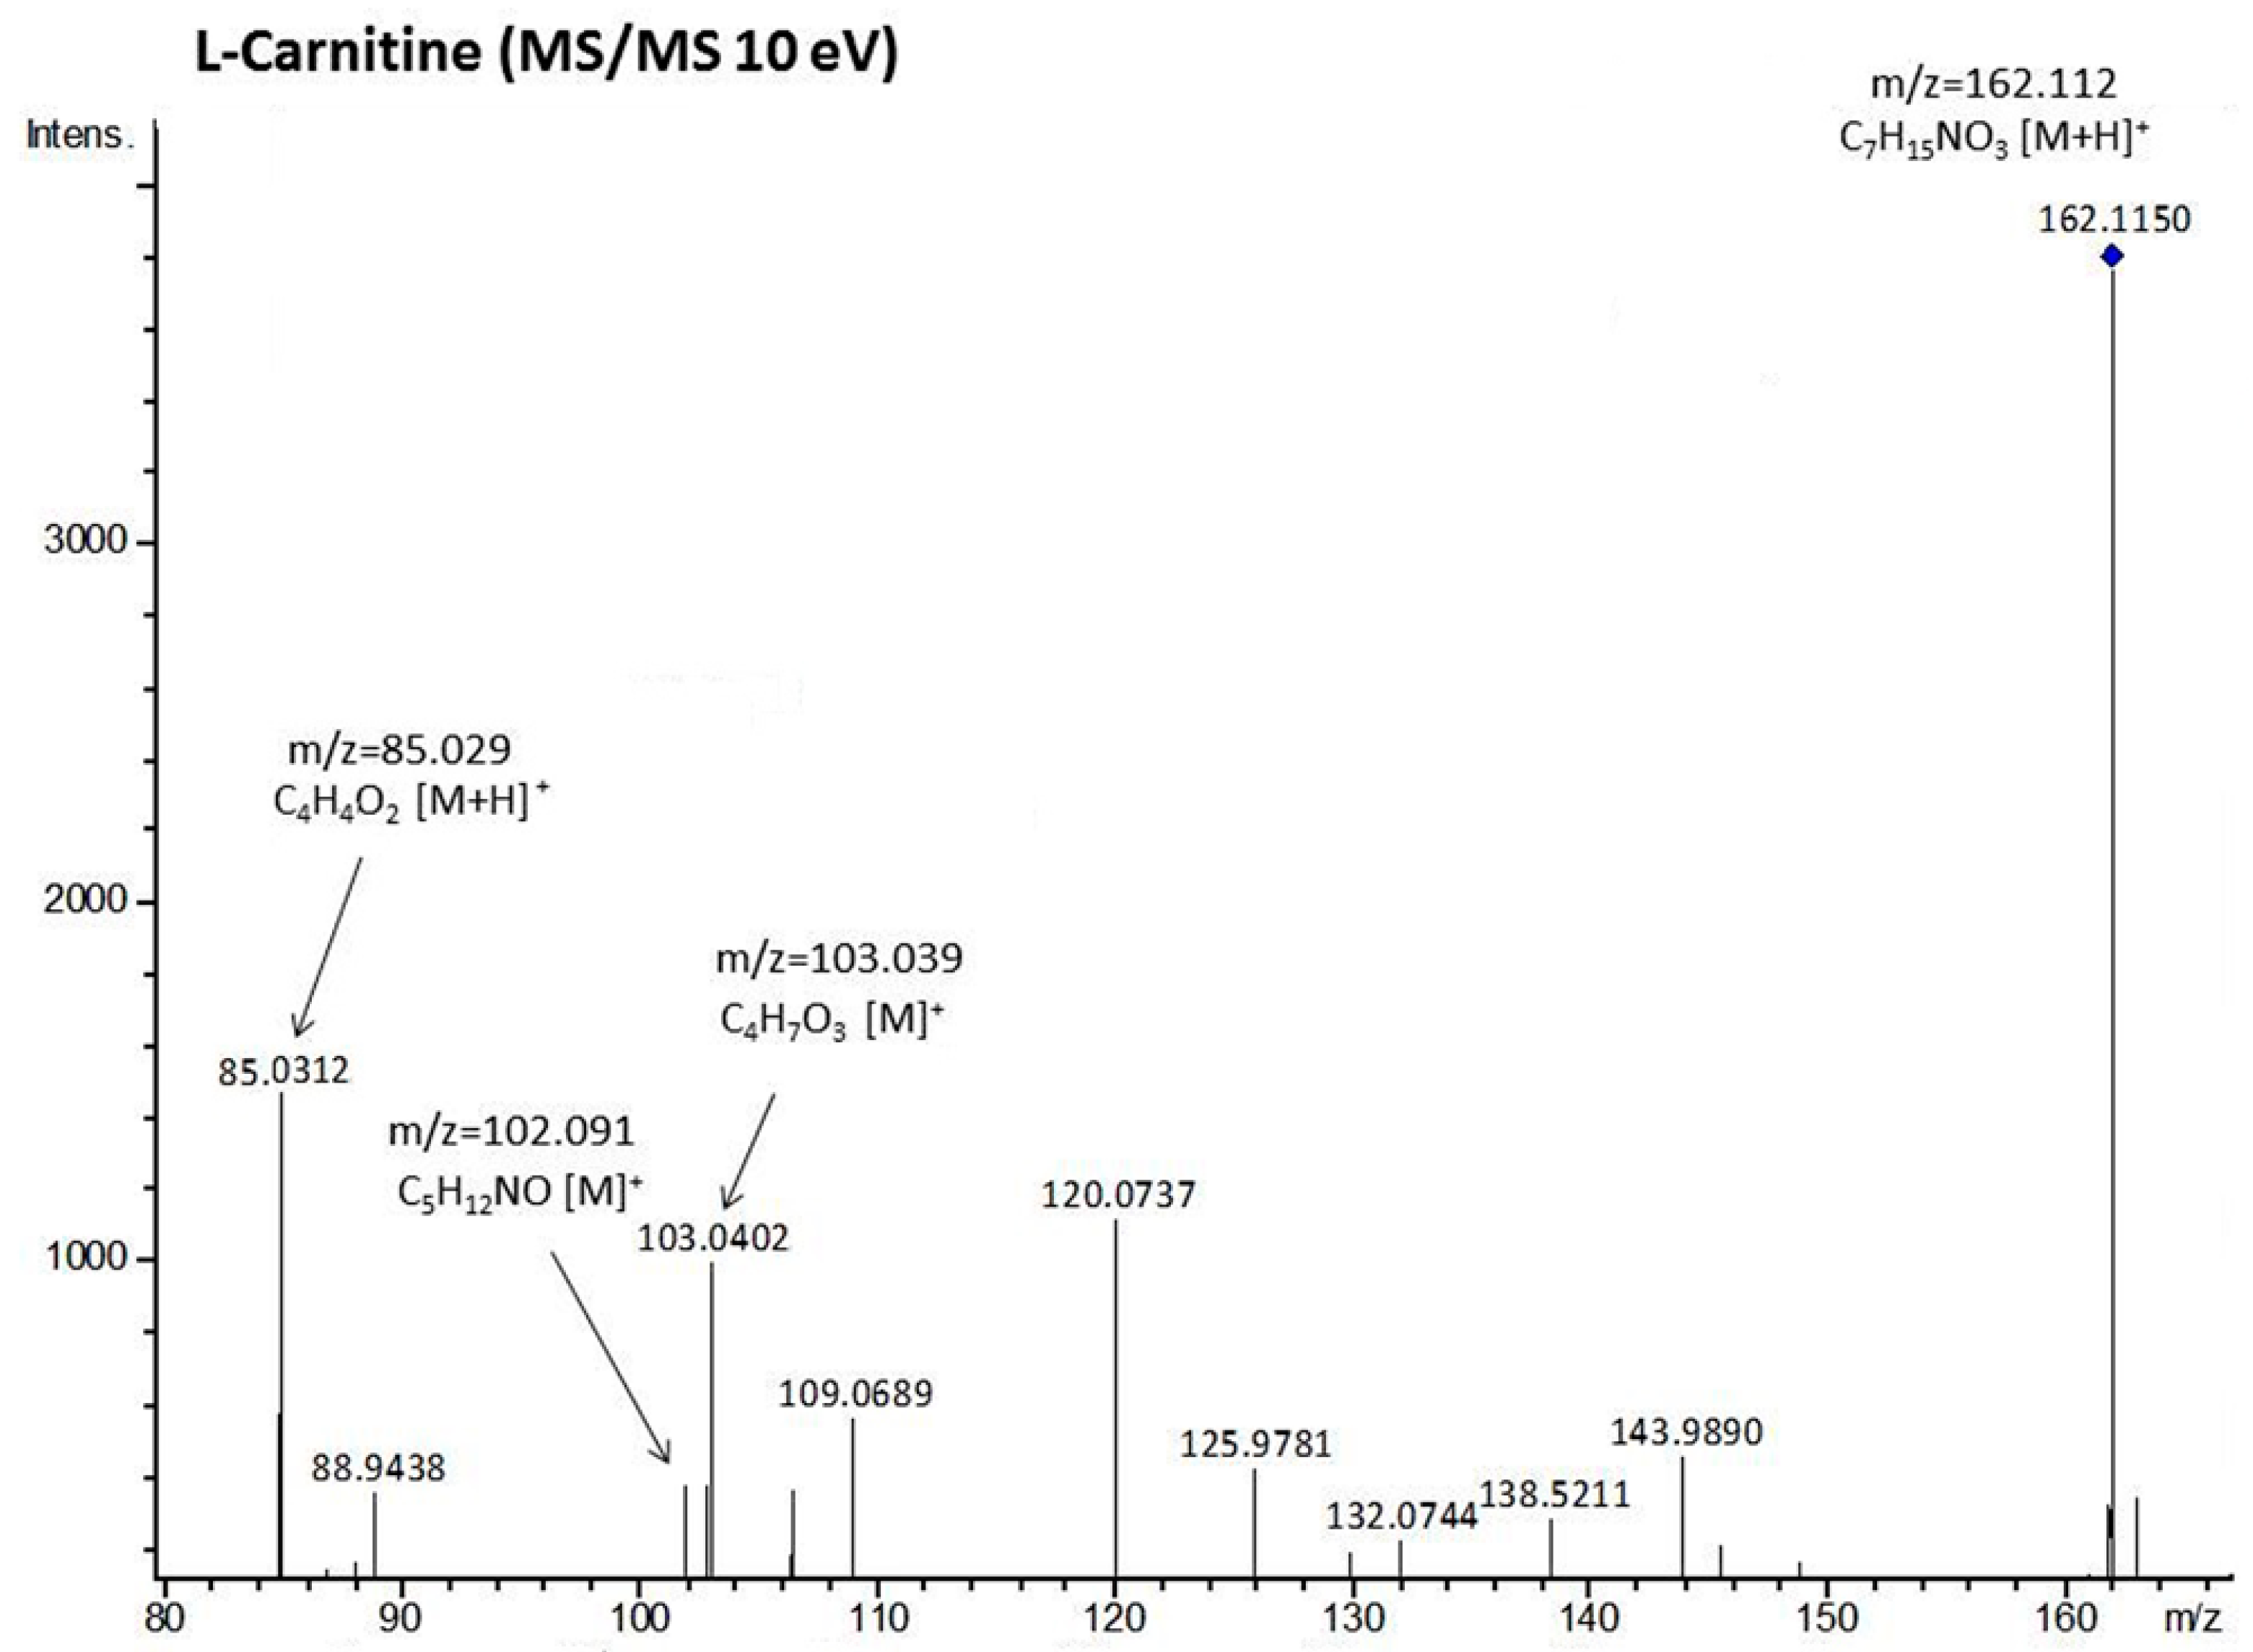
| L-carnitine | 162,1126 | 162,1125 | C7H15NO3 | [M + H]+ | 103,0402 | 103,039 * | C4H7O3 | [M]+ |
| 102,0914 | 102,0913 * | C5H12NO | [M]+ | |||||
| 85,0312 | 85,0284 * | C4H4O2 | [M + H]+ | |||||
© 2019 by the authors. Licensee MDPI, Basel, Switzerland. This article is an open access article distributed under the terms and conditions of the Creative Commons Attribution (CC BY) license (http://creativecommons.org/licenses/by/4.0/).
Share and Cite
Maslov, D.L.; Trifonova, O.P.; Mikhailov, A.N.; Zolotarev, K.V.; Nakhod, K.V.; Nakhod, V.I.; Belyaeva, N.F.; Mikhailova, M.V.; Lokhov, P.G.; Archakov, A.I. Comparative Analysis of Skeletal Muscle Metabolites of Fish with Various Rates of Aging. Fishes 2019, 4, 25. https://0-doi-org.brum.beds.ac.uk/10.3390/fishes4020025
Maslov DL, Trifonova OP, Mikhailov AN, Zolotarev KV, Nakhod KV, Nakhod VI, Belyaeva NF, Mikhailova MV, Lokhov PG, Archakov AI. Comparative Analysis of Skeletal Muscle Metabolites of Fish with Various Rates of Aging. Fishes. 2019; 4(2):25. https://0-doi-org.brum.beds.ac.uk/10.3390/fishes4020025
Chicago/Turabian StyleMaslov, Dmitry L., Oxana P. Trifonova, Anton N. Mikhailov, Konstantin V. Zolotarev, Kirill V. Nakhod, Valeriya I. Nakhod, Nataliya F. Belyaeva, Marina V. Mikhailova, Petr G. Lokhov, and Alexander I. Archakov. 2019. "Comparative Analysis of Skeletal Muscle Metabolites of Fish with Various Rates of Aging" Fishes 4, no. 2: 25. https://0-doi-org.brum.beds.ac.uk/10.3390/fishes4020025