Article

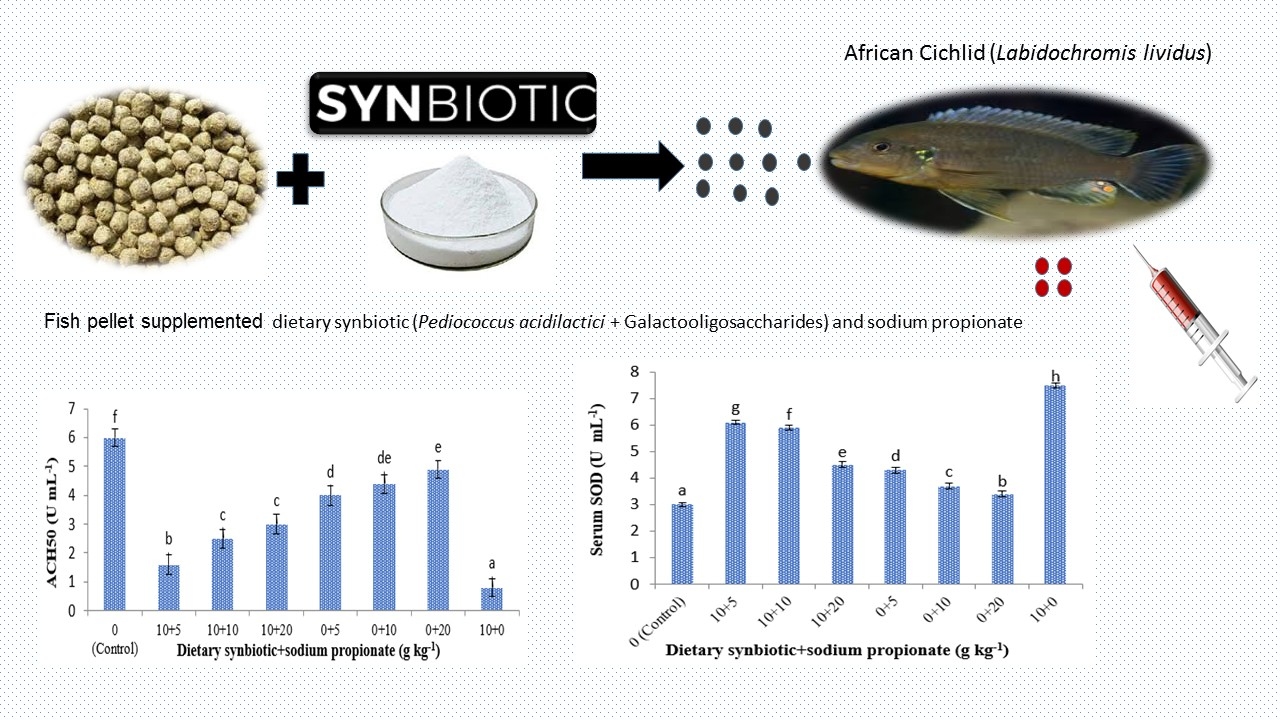
Effects of Single or Combined Administration of Dietary Synbiotic and Sodium Propionate on Humoral Immunity and Oxidative Defense, Digestive Enzymes and Growth Performances of African Cichlid (Labidochromis lividus) Challenged with Aeromonas hydrophila

1
Department of Fishery, Faculty of Natural Resources and Environment, Ferdowsi University of Mashhad, Mashhad 91773-1363, Iran
2
Department of Food hygiene and Aquaculture, School of Veterinary Medicine, Ferdowsi University of Mashhad, Mashhad 91773-1363, Iran
3
Department of Sciences and Technologies, University of Sannio, 82100 Benevento, Italy
*
Author to whom correspondence should be addressed.
Submission received: 23 October 2021 / Revised: 9 November 2021 / Accepted: 10 November 2021 / Published: 15 November 2021

Abstract

:
The aim of the present study was to investigate the potential effects of dietary synbiotic (SYN) (Pediococcus acidilactici + Galactooligosaccharides; 10 g kg−1), sodium propionate (SP; 5, 10 and 20 g kg−1) and a combination of SYN + SP on the growth performance, humoral immunity, antioxidant responses and disease resistance against Aeromonas hydrophila of African cichlid (Labidochromis lividus) fingerlings (0.52 ± 0.05 g) in a feeding trial lasting 63 days. A completely randomized design was run with eight treatments, including 0 (control) and supplemented diets containing SYN + SP (e.g., 10 + 5, 10 + 10, 10 + 20, 0 + 5, 0 + 10, 0 + 20 and 10 + 10). The lowest feed conversion ratio value was observed in fish fed the 5 g kg−1-SP and 10 g kg−1-SYN (p < 0.05). The highest values of protein efficiency ratio and protein productive value were recorded in fish fed the 10 g kg−1-SYN (p < 0.05). Fish fed the 10 g kg−1-SYN diet had the highest activities of immunity (lysozyme, immunoglobulin) and antioxidant responses (glutathione peroxidase and superoxide dismutase) (p < 0.05). After 28 days post-challenge, the highest survival rate (57%) was recorded in the diet containing 10 g kg−1 SYN and 5 g kg−1 SP. The results indicated that the single administration of SYN or combined with SP, especially at the level of 5 g kg−1 of diet, enhanced the survival and growth performances, humoral immune response, antioxidant and digestive enzymes of African cichlid.

Graphical Abstract

1. Introduction

Nowadays, the rearing techniques of ornamental fish are highly developed in the aquaculture industry. The ornamental fish industry fulfills approximately 90% of the freshwater traded organisms worldwide [1]. Because of the economic importance of aquarium fish, improving the health conditions, welfare and disease resistance of cultured fish are key factors in achieving sustainable production. During the last decades, the administration of environment-friendly immunostimulants (probiotics, prebiotics, parabiotics, synbiotics, organic salts and phyto-products), known as feed additives, has been considered to promote the growth indices and reduce microbial infections in aquatic animals [2,3,4,5,6].
Synbiotics, the combined form of probiotics and prebiotics, provides beneficial effects to the host by improving growth performance, digestive enzyme activities, disease resistance and increasing immune responses of aquatic animals [7,8,9]. The mucosal immunity of angelfish, Pterophyllum scalare, was improved via feeding with Artemia and synbiotics (P. acidilactici and fructooligosaccharide) [10]. Safari et al. [11] also showed that mucus immune responses and bactericidal activity in crayfish (Astacus leptodactylus leptodactylus) fed synbiotics (P. acidilactici + mannanoligosaccharide) were higher than those fed single probiotic and prebiotic. The function of synbiotics is highly related to the probiotic species matched with a special prebiotic. In this regard, the degree of polymerization of a prebiotic substrate with a special probiotic species and the production of major by-products of the fermentation process can affect the efficiency of synbiotic-supplemented diets [4].
Probiotics are defined as live microorganisms, which improve the health and immune response through balancing intestinal flora of host animals [12,13]. Recently, Gram-positive bacteria (lactic acid bacteria (LAB) and Bacillus sp.), Gram-negative bacteria (Aeromonas, Pseudomonas and Vibrio sp.) and yeast were investigated extensively in aquafeeds [9,14]. Pediococcus acidilactici is a Gram-positive bacterium, and its beneficial effects have been reported on growth indices of aquaculture species [15,16,17]. Dietary probiotic P. acidilactici was able to modulate the gut microbiota and up-regulate mucosal antibody immunoglobulin T in rainbow trout (Oncorhynchus mykiss) [18]. Prebiotics, non-digestible feed ingredients, beneficially affect the host causing microbial changes in the gastrointestinal tract, with subsequent physiological cascading processes [19]. Galactooligosaccharide (GOS) is an oligosaccharide that is mainly composed of galactose and glucose molecules [20]. The profitable effects of GOS as the promising prebiotic on growth indices have been reported in different fish species [20,21,22]. It was shown that dietary GOS at a level of 2% increased lactic acid bacteria (LAB) levels in the intestine of Caspian white (Rutilus frisii kutum) and Caspian roach (Rutilus caspicus) fingerlings after 6 weeks [23].
Short-chain organic acids, known as acidifiers, are regarded as one of the by-products of the fermentation process in the digestive tract. Recently, several studies have reported the effects of dietary organic acids (e.g., acetate, butyrate, lactate, propionate) and their salts on growth indices of aquatic animals [24,25]. Dietary sodium propionate enhanced mucosal immune responses and glutathione peroxidase (GPX) gene expression as an antioxidant enzyme in the liver of common carp, Cyprinus carpio [11]. Silva et al. [26] reported that the supplementation of propionate salt to a commercial shrimp diet at 2 g kg−1 significantly enhanced feed intake. The efficiency of dietary organic salts supplementation on aquatic species depends on the type of organic acid, dose, diet production method, nutrition history and ontogeny stage [24]. To the best of our knowledge, there is no literature on the simultaneous administration of synbiotics and acidifiers in aquafeeds. Therefore, the aim of the present study was to test the potential effects of different levels of dietary sodium propionate as an acidifier, synbiotic (P. acidilactici + galactooligosaccharides) and their combinations on the humoral immune status, serum antioxidant enzymes and digestive enzymes activities and growth performance, as well as intestinal microbiota of African cichlid (Labidochromis lividus) fingerlings.

2. Materials and Methods

2.1. Experimental Diets

The synbiotic (SYN) applied in this study was prepared by using Pediococcus acidilactici (Bactocell®,Lallemand Inc., Montreal, QC, Canada; 7.59 log CFU g−1) as a probiotic and galactooligosaccharides (GOS) as a prebiotic. Sodium propionate (SP) (C3H5NaO2) as an acidifier was purchased from Sigma-Aldrich Chemical Co. (USA).
Eight experimental diets were prepared by adding different concentrations of SYN and SP to the basal diet (Table 1). The control (basal) diet was produced with a twin-screw extruder (AquaSadra Co. Mashhad, Iran) with preconditioning (30 °C) and three temperature zones (60, 90 and 130 °C). The experimental diets were as follows: (1) control, basal diet without SYN and SP; (2) (10 + 5) SYN (10 g kg−1) + SP (5 g kg−1); (3) (10 + 10) SYN (10 g kg−1) + SP (10 g kg−1); (4) (10 + 20) SYN (10 g kg−1) + SP (20 g kg−1); (5) (0 + 5) SP (5 g kg−1); (6) (0 + 10) SP (10 g kg−1); (7) (0 + 20) SP (20 g kg−1); (8) (10 + 0) SYN (10 g kg−1). To produce the above-mentioned test diets, all feed additives (SYN, GOS and SP) were replaced with filler existing in the control diet.

2.2. Feeding Trial

Five hundred healthy African cichlid (Labidochromis lividus) fingerlings were purchased from a local ornamental fish farm. The fish were acclimatized in four glass aquariums (200 L) for two weeks. Afterward, fish (0.52 ± 0.05 g) were randomly distributed into 24 glass aquariums (20 fish per 150-L aquarium). The fish were fed ad libitum on the experimental diets three times a day (8:00, 12:00 and 16:00) for 63 days. During the feeding trial, the water in each aquarium was renewed (20% per day). Water temperature, dissolved oxygen and pH were monitored daily and maintained at 27.5 ± 1 °C, 6.4 ± 0.3 mg L−1 and 8.2 ± 0.4, respectively [27,28]. The feeding experiment was carried out in triplicate. All experiments were done according to FUM animal ethics.

2.3. Growth Indices

After the feeding trial period, the weight and length of each fish were individually measured. Growth indices were calculated based on the standard formulas as follows:
Weight gain: Wf − Wi
Specific growth rate (SGR; % Body weight day−1) = [(LnWf − LnWi)/T] × 100
Condition factor (CF) = Wf/Lf 3 × 100
Feed conversion ratio (FCR) = (Feed consumed/Wgain)
Protein efficiency ratio (PER) = (Wf − Wi)/Crude protein intake
Protein production value % (PPV) = (Whole-body protein gain)/Protein consumption) × 100
Survival rate (%) = (Nf/Ni) × 100
Where:
Wi: Initial weight; Wf: Final weight; Lf: Final length; Ni: Initial number of fish; Nf: Final number of fish; T: Time period (day).

2.4. Immunological and Antioxidant Parameter Analyses

To analyze the serum immune parameters, at the end of the feeding trial, the fish, starved for 24 h (n= nine per treatment), were randomly sampled from each aquarium at the end of the feeding trial. The serum samples were prepared based on the method described in Safari and Sarkheil [6]. The total immunoglobulins were measured according to Siwicki and Anderson [29]. Briefly, immunoglobulins were precipitated with polyethylene glycol (12%), incubated (25 °C for 2 h) under constant shaking, and finally centrifuged (3000× g for 15 min). Then, the supernatant was removed, and the precipitated protein content was measured. Immunoglobulins were calculated by subtracting the precipitated proteins from the total proteins in the serum.
Lysozyme (LYZ) activity in the serum was estimated by determining the level of lysis of the lysozyme-sensitive Gram-positive bacterium, Micrococcus lysodeikticus (Sigma), according to the procedure described by Kumari et al. [30]. Briefly, 15 µL of the serum sample was poured into a plate (96 well) in triplicate. Thereafter, M. lysodeikticus suspension (150 µL) was prepared using 0.02 M sodium acetate buffer with pH 5.8 (0.02 mg L−1) and transferred to each well. The absorbance was measured at a wavelength of 450 nm using the spectrophotometer (HACH DR/5000, Hach Co., Colorado, USA) at a one-hour interval, and the difference was calculated. The LYZ activity was expressed as U mL−1.
Alternative hemolytic complement activity (ACH50) was evaluated as reported in Yano [31]. Briefly, the serum samples were diluted in ethylene glycol tetra acetic acid–magnesium–gelatin veronal buffer (EGTA–Mg–GVB) to a volume of 250 µL in test tubes. Following, 100 mL of rabbit red blood cells (RaRBC) were dispersed into each tube and incubated at 20 °C for 90 min. Then, NaCl (3.15 mL) was added to each test tube and centrifuged (1600× g for 5 min). The optical density (OD) of the obtained supernatant was read at a wavelength of 414 nm. The ACH50 activity (U mL−1) was calculated based on the volume of serum, which causes the 50% lysis of the RaRBC. Superoxide dismutase (SOD) and glutathione peroxidase (GPX) enzymes were measured using commercial kits (Cusabio Biotech Co., Ltd.; Wuhan, China) following the manufacturer’s instructions.

2.5. Digestive Enzyme Analyses

At the end of the feeding trial period, three fish starved for 24 h were randomly sampled from each aquarium. The fish were anesthetized (cloves extract, 500 mg L−1), and the intestine was isolated and rinsed with cold distilled water (4 °C) [32]. The intestine was mixed with 0.2 M NaCl (1:5; w/v) [33] and homogenized on ice using a DI 18 Disperser homogenizer. Following, the samples were centrifuged (15,000× g for 15 min at 4 °C), and the supernatants were frozen (−80 °C). The enzyme activity was measured using a microplate scanning spectrophotometer (HACH DR/4000, USA) and expressed as U mg−1 protein min−1.
The α-amylase activity was measured according to the 3, 5-dinitrosalicylic acid method, as reported in Worthington [34], and read at a wavelength of 540 nm. Protease activity was estimated using the casein-hydrolysis method described by Hidalgo et al. [34]. Briefly, 0.05 mL of supernatant was mixed with 0.125 mL of casein and 0.125 mL of buffer (0.1 M Tris-HCl, pH 9.0) and incubated (37 °C for 1 h). Afterward, the reaction was stopped by adding 0.3 mL of trichloroacetic acid (TCA) (8% w/v) solution. Then, the samples were centrifuged (1800× g for 10 min) after incubation at 4 °C for 1 h. In the end, the supernatant was measured at a wavelength of 280 nm. Lipase activity was determined according to the method reported by Gawlicka et al. [33], with 4-nitrophenylmyristate (0.4 mM) as a substrate at 25 °C. The absorbance was measured at a 405 nm wavelength.

2.6. Microbiota Assays

The microbial counts of total bacterial aerobic, lactobacillus, fungi and Escherichia coli were determined in the digestive tract of the fish. For this purpose, the fish from each aquarium (n = nine per treatment) were randomly sampled, anesthetized with ice and washed (with benzalkolium chloride 0.1% for 60 min). Thereafter, the digestive tract was removed and homogenized in the presence of NaCl (0.9 w/v) using a homogenizer (DI 18 Disperser) [34,35]. The homogenate was centrifuged at 5000× g, 4 °C for five min. Then, a 100 µL aliquot of each prepared sample was plated onto a plate count agar (Merck, Darmstadt, Germany), plate de Man, Rogosa and Sharpe media (Merck, Darmstadt, Germany), Potato Dextrose Agar (Merck, Darmstadt, Germany) and Mac Conkey Agar (Merck, Darmstadt, Germany) to determine total aerobic bacterial count, lactobacillus count, fungi count and E. coli count, respectively. Finally, the plates were incubated (25 °C for 5 days), and those containing 30–300 colonies were used for bacterial counting as colony-forming units per gram (CFU g−1) [4,5].

2.7. Proximate Analysis

The analysis of dry matter (oven drying, 105 °C), crude protein (n × 6.25, Kjeldahl system: Buchi Labortechnik AG, Flawil, Switzerland), crude fat (Soxtec System HT 1043: Foss Tecator, AB, USA), ash (muffle furnace, 550 °C), gross energy (Parr bomb calorimetry model 1266, Parr Instrument Co., Moline, IL, USA) and crude fiber (after digestion with H2SO4 and NaOH) analysis of feedstuffs, diets and carcasses were performed according to standard methods [36]. Nitrogen-free extract (NFE) was calculated by subtracting dry matter minus crude protein, crude fat, crude fiber and ash contents.

2.8. Bacterial Exposure Challenge

After the feeding trial, 12 fish from each tank (36 fish per group) were selected and intraperitoneally injected with 100 μL of phosphate-buffered saline solution (PBS) containing 1 × 10⁷ live Aeromonas hydrophila, ATCC 49040. The injected fishes were fed with a control diet. The number of dead fish was recorded daily for 28 days.

2.9. Statistical Analysis

Data were presented as mean ± standard deviation (SD). The data were analyzed using SPSS software (Version, 19). The normality assumption of the data was tested using Kolmogorov–Smirnov test. Significant differences between the means were determined by one-way analysis of variance (ANOVA) followed by Tukey’s test. The significant difference was accepted at a level of p < 0.05.

3. Results

3.1. Growth Performance and Survival Rate

The growth performance, feed utilization parameters and survival rate of African cichlid (L. lividus) after the feeding trial period of 63 days are shown in Table 2. The final weight and weight gain of fish fed the supplemented diets increased significantly compared to the control group, except for the groups fed 10 and 20 g kg−1-SP (p < 0.05). The specific growth rate % (SGR) was higher in the supplemented dietary groups with respect to the control group, except for the 10 and 20 g kg1-SP dietary groups (p < 0.05). Fish fed the supplemented diets had a lower food conversion ratio (FCR) than the control, except for the 10 and 20 g kg1-SP dietary groups (p < 0.05). The lowest FCR value was observed in the 5 g kg1-SP and 10 g kg1-SYN dietary groups (p < 0.05). There was no significant difference between the condition factor % (CF) of fish fed the experimental diets (p > 0.05). The protein efficiency ratio (PER) value was significantly higher in the fish fed supplemented diets than the control, except for the 20 g kg1-SP dietary group (p < 0.05). The highest PER value was recorded in the 10 g kg1-SYN dietary group (p < 0.05). Fish fed the supplemented diets showed a higher protein production value % (PPV) than the control (p < 0.05). Fish fed the 10 g kg1-SYN diet had the highest PPV % (p < 0.05). The survival rate (%) of fish fed the supplemented diets was higher than the control, except for the 10 and 20 g kg1-SP dietary groups (p < 0.05). As shown in Table 3, the highest crude protein content of carcasses was measured in the fish fed with the diet containing 10 g kg1 SYN and 0 g kg1 SP (p < 0.05). The highest crude fat content of carcasses was observed in the fish fed the control and 0 g kg1 SYN and 20 g kg1 SP diets.

3.2. Immunological Assay

The variations of hemato-immunological indices in the serum of fish fed the experimental diets are shown in Figure 1. The lysozyme (LYZ) activity increased significantly in the fish fed supplemented diets compared to the control group (p < 0.05). The total immunoglobulin (Ig) level in all supplemented dietary groups was significantly higher than the control, except for the 20 g kg−1-SP dietary group (p < 0.05). Fish fed the 10 g kg−1-SYN diet had the highest LYZ and Ig activity (p < 0.05). The alternative hemolytic complement activity (ACH50) decreased significantly in fish fed the supplemented diets compared to the control (p < 0.05). The lowest ACH50 activity was observed in the 10 g kg−1-SYN dietary group (p < 0.05).

3.3. Antioxidant Enzyme Assay

Figure 2 shows the activity of the antioxidant enzymes in the serum of African cichlid fed diets supplemented with SYN and SP. The glutathione peroxidase (GPx) and superoxide dismutase (SOD) activity levels increased significantly in the serum of fish fed the supplemented diets compared to the control (p < 0.05). The highest GPx and SOD levels were observed in the 10 mg kg−1-SYN dietary group (p < 0.05).

3.4. Digestive Enzymes Activity

The activity of the digestive enzymes in African cichlid fed experimental diets is shown in Table 4. The protease activity increased in all supplemented dietary groups compared to the control, except for the 20 g kg−1-SP dietary group (p < 0.05). The α-amylase activity was significantly higher in fish fed the supplemented diets than in the control group (p < 0.05). Fish fed the supplemented diets showed a higher lipase activity than the control, except for the 20 g kg−1-SP diet (p < 0.05). The highest digestive enzymes activity was observed in the 10 g kg−1-SYN dietary group (p < 0.05).

3.5. Microbiota Assay

Total aerobic bacteria count (Log CFU g−1) of experimental fish did not show significant differences and ranged from 6.20 to 6.48 (Table 5). The highest Lactobacillus count and the lowest E. coli count (p < 0.05) were observed in the fish fed the diet supplemented with 10 g kg−1 SYN and 5 g kg−1 SP (Table 3).

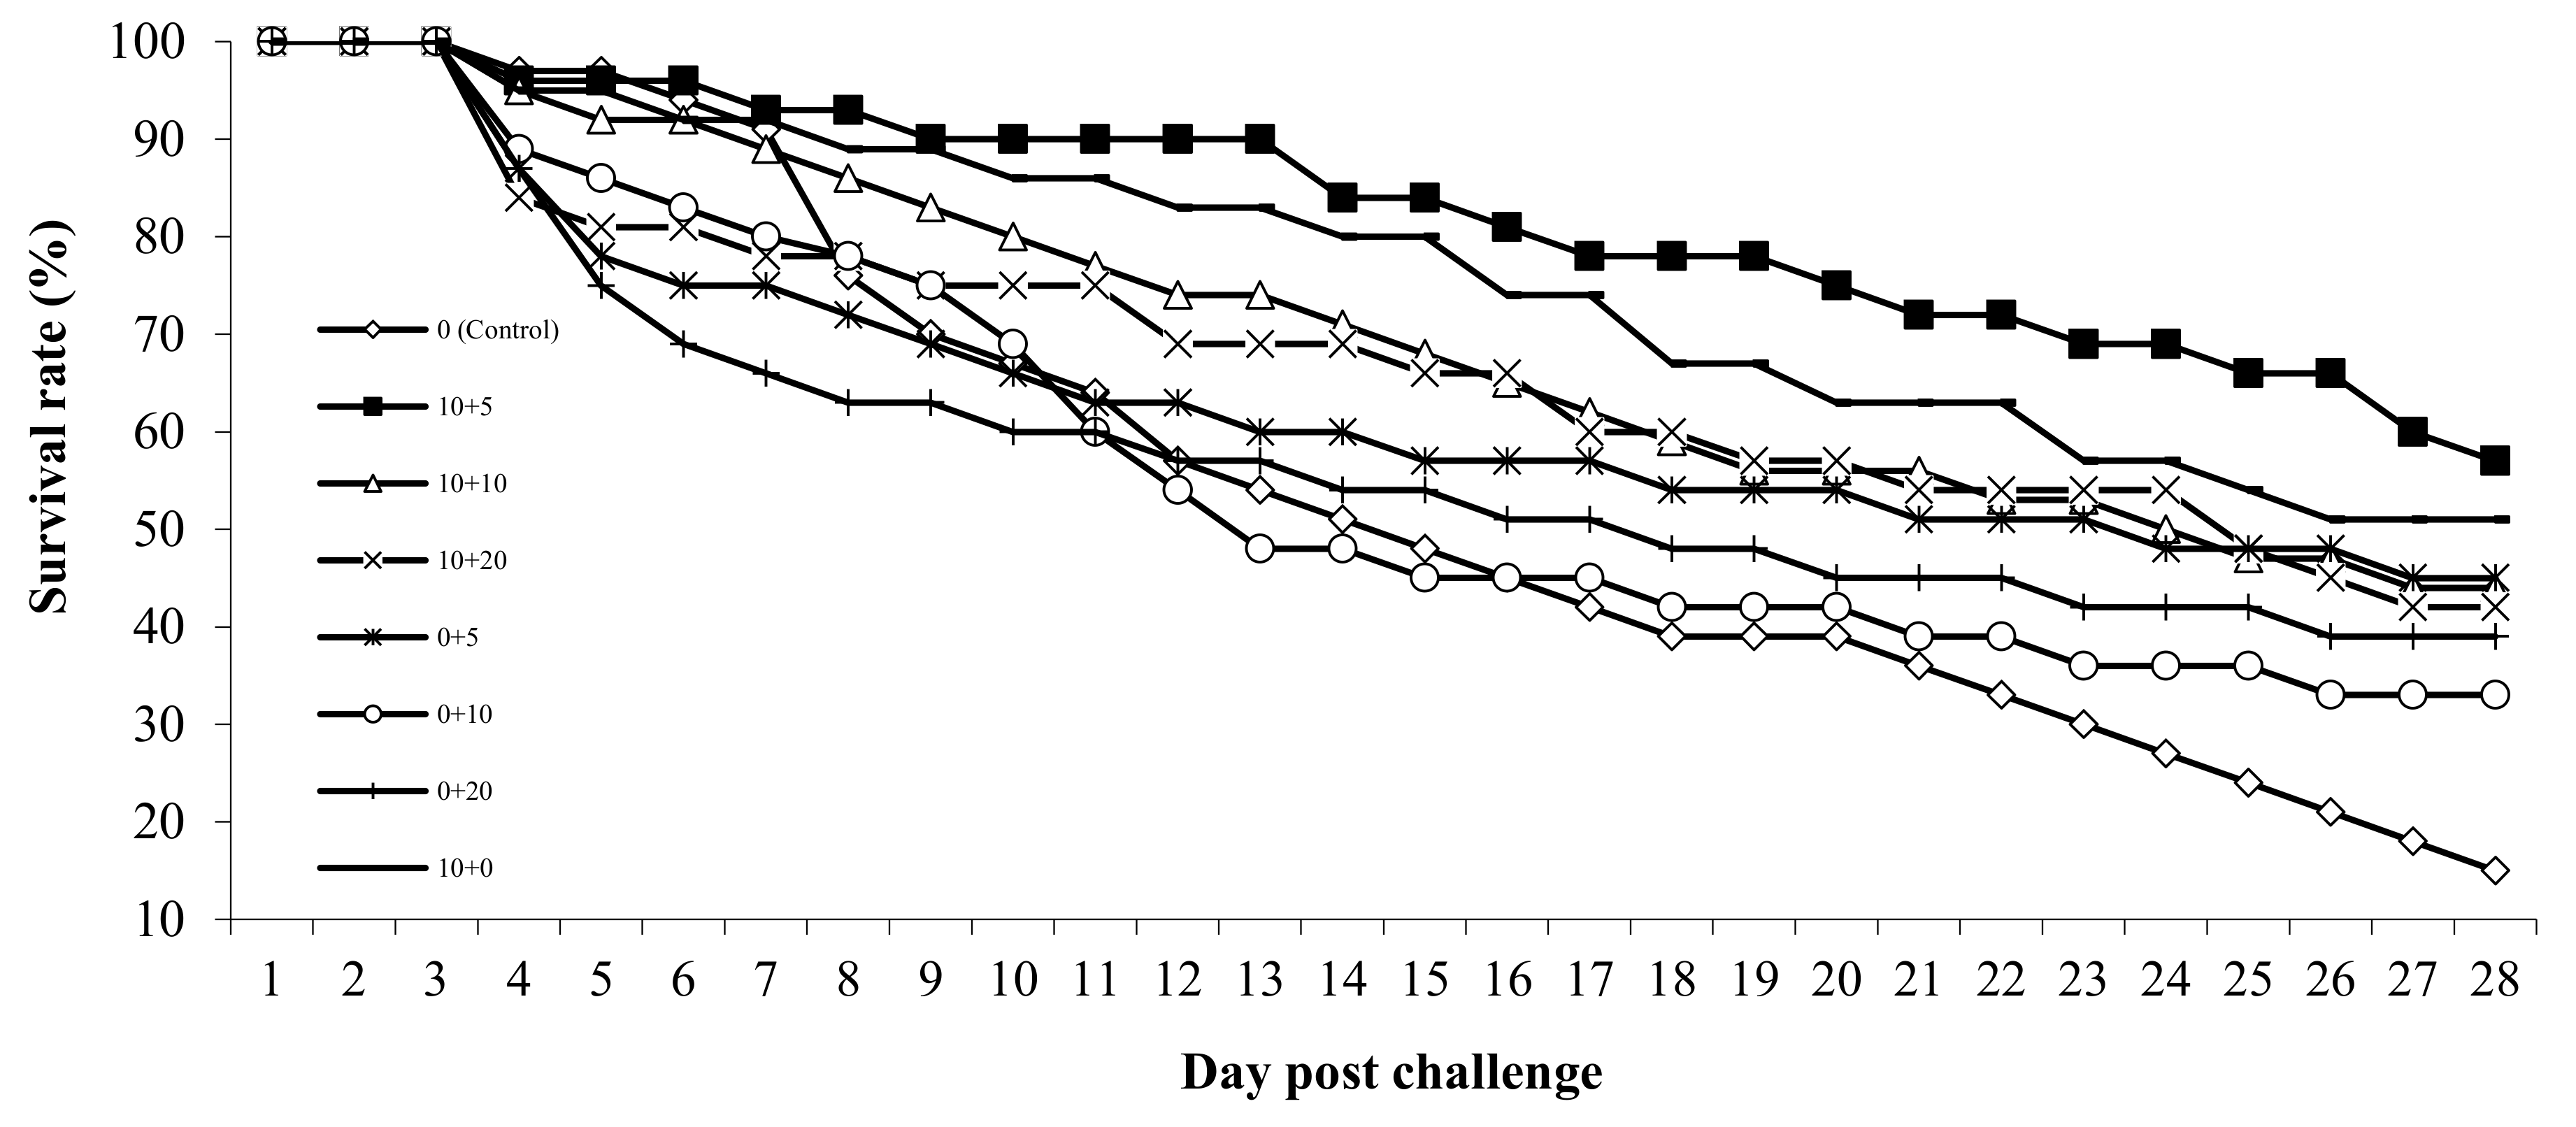
3.6. Pathogen Resistance

Single and combined administration of dietary synbiotic and sodium propionate levels enhanced the resistance of African cichlid to pathogen infection compared to those fed the control diet (Figure 3). After 28 days post-challenge, the highest survival rate (57%) was recorded in the diet containing 10 g kg−1 SYN and 5 g kg−1 SP (Figure 3).

4. Discussion

The effects of a single administration of dietary probiotic P. acidilactici, GOS as prebiotic and SP on the growth performance, immune status, digestive enzyme activity and the intestinal microbiota of different fish and shellfish species have been reported [4,11,18,20,22]. Several studies have been conducted to improve the survival and growth performance of aquatic animals through the administration of safe and eco-friendly feed-supplements, such as synbiotics and acidifiers [5,10,37,38]. To the best of our knowledge, there is not enough data on the efficiency of the combination of synbiotics and acidifiers on the growth performance of fish. The results of the current study reveal that the single administration of SYN (P. acidilactici + GOS) or combined with different levels of SP promoted the survival rate (%), growth performance and feed utilization indices, including final weight, weight gain, SGR%, FCR and PER and PPV values of fish after 63 days. The enhancement of growth performance could be attributed to the stimulation of digestive enzyme activities in the gastrointestinal tract [39], resulting in the better absorption of different nutrients, such as proteins and lipids [40]. The single administration of SP at the level of 5 g kg−1 of diet improved the survival rate and growth performance of fish, which may be due to the higher activity of digestive enzymes in this SP-dietary group. The effects of the different levels (0%, 0.25%, 0.5%, 1% and 2%) of SP on the growth performance of Caspian white (R. frisii kutum) fry showed that the final weight, WG and SGR% were higher in fish fed 0.25% dietary SP [37]. Kuhlmann et al. [41] also found an increase of 19% in the yield of shrimp; L. vannamei fed a 0.5% KDF-supplemented diet. However, it is not clear how organic acids could enhance digestive enzyme activities, nutrient retention efficiency, and finally, the growth performance of aquatic species. Some researchers related these biological responses to reduce the pH value of the diets supplemented with organic acids, improve gut microbiota of digestive tract via increment in lactic acid bacteria count and the reduction of Gram-negative bacteria (e.g., E. coli) [24,25]. Nonetheless, the positive effects of the combination SYN and SP in the diet of African cichlid were confirmed in the present study. Further studies need to evaluate the associated physiological pathways.
The results indicated that the lysozyme (LYZ) activity and total immunoglobulin (Ig) level increased significantly in fish fed diets supplemented with SYN and different levels of SP, except the 20 g kg−1-SP group. The highest increase in the Ig level and LYZ activity was observed in fish fed a diet supplemented with SYN (P. acidilactici + GOS). It was found that the LYZ activity increased in rainbow trout (O. mykiss) fed a P. acidilactici-supplemented diet (at 2.4 × 10⁶ CFU g−1) for 4 weeks [18]. It was reported that the total Ig was higher in zebrafish (Danio rerio) fed 1% or 2% GOS than the control group, while the LYZ activity showed no change compared to control after eight weeks [22]. Guerreiro et al. [20] found that dietary GOS (1%) incorporation had no significant effect on Ig level and LYZ activity in white sea bream (Diplodus sargus) juveniles. In the present study, the increase of total Ig and LYZ activity in African cichlid is probably related to the simultaneous administration of P. acidilactici and GOS. Rahimnejad et al. [42] also reported that the serum LYZ activity and ACH50 level increased in juvenile rockfish (Sebastes schlegeli) fed synbiotics (1% GOS and 6.3 log CFU g−1 P. acidilactici) for 8 weeks. In contrast, the finding of the present study showed that fish fed supplemented diets, especially SYN-supplemented diets, had lower ACH50 activity than the control group. This finding is in accordance with the finding of another study, which found that ACH50 decreased in White Sea bream (D. sargus) fed GOS compared to fish fed a control diet [20]. The serum Ig level and LYZ activity decrease paralleled the increase in SP level from 5 to 20 g kg−1 of diet, while the ACH50 increased with increasing SP of diets. Evaluation of the effects of different levels (0%, 0.25%, 0.5%, 1% and 2%) of dietary SP on Caspian white fish (R. frisii kutum) fry (2 g) humoral immune responses showed that lysozyme and ACH50 activities were higher in 0.25% and 0.5% treatments than other treatments [37]. In contrast, Safari et al. [11] found that the serum total Ig level and lysozyme activity increased with the elevation of the SP level from 0% to 2% in diets of common carp (C. carpio) (~25 g). These contradictory findings may be due to the difference in fish species and life stages [24]. However, further studies need to elucidate the cause of such different results.
The results of the present study revealed that GPx and SOD activities increased remarkably in 10 g kg−1-SYN and 10 g kg−1-SYN + 5 g kg−1-SP groups. Similarly, dietary synbiotics (GOS+ P. acidilactici) increased liver antioxidant enzymes (CAT, GST and GR) activity in rainbow trout (O. mykiss) [43]. The plasma SOD activity was higher in juvenile rockfish (S. schlegeli) fed a diet supplemented with synbiotic (1% GOS and 6.3 log CFU g−1 P. acidilactici) than those fed P. acidilactici and GOS-supplemented diets [42]. On the contrary, the single administration of dietary GOS had no significant effect on antioxidant enzymatic activity, including SOD and GPx, in white sea bream (D. sargus) [20]. The results of another study also showed that SOD and GPx activities in erythrocyte hemolysate of common carp (C. carpio) were not affected by dietary probiotic P. acidilactici [44]. It has been reported that dietary SP increased the expression of the GPx gene in the liver of common carp (C. carpio) [11]. The findings of the current study also indicated the elevation of SOD and GPx activities in fish fed SP-supplemented diets compared to the control group. The inclusion of SP at the level of 5 g kg−1 diet had a more positive effect on the activity of these enzymes. To interpret the results, it is important to consider fish species, ontogeny stages (larvae, fry, adult and broodstock), diet regimes (herbivorous, omnivorous and carnivorous), nutritional history and basal diet formulation.
The elevated digestive enzyme activities have been reported in fish and shellfish fed probiotics, prebiotics and their combination as synbiotics [9,45]. In the present study, the maximum digestive enzymes activity, including protease, α-amylase and lipase, was observed in fish fed diets supplemented with SYN (P. acidilactici + GOS). It was shown that the digestive enzyme activities enhanced in zebra fish (D. rerio) fed diets supplemented with different levels of P. acidilactici [46]. In contrast, dietary prebiotic GOS had no positive effect on digestive enzyme activity, such as protease, trypsin and lipase, in white seabream (D. sargus) after 12 weeks [20]. To date, few studies have investigated the effects of dietary organic acids on the digestive enzyme activity of aquatic animals [24]. Increased digestive enzymes activity has been reported in hybrid tilapia and white shrimp (Litopenaeus vannamei) fed citric acid-supplemented diets [47,48] and in green terror (Andinoacara rivulatus) fed apple cider vinegar-supplemented diets [25]. In the current study, dietary SP, especially at the levels of 5 and 10 g kg−1 diet, enhanced the activity of digestive enzymes compared to the control. However, the combination of SP with SYN and elevation of its level from 5 to 20 g kg−1 diet led to the decrease in digestive enzyme activities compared to the single administration of SYN. Although the exact cause of this effect is not clear, it needs more studies to identify the physiological pathways.
Lactic acid bacteria (LAB) are considered beneficial microorganisms within the gastrointestinal (GI) tract of fish. It is well known that they have the ability to stimulate the digestive function, host GI development, immune responses and disease resistance in fish species [49,50]. In the present study, the African cichlid fed an SYN-supplemented diet showed the highest lactobacillus count. Dietary supplementation with 2% GOS increased the LAB level and the ratio of LAB to TVC in the gut microbiota of Caspian roach (R. caspicus) and Caspian white (R. frisii kutum) fish fingerlings after 6 weeks [23]. The population of LAB also increased significantly in the intestinal tract of angelfish (Pterophyllum scalare) fed adult Artemia franciscana enriched with synbiotic (P. acidilactici + GOS) for 7 weeks [10]. Feeding beluga larvae (Huso huso) with Artemia urmiana nauplii enriched with P. acidilactici for 9 h also had a significant effect on the LAB level in the digestive tract of fish [51]. It was found that the addition of 3 g kg−1 K-diformate (KDF) to plant protein-based diets stimulated the growth of LAB in the gastrointestinal tract of tilapia [52]. Wassef et al. [53] reported that the inclusion of SP at the levels of 0.2% and 0.3% beneficially modified the distal intestine microbiota of European seabass (Dicentrarchus labrax) fry. In contrast, the supplementation of the diet with 2% Na-butyrate had no significant effects on the gut bacterial community of African catfish (Clarias gariepinus) [54]. In this trial, dietary supplementation with singular and combination use of synbiotics and sodium propionate improved the survival rate of A. hydrophila-injected African cichlid. Moreover, lactobacillus count in all dietary groups was higher than in the control group. In the present study, we observed the stimulating effects of using synbiotics and sodium propionate on growth performance and intestinal lactobacillus count of African cichlid. However, it needs further investigations to be confirmed.

5. Conclusions

The single administration of dietary SYN (P. acidilactici + GOS) and different levels of SP and their combination improved the survival rate, growth performance and lactic acid bacteria count in the gastrointestinal tract and enhanced selected humoral immune responses, antioxidant enzymes and digestive enzyme activities of African cichlid. Twenty-eight days after Aeromonas hydrophila injection, the survival rate of fish fed the diets containing SYN and/or SP were higher than those of fish fed the control diet. According to the results, the best inclusion level of SP as an acidifier was 5 g kg−1 of diet. These findings suggested that the supplementation of African cichlid-diets with SYN (P. acidilactici + GOS) and SP could be an effective way to improve fish health and reduce production costs.

Author Contributions

O.S. ran the experiment and analyzed the samples. M.S. collected the samples and wrote the manuscript. D.S. analyzed the samples and edited the manuscript. M.P. prepared the materials and kits and edited the manuscript. All authors have read and agreed to the published version of the manuscript.

Funding

This research was funded by the Research and Technology Deputy of Ferdowsi University of Mashhad under the 5%-Special Election Support Agreement of FUM (no: 73209; 16 March 2019).

Institutional Review Board Statement

The authors declare that the experiments were performed according to FUM animal ethics and the Directive 2010/63/EU of the European Parliament and of the Council of 22 September 2010 on the protection of animals used for scientific purposes.

Data Availability Statement

The data that support the findings of this study are available from the corresponding author upon reasonable request.

Acknowledgments

The authors thanks from Masoomeh Meraban Sang Atash for technical support.

Conflicts of Interest

The authors declare no conflict of interest. The funders had no role in the design of the study; in the collection, analyses, or interpretation of data; in the writing of the manuscript, or in the decision to publish the results.

References

  1. Ladisa, C.; Bruni, M.; Lovatelli, A. Overview of Ornamental Species Aquaculture. FAO Aquac. Newsl. 2017, 56, 39–40. [Google Scholar]
  2. Ngo, V.H. The use of medicinal plants as immunostimulants in aquaculture: A review. Aquaculture 2015, 446, 88–96. [Google Scholar]
  3. Vallejos-Vidal, E.; Reyes-López, F.; Teles, M.; MacKenzie, S. The response of fish to immunostimulant diets. Fish. Shellfish. Immunol. 2016, 56, 34–69. [Google Scholar] [CrossRef]
  4. Safari, O.; Paolucci, M.; Ahmadniaye Motlagh, H.R. Effects of synbiotics on immunity and disease resistance of narrow-clawed crayfish, Astacus leptodactylus leptodactylus (Eschscholtz, 1823). Fish. Shellfish Immunol. 2017, 64, 392–400. [Google Scholar] [CrossRef] [PubMed]
  5. Safari, O.; Paolucci, M. Effect of in vitro selected synbiotics (galactooligosaccharide and mannanoligosaccharide with or without Enterococcus faecalis) on growth performance, immune responses and intestinal microbiota of juvenile narrow clawed crayfish, Astacus leptodactylus leptodactylus Eschscholtz, 1823. Aquac. Nutr. 2018, 24, 247–259. [Google Scholar]
  6. Safari, O.; Sarkheil, M. Dietary administration of eryngii mushroom (Pleurotus eryngii) powder on haemato-immunological responses, bactericidal activity of skin mucus and growth performance of koi carp fingerlings (Cyprinus carpio koi). Fish. Shellfish Immunol. 2018, 80, 505–513. [Google Scholar] [CrossRef]
  7. Wang, Y.B.; Tian, Z.; Yao, J.; Li, W. Effect of probiotics, Enterococcus faecium, on tilapia (Oreochromis niloticus) growth performance and immune response. Aquaculture 2008, 277, 203–207. [Google Scholar] [CrossRef]
  8. Merrifield, D.L.; Dimitroglou, A.; Foey, A.; Davies, S.J.; Baker, R.T.M.; Bogwald, J. The current status and future focus of probiotic and prebiotic applications for salmo¬nids. Aquaculture 2010, 302, 1–18. [Google Scholar] [CrossRef]
  9. Ghasempour Dehaghani, P.; Javaheri Baboli, M.; Taghavi Moghadam, A.; Ziaei-Nejad, S.; Pourfarhadi5, M. Effect of synbiotic dietary supplementation on survival, growth performance, and digestive enzyme activities of common carp (Cyprinus carpio) fingerlings. Czech. J. Anim. Sci. 2015, 60, 224–232. [Google Scholar] [CrossRef] [Green Version]
  10. Azimirad, M.; Meshkini, S.; Ahmadifard, N.; Hoseinifar, S.H. The effects of feeding with synbiotic (Pediococcus acidilactici and fructooligosaccharide) enriched adult Artemia on skin mucus immune responses, stress resistance, intestinal microbiota and performance of angelfish (Pterophyllum scalare). Fish. Shellfish Immunol. 2016, 54, 516–522. [Google Scholar] [CrossRef]
  11. Safari, R.; Hoseinifar, S.H.; Nejadmoghadam, S.; Khalili, M. Non-specific immune parameters, immune, antioxidant and growth-related genes expression of common carp (Cyprinus carpio L.) fed sodium propionate. Aquac. Res. 2017, 48, 1–9. [Google Scholar] [CrossRef]
  12. Fuller, R. Probiotic in man and animals. J. Appl. Microbiol. 1989, 66, 365–378. [Google Scholar]
  13. Harikrishnan, R.; Balasundaram, C.; Heo, M.S. Lactobacillus sakei BK19 enriched diet enhances the immunity status and disease resistance to streptococcosis infection in kelp grouper, Epinephelus bruneus. Fish. Shellfish Immunol. 2010, 29, 1037–1043. [Google Scholar] [CrossRef]
  14. Nayak, S.K. Probiotics and immunity: A fish perspec¬tive. Fish. Shellfish Immunol. 2010, 29, 2–14. [Google Scholar] [CrossRef] [PubMed]
  15. Merrifield, D.L.; Bradley, G.; Harper, G.M.; Baker, R.T.M.; Munn, C.B.; Davies, S.J. Assessment of the effects of vegetative and lyophilized Pediococcus acidilactici on growth, feed utilization, intestinal colonization and health parameters of rainbow trout (Oncorhynchus mykiss Walbaum). Aquac. Nutr. 2011, 17, 73–79. [Google Scholar] [CrossRef]
  16. Neissi, A.; Rafiee, G.; Nematollahi, M.; Safari, O. The effect of Pediococcus acidilactici bacteria used as probiotic supplement on the growth and non-specific immune responses of green terror, Aequidens rivulatus. Fish. Shellfish Immunol. 2013, 35, 1976–1980. [Google Scholar] [CrossRef]
  17. Safari, R.; Hoseinifar, S.H.; Kavandi, M. Modulation of antioxidant defence and immune response in zebra fish (Danio rerio) using dietary sodium propionate. Fish. Physiol. Biochem. 2016, 42, 1733–1739. [Google Scholar] [CrossRef] [PubMed]
  18. Al-Hisnawi, A.; Rodiles, A.; Rawling, M.D.; Castex, M.; Waines, P.; Gioacchini, G.; Carnevali, O. Dietary robiotic Pediococcus acidilactici MA18/5M modulates the intestinal microbiota and stimulates intestinal immunity in rainbow trout (Oncorhynchus mykiss). J. World Aquacult Soc. 2019, 50, 1–19. [Google Scholar] [CrossRef]
  19. Gibson, G.R.; Roberfroid, M.B. Dietary modulation of the colonic microbiota: Introducing the concept of prebiotics. Nutr. J. 1995, 125, 1401–1412. [Google Scholar] [CrossRef]
  20. Guerreiro, I.; Couto, A.; Machado, M.; Castro, C.; Pousão-Ferreira, P.; Oliva-Teles, A. Prebiotics effect on immune and hepatic oxidative status and gut morphology of white sea bream (Diplodus sargus). Fish. Shellfish Immunol. 2016, 50, 168–174. [Google Scholar] [CrossRef]
  21. Ringo, E.; Song, S.K. Application of dietary supplements (synbiotics and probiotics in combination with plant products and β-glucans) in aquaculture. Aquac. Nutr. 2016, 22, 4–24. [Google Scholar] [CrossRef]
  22. Yousefi, S.; Hoseinifar, S.H.; Paknejad, H.; Hajimoradloo, A. The effects of dietary supplement of galactooligosaccharide on innate immunity, immune related genes expression and growth performance in zebrafish (Danio rerio). Fish. Shellfish Immunol. 2018, 73, 192–196. [Google Scholar] [CrossRef]
  23. Hoseinifar, S.H.; Doan, H.V.; Ashouri, G. Galactooligosaccharide effects as prebiotic on intestinal microbiota of different fish species. J. Agron. Anim. Ind. 2019, 14, 266–278. [Google Scholar] [CrossRef]
  24. Ng, W.K.; Koh, C.B. The utilization and mode of action of organic acids in the feeds of cultured aquatic animals. Rev. Aquacult. 2017, 9, 342–368. [Google Scholar] [CrossRef]
  25. Ahmadniaye Motlagh, H.; Sarkhei, M.; Safari, O.; Paolucci, M. Supplementation of dietary apple cider vinegar as an organic acidifier on the growth performance, digestive enzymes and mucosal immunity of green terror (Andinoacara rivulatus). Aquac. Res. 2019, 51, 1–9. [Google Scholar] [CrossRef]
  26. Silva, B.C.; Vieira, F.N.; Mourino, J.L.P.; Ferreira, G.S.; Seiffert, W.Q. Salts of organic acids selection by multiple characteristics for marine shrimp nutrition. Aquaculture 2013, 384–387, 104–110. [Google Scholar] [CrossRef]
  27. Erdogan, F.; Erdogan, M.; Gümüş, E. Effects of dietary protein and lipid levels on growth performances of two African Cichlids (Pseudotropheus socolofi and Haplochromis ahli). Turk. J. Fish. Aquat. Sci. 2012, 12, 635–640. [Google Scholar]
  28. Sarkheil, M.; Ameri, M.; Safari, O. Application of alginate-immobilized microalgae beads as biosorbent for removal of total ammonia and phosphorus from water of African cichlid (Labidochromis lividus) recirculating aquaculture system. Environ. Sci. Pollut. Res. 2021, 1–13. [Google Scholar] [CrossRef] [PubMed]
  29. Siwicki, A.K.; Anderson, D.P.; Rumsey, G.L. Dietary intake of immunostimulants by rainbow trout affects non-specific immunity and protection against furunculosis. Vet. Immunol. Immunopathol. 1994, 41, 125–139. [Google Scholar] [CrossRef]
  30. Kumari, J.; Sahoo, P.K.; Swain, T.; Sahoo, S.K.; Sahu, A.K.; Mohanty, B.R. Seasonal variation in the innate immune parameters of the Asian catfish Clarias batrachus. Aquaculture 2006, 252, 121–127. [Google Scholar] [CrossRef]
  31. Yano, T. Assay of Hemolytic Complement Activity. In Techniques in Fish Immunology; Stolen, J.S., Fletcher, T.C., Anderson, D.P., Hattari, S.C., Rowley, A.F., Eds.; SOS Publications: Trenton, NJ, USA, 1992; pp. 131–141. [Google Scholar]
  32. Yanbo, W.; Zirong, X. Effect of probiotics for common carp (Cyprinus carpio) based on growth performance and digestive enzyme activities. Anim. Feed Sci. Technol. 2006, 127, 283–292. [Google Scholar] [CrossRef]
  33. Gawlicka, A.; Parent, B.; Horn, M.H.; Ross, N.; Opstad, I.; Torrissen, O.J. Activity of digestive enzymes in yolk-sac larvae of Atlantic halibut (Hippoglossus hippoglossus): Indication of eadiness for first feeding. Aquaculture 2000, 184, 303–314. [Google Scholar] [CrossRef]
  34. Worthington, C. Worthington Enzyme Manual Related Biochemical. Freehold. N. J. 1991, 34, 212–215. [Google Scholar]
  35. Hidalgo, M.C.; Urea, E.; Sanz, A. Comparative study of digestive enzymes in fish with different nutritional habits: Proteolytic and amylase activities. Aquaculture 1999, 170, 267–283. [Google Scholar] [CrossRef]
  36. Association of Official Analytical Chemists (AOAC). Official Methods of Analysis, 16th ed.; Association of Official Analytical Chemists Arlington: Washington, DC, USA, 2005. [Google Scholar]
  37. Hoseinifar, S.H.; Zoheiri, F.; Caipang, C.M. Dietary sodium propionate improved performance, mucosal and humoral immune responses in Caspian white fish (Rutilus frisii kutum) fry. Fish. Shellfish Immunol. 2016, 55, 523–528. [Google Scholar] [CrossRef]
  38. Sewaka, M.; Trullas, C.; Chotiko, A.; Rodkhum, C.; Chansue, N.; Boonanuntanasarn, S.; Pirarat, N. Efficacy of synbiotic Jerusalem artichoke and Lactobacillus rhamnosus GG-supplemented diets on growth performance, serum biochemical parameters, intestinal morphology, immune parameters and protection against Aeromonas veronii in juvenile red tilapia (Oreochromis spp.). Fish. Shellfish Immunol. 2018, 86, 260–268. [Google Scholar] [CrossRef] [PubMed]
  39. Eslamloo, K.; Falahatkar, B.; Yokoyama, S. Effects of dietary bovine lactoferrin on growth, physiological performance, iron metabolism and non-specific immune responses of Siberian sturgeon Acipenser baeri. Fish. Shellfish Immunol. 2012, 32, 976–985. [Google Scholar] [CrossRef]
  40. Haroun, E.; Goda, A.; Kabir, M. Effect of dietary probiotic biogen supplementation as a growth promoter on growth performance and feed utilization of Nile tilapia Oreochromis niloticus (L.). Aquac. Res. 2006, 37, 1473–1480. [Google Scholar] [CrossRef]
  41. Kuuhlmann, K.J.; Jintasataporn, O.; Leucksteadt, C. Dietary potassium-diformate (KDF) improves growth performance of white-leg shrimp Litopenaeus vannamei under controlled conditions. Int. Aquafeed 2011, 3, 19–22. [Google Scholar]
  42. Rahimnejad, S.; Guardiola, F.A.; Leclercq, E.; Esteban, M.A.; Castex, M.; Sotoudeh, E.; Lee, S.M. Effects of dietary supplementation with Pediococcus acidilactici MA18/5M, galactooligosaccharide and their synbiotic on growth, innate immunity and disease resistance of rockfish (Sebastes schlegeli). Aquaculture 2018, 482, 36–44. [Google Scholar] [CrossRef]
  43. Hoseinifar, S.H.; Hoseini, S.M.; Bagheri, D. Effects of galactooligosaccharide and Pediococcus acidilactici on antioxidant defence and disease resistance of rainbow trout, Oncorhynchus mykiss. Ann. Anim. Sci. 2017, 17, 217–227. [Google Scholar] [CrossRef] [Green Version]
  44. Mirshahpanah, M.; Salari, A.; Shahsavani, D.; Baghshani, H.; Nematy, M. Effect of Pediococcus acidilatici on intestinal microbiota and the oxidative parameters of blood and muscles in Common Carp (Cyprinus carpio). J. Nutr. Fasting Health 2019, 7, 37–43. [Google Scholar] [CrossRef]
  45. Daniels, C.; Merrifield, D.; Boothroyd, D.; Davies, S.; Factor, J.; Arnold, K. Effect of dietary Bacillus spp. and man¬nan oligosaccharides (MOS) on European lobster (Homarus gammarus L.) larvae growth performance, gut morphology and gut microbiota. Aquaculture 2010, 304, 49–57. [Google Scholar] [CrossRef]
  46. Arani, M.M.; Salati, A.P.; Safari, O.; Keyvanshokooh, S. Dietary supplementation effects of Pediococcus acidilactici as probiotic on growth performance, digestive enzyme activities and immunity response in zebrafish (Danio rerio). Aquac. Nutr. 2019, 25, 854–861. [Google Scholar] [CrossRef]
  47. Li, J.S.; Li, J.L.; Wu, T.T. Effects of non-starch polysaccharides enzyme, phytase and citric acid on activities of endogenous digestive enzymes of tilapia (Oreochromis niloticus × Oreochromis aureus). Aquac. Nutr. 2009, 15, 415–420. [Google Scholar] [CrossRef]
  48. Su, X.; Li, X.; Leng, X.; Tan, C.; Liu, B.; Chai, X. The improvement of growth, digestive enzyme activity and disease resistance of white shrimp by the dietary citric acid. Aquac. Int. 2014, 22, 1823–1835. [Google Scholar] [CrossRef]
  49. Li, X.; Ringo, E.; Hoseinifar, S.H.; Lauzon, H.; Birkbeck, H.; Yang, D. Adherence and colonisation of microorganisms in the fish gastrointestinal tract. Rev. Aquacult. 2018, 11, 603–618. [Google Scholar] [CrossRef]
  50. Ringo, E.; Hoseinifar, S.H.; Ghosh, K.; Doan, H.V.; Beck, B.R.; Song, S.K. Lactic Acid Bacteria in Finfish—An Update. Front. Microbiol. 2018, 9, 1818. [Google Scholar] [CrossRef] [PubMed]
  51. Zare, A.; Azari-Takami, G.; Taridashti, F.; Khara, H. The effects of Pediococcus acidilactici as a probiotic on growth performance and survival rate of great sturgeon, Huso huso (Linnaeus, 1758). Iran. J. Fish. Sci. 2017, 16, 150–161. [Google Scholar]
  52. Wang, A.R.; Ran, C.; Ringo, E.; Zhou, Z. Progress in fish gastrointestinal microbiota research. Rev. Aquacult. 2018, 10, 626–640. [Google Scholar] [CrossRef] [Green Version]
  53. Wassef, E.A.; Saleh, N.E.; Abdel-Meguid, N.E.; Barakat, K.M.; Abdel-Mohsen, H.H.; El-bermawy, N.M. Sodium propionate as a dietary acidifier for European seabass (Dicentrarchus labrax) fry: Immune competence, gut microbiome, and intestinal histology benefits. Aquac. Int. 2019, 28, 1–17. [Google Scholar] [CrossRef]
  54. Owen, M.A.G.; Waines, P.; Bradley, G.; Davies, S. The Effect of Dietary Supplementation of Sodium Butyrate on the Growth and Microflora of Clarias gariepinus (Burchell 1822). In Proceedings of the 12th International Symposium on Fish Nutrition and Feeding, Biarritz, France, 28 May–1 June 2006; p. 149. [Google Scholar]
Figure 1. Lysozyme (U mL−1) (a), total immunoglobulin (mg mL−1) (b) and alternative hemolytic complement activity (ACH50) (U mL−1) (c) activities in the serum of African cichlid (L. lividus) fed diets supplemented with different levels of synbiotic (0 and 10 g kg−1) and sodium propionate (0, 5, 10 and 20 g kg−1) for 63 days. Bars with different letters are significantly different (mean ± SD; ANOVA, p < 0.05; n = 3). 10 + 5 = SYN (10 g kg−1) + SP (5 g kg−1); 10 + 10 = SYN (10 g kg−1) + SP (10 g kg−1); 10 + 20 = SYN (10 g kg−1) + SP (20 g kg−1); 0 + 5 = SP (5 g kg−1); 0 + 10 = SP (10 g kg−1); 0 + 20 = SP (20 g kg−1); 10 + 0 = SYN (10 g kg−1).
Fishes 06 00063 g001
Figure 2. Glutathione peroxidase (GPx) (U mL−1) (a) and superoxide dismutase (SOD) (U mL−1) (b) activities in serum of African cichlid (L. lividus) fed diets supplemented with different levels of synbiotic (0 and 10 g kg−1) and sodium propionate (0, 5, 10 and 20 g kg−1) for 63 days. Bars with different letters are significantly different (mean ± SD; ANOVA, p < 0.05; n = 3). 10 + 5 = SYN (10 g kg−1) + SP (5 g kg−1); 10 + 10 = SYN (10 g kg−1) + SP (10 g kg−1); 10 + 20 = SYN (10 g kg−1) + SP (20 g kg−1); 0 + 5 = SP (5 g kg−1); 0 + 10 = SP (10 g kg−1);0 + 20 = SP (20 g kg−1); 10 + 0 = SYN (10 g kg−1).
Fishes 06 00063 g002
Figure 3. Survival rate (%) of African cichlid (L. lividus) injected with Aeromonas hydrophila during the 28 days post challenge. Fish were fed experimental diets with different levels of synbiotic (0 and 10 g kg−1) and sodium propionate (0, 5, 10 and 20 g kg−1) with three replicates. 10 + 5 = SYN (10 g kg−1) + SP (5 g kg−1); 10 + 10 = SYN (10 g kg−1) + SP (10 g kg−1); 10 + 20 = SYN (10 g kg−1) + SP (20 g kg−1); 0 + 5 = SP (5 g kg−1); 0 + 10 = SP (10 g kg−1);0 + 20 = SP (20 g kg−1); 10 + 0 = SYN (10 g kg−1).
Fishes 06 00063 g003
Table 1. The feed ingredients and chemical composition of the control diet-fed juvenile African cichlid (Labidochromis lividus).
Feed Ingredient Content (g kg−1)
Fishmeal 1350
Spirulina meal 220
Soybean meal 173
Corn gluten 1100
Wheat flour 1240
Fish oil 170
Canola oil 170
Soy lecithin 15
Choline chloride (70%) 34
Vitamin C (stay) 35
Vitamin premix 3,*15
Mineral premix 3,*15
Antifungus 13
Filler (Carboxymethyl cellulose) 430
Chemical composition (g kg−1)
Dry matter899.39
Crude protein421
Crude fat282
Crude fiber65
Nitrogen free extract 131.39
Gross energy (Mj kg−1)15.58
1 Saramad Fish Aquafeed Co, Iran; 2 ACECR, Iran; 3 Kimia Roshd Co. Iran; 4 Sigma, Germany. * Mineral premix contains (mg Kg−1) Mg, 100; Zn, 60; Fe, 40; Cu, 5; Co, 0.1; I, 0.1; Antioxidant, 100. * Vitamin premix contains (mg Kg−1) E, 30; K, 3; Thiamine, 2; Riboflavin, 7; Pyridoxine, 3; Pantothenic acid, 18; Niacin, 40; Folacin, 1.5; Choline, 600; Biotin, 0.7 and Cyanocobalamin, 0.02.
Table 2. Growth performance, feed utilization parameters and survival rate of African cichlid (L. lividus) fed diets supplemented with different levels of synbiotic and sodium propionate for 63 days (mean ± SD, n = 3).
Dietary Synbiotic + Sodium Propionate Level (g kg−1)
0 (Control)10 + 510 + 1010 + 200 + 50 + 100 + 2010 + 0
Initial weight (g)0.65 ± 0.050.58 ± 0.040.67 ± 0.110.69 ± 0.050.65 ± 0.030.7 ± 0.020.68 ± 0.030.65 ± 0.09
Final weight (g)3.49 ± 0.09 a3.83 ± 0.09 b3.81 ± 0.13 b3.82 ± 0.07 b3.60 ± 0.52 b3.59 ± 0.06 a3.63 ± 0.07 a3.86 ± 0.04 b
Weight gain (g)2.83 ± 0.058 a3.25 ± 0.13 b3.14 ± 0.026 b3.13 ± 0.025 b2.95 ± 0.50 b2.89 ± 0.055 a2.94 ± 0.10 a3.20 ± 0.11 b
(% BW day−1)2.65 ± 0.10 a2.99 ± 0.16 d2.77 ± 0.22 bcd2.71 ± 1.02 bc2.69 ± 0.19 cd2.59 ± 0.03 a2.65 ± 0.09 ab2.82 ± 0.22 cd
Feed conversion ratio1.76 ± 0.03 c1.46 ± 0.06 b1.43 ± 0.01 b1.43 ± 0.02 b1.16 ± 0.21 a1.73 ± 0.03 c1.59 ± 0.05 c1.24 ± 0.04 a
Condition factor1.26 ± 0.011.43 ± 0.071.62 ± 0.091.49 ± 0.071.26 ± 0.11.26 ± 0.041.47 ± 0.041.49 ± 0.3
PER1.3 ± 0.14 a2.4 ± 0.15 e2.2 ± 0.16 de2 ± 0.14 cd2 ± 0.15 bc1.7 ± 0.13 b1.4 ± 0.15 a2.8 ± 0.14 f
PPV47 ± 0.14 a59 ± 0.16 f55 ± 0.17 e53 ± 0.2 d53 ± 0.18 d52 ± 0.19 c49 ± 0.19 b69 ± 0.14 g
Survival rate (%)83.33 ± 3.60 a97.91 ± 3.60 b95.83 ± 7.21 b93.75 ± 6.25 b97.91 ± 3.60 b91.66 ± 9.54 ab81.25 ± 12.5 a100 ± 0.00 b
10 + 5 = SYN (10 g kg−1) + SP (5 g kg−1); 10 + 10 = SYN (10 g kg−1) + SP (10 g kg−1); 10 + 20 = SYN (10 g kg−1) + SP (20 g kg−1); 0 + 5 = SP (5 g kg−1); 0 + 10 = SP (10 g kg−1);0 + 20 = SP (20 g kg−1); 10 + 0 = SYN (10 g kg−1). The values with different letters in the same row are significantly different (ANOVA, p < 0.05).
Table 3. Carcass proximate compositions of African cichlid (L. lividus) fed diets supplemented with different levels of synbiotic (0 and 10 g kg−1) and sodium propionate (0, 5, 10 and 20 g kg−1) for 63 days (mean ± SD, n = 3).
Dietary Synbiotic + Sodium Propionate Level (g kg−1)
0 (Control)10 + 510 + 1010 + 200 + 50 + 100 + 2010 + 0
Dry matter (%)26.88 ± 0.7626.63 ± 0.8626.98 ± 0.4727.08 ± 0.5627.00 ± 0.3626.78 ± 0.5627.05 ± 0.6627.03 ± 0.56
Crude protein (%)16.07 ± 0.37 a16.95 ± 0.32 f16.84 ± 0.42 e16.67 ± 0.23 d16.69 ± 0.23 d16.53 ± 0.23 c16.27 ± 0.27 b17.04 ± 0.22 g
Crude lipid (%)5.44 ± 0.05 e4.12 ± 0.08 a4.60 ± 0.07 c4.93 ± 0.13 d4.92 ± 0.10 d4.89 ± 0.09 d5.43 ± 0.09 e4.42 ± 0.11 b
Ash (%)3.16 ± 0.15 a3.38 ± 0.32 c3.41 ± 0.29 c3.39 ± 0.20 c3.18 ± 0.21 a3.19 ± 0.23 a3.25 ± 0.35 b3.43 ± 0.22 c
10 + 5 = SYN (10 g kg−1) + SP (5 g kg−1); 10 + 10 = SYN (10 g kg−1) + SP (10 g kg−1); 10 + 20 = SYN (10 g kg−1) + SP (20 g kg−1); 0 + 5 = SP (5 g kg−1); 0 + 10 = SP (10 g kg−1);0 + 20 = SP (20 g kg−1); 10 + 0 = SYN (10 g kg−1). The values with different letters in the same row are significantly different (ANOVA, p < 0.05).
Table 4. Digestive enzymes activity (U mg protein−1 min−1) of African cichlid (L. lividus) fed diets supplemented with different levels of synbiotic (0 and 10 g kg−1) and sodium propionate (0, 5, 10 and 20 g kg−1) for 63 days (mean ± SD, n = 3).
Dietary Synbiotic + Sodium Propionate Level (g kg−1)
0 (Control)10 + 510 + 1010 + 200 + 50 + 100 + 2010 + 0
Protease8.1 ± 0.14 a10.2 ± 0.16 d9.5 ± 0.17 c9.4 ± 0.2 c9.3 ± 0.18 b c9 ± 0.19 b8.4 ± 0.19 a10.5 ± 0.16 d
α-amylase3.9 ± 0.14 a7 ± 0.15 g6.3 ± 0.16 f5.5 ± 0.14 e5.2 ± 0.15 d4.9 ± 0.13 c4.5 ± 0.15 b8.2 ± 0.15 h
Lipase4.3 ± 0.19 a6.4 ± 0.2 e6.1 ± 0.22 d6.4 ± 0.23 c d6.1 ± 0.23 b c5.9 ± 0.2 b4.6 ± 0.23 a8.4 ± 0.15 f
10 + 5 = SYN (10 g kg−1) + SP (5 g kg−1); 10 + 10 = SYN (10 g kg−1) + SP (10 g kg−1); 10 + 20 = SYN (10 g kg−1) + SP (20 g kg−1); 0 + 5 = SP (5 g kg−1); 0 + 10 = SP (10 g kg−1); 0 + 20 = SP (20 g kg−1); 10 + 0 = SYN (10 g kg−1). The values with different letters in the same row are significantly different (ANOVA, p < 0.05).
Table 5. Total aerobic bacteria count (TAB; Log CFU g−1), lactobacillus count (LAB; Log CFU g−1), E. coli count (Log CFU g−1) and fungi count (Log CFU g−1) of intestines extracted from African cichlid (L. lividus) fed diets supplemented with different levels of synbiotic (0 and 10 g kg−1) and sodium propionate (0, 5, 10 and 20 g kg−1) for 63 days (mean ± SD, n = 3).
Bacteria Count
(Log CFU g−1)
Dietary Synbiotic + Sodium Propionate Level (g kg−1)
0 (Control)10 + 510 + 1010 + 200 + 50 + 100 + 2010 + 0
Total aerobic6.28 ± 1.096.20 ± 1.216.48 ± 1.306.38 ± 1.476.41 ± 1.316.47 ± 1.536.39 ± 1.526.48 ± 1.42
Lactobacillus0.42 ± 1.13 a3.31 ± 1.09 e3.12 ± 1.27 d2.93 ± 1.35 c2.89 ± 1.07 c1.67 ± 1.43 b1.71 ± 1.29 b3.09 ± 1.18 d
E. coli count0.51 ± 0.32 e0.25 ± 0.28 a0.43 ± 0.31 d0.37 ± 0.21 c0.38 ± 0.18 c0.31 ± 0.25 b0.32 ± 0.26 b0.42 ± 0.28 d
Fungi count0.42 ± 0.430.39 ± 0.240.37 ± 0.210.38 ± 0.240.41 ± 0.290.43 ± 0.130.36 ± 0.190.36 ± 0.19
10 + 5 = SYN (10 g kg−1) + SP (5 g kg−1); 10 + 10 = SYN (10 g kg−1) + SP (10 g kg−1); 10 + 20 = SYN (10 g kg−1) + SP (20 g kg−1); 0 + 5 = SP (5 g kg−1); 0 + 10 = SP (10 g kg−1);0 + 20 = SP (20 g kg−1); 10 + 0 = SYN (10 g kg−1). The values with different letters in the same row are significantly different (ANOVA, p < 0.05).
Publisher’s Note: MDPI stays neutral with regard to jurisdictional claims in published maps and institutional affiliations.

