
A Multidisciplinary Approach Evaluating Soybean Meal-Induced Enteritis in Rainbow Trout Oncorhynchus mykiss


1
Christian-Albrechts-Universität Kiel, Gesellschaft für Marine Aquakultur mbH, 25761 Buesum, Germany
2
Aquamedic, AS, Gaustadallèen 21, 0349 Oslo, Norway
3
Research Institute for Farm Animal Biology, Institute of Genome Biology, Fish Genetics Unit, 18196 Dummerstorf, Germany
*
Authors to whom correspondence should be addressed.
Fishes 2022, 7(1), 22; https://0-doi-org.brum.beds.ac.uk/10.3390/fishes7010022
Submission received: 16 December 2021
/
Revised: 11 January 2022
/
Accepted: 12 January 2022
/
Published: 14 January 2022
(This article belongs to the Section Genetics and Biotechnology)
Abstract
:This study evaluated a diverse range of markers of feeding stress to obtain a more precise assessment of the welfare of rainbow trout in relation to inadequate husbandry conditions. A feeding stress model based on dietary soybean meal was employed to identify suitable minimally invasive “classical” stress markers, together with molecular signatures. In a 56-day feeding experiment, rainbow trout were fed diets containing different levels of soybean meal. The impact of these different soybean meal diets on rainbow trout was assessed by water quality analyses, clinical health observations, classic growth and performance parameters, gut histopathology, blood-parameter measurements and multigene-expression profiling in RNA from whole blood. Soybean meal-induced enteritis was manifested phenotypically by an inflammatory reaction in the posterior section of the intestine and by diarrhoea in some trout. These inflammatory changes were associated with decreased supranuclear vacuolation. The haematocrit values and the levels of plasma cortisol and circulating lymphocytes in the blood were increased in trout that had consumed high amounts of SBM. Notably, the increased haematocrit depended significantly on the bodyweight of the individual trout. The transcript levels of certain genes (e.g., MAP3K1, LYG, NOD1, STAT1 and HSP90AB) emerged as potentially useful indicators in the blood of rainbow trout providing valuable information about inadequate nutrition. The expression-profiling findings provide a basis for improved, minimally invasive monitoring of feeding regimens in trout farming and may stimulate the development of practical detection devices for innovative aquaculture operations.

1. Introduction
The increasing intensification of the global aquaculture industry focuses not only on product quality and profitability, but also on the welfare of the farmed fish [1,2,3,4]. Various national, European and global research programmes aimed at assessing and defining the organism’s adaptability to withstand physical and psychological challenges during the production process have established welfare-indicator indices [3,5,6] for sustainable farming practices. The researched husbandry parameters include water temperature [7,8,9], concentrations of dissolved oxygen [10,11], stocking densities [12,13,14] and tank characteristics, such as background colour or structural enrichments [15,16], as well as the type and quality of feed containing any additives of vegetable origin [17,18,19].
Plant-based aquafeeds are becoming increasingly important for commercial aquaculture due to shortages of fishmeal and other protein sources [20]. Soybean meal (SBM) is used as a low-cost plant-based alternative to fish meal, as it provides a relatively high protein content with an amino acid profile that is similar to fish meal [21,22,23,24]. However, decades of research have revealed that SBM-based diets reduce the growth of salmonids [25], while also provoking mild to severe enteritis and other health complications [26]. These adverse responses are due to the presence of high levels of antinutritional factors, including saponins [27], proteinase inhibitors [28], lectins, oligosaccharides [29], phytoestrogens and antivitamins [27,30]. SBM feeding can induce morphological changes in the distal intestine [25,26,31], including increased numbers of inflammatory cells, shortening of folds and disruption of microvilli, widening of central stroma, increased formation of microvillar vesicles and elevated numbers of goblet and apoptotic cells, as well as reduced supranuclear vacuolisation with apical nuclear displacement within enterocytes [31,32,33,34]. Of particular significance is the SBM-induced inflammatory reaction. Unsuitable feed compositions have been reported to impair the immune system [29], and chronic inflammation may have serious consequences for the growth, health and, of course, the well-being of the fish.
The negative effects of SBM-based diets do not appear to affect all fish species investigated to the same extent [35]. In particular, carnivorous fish species such as rainbow trout (Oncorhynchus mykiss) suffer from intestinal inflammation after feeding with high levels of terrestrial plant components that contain antinutritional factors, such as soyasaponin, b-conglycinin and glycinin found in SBM [36,37]. However, the majority of the published findings on SBM-induced dietary intolerances in fish are essentially based on intestinal histology, enzyme-activity tests and microbiome analyses. Only a limited number of studies have quantified the expression of distinct genes to characterise the teleost response to SMB-induced nutritional deficiencies [37,38,39,40,41]. In general, PCR-based techniques using blood samples are still underrepresented in the field of nutritional fish physiology.
For the above reasons, in the present study, we imposed three dietary SBM inclusion levels to induce different gradations of intestinal inflammation and varying degrees of compromised overall welfare. We focused on using non-lethal and minimally invasive evaluation techniques to detect and compare a broad panel of traditional and novel health and welfare parameters indicative of SBM-induced enteritis.
2. Materials and Methods
2.1. SBM Feeding Trial
A 56-day feeding trial was conducted at the research facility of the Gesellschaft für Marine Aquakultur mbH in Buesum, Germany.
2.1.1. Diets
The diets were designed to be isonitrogenous and isoenergetic, following the amino-acid requirements of rainbow trout [42]. Feed pellets (with 6 mm in length and 4 mm in diameter) were produced using a pelleting machine (Type 14U175, Amandus Kahl, Hamburg, Germany) without subsequent extrusion processes. The fishmeal portion (50% in the control diet) was replaced with SBM at 33%, 66% and 100% to generate four pelleted feeds, SBM0 (no SBM included, control diet corresponding to the feed formulation of a commercially available trout feed), SBM33 (16.4% SBM included in the total ration), SBM66 (33% SBM included in total ration) and SBM100 (50% SBM included in the total ration; Table 1).
The nutrient compositions of the feeds are shown in Table 2.
2.1.2. Fish, Husbandry Conditions and Feeding Trial
A total of 228 juvenile, female monosex rainbow trout (O. mykiss; Troutbreeder Trostadt GbR, Reurieth, Germany) with an average weight of 81.9 ± 0.4 g were randomly stocked into twenty 150 L freshwater tanks in a recirculation system (Spranger Kunststoffe, Plauen, Germany) with a total volume of 5 m3. The transparent window of each tank was covered with a mirror spy foil (ESG Handels GmbH, Leutasch, Austria) to shield the fish from routine work. Fish were held under optimal conditions (18.5 ± 0.7 °C, 7.6–8.4 mg/L dissolved oxygen, pH 7.5 ± 0.1, NH4 0.3 ± 0.2 mg/L and NO2 1.3 ± 0.7 mg/L). The day–night rhythm was 14:10 h.
After an acclimation period of 14 days, the feeding experiment was performed in triplicate with 17 fish per tank. All animal handling procedures were approved by the animal welfare officer of the “Gesellschaft für Marine Aquakultur mbH” and the local authority of Schleswig-Holstein, according to the German animal welfare law. The initial stocking density was 14–15 kg/m3. All trout were fed twice a day (9 am and 4 pm) to apparent satiation with one of the four experimental feeds (Table 1). After each feeding, the uneaten pellets were collected and quantified to calculate the actual and precise feed intake.
2.1.3. Sampling
Six fish per feeding group were sampled at the start of the trial, after 4 weeks and after 8 weeks (at the end of the trial). The distribution of the feeding groups in the experimental set-up was randomised and the fish were randomly redistributed after the mid-term of the experiment. Two fish per tank (six fish per feeding group) were stunned by a blow to the head. Blood was taken from the caudal vein (Vena caudalis), using a sterile S-Monovette (EDTA KE/ 1.2 mL; Sarstedt, Germany) and a sterile syringe Safety-cannula (21G × 1½”; Sarstedt, Germany), for haematocrit, serum cortisol, differential blood cell count and molecular investigations. The length and weight of each individual fish were measured, and the fish were euthanised by severing the gill arches. The fish were then dissected and the liver and spleen weights were measured for calculations of organosomatic indices. Histology samples from the distal intestine were collected and fixed in 10% formalin.
The time expired between catching the fish, direct stunning by a blow to the head and the end of blood collection was documented and took no longer than five minutes (on average, 2.5 min).
2.2. Assessment of Body Condition Indices
The performance parameters, including specific growth rate (SGR), feed conversion ratio (FCR), daily feed intake (DFI), Fulton’s condition factor (K), hepatosomatic index (HIS) and spleenosomatic index (SSI), were calculated based on group measures as follows:
where FGW = final group weight [kg], IGW = initial group weight [kg], t = 59 days, Ft = total amount of feed intake [g], FIW = final individual weight [g], FIL = final individual length [cm], LiW = weight of liver [g] and SpW = weight of spleen [g].
SGR = [ln(FGW) − ln(IGW)]/t × 100
FCR = (Ft/1000)/(FGW − IGW)
DFI = SGR × FCR
K = FIW/(FIL)3 × 100
HSI = LiW/FIW × 100
SSI = SpW/FIW × 1000
For whole-body analysis, a pool of three randomly picked fish per feeding group was analysed. The nutrient contents of the diet and homogenised fish bodies were determined in duplicate using the Weender analysis method based on EU Regulation (EC) No 152/2009. The quality of the moisture content was determined by drying the homogenised samples at 103 °C for 4 h (model ED 53, Binder GmbH, Tuttlingen, Germany) to a constant weight. The organic-matter content was determined by the weight loss after a 4 h incineration (P300, Nabertherm, Lilienthal, Germany) at 550 °C. The ash content was then determined by the ash concentration in the incinerator (P300, Nabertherm, Lilienthal, Germany). The protein content was determined using the Kjeldahl method (N = 6.25) by chemical digestion (InKjel 1225 M, WD, Behr Labor-Technik GmbH, Düsseldorf, Germany), distillation (Behrosog3, Behr Labor-Technik GmbH) and titration (Titrex 2000, Behr Labor-Technik GmbH) of the samples. Crude fat content was determined by hydrolysis with hydrochloric acid (Hydrotherm HT 6 Gerhardt, Königswinter, Germany) and ether extraction in a Soxlet unit (Soxtherm Multistat/SX PC, Gerhardt, Königswinter, Germany). The gross energy content was determined by bomb calorimetry (C 200, IKA-Werke GmbH & Co. KG, Staufen, Germany).
The carbohydrate content was calculated based on the dry matter content of crude ash, crude protein and crude fat subtracted from 100% of the dry matter.
2.3. Haematocrit Determination
The collected EDTA-treated whole blood was immediately used to fill three heparinised micro haematocrit capillaries (Art. No. 7493 11, Brand GmbH + Co KG, Wertheim, Germany) to approximately 75% and centrifuged with a haematocrit centrifuge (Hämatokrit 210, Hettich GmbH & Co. KG, Tuttlingen, Germany) at 40,000 RZB/min at room temperature for 4 min. The haematocrit value was then read from a measuring template (Hettich GmbH & Co. KG, Tuttlingen, Germany).
2.4. Differential Blood Count
Haematological evaluation of the blood cells was conducted on blood smears taken from all sampled fish. A drop of EDTA-whole blood was applied to a previously cleaned slide and smeared with the narrow edge of a second slide. The blood smears were air-dried and then stained with a Giemsa stain (Dip Quick Stain, Jorgensen Laboratories, Loveland, Colorado). The stained blood cells were counted under light microscopy (CKX41, Olympus, Tokyo, Japan) at 1000× magnification using oil immersion. The blood smears were counted using the “meander” method. For each smear, 100 cells (granulocytes, lymphocytes, thrombocytes and monocytes) were recorded at two different suitable locations on the slide. The percentage composition of the differential blood count was then derived from the relative proportion of the blood cells detected.
2.5. Quantification of Serum Cortisol Levels
Cortisol levels were quantified by transferring 500 µL whole blood immediately after blood collection into 1.5 mL reaction tubes and centrifuging at 15,060× g for 5 min (Eppendorf Centrifuge Model 5414, Eppendorf, Hamburg, Germany). The resulting supernatant (blood plasma) was decanted into new 1.5 mL tubes and immediately frozen at −80 °C until measurement.
Before measurement, the blood plasma samples were purified by ethanol extraction. A commercial ELISA test kit for cortisol in human saliva―adapted for rainbow trout―was used to determine the cortisol content in blood plasma (Cortisol Salvia ELISA, RE52611, IBL International GmbH, Hamburg, Germany). The tests were performed in duplicate. A microplate reader (Infinite M200, Tecan Group Ltd., Männedorf, Switzerland) was used to measure the optical density, which was linearised using the logit-loglinear analysis (in IBM SPSS Statistics 20, Armonk, NY, USA), as the decrease in optical density was not linear with the increase in cortisol content.
2.6. Histopathological Evaluation of the Intestine
The intestinal tissue sections were evaluated by light microscopy, with a focus on the histomorphological changes characteristically found with SBM-induced enteritis (SBMIE) [34]. Tissues were dehydrated and embedded in paraffin, cut into 4 μm thick sections and stained with haematoxylin and eosin according to the routine methods of the histopathological surgery (Bleyer and Gruber-Dujardin, Göttingen, Germany). The stained sections were observed with a light microscope (Zeiss, Primo Star, Jena, Germany), and changes in mucosal fold length, width and cellularity of the submucosa and lamina propria, supranuclear enterocyte vacuolisation, frequency of intraepithelial lymphocytes and mitotic figures and apoptotic bodies within the epithelial layer were documented. The degree of morphological changes was analysed using a scoring system based on a scale from 0 to 4, where 0 was normal, 1 slight, 2 moderate, 3 severe and 4 extremely severe changes. The individual samples were allocated to the experimental groups after the histological evaluation had been completed.
2.7. Real-Time Quantitative PCR (RT-qPCR)
We designed a total of 34 oligonucleotide primer pairs (Table S1) for gene-expression profiling in blood samples using the multiplex-qPCR system Biomark HD (Fluidigm, South San Francisco, CA, USA). The panel of primer pairs covered genes coding for pattern-recognition receptors, pro- and anti-inflammatory cytokines, acute phase reactants, complement components, signaling molecules and heat-shock proteins. In addition, different marker genes for specific immune cell populations were included (Table S1). All primer pairs were pretested on the LightCycler 96 System (Roche), using the SensiFAST SYBR No-ROX Kit (Bioline). ACTB [43], EEF1A1 [44] and RPS5 [45] served as reference genes to normalise the data according to ref. [46].
We suspended 250 µL of whole blood samples in 1.3 mL RNAlater (SIGMA-Aldrich/Merck, Hamburg, Germany) to allow for storage at −80 °C until processing. Total RNA was extracted using a combination of QIAGEN RNeasy Plus Minikit (QIAGEN, Hilden, Germany) and RiboPure blood (Thermo Fisher Scientific, Bremen, Germany), with additional treatment with DNAase (QIAGEN, Hamburg, Germany). The optical density of the extracted RNA was measured photometrically (Tecan Nanoquant Infinite M200 Photometer, Tecan Group AG, Männedorf, Switzerland) to determine the quality and quantity of RNA, and its concentration was set to 10 ng/mL. RNA samples were separately reverse-transcribed into cDNA using the Reverse Transcription Master Mix (Fluidigm). The target concentration was increased using a preamplification over 10 cycles performed in 5 μL reactions using the PreAmp Master Mix (Fluidigm), followed by a treatment with exonuclease I (New England BioLabs, Frankfurt am Main, Germany). After injecting the control-line fluid (Fluidigm) into the two accumulators, the integrated-fluidic circuit (IFC) chip was primed in the MX-IFC Controller (Fluidigm). After priming, 5 μL of each primer assay and 5 μL of the preamplified cDNA samples were loaded into the respective inlets on the IFC and analysed with the Biomark HD system using the recommended manufacturer’s thermal protocol. EvaGreen fluorescence dyes (Bio-Rad) served as DNA-binding reporter molecules to allow the quantification of the amplified target fragments.
2.8. Data Analysis and Statistics
Statistical evaluations were carried out with the SPSS 20.0 statistics program (IBM SPSS Statistics 20, Armonk, NY, USA). The arithmetic mean and the standard deviation from the mean value were calculated as a measure of dispersion. The examination for normal distribution was carried out with the Kolmogorov Smirnov test. The Levene test was used to check the variance homogeneity. Normally distributed, homogeneous data were analysed by single-sector analysis of variance (ANOVA) and the Tukey test was applied as a post-hoc test. Data showing no normal distribution or variance heterogeneity were evaluated by the Kruskal-Wallis test and the post-hoc Dunnett-T3. Pearson’s correlation coefficient and linear regression analysis were used to assess the potential linear correlation between two variables. For all statistical tests, p ≤ 0.05 (two-sided) was considered significant.
Differences in histological values for the various evaluated morphological properties of the tissue were analysed for statistical significance using the Fisher test and a chi-squared post-hoc test. Both statistical tests were performed using the R-Statistics package (https://www.r-project.org/; The R Foundation; version 3.4.2; accessed on 1 September 2017) within the RStudio interphase (version 1.1.383; 2017). The differences were considered significant with p ≤ 0.05.
The RT-qPCR raw data were retrieved as Cq values using the Fluidigm Real-Time PCR analysis software v. 4.0.1. External gene-specific standard curves (107–103 copies per 5 μL; R2 > 0.999) were used to calculate individual copy numbers from Cq values. The resulting copy numbers were normalised with a factor based on the geometric mean of the copy numbers of the three reference genes, while gNorm and NormFinder [47] were used to evaluate the stability of reference gene expression. The variances between different RT-qPCR runs were minimised by grouping all data for genes of interest together using multiple plate analysis (MX 1.71 Agilent Technologies, Santa Clara, CA, USA USA). The geometric mean of the copy numbers of the suitable reference genes was used to normalise the copy numbers of the target genes. Target gene expression was calculated and normalised to a correction factor calculated from the internal control genes according to refs. [48,49] using the formula 2−ΔΔCt [50].
3. Results
3.1. Overall Health, Growth and Performance
Mortalities did not occur during the experimental period, but a strong growth divergence of the fish was observed across all experimental groups. During the eight-week trial period, we recorded a minor but steady increase in the weight of the rainbow trout. The average weight gain ranged from 25 g (SBM100) to 64 g (SBM0, Table 3). The substitution of fishmeal with SBM in the diet groups SBM33, SBM66 and SBM100 resulted in no significant differences in weight gain but influenced the specific growth rates (p = 0.05) and the FCR (p < 0.05) between the control (SBM0) and SBM100 groups. Increasing supplementation of SBM in trout feed was significantly negatively correlated with the SGR (r = −0.69; p = 0.01) and significantly positively correlated with the FCR (r = 0.70, p = 0.02).
The rainbow trout fed at 100% fish meal exchange (SBM100) had a lower DFI compared with either the SBM33 group (p = 0.045) or the SBM66 group (p = 0.052). A clearly negative correlation (r = 0.939, p = 0.000) was evident between SGR and DFI across the groups analysed, while various condition factors (including weight, K, HSI and SSI) did not show statistically significant differences (Figure 1 and Table 3).
The fish showed normal behaviour, although some trout from the SBM100 group suffered from bloody diarrhoea that began ten days after the start of the experiment and lasted until the end of the experimental period. From day 14 onwards, diarrhoea was also documented in trout from the SBM66 group. No pathological anatomical findings were observed during the final sampling, with the exception of medium to highly soft intestinal contents and slight redness of the intestinal mucosa in the SBM66 and SBM100 groups. Overall, the increasing substitution of fishmeal by SBM provoked a lower feed conversion, reduced growth and chronic diarrhoea.
3.2. Quantitative Nutrient Compositions of the Fish Body
The individuals of the SBM66 group had significantly lower protein contents (p = 0.04) compared to the SBM0 group (Table 4). The moisture, ash, fat and energy contents were not significantly different across the groups. Although not significant, the SBM33 and SBM66 groups differed from the SBM100 and SBM0 groups in terms of a lower fat content, accompanied by increased levels of moisture and ash.
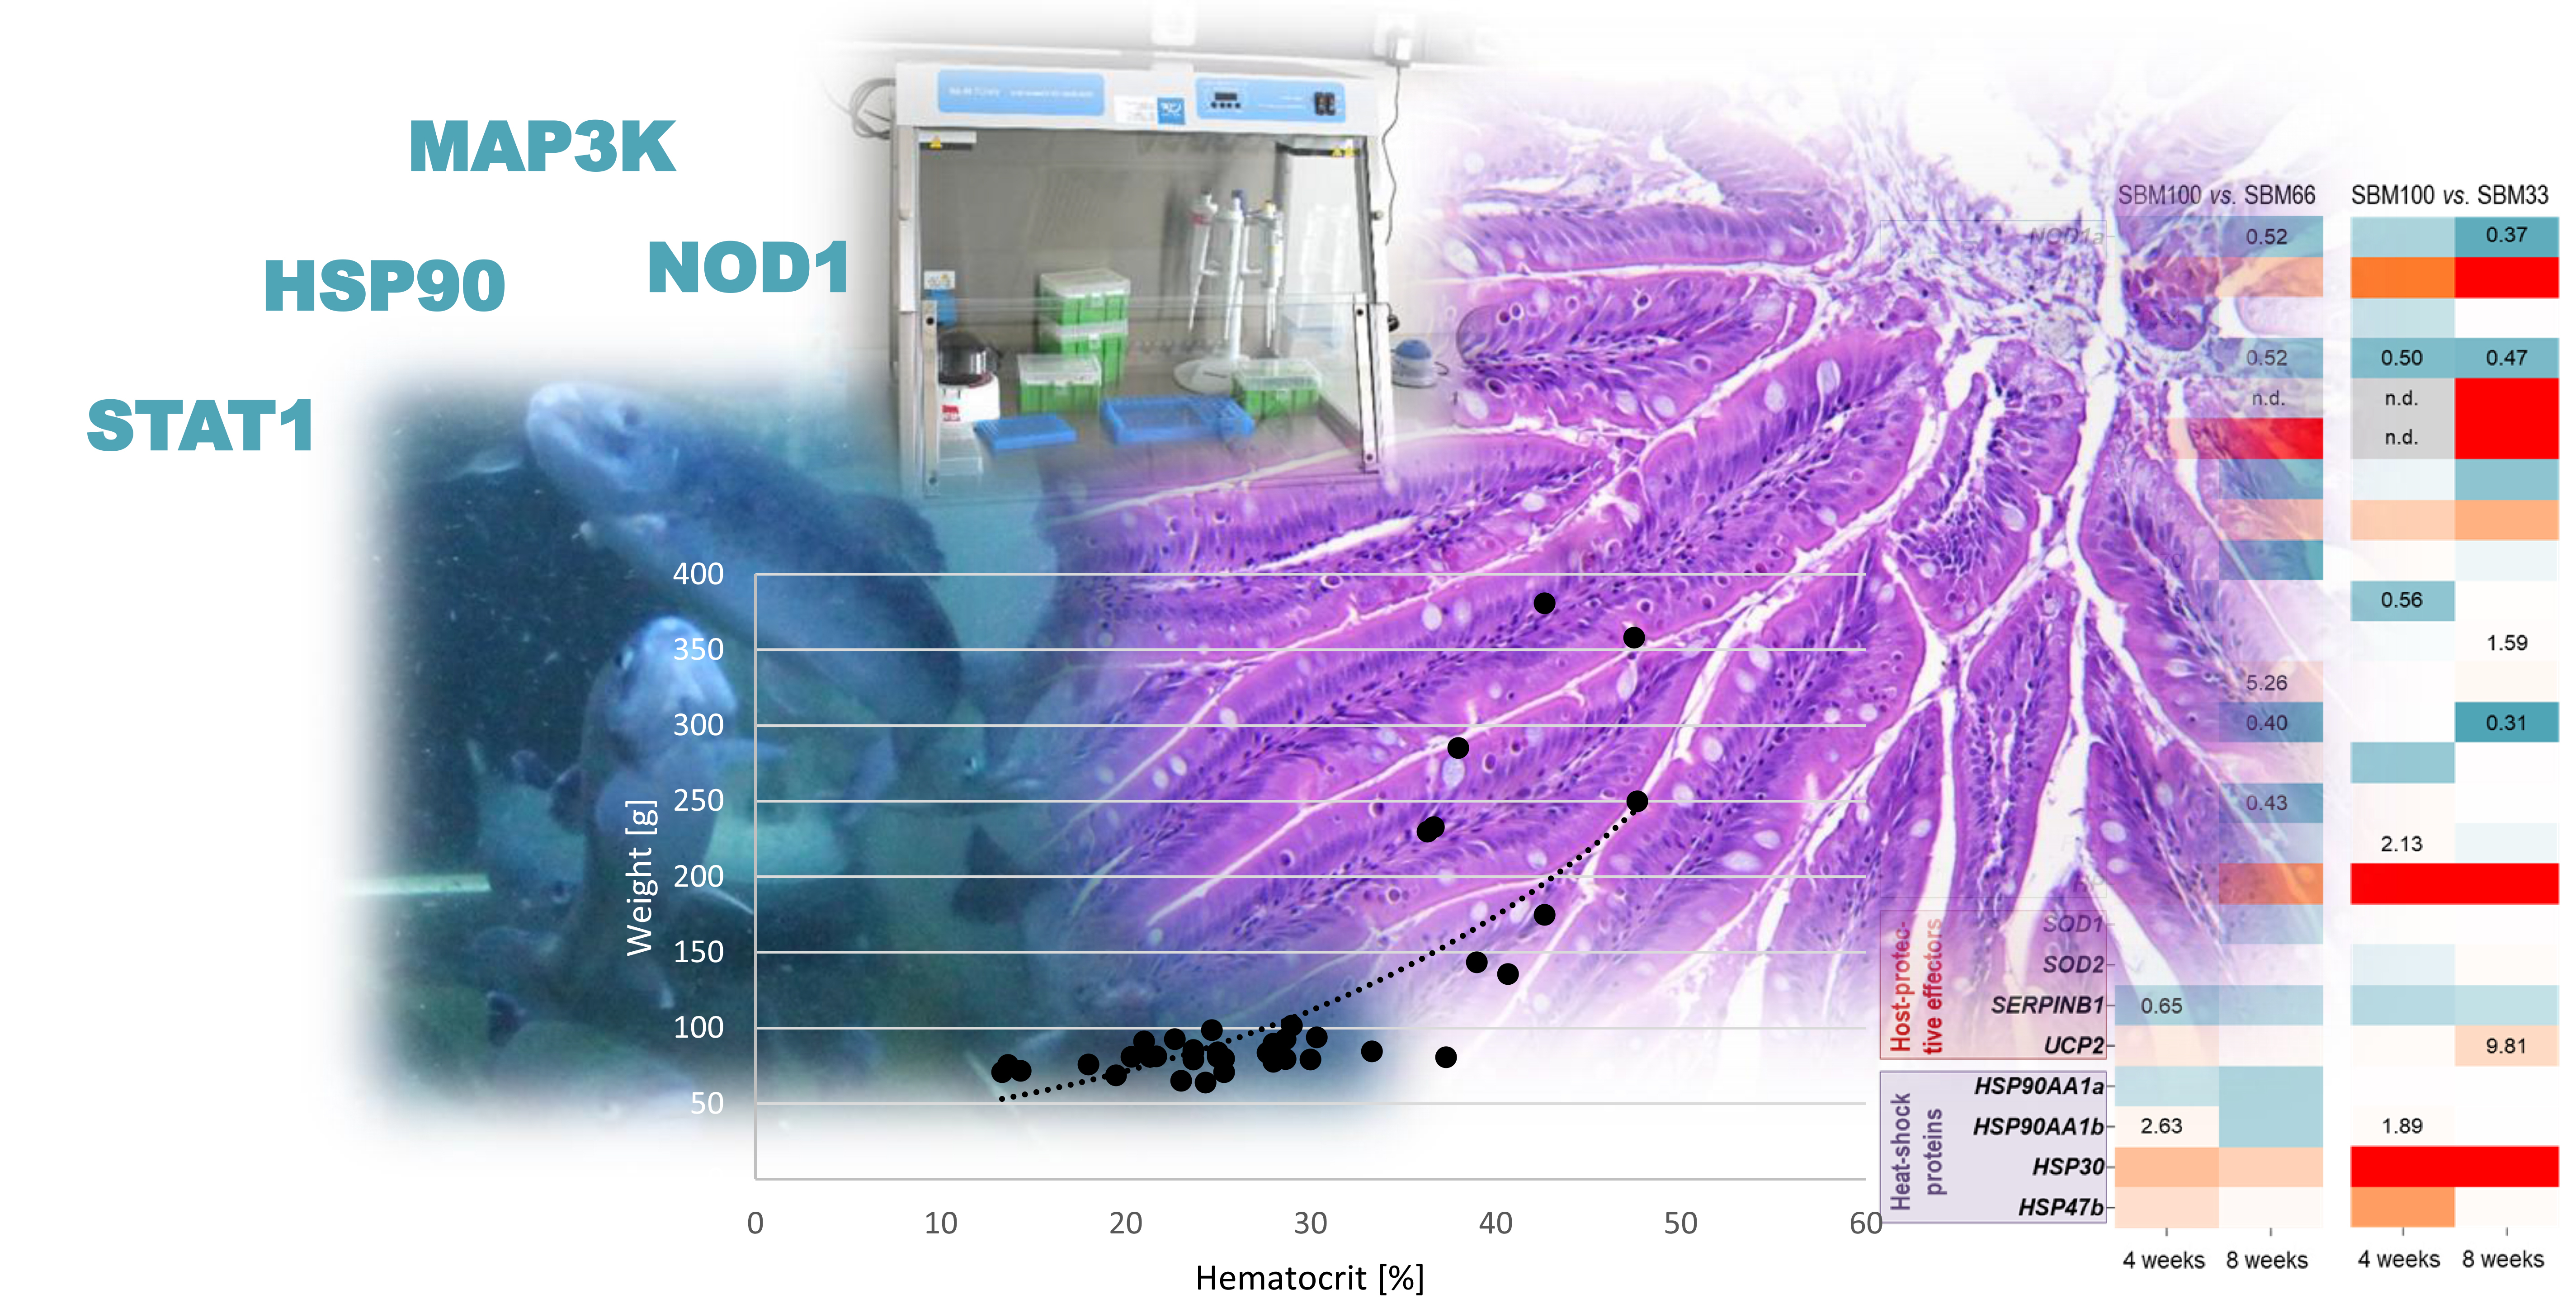
3.3. Haematocrit
The initial haematocrit value at the start of the experiment (n = 3) was 22.13% ± 3.36%, and the haematocrit values increased with increasing body weight (Pearson correlation; 4 weeks p = 0.003; 8 weeks p = 0.015) (Figure 2).
In general, the haematocrit values strongly varied across individuals and experimental groups, with average values ranging from 22% to 33% (Table 5).
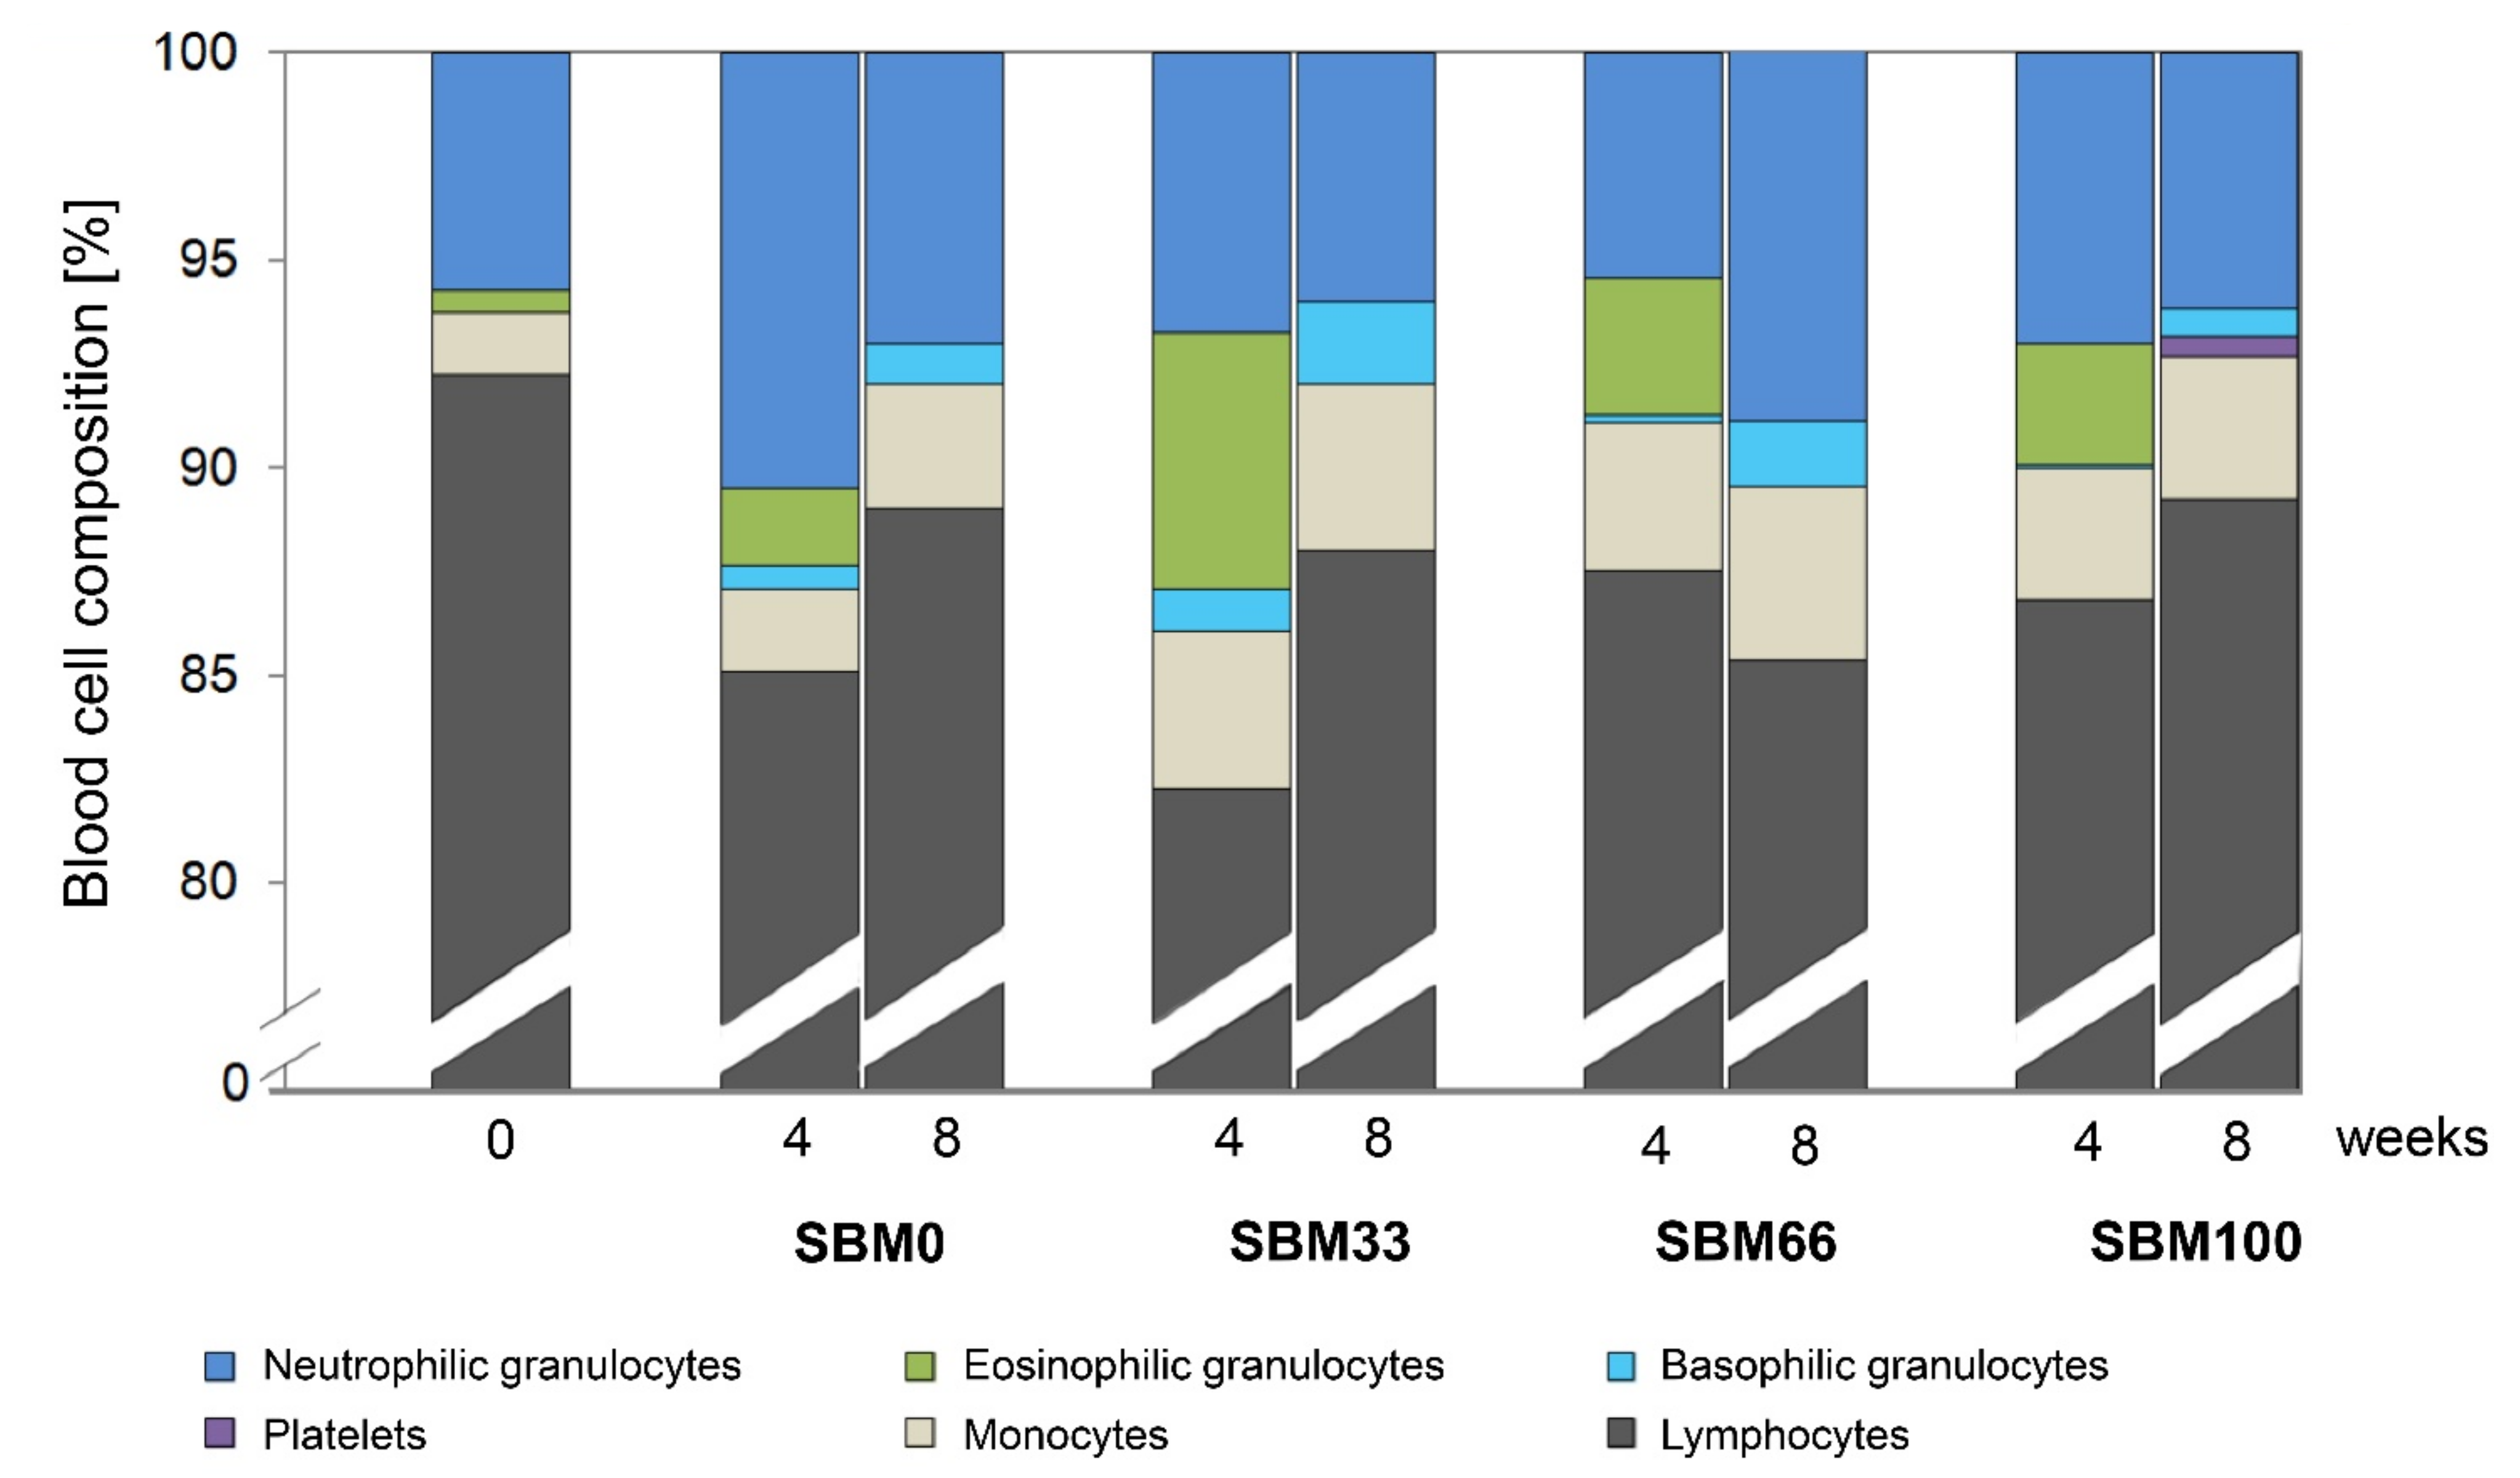
3.4. Differential Blood Count
The replacement of fishmeal with SBM in the feed did not significantly influence the cellular blood composition of the rainbow trout (n = 52), as evaluated by differential blood counts (Figure 3).
However, we observed a slightly lower percentage of lymphocytes and an associated increase in the percentage of granulocytes and monocytes across the diet groups investigated (SBM0, SBM33, SBM66 and SBM100) after four weeks compared to the start of the trial. The percentage of lymphocytes was slightly higher in the SBM0, SBM33 and SBM100 groups at the end of the experiment (at eight weeks) than at week 4. Trout from group SBM66 had the lowest mean percentage of lymphocytes, which correlated with a decrease in neutrophilic granulocytes, whereas the percentages of monocytes and basophilic granulocytes did not significantly change. Eosinophilic granulocytes were absent in the blood samples at week 8. The occurrence of platelets/thrombocytes (1%) could only be documented in individuals of the SBM100 group at week 8.
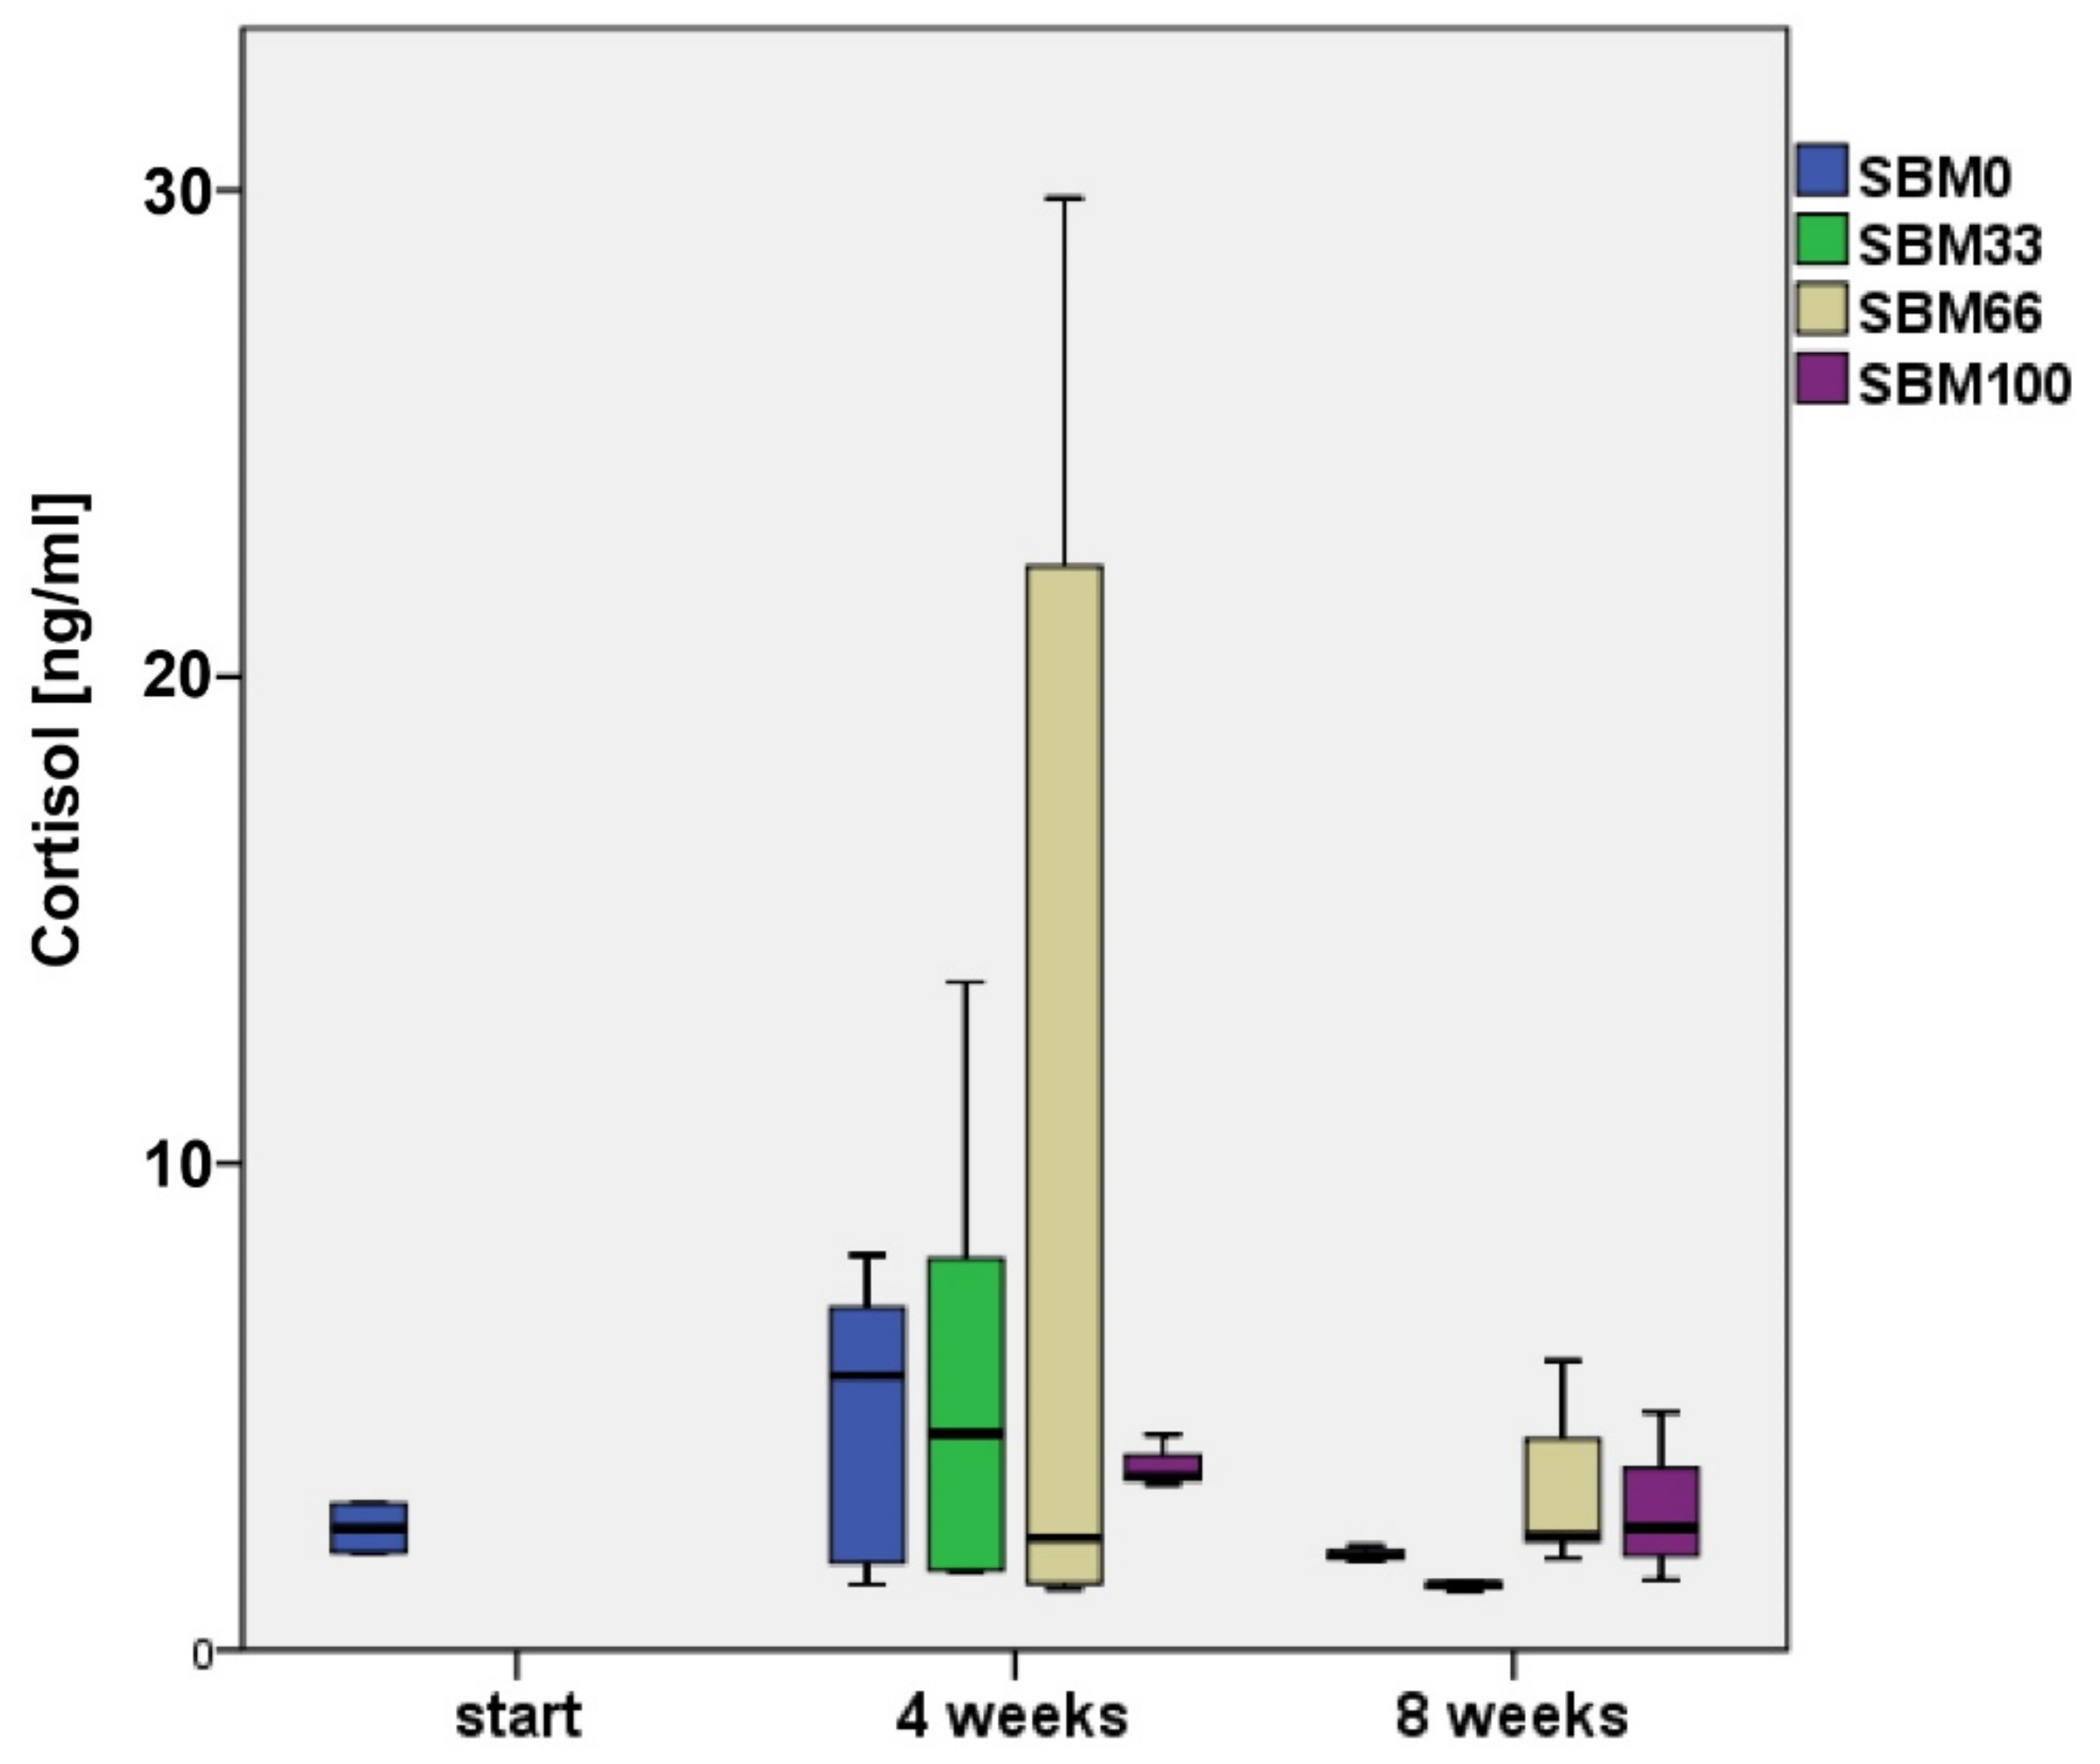
3.5. Cortisol
At the beginning of the experiment, rainbow trout (n = 4) had the lowest cortisol values, with an average concentration of 2.6 ± 0.53 ng/mL (Figure 4).
By week 4, the trout had two to five times higher cortisol levels. The levels had decreased by eight weeks but did not decline to the values measured at the initial sampling, except in the SBM33 group, which had an average cortisol content of 1.92 ± 1.74 ng/mL (Figure 4).
The individual cortisol concentrations showed strong variations; therefore, we did not observe significant differences between the SBM and the control groups. However, a tendency was indicated for a correlation between rising cortisol concentrations and increasing SBM content in the feed (Figure 4). Cortisol level and body weight did not show a significant correlation.
3.6. Histopathology
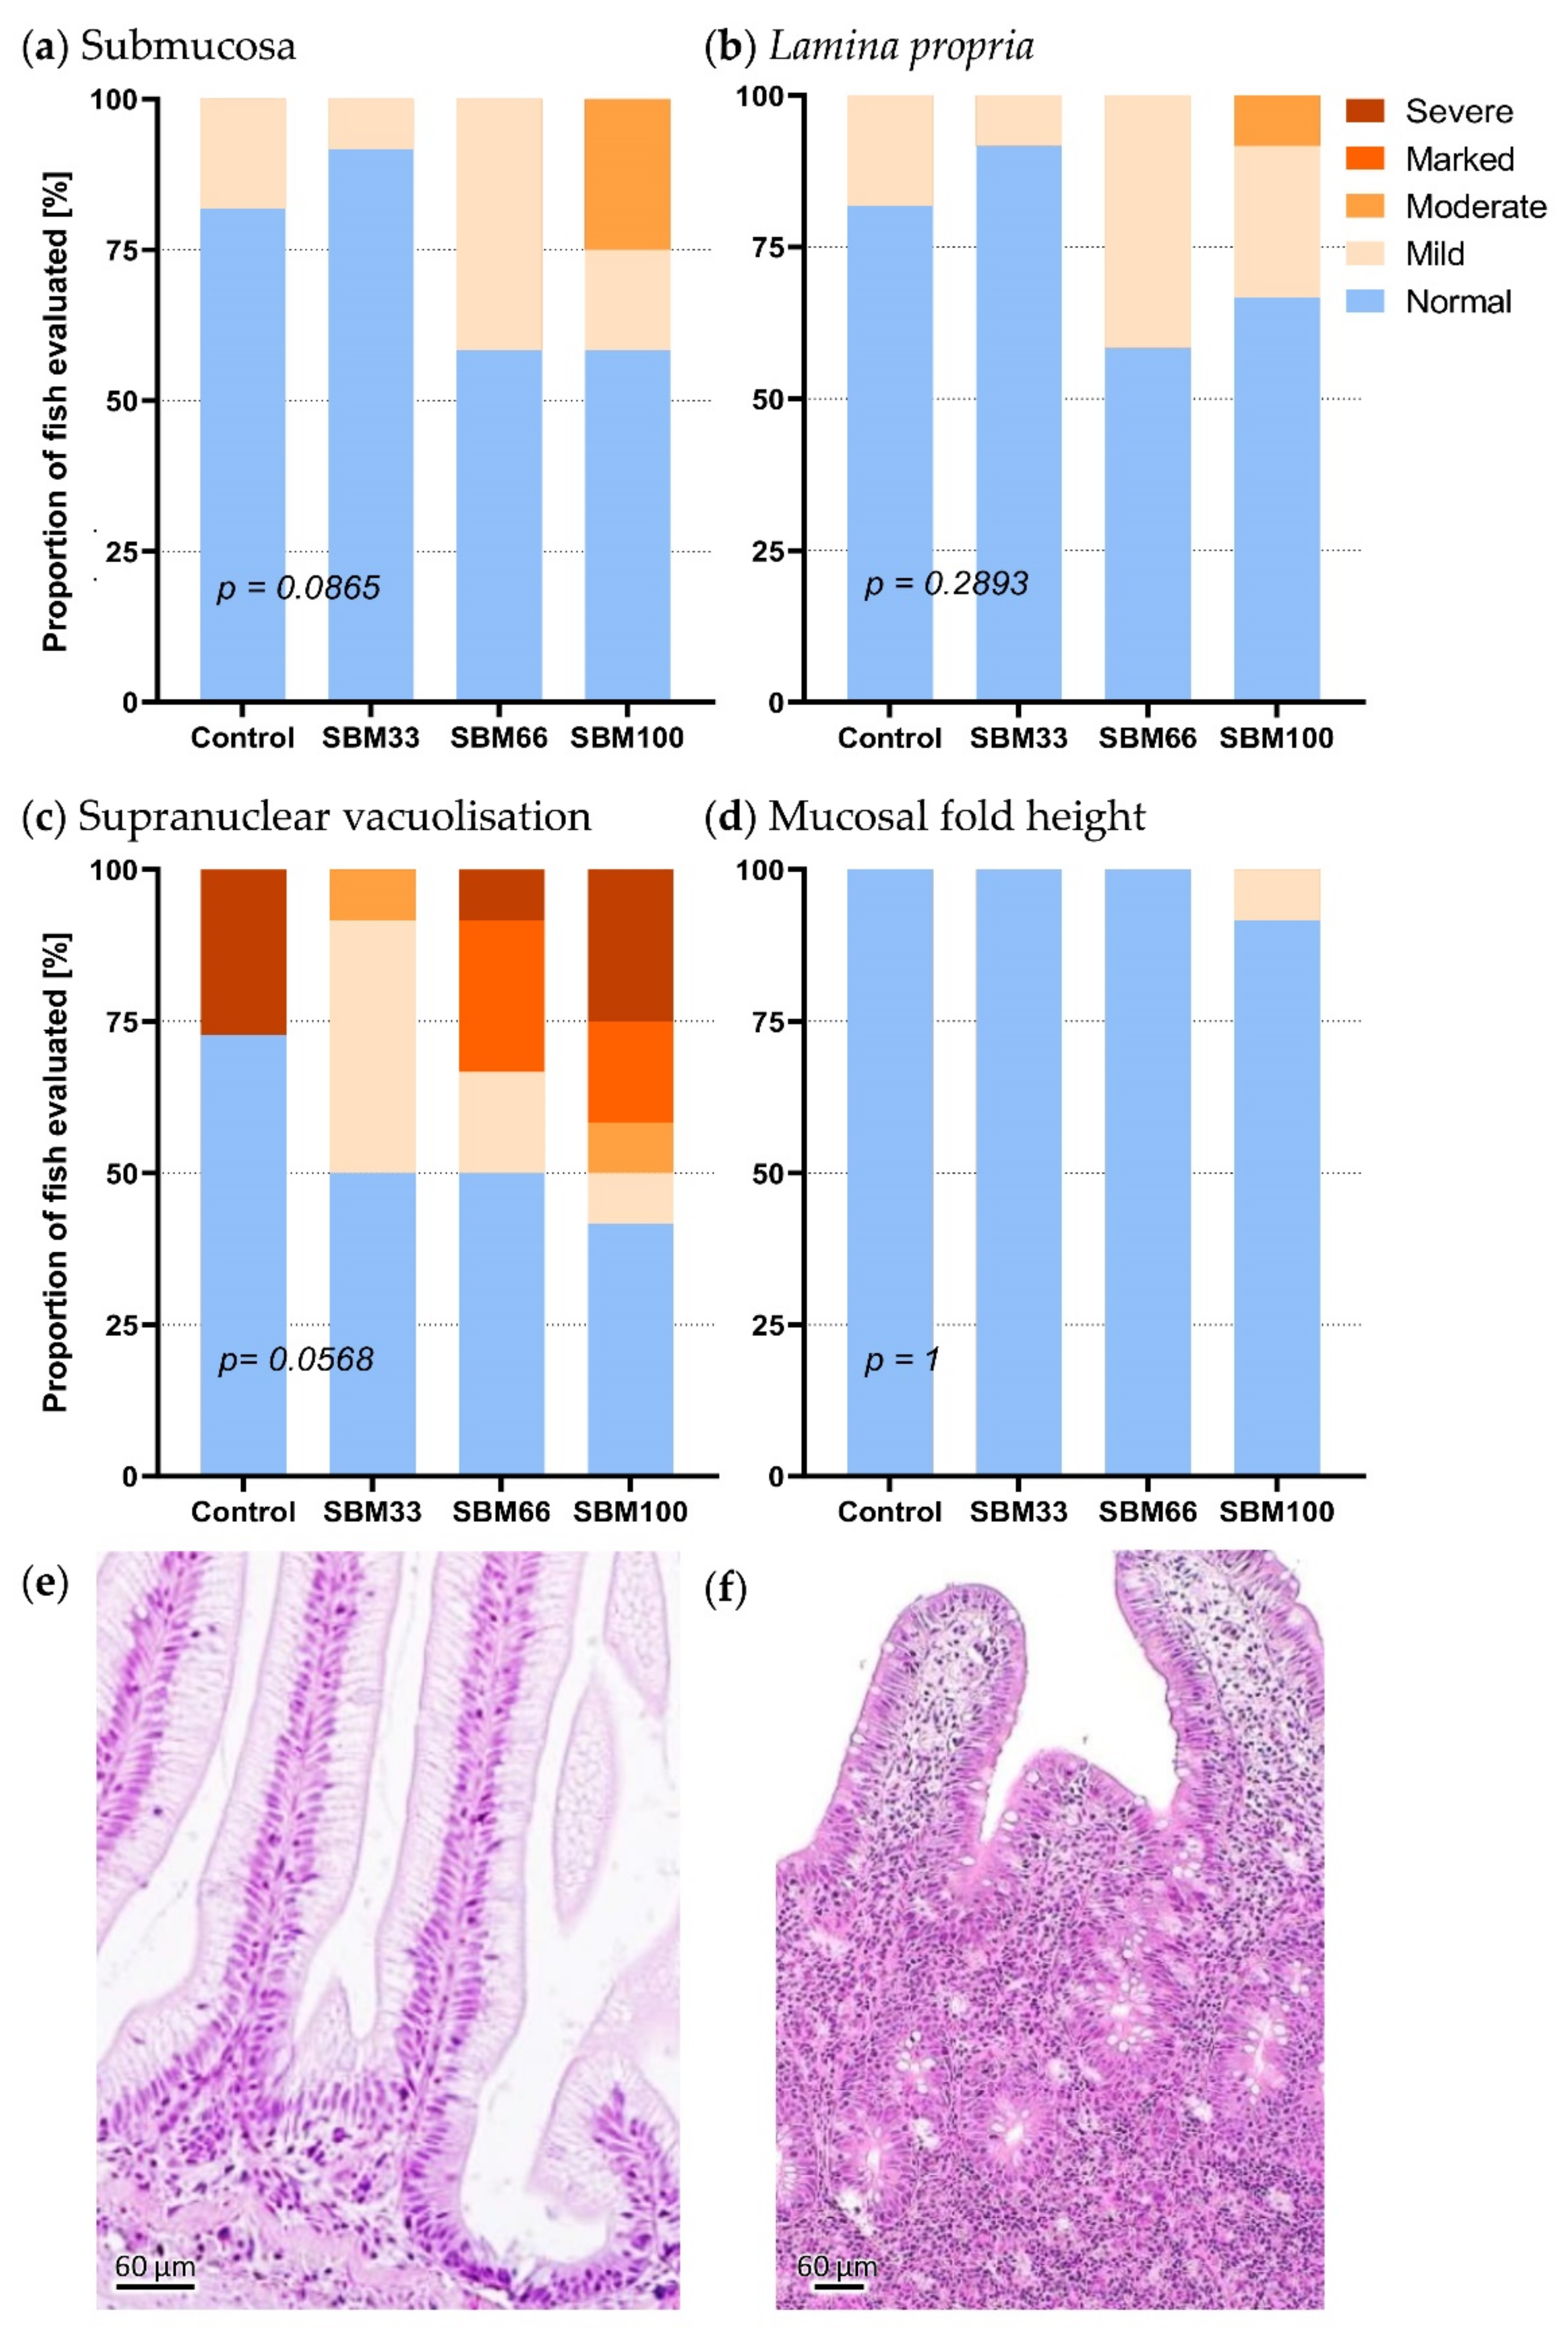
The distal intestinal sections of three rainbow trout per group showed slight to moderate signs of inflammation. All feeding groups contained at least one fish that revealed a slight infiltration of diverse leukocyte subpopulations into the lamina propria and submucosa. The occurrence of inflammation correlated with the proportion of SBM in the diet. Inflammatory changes were most prevalent in the SBM100 group, followed by the SBM66 group (Figure 5). The loss of supranuclear vacuolisation in the enterocytes was more pronounced compared to the infiltration of the submucosa and the lamina propria with inflammatory cells, particularly in the SBM100 group, followed by the SBM66 group. These observations indicated an SBM-induced enteropathy.
The morphological changes in the submucosa (p = 0.087) and the supranuclear vacuolation of enterocytes (p = 0.057) were only slight across the feeding groups (Figure 5). The numbers of melanoma macrophages in the liver and spleen were slightly increased in the SBM100 fish, and the macrophage clusters were proportionally larger than in the other feeding groups and tended to increase towards the end of the experiment.
3.7. Gene Profiling
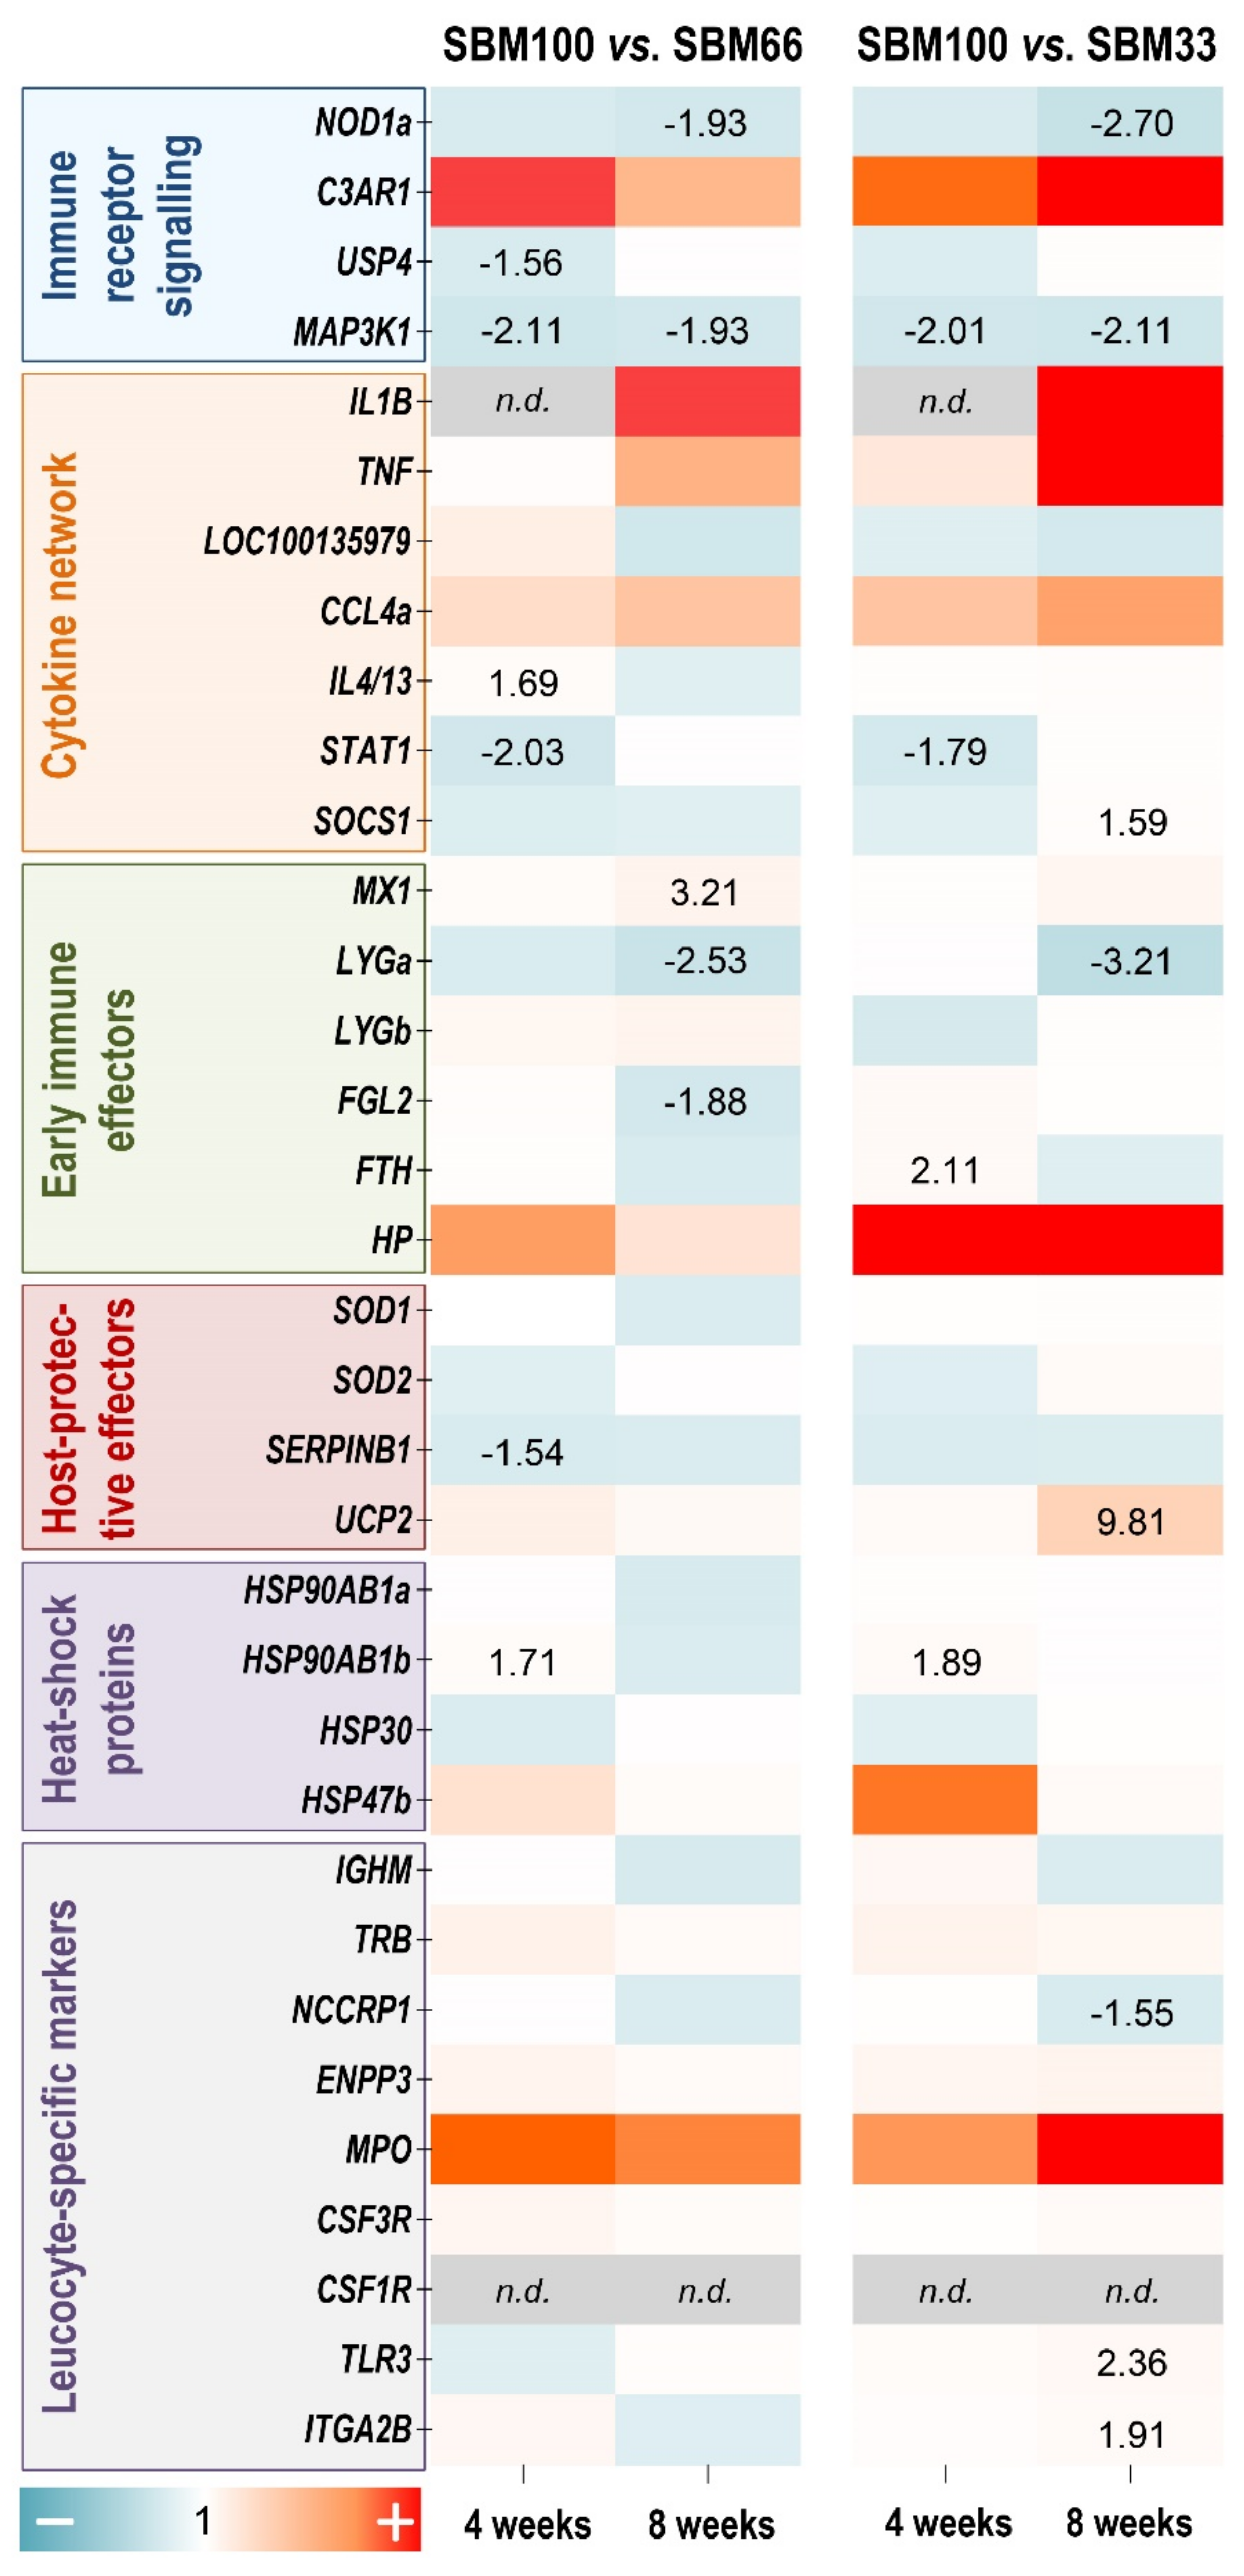
We used a panel of 34 immune-relevant and stress-relevant qPCR assays to profile the transcriptomic response of rainbow trout to the three SBM-supplemented diets. A comparison of the different diet groups revealed differential regulation of distinct genes in the entire panel (with p ≤ 0.05). Since our morphological, histological and physiological analyses had already documented more or less clear phenotypic and histological differences between the SBM100 diet and the other feeding treatments, the gene-expression data presented in Figure 6 are expressed relative to the SBM100 group. MAP3K1 was the only gene among 34 selected genes which showed significant and consistent downregulation (approximately 2-fold; p ≤ 0.04) in the SBM100 group compared to the SBM33 and SBM66 groups after four or eight weeks (Figure 6).
Differential expression of some other genes depended on the duration of the treatment. Four weeks of SBM100 diet downregulated STAT1 levels (≤1.7-fold; p ≤ 0.03), but induced HSP90AB1a (≥1.7-fold; p = 0.01) compared with the SBM33 and SBM66 groups. FTH (2.1-fold; p = 0.02) was upregulated in the SBM100 group compared to SBM33, while IL4/13 was upregulated (1.7-fold; p = 0.03) and SERPINB1 was downregulated (1.5-fold; p = 0.03) in the SBM100 group compared to the SBM66 groups.
Eight weeks of SBM100 diet downregulated NOD1a (<1.9-fold; p = 0.05) compared to the SBM33 and SBM66 groups. UCP2 (9.8-fold; p = 0.05), TLR3 (2.4-fold; p = 0.006), ITGA2B (1.9-fold; p = 0.002) and SOCS1 (1.6-fold; p = 0.05) were upregulated, whereas LYGa (3.2-fold; p = 0.009) and NCCRP1 (1.6-fold; p = 0.05) were downregulated in the SBM100 group compared to the SBM33 group. MX1 was upregulated (3.2-fold; p = 0.05) and FGL2 was downregulated (1.9-fold; p = 0.007) in the SBM100 group compared to the SBM66 groups.
Only a few genes showed higher transcript levels (LYGb, 4.3-fold; ITGA2B, 1.74-fold) or lower transcript levels (CCL4, −1.64-fold) in the SBM33 compared with the SBM66 group after four weeks of feeding. After eight weeks, the levels of six genes were lower (FGL2, −2.1-fold; IL4/13, −2.1-fold; SOD1, −1.8-fold; SOD2, −1.49-fold; STAT1, −1.23-fold; TNF, −7.7-fold) in the SBM33 than in the SBM66 group (data not shown).
4. Discussion
The present study evaluated potential biomarkers associated with the mid-term exposure of rainbow trout to three different concentrations of SBM. In essence, we observed that the increasing substitution of fishmeal with SBM decreased fish growth and feed conversion. This is well in line with previous reports on effects of SBM feeds in salmonid fish [33,37,51]. These earlier studies consistently demonstrated that feed intake and growth parameters are robust measures for assessing the welfare status of trout in challenging long-term trials or under suboptimal husbandry conditions, provided that the disruptive stimulus is sufficiently strong. Other parameters, such as behaviour or colour changes of the skin, can be standardised only to a limited extent and are primarily restricted to fish that are already sick. However, animal welfare goes beyond preventing the fish from suffering from serious diseases and weight loss. Since the German Animal Welfare Act (§ 1 TierSchG) prohibits the causing of pain, suffering, or harm to the fish, this justifies implicitly the need for simply determinable markers that can identify unsuitable husbandry conditions.
Feed supply and food quality are crucial elements of animal husbandry and welfare-monitoring strategies. In the present study, poor performance parameters were found across all the feeding groups sampled. This is probably related to an increased frequency of necessary management measures (such as tank cleaning) that arose due to the less stable structure of the feed pellets containing a high SBM content. Another factor was feed-induced enteritis, manifested phenotypically by an inflammatory reaction in the posterior section of the intestine and diarrhoea in some trout, as also described in other studies [40,52]. These inflammatory changes were associated with supranuclear vacuolation, but this morphological feature is likely not limited to inflammation. The destruction of the intestinal epithelium weakens the absorption of nutrients and massively disturbs the osmotic balance of the body. Consequently, enteritis can ultimately result in the death of the fish [40,53].
Our search for indicative parameters for SBM-induced enteritis at the molecular level turned out to be more challenging than expected. The histopathological analysis suggested that molecular markers were likely to be encountered in the intestine, as supported by recent studies in various fish species [40,54,55]. However, as these investigations require the killing and dissection of the animals, we first screened for potential markers that could be detected in small blood volumes taken non-lethally from farmed fish [56]. The haematocrit values and the levels of plasma cortisol and circulating lymphocytes in the blood of trout were elevated after the application of feed with high SBM dosages. Notably, these alterations were subject to strong individual variations, which presumably reflected social stress and the diverging growth of the fish. Strikingly, the increased haematocrit depended significantly on the bodyweight of individual trout. Thus, the tested parameters do not seem suitable as indicators of diet-related pathological effects.
The quantification of transcripts generally allows the screening of a large number of parameters involved in a variety of relevant functional pathways [56]. The gene-expression profiles obtained in the present study suggested that the addition of a small SBM proportion to the feed ration had a slightly positive effect on the immune system, whereas higher SBM proportions had an immunosuppressive effect in rainbow trout. Our data identify several genes that may be of interest for monitoring, but the observed modulations of their expressions were not consistent either across individuals within the feeding groups (mainly C3AR1, HP, IL1B, MPO, TNF) or across time points (HSP90AB1b, LYGa, NOD1a, STAT1) and/or diets (mainly FTH, MX1, UCP2). Only the levels of MAP3K1 were consistently reduced in trout receiving feed that contained only SBM in place of fish meal. The MAP3K1 gene encodes the “mitogen-activated kinase kinase kinase 1” (also known as MEKK1), which acts as an upstream activator of early transcription factors, such as NF-κB [57] or Jun [58]. The MAPK signalling pathways have previously been suggested to mediate the physiological effects of unbalanced dietary effects in fish [41,59,60,61].
Only a few studies have reported the involvement of STAT1 in fish after feeding with particular diets [62,63]. In the present study, STAT1 (coding for the transcription factor “signal transducer and activator of transcription 1”) was downregulated after four weeks of feeding with a fully substituted fish meal. At the same time point, HSP90AB1b (coding for a variant of “heat-shock protein 90”) was upregulated in the same feeding group, which may reflect a cellular stress response to the challenging diet [64]. After eight weeks of feeding with fully substituted fish meal, trout had reduced levels of NOD1a and LYGa (coding for variants of “nucleotide-binding oligomerisation domain containing protein 1” and “lysozyme g”, respectively) suggesting a constrained bacteriolytic capacity [65,66]. Apart from UCP2 (coding for “uncoupling protein 2”), no other analysed transcript level was strongly modulated in response to the SBM diets. A major bias was probably to expect pronounced systemic effects from a basically local (intestinal) response to certain feed additives. Given the few detected expression changes in the blood cells, we speculate that the systemic effects of trout fed with SBM-containing feed are mild according to the diets and time periods analysed in the present study.
5. Conclusions
The present study documented that a complete exchange of fishmeal with SBM in the rainbow trout diet reduced the specific growth rates and elevated the food conversion ratio. On the cellular level, these changes were reflected in slightly rising numbers of circulating thrombocytes and melanoma macrophages in the liver and spleen and inflammatory cells in the intestinal submucosa and lamina propria. At the molecular level, the transcript levels of several genes (including HSP90AB1b, FTH, LYGa, MAP3K1, MX1, NOD1a, STAT1 and UCP2) were significantly altered in circulating blood cells compared with the levels in blood from individuals fed lower amounts of SBM. The gene expression profiling findings demonstrate that a blood sample may provide useful information about the inadequate nutrition of fish. The results also provide a basis for improved, minimally invasive monitoring of feeding regimens in trout farming and may stimulate the development of practical detection devices for Aquaculture 4.0 [67,68] in the future.
Supplementary Materials
The following are available online at https://0-www-mdpi-com.brum.beds.ac.uk/article/10.3390/fishes7010022/s1, Table S1: Primers used in this study.
Author Contributions
Conceptualisation, H.S., C.S.; methodology, H.S., A.R. and E.C.; investigation, H.S., A.R. and E.C.; writing, H.S. and A.R.; supervision, C.S.; project administration, H.S. and C.S.; funding acquisition, H.S. and C.S. All authors have read and agreed to the published version of the manuscript.
Funding
This research was funded by the Federal Office for Agriculture and Food, grant number FKZ 2813NA002. The publication of this article was funded by the Open Access Fund of the FBN.
Institutional Review Board Statement
All animal handling procedures were approved by the animal welfare officer of the “Gesellschaft für Marine Aquakultur mbH” and the local authority of Schleswig-Holstein (MELUND), according to relevant institutional and national guidelines for care and use of laboratory animals (German animal welfare law; TierSchG and Regulation for the Protection of Animals Used for Experimental and Other Scientific Purposes; TierSchVersV as the national implementation of the Directive 2010/63/EU). The ethically (and legally) required replacement, reduction and refinement of animal experiments was taken into account in the experimental design and execution. Although the animals were fed a diet appropriate to their needs, the burden of the SBM100 group was classified as a medium challenge. Death, as the greatest possible harm, was considered. The authors and the official animal welfare authority nevertheless consider it essential to carry out this basic research.
Data Availability Statement
The data for this study were all collected at the Gesellschaft für Marine Aquakultur in Büsum.
Acknowledgments
Ingrid Hennings and Brigitte Schöpel (FBN) are greatly acknowledged for their excellent technical assistance.
Conflicts of Interest
The authors declare no conflict of interest.
References
- Farstad, W. Ethics in animal breeding. Reprod. Domest. Anim. 2018, 53, 4–13. [Google Scholar] [CrossRef]
- Bergleiter, S.; Berner, N.; Censkowsky, U.; Julià-Camprodon, G. Naturland e.V. and Organic Services GmbH Organic Aquaculture 2009 Production and Markets. 2009. Available online: www.naturland.de (accessed on 4 January 2022).
- Tschirren, L.; Bachmann, D.; Güler, A.C.; Blaser, O.; Rhyner, N.; Seitz, A.; Zbinden, E.; Wahli, T.; Segner, H.; Refardt, D. MyFishCheck: A Model to Assess Fish Welfare in Aquaculture. Animals 2021, 11, 145. [Google Scholar] [CrossRef]
- Hvas, M.; Folkedal, O.; Oppedal, F. Fish welfare in offshore salmon aquaculture. Rev. Aquac. 2021, 13, 836–852. [Google Scholar] [CrossRef]
- Rabadan, C.G.; Spreadbury, C.; Consuegra, S.; de Leaniz, C.G. Development, validation and testing of an Operational Welfare Score Index for farmed lumpfish Cyclopterus lumpus L. Aquaculture 2021, 531, 735777. [Google Scholar] [CrossRef]
- Stien, L.H.; Bracke, M.B.M.; Folkedal, O.; Nilsson, J.; Oppedal, F.; Torgersen, T.; Kittilsen, S.; Midtlyng, P.J.; Vindas, M.A.; Øverli, Ø.; et al. Salmon Welfare Index Model (SWIM 1.0): A semantic model for overall welfare assessment of caged Atlantic salmon: Review of the selected welfare indicators and model presentation. Rev. Aquac. 2013, 5, 33–57. [Google Scholar] [CrossRef]
- Ings, J.S.; Oakes, K.D.; Vijayan, M.M.; Servos, M.R. Temporal changes in stress and tissue-specific metabolic responses to municipal wastewater effluent exposure in rainbow trout. Comp. Biochem. Physiol. Part C Toxicol. Pharmacol. 2012, 156, 67–74. [Google Scholar] [CrossRef] [PubMed]
- Rebl, A.; Verleih, M.; Nipkow, M.; Altmann, S.; Bochert, R.; Goldammer, T. Gradual and Acute Temperature Rise Induces Crossing Endocrine, Metabolic, and Immunological Pathways in Maraena Whitefish (Coregonus maraena). Front. Genet. 2018, 9, 241. [Google Scholar] [CrossRef] [PubMed]
- Quinn, N.L.; McGowan, C.R.; Cooper, G.A.; Koop, B.F.; Davidson, W.S. Ribosomal genes and heat shock proteins as putative markers for chronic, sublethal heat stress in Arctic charr: Applications for aquaculture and wild fish. Physiol. Genom. 2011, 43, 1056–1064. [Google Scholar] [CrossRef] [PubMed] [Green Version]
- Bernier, N.J.; Craig, P.M. CRF-related peptides contribute to stress response and regulation of appetite in hypoxic rainbow trout. Am. J. Physiol. Integr. Comp. Physiol. 2005, 289, R982–R990. [Google Scholar] [CrossRef]
- Delaney, M.A.; Klesius, P.H. Hypoxic conditions induce Hsp70 production in blood, brain and head kidney of juvenile Nile tilapia Oreochromis niloticus (L.). Aquaculture 2004, 236, 633–644. [Google Scholar] [CrossRef]
- Caipang, C.M.; Berg, I.; Brinchmann, M.F.; Kiron, V. Short-term crowding stress in Atlantic cod, Gadus morhua L. modulates the humoral immune response. Aquaculture 2009, 295, 110–115. [Google Scholar] [CrossRef]
- Yarahmadi, P.; Miandare, H.K.; Hoseinifar, S.H.; Gheysvandi, N.; Akbarzadeh, A. The effects of stocking density on hemato-immunological and serum biochemical parameters of rainbow trout (Oncorhynchus mykiss). Aquac. Int. 2014, 23, 55–63. [Google Scholar] [CrossRef]
- Korytář, T.; Nipkow, M.; Altmann, S.; Goldammer, T.; Köllner, B.; Rebl, A. Adverse Husbandry of Maraena Whitefish Directs the Immune System to Increase Mobilization of Myeloid Cells and Proinflammatory Responses. Front. Immunol. 2016, 7, 631. [Google Scholar] [CrossRef] [PubMed] [Green Version]
- Ebrahimi, G. Effects of Rearing Tank Background Color on Growth Performance in Juvenile Common Carp, Cyprinus carpio L. Agric. J. 2011, 6, 213–217. [Google Scholar] [CrossRef] [Green Version]
- Lopez, P.A.; Díaz-Gil, C.; Saraiva, J.; Moranta, D.; Castanheira, M.; Nuñez-Velázquez, S.; Ledesma-Corvi, S.; Mora-Ruiz, M.; Grau, A. Effects of structural environmental enrichment on welfare of juvenile seabream (Sparus aurata). Aquac. Rep. 2019, 15, 100224. [Google Scholar] [CrossRef]
- Benhaïm, D.; Bégout, M.-L.; Péan, S.; Manca, M.; Prunet, P.; Chatain, B. Impact of a plant-based diet on behavioural and physiological traits in sea bass (Dicentrarchus labrax). Aquat. Living Resour. 2013, 26, 121–131. [Google Scholar] [CrossRef] [Green Version]
- Mullally, M.; Mimeault, C.; Rojas, M.O.; Vindas, P.S.; Garcia, M.; Alvarez, L.P.; Moon, T.W.; Gilmour, K.M.; Trudeau, V.L.; Arnason, J.T. A botanical extract of Souroubea sympetala and its active principle, betulinic acid, attenuate the cortisol response to a stressor in rainbow trout, Oncorhynchus mykiss. Aquaculture 2017, 468, 26–31. [Google Scholar] [CrossRef]
- Oxley, A.; Jolly, C.; Eide, T.; Jordal, A.-E.O.; Svardal, A.; Olsen, R.-E. The combined impact of plant-derived dietary ingredients and acute stress on the intestinal arachidonic acid cascade in Atlantic salmon (Salmo salar). Br. J. Nutr. 2010, 103, 851–861. [Google Scholar] [CrossRef] [Green Version]
- Olsen, R.L.; Hasan, M.R. A limited supply of fishmeal: Impact on future increases in global aquaculture production. Trends Food Sci. Technol. 2012, 27, 120–128. [Google Scholar] [CrossRef]
- Barnes, M.E.; Brown, M.L.; Bruce, T.; Sindelar, S.; Neiger, R. Rainbow Trout Rearing Performance, Intestinal Morphology, and Immune Response after Long-term Feeding of High Levels of Fermented Soybean Meal. N. Am. J. Aquac. 2014, 76, 333–345. [Google Scholar] [CrossRef]
- Oliva-Teles, A.; Gouveia, A.; Gomes, E.; Rema, P. The effect of different processing treatments on soybean meal utilization by rainbow trout, Oncorhynchus mykiss. Aquaculture 1994, 124, 343–349. [Google Scholar] [CrossRef]
- Voorhees, J.M.; Barnes, M.E.; Chipps, S.R.; Brown, M.L. Effects of Exercise and Bioprocessed Soybean Meal Diets during Rainbow Trout Rearing. Open Biol. J. 2019, 7, 1–13. [Google Scholar] [CrossRef]
- Bruni, L.; Secci, G.; Husein, Y.; Faccenda, F.; de Medeiros, A.C.L.; Parisi, G. Is it possible to cut down fishmeal and soybean meal use in aquafeed limiting the negative effects on rainbow trout (Oncorhynchus mykiss) fillet quality and consumer acceptance? Aquaculture 2021, 543, 736996. [Google Scholar] [CrossRef]
- Rumsey, G.L.; Siwicki, A.K.; Anderson, D.P.; Bowser, P.R. Effect of soybean protein on serological response, non-specific defense mechanisms, growth, and protein utilization in rainbow trout. Vet.-Immunol. Immunopathol. 1994, 41, 323–339. [Google Scholar] [CrossRef]
- Van den Ingh, T.S.G.A.M.; Krogdahl, Å.; Olli, J.J.; Hendriks, H.G.C.J.M.; Koninkx, J.G.J.F. Effects of soybean-containing diets on the proximal and distal intestine in Atlantic salmon (Salmo salar): A morphological study. Aquaculture 1991, 94, 297–305. [Google Scholar] [CrossRef]
- Francis, G.; Makkar, H.P.S.; Becker, K. Antinutritional factors present in plant-derived alternate fish feed ingredients and their effects in fish. Aquaculture 2001, 199, 197–227. [Google Scholar] [CrossRef]
- Krogdahl, A.; Lea, T.B.; Olli, J.J. Soybean proteinase inhibitors affect intestinal trypsin activities and amino acid digestibilities in rainbow trout (Oncorhynchus mykiss). Comp. Biochem. Physiol. Part A Physiol. 1994, 107, 215–219. [Google Scholar] [CrossRef]
- Krogdahl, A.; Penn, M.; Thorsen, J.; Refstie, S.; Bakke, A.M. Important antinutrients in plant feedstuffs for aquaculture: An update on recent findings regarding responses in salmonids. Aquac. Res. 2010, 41, 333–344. [Google Scholar] [CrossRef]
- Liener, I.E. Implications of antinutritional components in soybean foods. Crit. Rev. Food Sci. Nutr. 1994, 34, 31–67. [Google Scholar] [CrossRef]
- Baeverfjord, G.; Krogdahl, A. Development and regression of soybean meal induced enteritis in Atlantic salmon, Salmo salar L., distal intestine: A comparison with the intestines of fasted fish. J. Fish Dis. 1996, 19, 375–387. [Google Scholar] [CrossRef]
- Chikwati, E.M.; Venold, F.F.; Penn, M.H.; Rohloff, J.; Refstie, S.; Guttvik, A.; Hillestad, M.; Krogdahl, A. Interaction of soyasaponins with plant ingredients in diets for Atlantic salmon, Salmo salar L. Br. J. Nutr. 2012, 107, 1570–1590. [Google Scholar] [CrossRef] [Green Version]
- Knudsen, D.; Jutfelt, F.; Sundh, H.; Sundell, K.; Koppe, W.; Frøkiær, H. Dietary soya saponins increase gut permeability and play a key role in the onset of soyabean-induced enteritis in Atlantic salmon (Salmo salar L.). Br. J. Nutr. 2008, 100, 120–129. [Google Scholar] [CrossRef] [Green Version]
- Merrifield, D.L.; Olsen, R.E.; Myklebust, R.; Ringø, E.; El-Shemy, H. Dietary Effect of Soybean (Glycine max) Products on Gut Histology and Microbiota of Fish. Soybean Nutr. 2011, 231–250. [Google Scholar] [CrossRef] [Green Version]
- Booman, M.; Forster, I.; Vederas, J.C.; Groman, D.B.; Jones, S.R. Soybean meal-induced enteritis in Atlantic salmon (Salmo salar) and Chinook salmon (Oncorhynchus tshawytscha) but not in pink salmon (O. gorbuscha). Aquaculture 2018, 483, 238–243. [Google Scholar] [CrossRef]
- Buttle, L.; Burrells, A.; Good, J.; Williams, P.; Southgate, P. The binding of soybean agglutinin (SBA) to the intestinal epithelium of Atlantic salmon, Salmo salar and Rainbow trout, Oncorhynchus mykiss, fed high levels of soybean meal. Vet.-Immunol. Immunopathol. 2001, 80, 237–244. [Google Scholar] [CrossRef]
- Zhang, J.-X.; Guo, L.-Y.; Feng, L.; Jiang, W.-D.; Kuang, S.-Y.; Liu, Y.; Hu, K.; Jiang, J.; Li, S.-H.; Tang, L.; et al. Soybean β-Conglycinin Induces Inflammation and Oxidation and Causes Dysfunction of Intestinal Digestion and Absorption in Fish. PLoS ONE 2013, 8, e58115. [Google Scholar] [CrossRef] [Green Version]
- Miao, S.; Zhao, C.; Zhu, J.; Hu, J.; Dong, X.; Sun, L. Dietary soybean meal affects intestinal homoeostasis by altering the microbiota, morphology and inflammatory cytokine gene expression in northern snakehead. Sci. Rep. 2018, 8, 113. [Google Scholar] [CrossRef] [Green Version]
- Wang, Y.-R.; Wang, L.; Zhang, C.-X.; Song, K. Effects of substituting fishmeal with soybean meal on growth performance and intestinal morphology in orange-spotted grouper (Epinephelus coioides). Aquac. Rep. 2017, 5, 52–57. [Google Scholar] [CrossRef]
- Blaufuss, P.C.; Gaylord, G.; Sealey, W.M.; Powell, M.S. Effects of high-soy diet on S100 gene expression in liver and intestine of rainbow trout (Oncorhynchus mykiss). Fish Shellfish Immunol. 2019, 86, 764–771. [Google Scholar] [CrossRef]
- Holen, E.; Winterthun, S.; Du, Z.-Y.; Krøvel, A. Inhibition of p38 MAPK during cellular activation modulate gene expression of head kidney leukocytes isolated from Atlantic salmon (Salmo salar) fed soy bean oil or fish oil based diets. Fish Shellfish Immunol. 2011, 30, 397–405. [Google Scholar] [CrossRef]
- NRC (National Research Council). Nutrient Requirements of Fish and Shrimp; Natlional Academic Press: Washington, DC, USA, 2011. [CrossRef]
- Rebl, A.; Anders, E.; Wimmers, K.; Goldammer, T. Characterization of Dehydrodolichyl diphosphate synthase gene in rainbow trout (Oncorhynchus mykiss). Comp. Biochem. Physiol. Part B Biochem. Mol. Biol. 2009, 152, 260–265. [Google Scholar] [CrossRef]
- Bowers, R.M.; Lapatra, S.E.; Dhar, A.K. Detection and quantitation of infectious pancreatic necrosis virus by real-time reverse transcriptase-polymerase chain reaction using lethal and non-lethal tissue sampling. J. Virol. Methods 2008, 147, 226–234. [Google Scholar] [CrossRef] [PubMed]
- Rebl, A.; Rebl, H.; Korytář, T.; Goldammer, T.; Seyfert, H.-M. The proximal promoter of a novel interleukin-8-encoding gene in rainbow trout (Oncorhynchus mykiss) is strongly induced by CEBPA, but not NF-κB p65. Dev. Comp. Immunol. 2014, 46, 155–164. [Google Scholar] [CrossRef] [PubMed]
- Kortner, T.M.; Valen, E.C.; Kortner, H.; Marjara, I.S.; Krogdahl, A.; Bakke, A.M. Candidate reference genes for quantitative real-time PCR (qPCR) assays during development of a diet-related enteropathy in Atlantic salmon (Salmo salar L.) and the potential pitfalls of uncritical use of normalization software tools. Aquaculture 2011, 318, 355–363. [Google Scholar] [CrossRef]
- Andersen, C.L.; Jensen, J.L.; Ørntoft, T.F. Normalization of Real-Time Quantitative Reverse Transcription-PCR Data: A Model-Based Variance Estimation Approach to Identify Genes Suited for Normalization, Applied to Bladder and Colon Cancer Data Sets. Cancer Res. 2004, 64, 5245–5250. [Google Scholar] [CrossRef] [PubMed] [Green Version]
- Bustin, S.A.; Benes, V.; Garson, J.A.; Hellemans, J.; Huggett, J.; Kubista, M.; Mueller, R.; Nolan, T.; Pfaffl, M.W.; Shipley, G.L.; et al. The MIQE Guidelines: Minimum Information for Publication of Quantitative Real-Time PCR Experiments. Clin. Chem. 2009, 55, 611–622. [Google Scholar] [CrossRef] [Green Version]
- Vandesompele, J.; De Preter, K.; Pattyn, F.; Poppe, B.; Van Roy, N.; De Paepe, A.; Speleman, F. Accurate normalization of real-time quantitative RT-PCR data by geometric averaging of multiple internal control genes. Genome Biol. 2002, 3, research0034.1. [Google Scholar] [CrossRef] [Green Version]
- Livak, K.J.; Schmittgen, T.D. Analysis of Relative Gene Expression Data Using Real-Time Quantitative PCR and the 2−ΔΔCT Method. Methods 2001, 25, 402–408. [Google Scholar] [CrossRef]
- Green, T.; Smullen, R.; Barnes, A. Dietary soybean protein concentrate-induced intestinal disorder in marine farmed Atlantic salmon, Salmo salar is associated with alterations in gut microbiota. Vet. Microbiol. 2013, 166, 286–292. [Google Scholar] [CrossRef]
- Krogdahl, A.; Bakke-McKellep, A.M.; Roed, K.H.; Baeverfjord, G. Feeding Atlantic salmon Salmo salar L. soybean products: Effects on disease resistance (furunculosis), and lysozyme and IgM levels in the intestinal mucosa. Aquac. Nutr. 2000, 6, 77–84. [Google Scholar] [CrossRef] [Green Version]
- Heikkinen, J.; Vielma, J.; Kemiläinen, O.; Tiirola, M.; Eskelinen, P.; Kiuru, T.; Navia-Paldanius, D.; von Wright, A. Effects of soybean meal based diet on growth performance, gut histopathology and intestinal microbiota of juvenile rainbow trout (Oncorhynchus mykiss). Aquaculture 2006, 261, 259–268. [Google Scholar] [CrossRef]
- Kemski, M.M.; Rappleye, C.A.; Dabrowski, K.; Bruno, R.S.; Wick, M. Transcriptomic response to soybean meal-based diets as the first formulated feed in juvenile yellow perch (Perca flavescens). Sci. Rep. 2020, 10, 3998. [Google Scholar] [CrossRef] [Green Version]
- Valenzuela, L.; Pacheco, S.; Rincón, G.; Pavez, L.; Lam, N.; Hernández, A.; Dantagnan, P.; González, F.; Jilberto, F.; Ravanal, M.; et al. Intestinal Transcriptome Analysis Reveals Enrichment of Genes Associated with Immune and Lipid Mechanisms, Favoring Soybean Meal Tolerance in High-Growth Zebrafish (Danio Rerio). Genes 2021, 12, 700. [Google Scholar] [CrossRef] [PubMed]
- Seibel, H.; Baßmann, B.; Rebl, A. Blood Will Tell: What Hematological Analyses Can Reveal About Fish Welfare. Front. Veter. Sci. 2021, 8, 194. [Google Scholar] [CrossRef]
- Hirano, M.; Osada, S.-I.; Aoki, T.; Hirai, S.-I.; Hosaka, M.; Inoue, J.-I.; Ohno, S. MEK Kinase Is Involved in Tumor Necrosis Factor α-Induced NF-κB Activation and Degradation of IκB-α. J. Biol. Chem. 1996, 271, 13234–13238. [Google Scholar] [CrossRef] [PubMed] [Green Version]
- Yan, M.; Dai, T.; Deak, J.C.; Kyriakis, J.M.; Zon, L.I.; Woodgett, J.; Templeton, D.J. Activation of stress-activated protein kinase by MEKK1 phosphorylation of its activator SEK1. Nature 1994, 372, 798–800. [Google Scholar] [CrossRef] [PubMed]
- Li, X.; Cui, K.; Fang, W.; Chen, Q.; Xu, D.; Mai, K.; Zhang, Y.; Ai, Q. High level of dietary olive oil decreased growth, increased liver lipid deposition and induced inflammation by activating the p38 MAPK and JNK pathways in large yellow croaker (Larimichthys crocea). Fish Shellfish Immunol. 2019, 94, 157–165. [Google Scholar] [CrossRef] [PubMed]
- Wu, P.; Jiang, W.-D.; Jiang, J.; Zhao, J.; Liu, Y.; Zhang, Y.-A.; Zhou, X.-Q.; Feng, L. Dietary choline deficiency and excess induced intestinal inflammation and alteration of intestinal tight junction protein transcription potentially by modulating NF-κB, STAT and p38 MAPK signaling molecules in juvenile Jian carp. Fish Shellfish Immunol. 2016, 58, 462–473. [Google Scholar] [CrossRef] [PubMed] [Green Version]
- Zhang, L.; Feng, L.; Jiang, W.-D.; Liu, Y.; Wu, P.; Kuang, S.-Y.; Tang, L.; Tang, W.-N.; Zhang, Y.-A.; Zhou, X.-Q. Vitamin A deficiency suppresses fish immune function with differences in different intestinal segments: The role of transcriptional factor NF-κB and p38 mitogen-activated protein kinase signalling pathways. Br. J. Nutr. 2017, 117, 67–82. [Google Scholar] [CrossRef] [Green Version]
- Booman, M.; Xu, Q.; Rise, M.L. Evaluation of the impact of camelina oil-containing diets on the expression of genes involved in the innate anti-viral immune response in Atlantic cod (Gadus morhua). Fish Shellfish Immunol. 2014, 41, 52–63. [Google Scholar] [CrossRef]
- Zheng, D.; Kille, P.; Feeney, G.P.; Cunningham, P.; Handy, R.D.; Hogstrand, C. Dynamic transcriptomic profiles of zebrafish gills in response to zinc supplementation. BMC Genom. 2010, 11, 553. [Google Scholar] [CrossRef] [PubMed] [Green Version]
- Craig, E.A.; Gambill, B.D.; Nelson, R.J. Heat shock proteins: Molecular chaperones of protein biogenesis. Microbiol. Rev. 1993, 57, 402–414. [Google Scholar] [CrossRef]
- Dash, S.; Das, S.; Samal, J.; Thatoi, H.N. Epidermal mucus, a major determinant in fish health: A review. Iran. J. Vet. Res. 2018, 19, 72–81. [Google Scholar] [CrossRef] [PubMed]
- Keestra-Gounder, A.M.; Tsolis, R.M. NOD1 and NOD2: Beyond Peptidoglycan Sensing. Trends Immunol. 2017, 38, 758–767. [Google Scholar] [CrossRef] [PubMed]
- Dupont, C.; Cousin, P.; Dupont, S. IoT for Aquaculture 4.0 Smart and easy-to-deploy real-time water monitoring with IoT. In Proceedings of the 2018 Global Internet of Things Summit, Bilbao, Spain, 4–7 June 2018; pp. 1–5. [Google Scholar] [CrossRef]
- Antonucci, F.; Costa, C. Precision aquaculture: A short review on engineering innovations. Aquac. Int. 2020, 28, 41–57. [Google Scholar] [CrossRef]
Figure 1.
Mean values of (a) the specific growth rate SGR (%*d−1, r = 0.69; p = 0.013) and (b) feed conversion ratio FCR (r = 0.669, p = 0.017) for the feeding groups at three different sampling times. Letters (a, b) indicate significant differences between groups (p ≤ 0.05). SBM0 = control, SBM33, SMB66, SBM100 = feeding groups with substitution of fish meal for soybean meal at 33%, 66% or 100%.

Figure 2.
Correlation between weight [g] and haematocrit [%] across all sampling times; r = 0.697, p = 0.000.
Figure 2.
Correlation between weight [g] and haematocrit [%] across all sampling times; r = 0.697, p = 0.000.

Figure 3.
Cellular blood composition of rainbow trout fed different levels of soybean meal (SBM). The percentage distribution of white blood cells and platelets is shown for trout in each feeding group (SBM0, SBM33, SBM66 and SBM100) at the start of the trial (start; n = 3) and after 4 weeks (n = 9) and after 8 weeks (n = 9) of the SBM diets.

Figure 4.
Cortisol concentration (ng/mL) of rainbow trout across the time points analysed. Boxes represent the interquartile range (IQR), lower end = 25th percentile, upper end = 75th percentile, solid line = median, whiskers = 1.5 × IQR. SBM0 = control, SBM33–SBM100 = Soybean meal feeding groups with the exchange of fish meal to 33%, 66% or 100%.

Figure 5.
Histological assessment of the intestinal sections from the fish in the feeding trial. The graphs show the number of intestinal sections (n = 6) that were assessed as “normal”, “mild”, “moderate”, “marked” and “severe”. The following morphological characteristics were examined: (a) increase in width and inflammatory cell infiltration into the submucosa, (b) increase in width and inflammatory cell infiltration into the lamina propria, (c) reduction in supranuclear vacuolisation in enterocytes and (d) height of mucosal villi. Histological images represent (e) a normal healthy gut and (f) a gut with severe inflammation characterised by widening and infiltration of the submucosa and lamina propria by inflammatory cells and loss of vacuolisation on the enterocytes. The scale bar represents 60 μm.

Figure 6.
A heatmap illustrating the averaged fold-change values (coloured according to the scale below) of the mRNA concentrations measured in the SBM100 soybean-meal feeding group relative to the SBM66 and the SBM33 groups (both set at 1.0) at the time points indicated. The quantified transcripts are listed as gene symbols on the left and categorised according to their affiliation to immune-related and stress-related processes. Transcripts that were undetectable are marked grey in the appropriate fields. Only significant copy-number changes (p ≤ 0.05) are given.


Table 1.
Ingredients and composition of foodstuff used in the feeding experiment.
| Diet Composition | SBM0 | SBM33 | SBM66 | SBM100 |
|---|---|---|---|---|
| Fish meal 1 | 50.00 | 33.50 | 17.00 | 0.00 |
| Blood meal 3 | 5.00 | 5.00 | 5.00 | 5.00 |
| Gelatine 4 | 3.00 | 3.00 | 3.00 | 3.00 |
| Soybean meal 2 | 0.00 | 16.40 | 33.00 | 50.00 |
| Pea protein isolate 5 | 6.50 | 6.50 | 6.50 | 6.50 |
| Wheat gluten 6 | 7.00 | 10.59 | 14.05 | 17.25 |
| Wheat starch 7 | 19.50 | 15.00 | 10.55 | 5.50 |
| Fish oil 8 | 8.00 | 8.55 | 9.05 | 10.03 |
| Vitamins/Minerals 9 | 0.50 | 0.50 | 0.50 | 0.50 |
| Kaolin 10 | 0.00 | 0.47 | 0.85 | 1.22 |
| Calcium hydrogen phosphate 11 | 0.5 | 0.5 | 0.5 | 0.5 |
| Biolys 12 | 0.00 | 0.00 | 0.00 | 0.50 |
SBM = soybean meal; 0, 16, 33 and 50, different amounts (%) of total SBM in diet. SBM0 = control diet: 1 sea lion, herring fishmeal, 68% raw protein, 10% raw protein (Bioceval GmbH & Co. KG, Cuxhaven, Germany); 2 soybean meal 200 (P.C. Van Tuijl Kesteren b. v., Kesteren, Netherlands); 3 pig blood meal 90 (Sonac, Burgum, Netherlands); 4 edible gelatine gold (Gustav Ehlert GmbH & Co. KG, Verl, Germany); 5 pea protein isolate; heat treated (Empro E 86, Emsland Group, Emlichheim, Germany); 6 pregelatinised wheat starch: type 90 (Kröner starch, Ibbenbüren, Germany); 7 wheat gluten vital (Kröner starch, Ibbenbüren, Germany); 8 United Fishmeal Works (Cuxhaven GmbH & Co. KG, Cuxhaven, Germany); 9 vitamin-mineral mixture: 517158 (Vitfoss, Grasten, Denmark); 10 Kaolin: Sibelco (Ransbach-Baumbach, Germany); 11 calcium hydrogen phosphate (CaHPO4): JRS (Pharma GmbH & Co. KG, Rosenberg, Germany); 12 “Biolys” Lysine (Evonik Industrier AG, Essen, Germany).
Table 2.
Nutrient compositions (mean values ± standard deviations) of the experimental feeds.
| SBM0 | SBM33 | SBM66 | SBM100 | |
|---|---|---|---|---|
| Dry matter (%) | 89.83 ± 0.02 | 88.35 ± 0.04 | 90.00 ± 0.02 | 90.00 ± 0.02 |
| Ash (% DM) | 10.48 ± 0.05 | 09.16 ± 0.05 | 07.86 ± 0.03 | 06.38 ± 0.00 |
| Crude protein (% DM) | 54.63 ± 0.09 | 55.40 ± 0.23 | 54.44 ± 0.13 | 54.31 ± 0.18 |
| Crude lipid (% DM) | 15.72 ± 0.04 | 14.77 ± 0.05 | 13.94 ± 0.05 | 13.61 ± 0.05 |
| Carbohydrates (% DM) 1 | 19.17 | 20.67 | 23.76 | 25.70 |
| Energy (MJkg−1) | 22.10 ± 0.01 | 22.19 ± 0.03 | 22.19 ± 0.00 | 22.44 ± 0.02 |
1 carbohydrates = 100 − (crude protein + crude ash + crude lipid); DM = dry matter.
Table 3.
Growth and performance of rainbow trout fed diets containing different SBM levels.
| SBM0 | SBM33 | SBM66 | SBM100 | |
|---|---|---|---|---|
| Initial weight [g] | 81.75 ± 0.16 | 82.09 ± 0.90 | 81.44 ± 0.85 | 82.15 ± 0.40 |
| Final weight [g] | 146.10 ± 10.49 | 138.26 ± 29.64 | 134.52 ± 8.66 | 106.74 ± 13.19 |
| K | 0.89 ± 0.24 | 0.95 ± 0.29 | 0.94 ± 0.22 | 0.88 ± 0.20 |
| DFI [%·d−1] | 2.43 ± 0.13 a,b | 2.70 ± 0.13 a | 2.69 ± 0.07 a | 2.32 ± 0.21 b |
a,b Letters indicate significant differences between groups (p ≤ 0.05).
Table 4.
Nutrient composition of the total fish body per feeding group compared to trout at the start of the experiment.
Table 4.
Nutrient composition of the total fish body per feeding group compared to trout at the start of the experiment.
| Start | SBM0 | SBM33 | SBM66 | SBM100 | |
|---|---|---|---|---|---|
| Moisture content [%] | 71.75 | 70.14 ± 1.540 | 74.27 ± 5.120 | 78.15 ±1.47 | 71.75 ± 1.34 |
| Ash content [%] | 02.79 | 02.79 ± 0.07 | 03.02 ± 0.330 | 03.23 ± 0.11 | 02.77 ± 0.12 |
| Protein content [%] | 16.26 | 17.01 ± 0.62 a | 16.16 ± 0.65 a,b | 15.68 ± 0.15 b | 16.34 ± 0.21 a,b |
| Fat content [%] | 09.20 | 10.05 ± 1.170 | 06.55 ± 4.800 | 06.55 ± 4.80 | 09.82 ± 1.04 |
| Energy content [MJ/kg] | 26.05 | 25.58 ± 0.440 | 23.58 ± 2.900 | 21.33 ± 1.19 | 25.73 ± 0.16 |
a,b Letters indicate significant differences between groups (p ≤ 0.05).
Table 5.
Haematocrit values [%] for the rainbow trout in different feeding groups.
| SBM0 | SBM33 | SBM66 | SBM100 | |
|---|---|---|---|---|
| 4 weeks | 30.33 ± 6.17 | 29.50 ± 1.53 | 33.22 ± 7.99 | 22.67 ± 9.50 |
| 8 weeks | 23.39 ± 4.50 | 27.13 ± 11.40 | 30.40 ± 6.07 | 32.27 ± 11.25 |
Publisher’s Note: MDPI stays neutral with regard to jurisdictional claims in published maps and institutional affiliations. |
© 2022 by the authors. Licensee MDPI, Basel, Switzerland. This article is an open access article distributed under the terms and conditions of the Creative Commons Attribution (CC BY) license (https://creativecommons.org/licenses/by/4.0/).
Share and Cite
MDPI and ACS Style
Seibel, H.; Chikwati, E.; Schulz, C.; Rebl, A. A Multidisciplinary Approach Evaluating Soybean Meal-Induced Enteritis in Rainbow Trout Oncorhynchus mykiss. Fishes 2022, 7, 22. https://0-doi-org.brum.beds.ac.uk/10.3390/fishes7010022
AMA Style
Seibel H, Chikwati E, Schulz C, Rebl A. A Multidisciplinary Approach Evaluating Soybean Meal-Induced Enteritis in Rainbow Trout Oncorhynchus mykiss. Fishes. 2022; 7(1):22. https://0-doi-org.brum.beds.ac.uk/10.3390/fishes7010022
Chicago/Turabian StyleSeibel, Henrike, Elvis Chikwati, Carsten Schulz, and Alexander Rebl. 2022. "A Multidisciplinary Approach Evaluating Soybean Meal-Induced Enteritis in Rainbow Trout Oncorhynchus mykiss" Fishes 7, no. 1: 22. https://0-doi-org.brum.beds.ac.uk/10.3390/fishes7010022