Some Observations on Shape Factors Influencing Aerodynamic Lift on Passenger Cars


1
Aeronautical and Automotive Engineering, Loughborough University, Loughborough LE11 3TU, UK
2
Aerodynamics Department, Jaguar Land Rover, Gaydon CV35 0RR, UK
*
Author to whom correspondence should be addressed.
Fluids 2021, 6(1), 44; https://0-doi-org.brum.beds.ac.uk/10.3390/fluids6010044
Submission received: 29 November 2020
/
Revised: 8 January 2021
/
Accepted: 14 January 2021
/
Published: 18 January 2021
(This article belongs to the Special Issue Aerodynamics and Aeroacoustics of Vehicles)
Abstract
:The car aerodynamicist developing passenger cars is primarily interested in reducing aerodynamic drag. Considerably less attention is paid to the lift characteristics except in the case of high-performance cars. Lift, however, can have an effect on both performance and stability, even at moderate speeds. In this paper, the basic shape features which affect lift and the lift distribution, as determined from the axle loads, are examined from wind tunnel tests on various small-scale bodies representing passenger cars. In most cases, the effects of yaw are also considered. The front-end shape is found to have very little effect on overall lift, although it can influence the lift distribution. The shape of the rear end of the car, however, is shown to be highly influential on the lift. The add-on components and other features can have a significant effect on the lift characteristics of real passenger cars and are briefly discussed. The increase in lift at yaw is, surprisingly, almost independent of shape, as shown for the simple bodies. This characteristic is less pronounced on real passenger cars but lift increase at yaw is shown to rise with vehicle length.
1. Introduction
The primary role of the aerodynamics development engineer working on passenger car design is typically to reduce drag without compromising stability or refinement. All aerodynamic characteristics are affected by the shape of the car and cannot be developed in isolation. For example, the shape factors which influence drag will also influence the parameters which have an effect on stability, including lift.
Aerodynamic lift has a strong effect on car stability at high vehicle speeds. In particular, the lift coefficient and lift balance (the difference between front and rear axle lift coefficients) has a pronounced effect on high-speed cornering, lane change manoeuvrability, and straight line stability [1]. Lift also has an influence on crosswind sensitivity and high-speed braking performance. In addition, high lift characteristics are associated with increased drag, through the vortex drag component [2], and yawing moments [3], which affect drivability in windy conditions.
During the car development process, the targets for the lift coefficient are set according to the stability requirements of the vehicle. These targets usually take the form of a maximum permissible lift coefficient for each axle or combinations of them. The magnitude of the limiting lift coefficients is reduced as the performance of the car increases.
Passenger car shapes are effectively imposed by the design department (styling), and the car aerodynamicist must manipulate the shape to achieve the desired aerodynamic performance within the constraints set by design. The shape evolves through the development process but is essentially fixed before the build process of prototypes begins. The aerodynamic development prior to style sign-off, for most manufacturers, consists of a mix of wind tunnel tests and computational fluid dynamics (CFD) simulations of the evolving shape to monitor changes and suggest modifications. Most original equipment manufacturers (OEMs) use small-scale models for the initial phase of wind tunnel testing, with scales that range from 20% to 40%, while full-size aerodynamic bucks are typically used for the later phase, before prototypes become available.
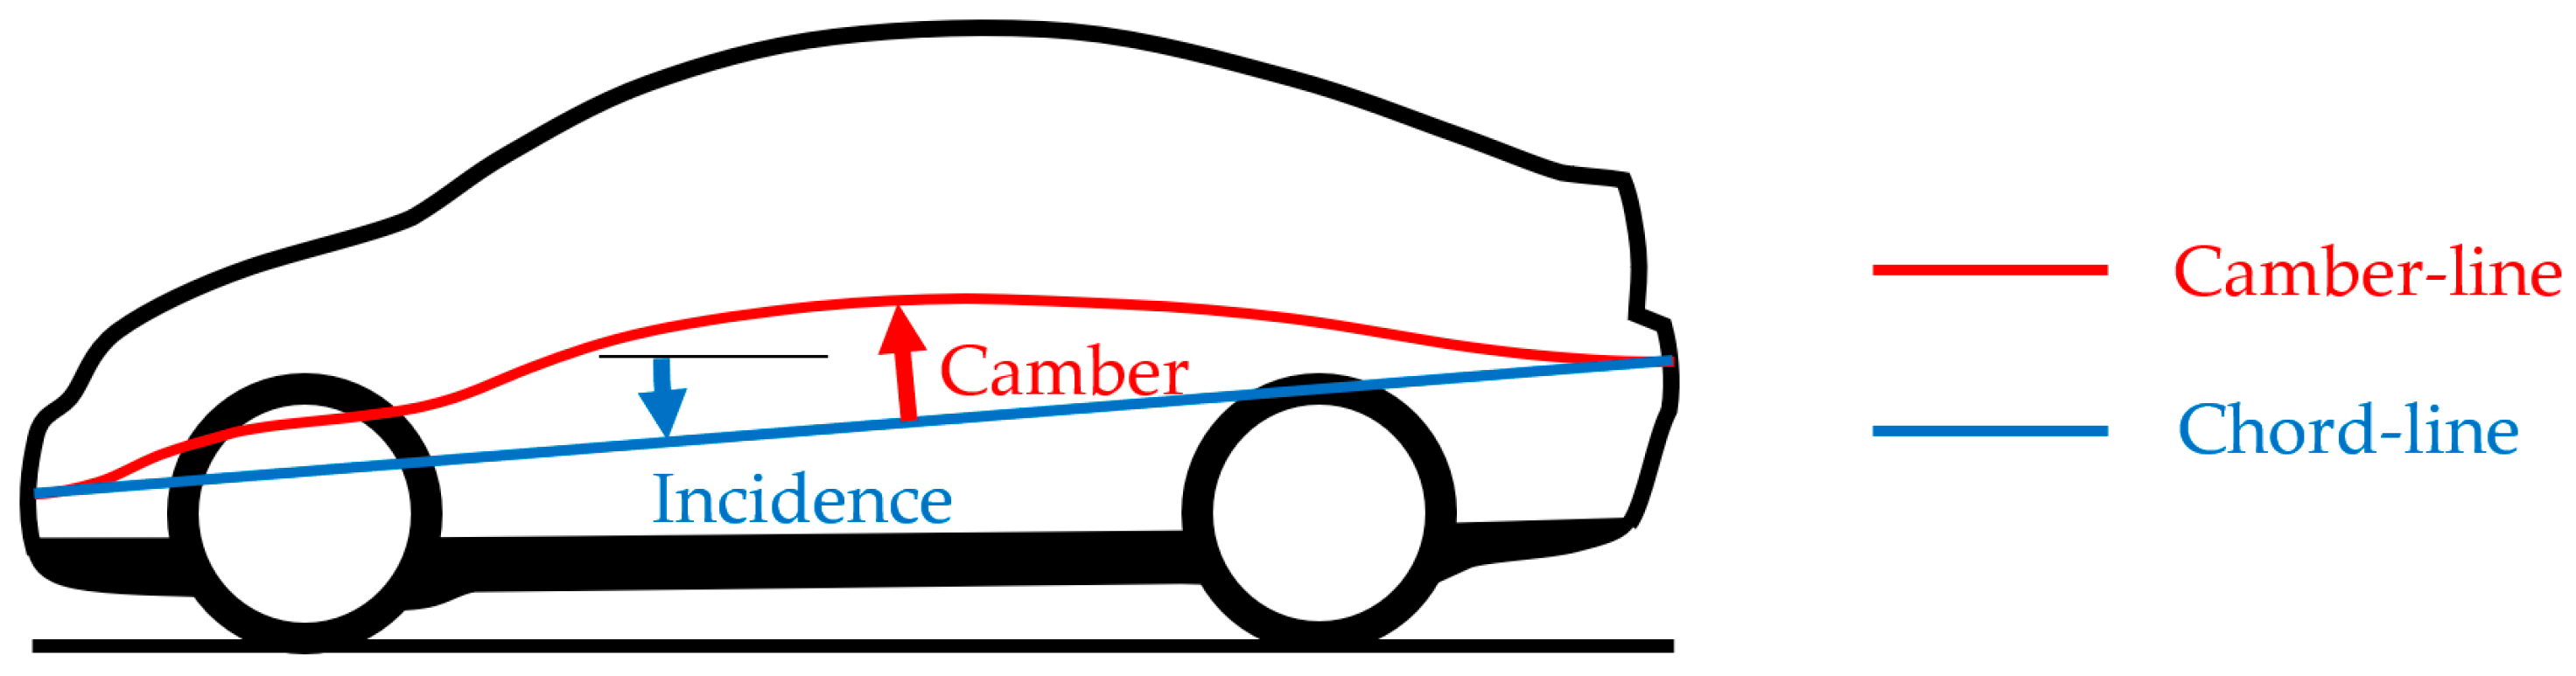
Various studies have been conducted on the influence of shape on the aerodynamic characteristics of passenger cars. Carr [4], in an early extensive study, developed a simplified quarter-scale saloon car shape from a rectangular box and then explored the effect of modifying most surfaces on the car model. As well as the configuration changes, the effects of sharpening individual edges of the car model were also investigated. Carr made the observation that all the changes in lift were identifiable from the changes in the camber-line—the line passing through the centroid of each cross-section, as shown in Figure 1. A positive camber or incidence change generated an increase in lift while negative changes had the opposite effect.
Another extensive study of shape changes was conducted by Gilhaus and Renn [5], using a 3/8th scale model of a generic hatchback car, a vehicle type which did not exist when Carr’s investigation was made. An assessment of squaring individual edges was also included. The results of this study figure strongly in the review of lift to be found in both Hucho [6] and Schultz [7].
Before the time when CFD was available, an attempt at lift and pitching moment prediction for car shapes was made by Morelli [8], using an elegant adaptation of slender wing theory. In this model, the local lift is a function of the curvature of the camber-line, span, and ground clearance. Later, but before CFD was a reliable technique, a prediction method for lift was developed by Carr et al. [9], based on the geometric features of a simple car model.
This paper does not attempt to predict the lift characteristics of passenger cars. As all aerodynamic development engineers are aware, very small changes, especially in critical regions, can have a significant effect on lift, and this is exploited by using small add-on components to tune the lift characteristics. The main aim of the paper is to make some general observations on the effect of large-scale shape changes on lift. These have been noted over many years of wind tunnel testing of a wide range of small-scale simple bodies representing car shapes. In many cases, these effects have not been previously reported.
2. Experimental Details
The data presented in this paper were acquired over a considerable period of time. This is not, therefore, a systematic investigation, although individual sections may have been carried out in a systematic manner. A range of different models have been used for the various investigations, but most of the studies involve very simple models with extensive flat surfaces to make configuration changes simpler and easier to understand. The different models are described in the section relevant to their use.
Over the time span considered, different wind tunnels have been used. While most of the studies were performed using the MIRA MWT (Model Wind Tunnel), this tunnel evolved with time and now no longer exists. Details of the different wind tunnels will be kept to a minimum in this paper, but the references will provide further details if required. From a combination of balance accuracy and observed repeatability, the lift coefficients, in all cases, can be considered accurate to within ±0.005.
All the tests reported here were conducted using a fixed ground simulation. While it is recognised that ground simulation has an effect on lift measurements, the impact on the changes in lift due to the upper body shape parameters assessed here is minimal and does not affect the conclusions drawn from the experiments.
Corrections for blockage, using the continuity method, [10], have been used where the wind tunnel is of the closed-jet type. For a model with frontal area, A, tested in a closed-jet wind tunnel with working section area, AT, the blockage ratio, B, is given by:
and the corrected lift coefficient, CLc, is given by:
where CLm is the measured lift coefficient.
B = A/AT
CLc = CLm (1 − B)2
3. Shape Effects
3.1. Basic Blocks
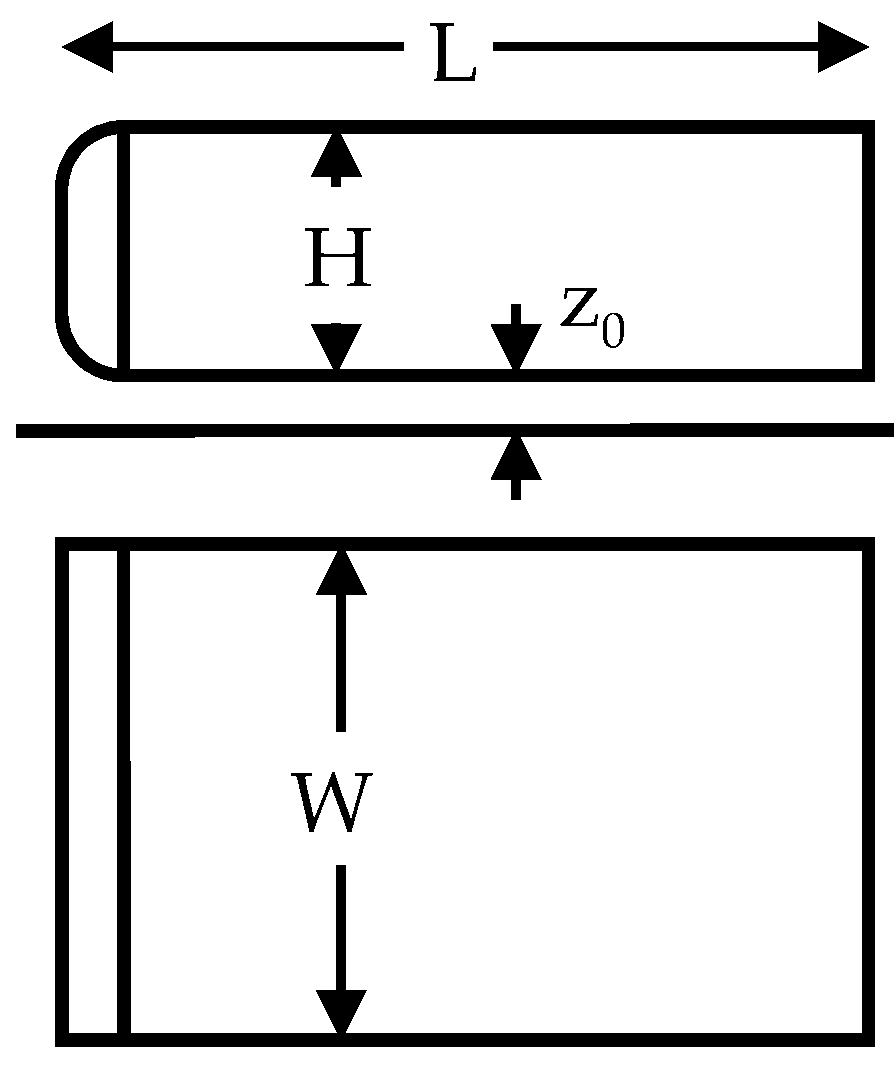
A range of very simple rectangular blocks were tested by Howell [11]. The basic geometry is shown in Figure 2, with the overall dimensions given in Table 1. The models are small but provide data for a range of planform aspect ratios, thicknesses, and lengths. They were tested in the T3 wind tunnel in the Department of Aeronautical Engineering at The City University, London. The wind tunnel was a closed-jet, closed-return wind tunnel with an octagonal working section 1.14 m wide by 0.93 m high. It had a full span fixed ground plane mounted 0.2 m above the wind tunnel floor, giving an area above the ground plane of 0.75 m2. The models were mounted to an overhead balance via a single long streamlined main strut and a tail rod. The pitch angle could be varied, although only the data for a zero-pitch angle, where the underside of the model is parallel with the ground, is presented here. No tare corrections were applied to the lift measurements. The models were tested at a nominal test airspeed of 30 m/s, giving a Reynolds number of 7 × 10⁵ for the 0.325 m long model, and the turbulence intensity was 0.5%.
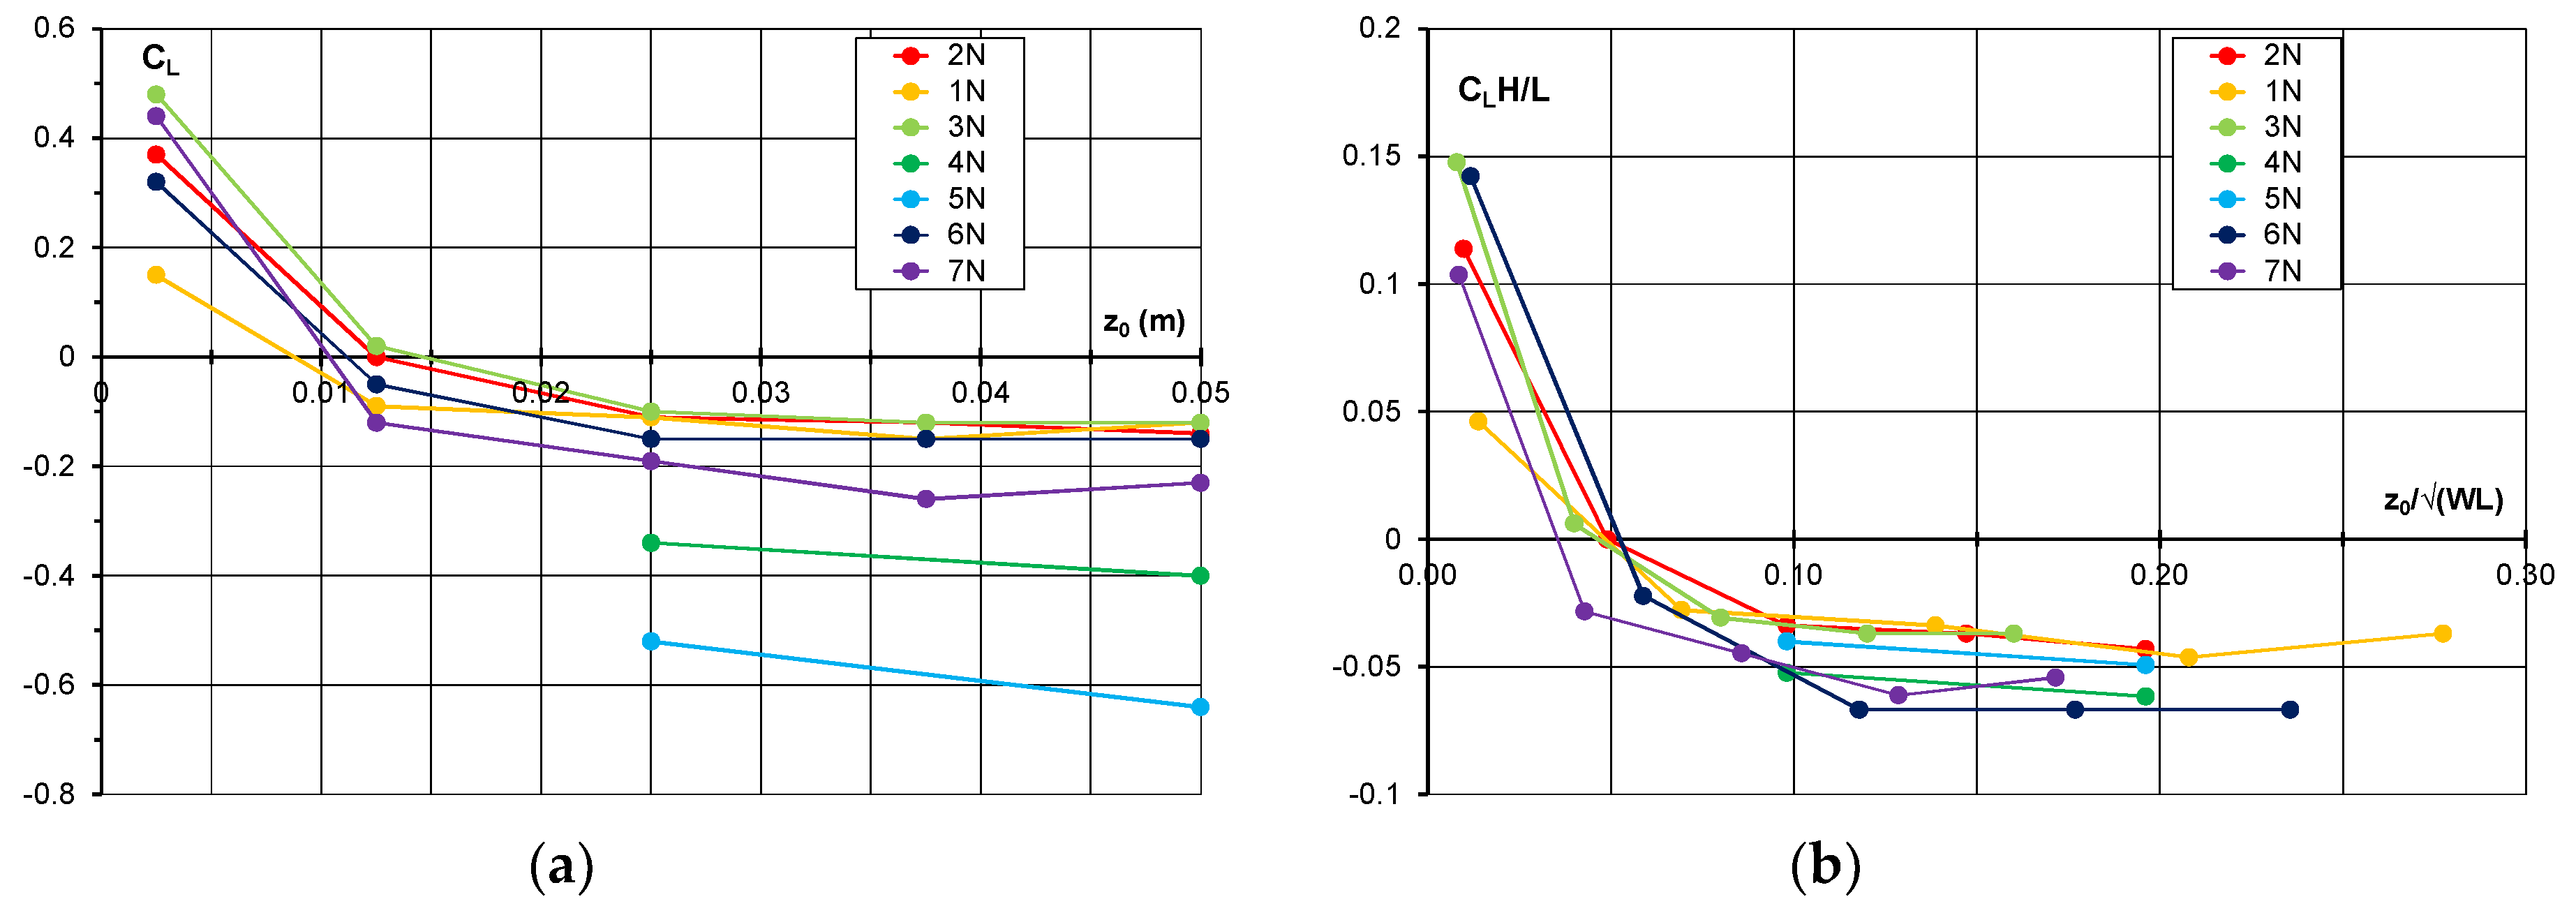
The leading-edge radius for all models was 0.25H, where H is the block height. The ground clearance, z0, was varied from 0.0025 to 0.05 m. The boundary layer displacement thickness at the model mid-length location in the empty tunnel was 0.003 m. The variation in the lift coefficient as a function of ground clearance for the range of blocks in Table 1 is shown in Figure 3a. The increase in lift at small ground clearances occurs because the boundary layer development on the underside inhibits the underbody flow, but in the limit of zero ground clearance, the lift will always be positive for these simple blocks as all the flow must pass over the body.
For all the blocks with the same thickness and length, the lift coefficients are very similar. The data are affected slightly by model length, but significantly by model height. Adjusting the lift coefficient by the factor, H/L, which in effect gives a lift coefficient based on plan area, as shown in Figure 3b, greatly reduces the spread of the data. The ground clearance is also non-dimensionalised by the square root of the plan area.
This might suggest that it would be beneficial to generate lift coefficients based on plan area rather than frontal area, but this would be inappropriate for automotive development as lift is not the component of primary interest.
3.2. Front-End Shape
3.2.1. Leading Edge Radius
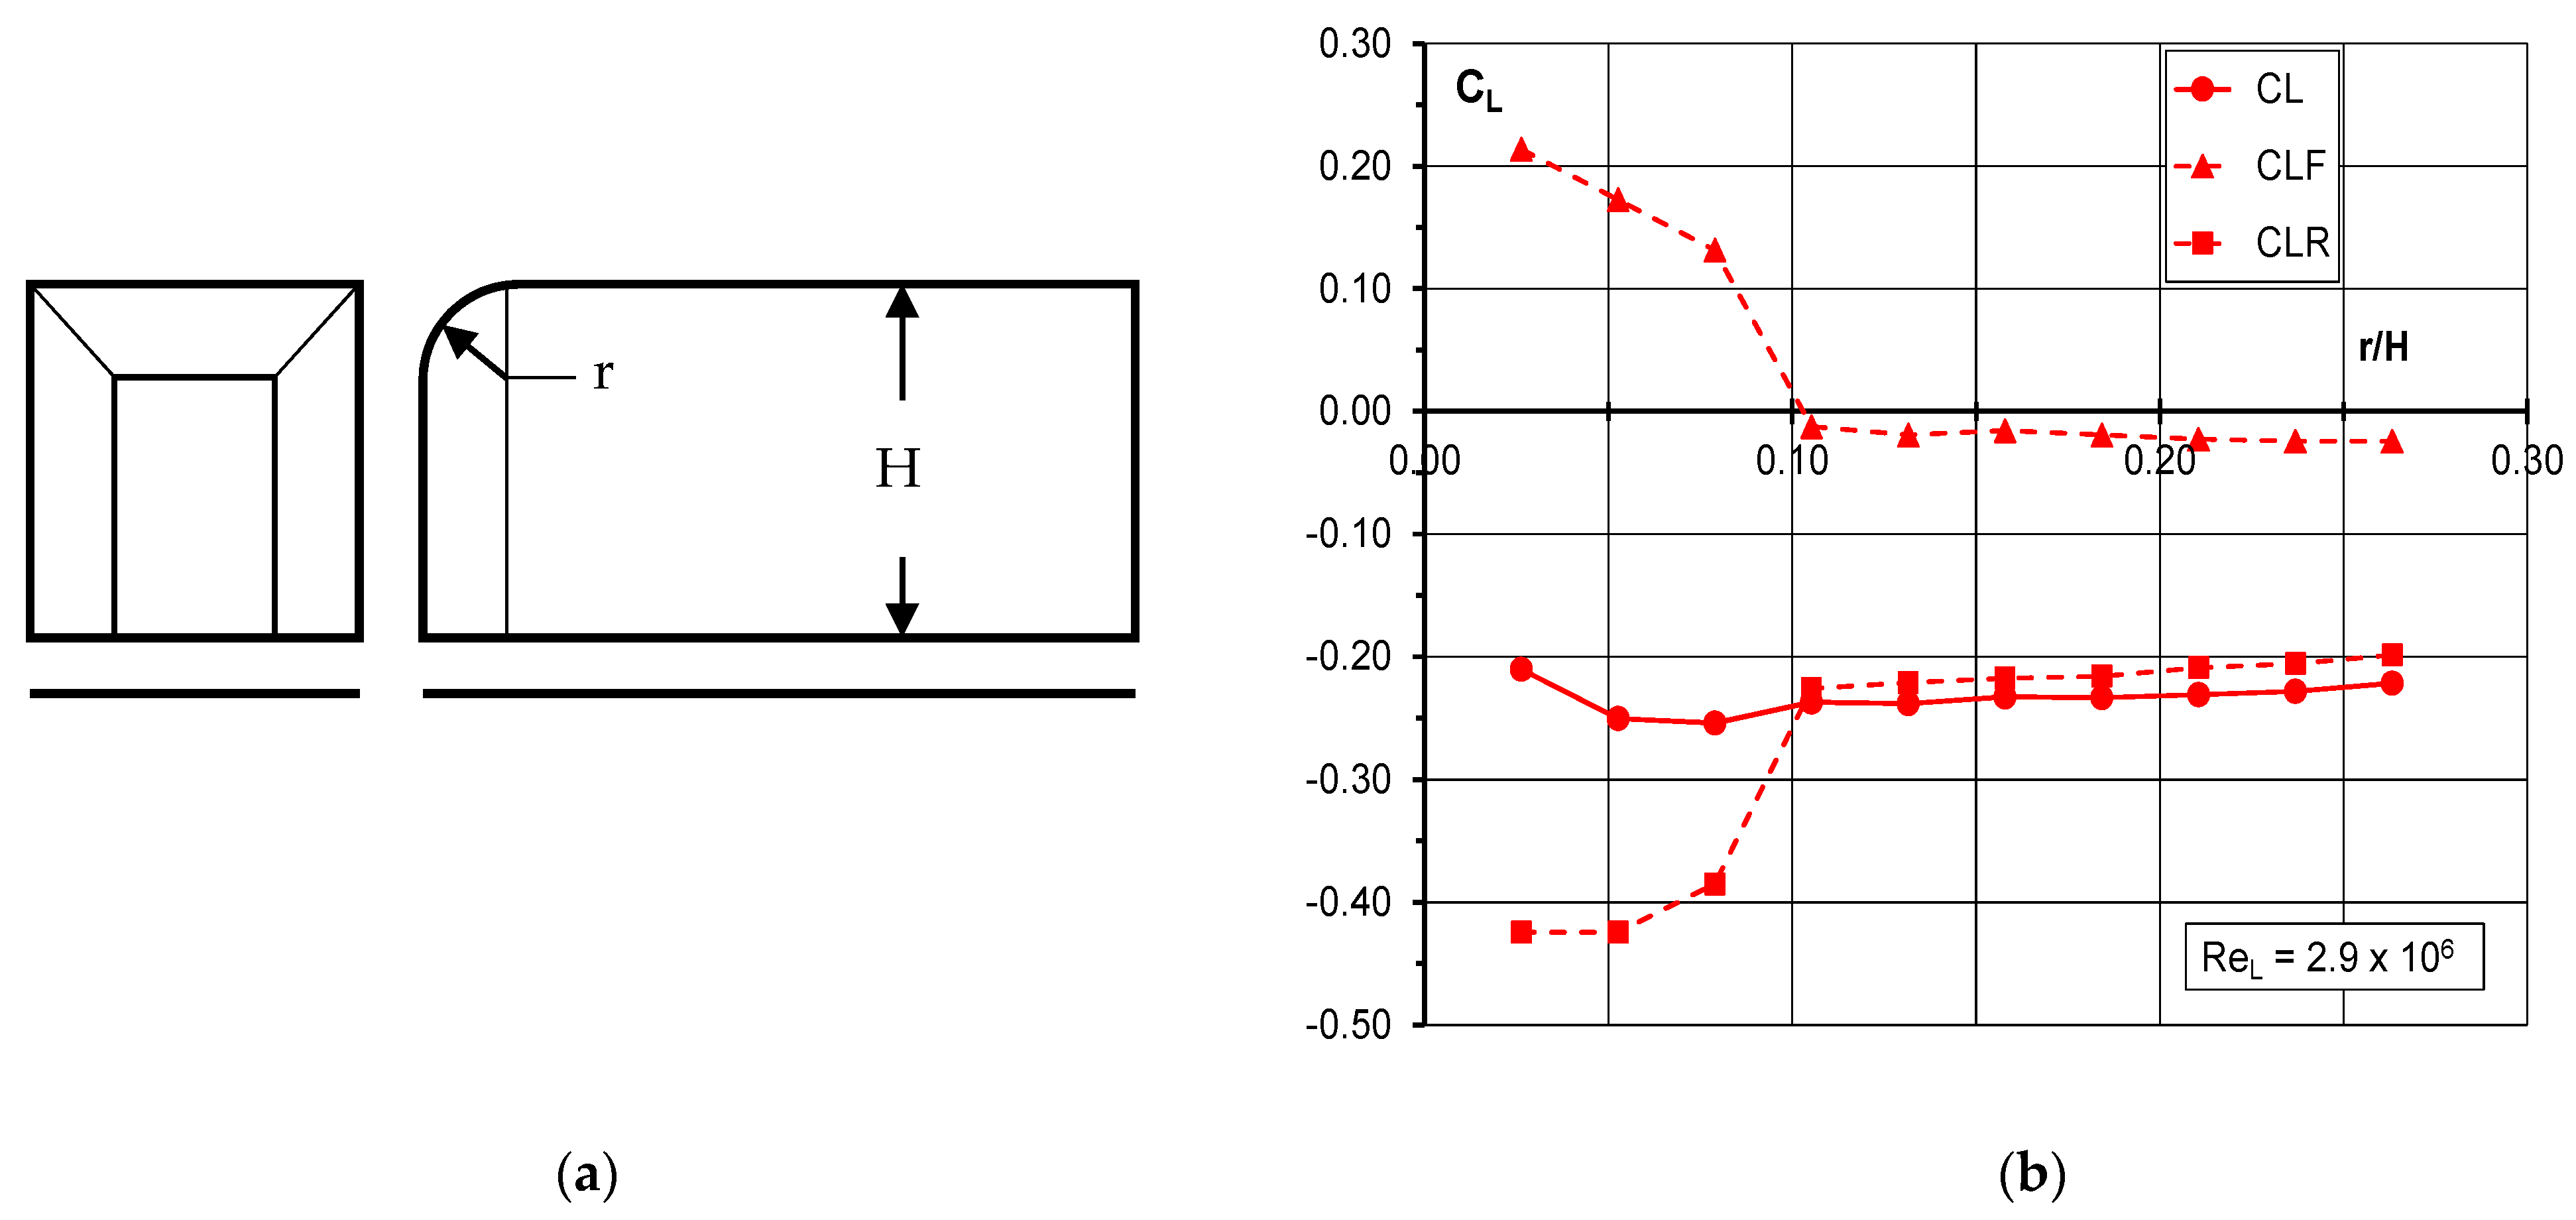
Newnham [12] investigated the effect of Reynolds number on the aerodynamic characteristics of simple shapes with different leading-edge radii. The model used was a rectangular block as shown in Figure 4a. The model was 0.845 m long, 0.38 m wide, and 0.39 m high. The leading-edge radius was applied equally to the upper and side leading edges only and varied from 0.01 to 0.1 m in 0.01 m steps. The ground clearance was 0.06 m. The model was mounted to an underfloor balance via four slender struts, located just inboard of the model side edges and spaced longitudinally by 0.60 m, which represents a nominal “wheelbase”. No lift corrections were applied for the struts.
The model was tested in the Loughborough University wind tunnel, which is of the closed-jet, open-circuit type. The wind tunnel working section is 1.32 m high by 1.92 m wide with corner fillets, giving a tunnel area of 2.49 m2. The maximum wind speed is 50 m/s and the turbulence intensity, 0.2%.
Figure 4b shows the overall lift coefficient and the nominal front and rear axle lift coefficients, CLF and CLR, respectively, as a function of the ratio of edge radius to model height. This test was conducted at a Reynolds number (based on length) of Re = 2.9 × 10⁶. The overall lift coefficient varies only slightly with small edge radii, but insignificantly as the edge radius exceeds 0.04 m. The front axle lift reduces sharply and the rear axle lift increases sharply at low edge radii, but both only vary slightly as the edge radius exceeds 0.04 m.
Newnham [12] also carried out an investigation on the effect of bonnet leading-edge radius using the MIRA Reference Car in the estate car configuration in the full-scale wind tunnel. The bonnet leading edge was reduced from the standard 0.152-m radius to 0.025 m. For an edge radius greater than 0.05 m, there was a negligible effect of radius on overall lift, but front axle lift reduced slightly while rear axle lift increased. A small effect of Reynolds number was noted.
3.2.2. Front-End
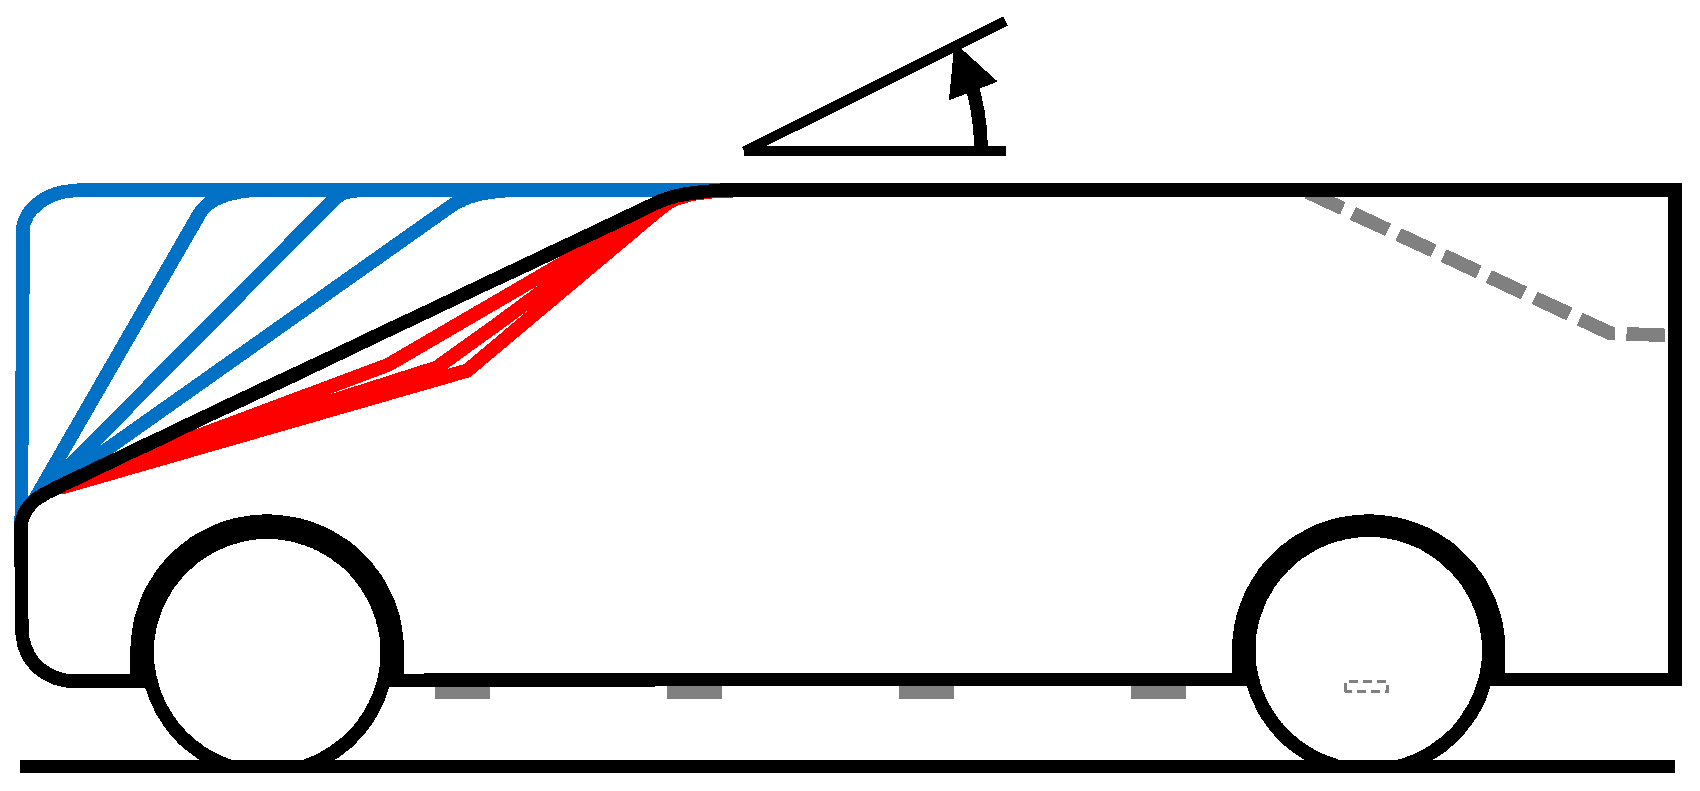
The MIRA Variable Geometry Model (VGM) was used to explore the effect of front-end shape on the aerodynamic characteristics of a simple car shape. This model as tested for this exercise is shown in Figure 5. It is 1.003 m long, 0.413 m wide, and 0.344 m high, with a wheelbase of 0.667 m and a frontal area of 0.114 m2. All edges had a radius of 0.030 m, except for the rearmost trailing edges, which were sharp. The ground clearance for the body was 0.05 m. The front-end shapes comprised a series of 1-box shapes, shown in blue in the figure, where the windscreen angles ranged from vertical, 90°, to 25°. Note that the angles are measured from horizontal, which is non-standard. Three notched front-ends were also tested, as shown in red in the figure. All the windscreen and bonnet angles are given in Table 2. The model had tumblehome and was tested in two rear-end configurations, a squareback and notchback, as shown by the grey dotted line in Figure 5. For the notchback, the backlight slope is 25° and the small boot extension gives an effective backlight angle of 21°. Roughness strips could be added to the underfloor and the model was tested without cooling airflow simulation.
The investigation was conducted in the MIRA MWT and for this test was in open-jet open-return form. The wind tunnel nozzle was 2.0 m wide by 1.0 m high. The nominal airspeed was 27 m/s, giving a Reynolds number, based on length, of 1.9 × 10⁶. The turbulence intensity was 1.2%. The wheels were mounted on small pads, which were flush with the wind tunnel floor and connected to an underfloor balance.
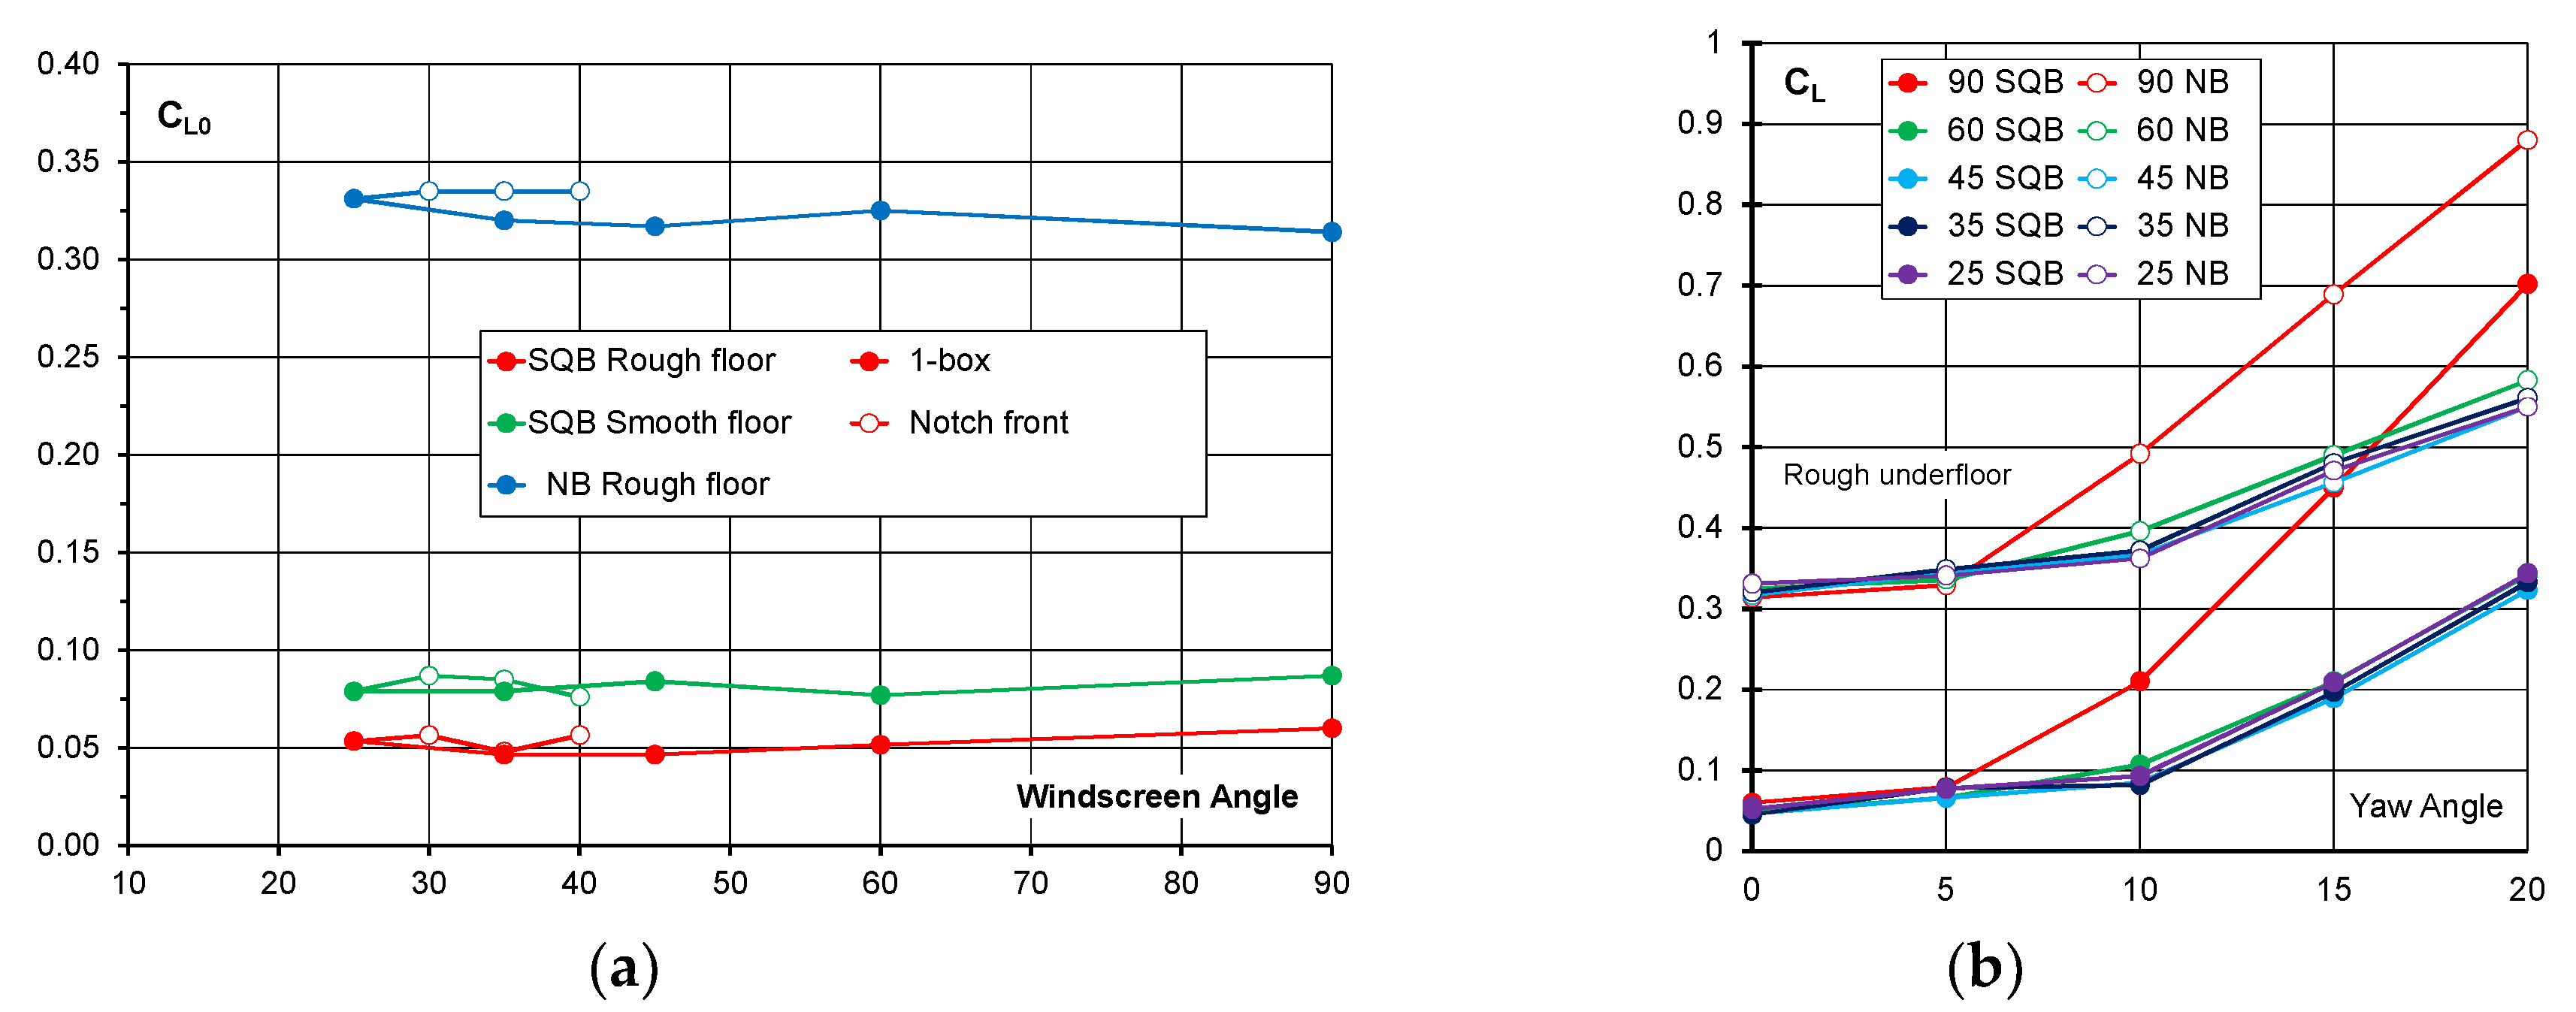
Figure 6a shows the overall lift coefficient at zero yaw for the range of different front-end shapes as defined by the windscreen angle. The data for the squareback shape are shown for a smooth and rough underfloor condition, while the notchback geometry was only tested with a rough underfloor. The 1-box shapes are shown by the solid symbols and the open symbols denote the notched front shapes.
Figure 6b shows the overall lift coefficient as a function of yaw angle for the squareback and notchback configurations with a rough floor. Except for the cases with a vertical windscreen, the lift increase with yaw is essentially independent of the front-end shapes tested. Comparing the notchback shapes against those with a squareback, the lift increase is similar up to a yaw angle of 10° but is reduced noticeably at higher yaw angles.
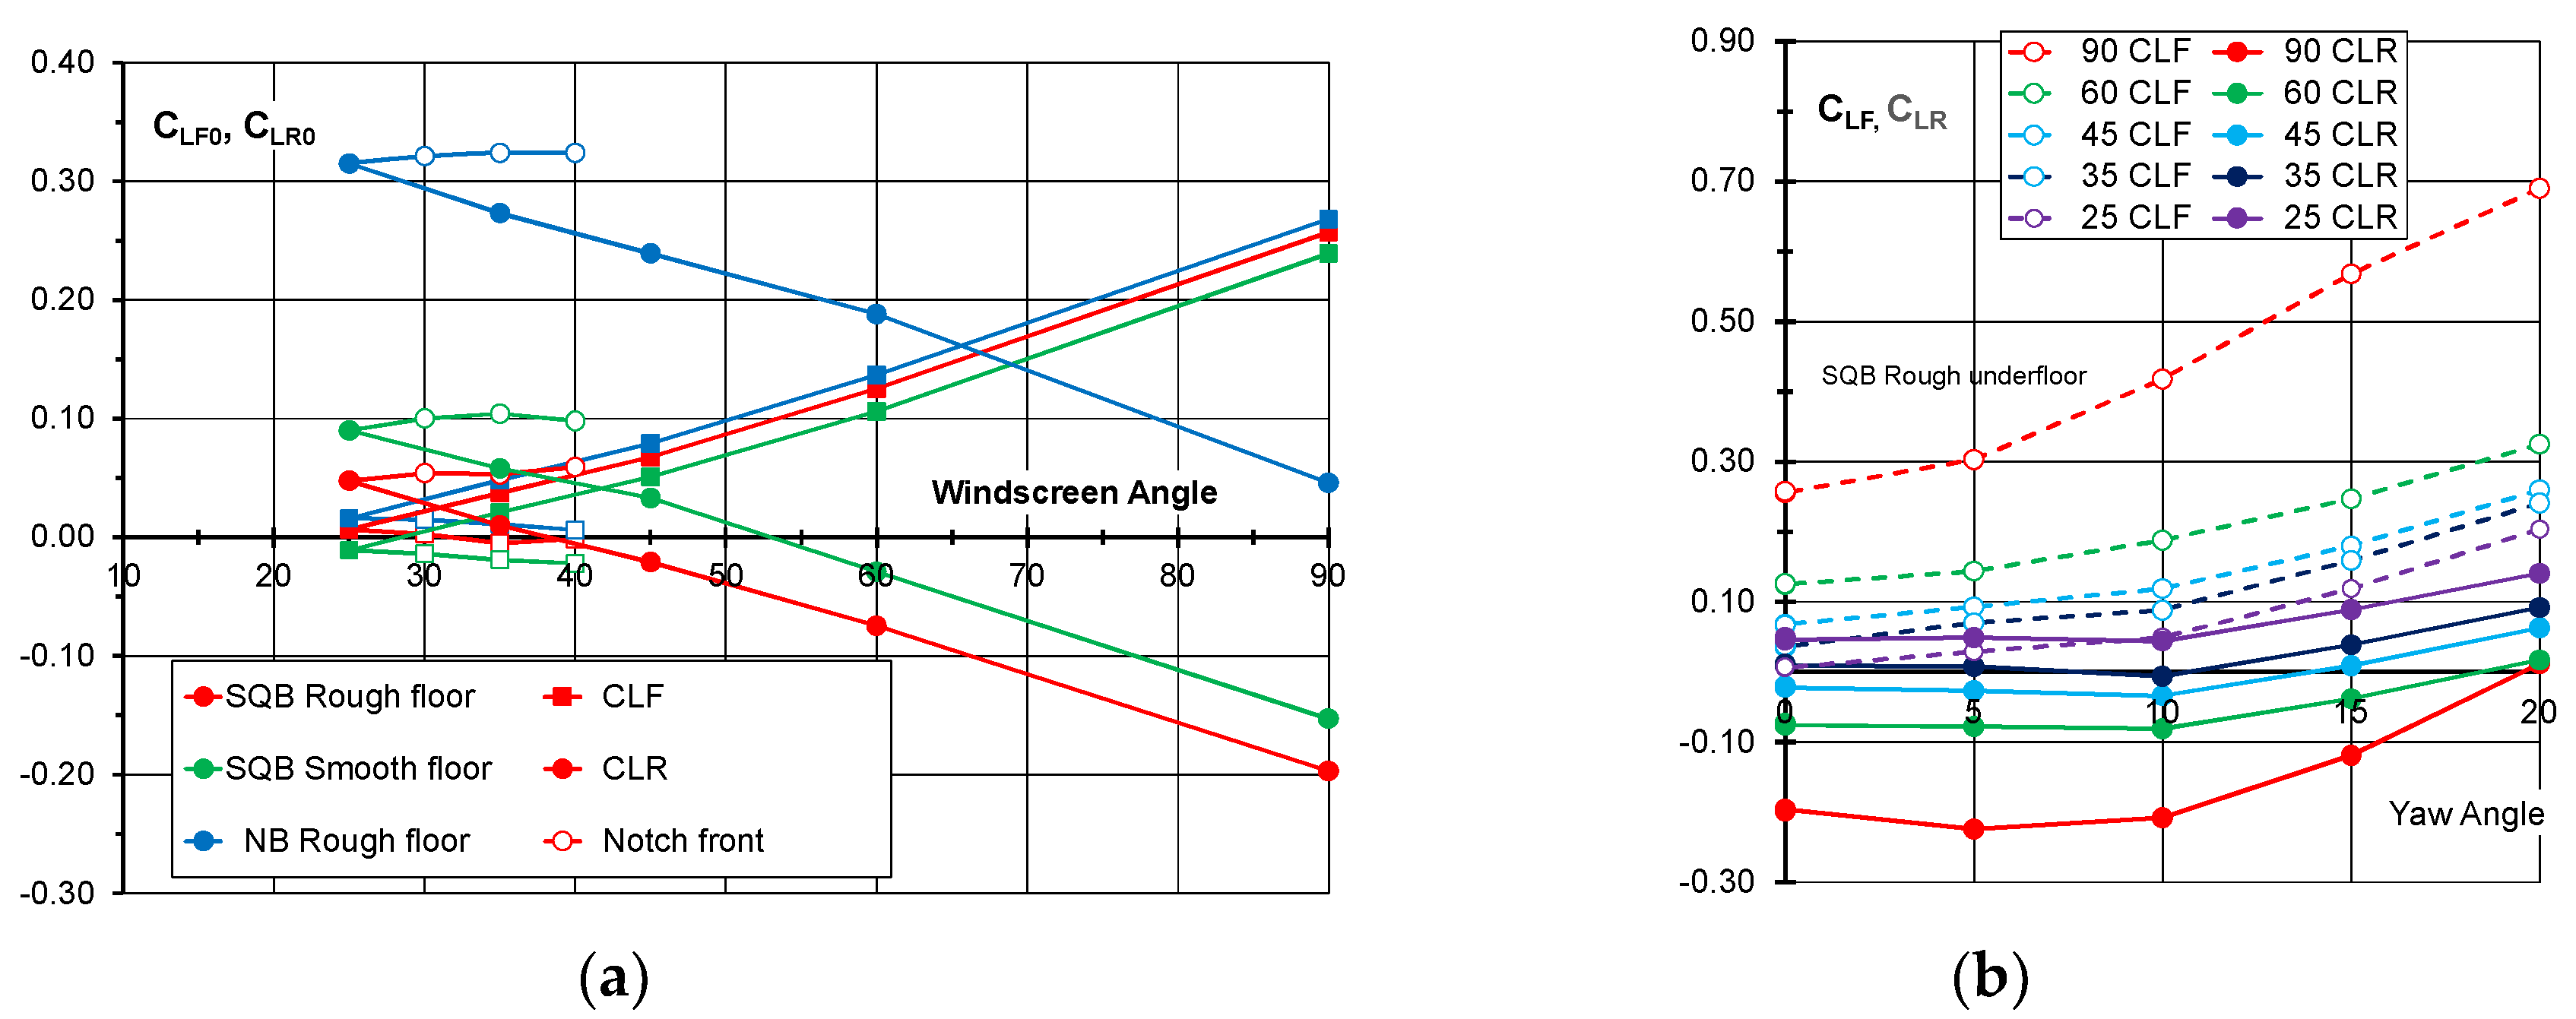
Figure 7a shows the front and rear axle lift coefficients as a function of windscreen angle. For the 1-box shapes, the front axle lift increases linearly with windscreen angle, while the rear axle lift coefficients reduce. For the notched front-end shapes, however, the front and rear axle lift coefficients remain almost constant. The variation in the 1-box lift coefficients is explained by the movement of the roof header. Suction peaks will occur at the extreme front-end of the car and on the roof header. As the windscreen angle reduces, the front-edge suction will increase and the suction at the roof header will decrease. For the front header forward of the front axle, the lift at the front axle will be enhanced. This combination will increase front axle lift and reduce lift at the rear axle. In the case of the notched front-ends, a positive pressure occurs at the base of the windscreen, which tends to increase with increasing windscreen angle.
Figure 7b shows the front and rear axle lift coefficients as a function of yaw angle for the squareback configuration with a rough floor. The front axle lift is shown by the open symbols and a dashed line, while the rear axle lifts are shown by the solid symbols and lines. As with the overall lift coefficients shown in Figure 6b, the variation of axle lift with yaw is similar for all windscreen angles, except for the vertical front-end case. For the squareback model shown, the lift increase with yaw is slightly greater at the front axle than it is at the rear.
3.3. Rear-End Shape
3.3.1. Roof Slope/Backlight Angle
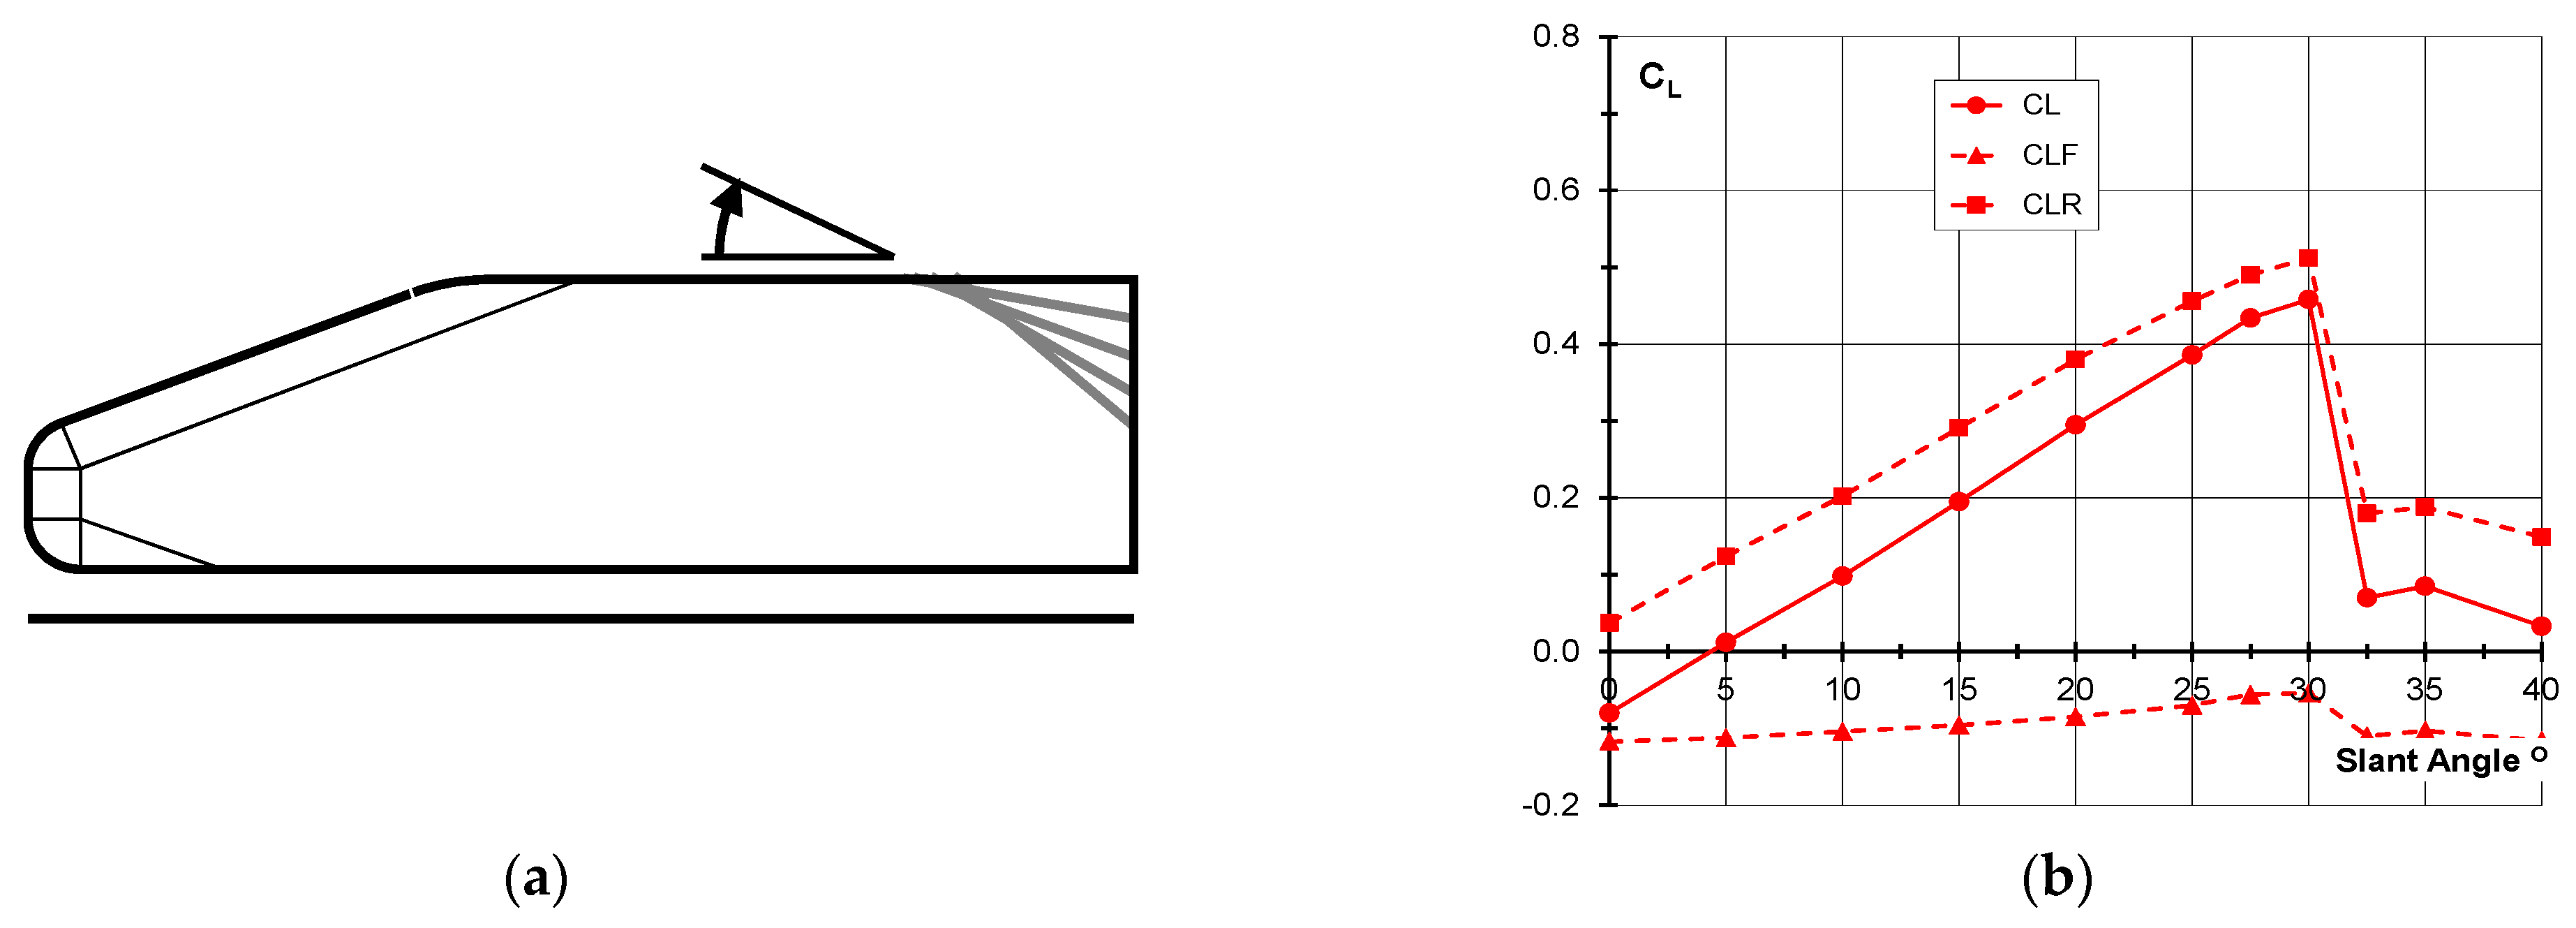
The Windsor Body, shown in Figure 8a, has been used for many years to investigate many fundamental aspects of car aerodynamics. The model represents an approximately quarter-scale lower-medium hatchback. It has the same overall dimensions as the well-known Ahmed Body, with length 1.044 m, width 0.389 m, and height, 0.289 m, giving a frontal area of 0.112 m2. For the purposes of generating front and rear lift coefficients, the wheelbase is 0.668 m and mid-wheelbase is at half the model length. All the leading edges are well rounded with a radius of 0.05 m, except the roof leading edge, which has a radius of 0.20 m. All the remaining edges are sharp.
It has been tested with a range of rear slant angles, representing roof slope at low angles and backlight angle at higher angles. Slant angles range from 0°, for the squareback shape, to 40°. The slant length is kept constant at 0.222 m to give a fixed aspect ratio of 1.75 for all the slant surfaces. The wind tunnel used for the tests reported here was the MIRA MWT in open-jet configuration, as described in Section 3.2.2. This and subsequent testing of the Windsor Body was carried out at a nominal airspeed of 27 m/s, with a Reynolds number, based on length, of 2.0 × 10⁶. The ground clearance was 0.050 m. The model is connected to the underfloor balance via thin plates, flush with the model sides, in the nominal wheel locations. No lift corrections were applied for the model supports.
The effect of slant angle on the overall lift coefficient and the front and rear axle lift coefficients at 0° yaw angle are shown in Figure 8b. Lift increases linearly with slant angle from 0° to 27.5°, but at 30°, there is a dramatic loss of lift. For slant angles up to the critical angle, the lift is generated at the slant leading edge and on the slant sides beneath the edge vortices, both of which increase with slant angle. At the critical angle, the edge vortices cannot maintain an attached flow at the slant trailing edge and the separation for the base flow moves from the slant trailing edge to the slant leading edge. In this post-critical state, the base pressure acts on the slant surface and so the lift does not quite revert to the squareback value. Almost all the variation in lift occurs at the rear axle because of the proximity of the slant leading edge to the rear axle position.
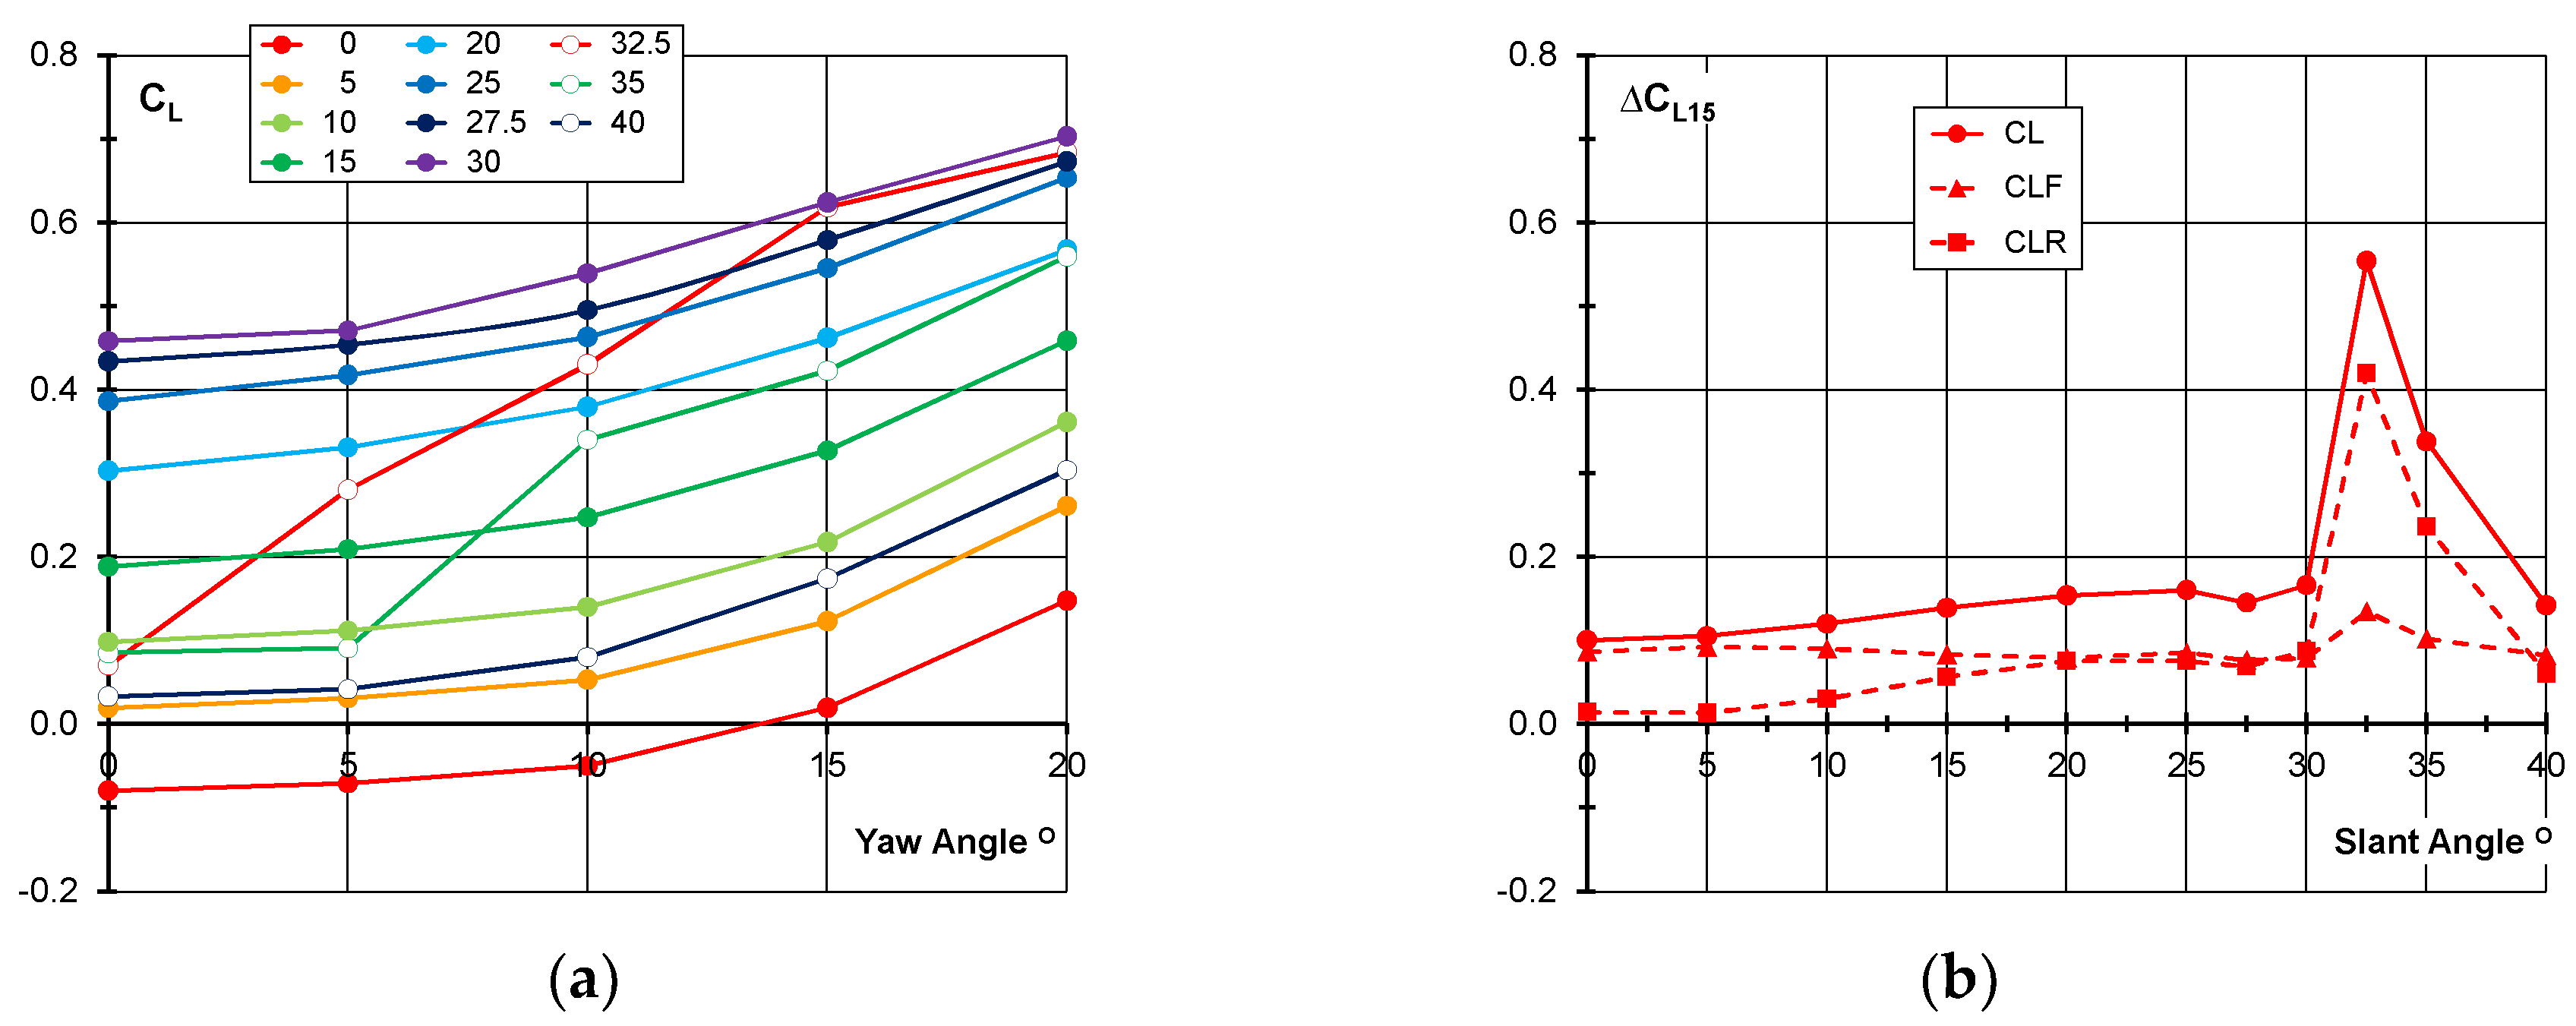
The effect of yaw angle on lift for the range of slant angles is shown in Figure 9a. For all the subcritical slant angles, from 0° to 30°, the increase in lift coefficient with yaw angle is very similar. For the immediate post-critical slant angles, however, the initial lift increase with yaw is much larger. At higher yaw angles, the trend with yaw reverts to the trends at lower slant angles. This suggests that the flow on the backlight at these high slant angles is switching from a separated to an attached flow condition, as the yaw angle increases. At a 40° slant angle, the lift increase with yaw is similar to that for the sub-critical slant angles, which suggests that the flow always remains separated at yaw.
This data are summarized in Figure 9b, which shows the increase in lift coefficient between yaw angles of 0° and 15° as a function of slant angle for overall lift and the front and rear axle components. There is a small increase in the lift rise with yaw for the sub-critical slant angles, but the plot shows the large jump in the lift increase with yaw for the slant angles which are just above the critical angle. The rear axle lift rise follows a similar pattern, while the front axle lift increase remains almost constant.
3.3.2. Slant Aspect Ratio
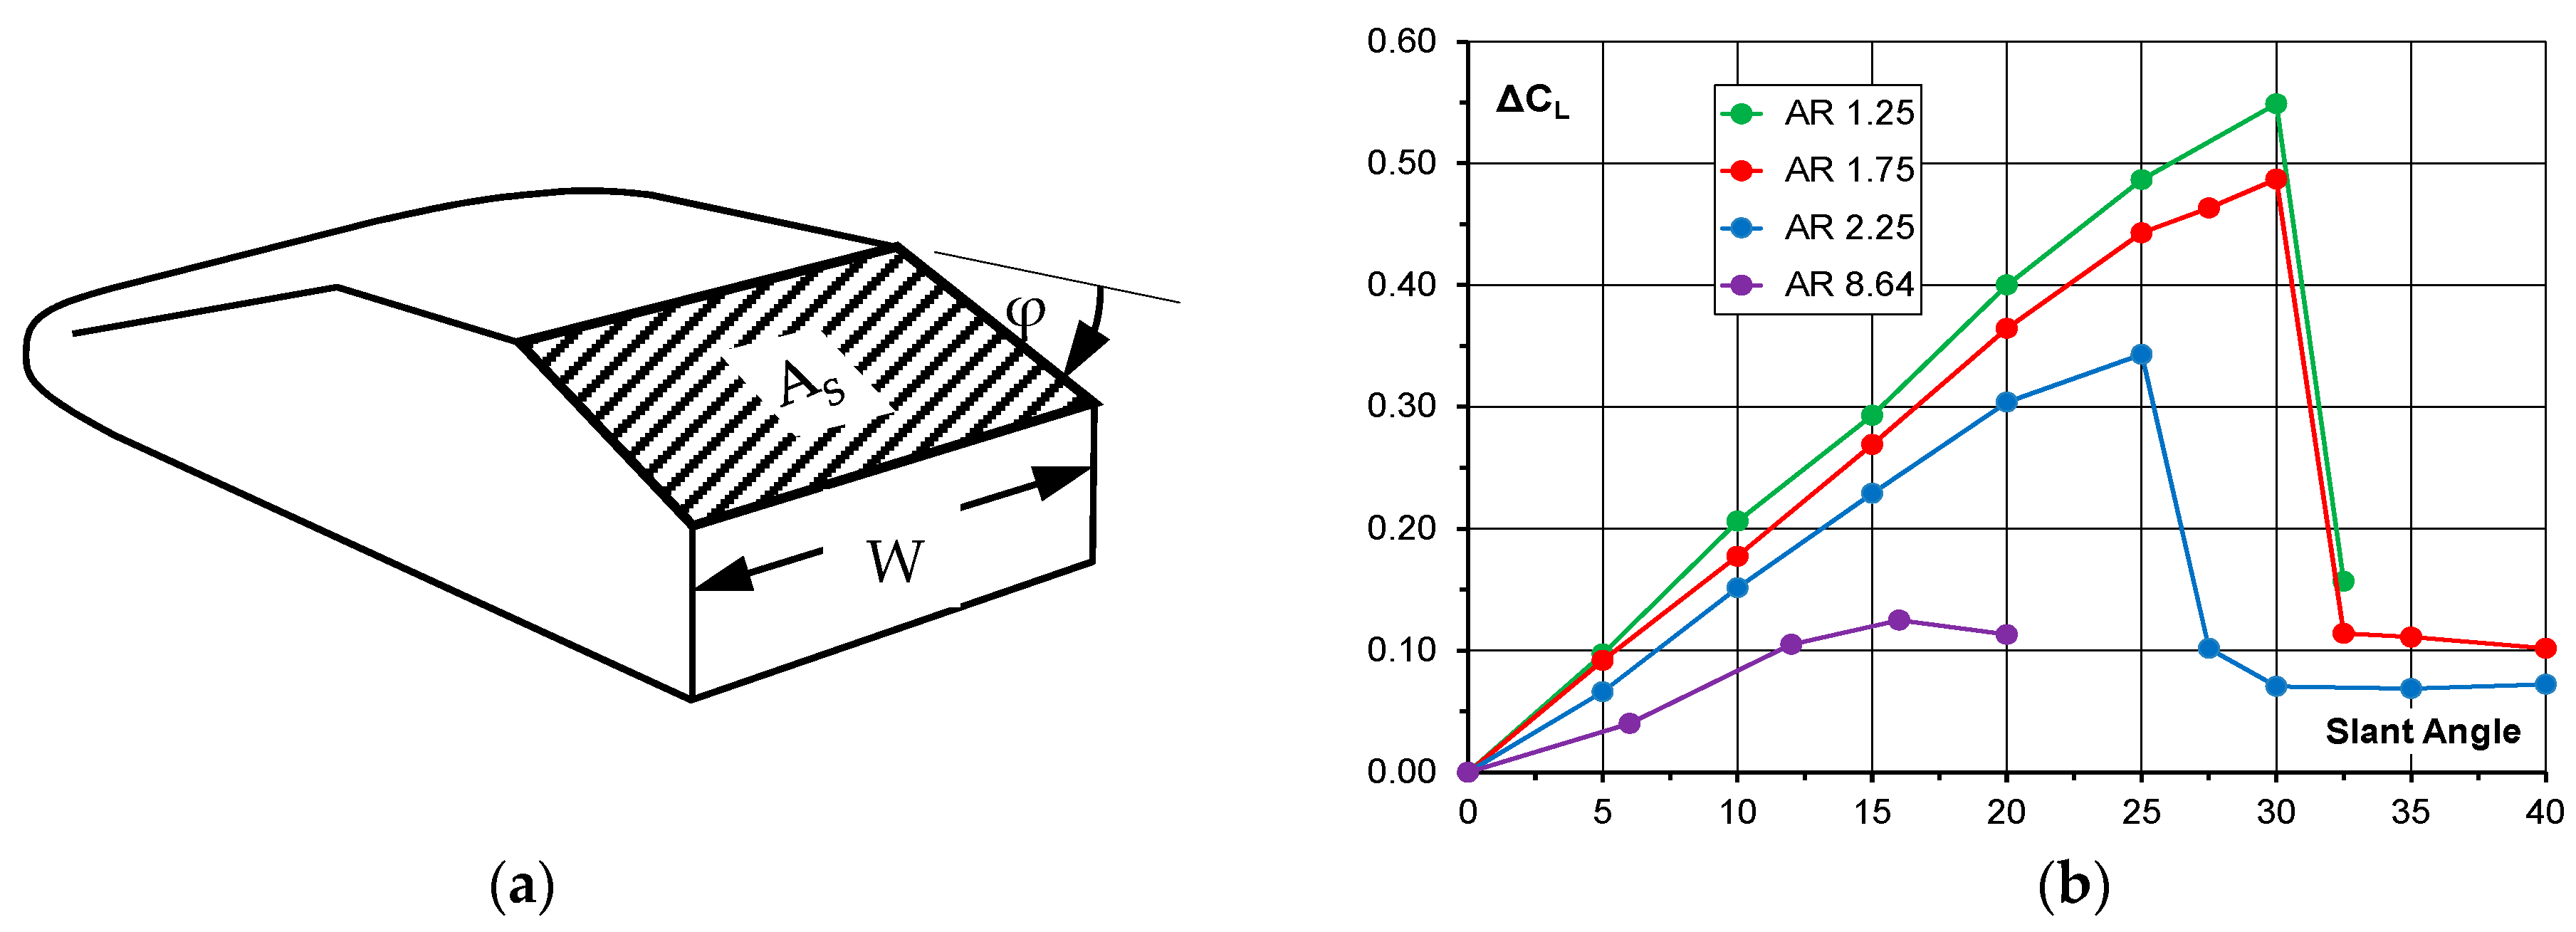
The effect of the slant surface aspect ratio on the lift and drag characteristics of the Windsor Body has also been investigated by Howell and Le Good [2]. The aspect ratio, AR, of the slant surface is defined as:
where AS is the area and W is the span or, in this case, the width of the slant surface, as shown in Figure 10a. For the rectangular slant surface for this body, the aspect ratio becomes the ratio, W/LS, where LS is the slant length.
AR = W2/AS
The effect of slant aspect ratio on the lift coefficient increase with slant angle is shown in Figure 10b. Aspect ratios from 1.25 to 1.75 were tested in the MIRA MWT when it was a closed-jet wind tunnel with a working section 2.0 m wide by 1.0 m high. Also shown are the results of a test by Pavia [13], who tested a short chamfer on the roof trailing edge of a Windsor Body in the Loughborough University Wind Tunnel. Details of this wind tunnel have been given in Section 3.2.1. In all cases, the ground clearance was 0.050 m and the data have been corrected for blockage. The data are presented as the increase in lift from the squareback configuration to account for wind tunnel and model mounting differences.
Figure 10b shows that lift increases approximately linearly with slant angle for a significant range of slant angles and the slope reduces as aspect ratio increases. The two models with the lowest aspect ratios (i.e., the longest slant lengths) have near identical critical angles where the flow on the backlight is effectively stalled. This angle reduces as slant length is reduced.
3.3.3. Edge Rounding
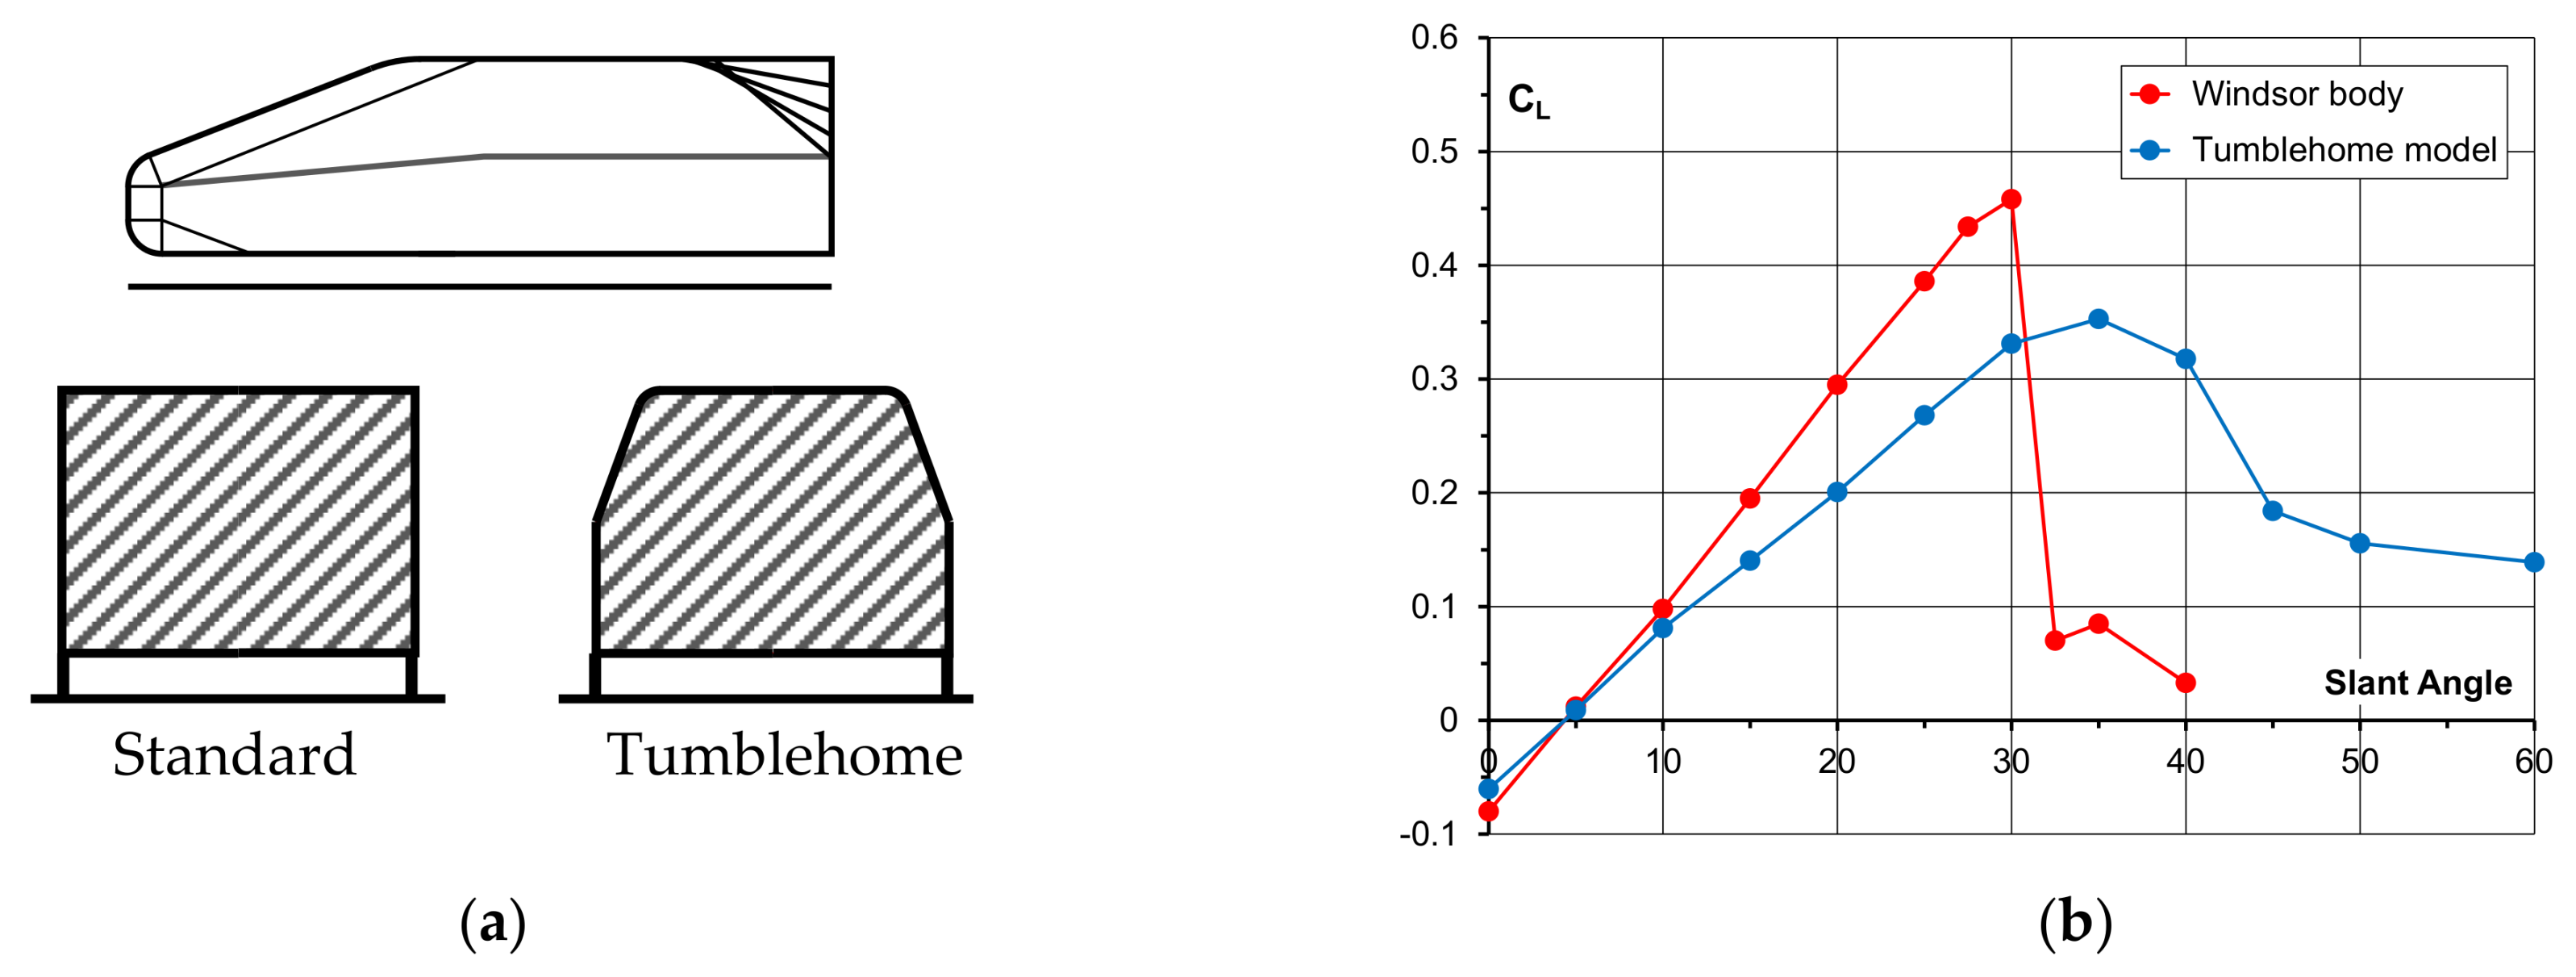
The Windsor Body was also tested in an alternative form, known as the Tumblehome model, which is shown in Figure 11a. The model has exactly the same side view, but the upper body surface is inclined inwards, a feature called tumblehome, at an angle of 15°.
The split line between upper and lower side surfaces is shown by the grey line in the side view drawing of Figure 11a. All the leading-edge radii were the same as on the standard model, but the longitudinal edges, as well as the side and leading edges of the slant surface, have a radius of 0.025 m, instead of being sharp. This model was tested in the MIRA MWT in closed-jet configuration and blockage corrections have been applied.
A comparison of the variation in lift coefficient with slant angle for the standard Windsor Body and Tumblehome model is shown in Figure 11b. The slope for the Tumblehome model is significantly less than that for the standard body, but the maximum lift coefficient occurs at a considerably higher slant angle. The reduction in lift that occurs at slant angles higher than that for maximum lift is less precipitous and of lower magnitude than for the standard body. As with the Windsor Body the front axle lift is approximately constant for all slant angles and almost all of the lift variation with slant angle occurs at the rear axle.
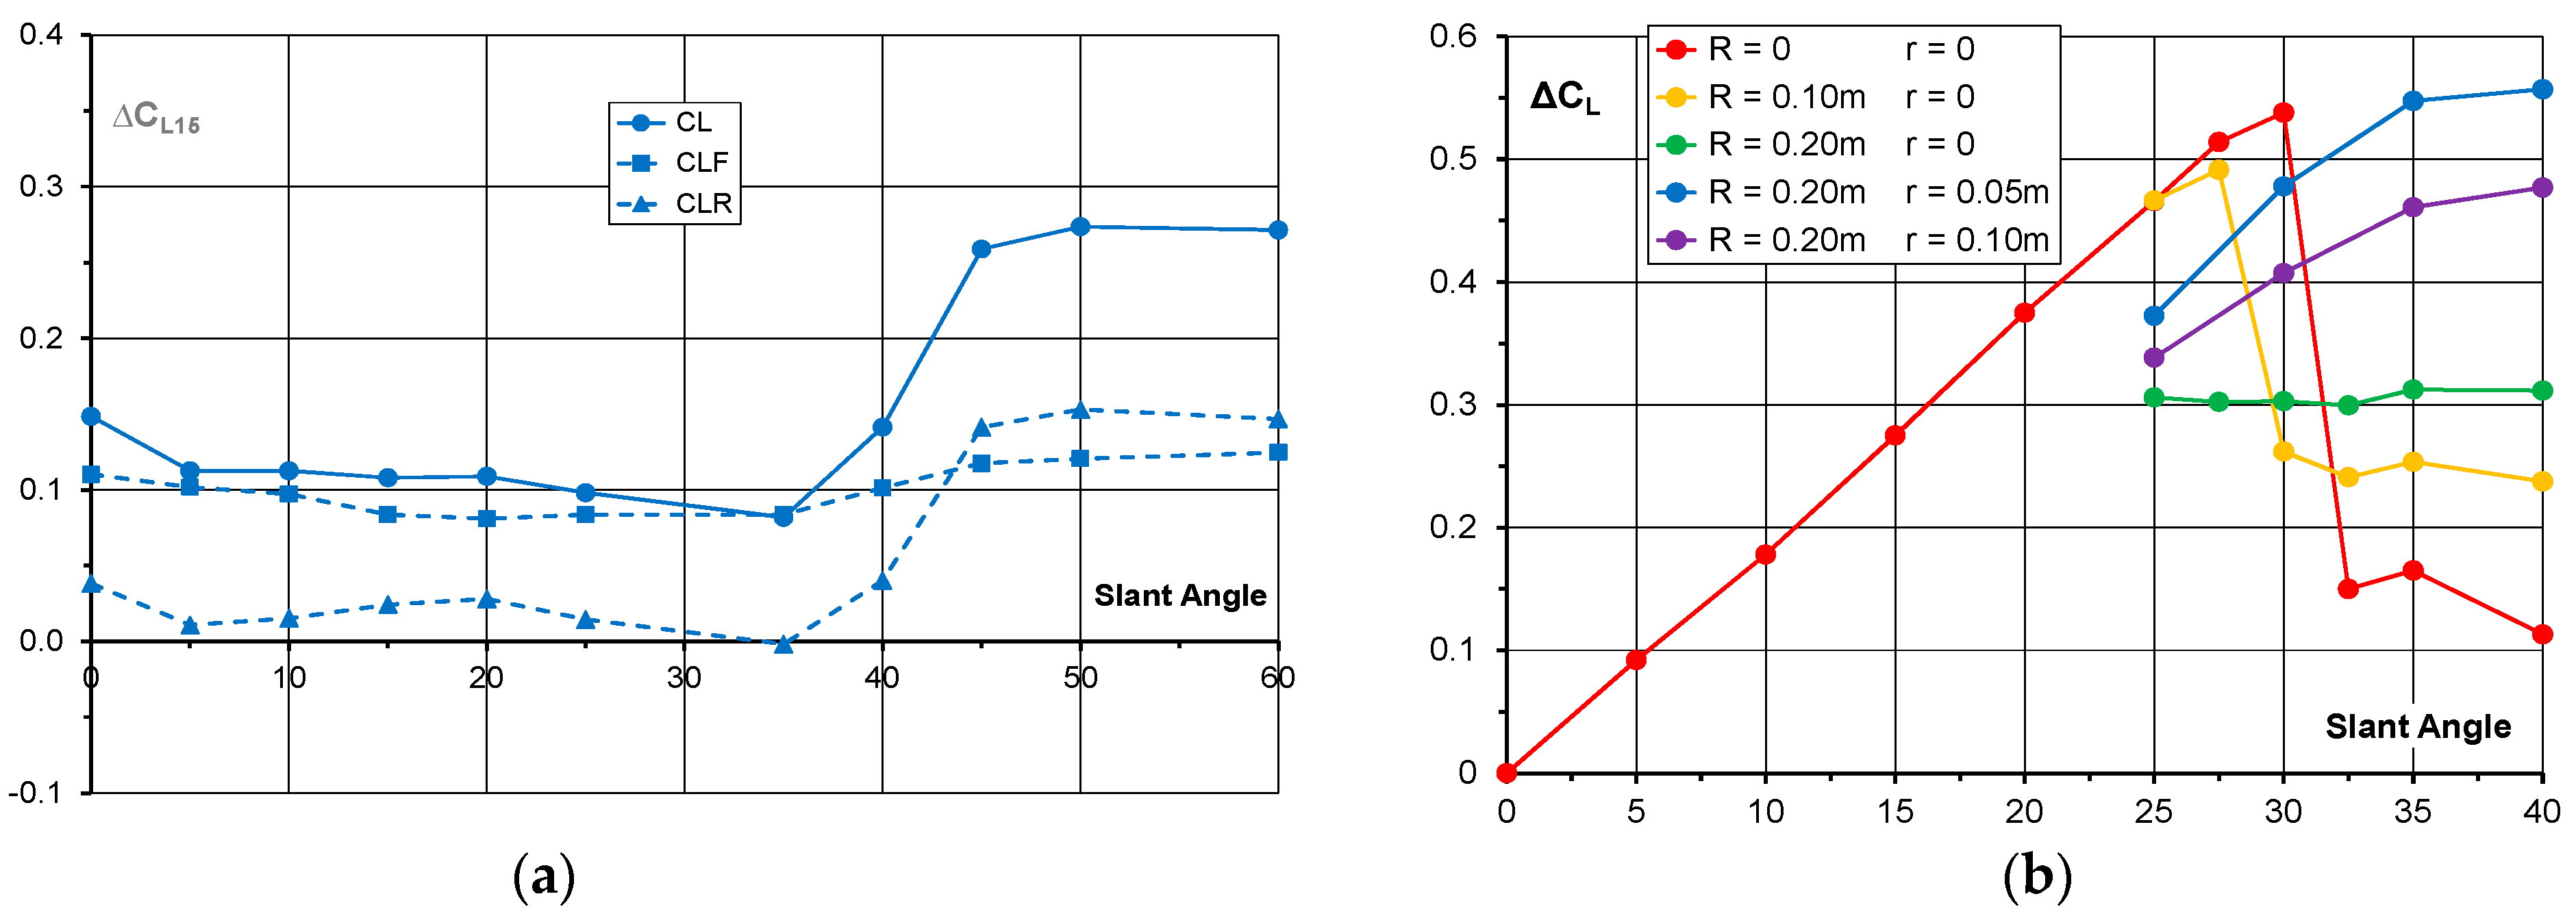
Figure 12 shows the increase in lift coefficient at yaw as a function of slant angle for the Tumblehome model. The increase in lift, ΔCL, is the change in lift between yaw angles of 0° and 15°. The increase in lift is fairly constant for slant angles from 5° to 35°. The slight reduction in lift rise with yaw as the slant angle increases is consistent with the behaviour noted in Figure 6b comparing squareback and fastback variants of the VGM model, but it differs from that shown for the sharp-edged Windsor Body. As shown by the Windsor Body, the lift rise with yaw is increased for post-critical slant angles. While for the Windsor Body, this increase is over a narrow range of slant angles, with the Tumblehome model, the lift increase with yaw rises to a peak when the slant angle is between 50° and 60°, the limit of the available data, but persists over a wider range of slant angles.
It is unclear whether it is the edge rounding or the tumblehome which creates the significantly different lift characteristics at high slant angles between the Windsor Body and the Tumblehome model. Measurements were taken on the Windsor Body with rounded edges on the slant surface for a limited range of slant angles from 25° to 40°. These tests were conducted at 0° yaw. The increase in lift coefficient, relative to the squareback configuration, is shown in Figure 12b for various combinations of edge radii. The radius on the slant leading edge is denoted by R and the radius of the side edges by r. With the side edges kept sharp and the slant leading-edge radius, R = 0.10 m, the lift is essentially the same as for the sharp-edged body but the critical angle is slightly less and the post-critical lift is increased. On increasing the leading-edge radius to R = 0.20 m, the lift coefficient is approximately constant for all slant angles, suggesting that the flow is always separated on the slant for the tested slant angles. With the leading-edge radius of 0.20 m, side edge radii of 0.05 and 0.10 m were applied. As the edge radius is increased, the increase in lift with slant angle and the maximum lift is reduced but the critical angle is increased above a slant angle of 40°, the maximum slant angle tested. This shows that it is the edge rounding which is primarily responsible for the changes shown in Figure 11 for the Tumblehome model. It is possible that these results will be affected by Reynolds number.
3.3.4. Notchback
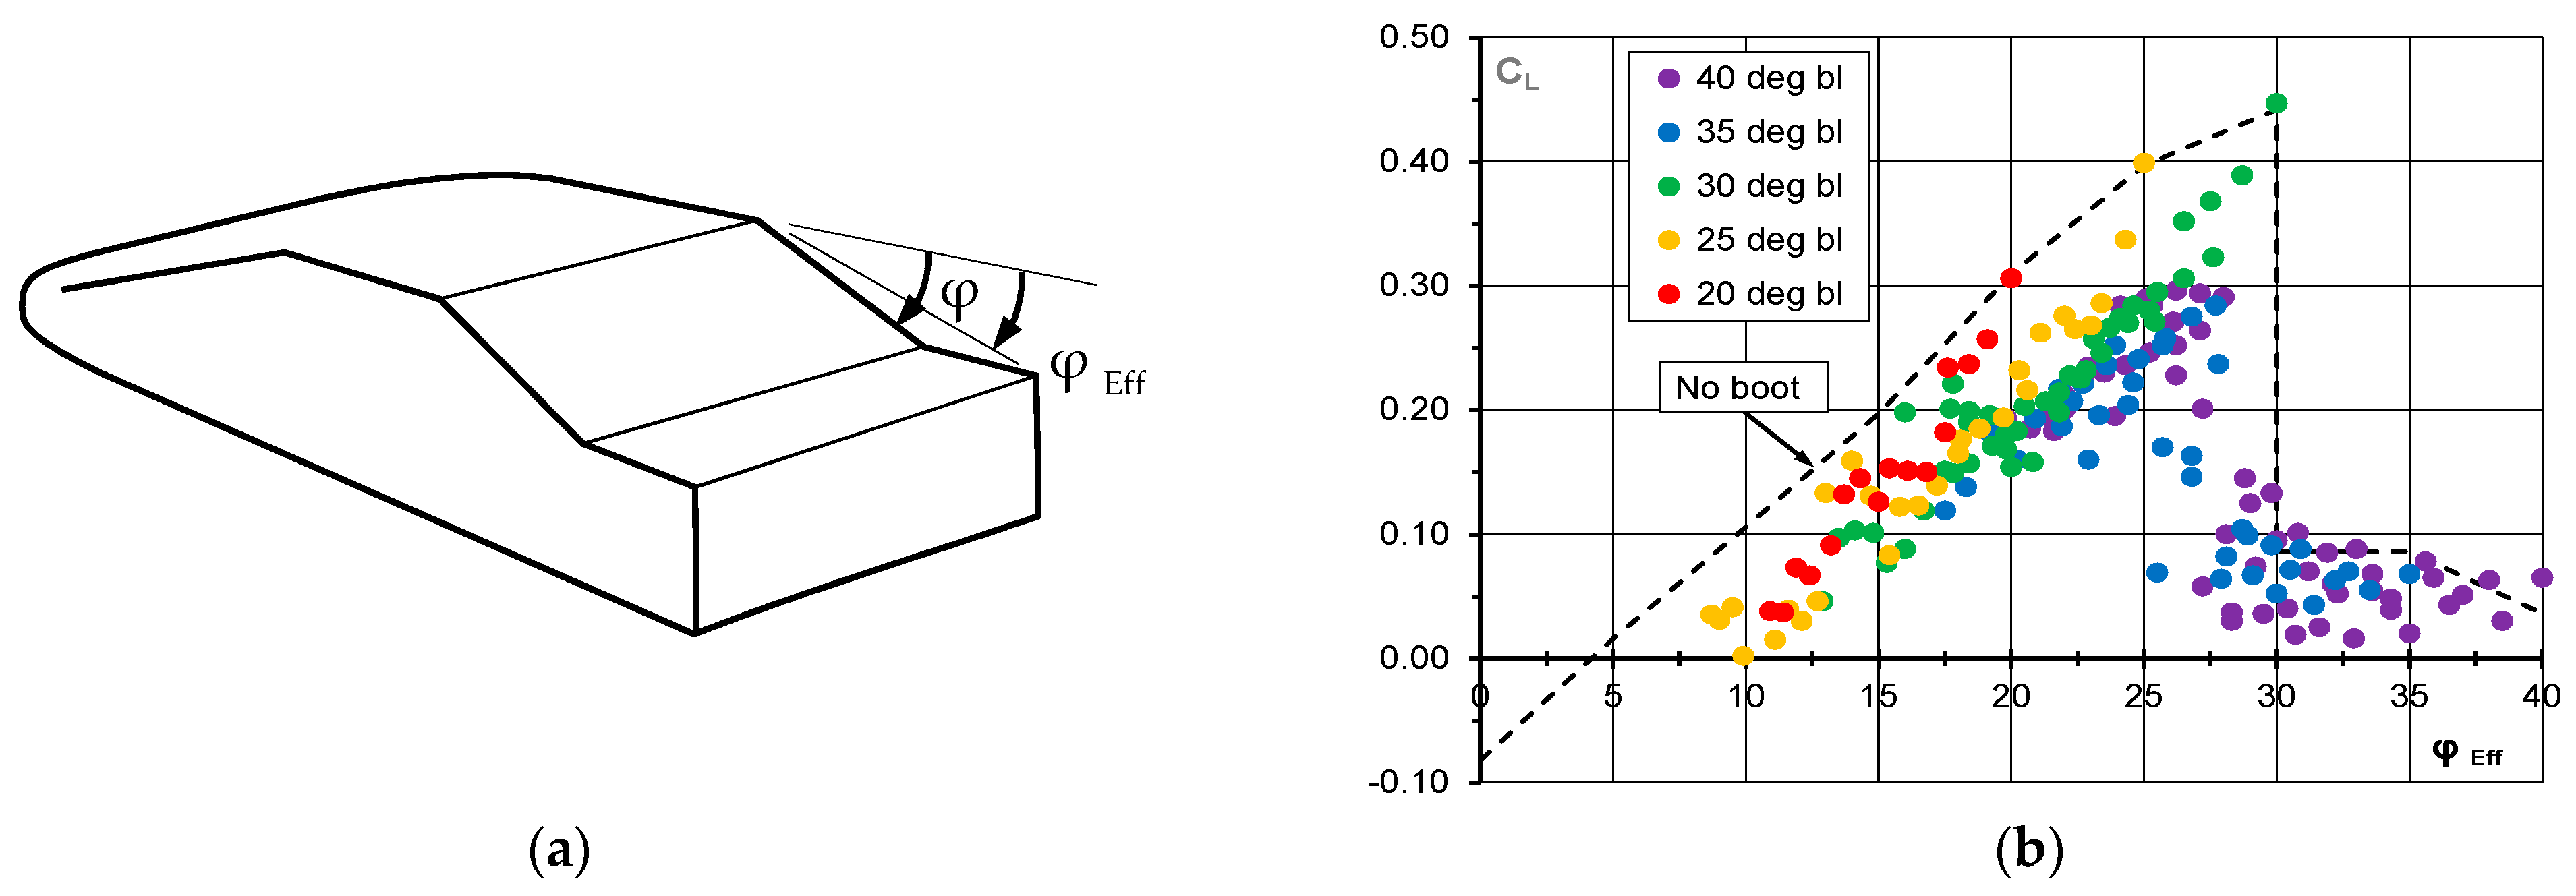
The Windsor Body has also been tested with boot extensions to create a notchback geometry. The basic geometry is sketched in Figure 13a. All trailing edges were sharp, as were the roof trailing edge and the backlight side edges. The underfloor was flat to the boot trailing edge and the upper surface of the boot extension was always flat. The backlight angle is denoted by φ and an effective backlight angle, φEff, is defined by the angle of an imaginary line joining the roof trailing edge and the boot trailing edge to the horizontal. This model was tested in the MIRA MWT at the time it was a closed-jet wind tunnel and blockage corrections have been applied.
Figure 13b shows the lift coefficient as a function of the effective backlight angle for the range of backlight angles, where the backlight is denoted by bl. The backlight angles vary from 20° to 40° and all the data, with very few exceptions where the backlight angle is just post-critical, are within an envelope formed by the bootless configuration, (i.e., the effective backlight angle = the backlight angle). This implies that the addition of a boot always reduces the lift.
The boot trailing edge was located in 0.010-m steps both rearwards and upwards from the slant surface trailing edge. Although not directly identified on the graph, these initial small incremental changes to the standard body with pre-critical slant angles show a significant reduction in lift. For larger boot sizes, a significant body of the data shows lift increasing approximately linearly with effective backlight angle and at the same rate as for the standard bootless body with backlight angle. It is also apparent that the addition of a boot to the post-critical backlight angles of 35° and 40° can make the separated flow from the roof trailing edge reattach to the boot surface and generate comparable lift coefficients to the pre-critical configurations.
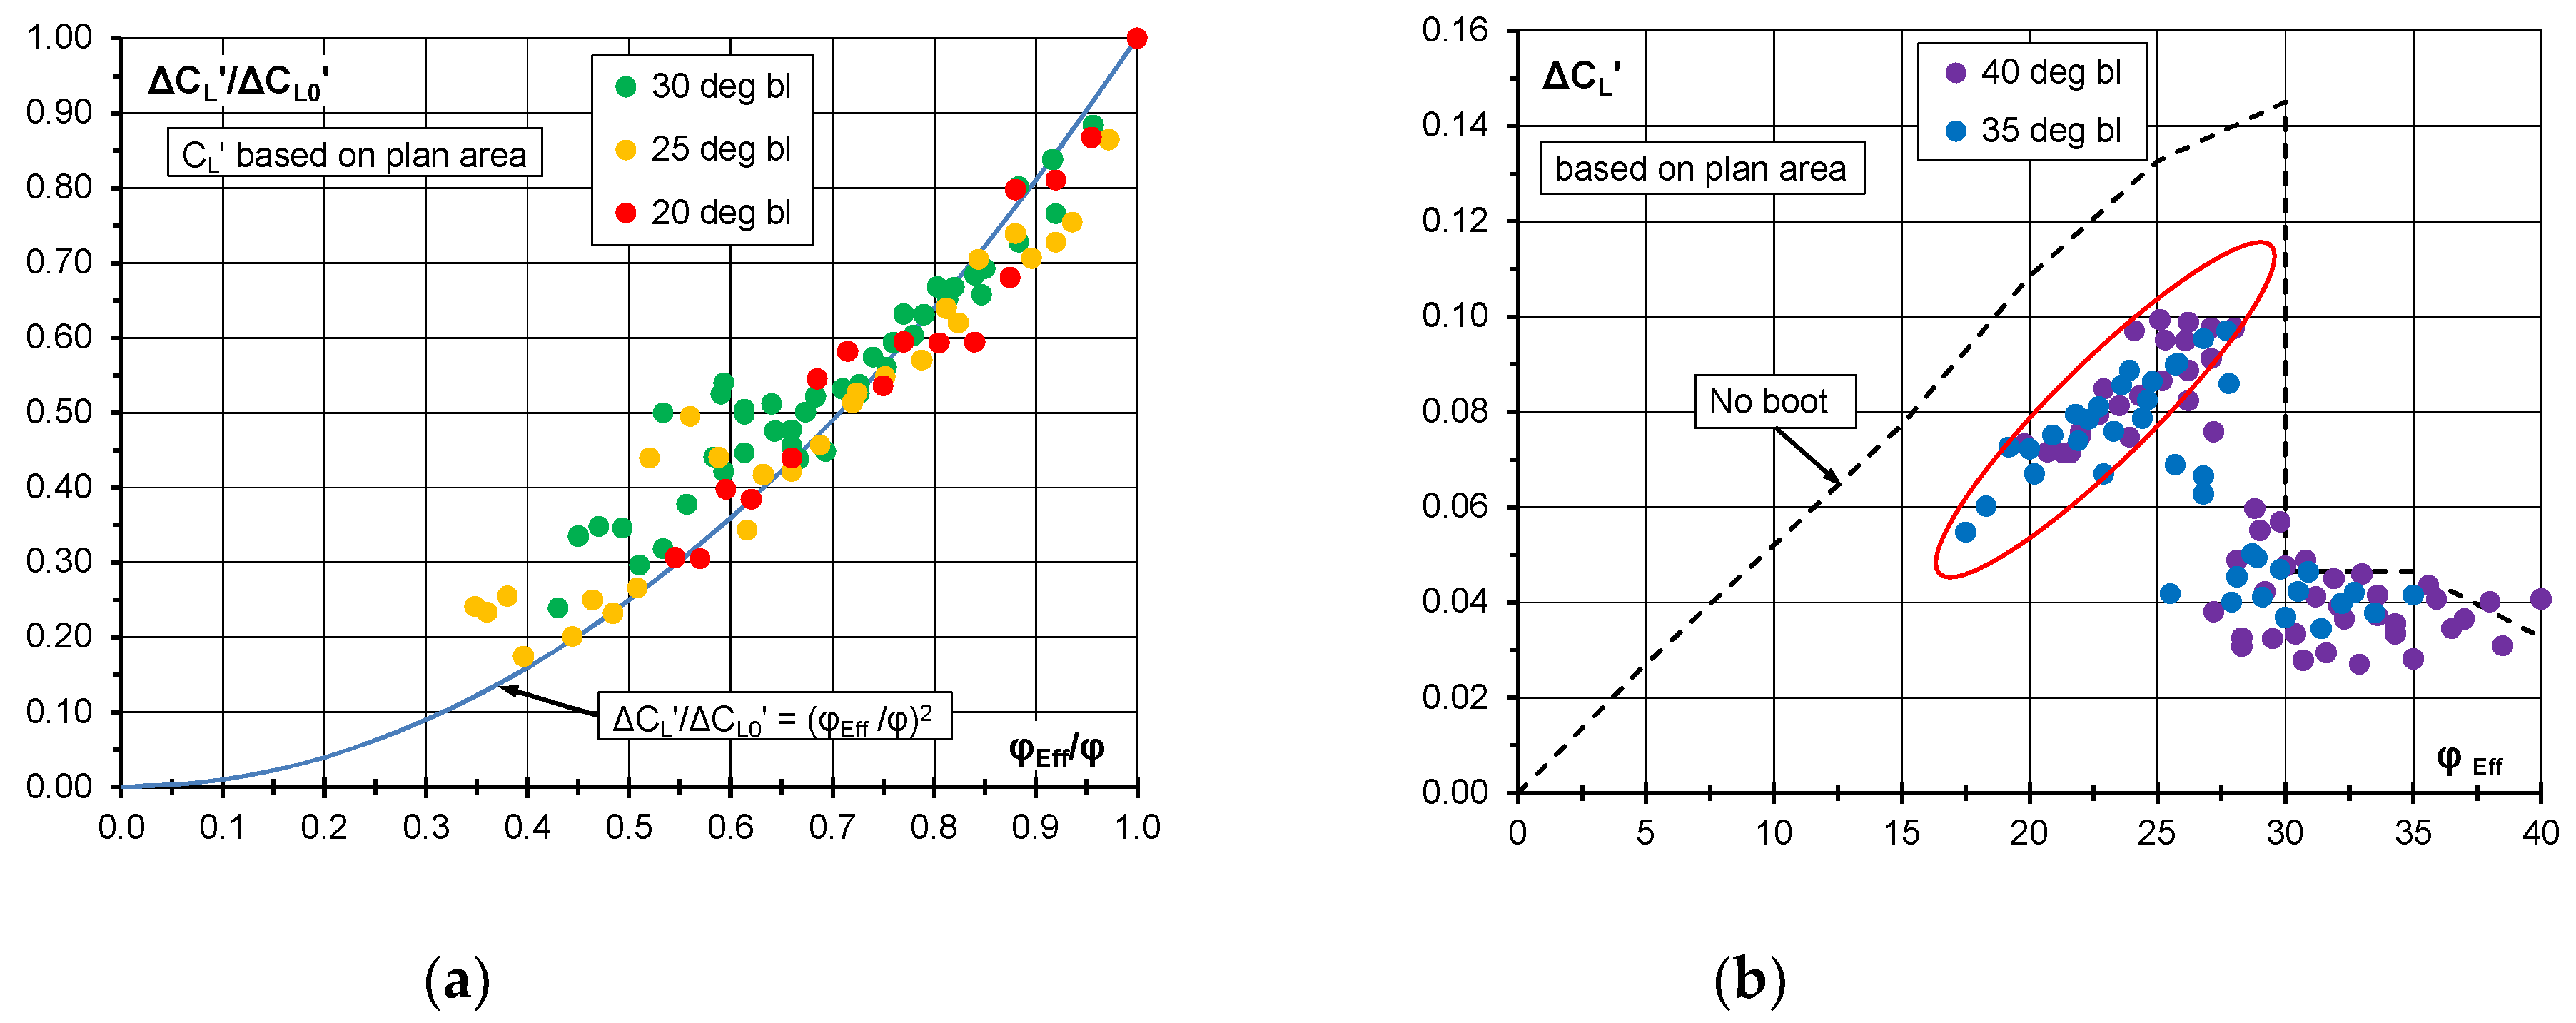
An attempt to rationalise the lift of the booted Windsor Body in relation to the standard body is shown in Figure 14. Because the boot length extends the body, the lift coefficients are based on the plan area and denoted by CL′. The increase in lift coefficient relative to the squareback body is denoted by ΔCL′, and in Figure 14a, it is presented as a ratio to the lift coefficient increase for the standard unbooted body with the same backlight angle, ΔCL0′, for the pre-critical backlight angles, 20°–30°. Figure 14a shows that the lift increase for the notchback configuration relative to the squareback case is approximately given by:
ΔCL′/ΔCL0′ = (φEff/φ)2
For the booted configurations where the backlight angle would normally be post-critical, a reference lift coefficient cannot be defined. Figure 14b shows that the increase in the lift coefficient for the notchback configurations where the flow is attached to the boot, indicated by the data within the red boundary, is approximately given by:
where, in this case, ΔCL0″ is the increase in the lift coefficient for an unbooted configuration with the same backlight angle as the effective backlight angle for the booted case. It can also be seen from Figure 14b that the critical angle between the attached and separated backlight flow is less than the critical angle for the unbooted configurations.
ΔCL′ = ΔCL0″ − k
3.4. Roof Curvature
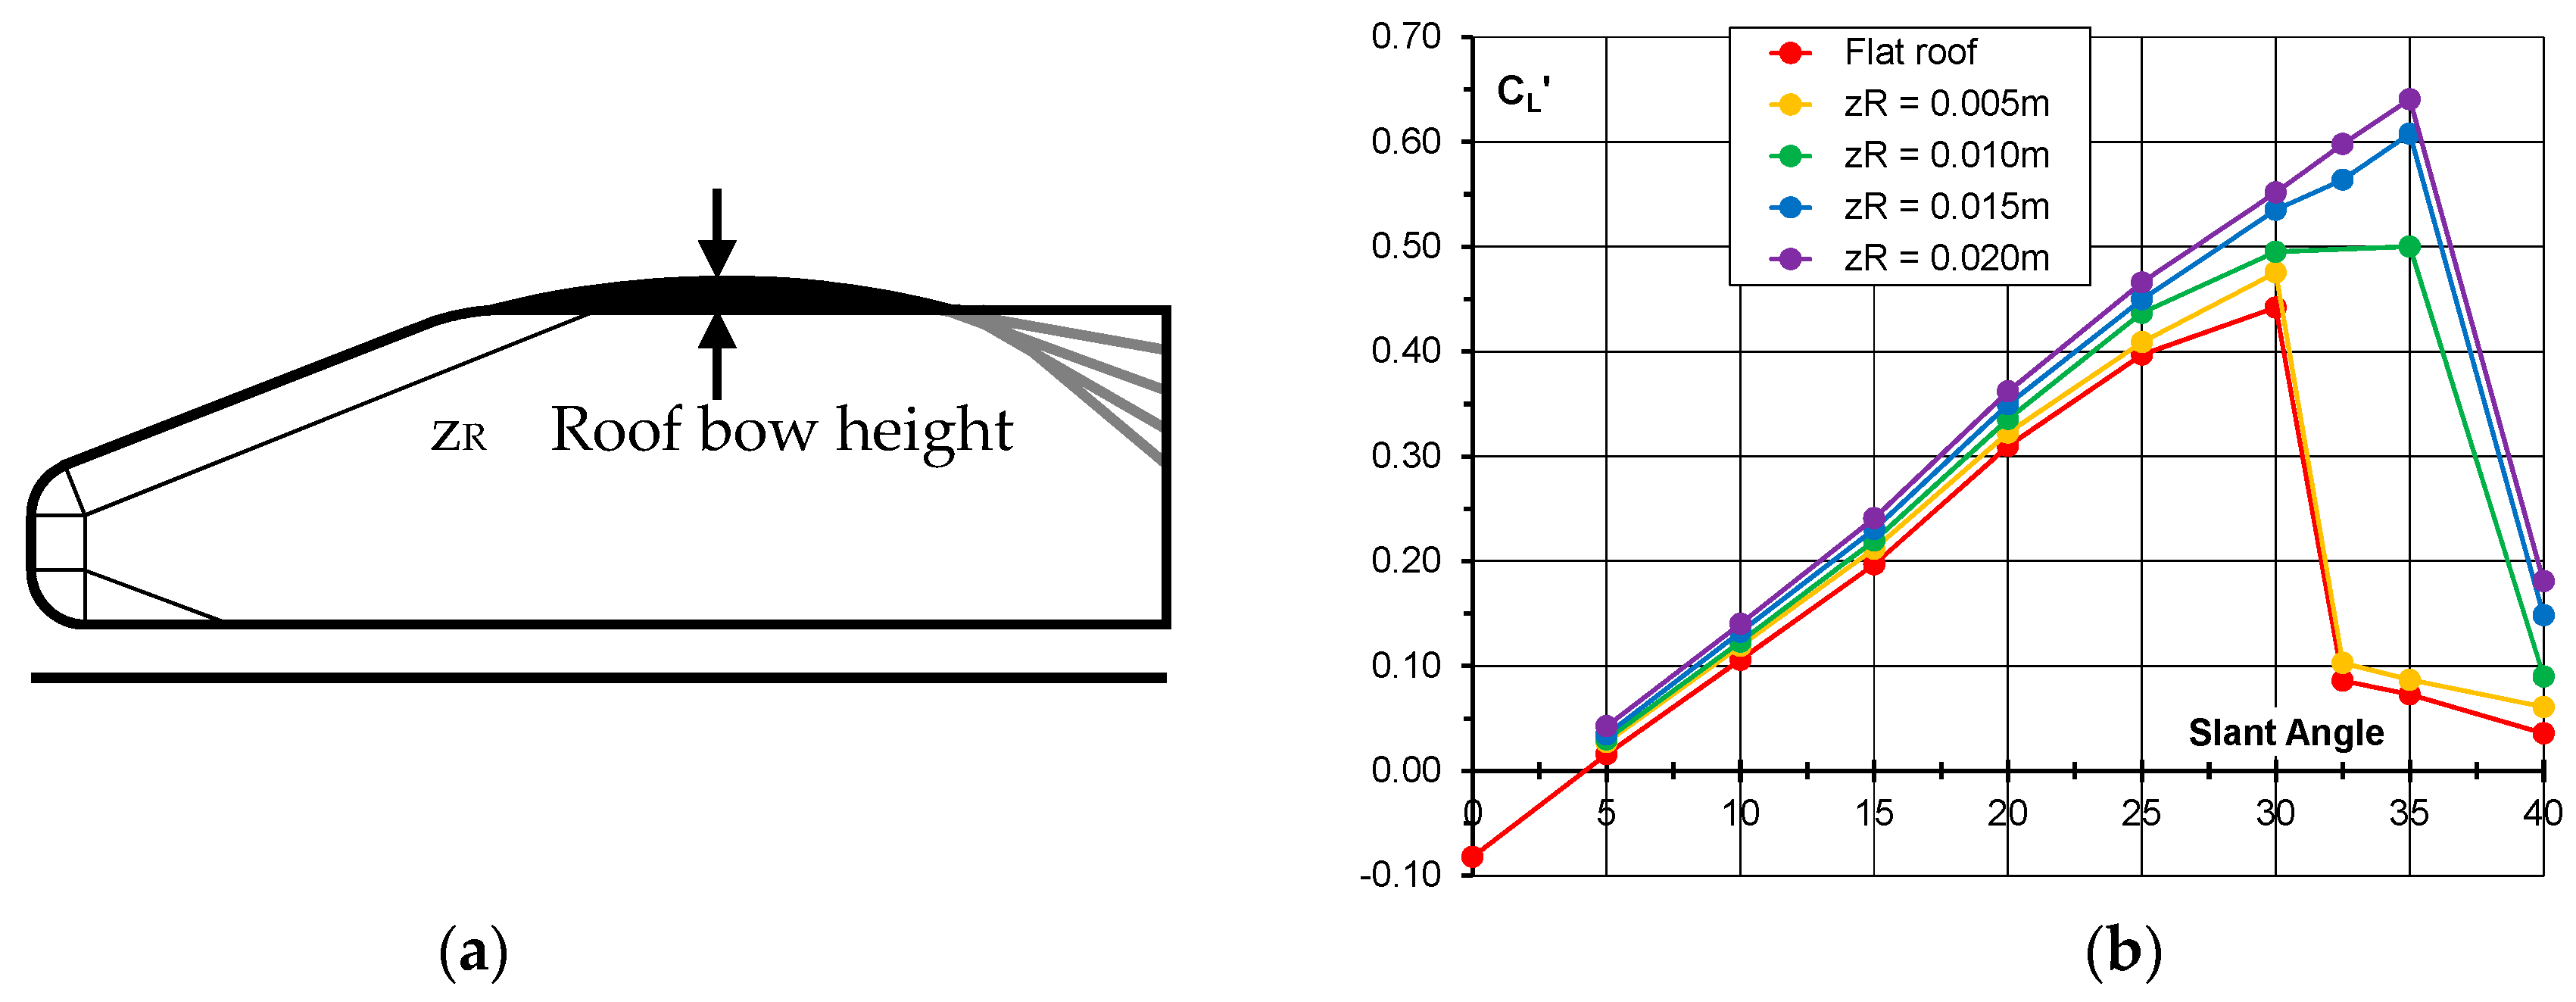
Curved roof profiles have been added to the standard flat roof Windsor Body. All add-on roof sections were the same length and each had a constant radius of curvature as shown in Figure 15a. The maximum thickness of the add-on roof section is denoted by zG. The trailing edge of the roof bow section was aligned with the leading edge of the slant surface. The leading edge of the roof bow was faired into the front surface of the roof with tape. The slant edges were all sharp for the data presented. The effect on the lift coefficient as a function of slant angle for the range of roof curvatures is shown in Figure 15b. The lift coefficients are, in this case, all based on the frontal area of the standard body with a flat roof as this is a measure of the lift increase.
If the coefficients were based on actual frontal area, the increments would still be positive, but smaller. The lift increase arising from the roof curvature increases with increasing slant angle. With the exception of the smallest roof bow case, the introduction of roof curvature also shifts the critical angle higher.
4. Discussion
4.1. Shape and Drag
As stated in the Introduction, the primary task of the car development aerodynamicist is to reduce drag without compromising stability. For most passenger cars, this will always prioritise drag over lift, but it cannot mean that lift is ignored. In an ideal development process, shape changes which reduce drag would also result in desirable overall lift and distribution of lift, but this rarely occurs in practice and compromises will be required. If the reader is interested in the drag effects from the shape changes discussed in this paper, they can be found in the following references. The drag of the rectangular blocks was discussed in [11]; the effect on drag for front-end rounding in [12]; the influence on drag of front-end design on the MIRA VGM and the effect of slant angle on the standard Windsor Body in Howell et al. [14]; the effect of slant aspect ratio on drag can be found in [2]; the effect of slant surface edge rounding for the Tumblehome model and the Windsor Body on drag was discussed in Howell [15]; and for the effects of adding a boot and roof curvature on Windsor Body drag, see Howell [16].
4.2. Other Lift Factors and Considerations
With current Design trends, lift characteristics are relatively benign, although the achievement of a beneficial lift balance can be more problematic, but the potential for high lift coefficients is apparent from the results in this paper. Although many cars will not be driven at high speed as they operate in countries with speed restrictions, they have a high performance capability and can potentially be driven at their maximum speed. The result is that all cars must meet the lift targets regardless of the market that they operate in. Typically, for a passenger car with reasonable performance, overall lift coefficients should not exceed 0.2 and the difference between front and rear axle lift coefficients should be less than 0.1. Where possible, the lift targets should be achieved through the basic shape and not rely on add-ons for cost and aesthetic reasons. Only high-performance derivatives would then require add-ons if necessary to meet their more restrictive lift requirements.
In general, the influence of lift is realised as a comfort parameter in that with good lift characteristics, the car feels better to drive. However, there are occasions where the influence becomes a safety issue. A safety critical situation only arises at very high speed and occurs, for example, where the aerodynamic lift on an axle of a car at yaw due to a crosswind approaches the mass on the axle. The reduced tyre grip can allow a dynamic yaw angle to develop, exacerbating the lift and creating an unstable situation. This could, potentially, happen with high rear lift on a lightly loaded rear axle, i.e., a front engine car, or with high front lift on a lightly loaded front axle, but, fortunately, such an event is extremely rare.
The results shown in this paper suggest that overall lift is fairly insensitive to major shape changes, except at the rear of the car. However, only upper body shape changes have been considered; the area of the car for which design has the major influence and a consequence of this insensitivity is that the aerodynamics development engineer cannot significantly alter the lift characteristics by modifying the style. However, the aerodynamic lift on passenger cars is not similarly insensitive and lift can be affected by many other components and features. These factors are discussed below. It is not an exclusive list, but includes most of the major influences.
The efficient placement for a cooling pack is in the front of the car. In this location, the cooling airflow has a significant effect on lift as the engine bay becomes pressurised. This increases front axle lift, but also decreases rear axle lift. The change is crudely dependent on the size of the open intake.
Cars have progressively adopted aerodynamically refined underfloors, predominantly for drag reduction. Lift is also reduced, but the lift distribution is dependent on the detail floor design. When underfloors were rough, a diffuser section between the rear axle and the rear bumper had little effect, but with the trend to better underfloor design, a diffuser can reduce overall lift with the load concentrated at the rear axle.
This trend has also seen the once ubiquitous bib spoiler beneath the front bumper become increasingly redundant. This simple aerodynamic aid was a very cheap and effective way to reduce drag, by reducing the flow energy passing over the rough underfloor, but it also reduced lift substantially and improved cooling airflow. The bib spoiler also deflected air away from the front wheels, reducing wheel drag, and this function is now performed by wheel spoilers mounted at the front edge of the wheelarch. These reduce the pressure inside the wheelarch, reducing lift. With regard to wheels and tyres, wider tyres tend to increase lift, while open wheel designs reduce lift by relieving the pressure between the wheels.
Spoilers at the rear of passenger cars are used to control drag and lift, as discussed in [1]. For hatchbacks with an upright tailgate, a spoiler at the top of the tailgate will reduce drag if angled downwards, but increase lift, although this squareback shape in general has low rear axle lift. For fastback shapes and saloon cars, where the airflow is attached to the boot, a spoiler at the boot trailing edge or a boot mounted aerofoil will reduce lift. The change to drag will depend on the height of the boot in relation to the optimum.
Lift is also affected by other factors. With regard to the ride height of the car, lift is not significantly changed with ground clearance over the normal operating range for cars, but lift is strongly affected by pitch attitude. For a negative (nose-down) pitch angle, front axle lift is reduced and rear axle lift increased slightly, giving a reduction in overall lift.
All the wind tunnel tests reported in this paper were conducted using a fixed ground surface, which was the normal procedure for all automotive aerodynamics testing at the time many of the experiments were undertaken. As the paper only considers changes in upper body shape, this is acceptable. Extensive testing to establish the effects of using a moving belt for ground simulation have been carried out with both the Windsor Body [17] and the MIRA VGM model [18], in the MIRA MWT. In [17], Howell measured lift and drag on the Windsor Body, with a range of diffuser and backlight angles, using a moving and stationary belt. In [18], Howell and Hickman used the MIRA VGM with a range of different rear-end shapes, with and without cooling airflow and underbody roughness to investigate the effects of moving and stationary belt ground simulation on lift and drag. Although the trends for lift were very similar, there were differences in absolute values, but both studies show that the effects of ground simulation would not be significant for the shape changes explored in this paper.
4.3. Influence of Camber-Line
The concept of a camber-line and its influence on changes in lift was advanced in the Introduction. It would be interesting to see if the suggestion that changes in lift can be explained by changes in camber and incidence is supported by the results presented in this paper. For the front-end shape changes, with the exception of the vertical windscreen case, the incidence is identical and the camber is very similar, implying negligible change in lift, which is shown by the data. In the case of the rear-end shape changes, an increasing slant angle increases both camber and incidence, which suggests that lift will increase, as shown by the results for pre-critical slant angles. It should be noted, however, that the lift is enhanced by the slant edge vortices, which are not considered in the simple theory. For the notchback configurations, raising the boot trailing edge reduces camber and incidence, implying lift reduction, which is what occurs. Extending the boot rearwards, however, creates negligible change in both camber and incidence, which implies no change in lift, but the data show a reduction in lift. For increasing roof curvature, camber is increased while incidence is unchanged, which suggests a lift increase, as shown by the data.
In general, the theory seems to apply but there are exceptions. It should be remembered that it is essentially a 2D concept and the effect of side edges are not considered. In addition, it assumes attached flow and cannot account for separations. Post-critical rear slant angles and notchback configurations with extensive separated flow from the roof trailing edge are outside its scope.
4.4. Lift at Yaw
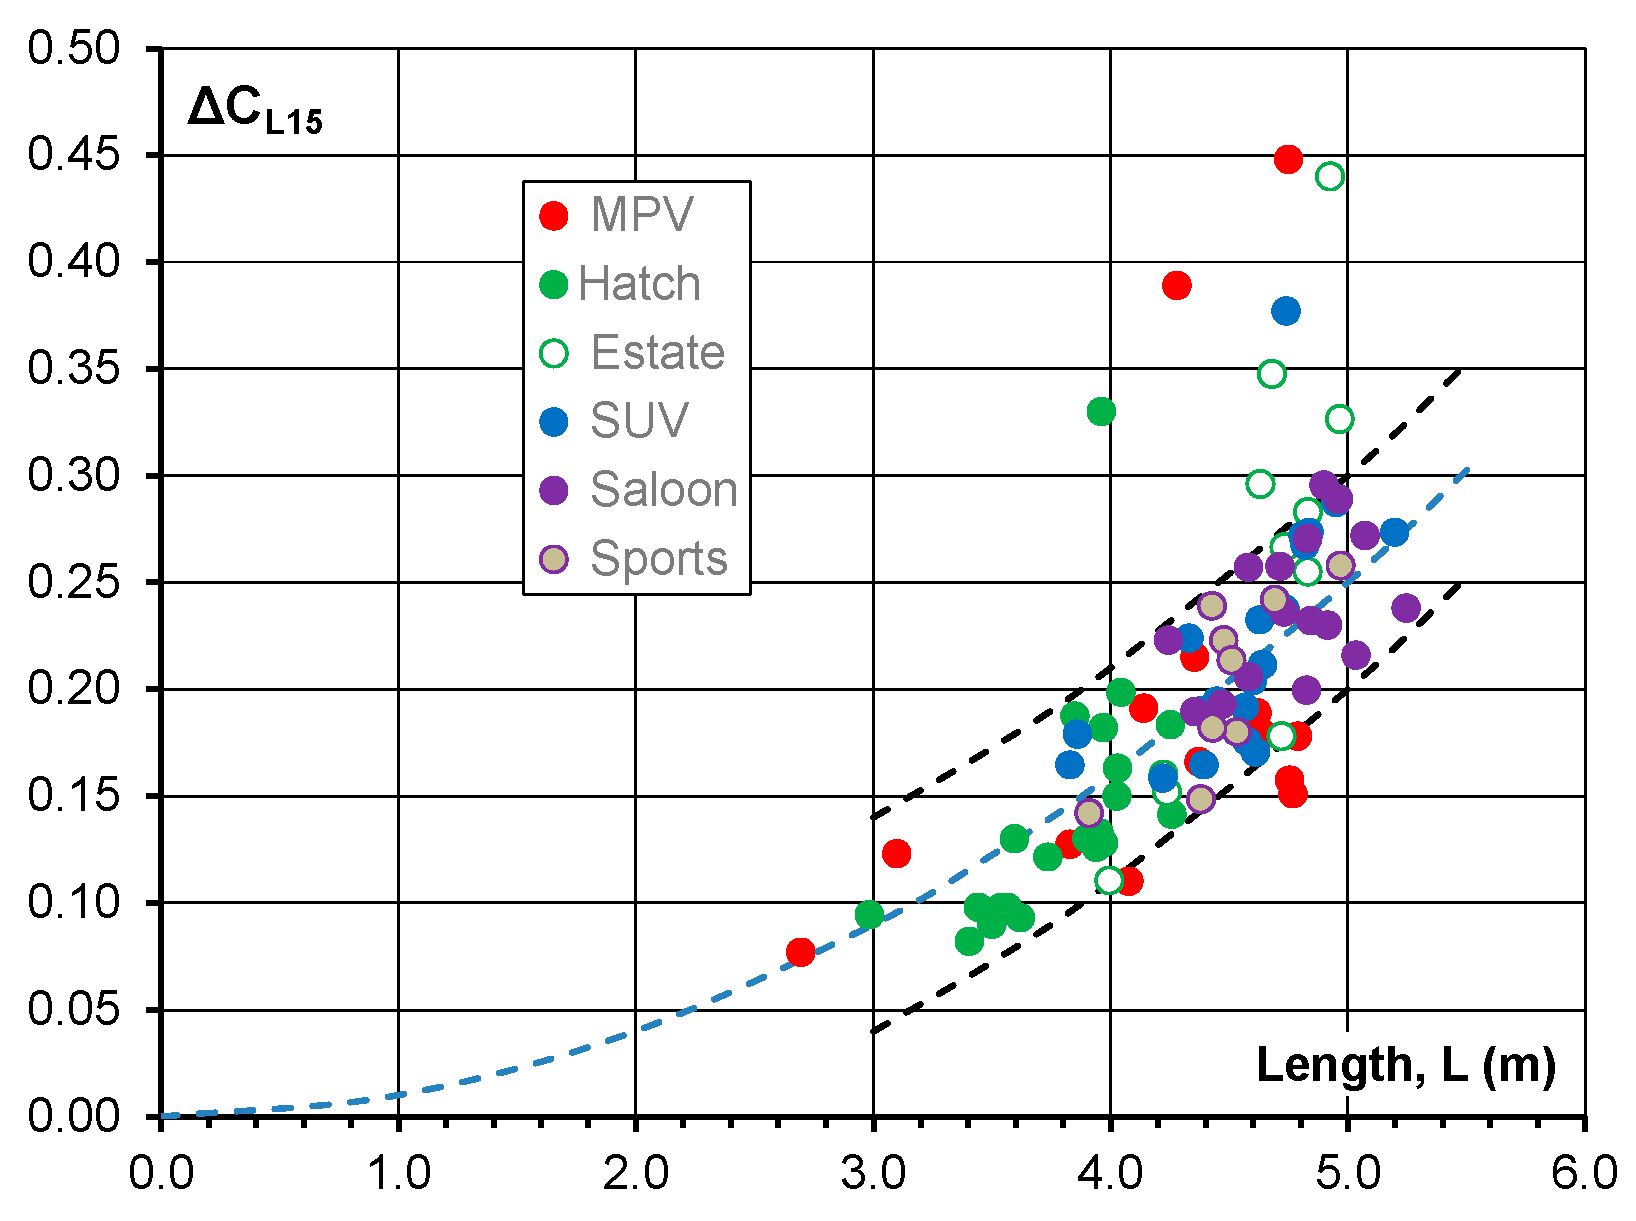
It is surprising that lift is insensitive to some major shape changes, but it is more remarkable that lift increase with yaw is very similar for almost all the configurations investigated in this paper. The lift at yaw data for a saloon car model with extensive configuration changes reported by Carr [4] show a similar result. The only significant exceptions were for the introduction of squared edges in certain areas of the body. For the same reasons discussed in Section 4.2 above, the results presented in this paper do not mean that all cars will have the same lift increase characteristics at yaw. Some small components and local changes to edge conditions can have an effect on lift at yaw by the action of flow interference and separation. However, from full-scale tests on a wide range of cars, shown in Figure 16, it can be seen that, even with this variability, the increase in lift at yaw is broadly similar.
All the wind tunnel tests were conducted in the MIRA Full Scale Wind Tunnel (FSWT) and represent a consistent dataset. The data are for approximately 80 cars of different types and are essentially the same dataset as used in the study of side force by Howell and Panigrahi [19]. The tunnel is a fixed ground wind tunnel and the tests were conducted at a nominal wind speed of 27 m/s. The plot shows the increase in lift from 0° to 15° yaw angle as a function of overall car length. Length is one parameter that was not significantly varied in any of the investigations reported in this paper, except for the basic rectangular blocks, which were not tested at yaw.
Although there is a broad spread of data, they suggest that the increase in the lift coefficient at yaw is increased with length2, as shown by the dashed lines. As the coefficient is based on frontal area, then, the lift rise is increased with height and width, but width varies insignificantly for all the cars tested. The data have not been interrogated for any shape features other than the overall vehicle dimensions, but the high lift outliers in Figure 16 are all cars with post-critical backlights.
5. Conclusions
The effect of large-scale upper body shape changes on the aerodynamic lift of passenger cars has been investigated in small-scale wind tunnel tests on a range of simple bodies.
Large-scale shape changes in the front of a car have a negligible effect on overall lift, although the lift balance between front and rear axles varies.
Lift is strongly influenced by the shape of the upper rear body. In particular, increasing the slant angle of the roof or backlight increases lift and is enhanced through the action of the edge vortices. Modifications to the leading and side edges of the surface can have a significant effect.
For the basic shapes tested in this paper, a simple relationship has been established between notchback and fastback geometries for bodies where the airflow is attached to the boot surface.
In general, for most of the cases in this study, changes in lift are qualitatively determined by changes to the camber-line.
The increase in lift at yaw is surprisingly insensitive to shape change for the large-scale shape changes investigated in this paper. This has some support from full-scale wind tunnel tests on real cars.
In reality, lift is affected by factors other than upper body shape and can be manipulated by small features and components which modify separation points or create interference effects.
Author Contributions
Formal analysis, J.H., S.W.; investigation, S.W., J.H., M.P.; writing—original draft preparation, J.H.; writing—review and editing, J.H., M.P., S.W.; supervision, M.P.; All authors have read and agreed to the published version of the manuscript.
Funding
This research received no external funding.
Data Availability Statement
The data are mostly available on request from the corresponding author except for that which is commercially sensitive.
Conflicts of Interest
The authors declare no conflict of interest.
References
- Howell, J.P.; Le Good, G.M. The Influence of Aerodynamic Lift on High Speed Stability. SAE Tech. Pap. 1999, 1, 0651. [Google Scholar]
- Howell, J.P.; Le Good, G.M. Effect of Backlight Aspect Ratio on Vortex and Base Drag for a Simple Car-Like Shape. SAE Tech. Pap. 2008, 1, 0737. [Google Scholar]
- Howell, J.P.; Baden Fuller, J. A Relationship between Lift and Lateral Aerodynamic Characteristics for Passenger Cars. SAE Tech. Pap. 2010, 1, 1025. [Google Scholar]
- Carr, G.W. The Aerodynamics of Basic Shapes for Road Vehicles. Part 2: Saloon Car Bodies; MIRA Report No. 1968/9; MIRA: Nuneaton, UK, 1968. [Google Scholar]
- Gilhaus, A.M.; Renn, V.E. Drag and Driving Stability Related Aerodynamic Forces and their Interdependence—Results of Measurements on 3/8-Scale Basic Car Shapes. SAE Tech. Pap. 1986, 95, 1047–1062. [Google Scholar]
- Hucho, W.-H. (Ed.) Aerodynamics of Road Vehicles, 4th ed.; SAE R-177; SAE International: Warrendale, PA, USA, 1998; ISBN 0-7680-0029-7. [Google Scholar]
- Schütz, T. (Ed.) Aerodynamics of Road Vehicles, 5th ed.; SAE R-430; SAE International: Warrendale, PA, USA, 2016; ISBN 978-0-7680-7977-7. [Google Scholar]
- Morelli, A. Theoretical Method for Determining the Lift Distribution on a Vehicle; FISITA Congress: Tokyo, Japan, 1964. [Google Scholar]
- Carr, G.W.; Atkin, P.D.; Somerville, J. An Empirically Based Prediction Method for Car Aerodynamic Lift and Side Force. In Proceedings of the RAeS Vehicle Aerodynamics Conference, Loughborough University, Loughborough, UK, 18–19 July 1994. [Google Scholar]
- Carr, G.W. Wind Tunnel Blockage Corrections for Road Vehicles; MIRA Report No. 1971/4; MIRA: Nuneaton, UK, 1971. [Google Scholar]
- Howell, J.P. Force and Wake Characteristics of Simple Bluff Bodies in Ground Proximity. In Proceedings of the ASME Conference—Aerodynamics of Transportation, Niagara Falls, NY, USA, 18–20 June 1979. [Google Scholar]
- Newnham, P.S. The Influence of Real World Turbulence on the Aerodynamic Optimisation of Bluff Body Road Vehicles. Ph.D. Thesis, Loughborough University, Loughborough, UK, 2007. [Google Scholar]
- Pavia, G. Characterisation of the Unsteady Wake of a Squareback Road Vehicle. Ph.D. Thesis, Loughborough University, Loughborough, UK, 2019. [Google Scholar]
- Howell, J.; Passmore, M.; Windsor, S. A Drag Coefficient for Test Cycle Application. SAE Tech. Pap. 2018, 1, 0742. [Google Scholar] [CrossRef]
- Howell, J.P. Shape Features which Influence Crosswind Sensitivity. In Proceedings of the Ride and Handling Conference, Birmingham, UK, 15–17 November 1993; Paper C466/036/93. IMechE: London, UK, 1993. [Google Scholar]
- Howell, J. Shape and Drag. In Euromotor: Using Aerodynamics to Improve the Properties of Cars; FKFS: Stuttgart, Germany, 1998. [Google Scholar]
- Howell, J.P. The Influence of Ground Simulation on the Aerodynamics of Simple Car Shapes with an Underfloor Diffuser. In Proceedings of the RAeS Vehicle Aerodynamics Conference, Loughborough University, Loughborough, UK, 18–19 July 1994. [Google Scholar]
- Howell, J.P.; Hickman, D. The Influence of Ground Simulation on the Aerodynamics of a Simple Car Model. SAE Tech. Pap. 1997, 1, 970134. [Google Scholar]
- Howell, J.; Panigrahi, S. Aerodynamic Side Forces on Passenger Cars at Yaw. SAE Tech. Pap. 2016, 1, 1620. [Google Scholar]
Figure 1.
Camber and incidence for car shapes.

Figure 2.
Simple rectangular blocks.

Figure 3.
Lift coefficient for the range of rectangular blocks as a function of ground clearance; (a) lift coefficient based on frontal area, (b) lift coefficient adjusted for plan area.
Figure 3.
Lift coefficient for the range of rectangular blocks as a function of ground clearance; (a) lift coefficient based on frontal area, (b) lift coefficient adjusted for plan area.

Figure 4.
(a) Model used by Newnham [12]; (b) Lift coefficients as a function of leading-edge radius.
Figure 4.
(a) Model used by Newnham [12]; (b) Lift coefficients as a function of leading-edge radius.

Figure 5.
MIRA VG Model.

Figure 6.
(a) Lift coefficient at 0° yaw as a function of windscreen angle for the range of front-end shapes; (b) Lift coefficient at yaw for the squareback and notchback shapes.
Figure 6.
(a) Lift coefficient at 0° yaw as a function of windscreen angle for the range of front-end shapes; (b) Lift coefficient at yaw for the squareback and notchback shapes.

Figure 7.
(a) Front and rear axle lift coefficient at 0° yaw as a function of windscreen angle for the range of front-end shapes. (b) Front and rear axle lift coefficients as a function of yaw angle for the squareback shape with a rough underfloor.
Figure 7.
(a) Front and rear axle lift coefficient at 0° yaw as a function of windscreen angle for the range of front-end shapes. (b) Front and rear axle lift coefficients as a function of yaw angle for the squareback shape with a rough underfloor.

Figure 8.
(a) Windsor Body; (b) Variation in lift coefficients as a function of rear slant angle.

Figure 9.
Lift coefficient for the Windsor Body. (a) Lift as a function of yaw angle for all slant angles; (b) Increase in lift coefficient at 15° yaw angle as a function of slant angle.
Figure 9.
Lift coefficient for the Windsor Body. (a) Lift as a function of yaw angle for all slant angles; (b) Increase in lift coefficient at 15° yaw angle as a function of slant angle.

Figure 10.
(a) Windsor Body showing slant surface; (b) Variation in lift coefficients with slant angle for different aspect ratios.
Figure 10.
(a) Windsor Body showing slant surface; (b) Variation in lift coefficients with slant angle for different aspect ratios.

Figure 11.
(a) Windsor Body and Tumblehome model showing cross-section; (b) Variation in lift coefficients with slant angle for standard Winsor Body and the Tumblehome model.
Figure 11.
(a) Windsor Body and Tumblehome model showing cross-section; (b) Variation in lift coefficients with slant angle for standard Winsor Body and the Tumblehome model.

Figure 12.
(a) Lift coefficient increase for the Tumblehome model at 15° yaw; (b) Effect of slant edge radii on lift of Windsor Body at 0° yaw.
Figure 12.
(a) Lift coefficient increase for the Tumblehome model at 15° yaw; (b) Effect of slant edge radii on lift of Windsor Body at 0° yaw.

Figure 13.
(a) Windsor Body with boot extensions; (b) Lift coefficient as a function of effective slant angle for a range of backlight angles.
Figure 13.
(a) Windsor Body with boot extensions; (b) Lift coefficient as a function of effective slant angle for a range of backlight angles.

Figure 14.
Lift coefficient increase for the notchback configurations relative to the squareback case for (a) pre-critical backlight angles, 20°–30°; (b) post-critical backlight angles, 35° and 40°.
Figure 14.
Lift coefficient increase for the notchback configurations relative to the squareback case for (a) pre-critical backlight angles, 20°–30°; (b) post-critical backlight angles, 35° and 40°.

Figure 15.
(a) Windsor Body with roof curvature; (b) Variation in lift coefficients with slant angle for range of roof curvatures.
Figure 15.
(a) Windsor Body with roof curvature; (b) Variation in lift coefficients with slant angle for range of roof curvatures.

Figure 16.
Lift increase at 15° yaw angle for a wide range of passenger cars.


Table 1.
Dimensions of simple rectangular blocks.
| Block | L (m) | W (m) | H (m) |
|---|---|---|---|
| 1 N | 0.325 | 0.1 | 0.1 |
| 2 N | 0.325 | 0.2 | 0.1 |
| 3 N | 0.325 | 0.3 | 0.1 |
| 4 N | 0.325 | 0.2 | 0.05 |
| 5 N | 0.325 | 0.2 | 0.025 |
| 6 N | 0.225 | 0.2 | 0.1 |
| 7 N | 0.425 | 0.2 | 0.1 |
Table 2.
Windscreen/bonnet angles for MIRA VGM.
| Model Type | Windscreen Angle° | Bonnet Angle° |
|---|---|---|
| 1-box | 90 | - |
| 60 | - | |
| 45 | - | |
| 35 | - | |
| 25 | - | |
| Notched front | 30 | 19 |
| 35 | 17 | |
| 40 | 15 |
Publisher’s Note: MDPI stays neutral with regard to jurisdictional claims in published maps and institutional affiliations. |
© 2021 by the authors. Licensee MDPI, Basel, Switzerland. This article is an open access article distributed under the terms and conditions of the Creative Commons Attribution (CC BY) license (http://creativecommons.org/licenses/by/4.0/).
Share and Cite
MDPI and ACS Style
Howell, J.; Windsor, S.; Passmore, M. Some Observations on Shape Factors Influencing Aerodynamic Lift on Passenger Cars. Fluids 2021, 6, 44. https://0-doi-org.brum.beds.ac.uk/10.3390/fluids6010044
AMA Style
Howell J, Windsor S, Passmore M. Some Observations on Shape Factors Influencing Aerodynamic Lift on Passenger Cars. Fluids. 2021; 6(1):44. https://0-doi-org.brum.beds.ac.uk/10.3390/fluids6010044
Chicago/Turabian StyleHowell, Jeff, Steve Windsor, and Martin Passmore. 2021. "Some Observations on Shape Factors Influencing Aerodynamic Lift on Passenger Cars" Fluids 6, no. 1: 44. https://0-doi-org.brum.beds.ac.uk/10.3390/fluids6010044