
CFD and Experimental Study of Wind Pressure Distribution on the High-Rise Building in the Shape of an Equilateral Acute Triangle

1
STU in Bratislava, Faculty of Civil Engineering, Radlinskeho 11, 810 05 Bratislava, Slovakia
2
STU in Bratislava, Faculty of Architecture and Design, Namestie slobody 19, 812 45 Bratislava, Slovakia
*
Author to whom correspondence should be addressed.
Fluids 2021, 6(2), 81; https://0-doi-org.brum.beds.ac.uk/10.3390/fluids6020081
Submission received: 14 January 2021
/
Revised: 5 February 2021
/
Accepted: 7 February 2021
/
Published: 12 February 2021
(This article belongs to the Special Issue Recent Advances in Computational Methods in Fluid Dynamics and Applications)
Abstract
:There is a lack of detailed information about wind flow and distribution of wind pressure around atypically shaped high-rise buildings. The national standard EN 1991-1-4 Eurocode 1 used to determine the effects of wind on the territory of Slovakia (and indeed other countries of the European Union) does not have a procedure for determining the effects of wind on objects of triangular shape. This presents a problem for designers and engineers, as there exist no generally binding/valid rules to follow when performing the wind effect analysis. This paper shows the procedure of identification and results of the external wind pressure coefficient for the triangularly shaped high-rise building. Two methods of calculation have been chosen for this purpose. First, experimental measurements were performed on a scaled model of the building cross-section in the wind tunnel. Subsequently, software simulations were performed on the same scaled model in the CFD (computational fluid dynamics) program ANSYS CFX. Results of wind pressure were obtained for two directions of wind flow measured in 16 sampling points distributed irregularly around the circumference of the model. Results were mutually compared and verified. At the end, the wind flow effects on a real-size triangular high-rise building in the built-up area performed by software simulation are shown.
1. Introduction
The current trend in the building industry is to build tall and irregularly shaped high-rise buildings in residential areas. The lack of space, density of residential areas, and uncontrolled construction process causes many problems in the actual design of the buildings.
The current national standard EN 1991-1-4 Eurocode 1 [1] does not provide a procedure or methodology for determining the wind effects for triangle-shaped structures. This presents a problem for the designers and engineers because there are no generally binding rules under which the wind effect analysis should be carried out.
Before starting the construction process, it is important to develop a detailed plan, including precise procedures, which results in a continuous workflow that is reliable and predictable at all stages of project planning. The use of lean construction practices and integrated planning is recommended before the building process starts, which is closely discussed in [2]. The issue of the preliminary design of the structure is closely related to the wind effects on the building and also in its vicinity.
The wind speed, wind pressure, and turbulence pattern needed for the purposes of the structural engineering can be obtained by two most commonly used methods—wind tunnel experiment and CFD (computational fluid dynamics) simulation. The determination of these parameters has been the subject of our research also in the past [3,4,5]. In order to get values of some basic quantities (wind pressure, wind velocity, etc.), performing experimental measurements in the wind tunnel seems to be the most proper method. Within the wind tunnel measurement process, the amount and distribution of sampling points represents a limiting criterion. Another important fact relates to the number of measured variables: experimental measurements can never provide such a number of variables as the software simulations can provide. Here, a determining criterion for a choice of suitable method is presented by the possibility of proper distribution of sampling points and number of measured variables (wind pressure, wind velocity, etc.).
Software for wind flow simulation can be used regardless of the model scale of the building. Results obtained by CFD simulation have much wider coverage with respect to the quantity of the analyzed variables, and there is no need to distribute the sampling points—the entire discrete environment is analyzed.
In addition to basic wind flow analysis, where pressure distribution and wind speed are measured, in the case of very tall buildings, dynamic response analysis is needed. However, because the solution of the dynamic response of the building is based on the transient simulations of wind flow and the scope would be a very extensive work, it will not be dealt with in this article.
In this article, as mentioned earlier, two methods were selected to demonstrate the calculation process of wind effects on triangularly shaped high-rise building.
Wind tunnel experimental analysis have been performed on a scaled model of the building. Prior to the wind tunnel experiment, CFD simulations were performed, and subsequently, 16 sampling points were specified on a scaled model. Values of wind pressure in conditions simulating the steady flow have been measured in sampling points afterwards. Within the measurements, two wind directions have been considered while the wind pressure distribution on a building’s surface has been investigated, representing the external wind pressure coefficients (Cp).
Numerical analysis has been performed using the ANSYS CFX software (Educational version ANSYS 16.0; ANSYS, Inc. Southpointe, 2600 Ansys Drive, Canonsburg, PA 15317, USA). It is a Finite Volume Method (FVM)-based software, with application of mathematical models through which it computes unknown quantities within the entire scope of a discrete environment.
To compare the results acquired by means of both methods, two assumptions had to be fulfilled: (1) The basic parameters (inlet wind speed, air density, atmospheric pressure) measured directly during the wind tunnel measurements should be used as the boundary conditions for CFD simulation; (2) to use the reduced model having a shape and scale identical to the one subjected to wind tunnel experimental measurements.
At the end, the comparison of results obtained by two presented methods is shown, as well as a demonstration of the wind effects on the real size high-rise buildings complex calculated by ANSYS CFX software.
2. Analyzed Model
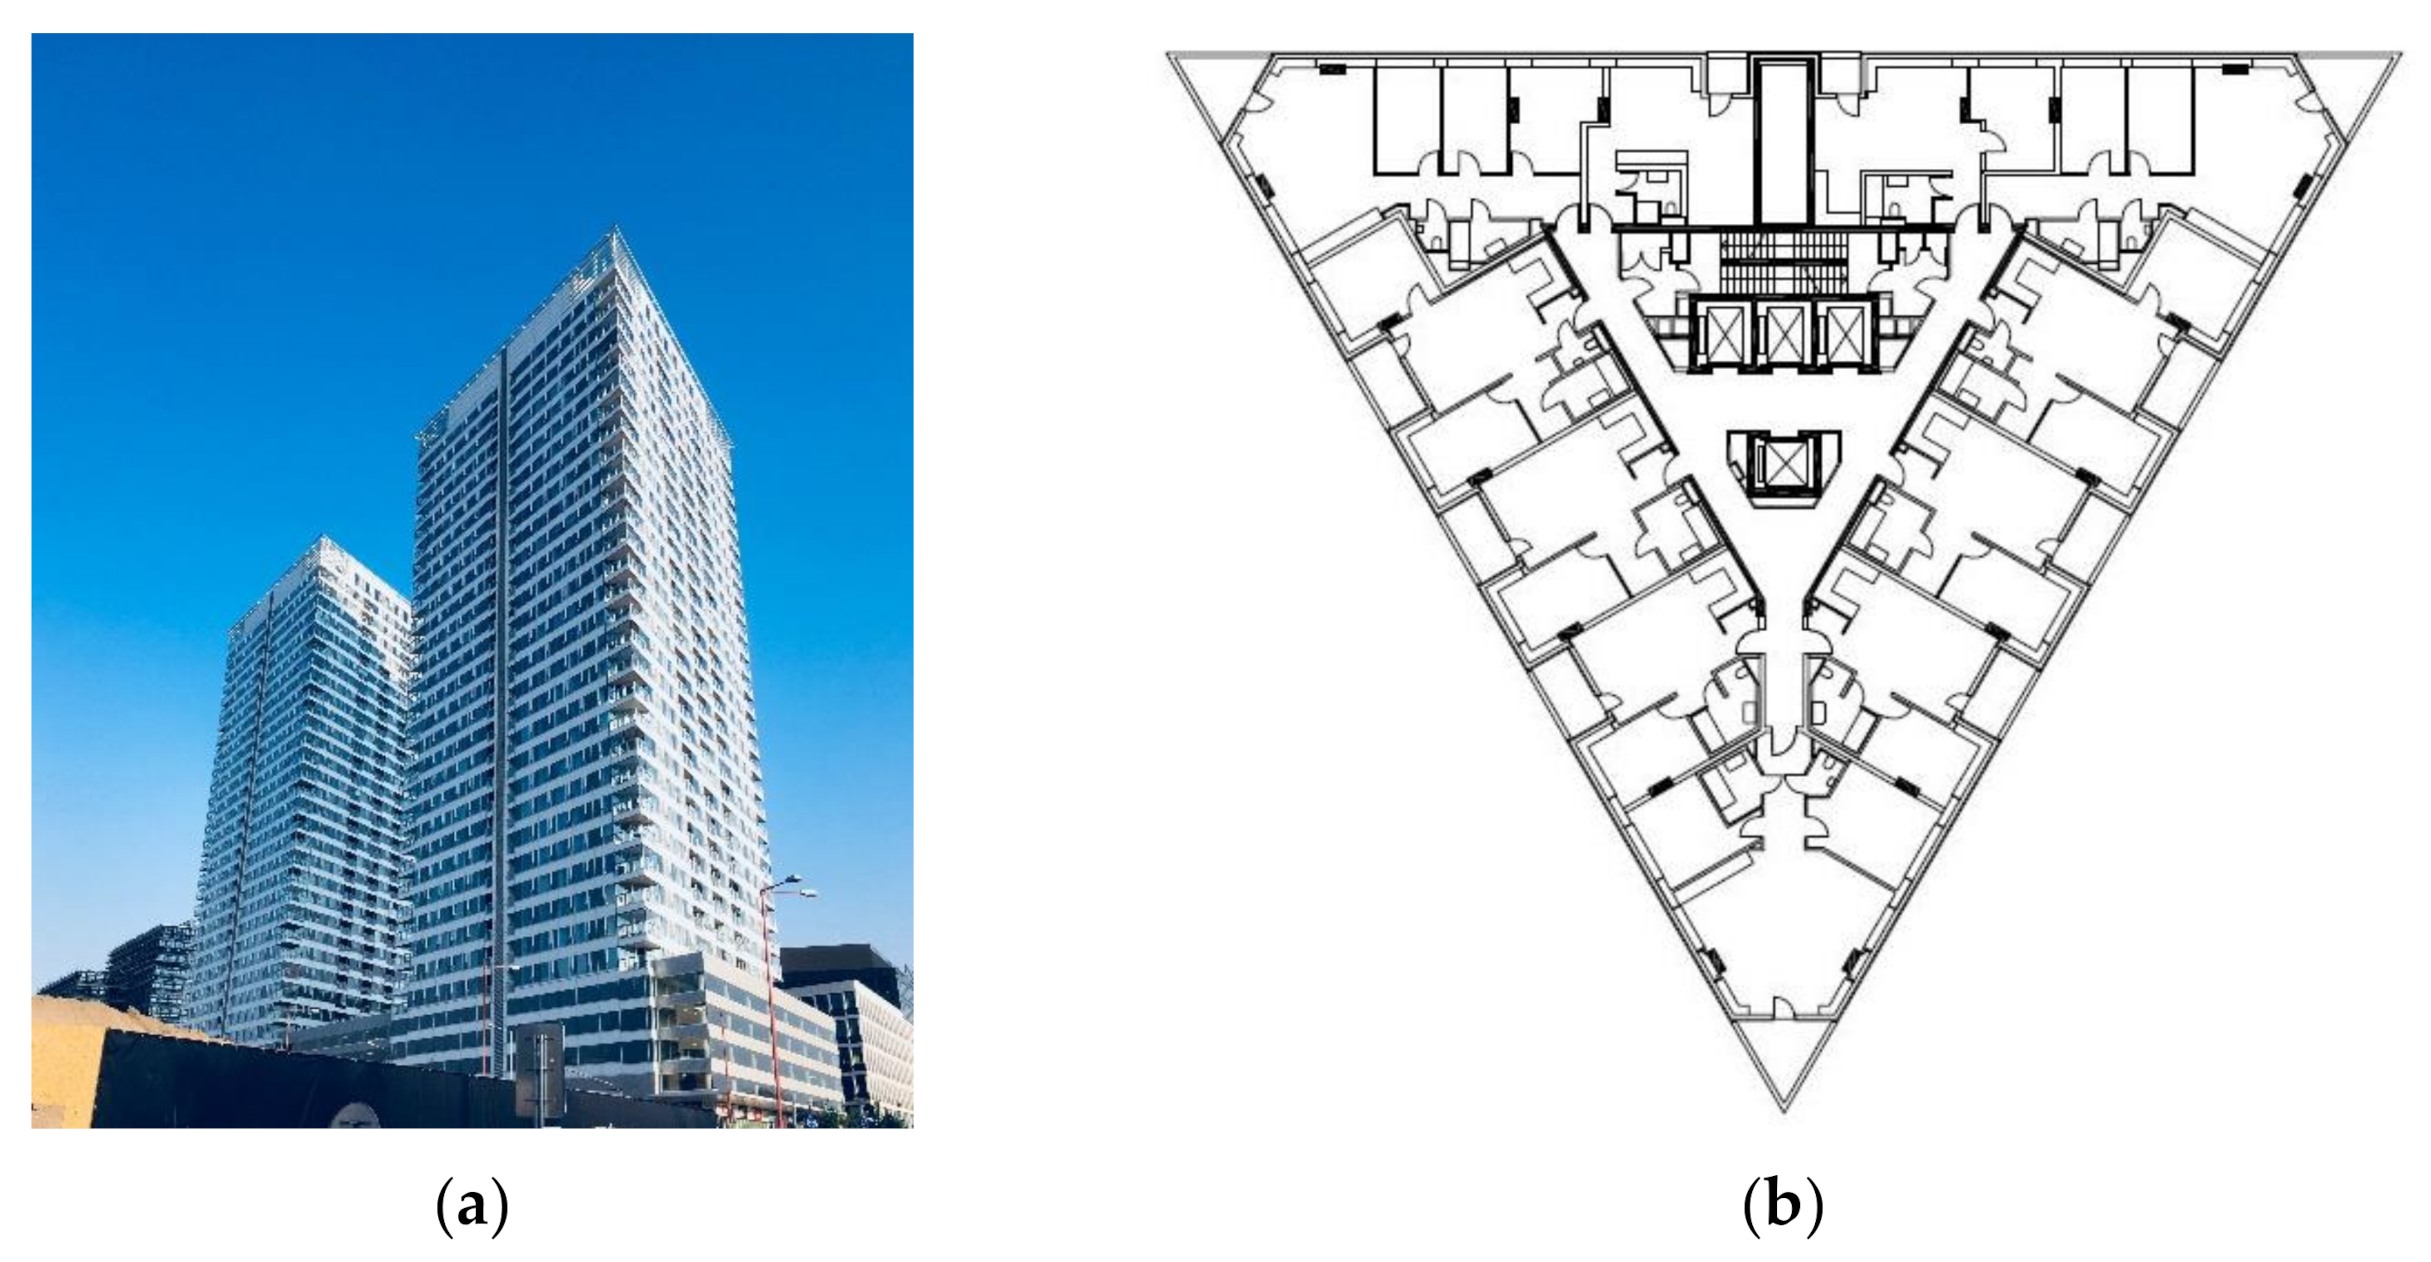
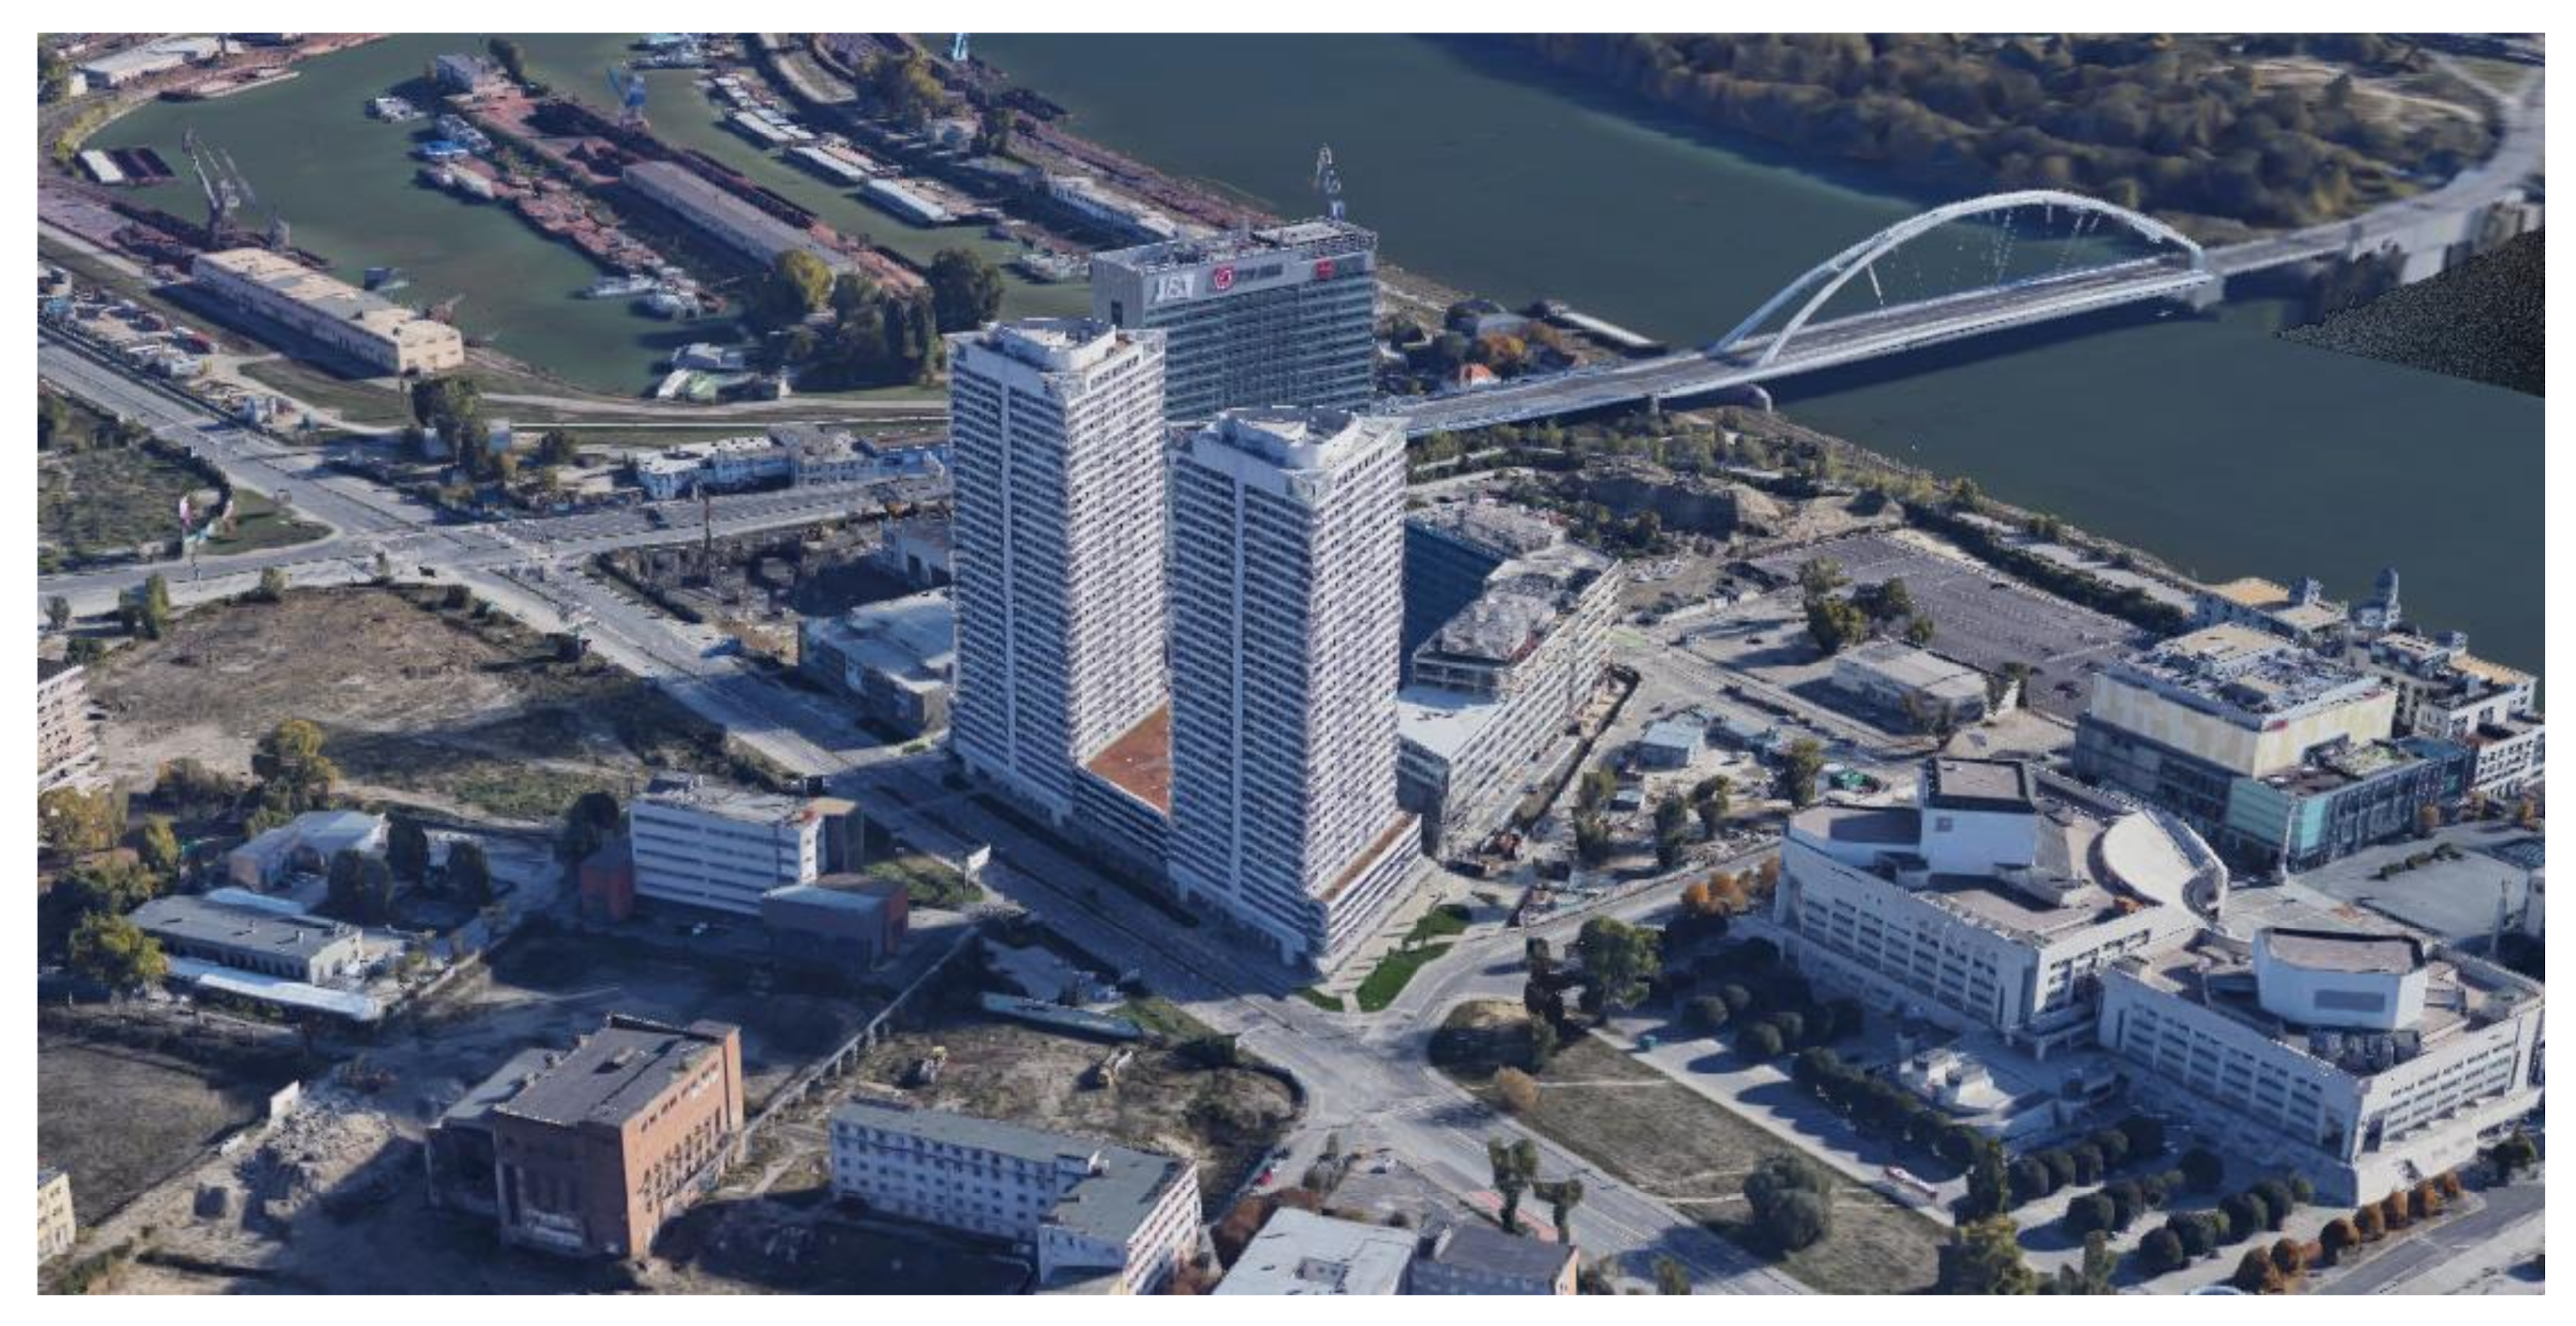
The inspiration for the choice of the analyzed shape of the buildings was the Panorama City buildings located in Bratislava—Slovakia, and they are shown in Figure 1a. The cross-section of buildings has a shape of an equilateral triangle, as shown in Figure 1b. The dimensions of the real-size buildings are as follows: edge length is 51.34 m; total height is 108 m. Each building has 33 floors, which brings them to the top of the list of the highest residential buildings in Slovakia. For wind effects analysis purposes, a reduced and simplified model of one of the Panorama city buildings was created at a scale of 1:172.
3. Wind Pressure Distribution around the Object Obtained by Wind Tunnel Experiment
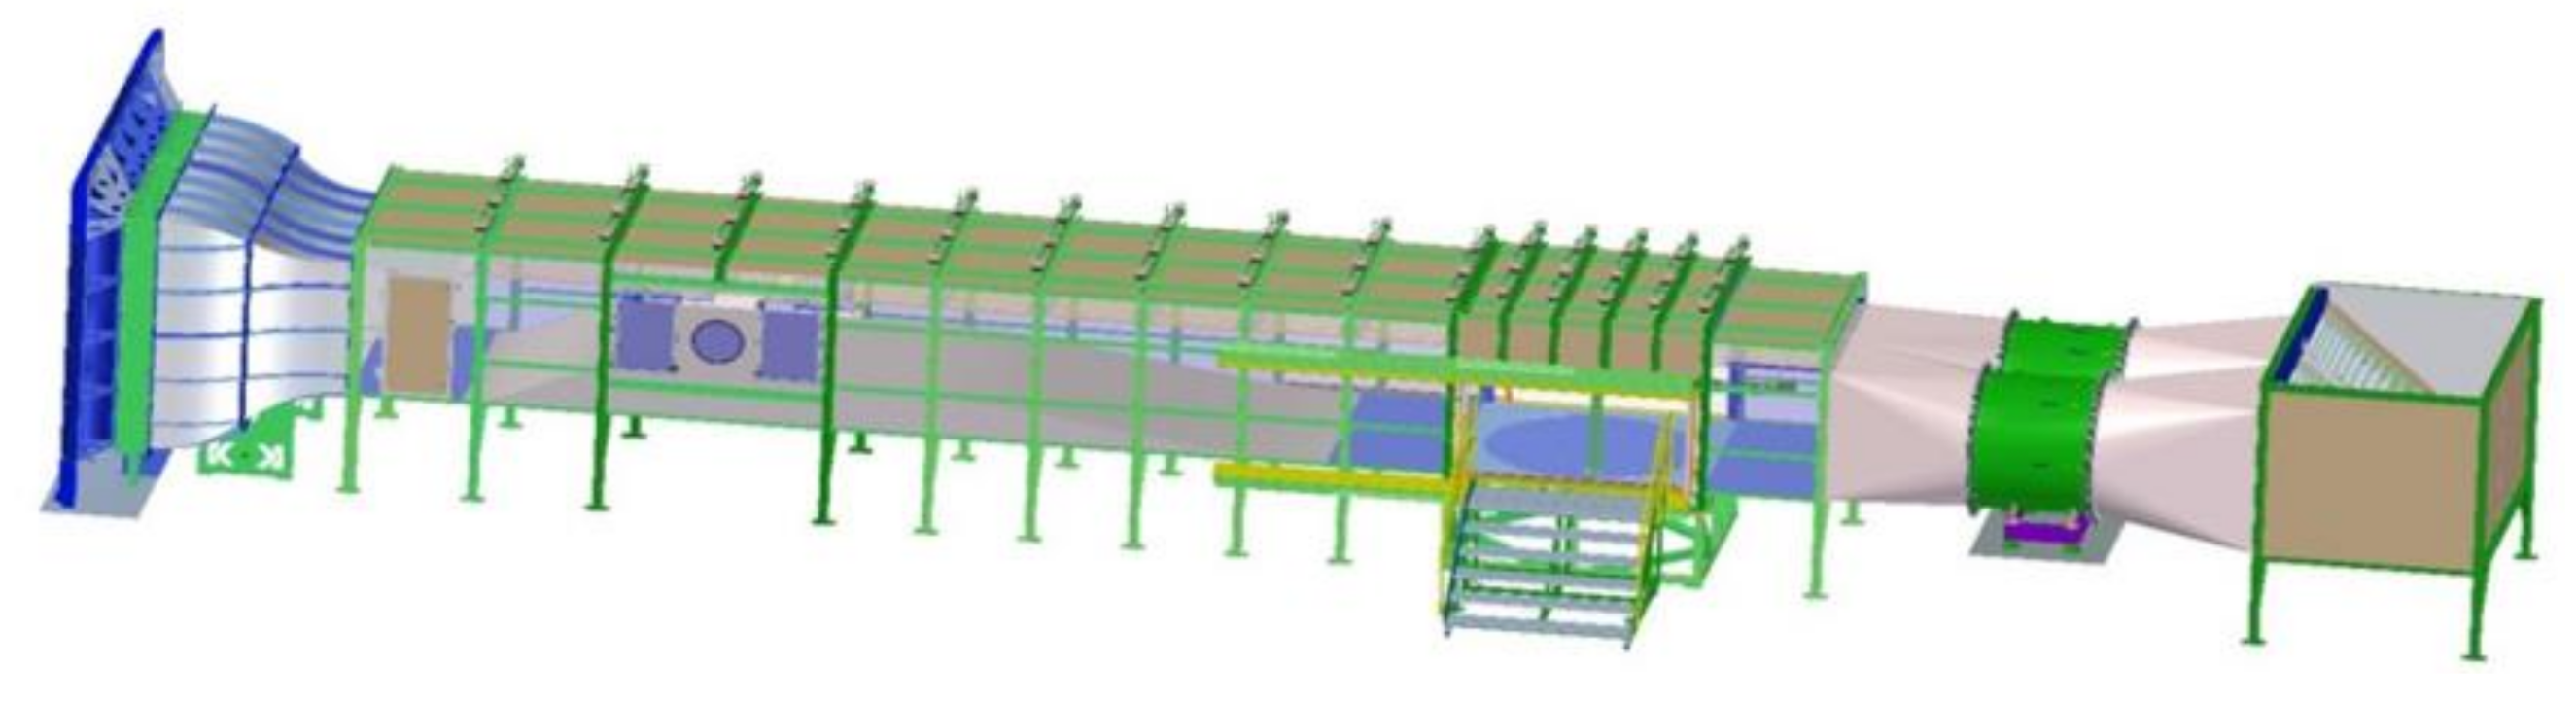
The experimental study that aimed to determine the distribution of wind pressure around the perimeter of the object was performed in a wind tunnel, as shown in Figure 2. The wind tunnel in Bratislava, Slovakia is designed as an open-circuit tunnel with closed test space. The total length of the tunnel is 26.4 m, the dimensions of the tunnel cross-section are 2.6 m × 1.6 m, and the total air flow volume is 52 m3/s. The device allows simulation of the random character of the wind flow, which is created in the natural environment by atmospheric boundary layer, as well as steady flows with a uniform velocity distribution, to which two measuring spaces serve in a series arrangement. The measurement in question has been carried out in the frontal space of the wind tunnel where there is no artificial layer to create excessive turbulence. However, an artificial boundary layer is constructed in the rear part of the tunnel (this boundary layer made of artificial rough button foil corresponds to the terrain between categories III/IV with surface roughness z0 = 0.7 m. As mentioned, the experiment was performed in the frontal space of the tunnel, where the walls are without artificial layers and fluid flow is very stable; without significant turbulences and wind speed, it is the most stable area of the whole tunnel. In the frontal space of the wind tunnel, a steady wind speed can be pre-set in the range of 3 to 32 m/s. Turbulences of the wind are very minimal; they can be neglected in the frontal space resulting in relatively stable wind flow with wind velocity difference during the measurement within the range of ±1.5%. The frontal space has been chosen due to the fact that the obtained results can be used in general terms (the results are not affected by turbulence) rather than only for certain conditions typical for a predetermined location of the building.
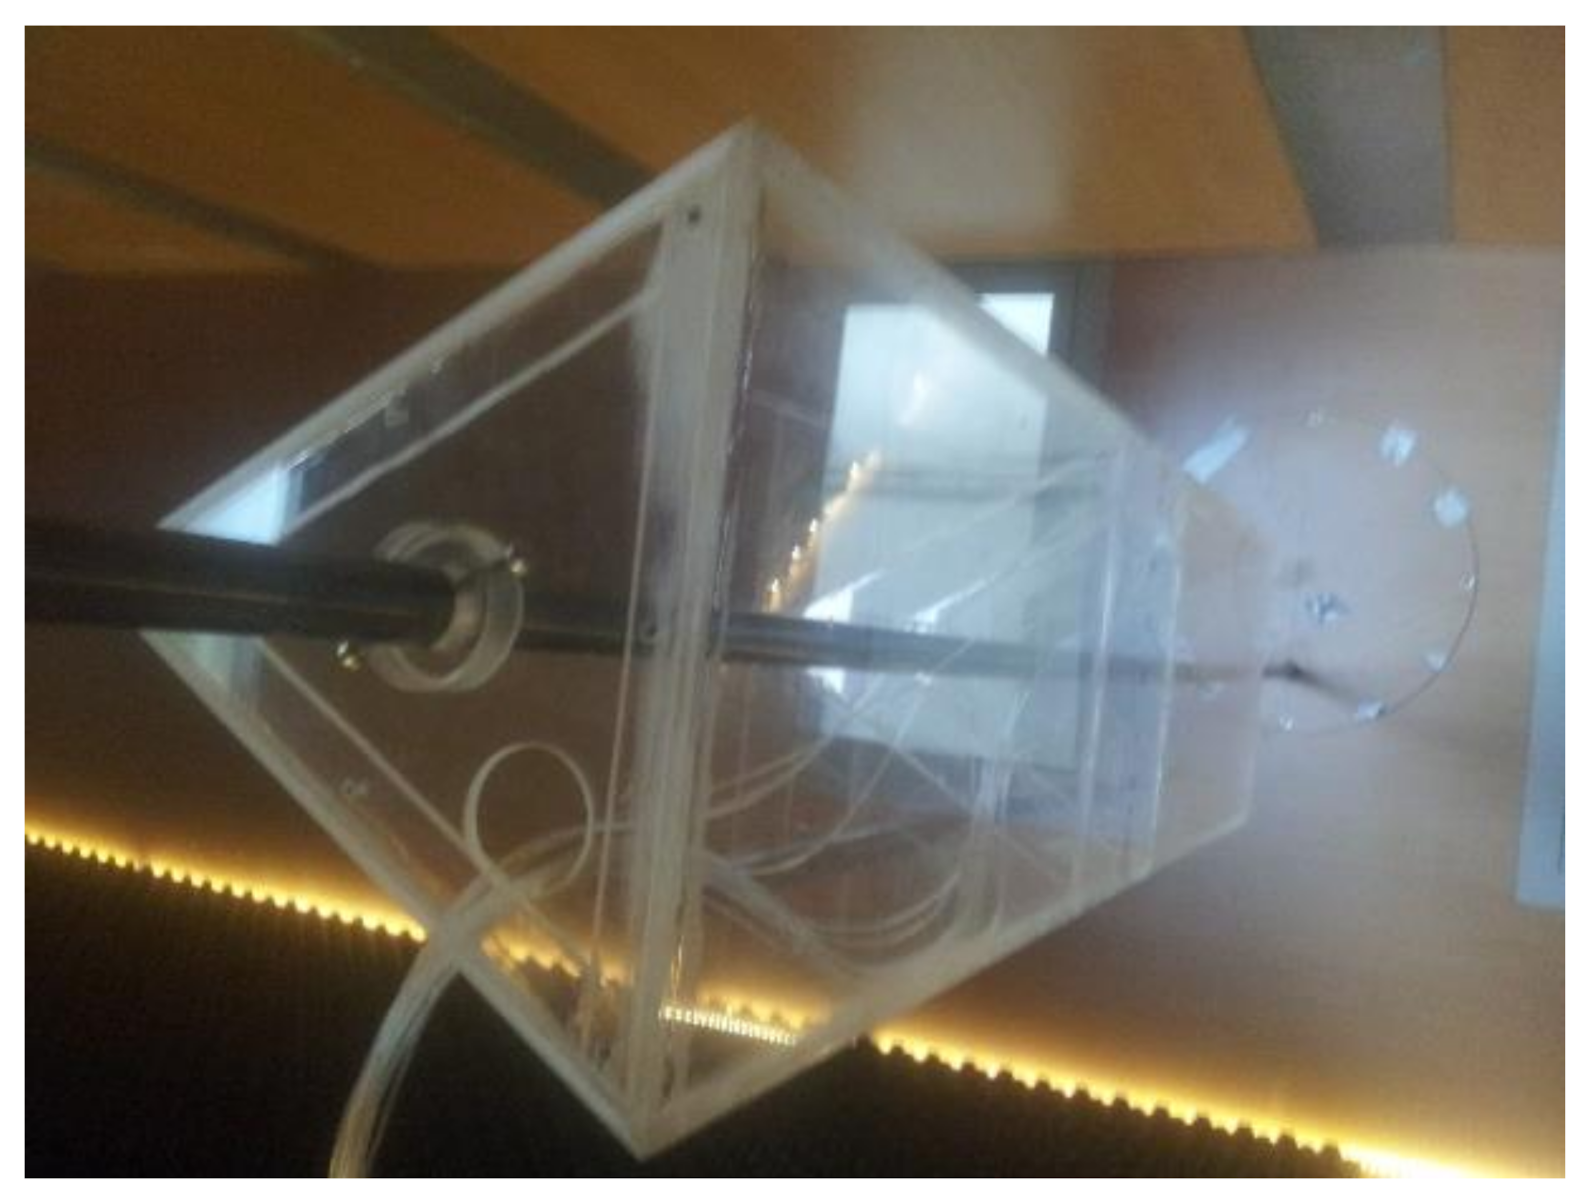
The model for experimental measurements shown in Figure 3 has been constructed in the scale 1:172. It refers to the shape of the horizontal cross-section of the real structure of the Panorama City building shown in Figure 1b. The chosen scale was defined based on previous measurement focused on the effects of walls and model size upon the obtained results. In [6], the author describes procedures of measuring and choosing the model size in the wind tunnel in detail.
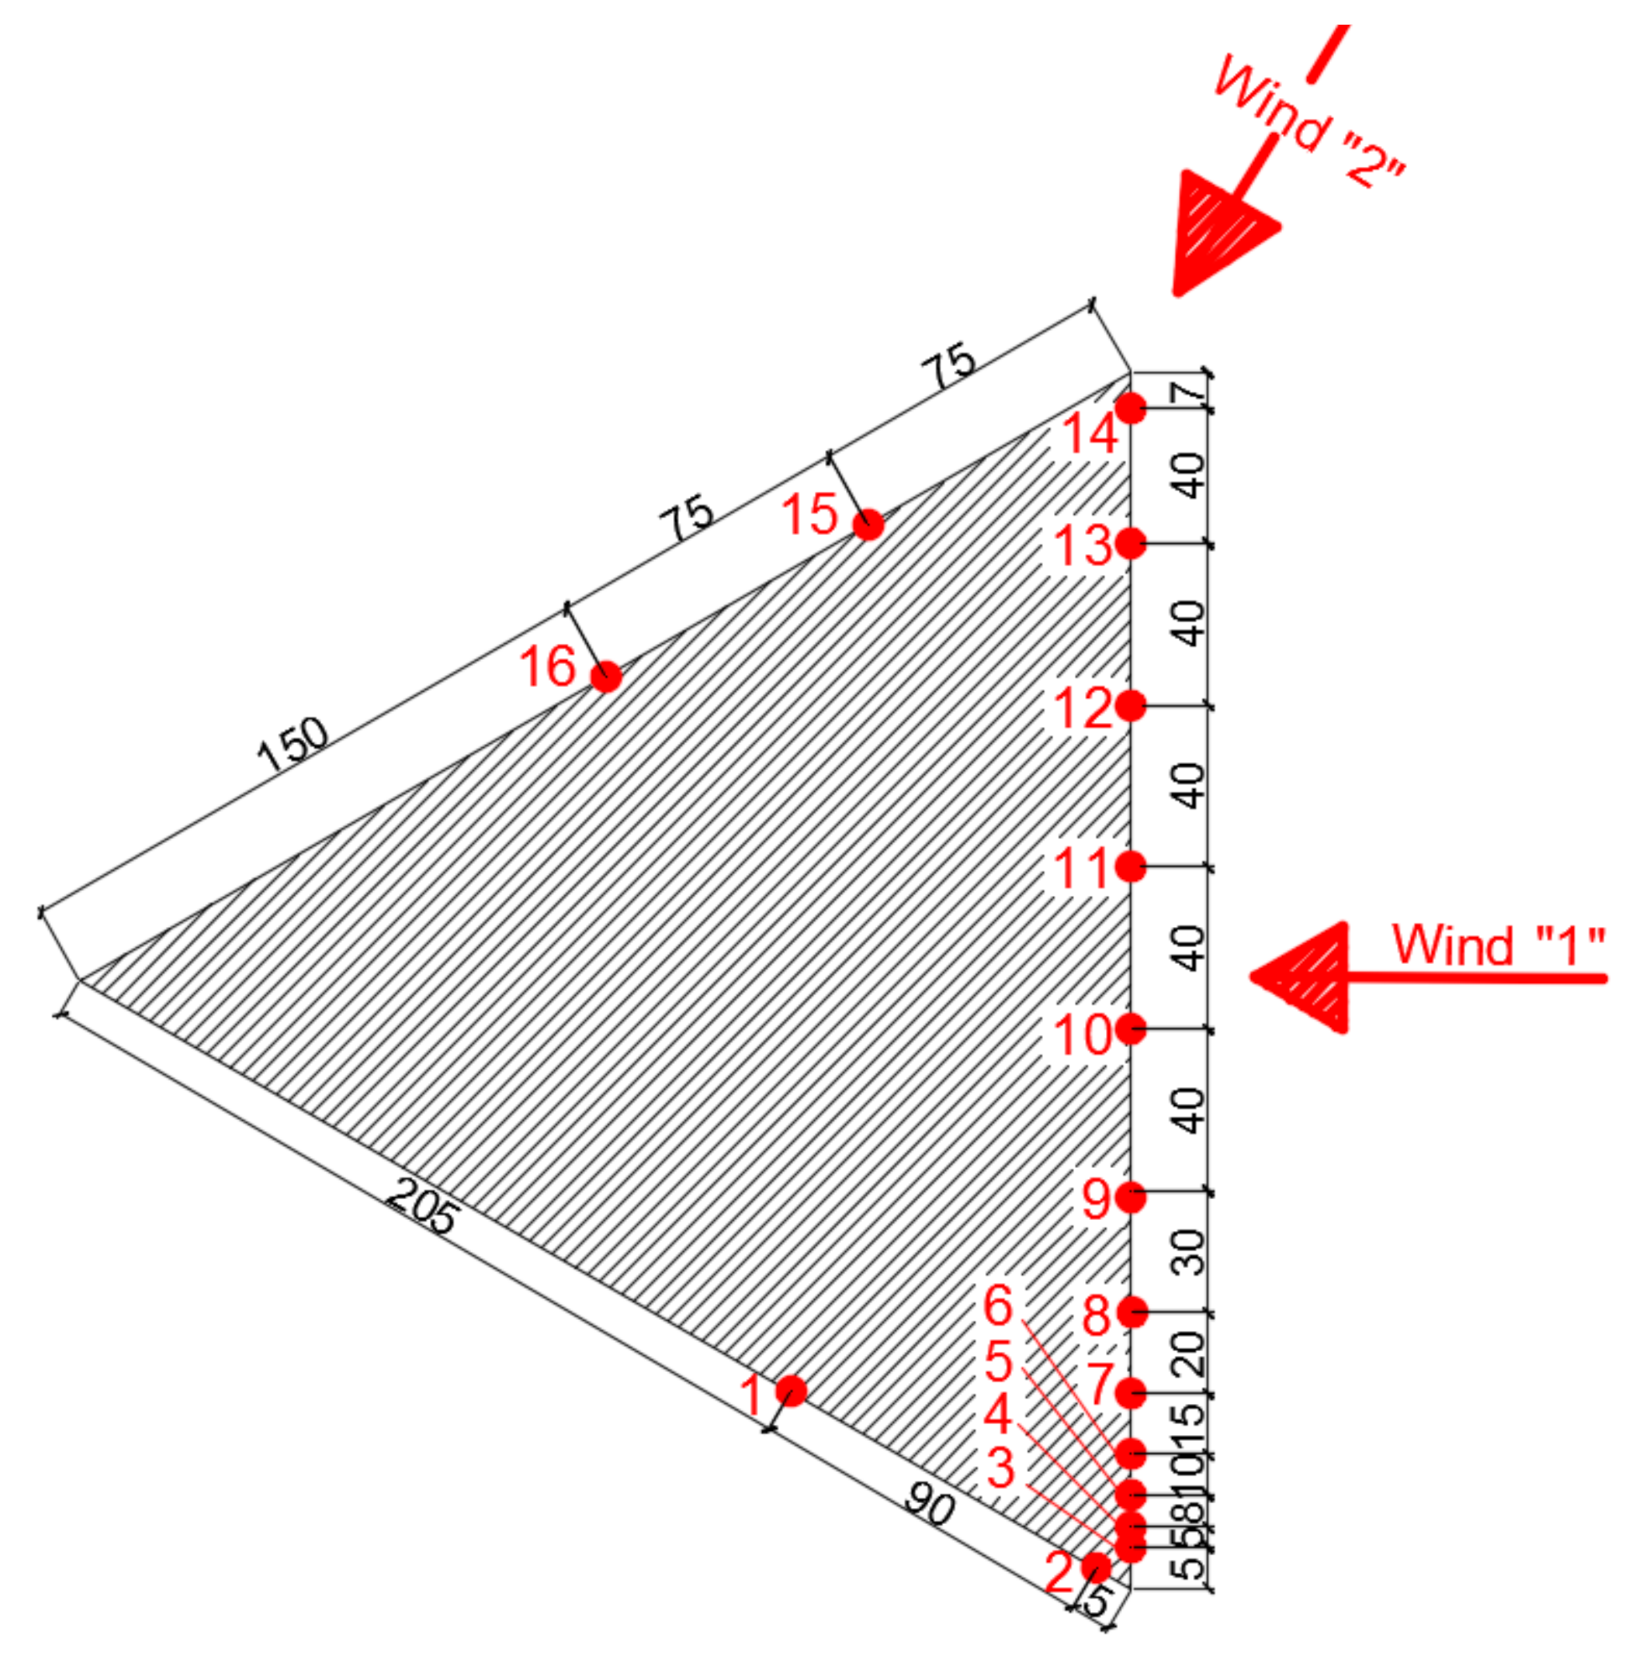
The measurements were preceded by very basic CFD software simulation, where the emphasis was not on the values of the results but only on a graphical representation of the distribution of wind pressure on the surface of the model. Thereafter, we were able to choose positions at which the placement of sampling points was appropriate. Sixteen sampling points had been distributed around the surface irregularly, as shown in Figure 4, so that the basic and peak values of wind pressure distribution based on CFD simulation with the best possible relevance were acquired.
Testing was performed in the frontal space of the wind tunnel where the wind speed can be considered as steady. Properties of air obtained directly from the wind tunnel measurements are listed in Table 1.
For the measurements of air behavior and its properties inside the wind tunnel, the following instrumentation was used: 15 differential pressure sensors placed along the tunnel to check pressure balance over the tunnel walls; two pitot-static (Prandtl) tubes located on the wall in the front and rear section of the tunnel to measure wind speed in each section independently; one almemo-type MA25902 (Ahlborn, Sayner, WI, USA) data logger and measuring device in combination with a thermal probe FVA935TH5K2, that can detect a wind speed difference of 0.2 m/s; one digital pressure scanner DSA 3217 (Scanivalve, Liberty Lake, WA, USA).
For the wind pressure measurement, the digital measuring unit Scanivalve DSA 3217 has been used two times for each sampling point for two different wind directions.
By this device, wind pressure can be measured with high precision (±0.05% full-scale long-term accuracy), and with one device, it is possible to measure pressure up to 16 sampling points. Therefore, the main reason why we used exactly 16 sampling points can be deduced: it was a sufficient number based on the results of the preliminary CFD simulation, and at the same time, it was enough to use only one pressure scanner for measurements.
The obtained wind pressure is the mean value measured for both directions. Given that the value of the wind pressure varies depending on several parameters where wind velocity is the parameter that most affects results, it seems to be more appropriate for engineering practice to not use the measured wind pressure but the dimensionless external wind pressure coefficients (Cp) by using Equation (1).
where p is the measured/calculated pressure where Cp is being evaluated in Pa, p∞ is the measured/calculated pressure outside of the turbulence zone (in free stream) in Pa, ρ∞ is the density of fluid outside of turbulence zone (in free stream) in kg/m3, and v∞ is the velocity of the fluid outside of the turbulence zone (free stream) in m/s.
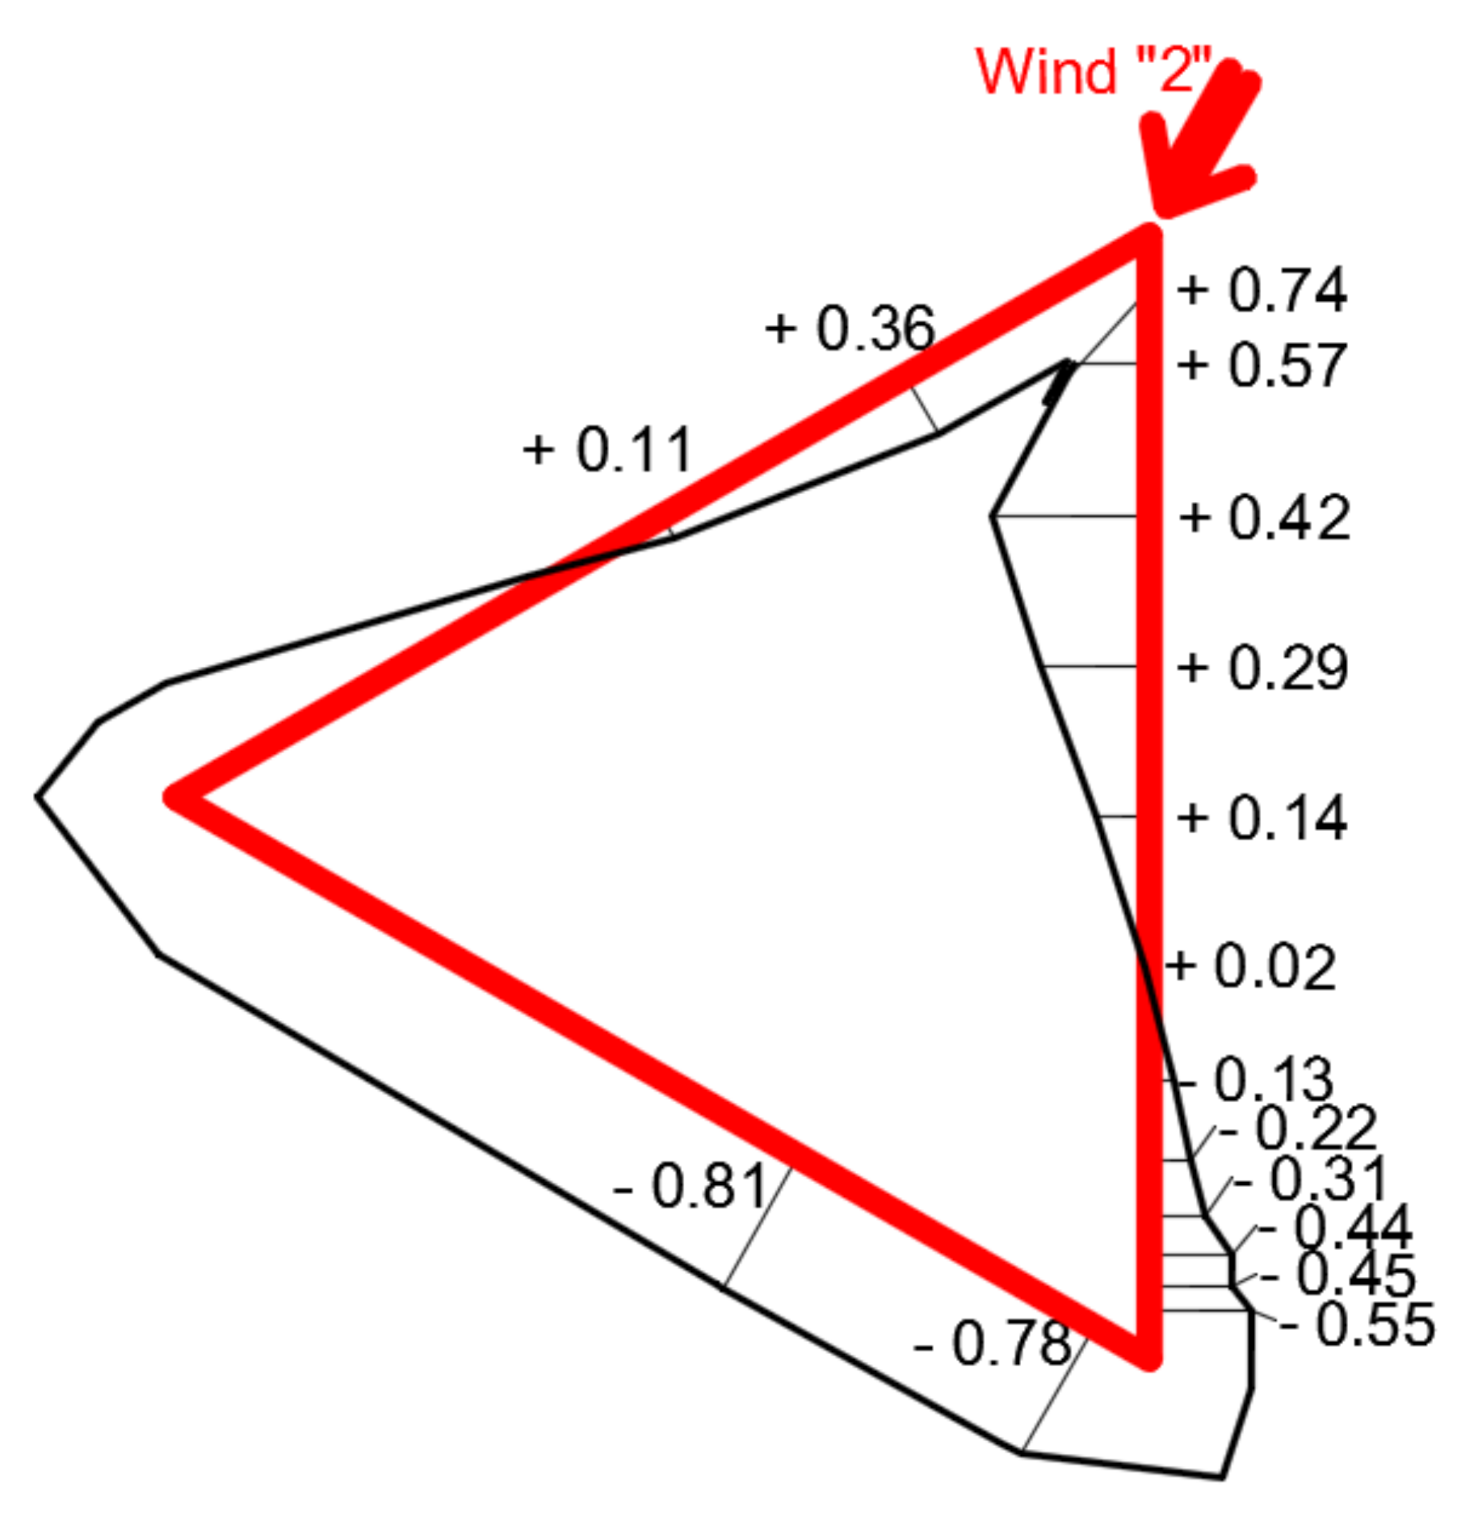
Figure 5 and Figure 6 show the values of Cp that have been obtained by an experimental measurement for two different wind directions.
In case there is no need to analyze pressure at the sampling points by computational fluid dynamics simulation, there are procedures listed in [7] that deal with the recalculation of experimentally measured pressure to actual wind load and apply it as load in software simulation.
4. CFD Simulation of the Scaled Model
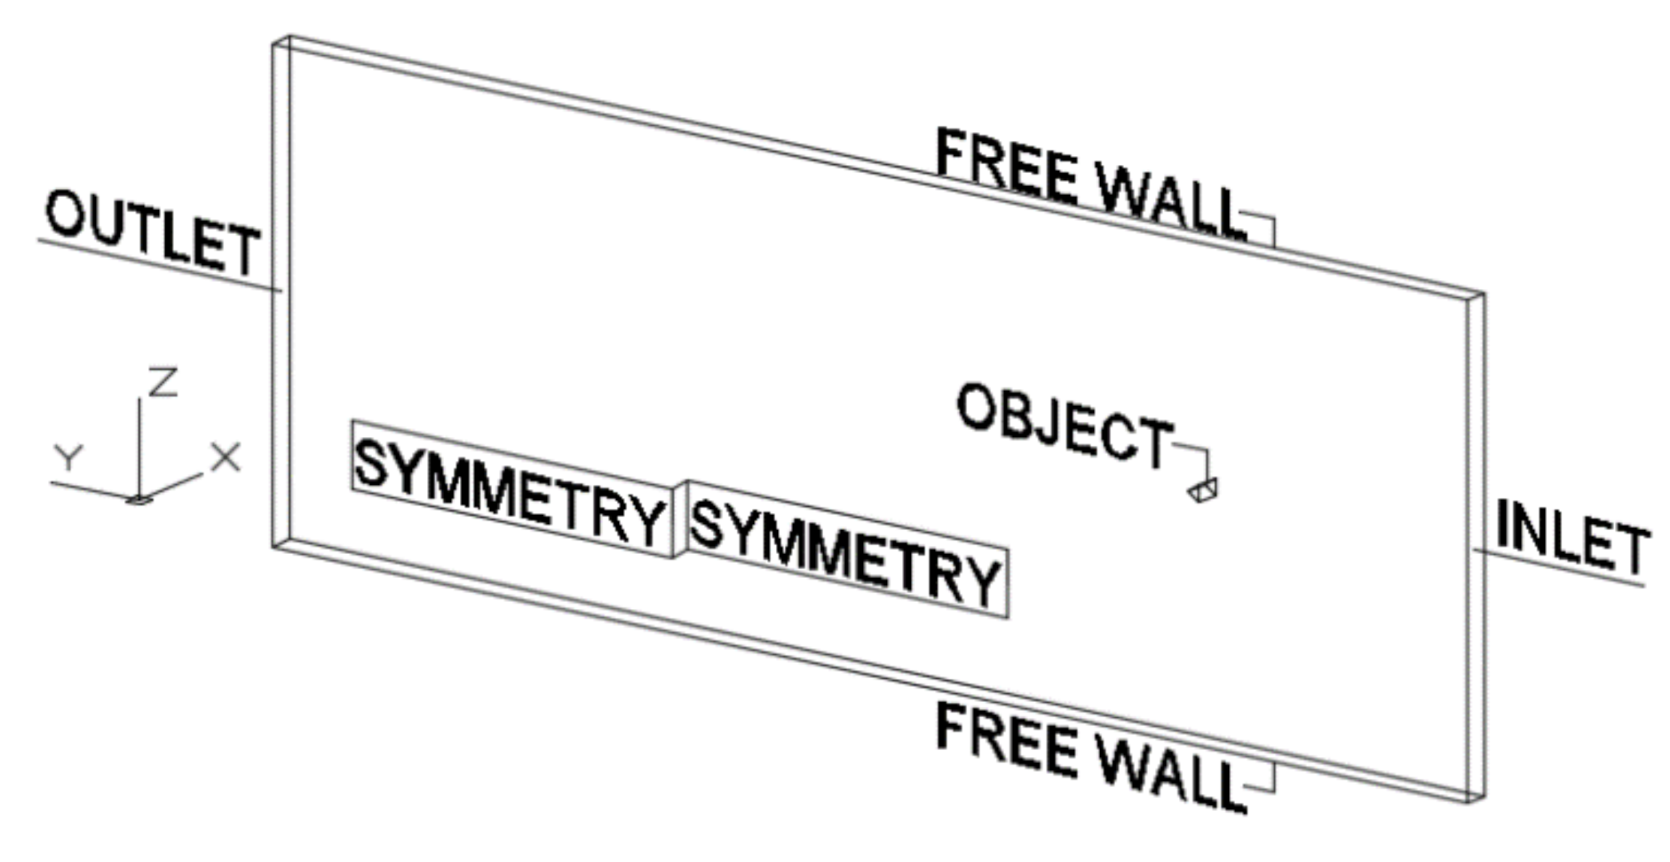
Software simulations were performed on the same scaled model as experiment. CFD software ANSYS CFX based on FVM (finite volume method) was used. The same scale of the test object (1: 172) maintains the same geometric properties as compared to the wind tunnel experiment. A discrete environment was created with the dimensions and names shown in Figure 7: the discrete environment length is 50 m, width is 0.15 m, and the height is 26 m. Given that the only thing we are interested in is the effects of wind on the cross-section of a triangular object, the height respectively the length of the model is not the key parameter and may be neglected in the simulation; a symmetry condition was used on both sides of discrete environment.
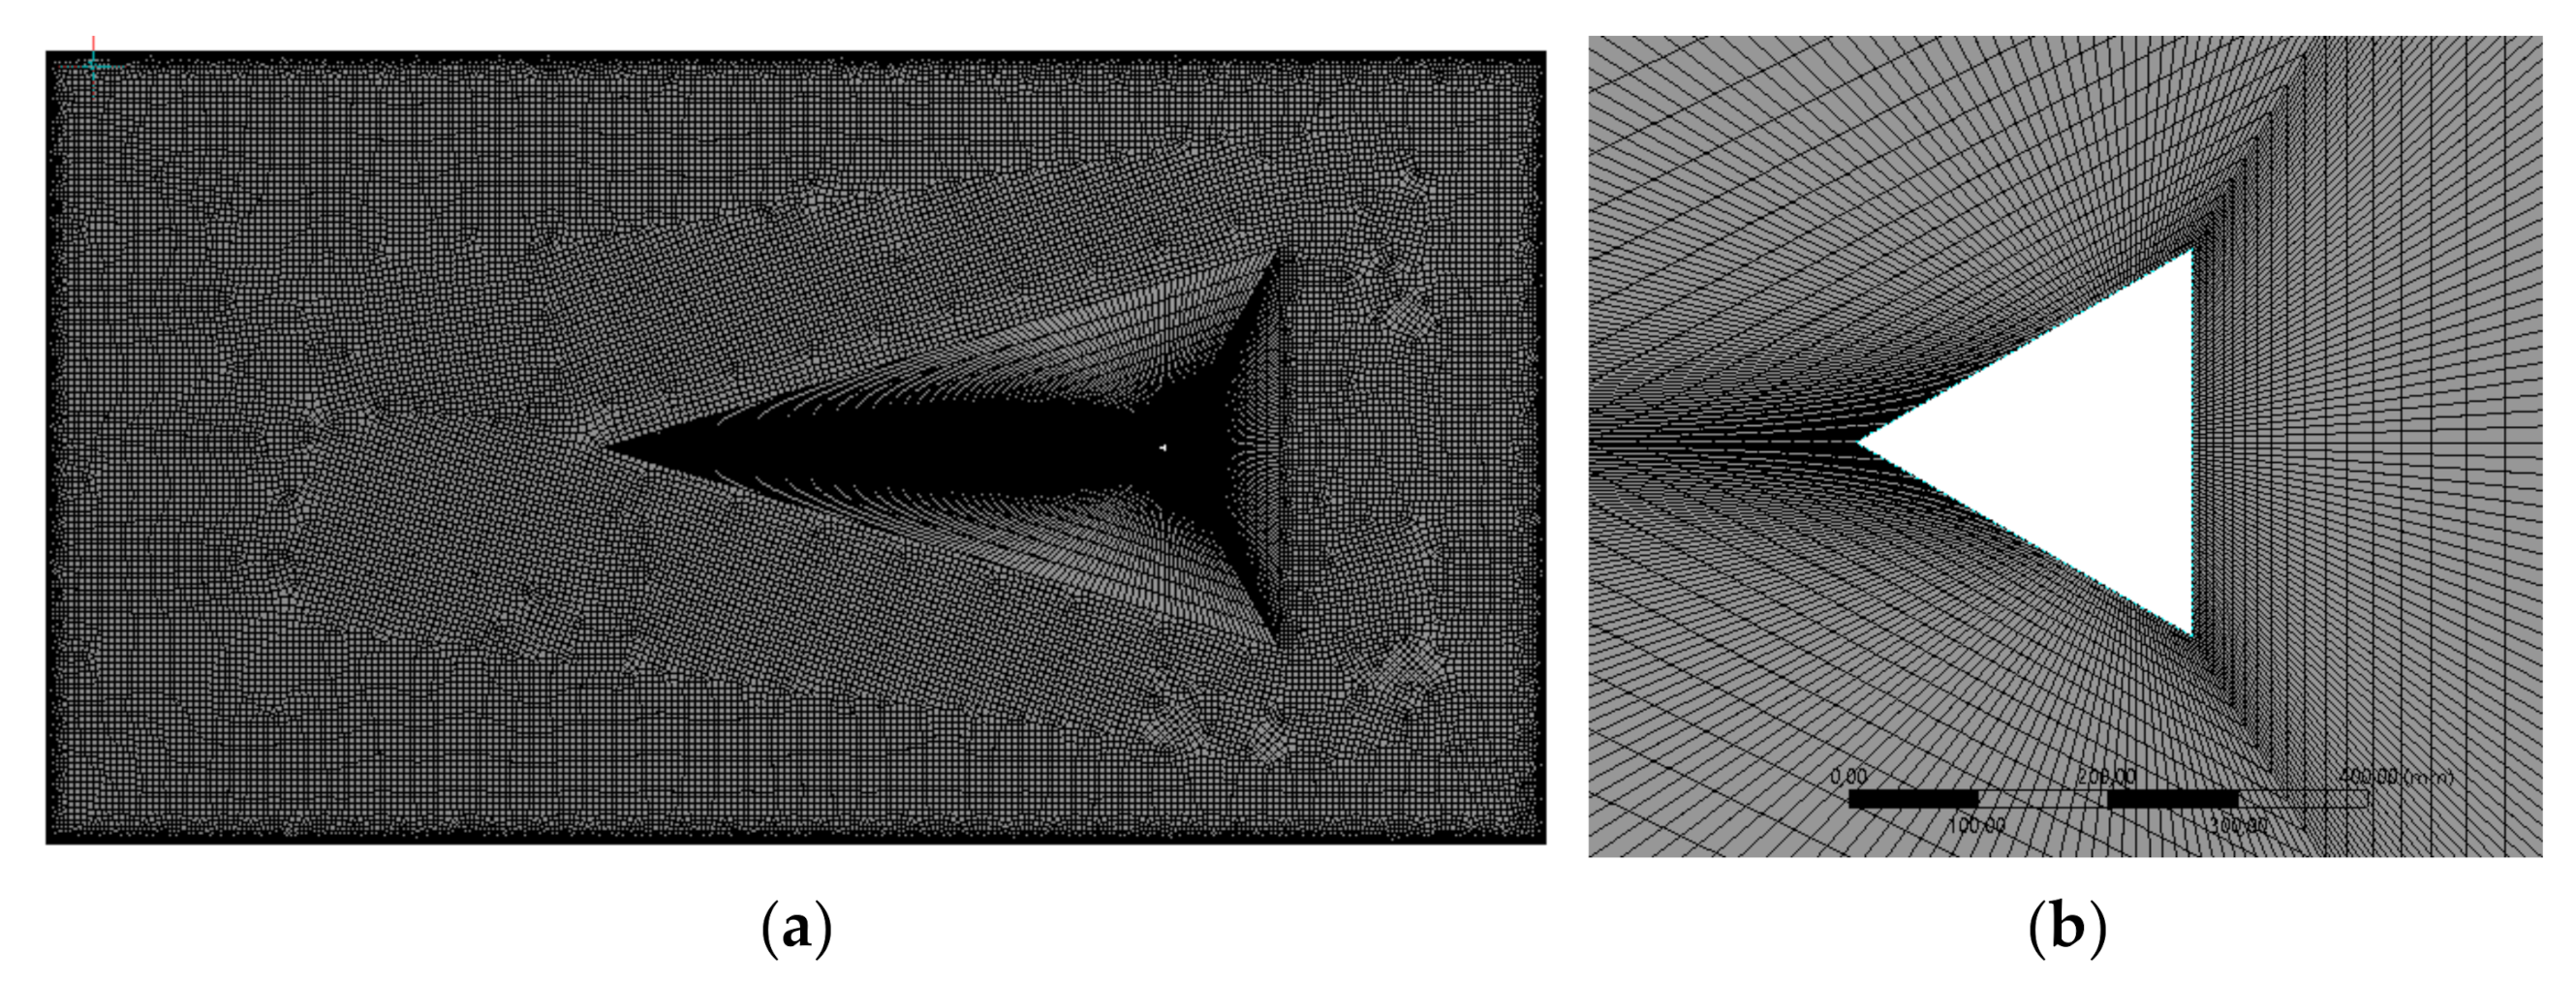
The ANSYS mesh module was used to divide the discrete environment to elements of different types, as shown in Figure 8a,b.
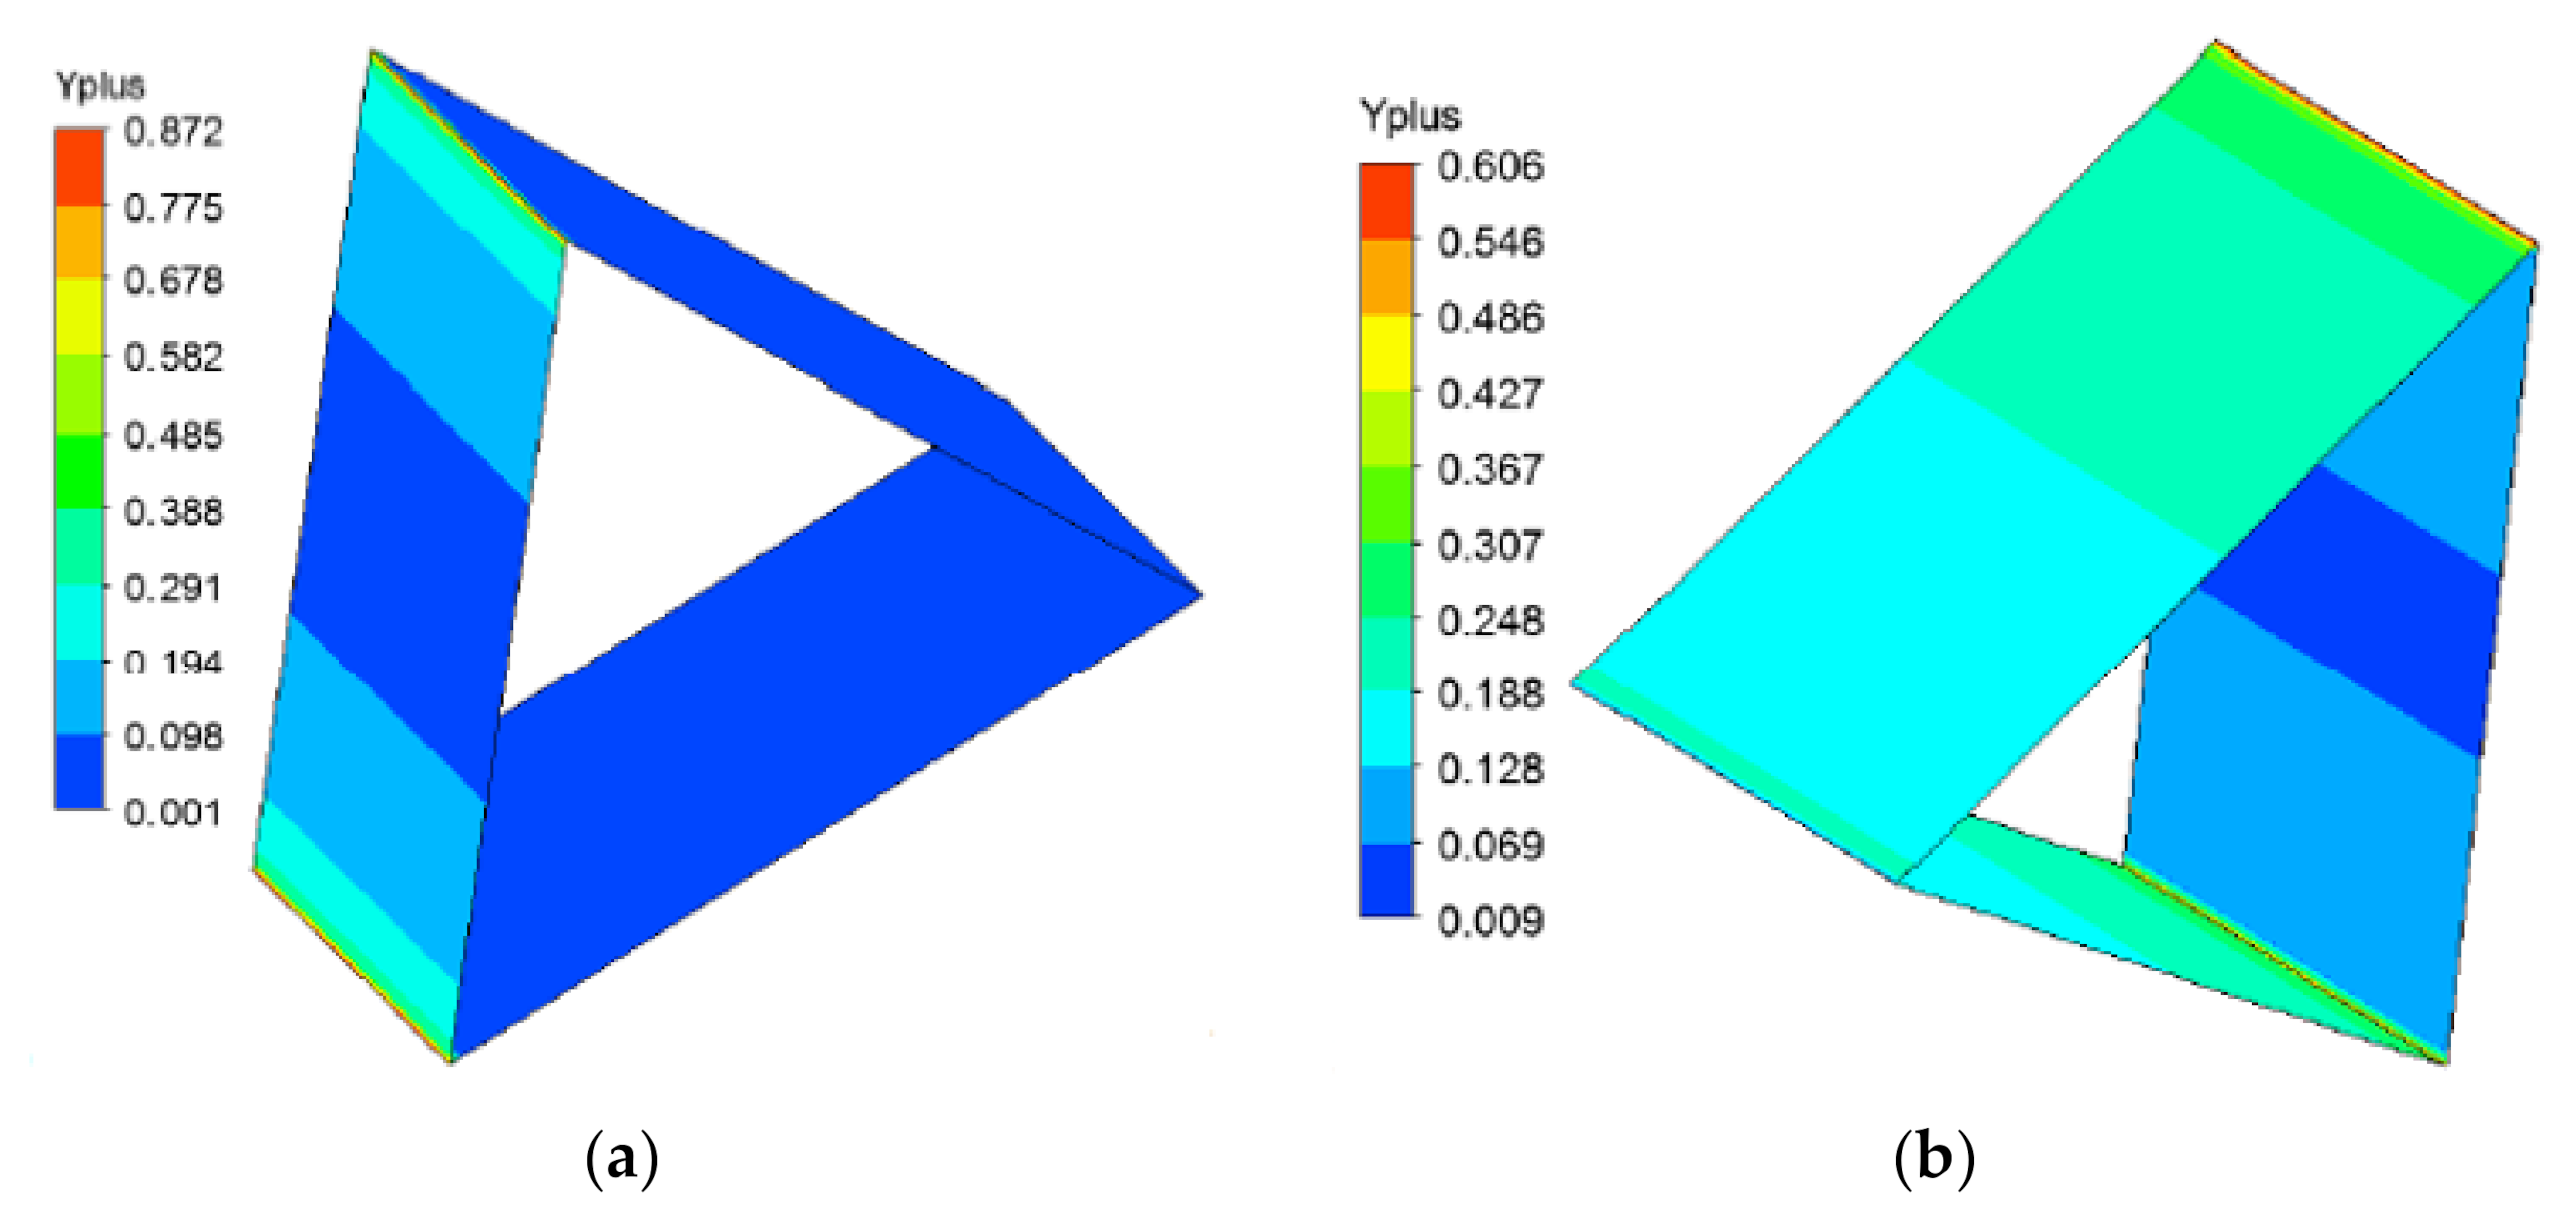
The mesh network was created so that the y+ values were less than 1, as shown in Figure 9a,b. The first layer of the mesh network was created at a distance of 0.01 mm from the circumference of the analyzed object. The following 80 fine layers were created gradually around an object with a growth rate of 1.2, as shown in Figure 8b. The largest edge size of 200 mm was created in the remote surroundings where turbulences of air do not significantly affect flow around an object. The following types of elements were created: to analyze flow No. 1, 2,678,940 Hexahedrons were used, and to analyze flow No. 2, 4,216,800 Hexahedrons were used. The principle of creating a very dense network around the object of interest was based on good previous experience—for example, from [8,9]. It is also appropriate to use the mathematical model SST (Shear Stress Transport) for this type of task, as it was demonstrated also in [8,9]. The topic of modeling of turbulent layer is very extensive, and still, more methods and upgrades are developed. The basic information about modeling of the turbulent layer in the near wall area is listed in [10] by the pioneers in this field: Launder and Spalding.
For the software simulation, the measured variables shown in Table 1 were used as the input parameters. Other parameters of the software simulation process that were not measured during the experiment (roughness of the object, turbulence magnitude …) were chosen based on estimations from the previous measurements. The Reynolds number in this case is 2.5 × 10⁻⁵, which can be considered as sub-critical regime. In most cases when the model size is smaller than 30 cm and the wind speed is lower than 19 m/s, the flow regime is sub-critical. The Strouhal number is 0.24. Both the Reynolds number and the Strouhal number were commented in more detail in [9].
The mathematical SST (Shear Stress Transport) model is a two-equation model belonging to the group of mathematical models RANS (Reynolds Averaged Navier–Stokes). The SST model is composed of two mathematical models: k-ω and k-ε. Its default set-up allows solving mathematical (physical) problems based on the needs of the engineering practice. One example of the application of various mathematical models (including the SST model) in the practical design of structural engineering is given in [8]. Within the SST model environment, the k-ω and k-ε models switch automatically in dependence on the discrete zone in which the quantities are investigated. The mathematical model k-ε itself is not suitable to use for obtaining quantities near walls (wind pressure on building surfaces, flow velocity near wall, etc.), which is also discussed by the authors in [11]. Within the analysis of quantities (e.g., pressure) investigated in the vicinity of an object (or directly on the model’s surface), the k-ω model would operate in these areas. On the other hand, the k-ε model operates in areas of free flow, as it shows very good results here. A combination of these two models into one (SST model) provides enough accuracy of results in the overall range of the discrete environment. More detailed information on mathematical models used for CFD simulations can be found in [12,13].
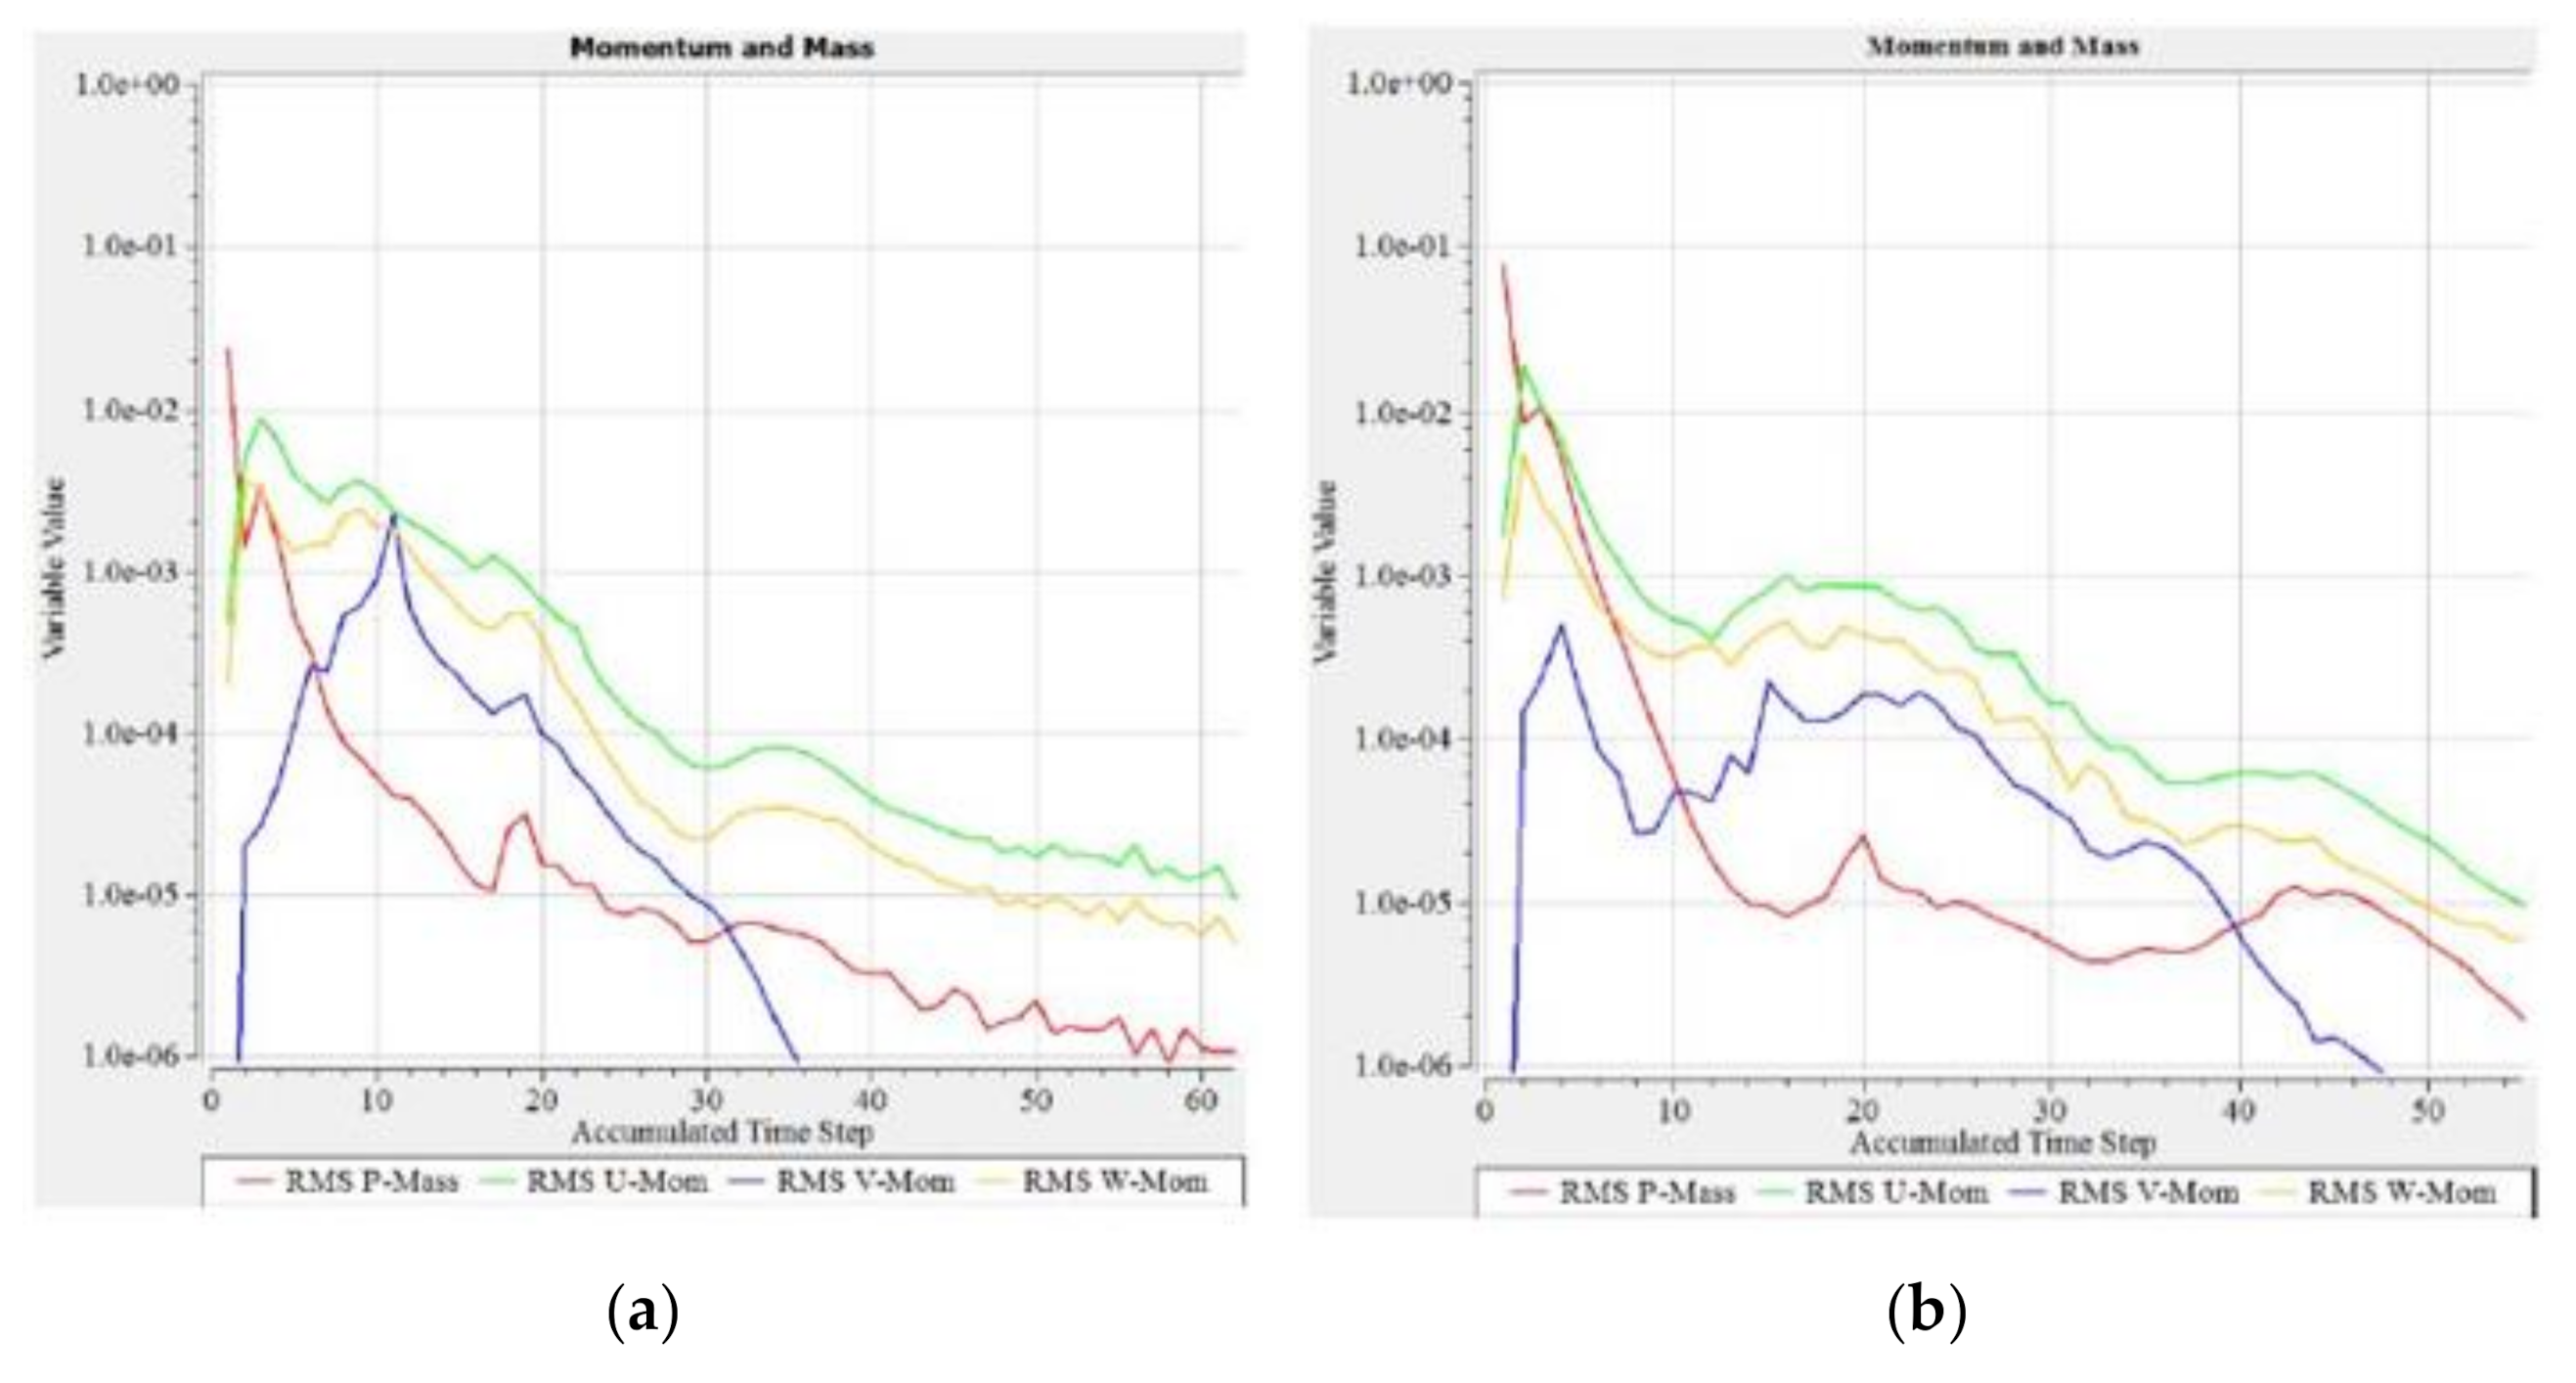
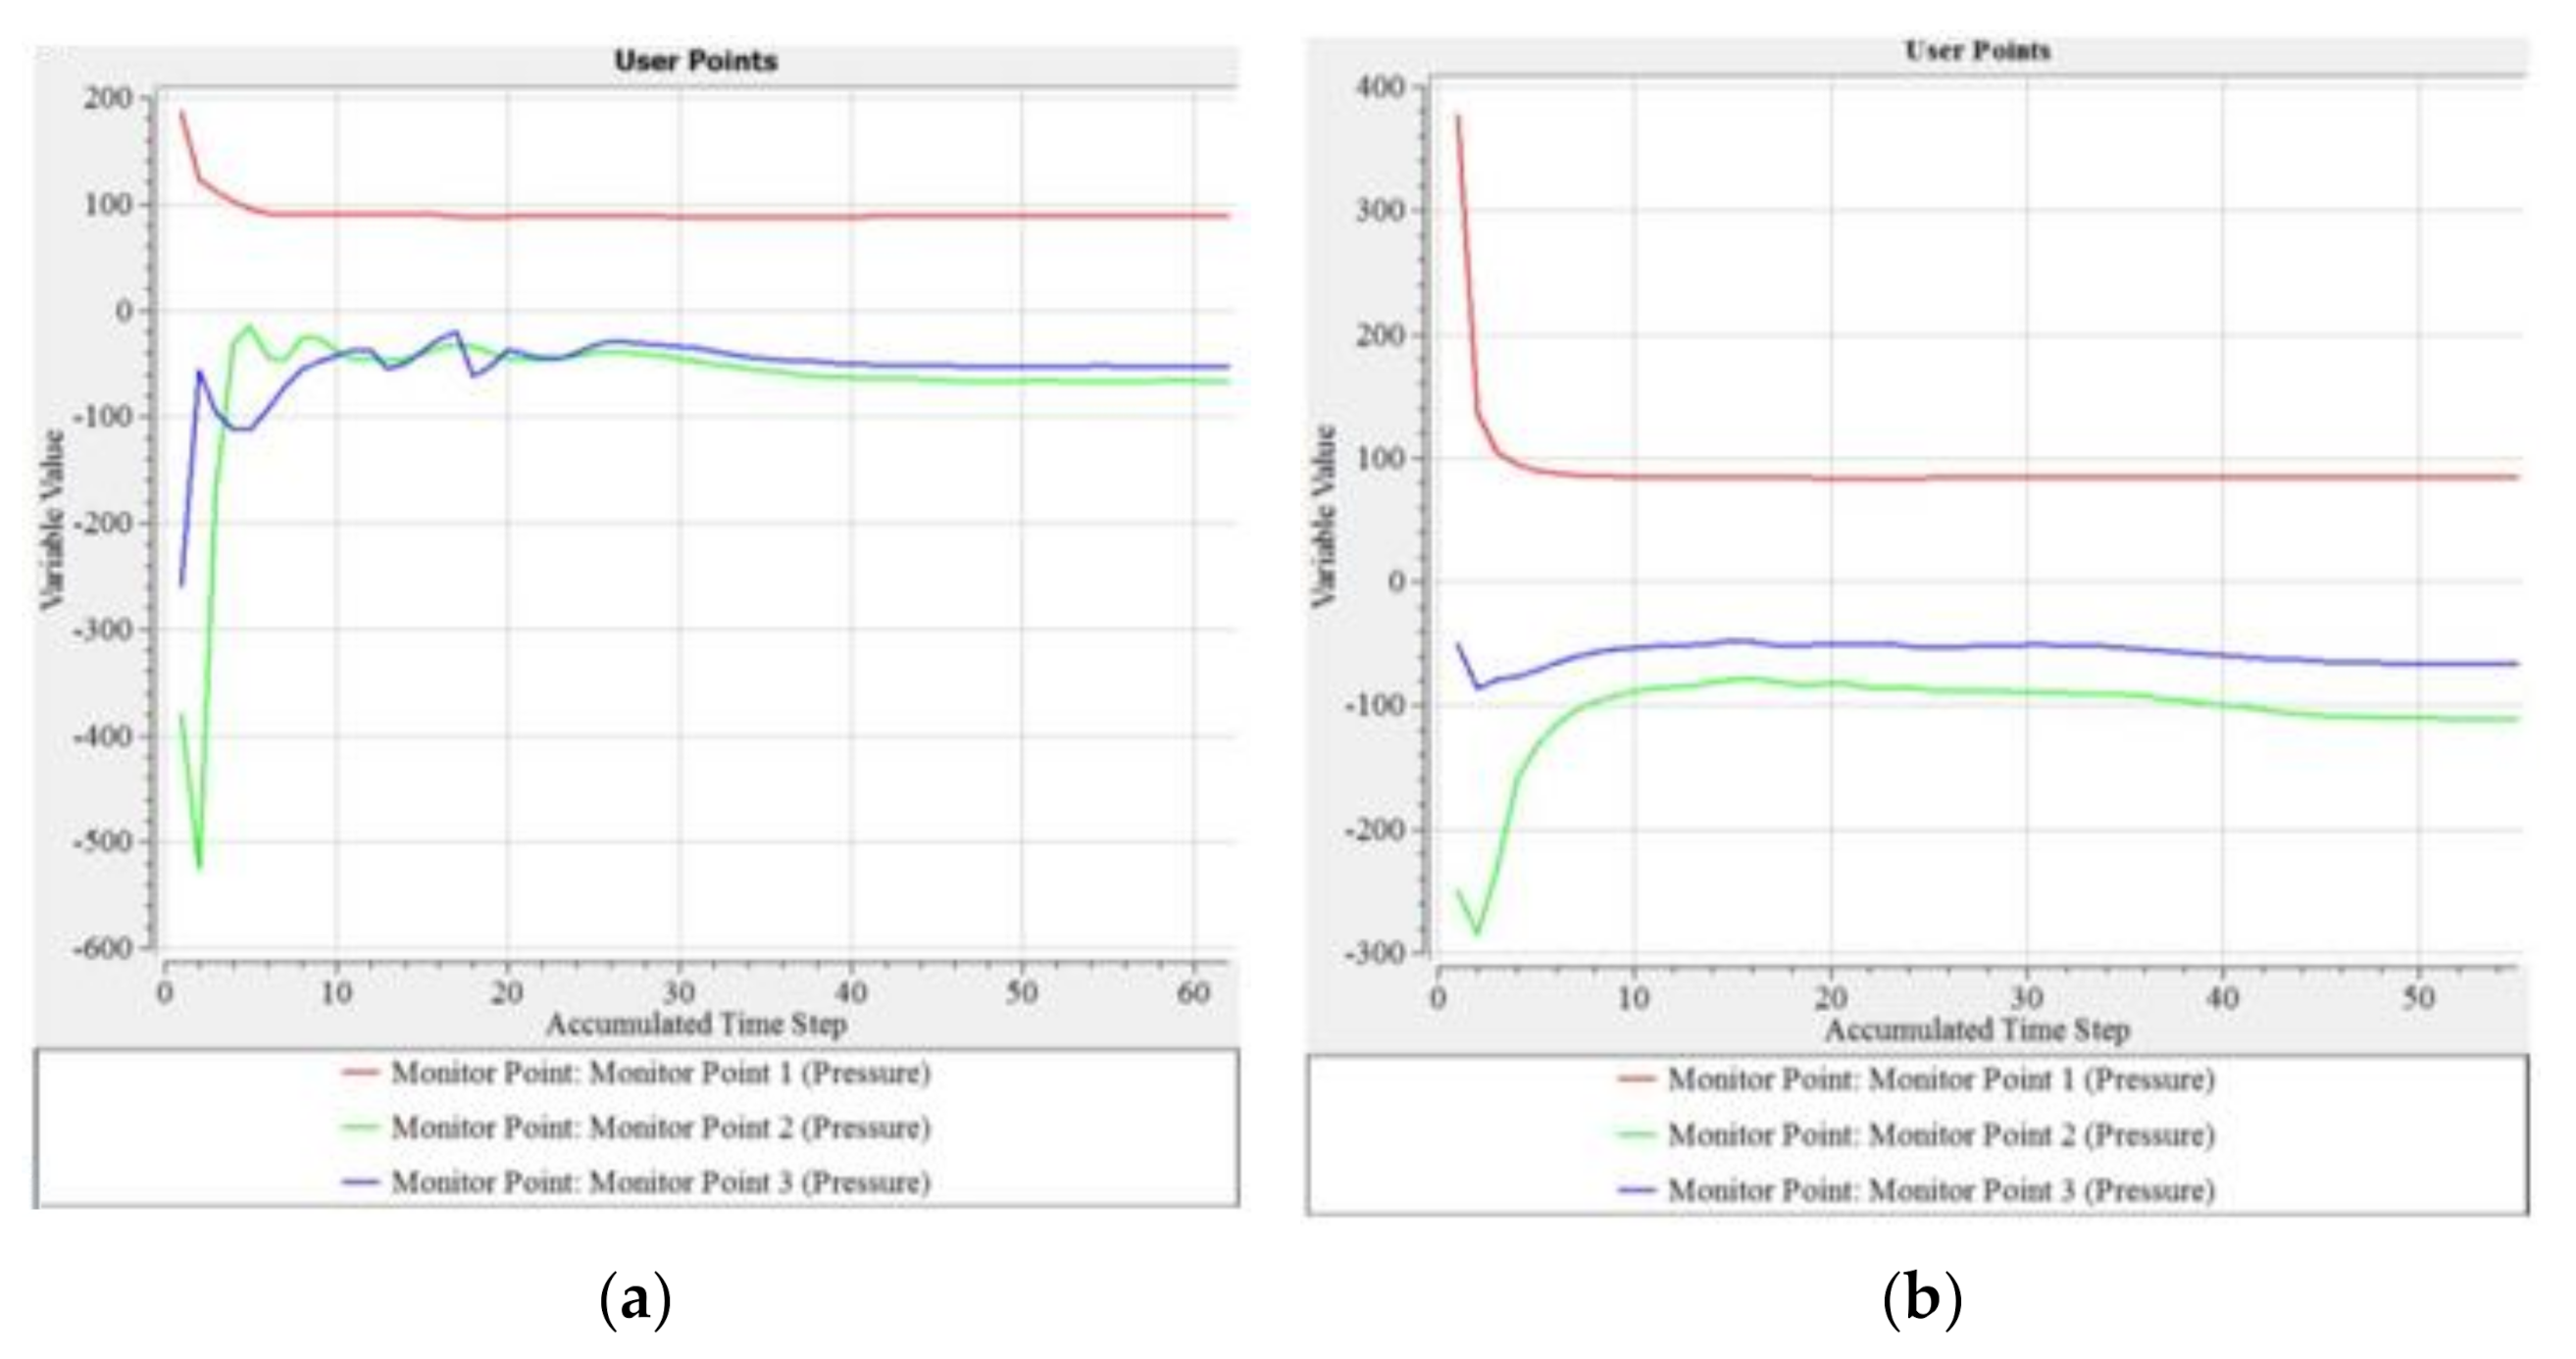
Residuals, imbalances, and pressure were monitored during the solution iteration process. For the momentum and mass convergence, criterion was set as RMS (root mean square with a required value of 1 × 10⁻⁵; see Figure 10a,b. An imbalance of velocity vectors reached stable values of ±0.0005% and less after several iterations. Three randomly positioned points around the circumference of the objects were created just to monitor another convergence: pressure changes depending on iteration; see Figure 11a,b. When all monitored variables no longer changed significantly, the flow simulation was stopped and considered converged.
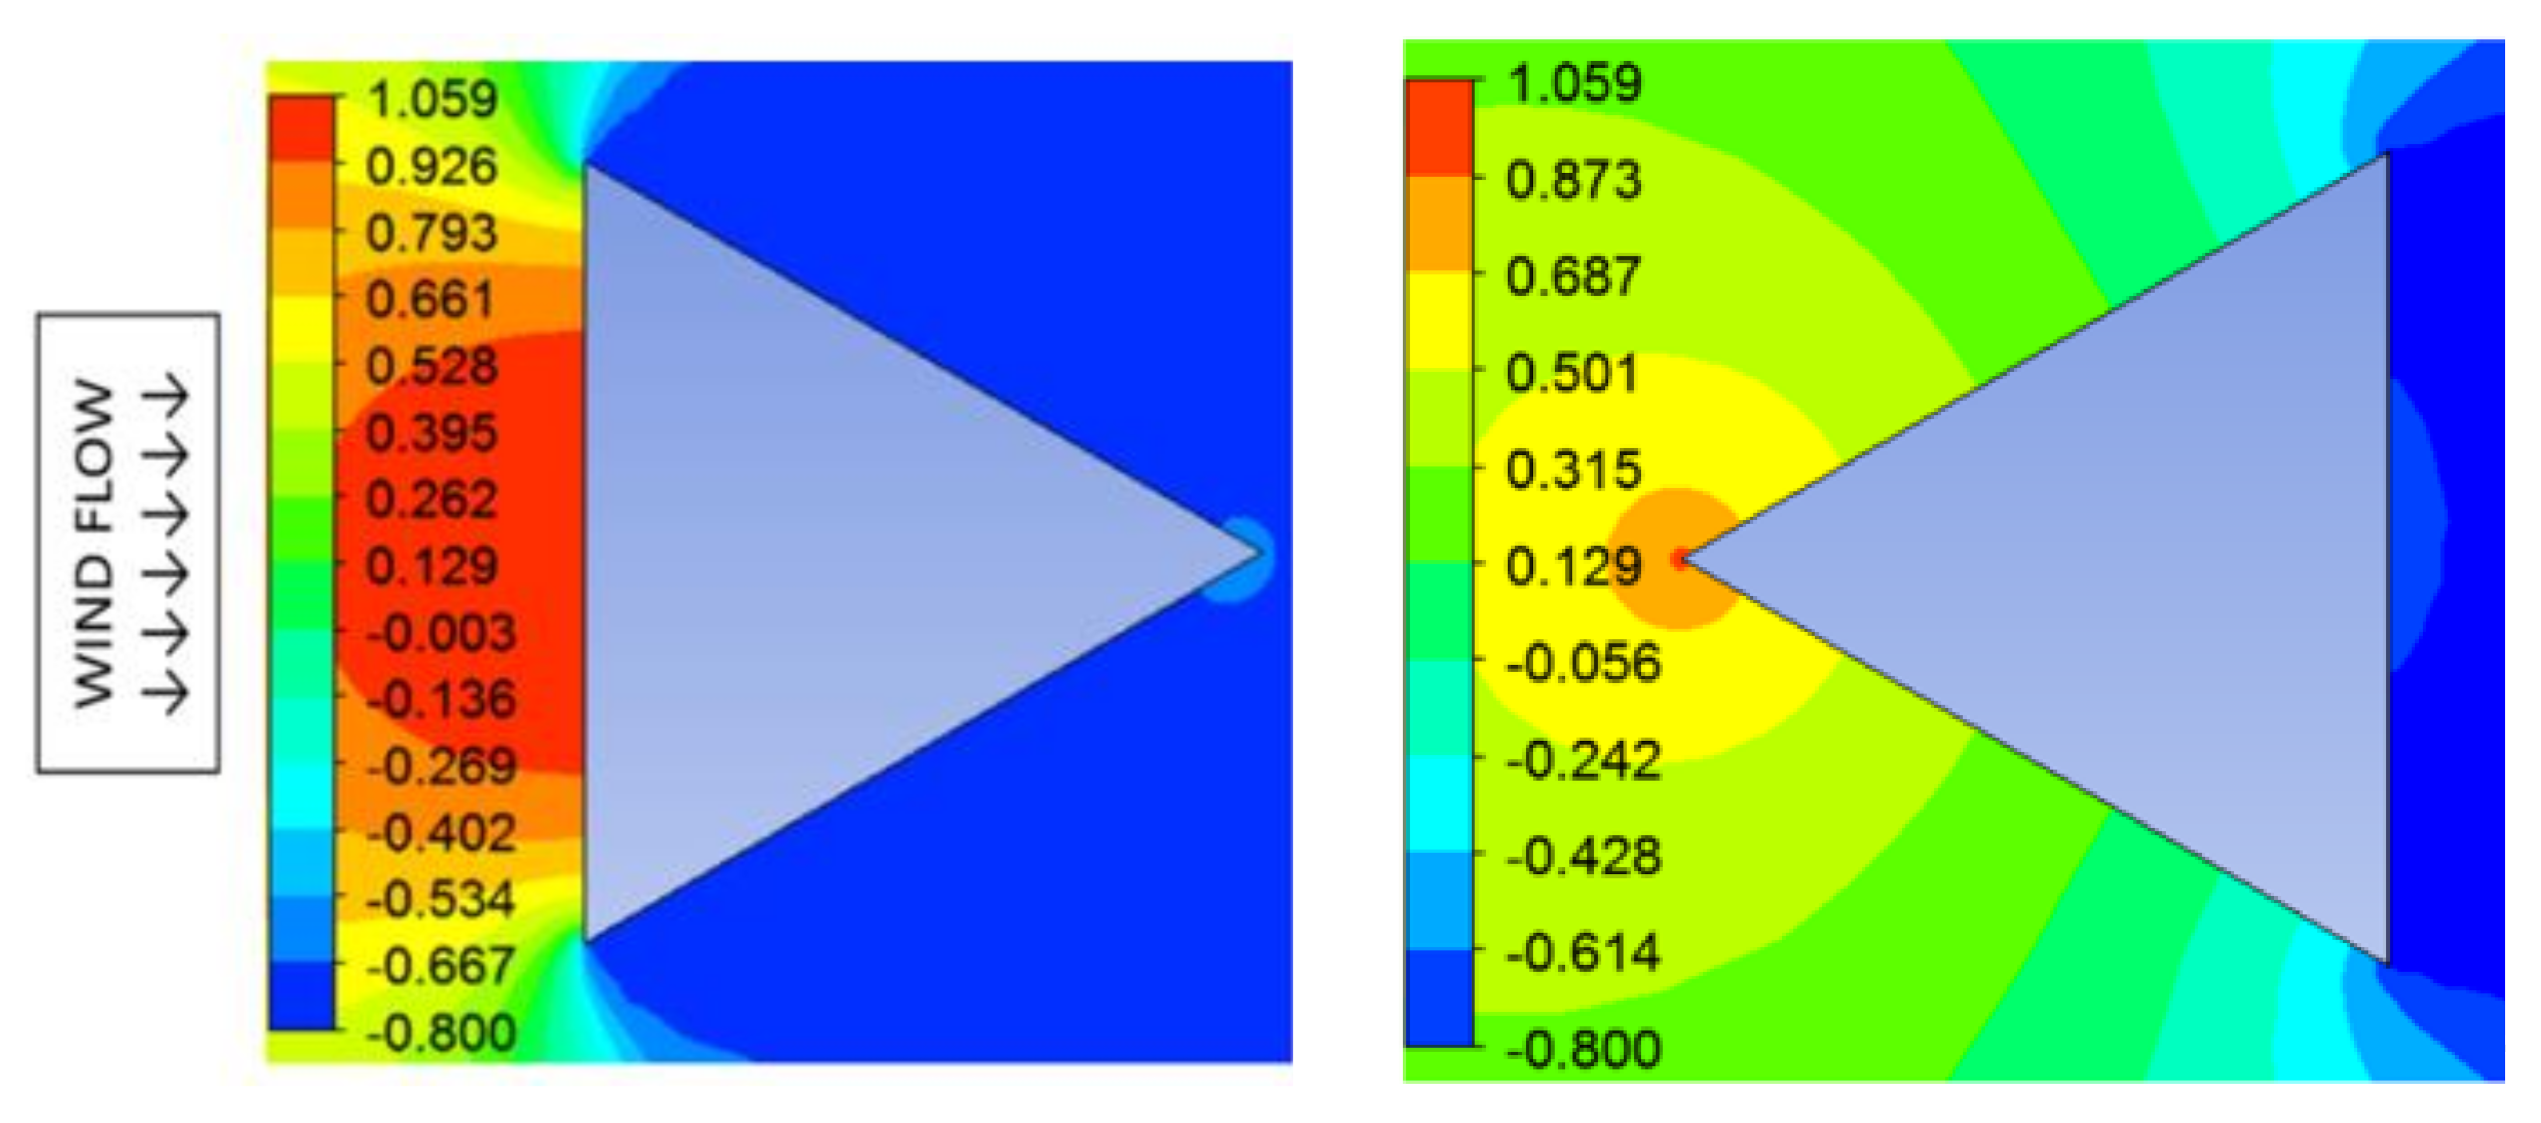
Wind pressure coefficients calculated for the two directions of wind flows are shown in Figure 12. In both cases, the wind flows from left to right.
5. Comparison of Results Obtained by CFD Simulation and Wind Tunnel Experiment
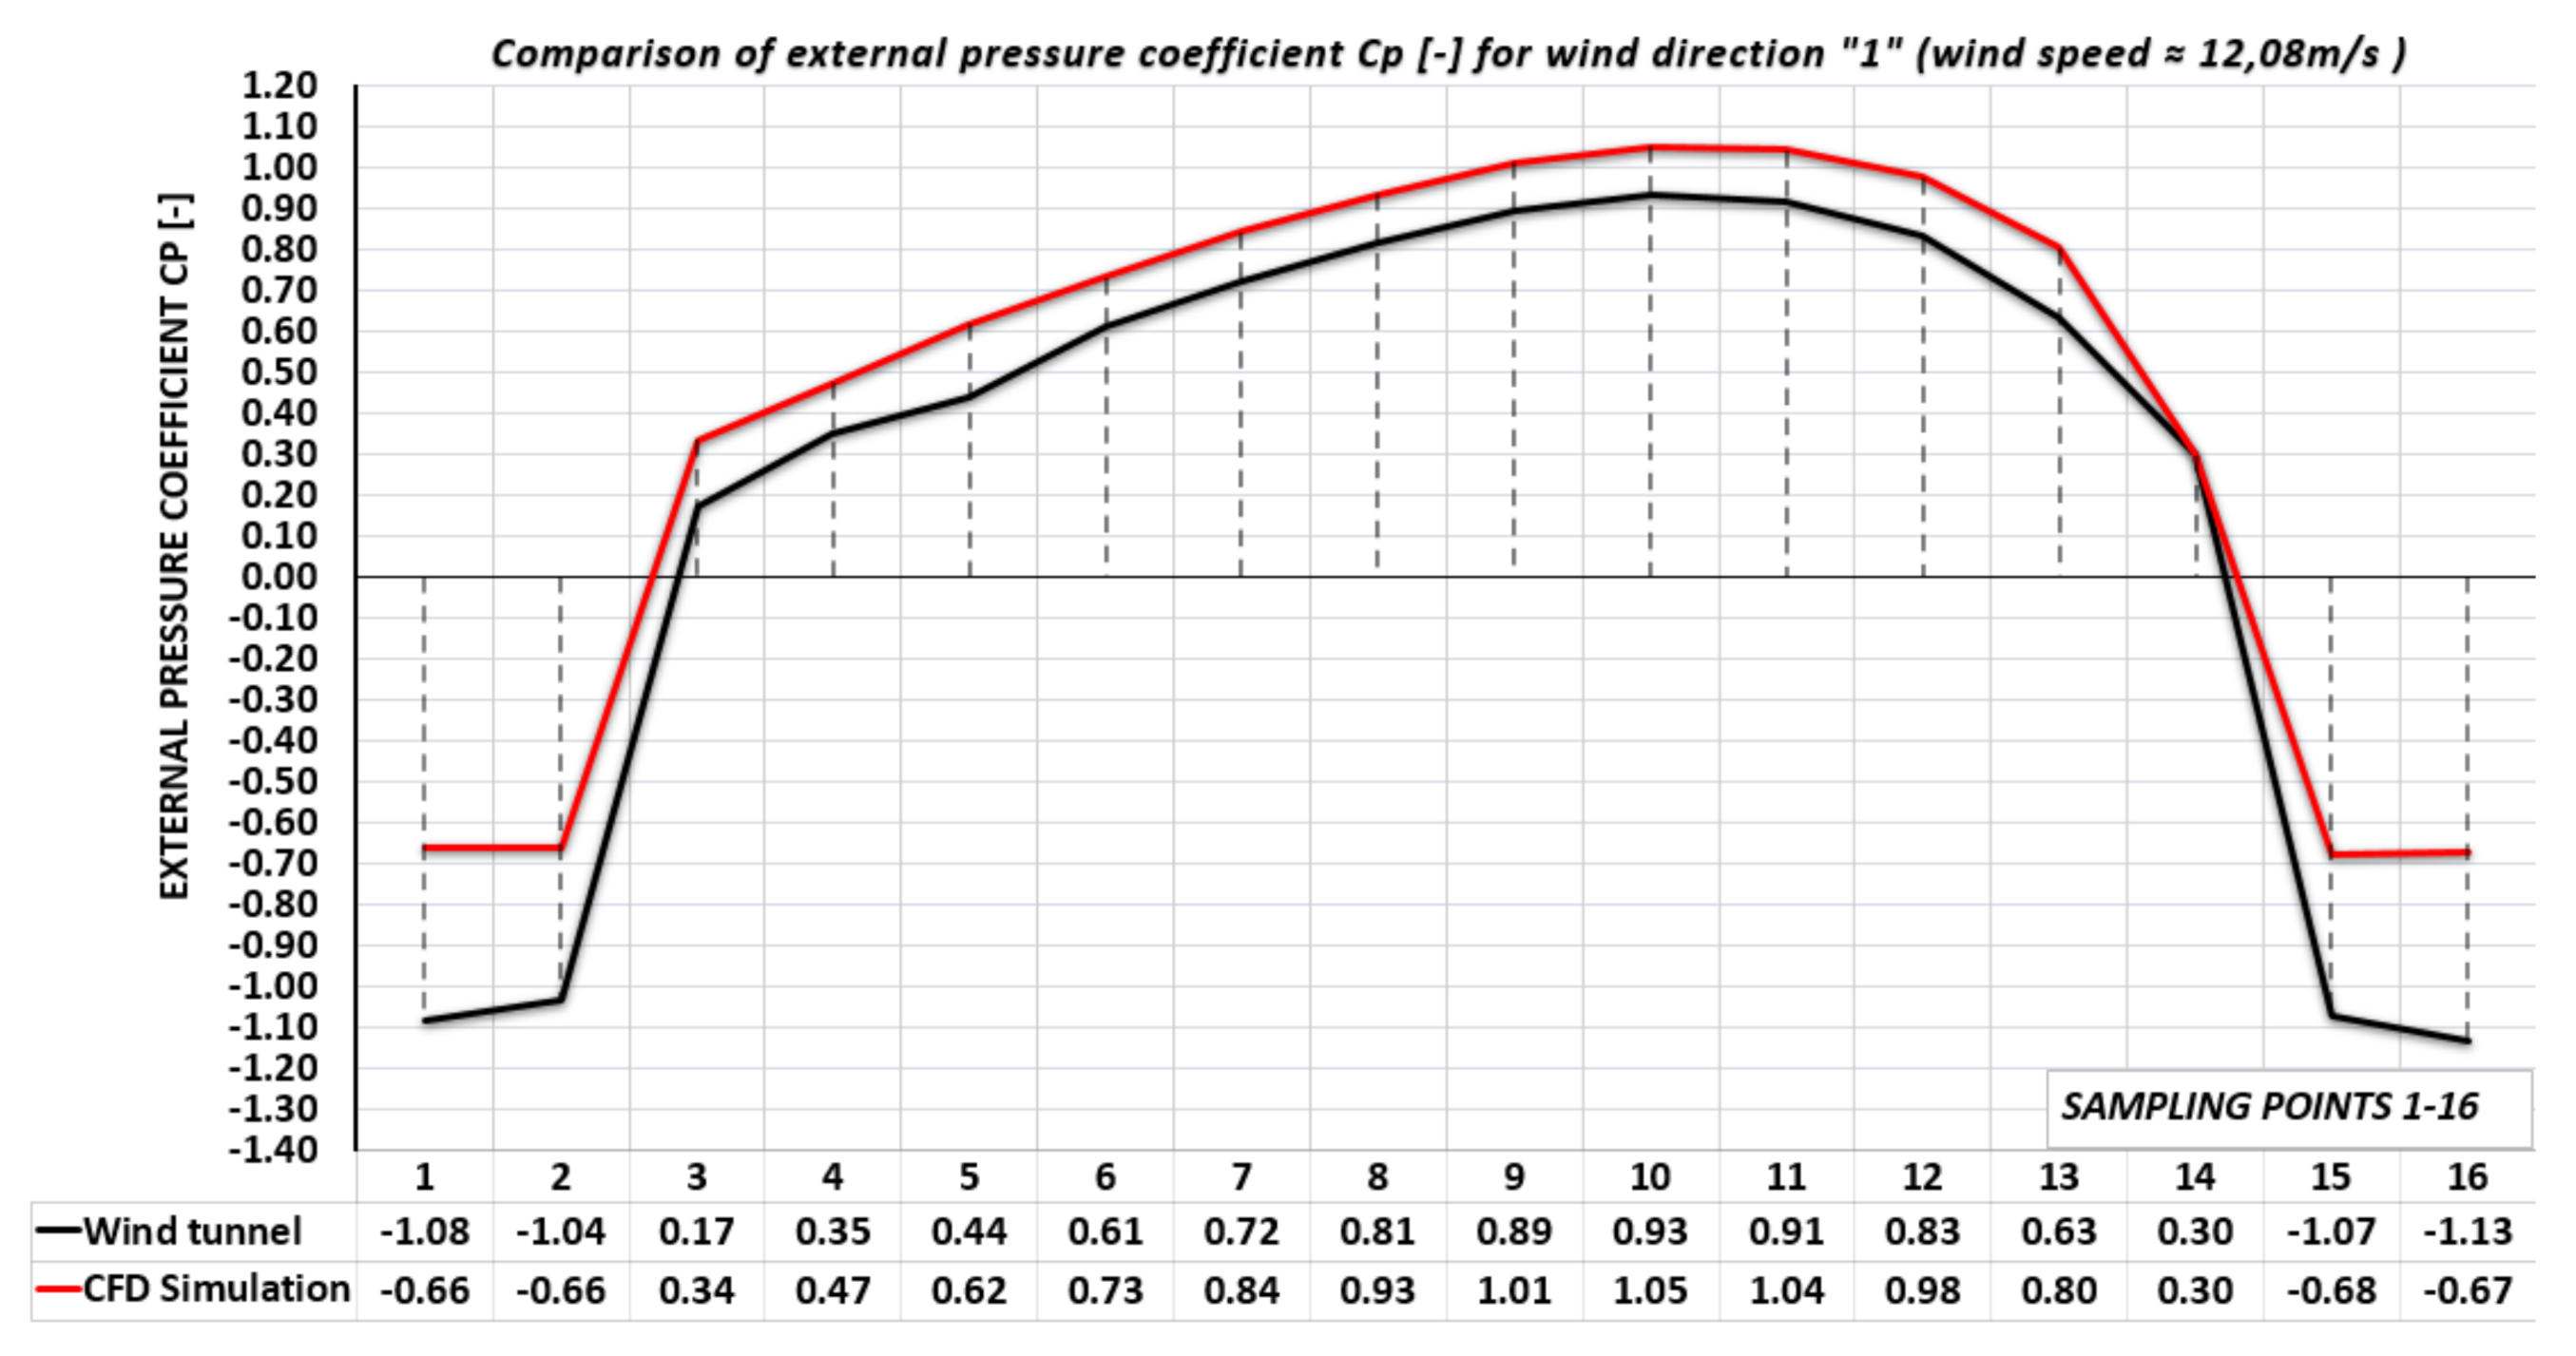
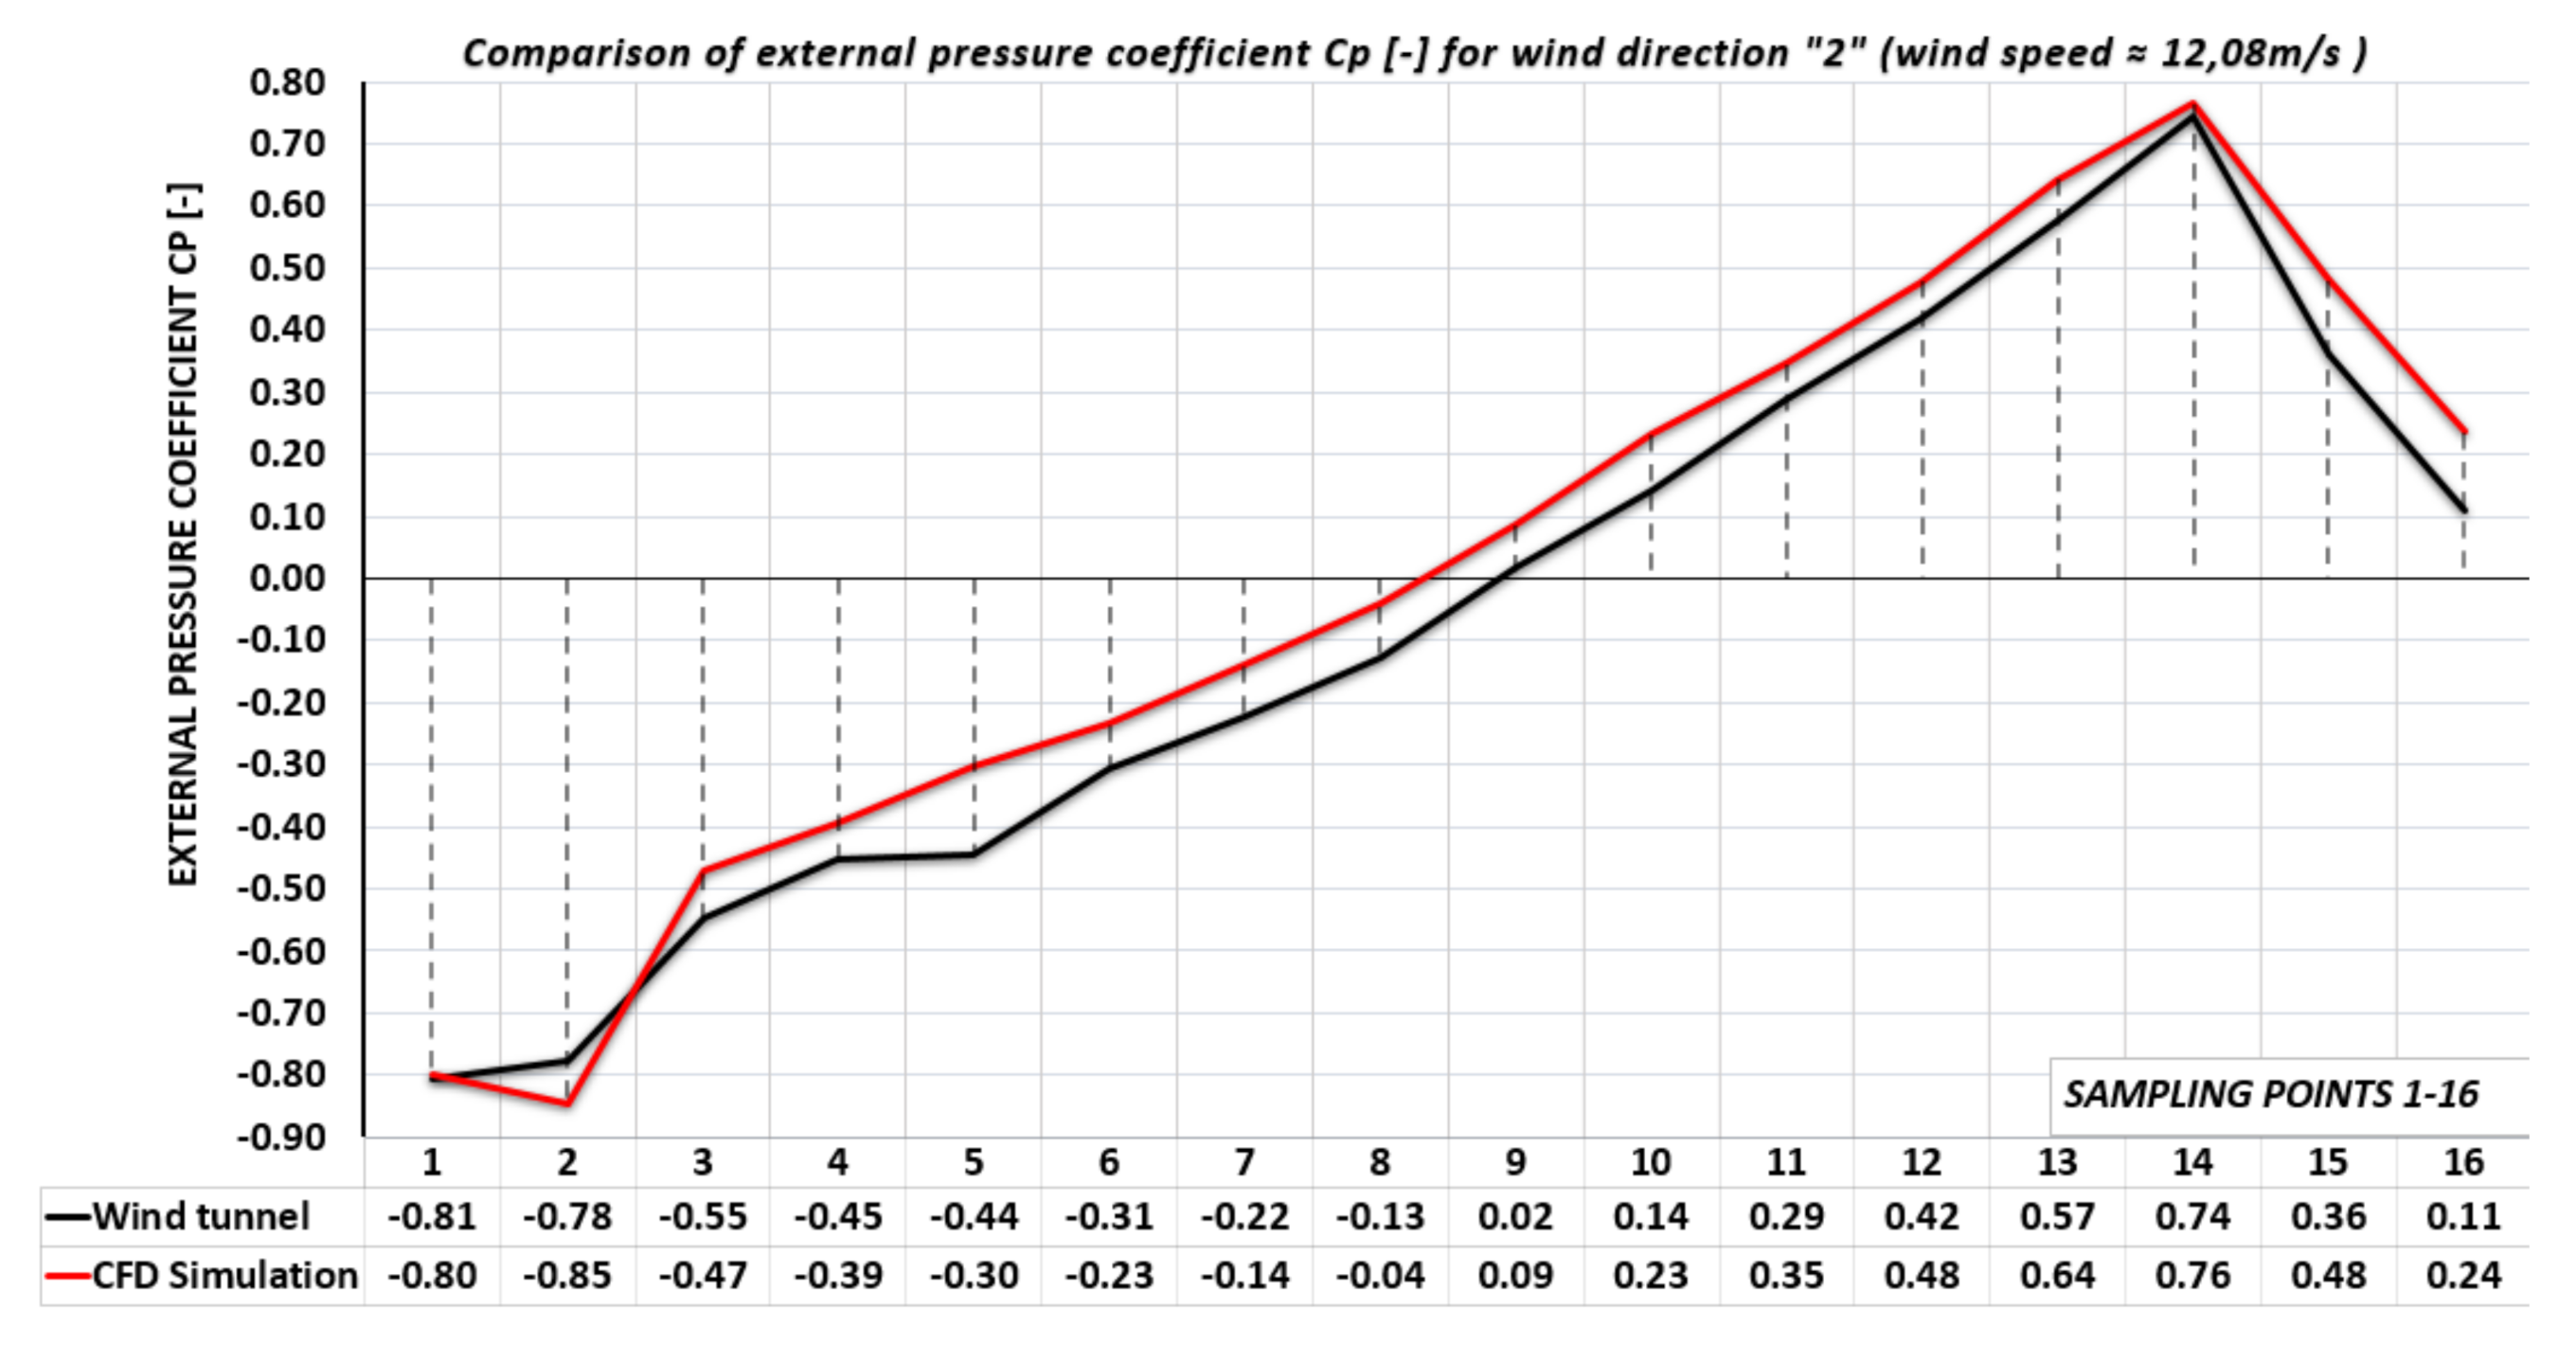
Results of the pressure coefficient were mutually compared in 16 sampling points and two directions of wind flow. The software calculation utilizes some inputs measured directly during the wind tunnel tests and thus achieves a higher match and eliminates differences of the main input variables. Results of comparison are shown in Figure 13 and Figure 14. In these figures, the numbers of sampling points are marked on the horizontal axis, and the results of external pressure coefficient are marked on the vertical axis.
Figure 13 and Figure 14 show a difference in the values of Cp between methods; however, the shape of the curve is identical. The percentage difference between the two methods was expressed by calculating the area under the curves of each Cp, and the percentage difference between the two surfaces is the desired result. For wind direction 1, the percentage difference between methods is 2.6%. For wind direction 2, the percentage difference between methods is 1.4%. This difference is due to many factors. The most significant factor is the averaging of values of measured pressure in wind tunnel tests. Wind speed during the wind tunnel tests never reaches the exact same constant value despite the fact that it can be considered as steady. The difference between the average and the actual wind speed in the frontal space of the wind tunnel in Bratislava is approximately ±1.5%. For better explanation and visualization of how wind speed affects wind pressure coefficient, transient software CFD analysis is presented in which the wind speed was defined as a variable with a difference of ±1.5% from the original constant value of 12.08 m/s. The change of the pressure coefficient depending on the varying wind speed and time for one of the sampling points can be seen in Figure 15.
It is clear from the above results that both methods are capable of obtaining relatively similar results, as demonstrated by the mutual verification. For the calculation of Cp and wind speed for the purposes of engineering practice, it is quite sufficient to use mathematical models of the RANS group with correctly set boundary conditions. However, if needed, it is also possible to use a more complex mathematical model such as the large-eddy simulation (LES) model to determine for example the wind pressure distribution on the building surface or wind speed at the cost of extreme hardware requirements and also calculation time. In order to give space to possible use of the LES model, other authors present its advantages, disadvantages, and comparison with experimental measurement in [14,15].
6. Wind Effects on the Real Size Building Complex in Urban Area
The analyzed complex consists of two residential high-rise buildings (two triangular Panorama City towers) and one rectangular high-rise office building (Tower 115) that is directly adjacent to the Panorama City buildings; see Figure 16.
The urban area where the buildings complex is situated can be classified by [1] as a terrain of categories number III/IV (taking into account the planned construction in the given location). The average wind speed in this location measured 10 m above ground is 12 m/s with predominant northwest flows referenced to [17]. For the software analysis, real wind speed (12 m/s) was used as a basic wind speed. Subsequently, based on the approach stated in [1], inlet wind speed was calculated with consideration of log wind profile according to reference [18].
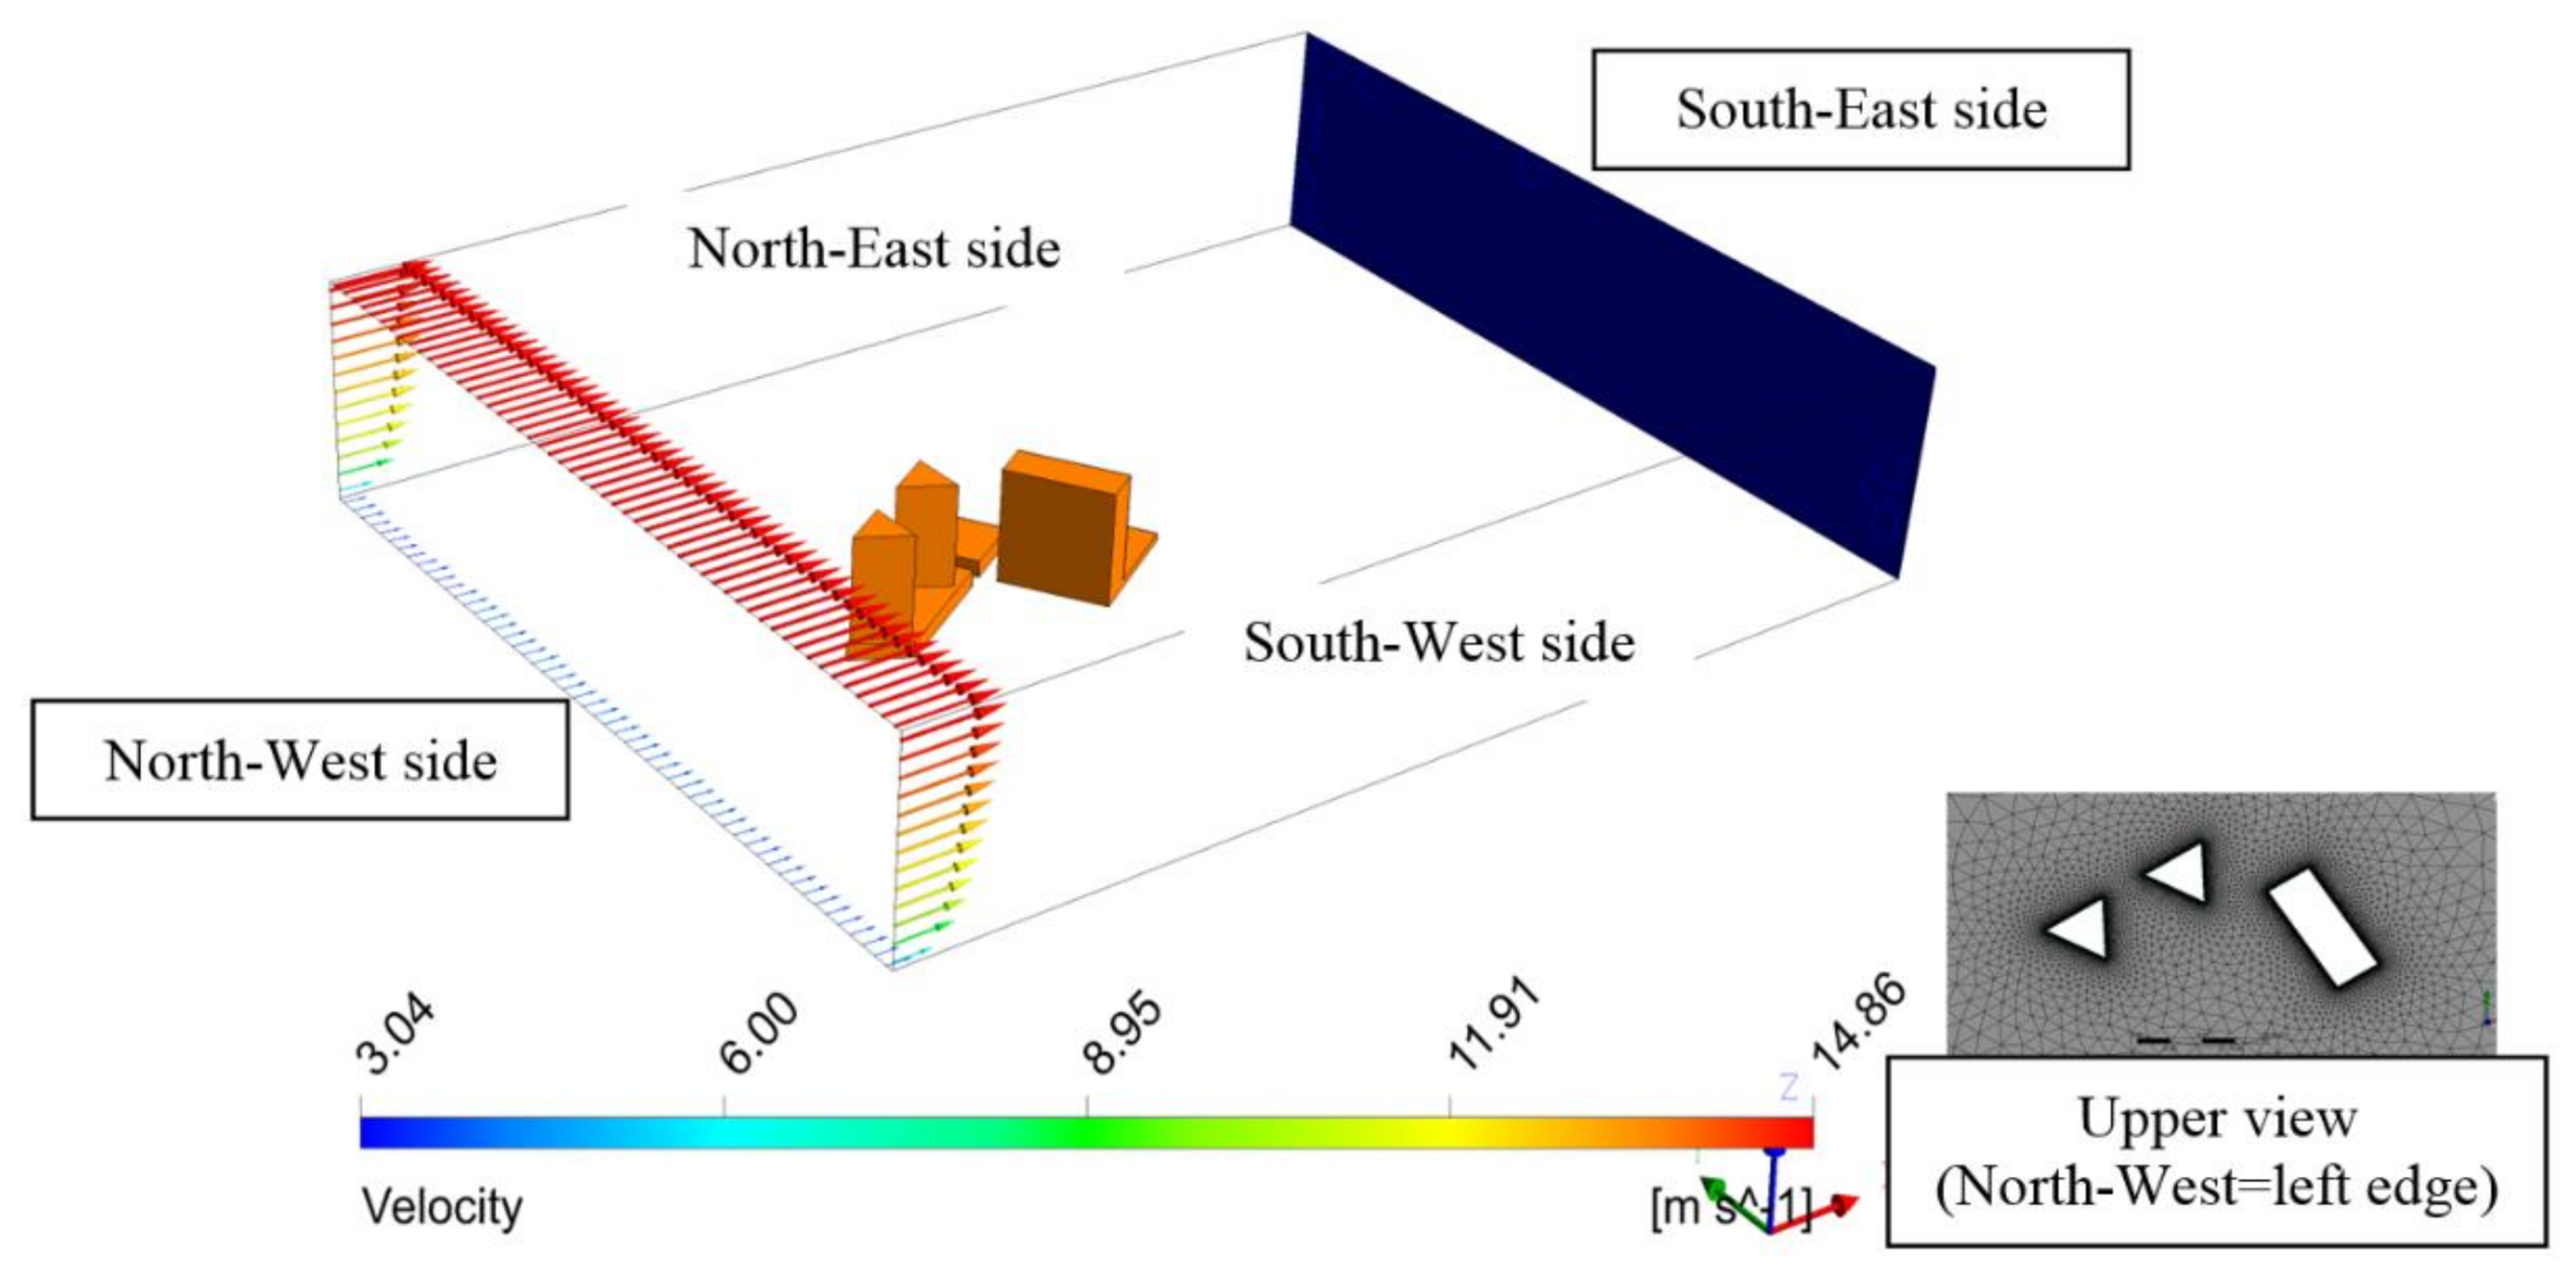
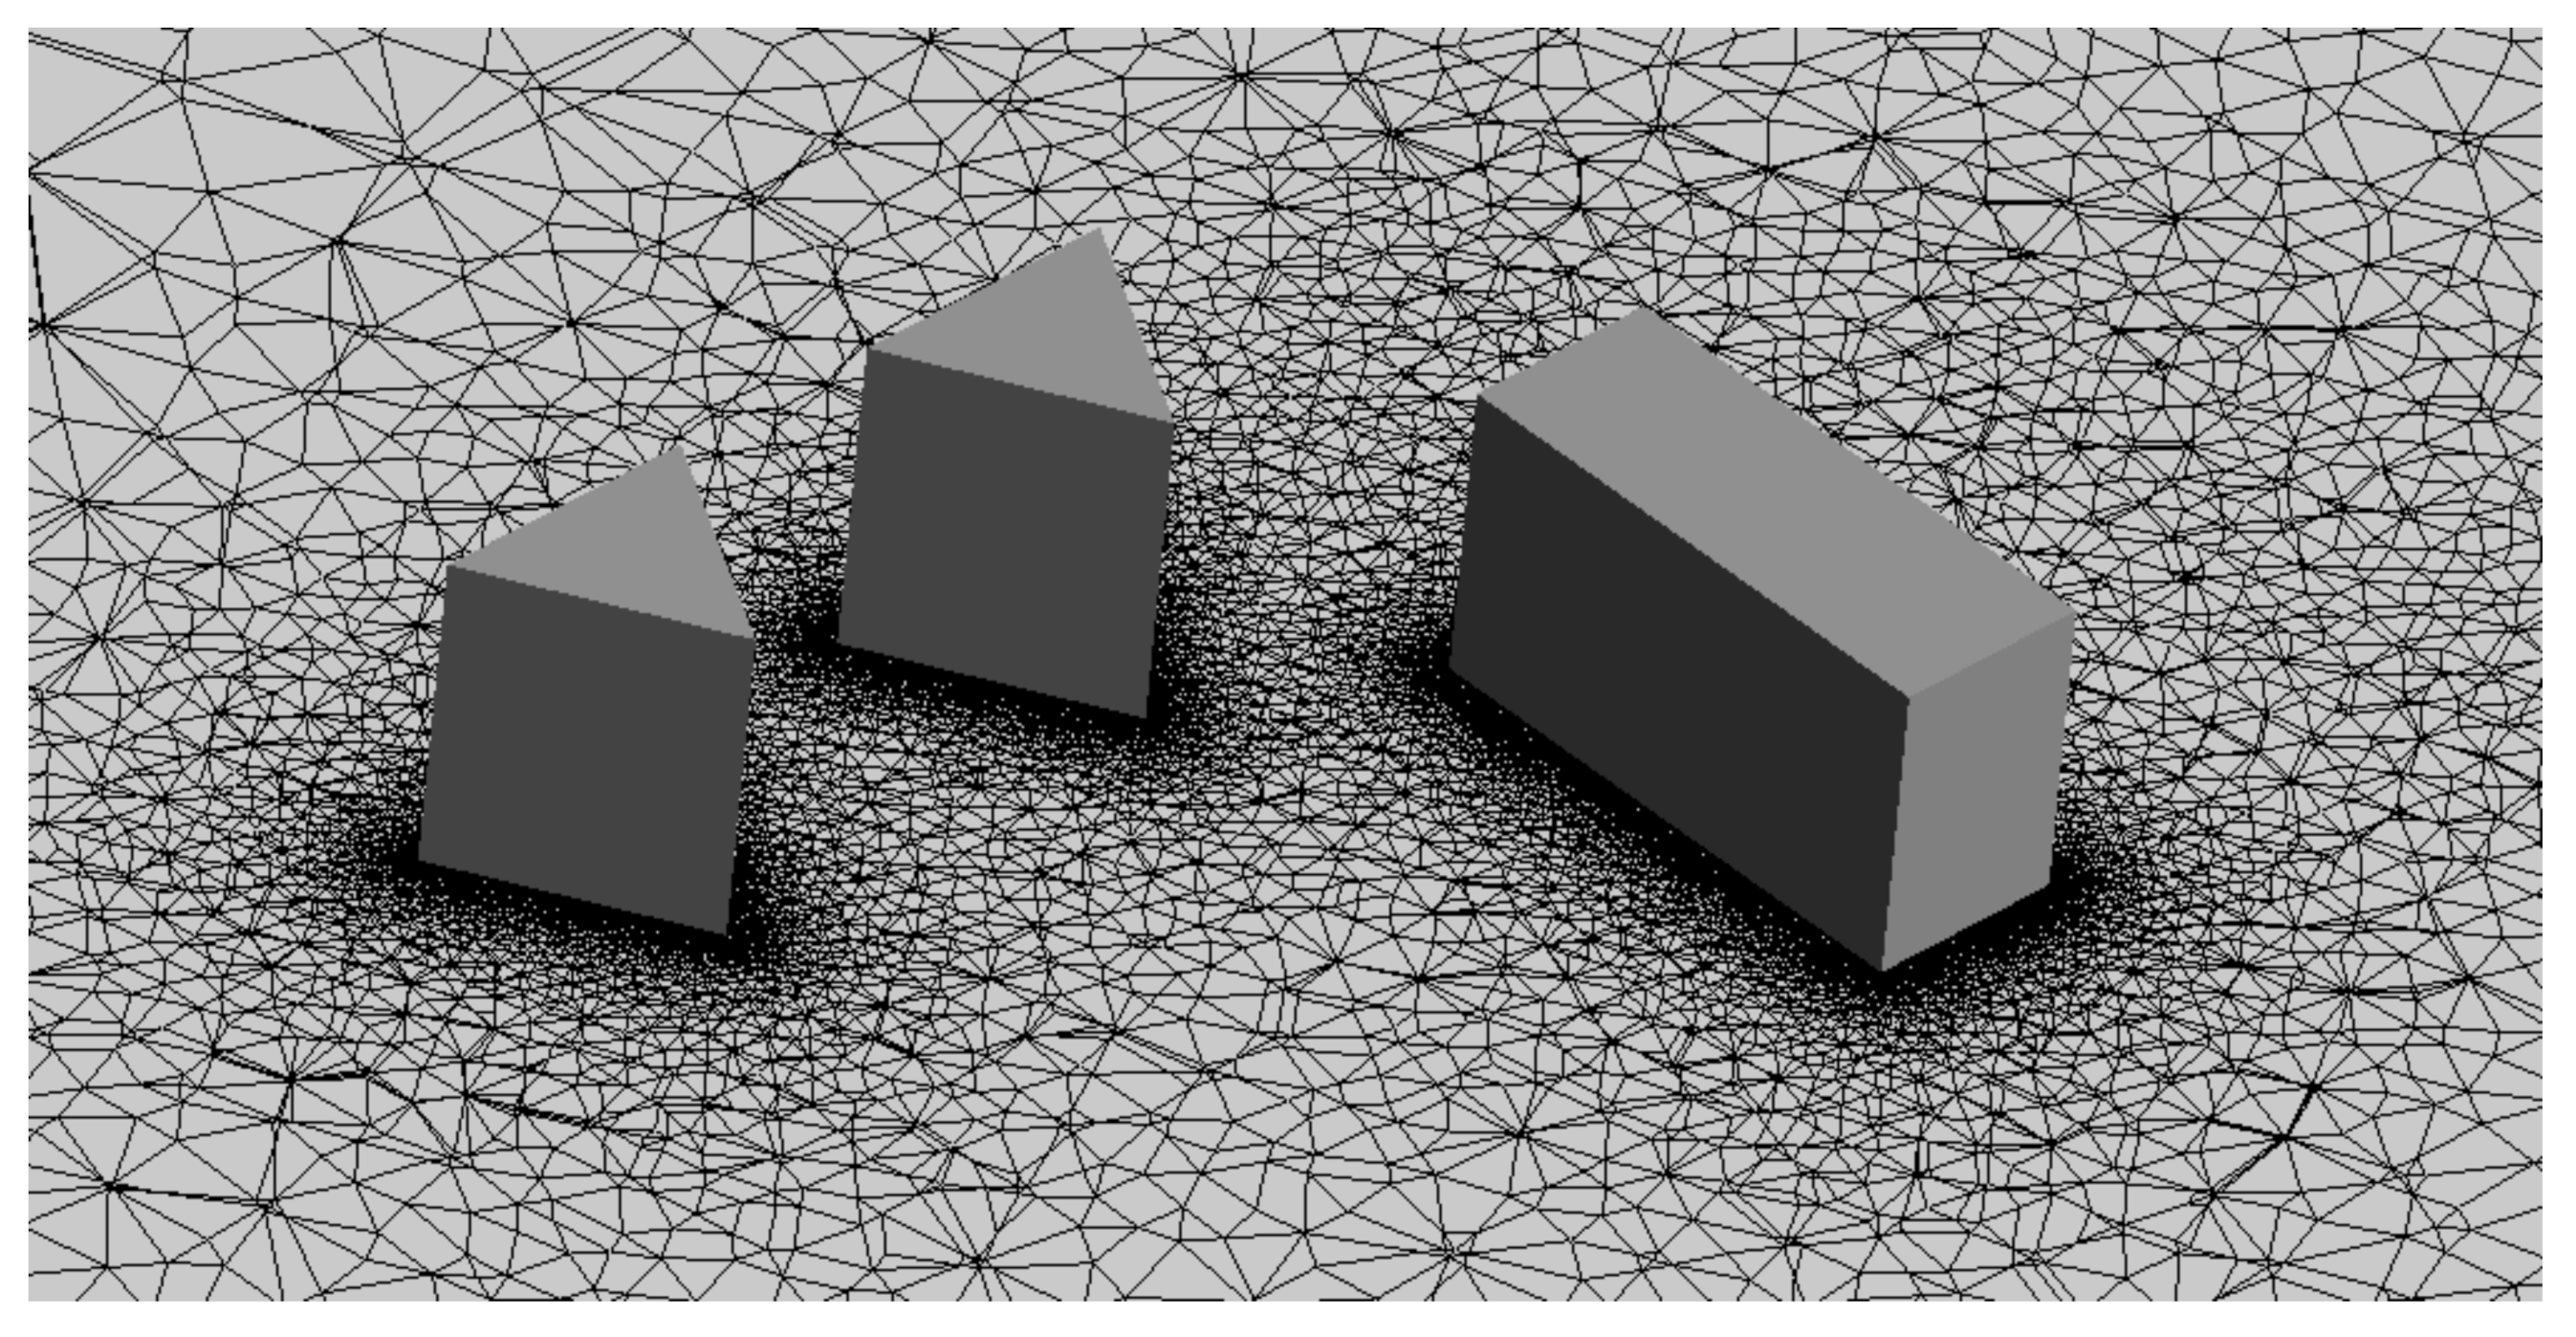
By creating a discreet environment of size 1030 m × 800 m × 200 m (see Figure 17) together with creating a mesh (see Figure 18) and applying boundary conditions such as inlet wind speed, outlet pressure, and properties of air, it was possible to execute CFD software analysis. The inputs for CFD analysis were set to roughly represent the most frequent wind flow direction and the corresponding wind speed in the specified area where the buildings are situated. The meteorological data are from [17].
The default domain consists of 6,397,230 tetrahedrons, 13,126,219 prisms, and 2725 pyramids: a total of 19,526,174 elements. The minimal size of an element side was set to 0.3 m, which was set in a very close distance to buildings and progressively increased to the areas where accurate capture of the flow vortices is not required. However, there is still a need to maintain a domain size for compressibility problems and proper convergence.
The mathematical model SST (Shear Stress Transport) was selected based on good previous experiences with result accuracy, e.g., from the previously mentioned verification.
A detailed investigation and verification of the results of the wind flow of a high-rise building of another type but using another mathematical model and different approach is listed in [19].
Momentum and mass convergence criterion were set as RMS with the required value of 1.10−5. The imbalance of velocity vectors reached stable values of ±1% and less after numerous iterations, and also, randomly positioned points around the circumference of the objects were created to monitor another convergence: pressure changes depending on iteration. After the RMS criterion was met, imbalances did not change significantly, and pressure at probing points did not change significantly either; thus, the solution was stopped and considered as converged.
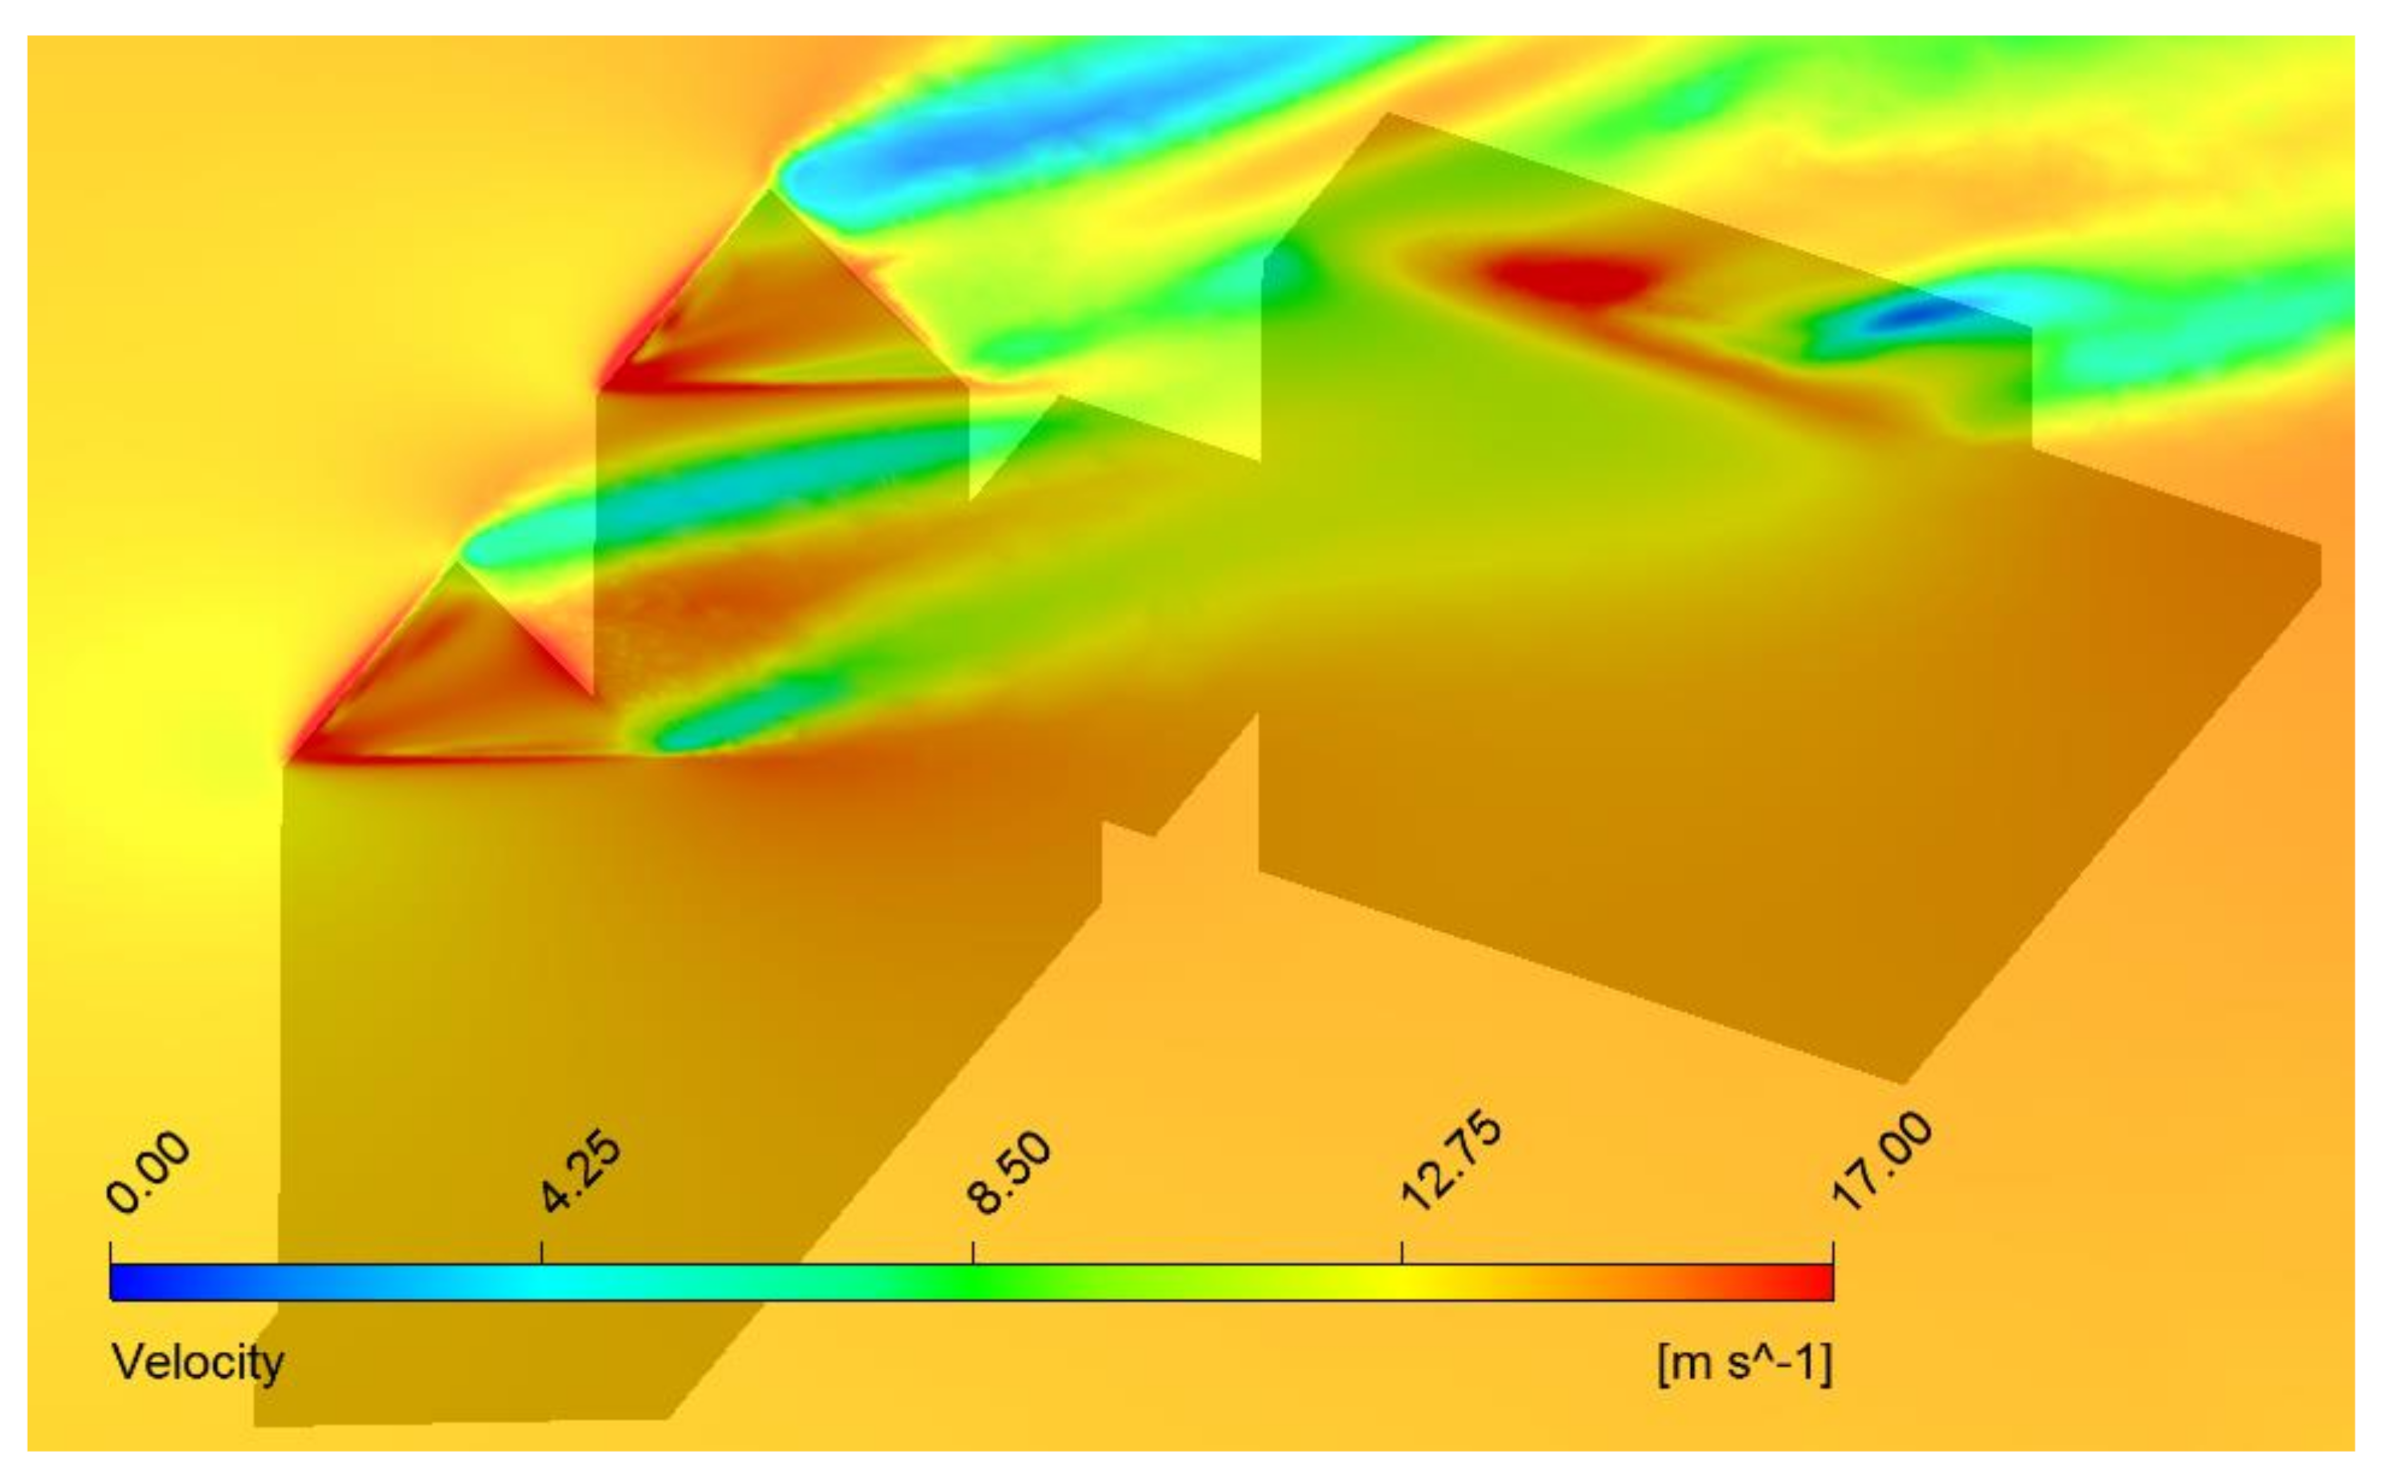
Subsequently, it is possible to proceed with the results. The streamlines of wind speed in Figure 19 show that wind flow between buildings does not cause a significant growth of wind speed compared to an inlet wind speed. Positioning of the buildings is creating vortices but without extreme increases of wind speed. However, what is clearly visible is that the northwest tower affects wind flow for the northeast tower and Tower 115. Analyses of whole building complexes situated in urban areas are important because the wind pressure and turbulence pattern vary depending on the area in which the wind is operating, and it also depends on the height of the buildings and their mutual arrangement. It is often the case that high-rise buildings are designed without taking into account the surrounding buildings and especially without taking into account the significantly higher wind speeds that arise as a direct consequence of the wind overflowing a building standing in front. The shape of the building is crucial here; therefore, it is important to list the sources that examined buildings of other shapes [20,21,22,23].
These days, another important role of wind study is to prove the suitability of the building’s location and its chosen shape in terms of building energy performance. At present, many optimization methods are used to generate a large variety of solutions to analyze integrated building design in the early stage, as mentioned in [24]. Increasing emphasis is placed on the installation of wind turbines directly on or in close proximity to the building, thus ensuring the partial self-sufficiency of the building. Based on the flow rate and turbulence profile, wind turbines can be placed directly on the buildings as mentioned in [25] or in close proximity to the buildings as a part of a small wind farm. The proper deployment and appropriateness of the use of turbines in the urban area are listed in [25,26]. In a simple way, the following important requirements must be met for placing a wind turbine directly on the building or in its surroundings: relatively steady wind speed that does not exceed the turbine limits set by the manufacturer, meeting safety regulations with regard to the location of turbines, solving undesirable oscillations arising from the installation of a wind turbine on a building, and meeting noise standards caused by rotation of the propeller. By meeting these and other additional requirements, it is possible to place wind turbines directly on the building or near the building. The building becomes multifunctional and fulfills not only functional and design features but also ecological features. In the event that the building owner decides to install wind turbines on the building in the future, the results of the wind velocity profile shown in Figure 19 could serve as a basic pillar for their preferred location. From the results of our simulation, the suggestion for the most suitable place for the location of wind turbines appears to be the roof—more specifically, the front sides of the roof, where wind speed is the highest (Figure 20) and turbulence is not visible (Figure 19).
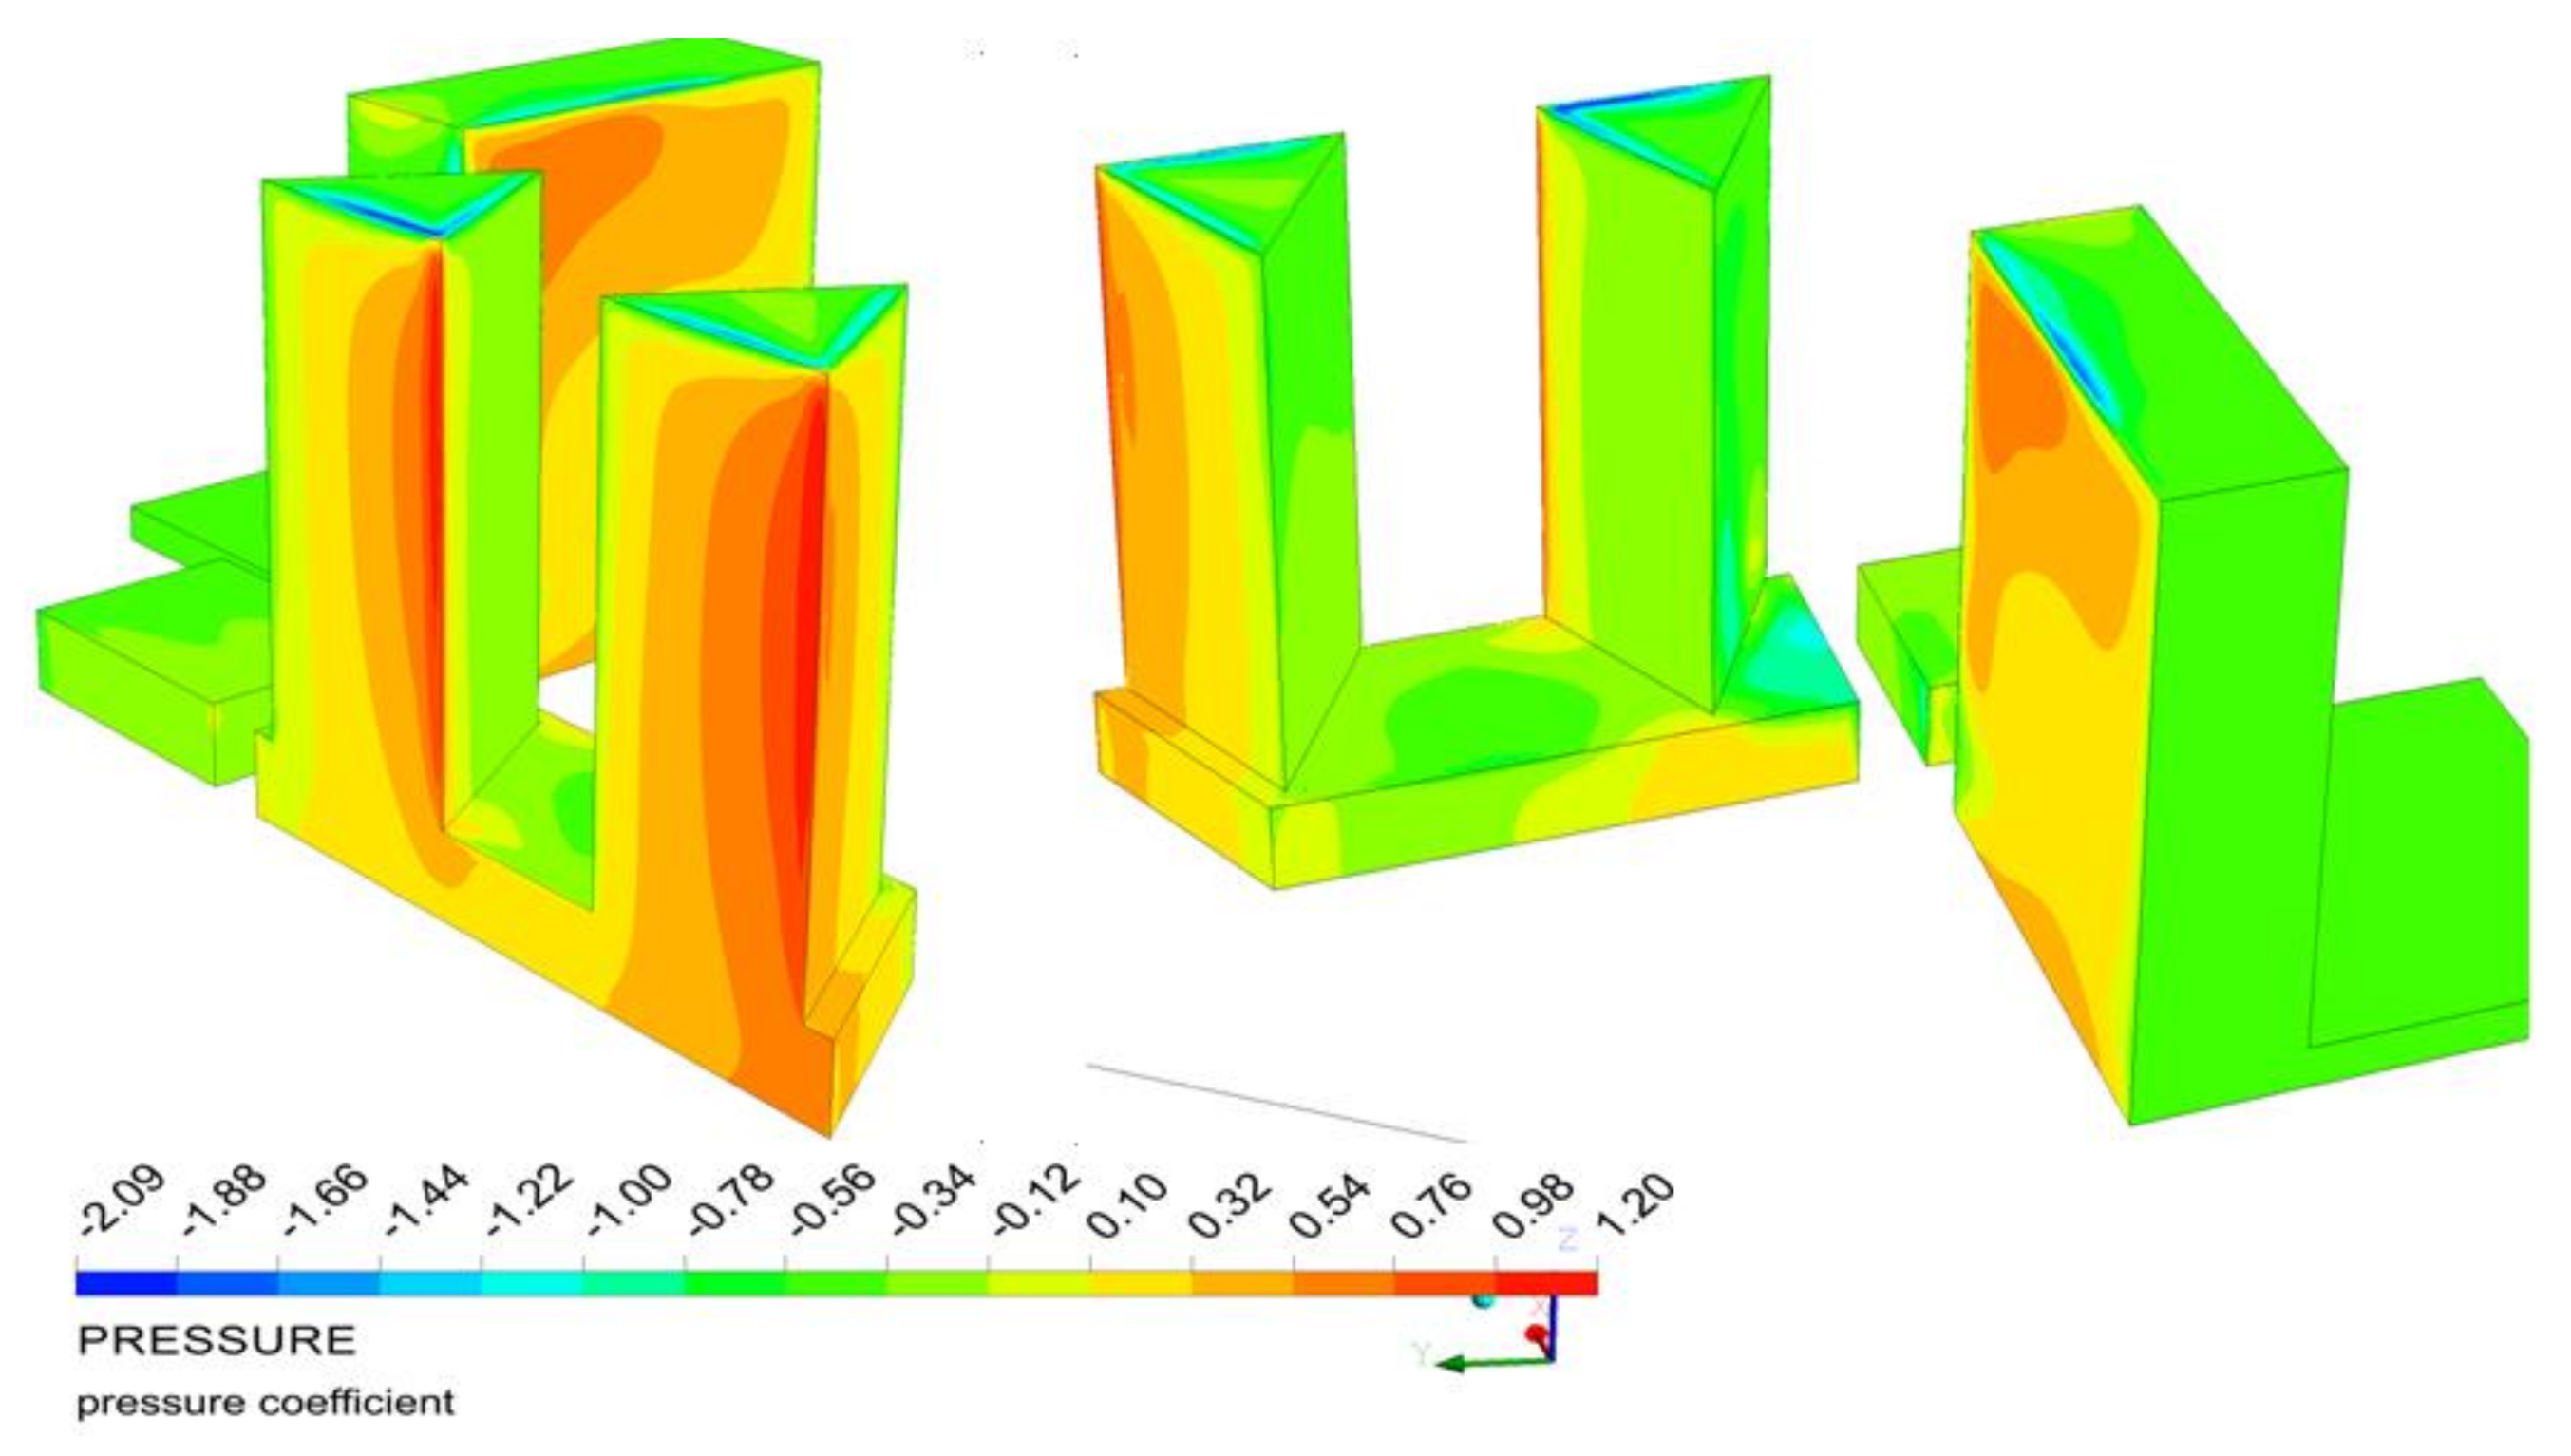
Returning to the main subject of this article, the results shown in Figure 21 indicate that the major part of the windward side is exposed to the wind pressure without the occurrence of significant peaks. The leeward side and corners are exposed to lift, however, without occurrence of significant peaks, too. The most significant wind effects can be observed on the building’s roof where the lift effects occur predominantly. The results can be applied to a large number of phenomena that may occur in the future in connection with these buildings. For example, the northeast triangular building which is in eclipse behind the northwest tower is greatly affected by the wind stream created on the sides of the northwest tower; therefore, local peak values in case of extreme winds could cause façade damage on the east–west tower. This phenomenon is often not included in static calculations, as their design is very often handled as that of free-standing buildings.
7. Conclusions
Through using both mentioned methods, it is possible to analyze the values needed for design of the high-rise building structure. Wind studies are an integral part of either the preliminary or the final design of a high-rise building. These days, buildings that have been traditionally designed symmetrically are very rare, and unusual designs are rising. For engineers and designers, it presents a big problem, because it is not possible to include calculation procedures for wind effects for all building shapes. Despite the fact that these procedures are absent in the general standards, research in this area is still ongoing, as evidenced by the articles [27,28,29], which on the one hand can be very helpful and on the other hand these articles are often written too scientifically and thus rarely sought after by practitioners. Achieving safety and productivity in construction projects should be a priority in any proposal. Regardless of the phase of the project, the effects of wind on high-rise buildings should not be neglected.
To decide which method to choose for the wind effect analysis, here are some of the findings made during the research. Based on our experience so far, the CFD simulation set in the way it is presented will be also relevant for analyzing another object and will achieve very similar results of Cp compared to the wind tunnel measurement we used. As we show here, software simulations results are in good agreement with experimental measurements, which can be considered as a validity proof of the assumption that if the software simulation is properly adjusted, the experimental measurements in the wind tunnel do not have to be performed necessarily. Software simulation offers a much wider scale of results compared to values that can be obtained by wind tunnel measurements.
Differences in results that show up in comparison of both methods can originate in the following factors: (1) Position of the model in the wind tunnel: a small rotation or shift of the model in the tunnel will lead to differences when evaluated and compared with results of the software model, which can be ideally positioned and rotated; (2) Size of discrete environment; (3) Mesh type and size; (4) Input parameters set in software simulation; (5) Averaging of the results measured in wind tunnel.
The difference in results has been explained in more detail in the article itself. However, results are clearly stated, and to evaluate whether the difference between the methods is acceptable is a subjective decision. For the purposes of engineering practice, in the authors’ opinion, the agreement is very good, and the results are applicable to practice—so the article is valuable mainly in this area.
For most engineering applications, the RANS models (Reynolds-averaged Navier–Stokes), where the SST model belongs, are accurate enough. For engineering practice, mostly wind speed and wind pressure in the given domain are the necessary variable. If buildings of real dimensions are designed using all safety factors, it is not a problem to use the results of an experiment or software simulation for which the comparison shows certain deviations. However, here, it must be said that this deviation should only be numerical, and the results should be the same in principle (e.g., in both methods, the distribution of wind pressure along the facade is the same and the difference is only in the resulting numbers). The results presented in the article can be used to complete the missing part for the standard [1] (where the methodology of wind effects determination for triangle-shaped buildings is missing).
When even better accuracy of the results is required, or when time-dependent variables are necessary, it is possible to analyze how wind effects act on a structure or near the structure by the more complex mathematical models such as LES (large-eddy simulation) or DNS (direct numerical simulation). The results obtained by correctly set LES or DNS mathematical models can be considered as very accurate and valuable results corresponding to the real effect of the wind in the given urban area. It must be said that if there must be a choice between LES and DNS, the LES model is far more used for engineering practice compared to DNS. The DNS model is used for analysis of phenomena where the monitoring of very small differences of variables is crucial, such as monitoring dust particles around buildings or similar tasks where it is required to monitor the effects of wind at a very accurate level and microscopic level. The use of the LES mathematical model for tasks that are similar to those presented here are described in more detail in [30].
Based on the results stated in this article and the number of experiments and comparative measurements that we have performed in the past [3,4,5,9], it can be concluded that if the CFD simulation is set up as described in this paper for the purposes of engineering practice (to analyze pressure distribution and wind speed around buildings), it is possible to analyze other building shapes without using a wind tunnel.
Although software simulations presently appear to be an ideal method for the investigation of wind effects acting upon the buildings of an irregular cross-section, still, it is only a software, and if any doubts arise during CFD simulations, it is recommended to perform experimental analyses in a wind tunnel when it comes to models (structures) of an unusual shape to verify the obtained values. The most accurate way of receiving the general concept of wind effects acting upon the structures that have an irregular floor plan, pedestrians, and adjacent buildings, can be achieved by means of an overlap between the experimental and software analysis. When choosing any of the available options, it is important to consider the available options, time aspect, and financial aspect. In most cases of wind studies, the fastest option is to use the software. The accuracy of the results depends on a number of factors, as mentioned in this contribution, so it is up to the participating sides to decide/agree on the method to be selected.
Author Contributions
Conceptualization, R.A. and N.J.; methodology, R.A. and N.J.; software, R.A.; validation, R.A. and N.J.; formal analysis, N.J.; investigation, R.A. and N.J.; resources, R.A. and N.J.; data curation, R.A. and N.J.; writing—original draft preparation, R.A. and N.J.; writing—review and editing, R.A.; visualization, R.A.; supervision, N.J.; project administration, N.J.; funding acquisition, N.J. All authors have read and agreed to the published version of the manuscript.
Funding
This research was funded by VEGA, grant number 1/0412/18.
Informed Consent Statement
Informed consent was obtained from all subjects involved in the study.
Data Availability Statement
Both authors declare that they have read and agree with MDPI Research Data Policies at https://0-www-mdpi-com.brum.beds.ac.uk/ethics.
Acknowledgments
Grant Agency VEGA, project No. 1/0412/18 which supported this paper.
Conflicts of Interest
The authors declare no conflict of interest. Research and article publication are financially supported by Grant Agency VEGA, project No. 1/0412/18. The funders had no other than financial role in the design of the study; in the collection, analyses, or interpretation of data; in the writing of the manuscript, or in the decision to publish the results.
References
- EN 1991-1-4. Eurocode 1: Actions on Structures, Part 1–4, General Actions—Wind Actions, European Standards: Brussels, Belgium, 2005.
- Mikaelson, L.-Å.; Larsson, J. Integrated planning for sustainable building production—An evolution over three decades. J. Civ. Eng. Manag. 2016, 23, 319–326. [Google Scholar]
- Jendzelovsky, N.; Antal, R. Wind Effects on the Triangular High-Rise Structure with Curved Corners. In Proceedings of the Structural and Physical Aspects of Construction Engineering (SPACE 2016): 3rd International Conference Proceedings, High Tatras, Slovakia, 9–11 November 2016. [Google Scholar]
- Antal, R. Wind Flow around the High-Rise Buildings of Various Triangular Cross-Sections. In Proceedings of the New Trends in Statics and Dynamics of Buildings [CD-ROM]: Conference Proceedings, Bratislava, Slovakia, 19–20 October 2017. [Google Scholar]
- Antal, R.; Jendzelovsky, N.; Hubova, O. The Design of Aerodynamically Shaped High-Rise Buildings with Integrated Turbines. In Proceedings of the WINERCOST ‘17: Proceeding of the International Conference on Wind Energy Harvesting, Coimbra, Portugal, 20–21 April 2017. [Google Scholar]
- Jirsak, M. Study of Buildings and Structures in Wind Tunnels (in Czech); ČKAIT: Praha, Czech Republic, 2009; p. 145. ISBN 978-80-87093-87-0. [Google Scholar]
- Samofalov, M.; Kazakov, A.; Pavlovsky, R.M. The basic principles of the algorithm recalculating data on experimental aerodynamic tests into wind affected load strains. J. Civ. Eng. Manag. 2011, 17, 296–307. [Google Scholar] [CrossRef] [Green Version]
- Kozubkova, M. Fluid Flow Modelling: FLUENT, CFX; [CD-ROM]; VSB—Technical University: Ostrava, Czech Republic, 2008; ISBN 978-80-248-1913-6. (In Czech) [Google Scholar]
- Antal, R. Aerodynamics of High-Rise Buildings Using Software Simulations of Wind Flow (Accession No. SvF-13416-7229). Ph.D. Thesis, Slovak University of Technology—Faculty of Civil Engineering, Bratislava, Slovak, 2019. [Google Scholar]
- Laundner, B.E.; Spalding, D.B. The numerical computation of turbulent flows. Comput. Methods Appl. Mech. Eng. 1974, 3, 269. [Google Scholar] [CrossRef]
- Mohamed, M.A.; Wood, D.H. Modifications to Reynolds-averaged Navier–Stokes turbulence models for the wind flow over buildings. Int. J. Sustain. Energy 2015, 36, 225–241. [Google Scholar] [CrossRef]
- Anderson, J.D. Computational Fluid Dynamics: The Basics with Applications; McGraw-Hill Inc.: New York, NY, USA, 1995; ISBN 978-00-70016-85-9. [Google Scholar]
- Chung, T.J. Computational Fluid Dynamics, 2nd ed.; Cambridge University Press: New York, NY, USA, 2010; ISBN 978-05-21769-69-3. [Google Scholar]
- Phuc, V.P.; Nozu, T.; Kikuchi, H.; Hibi, K.; Tamura, Y. Wind Pressure Distributions on Buildings Using the Coherent Structure Smagorinsky Model for LES. Comput. Methods Wind Eng. 2018, 6, 32. [Google Scholar] [CrossRef] [Green Version]
- Zu, G.; Lam, M.K. LES and Wind Tunnel Test of Flow around Two Tall Buildings in Staggered Arrangement. Comput. Methods Wind Eng. 2018, 6, 28. [Google Scholar] [CrossRef] [Green Version]
- Google Maps. Available online: https://goo.gl/maps/4XtLUi7P5M2QYiwR6 (accessed on 13 January 2021).
- Polcak, N.; Stastny, P. Topography Influence on Wind Condition of Bratislava. In Proceedings of the Microclimate and Mesoclimate of Landscape Structures and Anthropogenic Environment, Skalni Mlyn, Czech Republic, 2–4 February 2011; ISBN 978-80-86690-87-2. [Google Scholar]
- Wieringa, J.; Davenport, A.J.; Grimmond, C.S.B.; Oke, T.R. New revision of Davenport roughness classification. In Proceedings of the 3rd European & African Conference on Wind Engineering (3EACWE), Eindhoven, The Netherlands, 2–6 June 2001; pp. 285–292. [Google Scholar]
- Nishizawa, S.; Sawachi, T.; Ken-ichi, N.; Seto, H.; Ishikawa, Y. A Wind Tunnel Full-Scale Building Model Comparison between Experimental and CFD Results Based on the Standard k-ε Turbulence Representation. Int. J. Vent. 2004, 2, 419–429. [Google Scholar] [CrossRef]
- Cheng, C.K.; Yuen, K.K.; Lam, K.M.; Lo, S.M. CFD wind tunnel test: Field velocity patterns of wind on a building with a refuge floor. Int. J. Comput. Fluid Dyn. 2005, 19, 531–544. [Google Scholar] [CrossRef]
- Mou, B.; He, B.J.; Zhao, D.X.; Chau, K.W. Numerical simulation of the effects of building dimensional variation on wind pressure distribution. Eng. Appl. Comput. Fluid Mech. 2017, 11, 293–309. [Google Scholar] [CrossRef]
- Tanaka, H.; Tamura, Y.; Ohtake, K.; Nakai, M.; Kim, Y.C. Experimental Investigation of Aerodynamic Forces and Wind Pressures Acting on Tall Buildings with Various Unconventional Configurations. J. Wind Eng. Ind. Aerodyn. 2012, 107–108, 179–191. [Google Scholar]
- Ning, L.; Chris, L.; Yukio, T.; Bo, L.; Osamu, N. Characteristics of wind forces acting on tall buildings. J. Wind Eng. Ind. Aerodyn. 2005, 93, 217–242. [Google Scholar]
- Migilinskas, D.; Balionis, E.; Dziugaite-Tumeniene, R.; Siupsinskas, G. An advanced multi-criteria evaluation model of the rational building energy performance. J. Civ. Eng. Manag. 2016, 22, 844–851. [Google Scholar] [CrossRef]
- Hakimi, R.; Lubitz, W.D. Wind environment at a roof-mounted wind turbine on a peaked roof building. Int. J. Sustain. Energy 2016, 35, 172–189. [Google Scholar] [CrossRef]
- Bagocius, V.; Zavadskas, E.K.; Turskis, Z. Multi-person selection of the best wind turbine based on the multi-criteria integrated additive-multiplicative utility function. J. Civ. Eng. Manag. 2014, 20, 590–599. [Google Scholar] [CrossRef]
- Eswara, K.B.; Yukio, T.; Akihito, Y.; Yong, C.K.; Qingshan, Y. Experimental investigation on aerodynamic characteristics of various triangular-section high-rise buildings. J. Wind Eng. Ind. Aerodyn. 2013, 122, 60–68. [Google Scholar]
- Salam, N.; Wardana, I.N.G.; Wahyudi, S.; Widhiyanuriyawan, D. Fluid Flow through Triangular and Square Cylinders. Aust. J. Basic Appl. Sci. 2014, 8, 193–200. [Google Scholar]
- Daemei, A.B.; Khotbehsara, W.M.; Nobarani, E.M.; Bahrami, P. Study on wind aerodynamic and flow characteristics of triangular-shaped tall buildings and CFD simulation in order to assess drag coefficient. Ain Shams Eng. J. 2019, 10, 541–548. [Google Scholar] [CrossRef]
- Yan, B.; Li, Q. Large-eddy simulation of wind effects on a super-tall building in urban environment conditions. Struct. Infrastruct. Eng. 2015, 12, 765–785. [Google Scholar] [CrossRef]
Figure 1.
Panorama City buildings (Bratislava, Slovakia): (a) 3D view; (b) Floor plan of one of the buildings.
Figure 1.
Panorama City buildings (Bratislava, Slovakia): (a) 3D view; (b) Floor plan of one of the buildings.

Figure 2.
Wind tunnel in Bratislava, Slovakia.

Figure 3.
Model of building under examination inside the wind tunnel.

Figure 4.
Accurate distribution of sampling points (in mm) and direction of wind flow.

Figure 5.
External pressure coefficient Cp [−] obtained experimentally for wind flow direction 1.

Figure 6.
External pressure coefficient Cp [−] obtained experimentally for wind flow direction 2.

Figure 7.
Discrete environment and names of the boundaries used for CFD (computational fluid dynamics) simulation.
Figure 7.
Discrete environment and names of the boundaries used for CFD (computational fluid dynamics) simulation.

Figure 8.
Generated mesh for CFD simulation: (a) Whole discreet environment; (b) Close proximity of analyzed object.
Figure 8.
Generated mesh for CFD simulation: (a) Whole discreet environment; (b) Close proximity of analyzed object.

Figure 9.
Dimensionless distance y+ to first vertex adjacent to the wall: (a) Wind flow direction 1; (b) Wind flow direction 2.
Figure 9.
Dimensionless distance y+ to first vertex adjacent to the wall: (a) Wind flow direction 1; (b) Wind flow direction 2.

Figure 10.
Convergence of momentum and mass: (a) Wind direction 1; (b) Wind direction 2.

Figure 11.
Changes of wind pressure in [Pa] depending on iteration: (a) Wind direction 1; (b) Wind direction 2.
Figure 11.
Changes of wind pressure in [Pa] depending on iteration: (a) Wind direction 1; (b) Wind direction 2.

Figure 12.
Calculated wind pressure coefficient: (a) Wind direction 1; (b) Wind direction 2.

Figure 13.
Comparison chart of external pressure coefficient for wind flow direction 1.

Figure 14.
Comparison chart of external pressure coefficient for wind flow direction 2.

Figure 15.
Comparison of wind pressure coefficients (Cp) varying in time and wind speed for sampling point 10 and wind direction 1.
Figure 15.
Comparison of wind pressure coefficients (Cp) varying in time and wind speed for sampling point 10 and wind direction 1.

Figure 16.
Complex of buildings from northwest view: Panorama City and Tower 115 [16].
Figure 16.
Complex of buildings from northwest view: Panorama City and Tower 115 [16].

Figure 17.
Layout of buildings in discrete environment and preview of wind speed profile.

Figure 18.
Generated mesh in close distance to the buildings, approximately in the center of its height.
Figure 18.
Generated mesh in close distance to the buildings, approximately in the center of its height.

Figure 19.
Streamlines of wind speed in the velocity scale for two perspectives.

Figure 20.
Streamlines of wind speed 1 m above roof surface for possible wind turbine placement.

Figure 21.
Contours of dimensionless pressure coefficient Cp [−] for two perspectives.


Table 1.
Properties of air measured directly in the wind tunnel during tests.
| Average Wind Speed | Atmospheric Pressure | Density of Air |
|---|---|---|
| (m/s) | (Pa) | (kg/m3) |
| 12.08 | 99870 | 1.170502 |
Publisher’s Note: MDPI stays neutral with regard to jurisdictional claims in published maps and institutional affiliations. |
© 2021 by the authors. Licensee MDPI, Basel, Switzerland. This article is an open access article distributed under the terms and conditions of the Creative Commons Attribution (CC BY) license (http://creativecommons.org/licenses/by/4.0/).
Share and Cite
MDPI and ACS Style
Jendzelovsky, N.; Antal, R. CFD and Experimental Study of Wind Pressure Distribution on the High-Rise Building in the Shape of an Equilateral Acute Triangle. Fluids 2021, 6, 81. https://0-doi-org.brum.beds.ac.uk/10.3390/fluids6020081
AMA Style
Jendzelovsky N, Antal R. CFD and Experimental Study of Wind Pressure Distribution on the High-Rise Building in the Shape of an Equilateral Acute Triangle. Fluids. 2021; 6(2):81. https://0-doi-org.brum.beds.ac.uk/10.3390/fluids6020081
Chicago/Turabian StyleJendzelovsky, Norbert, and Roland Antal. 2021. "CFD and Experimental Study of Wind Pressure Distribution on the High-Rise Building in the Shape of an Equilateral Acute Triangle" Fluids 6, no. 2: 81. https://0-doi-org.brum.beds.ac.uk/10.3390/fluids6020081