Article

Commercial Baby Foods Aimed at Children up to 36 Months: Are They a Matter of Concern?

1
Food and Nutrition Department, National Health Institute Dr Ricardo Jorge, Av. Padre Cruz, 1649-016 Lisbon, Portugal
2
NOVA National School of Public Health, NOVA University of Lisbon, Avenida Padre Cruz, 1600-560 Lisbon, Portugal
3
NOVA National School of Public Health, Public Health Research Center (CISP), Comprehensive Health Research Center, NOVA University of Lisbon, Avenida Padre Cruz, 1600-560 Lisbon, Portugal
4
Center for Studies and Research in Social Dynamics and Health (CEIDSS), Av. Padre Cruz, 1649-016 Lisbon, Portugal
5
MARE-NOVA-Marine and Environmental Sciences Centre, Department of Environmental Sciences and Engineering, NOVA School of Science and Technology (FCT NOVA) (FCT/UNL), 2829-516 Caparica, Portugal
6
CESAM, Centre for Environmental and Marine Studies, University of Aveiro, Campus Universitário de Santiago, 3810-193 Aveiro, Portugal
7
IUEM–Instituto Universitário Egas Moniz, Egas Moniz-Cooperativa de Ensino Superior, 2829-511 Caparica, Portugal
*
Author to whom correspondence should be addressed.
Submission received: 8 April 2022 / Revised: 4 May 2022 / Accepted: 10 May 2022 / Published: 13 May 2022
(This article belongs to the Section Food Nutrition)

Abstract

:
Proper nutrition in infancy and early childhood is crucial to ensuring optimal child development, growth, and better health outcomes later in life. The nutrient profile model proposed by WHO/Europe aims to assess the nutritional quality and promotional/marketing aspects of commercial baby foods aimed at children up to 36 months. We used commercial data from 191 baby foods collected between March 2021 and July 2021, from eight supermarket chains in the Lisbon Metropolitan area. According to the model specifications and the NOVA classification system, we assessed the nutritional quality and promotion aspects and the degree of processing, respectively. The presence of at least one sugar-contributing ingredient was found in 34.0% of the products; 13.9% of products listed sugars and 15.0% listed fruit juices or concentrates as an ingredient. The claim “No added sugar” was present in 69.6% of products. Only 35.1% of products comply with all the nutritional requirements of the model. Concerning processing classification, 61.8% of products were ultra-processed, and about 57.0% were indicated for children < 12 months. These findings reinforce the importance of implementing measures to ensure that commercial foods for infants are marketed appropriately and to promote foods with a lower degree of processing.

1. Introduction

In infancy, adequate nutrition is a key factor for normal growth and development, helps the establishment of taste preferences, and may have implications for health throughout life [1]. Food preferences begin to take shape during fetal development and continue to change throughout life, influenced by biological, social, and environmental factors [2]. These preferences are fundamental of food choice and therefore diet quality.
The promotion of exclusive breastfeeding for six months is the gold standard for infant feeding and a global public health recommendation [3]. Infants should receive safe and nutritionally adequate complementary foods from 6 months of age, keeping breastfeeding until 2 years of age or older [4]. The role of these products in an appropriate complementary feeding has been discussed, driven by concerns related to their nutritional content and potentially problematic marketing strategies associated with the promotion of these products [5].
In 2016, the WHO guidance on ending the inappropriate promotion of foods for infants and young children (IYC) was approved to endorse countries to take action on this issue [6,7]. To implement this guidance, a Nutrient Profile Model (NPM) for commercially available complementary foods (CACFs) for infants under the age of 36 months was developed to drive the decisions regarding the identification of foods that are inappropriate for promotion, particularly reducing the intake of salt and free sugars [8].
Currently, Directive 2006/125/EC does not specify the total sugar content but sets out the amount of added sugar, such as sucrose, fructose, syrups, and honey, that is allowed in processed cereal-based foods. However, as this information is not included on the packaging, it is not possible to determine the amount of these or the total added (or free) sugar in products [9].
Children’s diets are generally characterised by low fruit and vegetable consumption and an excess of products that contain high levels of sugar, saturated fat, and sodium [10]. In particular, sugar consumption among children has been a cause of concern worldwide, as it is higher than children’s recommended daily limit.
The WHO recommends as a “strong recommendation” reducing the intake of free sugars to less than 10% of total energy intake as well as a “conditional recommendation” to further reduce free sugars to below 5% [11].
Published data show that this reducing the intake of free sugars to less than 10% of total energy intake is not met in most countries; for example, in several European countries, total sugars ranged between 15 and 21% of energy intake and between 16 and 26% in adults and children, respectively [12]. Added sugars provide 7 to 11% of total energy intake in adults and contributes with a higher proportion of children’s energy intake (11 to 17%) [12]. In Portugal, the National Food, Nutrition, and Physical Activity Survey reported that IYC (<5 years) had the highest energy contribution from total sugars (28%) [13]. In addition, evidence is growing that some CACFs for infants (also referred as baby foods) contain considerable high amounts of sugar [14,15,16,17,18].
In the first two years of life, the introduction of complementary food represents an opportunity for infants to achieve long-term healthy dietary patterns [19]. Recent studies have found that products containing ingredients such as sugar, salt, fat, and artificial colors or preservatives and produced from constituents derived from foods, also known as ultra-processed (UP) foods, comprise an increasing percentage of children’s diets [20]. In the Belgian population, about 30% of daily energy intake is from UP foods, and young children consume the largest proportion of their daily energy intake from UP foods [21]. Other studies, such as from the U.S. and Canada, also found that UP foods represent more than 50% of the daily energy intake [22,23].
Food processing increases nutrient availability and food quality and plays a key role in attaining food and nutrition security [24]. UP foods are usually low in fiber, protein, vitamins, and minerals and high in added sugar, trans-fat, sodium, and refined starch [23]. The consumption of UP foods during childhood has also been linked to obesity and cardiometabolic risk factors in children and adults [25,26] as well as an increased mortality risk among adults [27,28].
According to a Sadler et al. review, there are a great number of food classification systems based on food processing. Most of the classification systems are proposed by expressing concerns about the food transition to industrially made products and an associated increase in chronic disease [29].
The NOVA classification system developed by Monteiro et al. has been extensively applied in several studies of diet quality and health outcomes, particularly obesity [30]. This system classifies foods and food products into four categories according to the degree of processing, comprising unprocessed and minimally processed foods (e.g., vegetables and fresh fruit), processed culinary ingredients (e.g., honey and sugar), processed foods (e.g., fruits in syrup and vegetables in brine), and UP foods (e.g., packaged soups and chicken nuggets) [31].
Several studies have evaluated the consumption of UP foods in paediatric populations [19,32]; however, there is still limited research on the assessment of CACFs marketed for IYC under 36 months according to the NOVA classification system [17,18,33].
In 2019, the National Health Authority (Directorate General of Health (DGS)) developed a Nutrient Profile Model (PT_NPM) based on the WHO nutrient profile model with some adaptions. This model was created to limit food promotion/marketing to children between 36 months and 16 years old [34]. As adequate nutrition in infancy and early childhood is crucial to prevent all forms of malnutrition and diet-related non-communicable diseases, effective action is then needed for ending the inappropriate promotion of foods for infants and young children under 36 months [7]. The implementation of the Nutrient Profile Model (NPM) developed by the WHO Regional Office for Europe (WHO/Europe) to guide decisions on the promotion and nutritional quality of baby foods will be under the scope of the Integrated Strategy for the Promotion of Healthy Eating (EIPAS) in Portugal [35].
The present study aims to assess the nutritional quality and promotion (labelling requirements, visual information on labels and type of statements) of products marketed for IYC under 36 months available on the Portuguese market considering the following aspects:
(1)
Agreement with the compositional criteria and labelling requirements of the Nutrient Profile Model (NPM) for commercial baby foods aimed at children up 36 months;
(2)
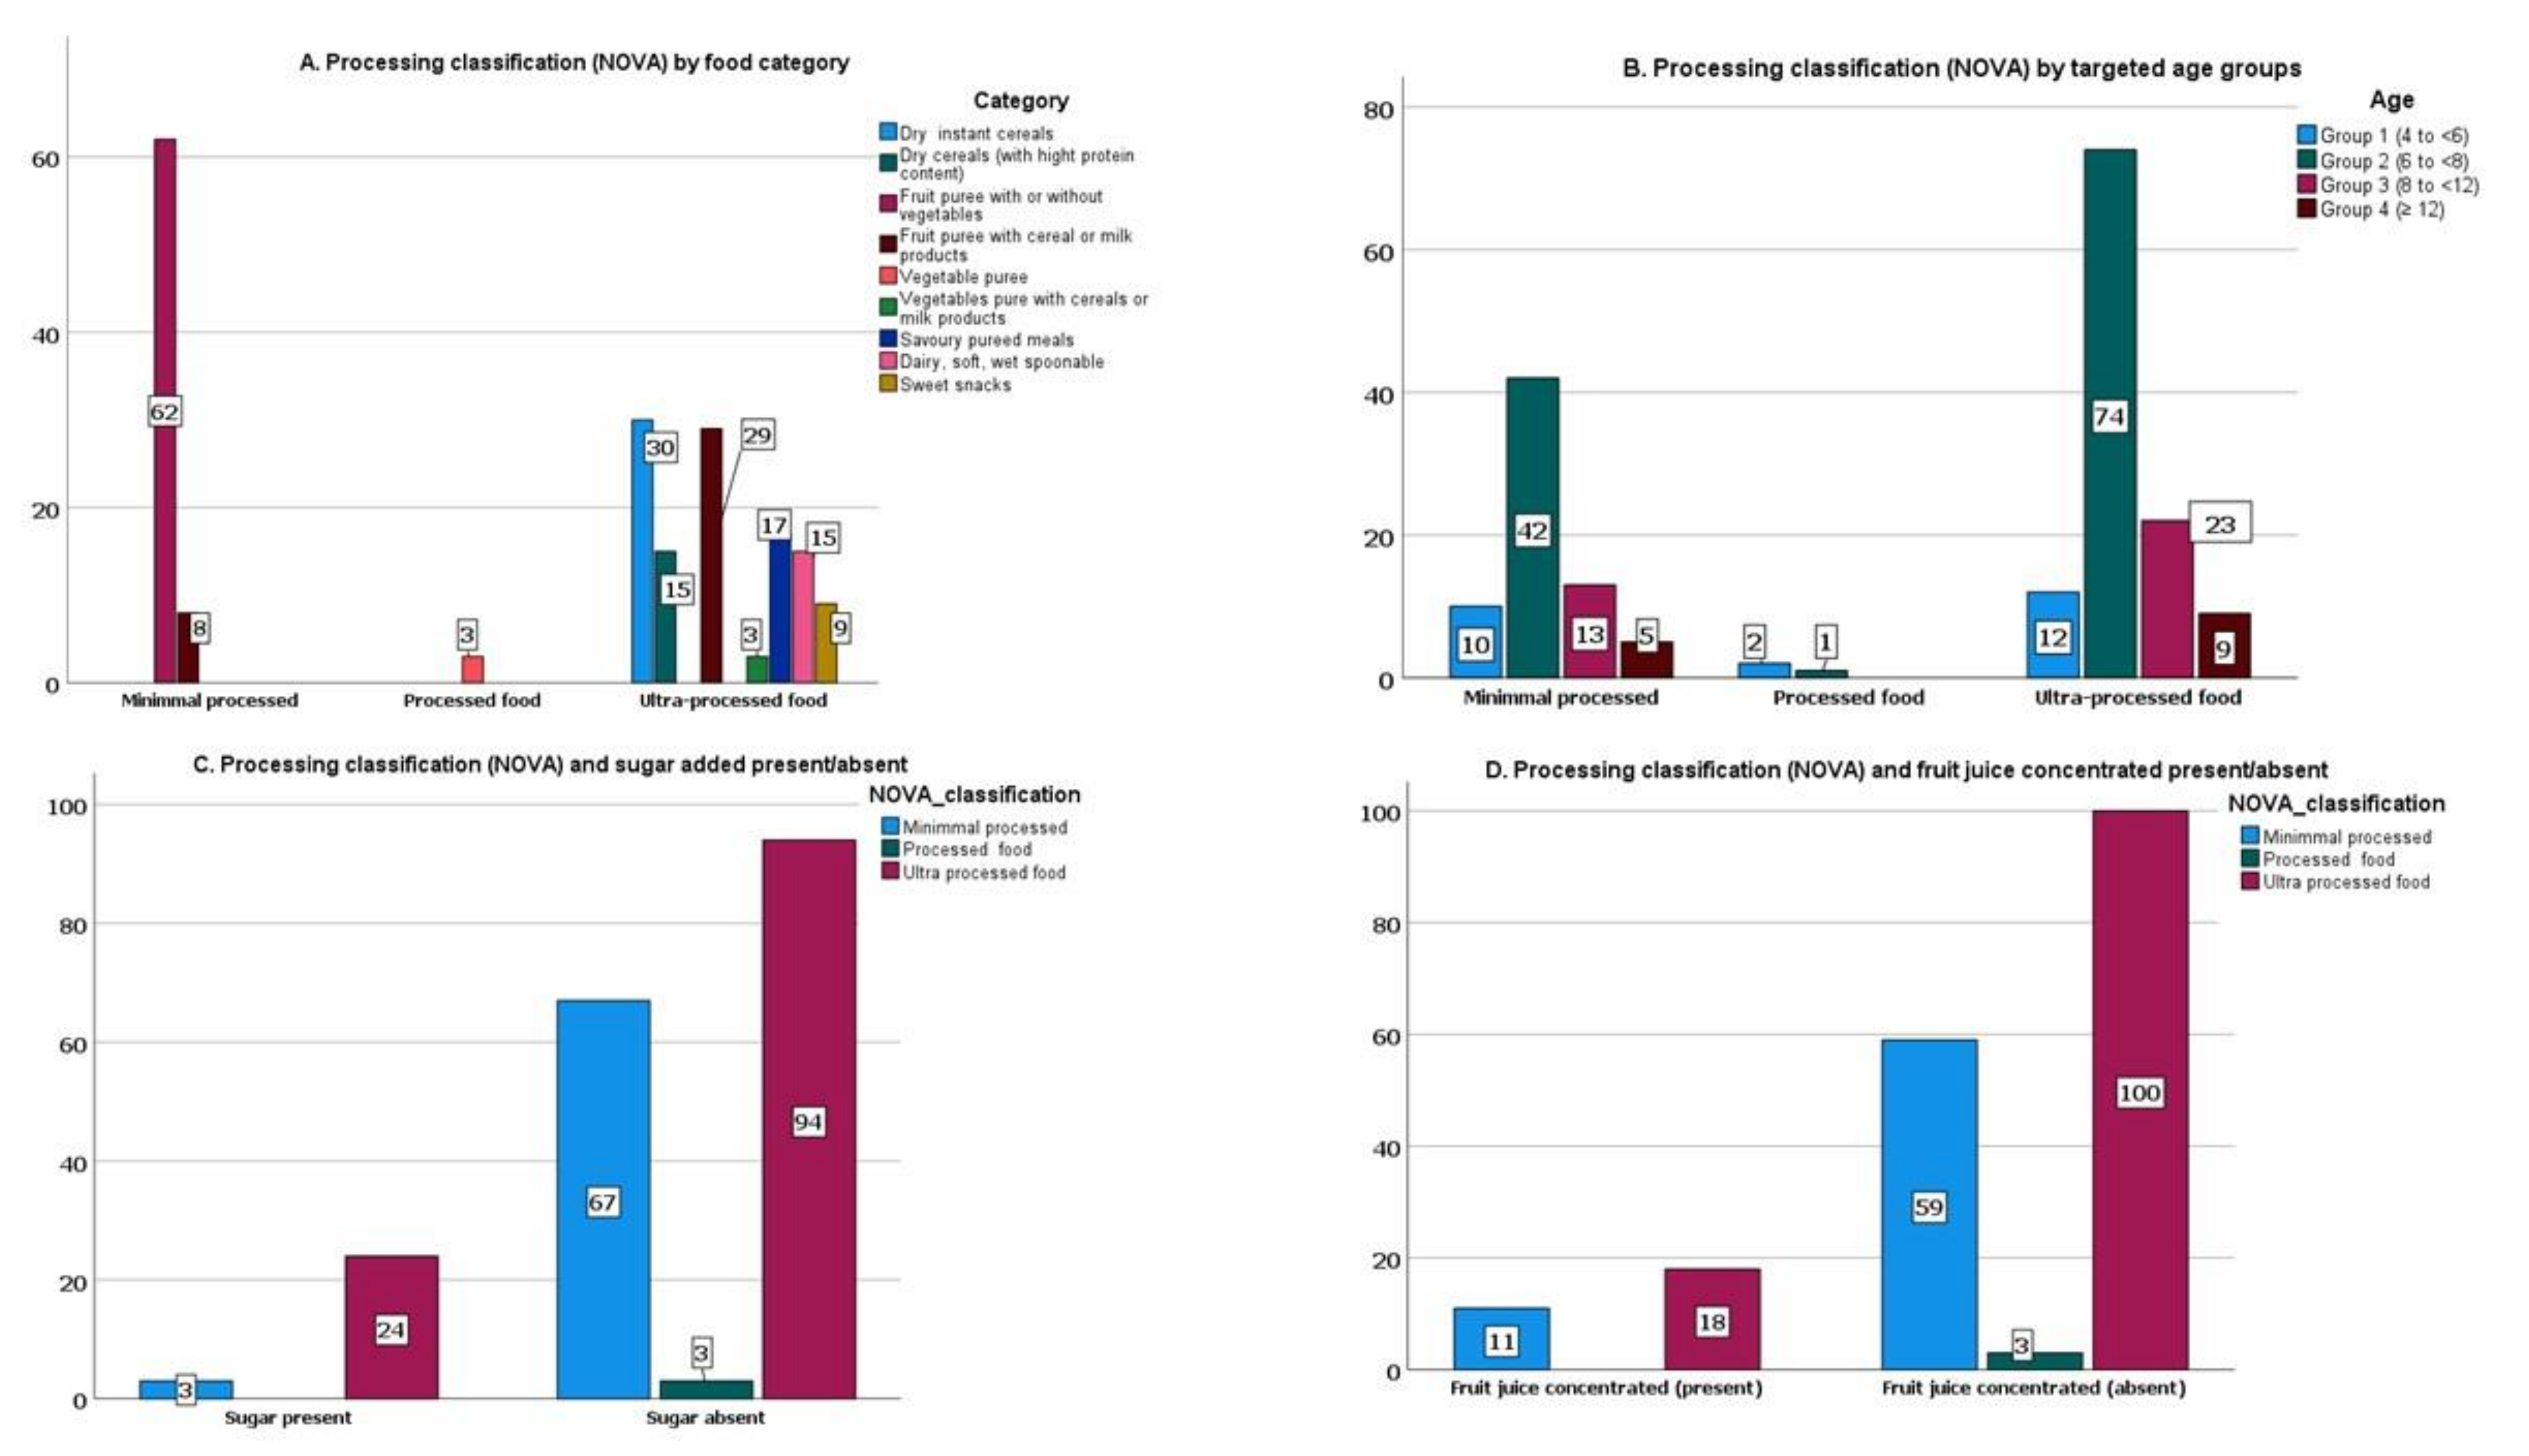
Level of processing as defined by the NOVA classification system.

2. Materials and Methods

2.1. Data Collection

This study used a cross-sectional design and a convenience sample of 191 products targeted to infants under 36 months of age (CACFs), collected between March 2021 and July 2021, from eight supermarket chains in the Lisbon Metropolitan area, which holds almost 80% of the market share in Portugal. Following the method of a previously published study [15], nutritional and packaging information and information about the ingredient list from the products in-store or the supermarkets’ websites were collected and photographed.
A Microsoft Excel spreadsheet was developed to record information on the different variables studied, namely basic information (brand name, product name, product category); packaging information (recommended age, serving size, nutrition-related messages, composition claims, and health claims); nutritional content (energy (kJ/kcal), protein (g), total fat (g), saturated fatty acids, carbohydrates (g), total sugars (g), and sodium (mg)); and visual information (e.g., cartoons, pictures of infants/young children). All the nutritional values have been expressed per 100 g product.

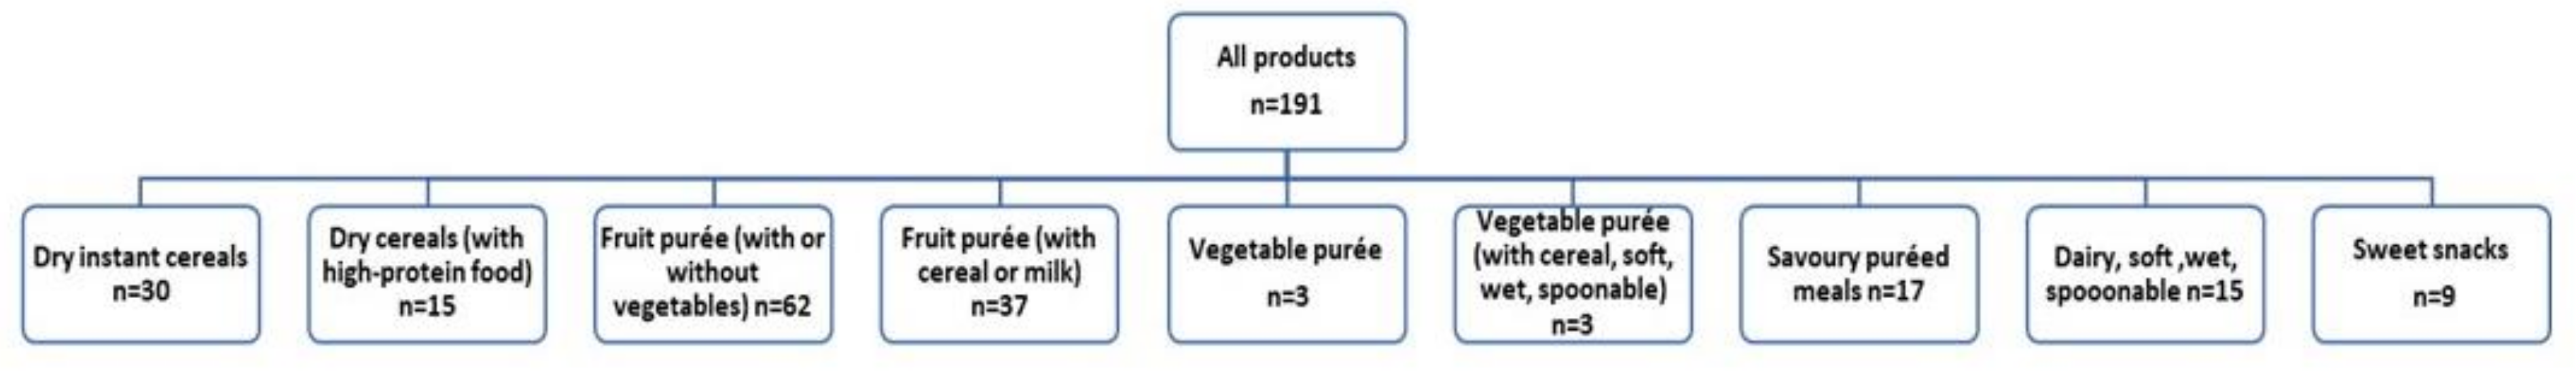
2.2. Product Categorization

CACFs were categorized based on the adopted NPM classification developed by the WHO/Europe [8] and presented in Figure 1.
CACFs were also categorized according to their processing level as minimally processed (MP), processed, or UP foods based on the NOVA classification system [31] using the photographs of the ingredients list. Foods whose ingredients list only presented unprocessed foods (e.g., fruit and vegetables) were categorized as minimally processed. Products with ingredients such as salt, sugar, and fats were classified as processed. For the classification of UP products, the use of industrial techniques, such as extrusion, hydrogenation, and carbohydrate modifications, and the ingredient list was taken into account. Food products where the ingredient list contained additives, such as emulsifiers, and flavourings, were categorised as UP [16,18]. Information on the coded variables is provided in Appendix A (Table A1).

2.3. Nutritional Composition and Labelling Requirements Evaluation

Nutrient composition, labelling requirements, and promotional restrictions were evaluated according to the adopted criteria of NPM for CACFs to identify products appropriate for promotion for IYC up to 36 months [8].
Results for energy, protein, total sugars, total fat, saturated fatty acids, and sodium are presented on g (or mg) per 100 g. The energy density is shown on a kcal per 100 g basis. In addition, the nutrient values in g per 100 kcal were calculated to compare with dry products that have to be reconstituted before consumption and ready-to-eat products.
The presence of added sugars was identified from the back-of-pack ingredient list. For the present study, added sugar was classified as fruit juice whether whole, concentrated, or powdered; sugar; sucrose; dextrose; fructose; maltose; any syrup; honey; barley malt/malted barley/malt extract; molasses; and artificial or natural zero/low-calorie sweeteners, in line with the WHO definition of free sugar [11]. This is an extension of the European Food Safety Authority (EFSA) definition of added sugars [36] by additionally including fruit juice (and its derivatives) and honey.

2.4. CACFs Classification into Target Age Groups

CACFs were divided into four groups, based on the developmental milestones for feeding and the minimum age specified on the food label [37]. Group 1 includes foods for infants from 4 months to <6 months, Group 2 from 6 months to <8 months, Group 3 from 8 months to <12 months, and Group 4 from 12 months or older.

2.5. Data Analysis

Data were processed with the Statistical Package for Social Sciences software and included frequency distribution, descriptive statistics, and correlation (IBM SPSS Statistics, Version 28.0, IBM Corp., Chicago, IL, USA) [38].
Descriptive statistics had been used to report the frequency of CACFs in each food category, food processing (NOVA classification), age, and claims.
Tests for normality on the nutritional values of foods were performed with the Kolmogorov–Smirnov test and revealed that data were not normally distributed; therefore, non-parametric testing was conducted.
The categorical variables were reported as relative and absolute frequencies. Median, standard deviation (SD), and P25 and P50 values for nutritional information were calculated from the labels. Pearson’s chi-square test (χ2 test) was employed to assess the associations between two variables. Kruskal–Wallis non-parametric test with multiple pairwise comparisons was performed to test for differences in levels of nutrients between food categories and food processing (NOVA classification). The Bonferroni correction was applied. For a p-value less than 0.05, the result was considered statistically significant and highly statistically significant if the p-value was less than 0.01. Results are shown in tables and box plot diagrams.

3. Results

3.1. General Characteristics

Table 1 provides information on the number of products by categories for which information was collected, respectively.
Of the 191 CACFs identified in this study, the most abundant categories of CACFs were fruit purée (with/without vegetables) (n = 62, 32.5%), fruit purée with cereal/milk (n = 37, 19.4%), and dry instant cereals (n = 30, 15.7%).
The majority (n = 177, 92.7%) of CACFs were indicated for children under 12 months of age (Groups 1–3). As shown in Table 1, 12.6% of CACFs were intended to be consumed by Group 1 (4 to <6 months) children, 61.3% for Group 2 (6 to <8 months) children, 18.8% for Group 3 (8 to <12 months) children, and 7.3% for Group 4 (≥ 12 months) children.

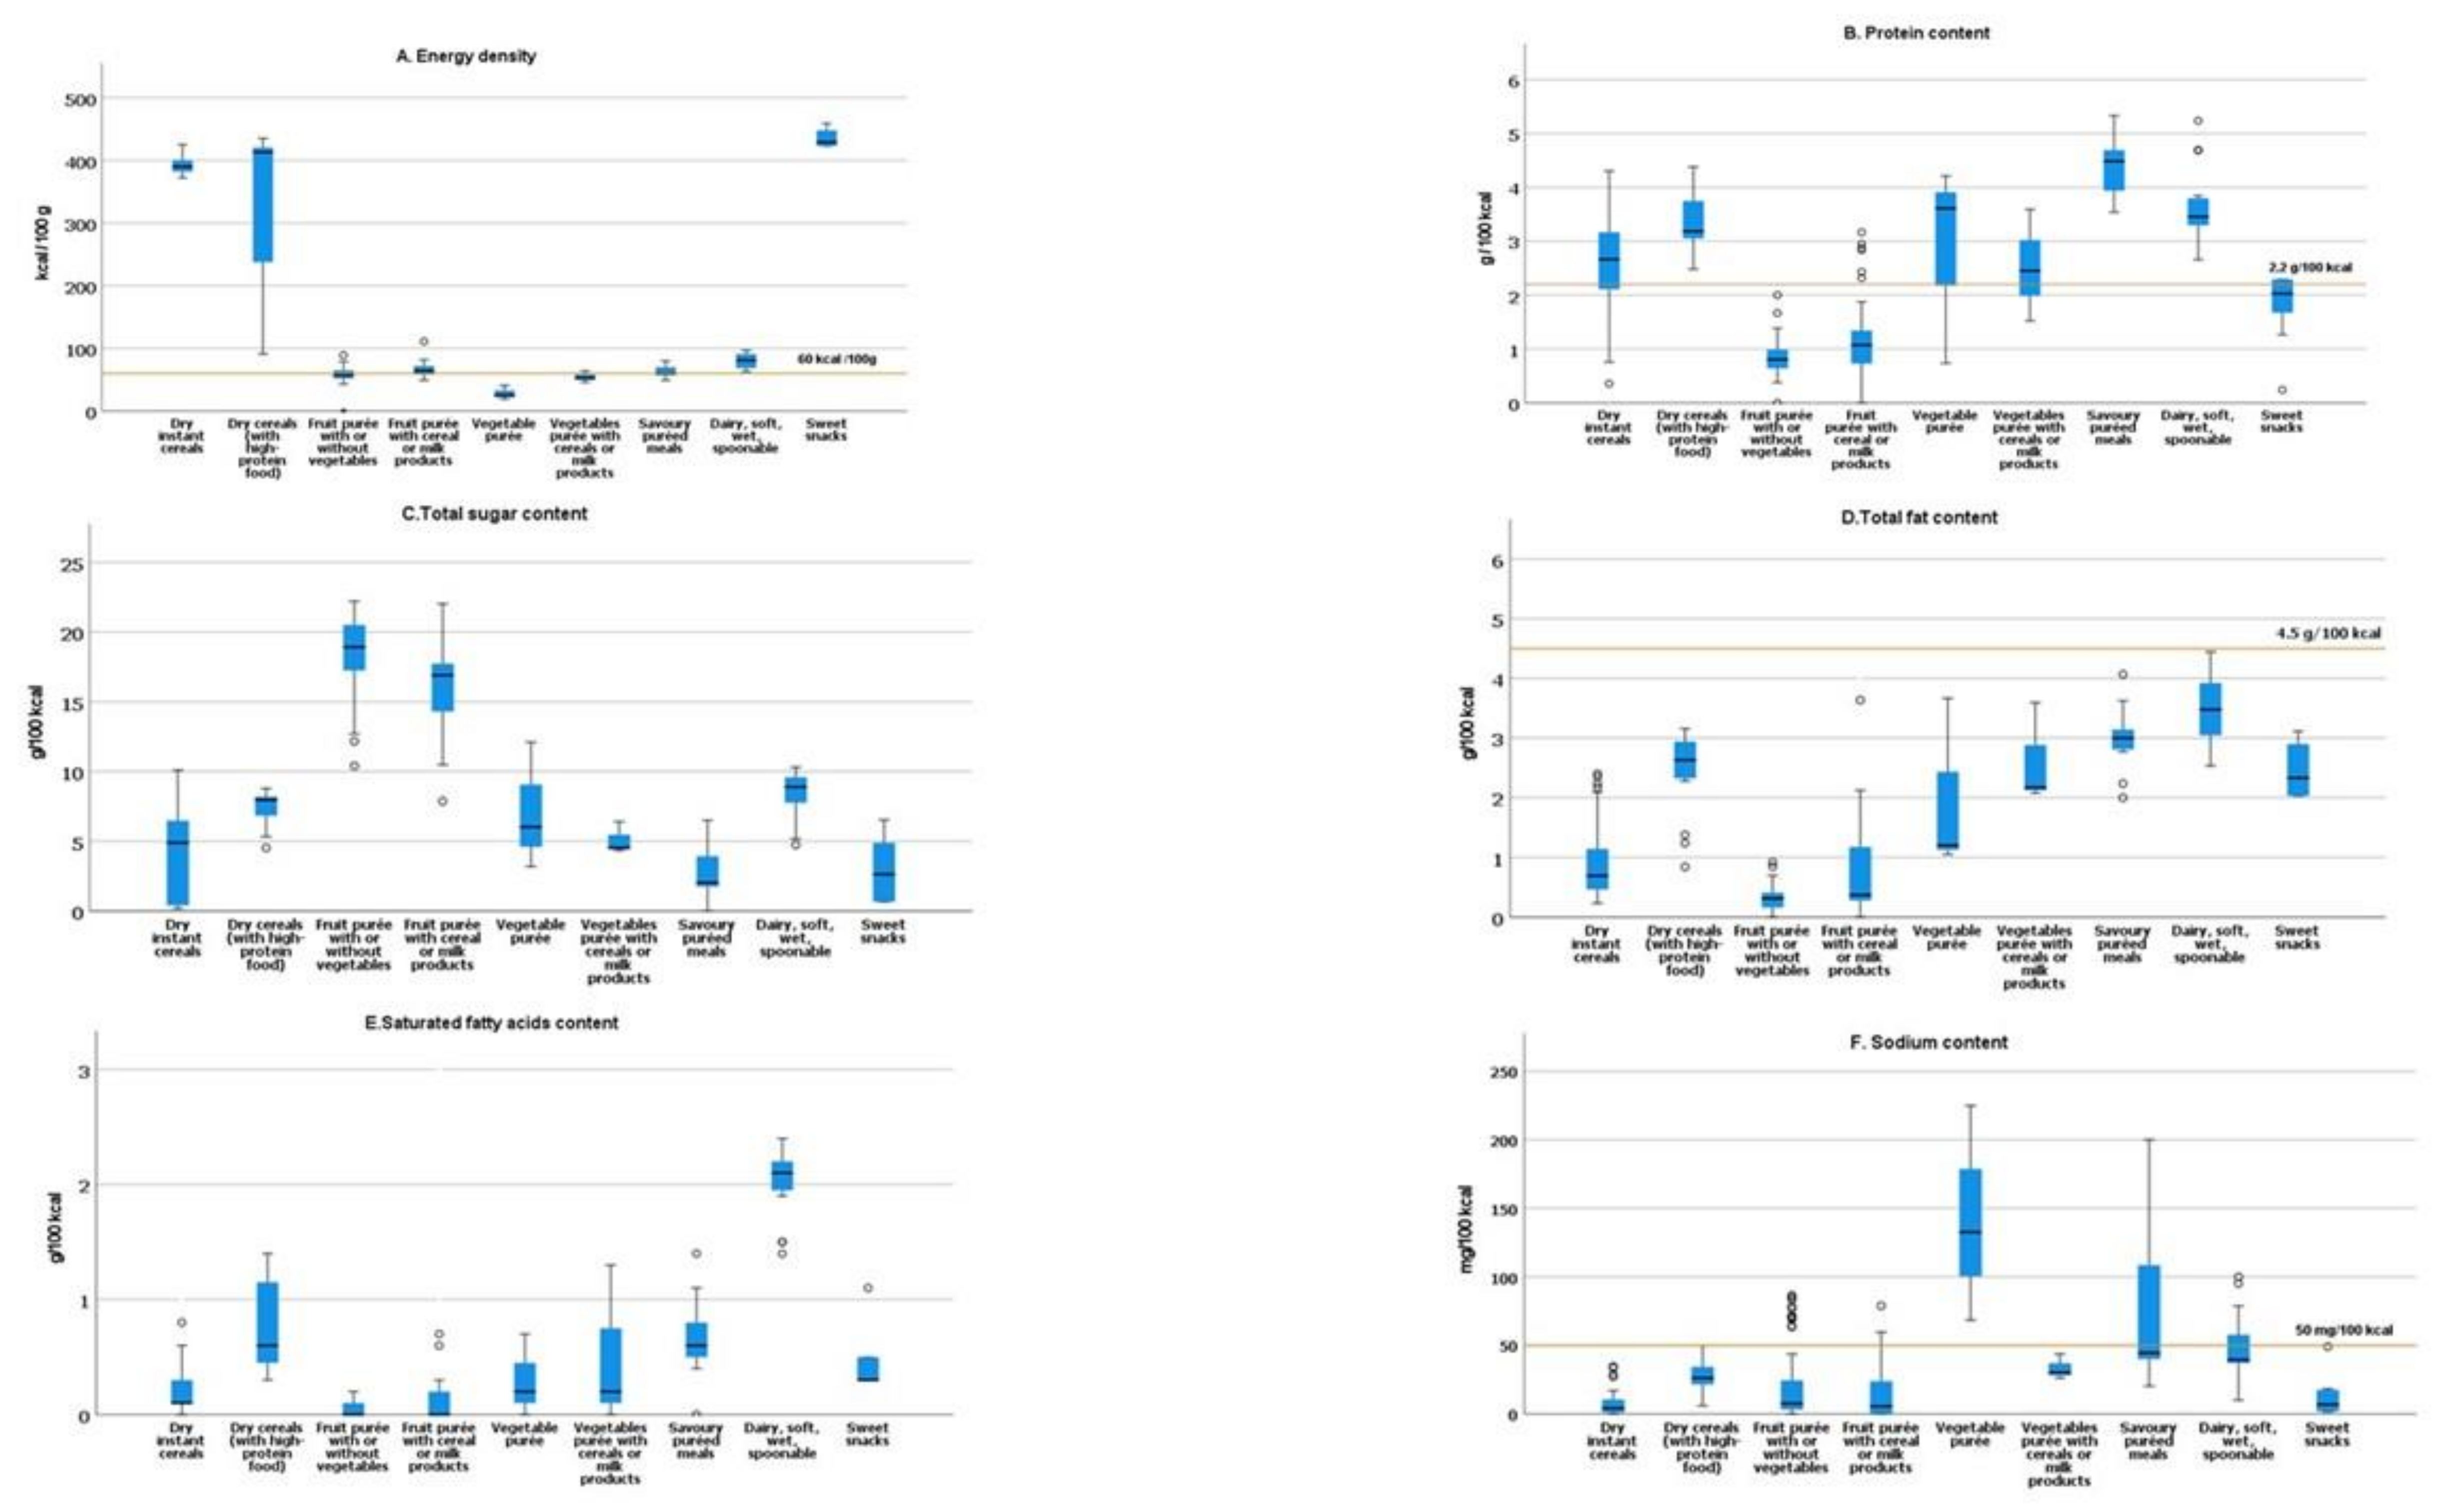
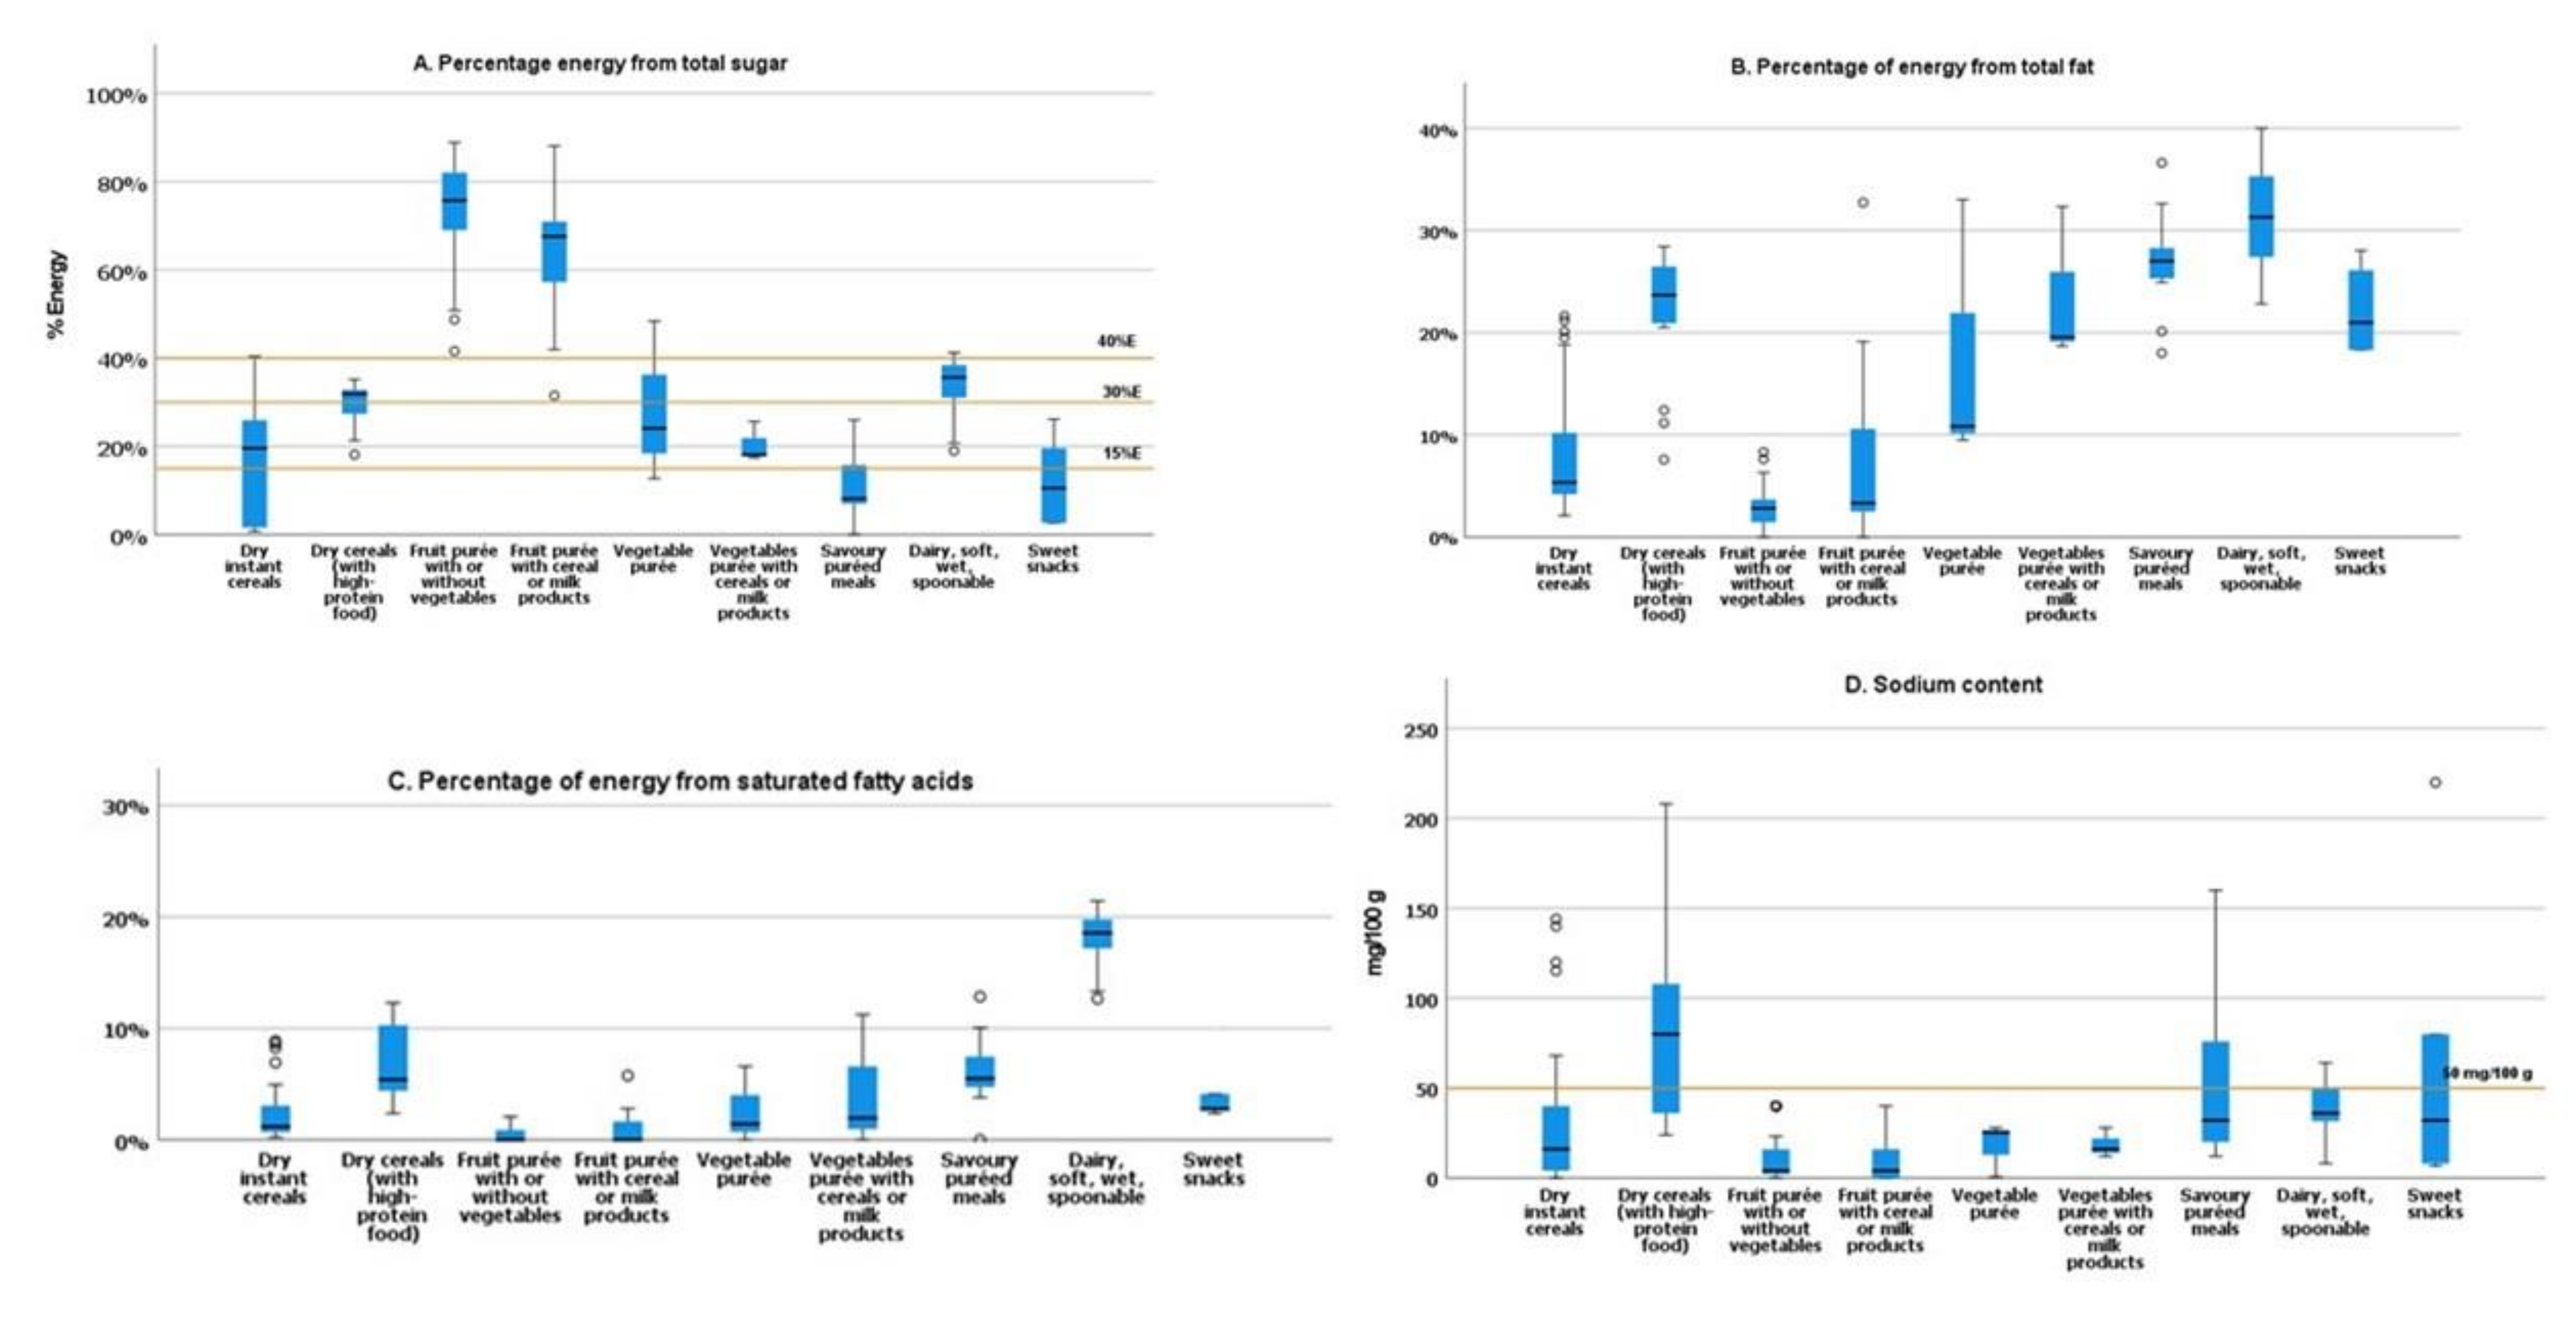
3.2. Nutritional Composition

Table 2 summarizes the nutritional composition of the CACFs considered in the study.
Assessment of the nutritional composition per 100 g, the categories dry instant cereals, fruit purée (with/without vegetables), fruit purée with cereal/milk, and vegetables with cereal, soft, wet, spoonable presented significantly lower values for sodium (p < 0.001). The lower medium energy content was found in vegetable purée (105 kJ/100 g) and vegetables with cereals/milk products (223 kJ/100 g), and the highest content was found in sweet snacks (1810 kJ/100 g). Dry cereals with high protein, dairy, soft, wet, spoonable and sweet snacks showed the highest median saturated fatty acids content (Table 2).
Analysing the energy density (kcal/100 g) by food category, Figure 2A shows that some products, such as the case of vegetable purée and vegetables with cereals/milk products, provide a lower energy density, less than 60 kcal/100 g.
Regarding protein content (Figure 2B), our study shows that most of the products exceed the adopted lower limit of total protein (2.2 g/100 kcal), proposed by the NPM of the WHO/Europe, for several CACFs categories.
The total sugar content ranged from 0 g/100 kcal to 22.0 g/100 kcal (Figure 2C). The highest content of total sugars was observed for dry cereals with high protein, dry instant cereals, and sweet snacks (27.2, 20.0 and 17.2 g per 100 g of product, respectively). The average energy contribution from total sugars varied between 8.1% (spoonable meals) to 75.7% fruit purée (with/without vegetables).
For all the fruit purée (with/without vegetables) (n = 62), fruit with cereal/milk products (n = 37), and half of the dry instant cereals with high protein (n = 8), more than 30% of calories come from total sugar, and around 30% (n = 5) of the savoury puréed meals have more than 15% of calories from sugars (Figure 3A).
Concerning the energy contribution from total sugar (Figure 3A), the fruit purée with/without vegetables (n = 62) and the fruit with cereal/milk products (n = 37) tend to contain a high sugar content, with > 30% of calories from sugars.
For total fat content, a considerable degree of variation in different categories was verified (Figure 2D). The highest percentage of energy from total fat was observed in the dairy, soft, wet, spoonable category (Figure 3B).
The highest medium level of saturated fatty acids per 100 kcal was observed in the category dairy, soft, wet, spoonable (2.1 g/100 kcal) (Figure 2E). For most of the products, the average saturated fatty acids content was less than or equal to 10% energy from saturated fat (Figure 3C).
For sodium content, the NPM for CACFs proposed by the WHO/Europe comprises maximum limits for sodium, 50 mg/100 kcal (and 50 mg/100 g) or 100 mg/100 kcal (and 100 mg/100 g), when a product contains cheese.
Considering the maximum limit adopted by the NPM for sodium 50 mg/100 g, we observed some products in the categories savoury puréed meals; dairy, soft, wet, spoonable; and sweet snacks exceeding the adopted limit (Figure 3D) and would require reformulation to reduce the sodium levels.

3.3. Compliance with the NPM Criteria

3.3.1. Compositional Criteria

Nutrition information was assessed according to the individual requirements of the NPM proposed by the WHO/Europe. From the 191 CACFs under study, only 35.1% (n = 67) have been identified as appropriate for children up to 36 months, as they meet all the compositional criteria of the model.
Regarding protein and fat content, all products meet the recommended levels. Around 70% (n = 134) had no added sugars/sweeteners, and 77.5% (n = 148) had lower than recommended sodium levels. An energy threshold of 60 kcal/100 g (minimum) is proposed by the model for products in the fruit/vegetables purées and dairy categories. This study found that 40.8% (n = 78) of products from these categories provide higher calories than the recommended.

3.3.2. Labelling Requirements

Most of the CACFs carried a composition/nutrition claim (96.9%), with health claims present on 9.0% of products. Some visual aspects of product labels have been correlated with inappropriate promotion, while 39.0% (n = 74) of the products carried cartoon images (Table 3).
On the other hand, 69.6% (n = 133) of the total products under study had “No added sugar” claim, with fruit purée with/without vegetables (n = 59, 95.2%) and fruit with cereal/milk products (n = 34, 91.9%) as the most represented categories. No added salt claim was found on 27.2% (n = 52), with vegetables purée (n = 3, 100%) and savoury puréed meals (n = 12, 70.6%) as the most represented categories. In total, 34.0% of the baby foods (n = 65) contained at least one sugar-contributing ingredient. Added sugars (identified by the ingredient list as sugars, fruit juice/concentrates) were found in 13.9% (n = 27) and 15.0% (n = 29), respectively (Table 4).
Additionally, it was found that 17.3% (n = 23) of these products that contained sugar (n = 2) or concentrated fruit juice (n = 21) in the ingredient list had the claim “No added sugar”.

3.4. Processing Level

Our results show that 61.8% (n = 118) of the CACFs were UP and 36.6% (n = 70) were MP and when comparing the nutritional composition between NOVA groups, UP were higher in energy density, proteins, total fat, saturated fatty acids, and carbohydrates compared to processed and minimally processed foods (Table 5).
Overall, the median energy density of the UPFs was 383 kJ (91.0 kcal), with 3.3% of total energy from proteins, 16.5% from carbohydrates, and 2.5% from lipids. Per 100 g, total sugars were significantly lower (p ≤ 0.001) when compared with MP foods as well as between processed and MP foods. There were significant differences between medians for energy (kcal, kJ) and all the nutrient content (p < 0.001) between each of the NOVA groups (Table 5).
Concerning processing classification and food category, the highest proportion of minimally processed foods was observed for fruit purée with/without vegetables with 88.6% (n = 62). Dry instant cereals at 25.4% (n = 30), fruit purée with cereal/milk at 24.6% (n = 29), and savoury puréed meals at 14.4% (n = 17) represent the highest percentage of UP foods, respectively (Figure 4A).
Regarding the recommended age for consumption, our study revealed that 57.0% (n = 109) of the analysed products classified as UP foods were indicated for children under 12 months (Groups 1 to 3) (Figure 4B).
In the current study, the presence of sugar and fruit juice concentrated was found in 27.1% (n = 32) of the UP foods and 20.0% (n = 14) of the MP foods (Figure 4C,D).

4. Discussion

This study provides some important information on the nutrient profile and level of processing of baby foods available in the market target to children up to 36 months.
Analysing the energy content, our results are similar to Gómez Martin et al., a study that identified complementary food, vegetable, legumes, and infant purée with lower energy content. Grammatikaki et al. found on average the highest content for energy in baby biscuits and rusks (sweet snacks) [18,39].
Concerning the energy density (kcal/100 g) by food category, several CACFs indicate for children up to 6 months, such as the case of vegetable purée and vegetables with cereals or milk products, provide a lower energy density, less than 60 kcal/100 g, which is the minimum energy density adopted by the NPM of WHO/Europe for CACFs [8]. Low energy density can be a problem because the small stomachs of babies and young children limit them to relatively small amounts of consumption at mealtimes. Conversely, some products in the sweet snacks category that are suitable for children above 6 months have a high energy density, thus enhancing the risk of excessive energy intake and unfavourable gain in body mass [40].
As the European Directive 2006/125/EC does not establish any requirements regarding energy density, all CACFs effectively comply with this directive [9].
Regarding dry products, the guidelines for formulated complementary foods, WHO-Codex CAC/GL 8-1991, indicate that energy density should be a minimum of 4 kcal/g (400 kcal/100 g) on a dry-weight basis [41]. The median energy density for dry cereals with high protein are in accordance with the Codex recommendation for this food category [41].
The highest protein contents in dry instant cereals and dry cereals with high protein, 10.0 g/100 g and 13.6 g/100 g, respectively, are in line with Grammatikaki et al. study, which reports a high-protein content in baby cereals, 10.5 g/100 g, respectively [18].
According to our data, the categories fruit purée with/without vegetables and fruit purée with cereal/milk presented higher content of carbohydrates than the categories vegetable purées, vegetable purée with cereal, and savoury meals; these findings are in line with those in the Garcia et al. study [14].
The average energy contribution from total sugars was above 75% in fruit purée (with/without vegetables). Similarly, the Hutchinson et al. study found added sugars present in a considerable percentage of fruit purées, with the mean for each country ranging between 72–79% [15].
For the sweet snacks category, the products with more than 15% of energy from sugars, these products should not be marked as suitable for IYC according to the proposed WHO criteria [8]. These results could be considered high according to the WHO recommendations to limit free sugar consumption to 5% or 10% of their overall energy intake and EFSA average requirements sets for energy for IYC [11,42].
These results are of great concern, as food preferences established in infancy persist over time [1]. Persistent exposure to foods with high levels of sugar is linked to an increase in the development of dental caries and metabolic diseases in childhood and later life [43,44].
In Portugal, children under 5 years old had the highest energy contribution from total sugars (28 E%). The main food sources contributing to added and free sugars intake were milk, yoghurts, fruit, and infant formula and, in children above 5 years, mostly processed foods, such as yoghurts, breakfast cereals, sweets, cakes, and soft drinks [13].
According to the recommendations of health organisations and experts, it is important to avoid adding salt to foods for IYC and limited thereafter because of the health risks and as a form of promoting healthier eating habits [45,46]. For the adult population, WHO and EFSA recommend a target sodium intake of 2 g per day (equivalent to 5 g per day of salt). For children, this threshold should be adjusted to a lower value due to reduced energy intake. As some foods have sodium naturally present, the study was not able to discriminate if and when salt had been added [45,47].
Our results converge with the results described by Maalouf et al. and Padarath et al., which found only a few of the CACFs presenting an excess of sodium content or containing an added salt [48,49].
The limit of the European Commission Directive for sodium is 200 mg/100 g or 200 mg/100 kcal or 100 mg/100 g or 100 mg/100 kcal for cereal products, and in our study, a small number of products exceeded the sodium thresholds [9].
The proportion of products meeting the nutritional requirements of the NPM observed in our study is similar to the Pace pilot study conducted in Malta to assess the nutritional characteristics of CACFs according to the NPM proposed by the WHO/Europe. In the pilot study, only 36% of the 243 food products tested met the nutritional requirements used by this model [50].
Regarding the presence of claims, the NPM for CACFs indicates no claims (compositional, health, or marketing) are accepted on the product’s packaging or related marketing materials [8]. In addition, Codex guidelines state that foods for IYC must not carry nutrition or health claims [51]. The reason for this is that claims can confuse consumers and/or compromise breastfeeding or complementary feeding practices [7].
Our results for visual aspects of baby food labels related to inadequate promotion are in concordance with the WHO study, which revealed a proportion of products with cartoons on the packaging varied from 16% in Israel to 53% in Bulgaria [52].
In our study, the presence of sugar-contributing ingredients complies with the European Commission directive and EFSA definition of added sugars (fruit juice is excluded); nevertheless, these ingredients will also account for the total and free sugar content of these foods [9,15,53]. Our results are in line with those by Grammatikaki et al. that reported 38.5% of the baby foods contained at least one sugar-contributing ingredient in the form of added sugars, free sugars, and fruit and vegetable purées/powders. [18]. Similarly, Padarath et al. found that 34.0% of CACFs available included several free sugars (e.g., sugars, maltodextrin, fruit juice, fruit juice concentrates, and glucose) [49].
Our results show that more than 50% of the CACFs were UP. Comparable results were reported in the research of Araujo et al., in which 33.6% were MP foods, 10.2% were processed, and 56.1% were UP foods [33].
Furthermore, in our study, UP foods showed a total sugar content per 100 g that was significantly lower and a sodium content significantly higher compared to MP foods, and the same was found between processed and MP foods. McCann et al. also found the same unexpected results for the content of total sugars and sodium in UP foods in comparison to processed and MP foods [17]. As the MP foods group consists of fruit purée with/without vegetables 88.6% (n = 62) and fruit purée with cereals/milk 24.6% (n = 8), which have in common the use of certain ingredients, this may explain the higher sugar results observed. The sodium result in the processed food group can be attributed to the group being composed of vegetable purées (n = 3), which have a higher sodium content compared to fruit purées.
Da Rocha et al. found in their study that 79% of the baby foods were UP foods. The difference observed compared with our results (61.8%, n = 118) might be explained by the fact their study considered infant and follow-up formulas (n = 31, 33%), and our analysis included the food category fruit purée with cereals/milk, which had 15.8% (n = 29) of foods classified as UP due to the presence of additives in the ingredient list or the manufactured process [16].
Regarding the recommended age for consumption, our study revealed an early introduction of UP foods. Recognizing the first 1000 days as a crucial period for preventing childhood obesity, the adoption from the early age of dietary patterns that includes foods with sugars as added ingredients or high in UP foods can have implications for child health and contribute significantly to the increase of childhood obesity and chronic diseases in later life [19,54,55]. In its context, the European Childhood Obesity Group highlighted the negative effects of high consumption of UPFs by children and called for restrictions [32].
Various studies have revealed that the main consumers of UP foods are children and adolescents, with caloric intake from UP foods ranging from 67% in the USA in 2018 in children aged 2–19 years [56] to 45.5% in France by the analysis of data from the INCA3 2014–2015 study (children aged 1–10 years) [57]. In Brazil, the proportion of total UP foods energy consumption was reported as 42.0% ± 8.7 at ages 3–4 years and 47.8% ± 8.9 at ages 6–8 years [58].
The consumption of processed and UP foods by children is indicated as a factor that can decrease the quality of children’s diets, considering that many are processed and UP foods that have higher amounts of nutrients of concern, such as sugar, trans fat, and sodium, compared to unprocessed or minimally processed foods [59]. This reveals the need to establish guidelines for the infant-child food industry to reduce processing levels in the manufacture of foods [32,59].
In the current study, UP foods that contained at least one sugar-contributing ingredient, sugar was identified in 53.3% (n = 24) of UP foods. On the other hand, MP foods that have at least one sugar-contributing ingredient, such as fruit juice or concentrates, were found in 91.7% (n = 11) of MP foods. Our results are consistent with the Grammatikaki et al. study, which found in 60% of MP foods contained free sugars (e.g., fruit juices or fruit juices concentrates) [18].
In the future, as part of the strategy of nutritional reformulation of food products with excessive content of fat, salt, sugar, or energy, the present analysis may be replicated to monitor the nutritional composition of CACFs targeted to IYC under 3 years of age in Portugal.
Strengths and limitations could be identified. An important strength of this study lies in providing valuable insight into CACFs at the national level and reinforces that action is needed to establish marketing and product guidelines and inform policymakers to align with health priorities important to IYC. Furthermore, this study also classifies CACFs by the NOVA classification, providing additional insight into these products and could contribute to the limited research available in this area. Furthermore, our results also constitute an important challenge for policymakers to consider lowering the sugar content in CACFs via health taxes, reformulation programmes, and food marketing restrictions [60]. In addition, it is advisable to undertake development of restrictive regulations for CACFs labelling to assist caregivers in making healthier choices. The inclusion on labels of information on added and intrinsic sugars content should be considered [8].
Due to the inherent limitations regarding the sugars labelling of CACFs, as sugars naturally occurring in milk and fruit are not distinguished from added sugars, it was not possible to collect data on the contribution of added sugars to total energy or total carbohydrates content.

5. Conclusions

This study is an overview of the nutrient profile, promotional aspects of product packaging, and level of processing of CACFs and contributes with the expertise to the implementation of the WHO’s guidance of these foods.
Our results indicate a concern related to the sugar content of several categories of CACF, as it is higher than recommended and contradicts the guidelines for restricting sugar intake in infants and young children. Furthermore, our study indicates that an early inclusion of UP foods in IYC diet is probable, with more than 50% of products destined for children under 12 months being classified as UP.
Proper nutrition during infancy and early childhood is crucial to support the growth, health, and development of children. The results of this study emphasise the importance of implementing the WHO guidelines on the assessment of commercially available foods for IYC as a strategy to improve complementary feeding practices and the importance of assessing the food processing characteristics of processed foods and beverages targeted to IYC under 3 years of age to assist parents and health professionals with the correct information when selecting complementary and infant foods.
These findings endorse the importance of innovative interventions in the field of consumer education to decrease UP foods consumption and encourage the consumption of natural and MP foods.
This study also provides evidence to operationalize the implementation at the national level of NPM proposed by WHO to facilitate decisions on what foods are inappropriate for promotion for IYC under 36 months of age and to policymakers to update regulation and guide product reformulation concerning the sugar content of CACFs.
The data framed by WHO recommendations have essential applications in nutrition research, dietary counselling, and public health practice. The WHO recommendations are crucial to understand concerns detected in multicentre studies at the international or national level and identify sub-populations at risk due to typical dietary patterns or increased physiological needs.

Author Contributions

M.S., conceptualization and study design, data collection, data analysis, and writing; F.M., data collection, data analysis, and feedback on the paper; I.L., data analysis and feedback on the paper; A.I.R., data analysis and feedback on the paper; I.C., data analysis and feedback on the paper; A.B., feedback on the paper; R.A., conceptualization, methodology, data analysis, and writing—review and editing. All authors have read and agreed to the published version of the manuscript.

Funding

The authors appreciate the financial support of AHFES project (EAPA_1071_2018AHFHES). This project is co-funded by the European Regional Development Fund through the Atlantic Area Program. Ricardo Assunção thanks FCT/MCTES for the financial support to CESAM (UIDP/50017/2020 + UIDB/50017/2020) through national funds.

Data Availability Statement

The data presented in this study are available on request from the corresponding author.

Acknowledgments

This manuscript was developed under the scope of WHO Collaborating Center on Nutrition and Childhood Obesity–National Institute of Health Dr Ricardo Jorge.

Conflicts of Interest

The authors declare no conflict of interest.

Appendix A

Table A1. Information on the coded variables that were subject to analysis.
Coded VariablesDescription
Basic informationBrand name, product name, food type, ingredients, recommend age, serving size
Product category Products were classified according to the NPM proposed by WHO/Europe: Dry instant cereals; dry cereals (with high-protein food (added)-powder milk or whey); fruit purée (with/without vegetables); vegetable purées; fruit purée with cereal/milk; vegetables with cereal, soft, wet, spoonable; savoury puréed meals; dairy, soft, wet, spoonable; sweet snacks.
Nutritional informationNutritional content (total energy (kJ/kcal), protein (g), carbohydrates (g), total sugars (g), fat (g), saturated fatty acids (g), and sodium (mg). All the nutritional analysis was per 100 g product.
Details on the presence of added sugarsFor these analyses, added sugars were classified as fruit juice whether whole, concentrated, or powdered; sugar; sucrose; dextrose; fructose; maltose; any syrup; honey; barley malt/malted barley/malt extract; molasses; and artificial or natural zero/low-calorie sweeteners.
Composition, nutrition, and health claimsComposition claim: No added preservatives, organic food, egg-free, dairy-claims free, gluten-free. Nutrition claim: Contains calcium, contains iron, contains vitamin C, contains dietary fiber, contains multiple vitamins, no added sugar, no added salt, contains vitamin E, contains multiple minerals. Health claims: Provides good nutrition to children, nutritionally balanced, cognitive ability.
Visual informationPresence of cartoons, pictures of infants/young children, pictures of mothers, pictures of bottles/teats.

References

  1. Scaglioni, S.; De Cosmi, V.; Ciappolino, V.; Parazzini, F.; Brambilla, P.; Agostoni, C. Factors influencing children’s eating behaviours. Nutrients 2018, 10, 706. [Google Scholar] [CrossRef] [PubMed] [Green Version]
  2. Mennella, J.A. Development of food preferences: Lessons learned from longitudinal and experimental studies. Food Qual. Prefer. 2006, 17, 635. [Google Scholar] [CrossRef] [PubMed] [Green Version]
  3. World Health Organization. The Optimal Duration of Exclusive Breastfeeding: Report of an Expert Consultation. Joint WHO/NHD Expert Consultation. In WHO Technical Report No. 01.09.; WHO: Geneva, Switzerland, 2002; Volume 65. [Google Scholar]
  4. World Health Organization; United Nations Children’s Fund (UNICEF). Global Strategy for Infant and Young Child Feeding; WHO: Geneva, Switzerland, 2003. [Google Scholar]
  5. Maslin, K.; Venter, C. Nutritional aspects of commercially prepared infant foods in developed countries: A narrative review. Nutr. Res. Rev. 2017, 30, 138–148. [Google Scholar] [CrossRef] [PubMed]
  6. World Health Organization. Resolution WHA69.9. Ending Inappropriate Promotion of Foods for Infants and Young Children, Proceedings of the Sixty-Ninth World Health Assembly, Geneva, Switzerland, 23–28 May 2016; WHO: Geneva, Switzerland, 2016; pp. 23–28.
  7. World Health Organization. Guidance on Ending the Inappropriate Promotion of Foods for Infants and Young Children: Implementation manual; WHO: Geneva, Switzerland, 2017. [Google Scholar]
  8. WHO Regional Office for Europe. Ending Inappropriate Promotion of Commercially Available Complementary Foods for Infants and Young Children between 6 and 36 Months in Europe; WHO: Geneva, Switzerland, 2019. [Google Scholar]
  9. European Commission. Commission Directive 2006/125/EC on processed cereal-based foods and baby foods for infants and young children. Off. J. Eur. Union 2006, 339, 16–35. [Google Scholar]
  10. UNICEF. The State of the World’s Children 2019. Children, Food and Nutrition. Growing Well in a Changing World; UNICEF: New York, NY, USA, 2019. [Google Scholar]
  11. World Health Organization. Guideline: Sugars Intake for Adults and Children; WHO: Geneva, Switzerland, 2015; Volume 57. [Google Scholar]
  12. Azaïs-Braesco, V.; Sluik, D.; Maillot, M.; Kok, F.; Moreno, L.A. A review of total & added sugar intakes and dietary sources in Europe. Nutr. J. 2017, 16, 6. [Google Scholar] [CrossRef] [PubMed] [Green Version]
  13. Marinho, A.R.; Severo, M.; Correia, D.; Lobato, L.; Vilela, S.; Oliveira, A.; Ramos, E.; Torres, D.; Lopes, C. Total, added and free sugar intakes, dietary sources and determinants of consumption in Portugal: The National Food, Nutrition and Physical Activity Survey (IAN-AF 2015-2016). Public Health Nutr. 2020, 23, 869–881. [Google Scholar] [CrossRef]
  14. Garcia, A.L.; McLean, K.; Wright, C.M. Types of fruits and vegetables used in commercial baby foods and their contribution to sugar content. Matern. Child Nutr. 2016, 12, 838–847. [Google Scholar] [CrossRef]
  15. Hutchinson, J.; Rippin, H.; Threapleton, D.; Jewell, J.; Kanamäe, H.; Salupuu, K.; Caroli, M.; Antignani, A.; Pace, L.; Vassallo, C.; et al. High sugar content of European commercial baby foods and proposed updates to existing recommendations. Matern. Child Nutr. 2020, 17, e13020. [Google Scholar] [CrossRef]
  16. Da Rocha, K.F.; De Araújo, C.R.B.; De Morais, I.L.; Padrão, P.; Moreira, P.; Ribeiro, K.D.D.S. Commercial foods for infants under the age of 36 months: An assessment of the availability and nutrient profile of ultra-processed foods. Public Health Nutr. 2021, 24, 3179–3186. [Google Scholar] [CrossRef]
  17. McCann, J.; Russell, G.; Campbell, K.; Woods, J. Nutrition and packaging characteristics of toddler foods and milks in Australia. Public Health Nutr. 2021, 24, 1153–1165. [Google Scholar] [CrossRef]
  18. Grammatikaki, E.; Wollgast, J.; Caldeira, S. High levels of nutrients of concern in baby foods available in Europe that contain sugar-contributing ingredients or are ultra-processed. Nutrients 2021, 13, 3105. [Google Scholar] [CrossRef] [PubMed]
  19. Spaniol, A.M.; Da Costa, T.H.M.; Souza, A.D.M.; Gubert, M.B. Early consumption of ultra-processed foods among children under 2 years old in Brazil. Public Health Nutr. 2021, 24, 3341–3351. [Google Scholar] [CrossRef] [PubMed]
  20. Monteiro, C.A.; Cannon, G.; Levy, R.B.; Moubarac, J.C.; Louzada, M.L.C.; Rauber, F.; Khandpur, N.; Cediel, G.; Neri, D.; Martinez-Steele, E.; et al. Ultra-processed foods: What they are and how to identify them. Public Health Nutr. 2019, 22, 936–941. [Google Scholar] [CrossRef] [PubMed]
  21. Vandevijvere, S.; De Ridder, K.; Fiolet, T.; Bel, S.; Tafforeau, J. Consumption of ultra-processed food products and diet quality among children, adolescents and adults in Belgium. Eur. J. Nutr. 2019, 58, 3267–3278. [Google Scholar] [CrossRef]
  22. Neri, D.; Martinez-Steele, E.; Monteiro, C.A.; Levy, R.B. Consumption of ultra-processed foods and its association with added sugar content in the diets of US children, NHANES 2009-2014. Pediatr. Obes. 2019, 14, e12563. [Google Scholar] [CrossRef]
  23. Moubarac, J.C.; Batal, M.; Louzada, M.L.; Martinez Steele, E.; Monteiro, C.A. Consumption of ultra-processed foods predicts diet quality in Canada. Appetite 2017, 108, 512–520. [Google Scholar] [CrossRef]
  24. Augustin, M.A.; Riley, M.; Stockmann, R.; Bennett, L.; Kahl, A.; Lockett, T.; Osmond, M.; Sanguansri, P.; Stonehouse, W.; Zajac, I.; et al. Role of food processing in food and nutrition security. Trends Food Sci. Technol. 2016, 56, 115–125. [Google Scholar] [CrossRef]
  25. Costa, C.S.; Del-Ponte, B.; Assunção, M.C.F.; Santos, I.S. Consumption of ultra-processed foods and body fat during childhood and adolescence: A systematic review. Public Health Nutr. 2018, 21, 148–159. [Google Scholar] [CrossRef] [Green Version]
  26. Askari, M.; Heshmati, J.; Shahinfar, H.; Tripathi, N.; Daneshzad, E. Ultra-processed food and the risk of overweight and obesity: A systematic review and meta-analysis of observational studies. Int. J. Obes. 2020, 44, 2080–2091. [Google Scholar] [CrossRef]
  27. Srour, B.; Fezeu, L.K.; Kesse-Guyot, E.; Allès, B.; Méjean, C.; Andrianasolo, R.M.; Chazelas, E.; Deschasaux, M.; Hercberg, S.; Galan, P.; et al. Ultra-processed food intake and risk of cardiovascular disease: Prospective cohort study (NutriNet-Santé). BMJ 2019, 365, l1451. [Google Scholar] [CrossRef] [Green Version]
  28. Schnabel, L.; Kesse-Guyot, E.; Allès, B.; Touvier, M.; Srour, B.; Hercberg, S.; Buscail, C.; Julia, C. Association between Ultraprocessed Food Consumption and Risk of Mortality among Middle-aged Adults in France. JAMA Intern. Med. 2019, 179, 490–498. [Google Scholar] [CrossRef] [PubMed]
  29. Sadler, C.R.; Grassby, T.; Hart, K.; Raats, M.; Sokolović, M.; Timotijevic, L. Processed food classification: Conceptualisation and challenges. Trends Food Sci. Technol. 2021, 112, 149–162. [Google Scholar] [CrossRef]
  30. Monteiro, C.A.; Cannon, G.; Moubarac, J.C.; Levy, R.B.; Louzada, M.L.C.; Jaime, P.C. The UN Decade of Nutrition, the NOVA food classification and the trouble with ultra-processing. Public Health Nutr. 2018, 21, 5–17. [Google Scholar] [CrossRef] [PubMed] [Green Version]
  31. Monteiro, C.A.; Cannon, G.; Lawrence, M.; Costa Louzada, M.L.; Machado, P.P. The NOVA Food Classification System and Its Four Food Groups; FAO: Rome, Italy, 2019; ISBN 9789251317013. [Google Scholar]
  32. Khandpur, N.; Neri, D.A.; Monteiro, C.; Mazur, A.; Frelut, M.L.; Boyland, E.; Weghuber, D.; Thivel, D. Ultra-Processed Food Consumption among the Paediatric Population: An Overview and Call to Action from the European Childhood Obesity Group. Ann. Nutr. Metab. 2020, 76, 109–113. [Google Scholar] [CrossRef]
  33. De Araújo, C.R.B.; Ribeiro, K.D.D.S.; De Oliveira, A.F.; De Morais, I.L.; Breda, J.; Padrão, P.; Moreira, P. Degree of processing and nutritional value of children’s food products. Public Health Nutr. 2021, 24, 5977–5984. [Google Scholar] [CrossRef]
  34. Direção-Geral da Saúde. Perfil Nutricional—Restrições à Publicidade Alimentar Dirigida a Crianças; Ministério da Saúde: Lisbon, Portugal, 2019.
  35. Graça, P.; Gregório, M.J. Strategy for the promotion of healthy eating in Portugal. Health Numbers Port. 2015, 4, 36–40. [Google Scholar]
  36. EFSA Panel on Dietetic Products, Nutrition and Allergies. Scientific Opinion on Dietary Reference Values for carbohydrates and dietary fibre. EFSA J. 2010, 8, 1462. [Google Scholar] [CrossRef] [Green Version]
  37. Dodrill, P. Typical Feeding and Swallowing Development in Infants and Children. In Dysphagia; Elsevier: Amsterdam, The Netherlands, 2016; pp. 253–269. ISBN 9780323187015. [Google Scholar]
  38. IBM Corp. IBM SPSS Statistics for Windows; Version 26.0; IBM Corp.: Armonk, NY, USA, 2019. [Google Scholar]
  39. Gómez-Martín, M.; Arboleya, S.; Gueimonde, M.; González, S. Nutritional composition of processed baby foods targeted at infants from 0–12 months. J. Food Compos. Anal. 2019, 79, 55–62. [Google Scholar] [CrossRef]
  40. Azzopardi, D.J.; Lacy, K.E.; Woods, J.L. Energy density of new food products targeted to children. Nutrients 2020, 12, 2242. [Google Scholar] [CrossRef]
  41. FAO; WHO. Codex Alimentarius: International Food Sandards. Guidelines on Formulated Complementary Foods for Older Infants and Young; FAO: Rome, Italy, 2017. [Google Scholar]
  42. EFSA Panel on Dietetic Products, Nutrition and Allergies. Scientific Opinion on Dietary Reference Values for energy. EFSA J. 2013, 11, 3005. [Google Scholar] [CrossRef] [Green Version]
  43. Fidler Mis, N.; Braegger, C.; Bronsky, J.; Campoy, C.; Domellöf, M.; Embleton, N.D.; Hojsak, I.; Hulst, J.; Indrio, F.; Lapillonne, A.; et al. Sugar in Infants, Children and Adolescents: A Position Paper of the European Society for Paediatric Gastroenterology, Hepatology and Nutrition Committee on Nutrition. J. Pediatr. Gastroenterol. Nutr. 2017, 65, 681–696. [Google Scholar] [CrossRef] [PubMed] [Green Version]
  44. Vos, M.B.; Kaar, J.L.; Welsh, J.A.; Van Horn, L.V.; Feig, D.I.; Anderson, C.A.M.; Patel, M.J.; Cruz Munos, J.; Krebs, N.F.; Xanthakos, S.A.; et al. Added Sugars and Cardiovascular Disease Risk in Children: A Scientific Statement from the American Heart Association. Circulation 2017, 135, e1017–e1034. [Google Scholar] [CrossRef] [PubMed] [Green Version]
  45. World Health Organization. Guideline: Sodium Intake for Adults and Children; WHO: Geneva, Switzerland, 2012; pp. 1–56. [Google Scholar]
  46. Fewtrell, M.; Bronsky, J.; Campoy, C.; Domellöf, M.; Embleton, N.; Mis, N.F.; Hojsak, I.; Hulst, J.M.; Indrio, F.; Lapillonne, A.; et al. Complementary feeding: A position paper by the European Society for Paediatric Gastroenterology, Hepatology, and Nutrition (ESPGHAN) committee on nutrition. J. Pediatr. Gastroenterol. Nutr. 2017, 64, 119–132. [Google Scholar] [CrossRef]
  47. EFSA Panel on Nutrition, Novel Foods and Food Allergens (NDA); Turck, D.; Castenmiller, J.; De Henauw, S.; Hirsch-Ernst, K.-I.; Kearney, J.; Knutsen, H.K.; Maciuk, A.; Mangelsdorf, I.; McArdle, H.J.; et al. Dietary reference values for sodium. EFSA J. 2019, 17, e05778. [Google Scholar] [CrossRef] [PubMed] [Green Version]
  48. Maalouf, J.; Cogswell, M.E.; Bates, M.; Yuan, K.; Scanlon, K.S.; Pehrsson, P.; Gunn, J.P.; Merritt, R.K. Sodium, sugar, and fat content of complementary infant and toddler foods sold in the United States, 2015. Am. J. Clin. Nutr. 2017, 105, 1443–1452. [Google Scholar] [CrossRef] [PubMed] [Green Version]
  49. Padarath, S.; Gerritsen, S.; Mackay, S. Nutritional aspects of commercially available complementary foods in New Zealand supermarkets. Nutrients 2020, 12, 2980. [Google Scholar] [CrossRef]
  50. Pace, L.; Bica, M.; Williams, J.; Hutchinson, J.; Cade, J.E.; Wickramasinghe, K.; Vassallo, C.; Breda, J. High levels of sugar and salt in commercial baby foods in Malta: Results from a pilot study using the world health organization draft nutrient profile model. Malta Med. J. 2020, 32, 59–76. [Google Scholar]
  51. CODEX Alimentarius. Guidelines for the Use of Nutrition and Health Claims. (CAC/GL 23-1997); Joint FAO/WHO Codex Alimentarius Commission; Codex Alimentarius Commission: Rome, Italy, 1997. [Google Scholar]
  52. WHO Regional Office for Europe. Commercial Foods for Infants and Young Children in the WHO European Region: A Study of the Availability, Composition and Marketing of Baby Foods in Four European Countries; WHO: Geneva, Switzerland, 2019. [Google Scholar]
  53. European Food Safety Authority. Scientific Opinion on Establishing Food-Based Dietary Guidelines; EFSA: Parma, Italy, 2010; Volume 8. [Google Scholar]
  54. Lanigan, J. Prevention of overweight and obesity in early life. Proc. Nutr. Soc. 2018, 77, 247–256. [Google Scholar] [CrossRef] [Green Version]
  55. Birch, L.L.; Doub, A.E. Learning to eat: Birth to age 2 y. Am. J. Clin. Nutr. 2014, 99, 723S–728S. [Google Scholar] [CrossRef] [Green Version]
  56. Wang, L.; Martínez Steele, E.; Du, M.; Pomeranz, J.L.; O’Connor, L.E.; Herrick, K.A.; Luo, H.; Zhang, X.; Mozaffarian, D.; Zhang, F.F. Trends in Consumption of Ultraprocessed Foods among US Youths Aged 2–19 Years, 1999–2018. JAMA J. Am. Med. Assoc. 2021, 326, 519–530. [Google Scholar] [CrossRef]
  57. Fardet, A.; Thivel, D.; Gerbaud, L.; Rock, E. A Sustainable and Global Health Perspective of the Dietary Pattern of French Population during the 1998–2015 Period from INCA Surveys. Sustainability 2021, 13, 7433. [Google Scholar] [CrossRef]
  58. Costa, C.S.; Rauber, F.; Leffa, P.S.; Sangalli, C.N.; Campagnolo, P.D.B.; Vitolo, M.R. Ultra-processed food consumption and its effects on anthropometric and glucose profile: A longitudinal study during childhood. Nutr. Metab. Cardiovasc. Dis. 2019, 29, 177–184. [Google Scholar] [CrossRef] [PubMed]
  59. Araújo, C.; Ribeiro, K.D.; Padrão, P.; Moreira, P. Industrialized foods in early infancy: A growing need of nutritional research. Porto Biomed. J. 2019, 4, e47. [Google Scholar] [CrossRef] [PubMed] [Green Version]
  60. WHO Regional Office for Europe. Improving Dietary Intake and Achieving Food Product Improvement. Policy Opportunities and Challenges for the WHO European Region in Reducing Salt and Sugar in the Diet; WHO: Geneva, Switzerland, 2020. [Google Scholar]
Figure 1. Sampling and Product categorization according to the study.
Foods 11 01424 g001
Figure 2. (A) Energy density of food products. The horizontal yellow line at 60 kcal/100 g indicates the minimum energy density adopted by the NPM of the WHO/Europe for several CACFs categories. (B) Protein content of food products. The line at 2.2 g/100 kcal indicates a lower limit adopted by the NPM of the WHO/Europe for several CACFs categories. (C) Total sugar content of food products; (D) total fat content of food products; (E) saturated fatty acids content of food products. The yellow line at 4.5 g/100 kcal indicates an upper limit for total fat adopted by the NPM of the WHO/Europe for some CACFs categories; (F) sodium content of food products. The yellow line at 50 mg/100 kcal indicates the upper limit for sodium adopted by the NPM of the WHO/Europe for some CACFs categories.
Foods 11 01424 g002
Figure 3. (A) Percentage energy from total sugar of food products; the yellow lines at 15%, 30%, and 40% indicate the adopted percentage of calories from total sugar to have a flag on the front-of-pack label by the NPM of the WHO/Europe for several CACFs categories. (B) Percentage energy from total fat of food products; (C) percentage energy from total saturated fatty acids of food products; (D) sodium content (mg/100 g) of food products. The yellow line at 50 mg/100 g indicates the upper limit for sodium adopted by the NPM of the WHO/Europe for some CACFs categories.
Foods 11 01424 g003
Figure 4. (A) Processing classification (NOVA) by food category (n); (B) processing classification (NOVA) by targeted age groups (n); (C) processing classification (NOVA) and added sugars (sugar) (present/absent) in the ingredient list (n); (D) processing classification (NOVA) and added sugars (fruit juice concentrated) (present/absent) in the ingredient list (n).
Foods 11 01424 g004
Table 1. Distribution of CACFs according to food category, processing level (NOVA), and age group.
CharacteristicClassificationNumber (n)Percentage (%)
Product/Food categoryDry instant cereals 3015.7
Dry cereals (with high-protein food (added)-powder milk or whey)157.9
Fruit purée (with/without vegetables)6232.5
Fruit purée with cereal/milk3719.4
Vegetable purée31.6
Vegetables purée with cereal, soft, wet, spoonable31.6
Savoury puréed meals178.9
Dairy, soft, wet, spoonable157.9
Sweet snacks94.7
Processing level (NOVA)Minimally processed7036.6
Processed31.6
Ultra-processed11861.8
Age group (months)Group 1 (4 to <6) 2412.6
Group 2 (6 to <8)11761.3
Group 3 (8 to <12) 3618.8
Group 4 (≥ 12)147.3
Table 2. Nutritional composition per 100 g for CACFs by food category, considered in the study.
Dry Instant
Cereals
Dry Cereals (with High-Protein Food)Fruit Purée (with/without Vegetables);Fruit Purée with Cereal/MilkVegetable
Purees
Vegetables with Cereal, Soft, Wet SpoonableSavoury Puréed MealsDairy, Soft, Wet, SpoonableSweet Snacksp *
Energy (kJ)1651 (1617–1696)1739 (398–1781)243 (220–274)271 (244–305)105 (81.0–†)223 (195–†)254 (236–296)339 (276–383)1810 (1787–1903)<0.001
SD5762441494738395060
Protein (g)10.0 (7.9–12.0)13.6 (2.9–16.5)0.4 (0.3–0.7)0.7 (0.4–1.0)0.8 (0.3–†)1.3 (0.7–†)2.7 (2.4–2.9)3.0 (2.7–3.1)8.7 (6.7–9.7)<0.001
SD3.85.80.20.70.30.80.40.52.8
Total fat (g)2.3 (1.8–4.6)9.5 (3.0–11.0)0.2 (0.1–0.2)0.3 (0.2–1.0)0.3 (0.2–†)1.1 (1.0–†)1.8 (1.7–2.2)2.8 (2.3–3.2)10.0 (8.6–13.5)<0.001
SD2.83.90.21.40.70.70.40.62.4
Saturated fatty acids (g)0.5 (0.3–1.5)1.8 (1.3–2.5)0.0 (0.0–0.6)0.0 (0.0–0.3)0.0 (0.0–†)0.1 (0.0–†)0.4 (0.3–0.6)1.5 (1.3–2.0)1.3 (1.3–3.3)<0.001
SD1.21.30.20.70.20.40.20.41.9
Carbohydrate (g)76.7 (75.0–82.0)63.0 (14.0–66.4)12.9 (11.3–14.1)13.0 (12.0–15.0)4.1 (3.5–†)8.0 (8.0–†)7.60 (6.6–9.3)11.5 (8.8–12.2)76.0 (75.0–76.0)<0.001
SD7.324.82.31.91.20.31.62.31.9
Total sugars (g)20.0 (1.5–26,2)27.2(8.0–31.1)11.0 (9.1–12.1)10.7 (9,6–12.0)1.5 (1.3–†)2.9 (2.0–†)1.3 (1.2–2.4)7.2 (5.0–8.1)12.0 (2.8–24.0)<0.001
SD12.710.72.21.70.50.70.92.011.0
Sodium (mg)16.0 (4.0–45.0)80.0 (36.0–108)4.00 (2.0–16.0)4.00 (0.0–16.5)28.0 (25.2–†)16.0 (12.0–†)32.0 (20.0–78.0)36.0 (30.0–52.0)32.0 (8.0–80.0)<0.001
SD54.049.914.411.617.08.340.014.768.9
Values are expressed as median (25th–75th percentile); SD, standard deviation; * p-value obtained with the Kruskal–Wallis test for independent samples with multiple pairwise comparisons (food categories); † Not calculated (small sample size, n = 3).
Table 3. Distribution of claim type and visual information for CACFs considered in the present study.
CharacteristicSub-Category or ClassificationNumber (n)Percentage (%)
Nutrition/Composition ClaimYes18596.9
No63.1
Health ClaimYes179.0
No17491.0
Claim typeComposition claim
No added preservatives5729.8
Gluten-free6433.5
Organic food4724.6
Egg-free157.9
Dairy-free189.4
Nutrition claim
No added sugar13369.6
No added salt5227.2
Contains vitamin C2613.6
Contains iron199.9
Contains calcium2714.1
Contains vitamin E31.6
Contains multiple vitamins168.4
Contains multiple minerals136.8
Contains dietary fiber84.2
Health claim
Nutritionally balanced/provides good nutrition to children157.9
Cognitive ability21.0
Visual Information (cartons, pictures)Yes7439.0
No 11761.0
Table 4. Description of CACFs according to the presence of claims and presence of sugar-contributing ingredients (number (n) and percentage (%)).
Dry Instant Cereals Dry Cereals
(with High-Protein Food)
Fruit Purée
(with/without Vegetables)
Fruit Purée with Cereal/Milk Vegetable PuréeVegetables Purée with Cereal, Soft, Wet, Spoonable Savoury Puréed Meals Dairy, Soft, Wet, SpoonableSweet Snacks Total 1
Total30 (15.7%)15 (7.9%)62 (32.5%)37 (19.4%)3 (1.6%)3 (1.6%)17 (8.9%)15 (7.9%)9 (4.7%)193 (100%)
Composition Claim
No added preservatives (a)
2 (6.7%)1 (6.7%)28 (45.2%)7 (19.9%)0 (0.0%)0 (0.0%)12 (70.6%)7 (46.7%)0 (0.0%)57 (29.8%)
Gluten-free (b)6 (20.0%)3 (20.0%)29 (46.8%)10 (27.0%)3 (100.0%)1 (33.3%)4 (23.5%)7 (46.7%)1 (11.1%)64 (33.5%)
Organic food (a)1 (3.3%)0 (0.0%)17 (27.4%)16 (43.2%)0 (0.0%)3 (100.0%)5 (29.4%)4 (26.7%)1 (11.1%)47 (24.6%)
Nutrition Claim
No added sugar (a)
16 (53.3%)5 (33.3%)59 (95.2%)34 (91.9%)0 (0.0%)0 (0.0%)5 (29.4%)10 (66.7%)4 (44.4%)133 (69.6%)
No added salt (a)13 (43.3%)5 (33.3%)10 (16.1%)3 (8.1%)3 (100.0%)2 (66.7%)12 (70.6%)1 (6.7%)3 (33.3%)52 (27.2%)
Health Claim
Nutritionally balanced/provides good nutrition to children
0 (0.0%)1 (6.7)%0 (0.0%)3 (8.1%)0 (0.0%)0 (0.0%)0 (0.0%)10 (66.7%)1 (11.1%)15 (7.9%)
Ingredients (added sugars)
Sugar (a)
9 (30.0%)5 (33.0%)3 (4.8%)0 (0.0%)0 (0.0%)0 (0.0%)0 (0.0%)5 (33.0%)5 (55.6%)27 (13.9%)
Fruit juice concentrated (c)2 (6.7%)3 (20.0%)11 (17.7%)11 (29.7%)0 (0.0%)0 (0.0%)0 (0.0%)2 (13.3%)0 (0.0%)29 (15.0%)
Other added sugars (d), (e), (f)5 (16.6%)0 (0.0%)0 (0.0%)3 (8.1%)0 (0.0%)0 (0.0%)0 (0.0%)0 (0.0%)1 (11.1%)9 (4.7%)
χ2 test, (a) (p < 0.001), (b) (p = 0.014), (c) (p = 0.079), and (d) (p > 0.05) for syrup, dextrose, sucrose, malt extract; (e) p = 0.038, for honey; (f) p = Not calculated because variables is a constant for malted barley extract, molasses, maltose, fructose, glucose, trehalose, galactose; 1 Total percentage for each claims type and presence of sugar-contributing ingredients is in relation to the total products analysed (n = 193).
Table 5. Nutrition information per 100 g across processing classification (NOVA) for CACFs considered in the study.
Minimally ProcessedProcessedUltra-Processedp *
Energy (kJ)245 (222–272) a,c105 (81.0–†) a383 (276–1681) b<0.001
SD3947708
Energy (kcal)58.0 (52.5–64.5) a,c24.9 (19.0–†) a91.0 (66.0–397.3) b<0.001
SD9.011.3167.4
Protein (g)0.4 (0.3–0.7) a0.8 (0.3–†) a,c3.0 (1.9–10.0) b,c<0.001
SD0.20.35.0
Total fat (g)0.2 (0.1–0.2) a0.3 (0.2–†) a,c2.3 (1.1–4.0) b,c<0.001
SD0.20.73.6
Saturated fatty acids (g)0.0 (0.0–0.0) a0.0 (0.0–†) a,c0.7(2.9–1.8) b,c<0.001
SD0.20.21.2
Carbohydrate (g)12.9 (11.4–14.0) b4.1 (3.5–†) a15.0 (11.2–75.0) c<0.001
SD2.21.232.0
Total sugars (g)11.0 (9.5–12.1) b,c1.5 (1.3–†) a9.0 (2.9–19.0) a,c0.040
SD2.10.510.4
Sodium (mg)4.0 (0.4–12.0) a25.2 (0.56–†) a,c24.6 (8.0–52.0) b,c<0.001
SD14.015.046.0
Values are expressed as median (25th–75th percentile); * p-value obtained with Kruskal–Wallis test for independent samples with multiple pairwise comparisons (processing classification). For each processing level; different lowercase letters in the same row indicate differences among processing (Kruskal–Wallis non-parametric one-way ANOVA for independent samples with multiple pairwise comparisons), † Not calculated (small sample size, n = 3); SD, standard deviation.
Publisher’s Note: MDPI stays neutral with regard to jurisdictional claims in published maps and institutional affiliations.

