1. Introduction
Great strides have been made in tobacco control in Canada and globally over the past few decades through implementation of various measures, including those endorsed by the international Framework Convention for Tobacco Control [FCTC] [
1]. Nevertheless, smoking prevalence remains substantial: 18.1% of Canadians over 12 years of age, representing 5.4 million Canadians, were current smokers in the year 2014 [
2]. The overall burden of smoking related illness and death from cancer and from respiratory and cardiovascular diseases continues to be devastating. In 2002, 37,000 Canadians died from tobacco associated illnesses–the size of a small town being wiped off the map each year [
3]. Canadians lose an estimated 515,607 person years of life every year as a result of premature mortality from tobacco smoking [
3]. The idea of a “Tobacco Endgame” is based on the perspective that “control” of tobacco will never be enough to deal with the epidemic of tobacco related diseases and that the focus must be shifted to develop strategies to reach a future that is free of commercial tobacco. This notion of “endgame” is qualitatively different from tobacco control strategies currently in place. This recognition is becoming more widespread and is increasingly leading to the view that a strategy for an “endgame” for commercial tobacco is required.
In October 2016, a Tobacco Endgame for Canada Summit was convened with over 80 experts, researchers, government officials, advocates, and health professionals in attendance to discuss possible strategies to the target goal “less than 5 by 35”; that is, to achieve less than 5% smoking prevalence by 2035. In this report, we describe the findings from simulation models that assessed the impact in Ontario of five potential Tobacco Endgame strategies [
4]. They include:
Plain packaging for all tobacco products.
Free cessation services for all (both pharmaceutical and behavioural therapy).
Decreasing the number of outlets selling tobacco products.
Increasing tobacco taxes.
Increasing the minimum age to legally purchase tobacco to 21 years.
In addition, we also modeled the impact of tax and price increase to achieve “less than 5 by 35” on government taxation revenue. Cigarette taxes bring in significant revenue to governments at the national and provincial level. Apart from sales taxes, in 2014–2015 Canadian Federal and Provincial governments received
$8.2 billion from the sale of tobacco [
5]. There is concern expressed by those opposed to tobacco elimination that reducing the number of smokers would decrease government revenue and that this would be of such a magnitude that it could not happen. However, there is overwhelming Canadian and international evidence that increases in tobacco taxes can reduce tobacco use and increase government tax revenue [
6,
7,
8,
9,
10,
11,
12,
13]. At current taxation and tobacco use rates, taxes on tobacco products have the dual effect of decreasing the demand for tobacco and increasing government revenue. In fiscal year 2014–2015, the federal government collected more than
$3 billion in cigarette taxes [
14]. In Ontario and Québec, Canada’s largest provinces, the provincial governments collected more than
$1 billion each.
If Canada achieves “less than 5 by 35” through non-tax interventions, total taxes collected on the sale of tobacco products would dwindle substantially. Given that in 2014, 18.1% of Canadians aged 12 and older smoked either daily or occasionally [
2], it could be expected that annual tobacco tax receipts decrease by as much as 75% from 2035. Moreover, during the period of transitioning from 18% to 5% smoking prevalence, the cumulative amount of tax losses year over year would be far from negligible. Achieving “less than 5 by 35”, however, need not be achieved solely on the back of non-tax interventions. In the case, albeit extreme, that “less than 5 by 35” is achieved solely through tax and price increases, the cumulative tax revenue gains during the transition period could be considerable. Irrespective of the substantial cost savings gained from reductions in health care spending and reductions in indirect costs to society detailed above, there might be minimal changes in government revenue during the period of transition to “less than 5”, if increased tax rates are a component of an endgame strategy.
The purpose of this paper is to evaluate the expected impact of endgame policies and understand the expected tax revenue impact of reducing smoking prevalence to less than 5%.
2. Materials and Methods
2.1. Ontario SimSmoke Model
Four of the Tobacco Endgame strategies were modelled using the Ontario SimSmoke simulation model. The Ontario SimSmoke model is adapted from the SimSmoke simulation model of tobacco control policies, previously developed for the U.S. and other countries [
15,
16,
17]. The model uses population, smoking rates, and tobacco control policy data for Ontario. It assesses, individually and in combination, the effect of seven types of tobacco control policies (taxes, clean air, mass media, advertising bans, warning labels, cessation treatment, and youth access policies) on smoking prevalence and associated future premature mortality [
18]. Each policy parameter in the model is accorded an effect size developed for the SIMSMOKE model based on literature reviews and expert panel. These existing parameters were then either maximized to represent full implementation of the intervention or the parameter effect sizes themselves were adapted according the new assumptions. Modifications were made to the Ontario SimSmoke policy levels or policy effect sizes to assess the impact of each Tobacco Endgame strategy on smoking prevalence in Ontario between 2019 and 2035. The following represent the changes in the SIMSMOKE model to represent the effect of the endgame scenarios.
To simulate the impact of plain packaging, the comprehensive marketing ban (both direct and indirect) policy level in Ontario SimSmoke was increased to 90% (up from 25%) as a proxy measure for plain packaging in which the package itself was assumed to be the primary method of direct consumer marketing in Ontario..
Free cessation services were modeled adapting two parameters in Ontario SimSmoke. The first parameter incorporated free cessation services (pharmacotherapy and behavioural therapy) in all primary care and hospital settings,. The second parameter expanded the number of settings offering free cessation to also include offices of health professionals, community, and ‘other.’ Free cessation services are currently limited in Ontario.
Analyses conducted by Chaiton, Mecredy, and Cohen [
19] identified an increased risk of relapse among smokers who resided within 500 m from a tobacco outlet (Hazard ratio: 1.41) compared to those who lived further away. As a proxy measure for decreasing the number of outlets selling tobacco products, the policy effect sizes in Ontario SimSmoke for the five cessation treatment policies (treatment availability, treatment access, quitlines, quitlines with treatment access, and brief interventions) were increased by a value of 1.41.
Price elasticities were doubled in the Ontario SimSmoke model to assess the impact of increased tobacco taxes on smoking prevalence. Specifically, the policy effects were increased to −0.6 for youth less than 18 years (60% reduction in smoking), −0.4 for young adults aged 18 to 24 (40% reduction in smoking), −0.3 for adults aged 25 to 34 years (30% reduction in smoking) and −0.2 for adults aged 35 years or more (20% reduction in smoking).
2.2. Ontario Population Model
Our final endgame model, increasing the minimum age of legal purchase to 21 years and tax revenue, was modelled separately from the SIMSMOKE model. In this model, we simulated the impact of minimum age laws by using a population program in which the baseline status quo rate of change in smoking prevalence was estimated to be 1.1% per year. We adjusted our model for effects in age group less than 19 and eliminated the effect of cessation in our model. This model was also used to evaluate the effect of taxation using a separate model that simulates the impact of tax and price increases required to achieve “less than 5 by 35”.
Based on the analyses conducted by Callaghan et al. [
20], it was assumed that the rate of onset for new smokers aged 20–22 would be 2.7 percentage points lower than it would have been under the standard projection for each year if the minimum age ban took effect immediately. No changes in prevalence were modelled for older ages at the time on the implied onset of the law; however, the effect was carried through as the cohort aged. Additionally, it was assumed that the increased age of onset would be associated with increased cessation in this cohort (natural rate of decrease adjusted from 0.011 to 0.022). No adjustment was made for any effects in youth younger than 19 who might be affected by reduced access to tobacco. No adjustment was made for any additional social normative effects.
This model obtained smoking prevalence from 2014 Canadian Community Health Survey (CCHS) [
2]. We used Statistics Canada medium growth population projection scenario (M1: medium-growth, 1991/1992 to 2010/2011 trend, CANSIM Table 052-0005) [
21]. The number of people aged 20–22 was obtained from the Ontario Ministry of Finance for years 2018–2035 [
22]. Smoking prevalence and daily number of cigarettes consumed per smoker, by age: We used the most recent cycle (2014) of a large national survey, the CCHS, and obtained point estimates for smoking prevalence and intensity. Excise tax rate and revenue: We obtained current tobacco excise tax rates and more recent estimates of tobacco excise tobacco tax revenue from provincial Ministries of Finance. Total cigarette tax paid sales: As a measure of tax-paid sales, we used cigarette wholesale data as reported by tobacco manufacturers to Health Canada. Underlying trend: Smoking prevalence in Canada has steadily decreased since the mid-1960s. In 1965 about half of all Canadians aged 15 and above smoked. By the early 2010s, only about 20% did [
23]. This steady decline was due to many factors such as information on the harmful effects of active smoking and secondhand smoke, tobacco control policies such as smoke free policies, advertising bans and taxation, and changes in anti-smoking sentiment. Although it is difficult to disentangle the effects of each of these factors, it seems reasonable to assume that the downward trend in smoking prevalence observed between the early 2000s and the present would not abruptly end in the near future. In the last decade for which data are available, smoking prevalence, on average, declined annually by about 2% to 3% depending on the province. We assumed an underlying trend of 2.5% in annual decrease in both smoking prevalence and daily number of cigarettes consumed per smoker.
2.3. Tax Revenue
This model that simulates the impact of tax and price increases required to achieve “less than 5 by 35” by examining the impact on taxation revenues under three different scenarios: (1) excise taxes are increased only to keep up with inflation; (2) “less than 5 by 35” is achieved solely through excise tax increases; and (3) “less than 5 by 35” is achieved through non tax intervention and excise tax increases that raise prices by 5% in real terms annually. We used accepted parameters of elasticity for changes in tobacco prices for adults (−0.4) and twice that for youth [
13]. The model accounts for population growth, inflation, and tax evasion. We used data for the province of Ontario to simulate the impact of tax and price increases required to achieve “less than 5 by 35” on tax revenue. At the current tax rates, it is expected that Ontario will collect about
$1.5 billion in 2016. All monetary figures below are in constant 2016 dollars. To estimate the changes on tax revenue, we made the following baseline model parameters and assumptions.
Own-price elasticity: There is overwhelming evidence that individuals respond to changes in tobacco prices. In high-income countries such as Canada and the United States, it is generally accepted that a 10% increase in prices would reduce total consumption by about 4%; and that half of the reduction comes from a reduction in the number of smokers and half from a reduction in consumption among continuing smokers [
13]. It is also generally accepted that youth respond more to changes in prices—about twice as much as older adults [
13]. Consequently, as a baseline assumption for own-price elasticity for cigarettes, we used −0.4 for adults (20 years of age and above) (−0.2 for own-price prevalence elasticity and −0.2 for own-price consumption elasticity), and twice that for youth (12 to 19 years of age).
Pass-through rate: Tax changes do not necessarily lead to price changes as manufacturers are rarely required to pass on the full extent of tax increases to consumers. Manufacturers often under- or over-shift tax changes. In mature cigarette markets such as Canada, manufacturers typically over-shift tax increases [
24]. As a baseline assumption, we assumed that tobacco manufacturers over-shift tax increases by 10%.
Prices: In order to estimate the effect of tax changes on smoking, it is necessary to first estimate the effect of tax changes on current prices. We used $0.40 per cigarette stick.
Expected inflation: As a measure of expected inflation, we used 2% annual increases to reflect the Bank of Canada’s 2% inflation-control target [
25].
Cigarette tax evasion: Although cigarette tax evasion has many causes, high taxes undeniably create an incentive for tobacco users and manufacturers to elaborate ways to evade tobacco taxes. While the illegal nature of cigarette tax evasion makes it intrinsically difficult to measure accurately, cigarette tax evasion in some Canadian regions such as southern Ontario is not negligible [
26]. Our model allows for a portion of the effect of tax and price increases on tobacco use and consumption to be directed towards contraband cigarettes.
3. Results
3.1. Smoking Prevalence Modelling
Results from the Ontario SimSmoke simulation model indicate that each of the Tobacco Endgame strategies predicts a greater reduction in smoking prevalence by 2035 compared to the status quo scenario (
Table 1 and
Figure 1).
Increased taxation had the greatest independent impact on smoking prevalence. By 2035, smoking prevalence is projected to reach 10.1% with increased tobacco taxes, while the status quo prevalence is projected to be 12.9% in 2035 (a 2.8 percentage point reduction).
Decreased tobacco availability is projected to reduce smoking prevalence by 1.5 percentage points in 2035, from 12.9% with the status quo scenario to 11.4% with fewer tobacco outlets.
Offering free cessation services in primary care and hospital settings (i.e., Ottawa Model of Smoking Cessation model) is projected to reduce smoking prevalence to 12.2% in 2035, while free cessation services offered in primary care, hospitals, offices of health professionals, community and ‘other’ settings is projected to further reduce smoking prevalence to 12.1% in 2035. Both cessation policy models project lower smoking prevalence in 2035 compared to the status quo scenario (12.9% in 2035; a 0.61 and 0.78 percentage point reduction, respectively).
Plain packaging is projected to reduce smoking prevalence by 0.6 percentage points in 2035, from 12.9% with the status quo scenario to 12.3% with plain packaging.
The combined effect of all four Tobacco Endgame strategies modelled in Ontario SimSmoke is projected to reduce smoking prevalence to 8.5% in 2035, a 4.4 percentage point reduction compared to the status quo scenario (12.9% in 2035).
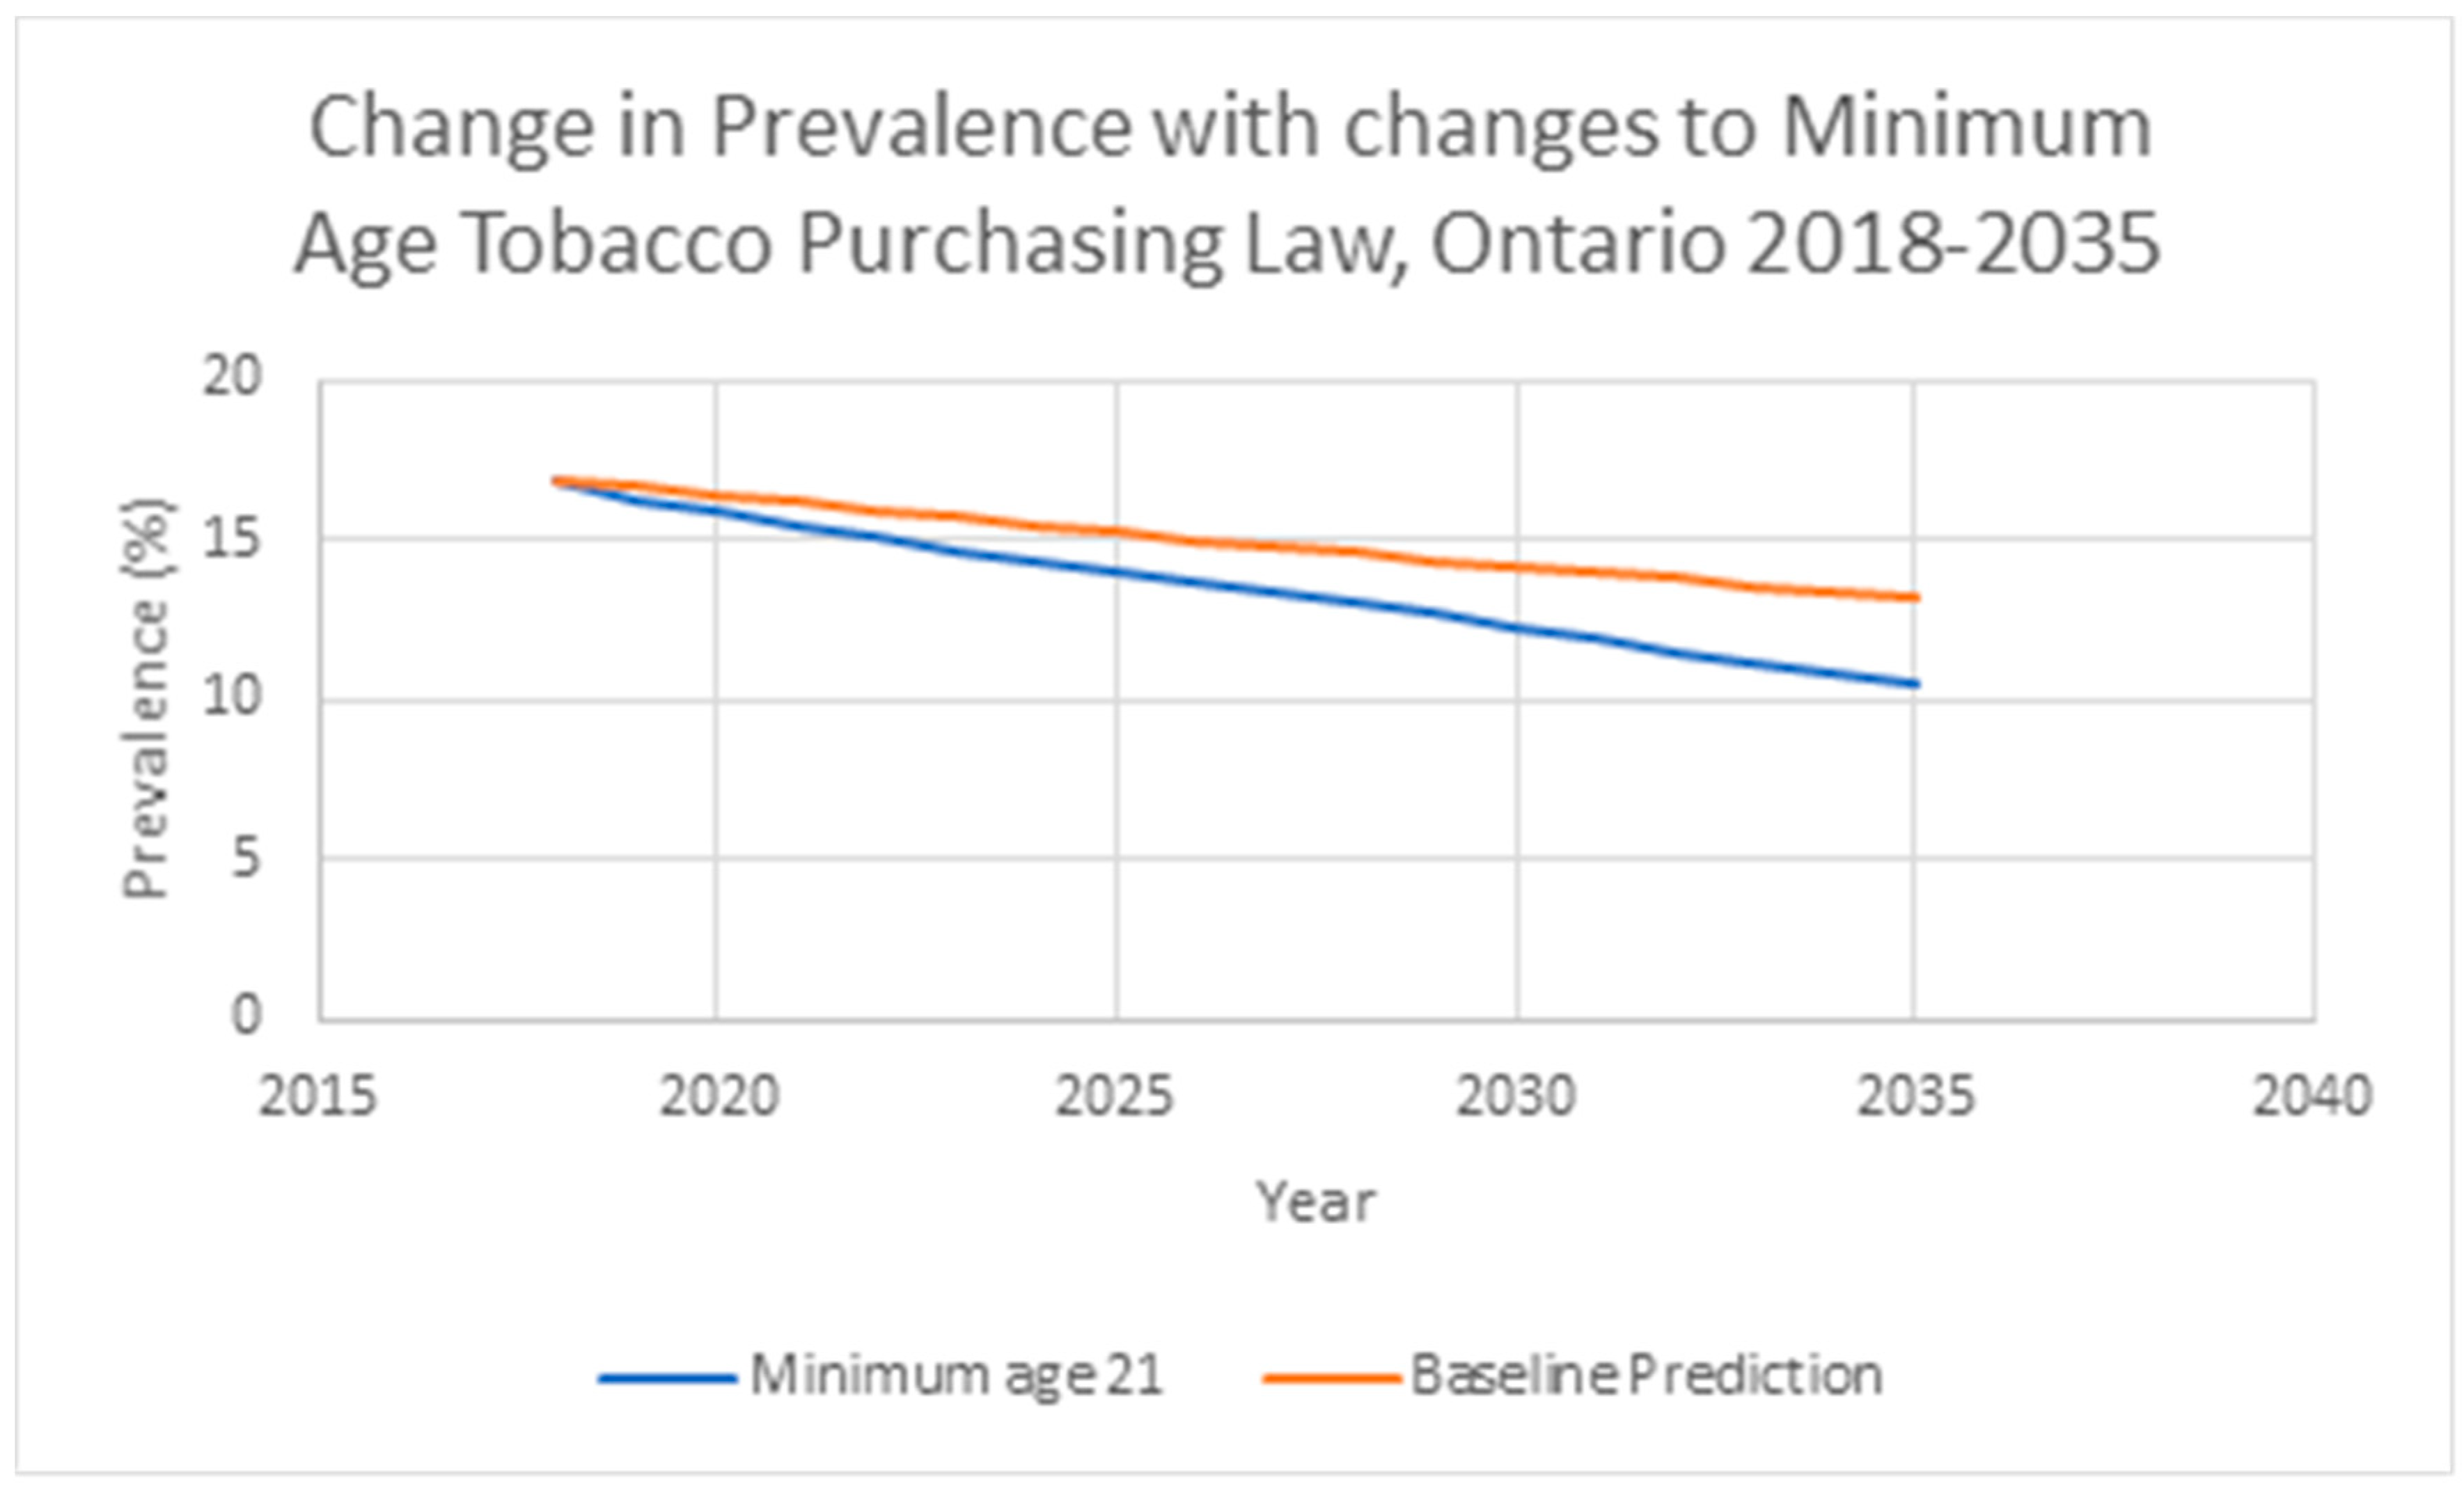
In the model assessing the impact of a higher minimum age for legal purchase, population smoking prevalence was expected to decline 3.7 percentage points by 2035 to 13.2% from an imputed value of 16.9% under the baseline status quo scenario. Increasing the minimum legal purchase age to 21 would be expected to reduce smoking prevalence to 10.5% (8.0% among the 20–34 year olds; 2.7 and 5.2 percentage point decrease, respectively). Eliminating the effect on cessation in the model would predict a 2035 prevalence of 11.2% (10.8% among the 20–34 year olds; 2.0 and 2.4 percentage point decrease, respectively) (
Figure 2).
3.2. Taxation Revenue Models
Average number of cigarettes per day was expected to be 4.0 cigarettes smoked per day among the 5% who were expected to continue smoking on average by 2035 down from 13.3 cigarettes a day in 2014.
Scenario 1. “Less than 5 by 35” achieved through non-tax interventions (excise taxes assumed to keep up with inflation):
- -
Tax revenue, 2035: $163 million
- -
Tax revenue, 2016–2035: $12,605 million
- -
Tax revenue, average, 2016–2035: $630 million
Scenario 2. “Less than 5 by 35” achieved solely through excise tax increases (assuming an underlying annual downward trend in smoking prevalence and consumption of 2.5%). Note that such a scenario requires that taxes increase annually by more than 20%:
- -
Tax revenue, 2035: $5054 million
- -
Tax revenue, 2016–2035: $68,884 million
- -
Tax revenue, average, 2016–2035: $3444 million
Scenario 3. “Less than 5 by 35” achieved through non-tax interventions and excise tax increases that raise prices by 5% in real terms, annually:
- -
Tax revenue, 2035: $673 million
- -
Tax revenue, 2016–2035: $24,261 million
- -
Tax revenue, average, 2016–2035: $1213 million
4. Discussion
The modelling results presented in this report highlight the effects of five key Tobacco Endgame strategies to reduce the smoking prevalence in Ontario by the year 2035. Increasing the tobacco taxes had the greatest independent predicted decrease in smoking prevalence by the year 2035 (2.8%), followed by increasing the minimum age for legal purchase to 21 years (2.4%) and decreasing the number of tobacco outlets (1.5%). Offering free cessation services and introducing plain packaging on all tobacco products each reduced the smoking prevalence by less than 1% compared to the status quo. Notably, none of the Tobacco Endgame strategies (either independently or combined) projected a smoking prevalence that was less than 5% by 2035.
Regarding impact of tax interventions on government revenue, our model shows that if Canada achieves “less than 5 by 35” through non-tax interventions, annual tobacco tax receipts would decrease from about $1.5 billion to about $160 million in 2035. However, if tax rates increase such that prices increase by 5% annually (in excess of inflation)—a policy pursued by France from 1991 to the early 2000s—average annual tax revenue would amount to about $1.2 billion and the cumulative taxes collected between 2016 and 2035 would near $25 billion.
The scenario 2 model showing the potential prices needed to achieve “less than 5 by 35” through taxation alone demonstrates the need for a comprehensive policy for the Tobacco Endgame that relies on both tax and non-tax interventions. Allowing for a portion of the effect of tax and price increases on tobacco use and consumption to be directed towards contraband cigarettes, as expected, reduces tax receipts, but does not invalidate any of the key findings. Similarly, our results are not sensitive to the use of a more conservative own-price elasticity estimates of −0.3. Taxation revenue should not be a barrier to the endgame. The analysis shows that with a sensible taxation policy, fiscal cost impact over the period of implementation is minimal compared to the health care and social costs of tobacco which currently are estimated at
$16.2 billion per year [
27]. Ultimately, however, it is important to recognize that the massive health and mortality burden due to tobacco is not worth sustaining for any amount of profit or revenue.
Caution should be taken when interpreting the projections presented in this report as they depend on the reliability of the data, and the estimated parameters and assumptions used in the models. A reduction in smoking prevalence and consumption in excess of current trends would inevitably lead to future populations that are larger than projected by Statistics Canada’s medium growth population projections. There is strong evidence that higher incomes increase the demand for tobacco products [
13]. However, income growth in Canada is projected to be relatively low [
28]. Consequently, income effects are unlikely to affect the above results. Our approach examines the effect of changes in tobacco excise rates on tobacco excise revenue and not on harmonized sales tax (HST) which is a non-tobacco specific tax applicable on any taxable supplies in Canada, as ex-smokers and continuing smokers that reduce their consumption will very likely divert their spending towards goods and services that are also subject to HST. Our approach does not address the issue of tax avoidance such as brand switching. Because governments in Canada rely entirely on tobacco specific excise taxes and not on specific ad valorem taxes, which differs between brands of tobacco products. More broadly, the endgame potential interventions here are only a possible subset of innovative strategies that could change the landscape of tobacco control. For instance, this study does not consider the role of e-cigarettes, reduced nicotine, or structural changes to the tobacco industry. These other interventions may have a greater impact on smoking prevalence or health burden than the intervention set considered here.


