1. Introduction
Infrared spectroscopy is the science and technology of identifying and quantifying the composition of matter based on the interaction of their molecular vibrations and rotations with the light in the infrared region of the spectrum [
1,
2]. It is serving a huge number of applications in different domains such as the biological, pharmaceutical, chemical, food and beverage and environmental monitoring industries. One example is the infrared gas analyzers that can serve natural gas analyses, air quality monitoring, threat or gas leakage detection and medical diagnostics [
3,
4]. The market is growing fast and is expected to grow even faster due to the introduction of the miniaturized spectrometers enabling portability and ubiquitous spectral sensing for both professional and consumer use [
5].
Different miniaturization or microscale technologies have emerged to serve the existing market and open new markets, such as microelectromechanical systems (MEMS) Fourier transform infrared (FTIR) spectrometers [
6,
7], tunable selective filter spectrometers [
8], linear variable filters [
9] and dispersive grating spectrometers [
10]. The miniaturization comes at the cost of lower performance than bench-top instrumentation, especially for the spectral resolution. In FTIR spectrometers, the resolution is limited by the travel range of the micromirror of the scanning Michelson interferometer following the uncertainty principle [
1,
11]
, where
is full travel range of the mirror and
is the spectral resolution in the wavenumber domain. The resolution in the wavelength domain
, where
is the wavelength. For resonance filter-based techniques, high reflectivity mirrors together with a longer physical cavity are needed to achieve fine spectral resolution but this forces the filter to operate at high-resonance, thus limiting the spectral range of operation [
12]. Finally, for first diffraction order dispersive grating spectrometers, the resolution follows the relation
[
13] where
N is the number of grooves on the diffraction grating. This is consistent with the transform limit theory stating that the smallest resolvable unit transform is inversely proportional to the number of samples.
Multivariate analysis, sometimes referred to as chemometrics, is usually used to predict the concentration of the different compositions of the sample [
1]. The accuracy of prediction depends on many factors such as the ratio between signal and noise, spectral resolution, accuracy of the
x-axis (i.e., wavelength accuracy) and the accuracy of the
y-axis (i.e., photometric accuracy). In the case of gas analysis, spectral resolution is of particular importance. Therefore, there is a need for realizing a high-resolution spectral analysis over a wide spectral range based on a compact spectroscopic device. Higher (finer) spectral resolution is required for better identification and quantification of materials. In fact, the resolution plays an important role in the ability of material identification and sometimes the sensitivity to lower concentration as well [
1,
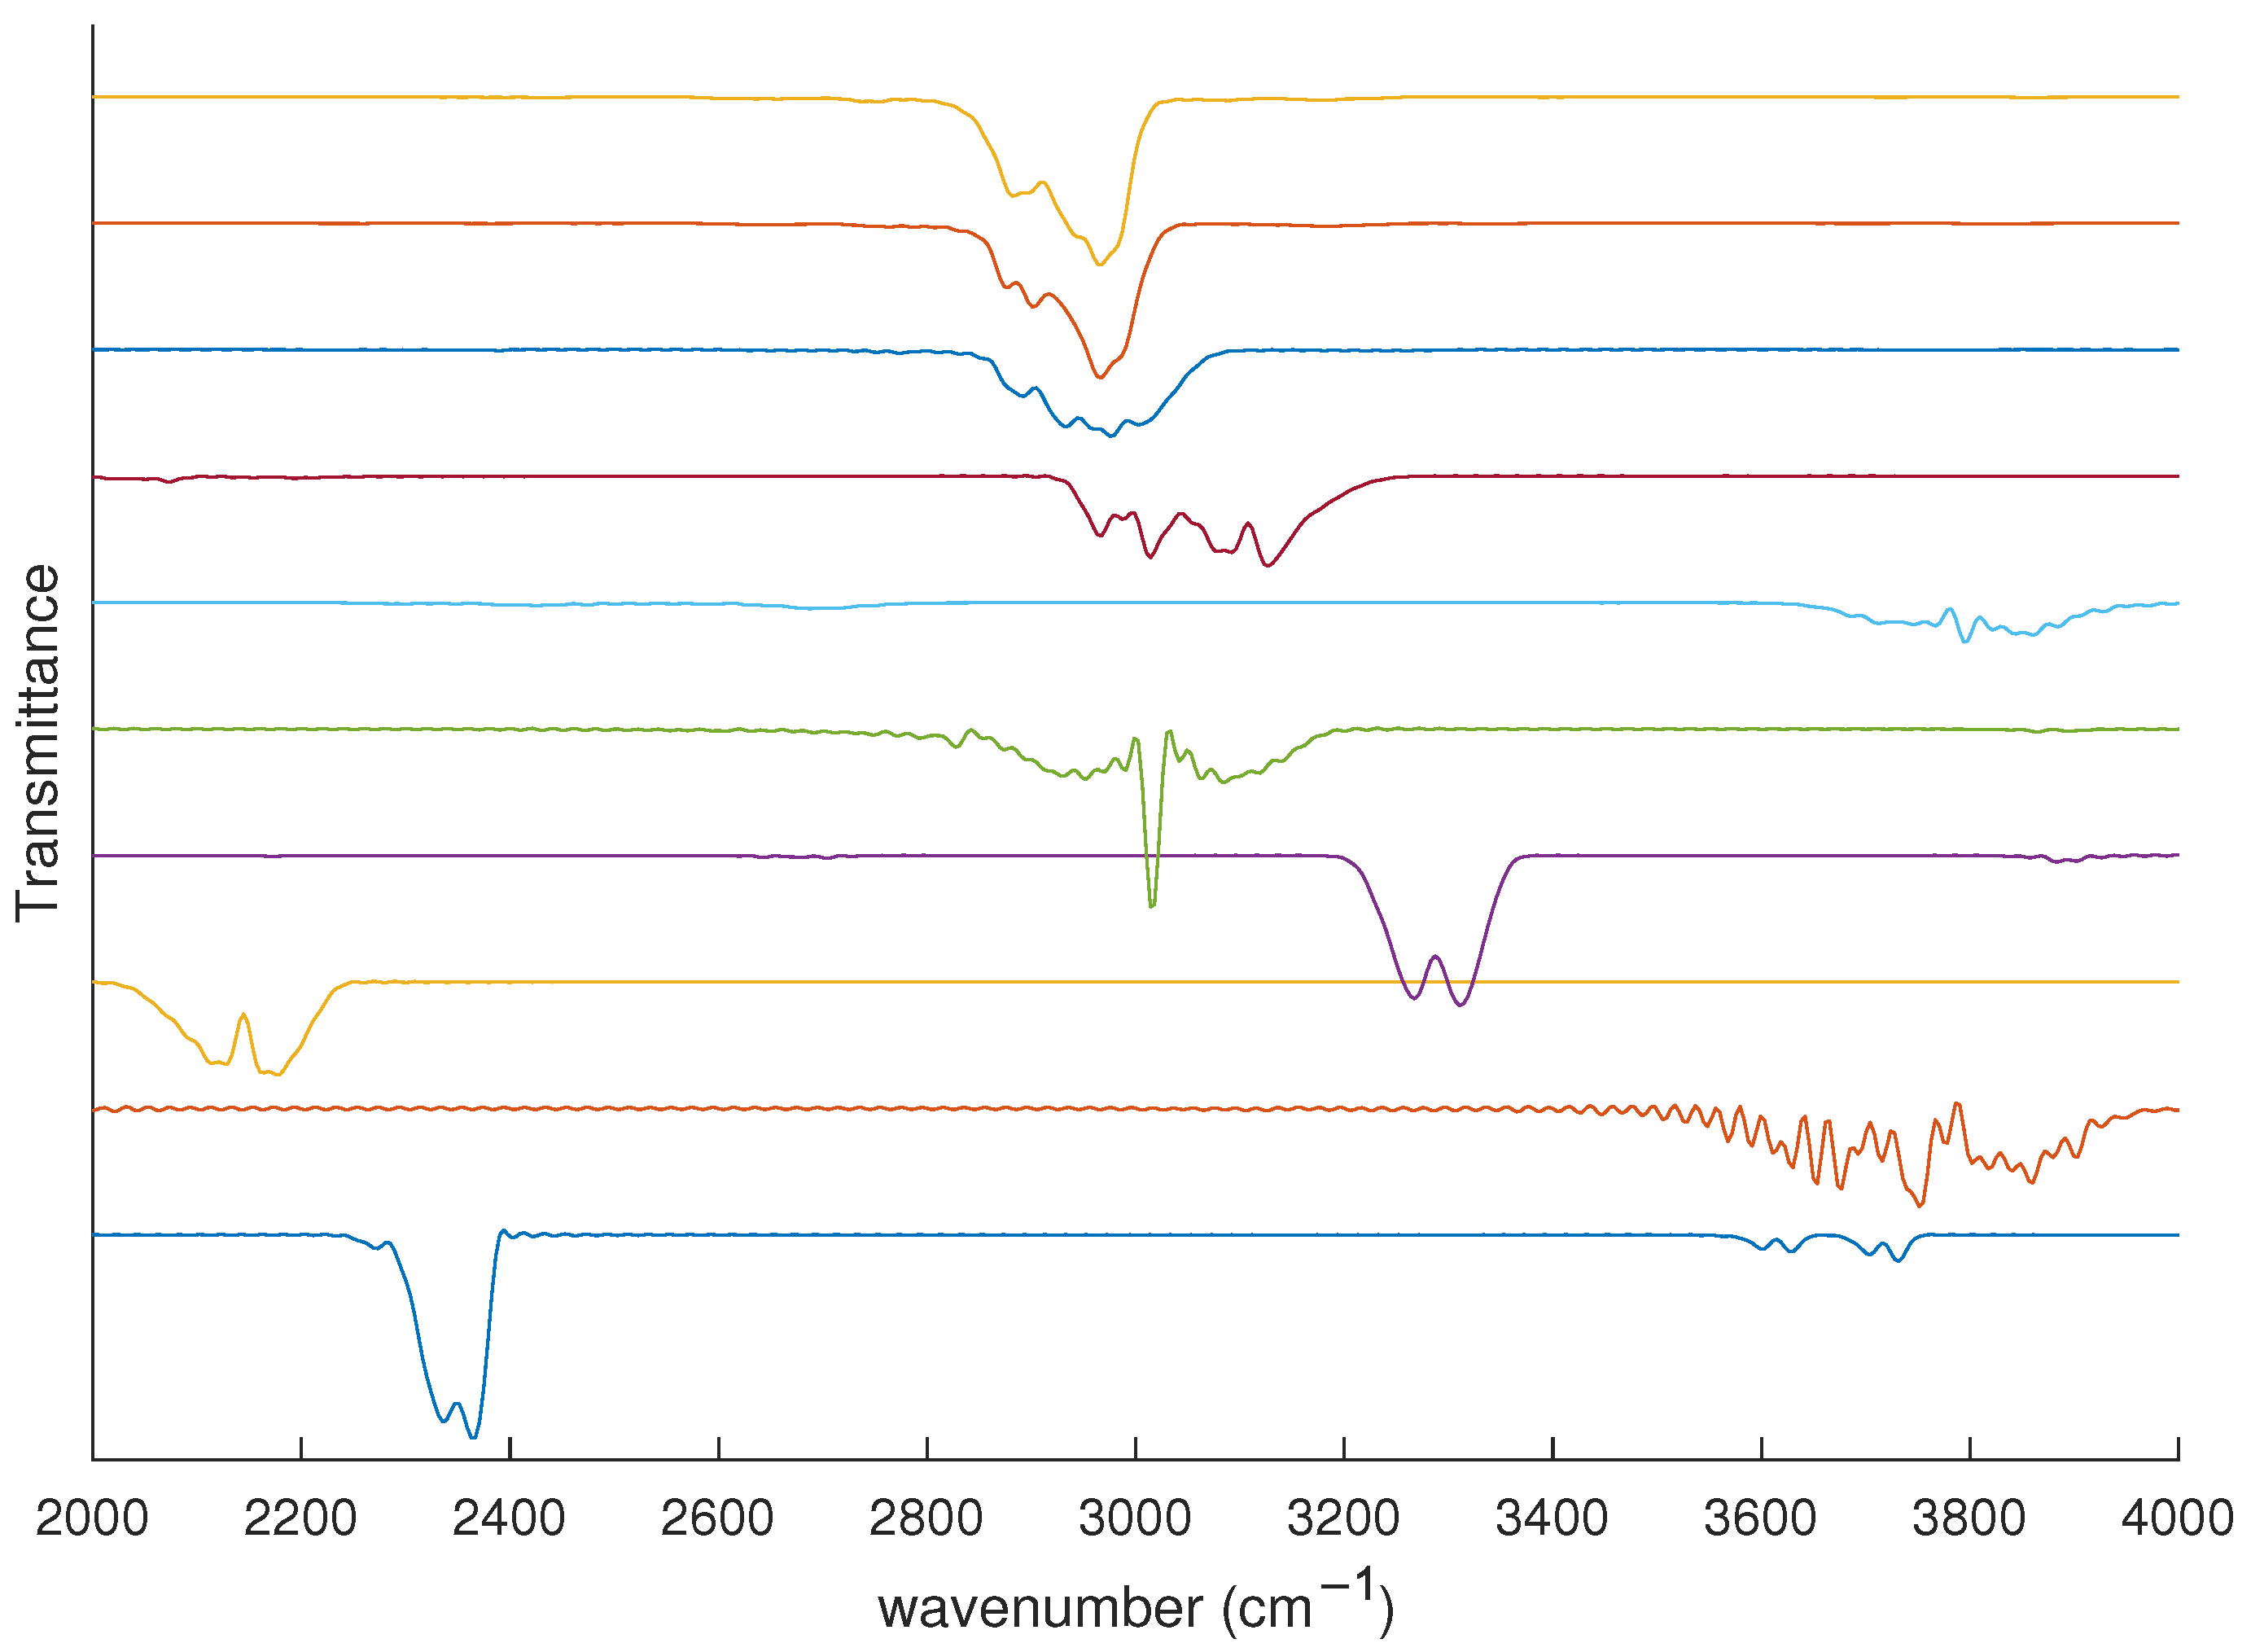
14]. One notable example for smart industry is the analysis of the biogas and natural gas contents as a primary source of energy in domestic and industrial markets. On one hand, this kind of gas is composed of a mixture of compounds whose spectral fingerprint is spread over a wide spectral range as shown in
Figure 1. On the other hand, the various hydrocarbons in such gases (e.g., CH
, C
H
, C
H
, C
H
) have a similar molecular structure requiring selective detection (fine resolution).
Therefore, there is a need for realizing a high-resolution spectral analysis over a wide spectral range based on compact spectroscopic devices. To this end, several infrared spectroscopy resolution enhancement techniques have been reported from, on one hand, by innovative hardware architectures together with the corresponding signal processing [
15,
16,
17] and, on the other hand, by using signal processing techniques on the conventional hardware such as auto-regression [
18] and compressed sensing [
19]. However, the offered resolution enhancement of such techniques is still not enough compared to the resolution of bench-top devices, and is accompanied with spectral distortion necessitating the need for incorporating new directions. Deep learning (DL) was shown to be very successful in resolution enhancement of different types of signals, such as images [
20,
21], medical imaging [
22], interferometry [
23], fluorescence microscopy [
24,
25], field-emission scanning electron microscopy [
26], magnetic resonance imaging (MRI) [
27], and vascular ultrasound imaging [
28]. DL was also applied in enhancement of other one-dimensional (1D) signals such as speech [
29,
30].
In this article, we use a deep convolutional neural network (CNN) for virtual resolution enhancement of FTIR gas spectra. The article extends and further improves previously presented results [
31]. The neural network considers the low-resolution spectrum as the input and generates a high-resolution one. In [
31], a CNN was introduced as a proof-of-concept to enhance the resolution of gas spectra that are composed of mixtures of different percentages of six gases. We extend the results by considering mixtures of ten gases that are relevant to the gas industry. The consideration of extra gases poses an extra problem, which is the overlapping of spectral peaks of different gases. The neural-network parameters have to be carefully tuned to be able to resolve such overlapped peaks. Additionally, the previously reported problem of false peaks in the enhanced spectra was improved in the work presented here. Finally, we extend the results by enhancing the resolution of experimentally measured spectra using both bench-top FTIR spectrometer (bench-top device Tensor II by Bruker) and a miniaturized mid-infrared MEMS FTIR spectrometer [
32]. The training of the CNN required the consideration of data with different spectral resolutions and signal-to-noise ratios (SNRs). Other features in the data have also been accounted for, as discussed in detail below.
The rest of the article is structured as follows.
Section 2 discusses the methodology of datasets synthesis, the network architecture and the training process. In
Section 3, we show the results of the trained network and evaluate the performance of the proposed network with synthetic and measured data. Conclusions are presented in
Section 4.
2. Methodology
Generally, resolution enhancement methods apply signal processing techniques on the low-resolution input signal to reach a higher resolution version (e.g., [
33,
34]). These signal processing techniques mainly adopt either a local or global approach to generate the missing samples needed to enhance the resolution. Interpolation based techniques approaches are mainly dominated by the neighbor samples or hand crafted features to deduce the missing samples; such a step does not directly benefit from potential useful characteristics of the whole signal. On the other hand, frequency based enhancement approaches inject the required information based on a theoretical assumption and ignore the local information around each sample.
CNN architecture enables the processing of the input signal on different layers, where the signal is convolved with many kernels to capture local features around each sample, the output of each layer is fed to the next level to capture more abstract features as wider neighborhood of the sample is involved. Finally, fully connected layers enable the involvement of the whole signal to affect each output sample. The convolution kernels at each layer and the weights at fully connected layers are initiated randomly and modified iteratively through the learning process, where the output signal is kept closer to the ground truth of the corresponding input. This CNN architecture enables both local features around samples and global features of the whole signal to be employed in the enhancement process. Instead of adopting theoretical assumptions about the signal, CNN uses the training data (input low-resolution signals and corresponding ground truth high-resolution versions) to adjust the kernels and weights and to extract features and to implicitly learn the required mapping based on realistic data which provides a superior performance when compared with traditional approaches.
In this research, CNN is proposed for the FTIR resolution enhancement problem. Training the proposed neural network requires the availability of large sets of low- and high-resolution gas spectra, where the high-resolution spectra are considered as ground-truth. Experimentally acquiring such large sets of data is very challenging. Therefore, we relied on generating synthetic spectra that imitates the measured spectra. The network was trained using the synthesized low- and high-resolution data. The details of the training data set and the employed synthesis is covered in
Section 2.1 and the network architecture is discussed in
Section 2.2 and
Section 2.3.
2.1. Training Datasets
For training the neural network, a very large set of high- and low-resolution gas spectra was utilized at different SNRs. The utilized data of gas spectra were synthesized using data available from both the spectroscopic HITRAN (high-resolution transmission molecular absorption database) online database [
35] and database generated by Pacific Northwest National Laboratory (PNNL) [
36]. Each generated spectrum represents a mixture of different amount of gases that are relevant to the gas industry, namely, Carbon dioxide CO
, water vapor H
O, Carbon monoxide CO, Acetylene C
H
, Methane CH
, Hydrogen sulfide H
S, Ethene (Ethylene) C
H
, Ethane C
H
, Propane C
H
, and Butane C
H
. PNNL provides the absorption for a sample concentration of one part-per million (ppm) in one-meter optical path length at 296 kelvins, and HITRAN provides a compilation of spectroscopic parameters that are used by a set of computer codes to predict and simulate the transmission and emission of light in gases. The amount of gases in the synthesized mixtures were limited to percentages that are relevant to the mentioned industrial applications.
Synthesis of Different Resolution Spectra
The spectra obtained from HITRAN and PNNL are of high-resolution. Creating spectra with lower resolutions was performed as follows. Spectral resolution depends directly on the maximum optical path difference (OPD) that can be measured by the spectrometer [
1,
37]. To simulate the effect of lower resolution FTIR spectrometers, a model based on a Michelson interferometer was used for interferogram calculation taking into consideration the limited OPD. Given the absorptivity of gases, the input spectrum (transmittance)
is calculated based on Beer-Lambert law,
where
is the gas absorptivity,
C is the gas concentration and
L is the path length. The interferogram
is then calculated using the following equation, neglecting the dispersion effect
where
x is the optical path difference between interferometer arms,
and
are minimum and maximum wavenumbers. Then, the output gas spectrum
is calculated using Fourier transform of the interferogram as follows
The resulting spectrum resolution is calculated as 0.604/OPD [
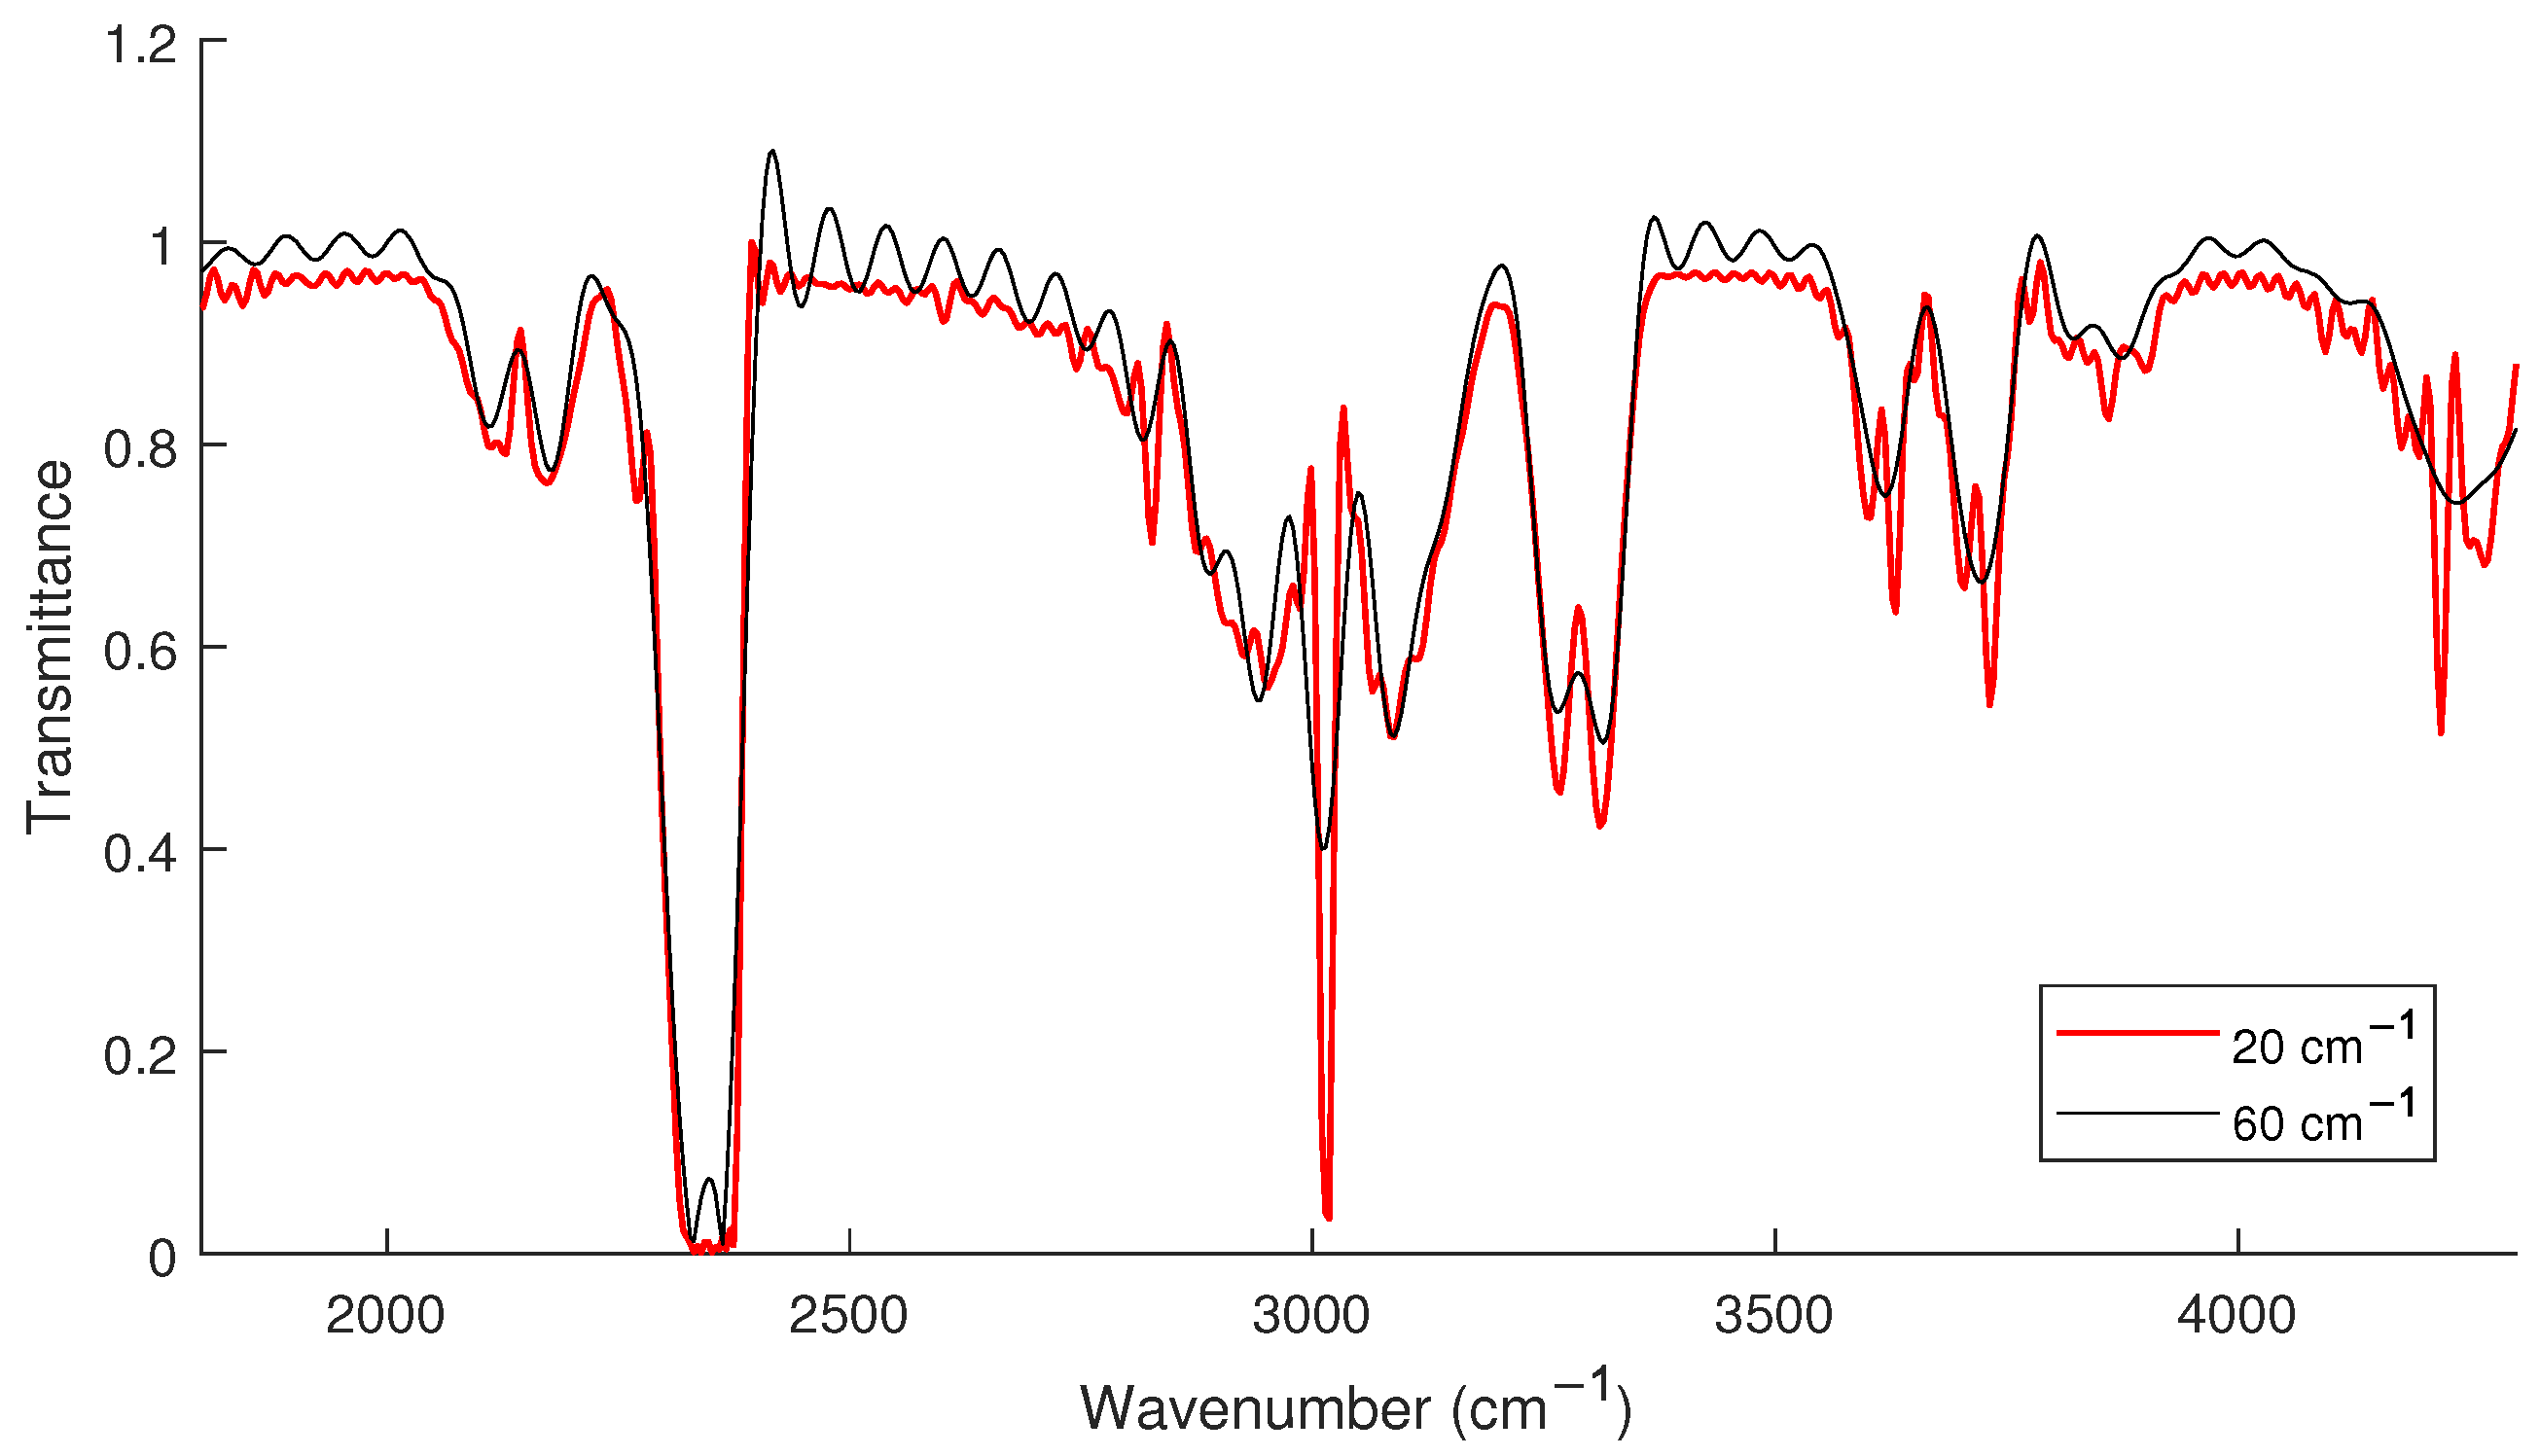
1]. For synthesizing the two sets of data (low- and high-resolution) used in our work, the corresponding interferograms were generated and truncated to maximum OPDs of 0.01 and 0.03 m, respectively. Applying FFT to the interferograms resulted in spectra of resolutions 60 and 20
. Next, different values of signal-to-noise ratios (SNRs) were considered in the data. The effect of the SNR was included by adding additive white Gaussian noise (AWGN) to the interferograms. The SNR is defined as [
38]
where
is the rms value of the added AWGN.
Figure 2 shows an example of the low- and high-resolution data.
In order to avoid possible sources of overfitting of the neural network, different random number generating methods were used in generating the noise. Additionally, to induce variability in the training dataset, additional sets were added to the low-resolution (input) training data with different OPDs.
2.2. The Proposed Convolutional Neural Network
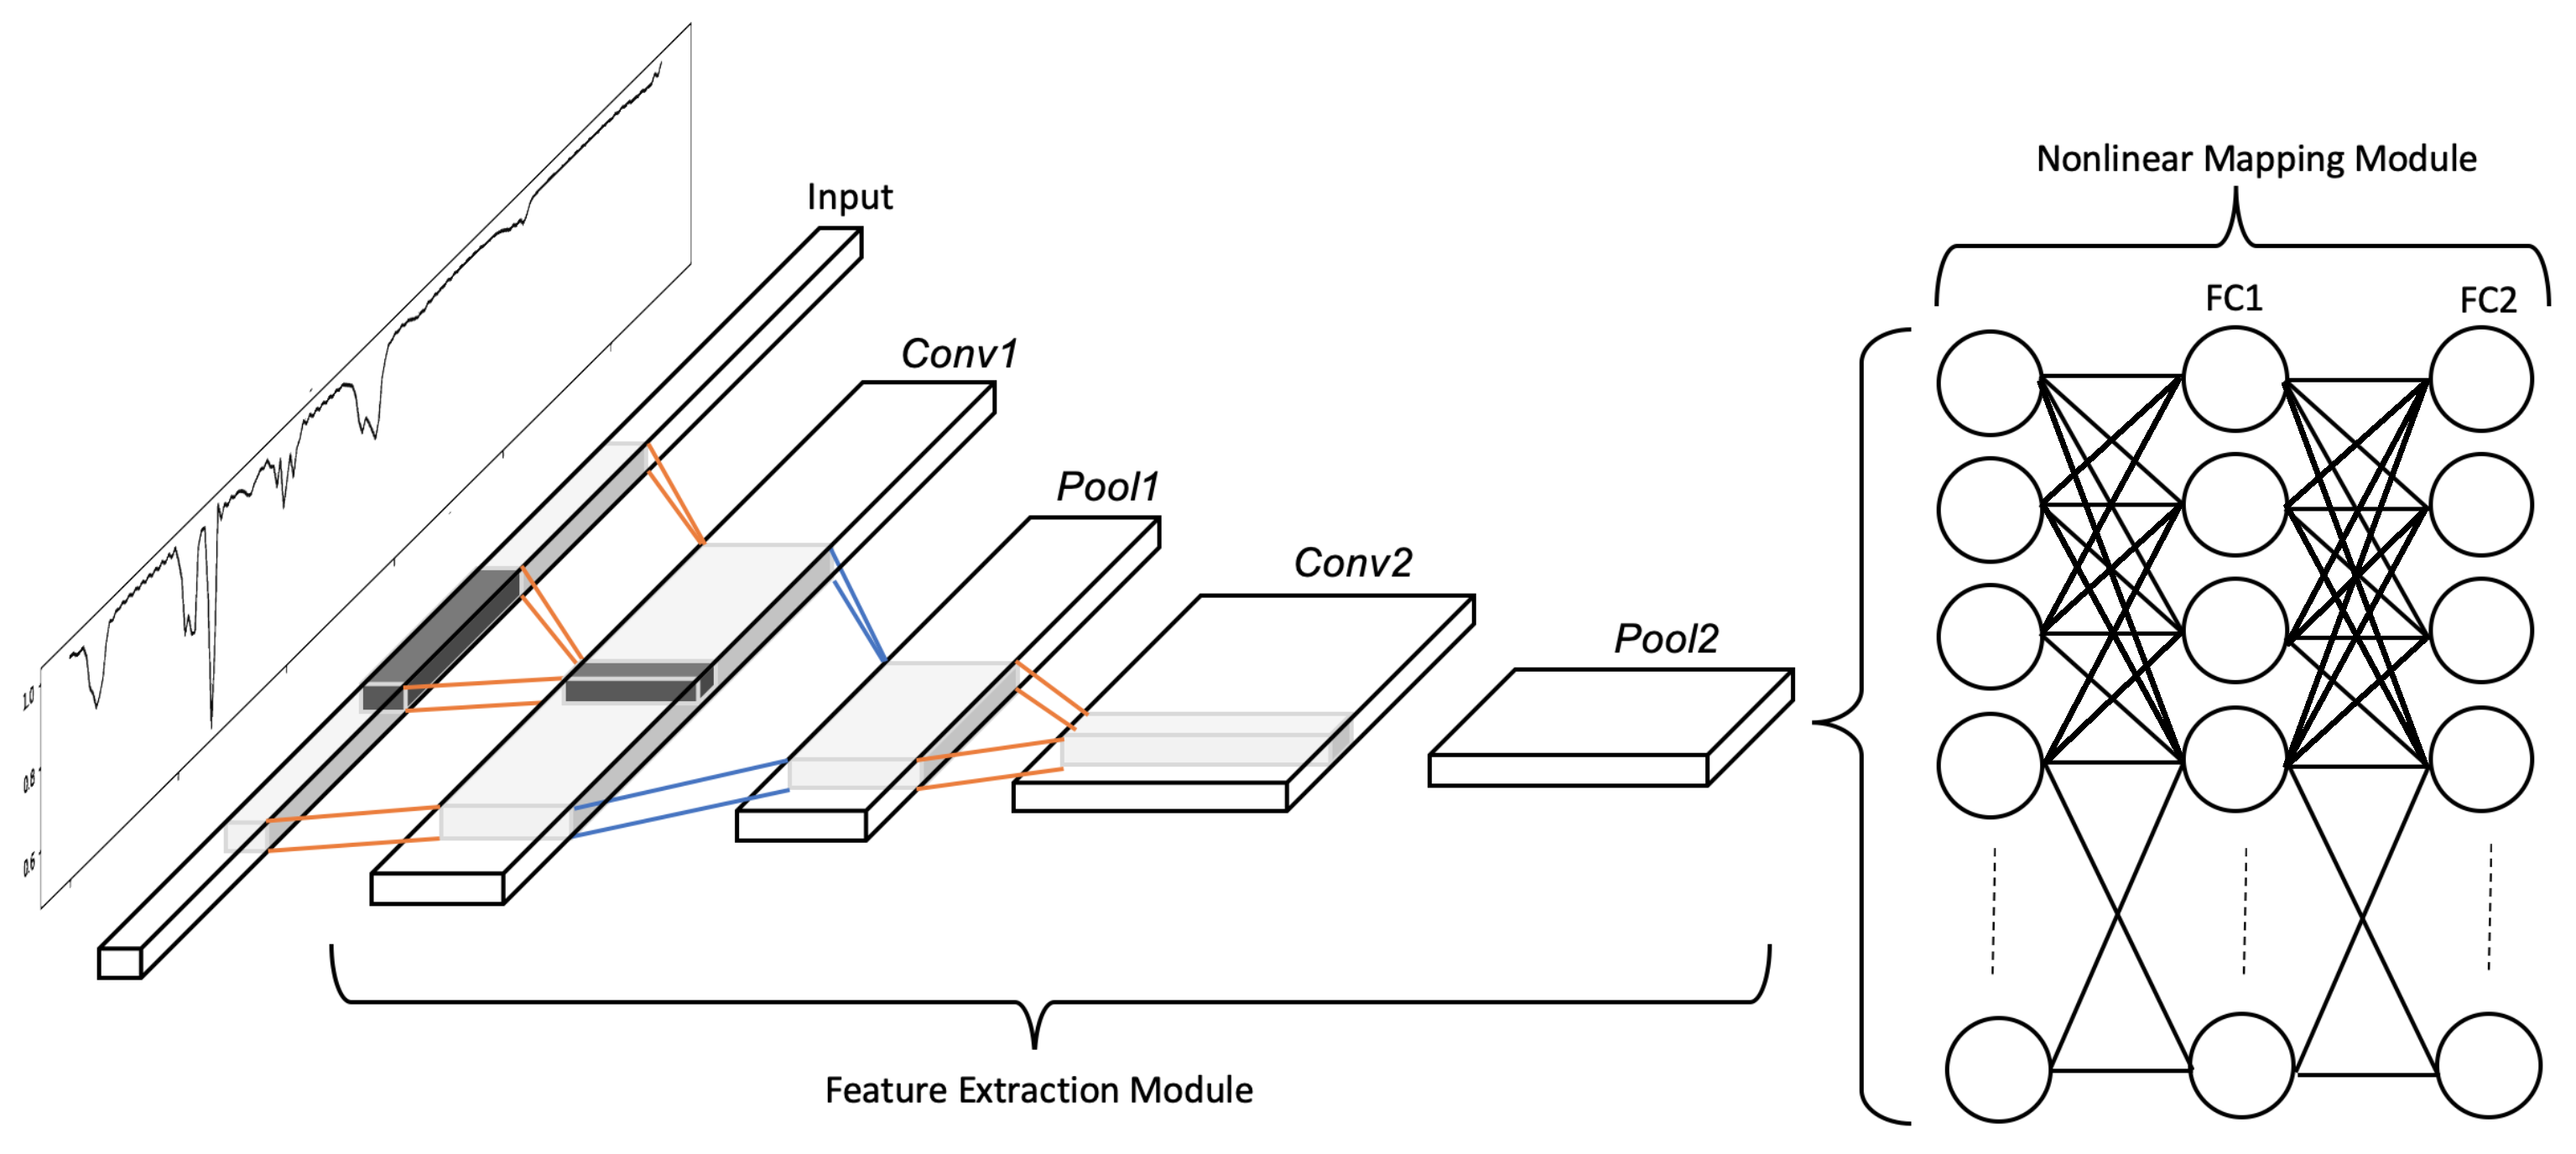
In this section, we propose a CNN for the FTIR resolution enhancement problem. The CNN structure is shown in
Figure 3. It consists of four layers: two convolutional and two fully-connected layers. The given dataset contains low-resolution spectrums and their associated high-resolution versions, denoted by
and
, respectively. The network is trained to learn a function
F that maps between the low- and high-resolution spectra, such that the discrepancy between
and
is minimized. In the following, we describe the network architecture and the training process.
2.3. Network Architecture
The proposed network includes two convolutional layers that extract a set of high-dimensional features from the input spectra. These extracted features are fed into two fully connected layers that serve as a nonlinear mapping that constructs a high-resolution output spectrum through the training process. The number of input and output neurons are equal to the number of samples in the input and output spectra, respectively.
2.3.1. Feature Extraction Layers
The feature extraction is achieved using two convolutional layers, each of which is followed by a pooling layer. At each convolutional layer, the input is convolved by
trainable kernels in order to extract
feature maps at the layer output
. The superscript in the following refers to the layer number where
. The kernel size at the
layer is
. The
feature map can be expressed as
where ∗ is the 1D-convolution operator,
a point-wise activation function, and
the kernel trainable weights with
. The function of the pooling layer, applied to the output of each convolutional layer, is twofold. First, it is used to reduce the dimension of the extracted features, and accordingly, the computational complexity. Second, it quickly expands the kernel reach when we go deep in the network. Accordingly, the first layer,
conv1, learns an arbitrary set of local features of the low-resolution spectra. However, the second layer
conv2 involves more samples from the input spectrums and becomes able to extract global features. The kernel reach of the two layers is highlighted in
Figure 3 with dark and light gray boxes, respectively.
2.3.2. Nonlinear Mapping Layers
The final nonlinear mapping is achieved using two fully-connected layers,
FC1 and
FC2, to map the extracted features into a high-resolution spectrum. The output of each layer is given by
where the operator ∘ is the matrix multiplication, and
contains the trainable weights of the
layer. The non-linearity is introduced by the nonlinear activation function
used at each layer. The activation function used in all layers in this work is the Rectified Linear Unit (ReLU).
2.3.3. Loss Function
The network is trained to estimate the trainable weights that minimize a pre-defined loss function. We define the loss function as the mean square error (MSE) between the predicted spectrum
and the ground-truth spectrum
:
where the subscript
i refers to the
example in the training dataset, and
N is the total number of spectrums in the dataset. Moreover,
is a set of all trainable weights in the network that should be optimally chosen to minimize the loss function. In our experiments, we use the Adam algorithm to solve the minimization problem.
3. Synthetic and Experimental Results and Discussion
Without loss of generality, we execute experiments to scale up the resolution of the gas spectra from
to
. The range of wavelengths of our interest (relevant to the miniaturized FTIR spectrometers [
39]) falls between 2000 and 4000
. This range of wavenumbers was chosen based on the supported range of the miniature MEMS FTIR device and based on the application under study related to the group of gases of interest for natural gas, biogas analysis and environmental monitoring. Infrared gas analysis with smaller wavenumbers can be needed in other applications such as industrial process control and medical diagnostics [
40].
The training input and output spectra are accordingly limited to this range. A fixed number of samples is selected for both input and output spectra. Each spectrum is represented in exactly 520 discrete points (samples). One example is shown in
Figure 2. The training and validation datasets have 70,000 and 8000 synthetic spectrums, respectively, generated as described in
Section 2.1, at the two defined resolutions. The SNR used in the datasets ranges from 20 to 40 dB. Feature normalization is the only pre-processing step executed before training the network. The CNN hyper-parameters are set to the values shown in
Table 1. We use 1D average pooling in
Pool1 and
Pool2 layers, which averages out each patch of two and four elements, respectively. The network is trained for 100 epochs using the Adam algorithm with a learning rate of
and a weight decay of
. The trained network is examined with both a synthetic dataset and real spectra measured using both a bench-top device and MEMS FTIR spectrometers.
3.1. Synthetic Data
We first tested the trained data with a synthetic dataset of another 8000 synthesized spectrums. The test loss, calculated as in (
7), was
.
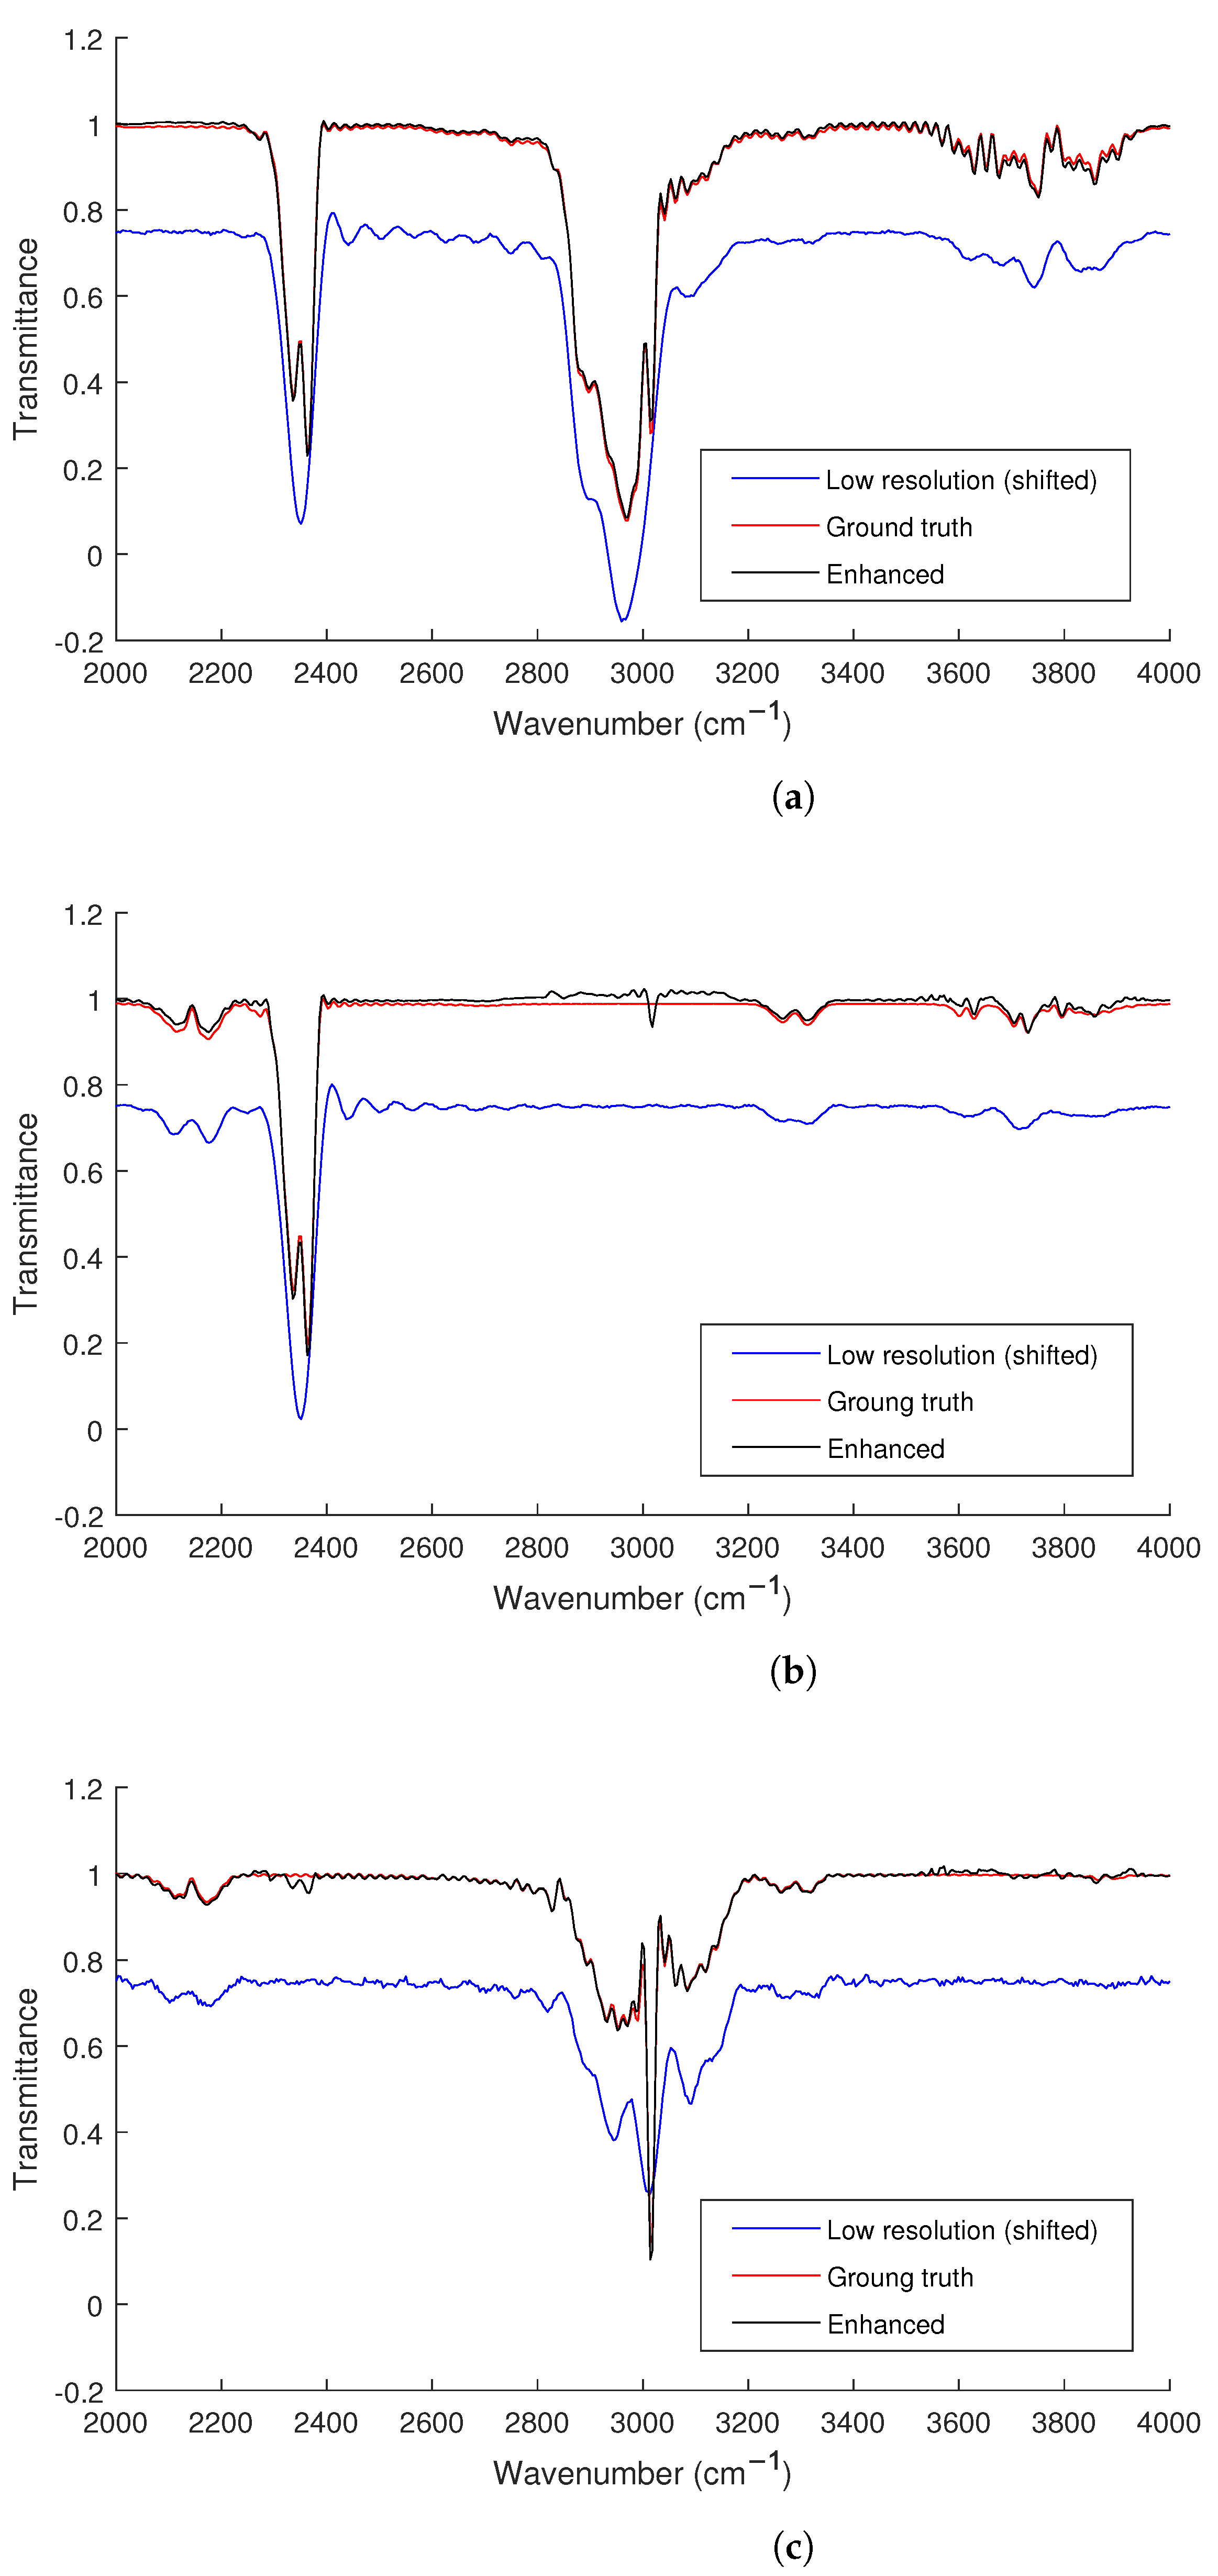
Figure 4 shows the output of the trained CNN for two different examples of the test data. The network was able to construct the high-resolution spectrum with an average MSE identical to the test loss. The low-resolution (input) spectra in the figures was shifted by an amount of 0.25 for the sake of clarity. As can be seen from the figures, overall, the trained network performs well in resolving the overlapped peaks from the low-resolution spectra. As shown in
Figure 4b,c, in some cases, (specially for lower SNR values), the noise in the low-resolution spectra are misidentified as peaks with small amplitude (e.g., the peak at ∼3000-
in
Figure 4b and the peak around ∼2350-
in
Figure 4c). The MSEs of these three examples were
, and
, respectively.
3.2. Experimental Measurements
The synthetic data show the theoretical gas spectra; however, the measured spectra are affected by many background distractors, such as light sources and the gases in the surrounding atmosphere resulting in distortions in the measured spectrum. Additionally, other artifacts and nonlinearities affect the measured spectra from different devices. This includes non-constant baselines. Theoretical transmission spectra have all the spectral peaks ’dropped’ from horizontal baselines while the baselines of the measured spectra are affected by the device and the orientation of the gas cell, which cause them to have tilted baselines (see [
41] and the figures therein). Additionally, non-uniform SNR commonly occur in miniaturized MEMS spectrometers, where the noise affects some wavelengths more than others. Also, the shape of the apodization function is another source of artifacts in the measured spectra. In this subsection, we discuss the performance of the trained network with real measurements. For the experiment, we measured the spectrum of a cell that contains a mixture of CO
(
), CO (
), CH
(1.2%) and H
S (
) using both the bench-top device and a mid-infrared MEMS FTIR spectrometer at a resolution of 60
. The details of the measurement was as follows. A 10-cm length free-space gas cell filled with the gas mixture and sealed was specially ordered (from Wavelength References). The pressure inside the cell is the atmospheric pressure. The cell has wedged MgF
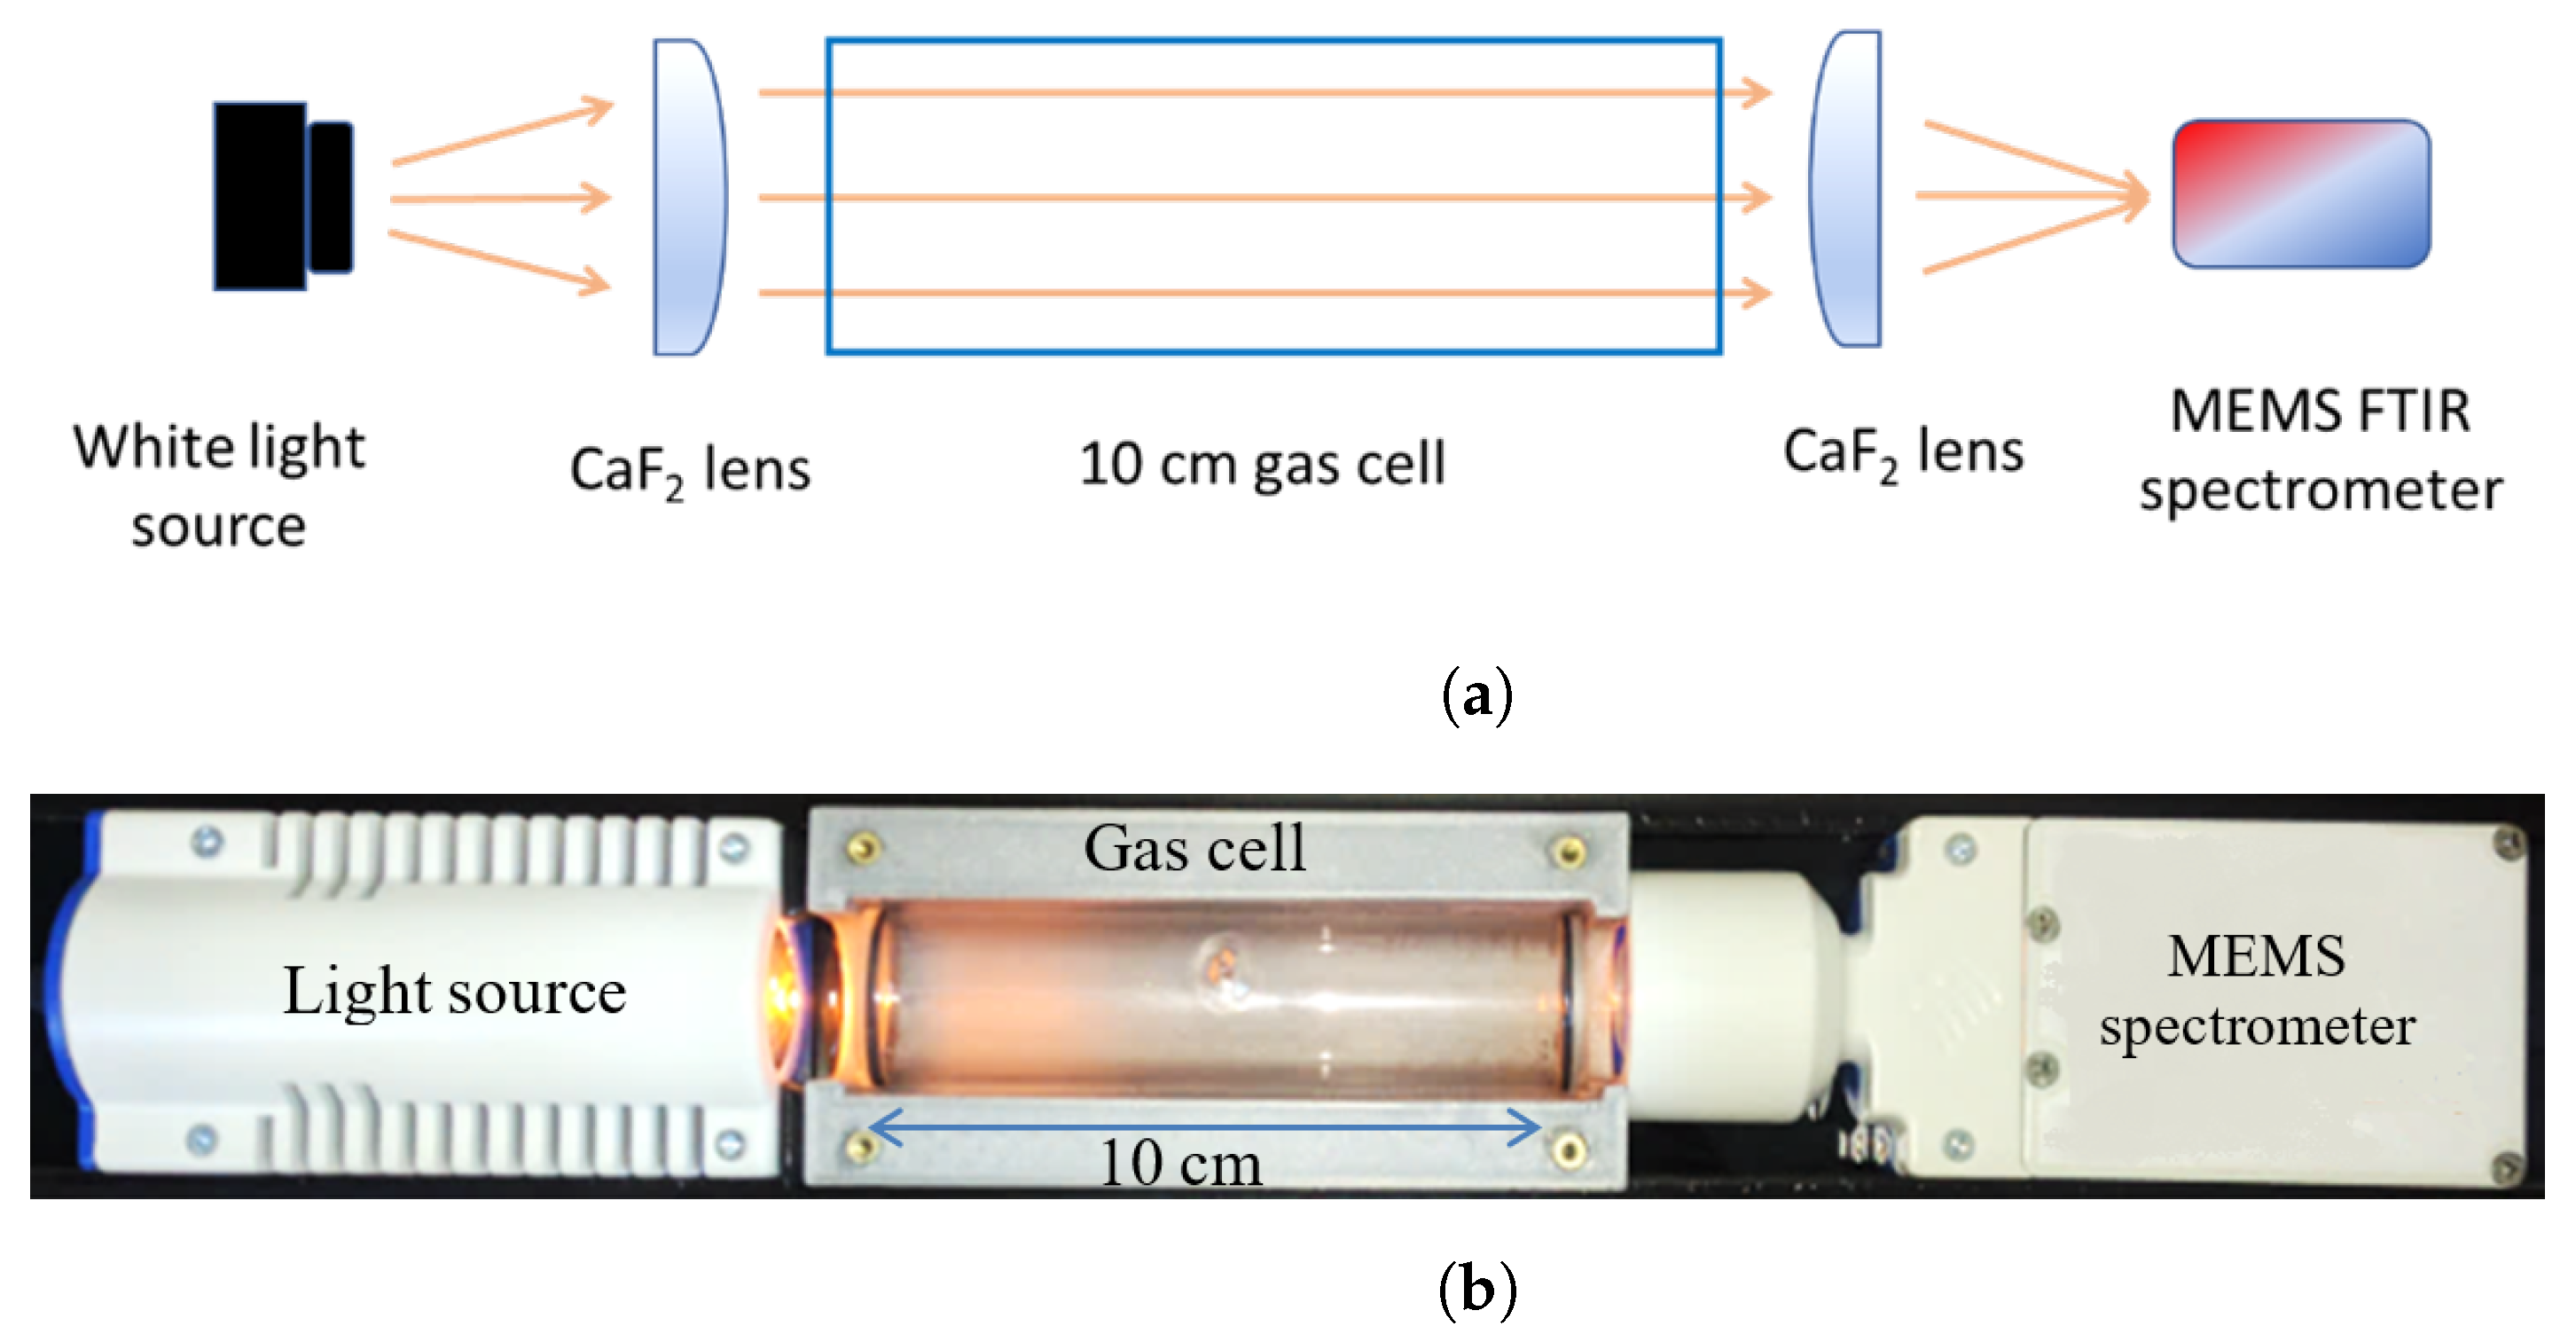
windows transparent in the wavelength range of interest. The diameter of the cell is about 25 mm. The cell was measured using the setup shown in the schematic in
Figure 5a, while a photo for the real setup is shown in
Figure 5b with the light source switched on. An infrared light source (Thorlabs, HEP3965) was used. The light is collimated and focused using CaF
lenses (Thorlabs) by placing them at a distance equal to their focal length away from the source and spectrometer input. A measurement background is taken while the two lenses are in close proximity. Then the gas cell is inserted and measured referenced to the background.
Next, the measured spectra went through two pre-processing steps. First, we followed the algorithm of [
41] in order to correct the baseline of the measured spectrum. The second pre-processing step is re-sampling. Commonly, down-sampling process has to be executed as the measured spectrum is usually represented in more than 520 samples (the number of inputs to the CNN).
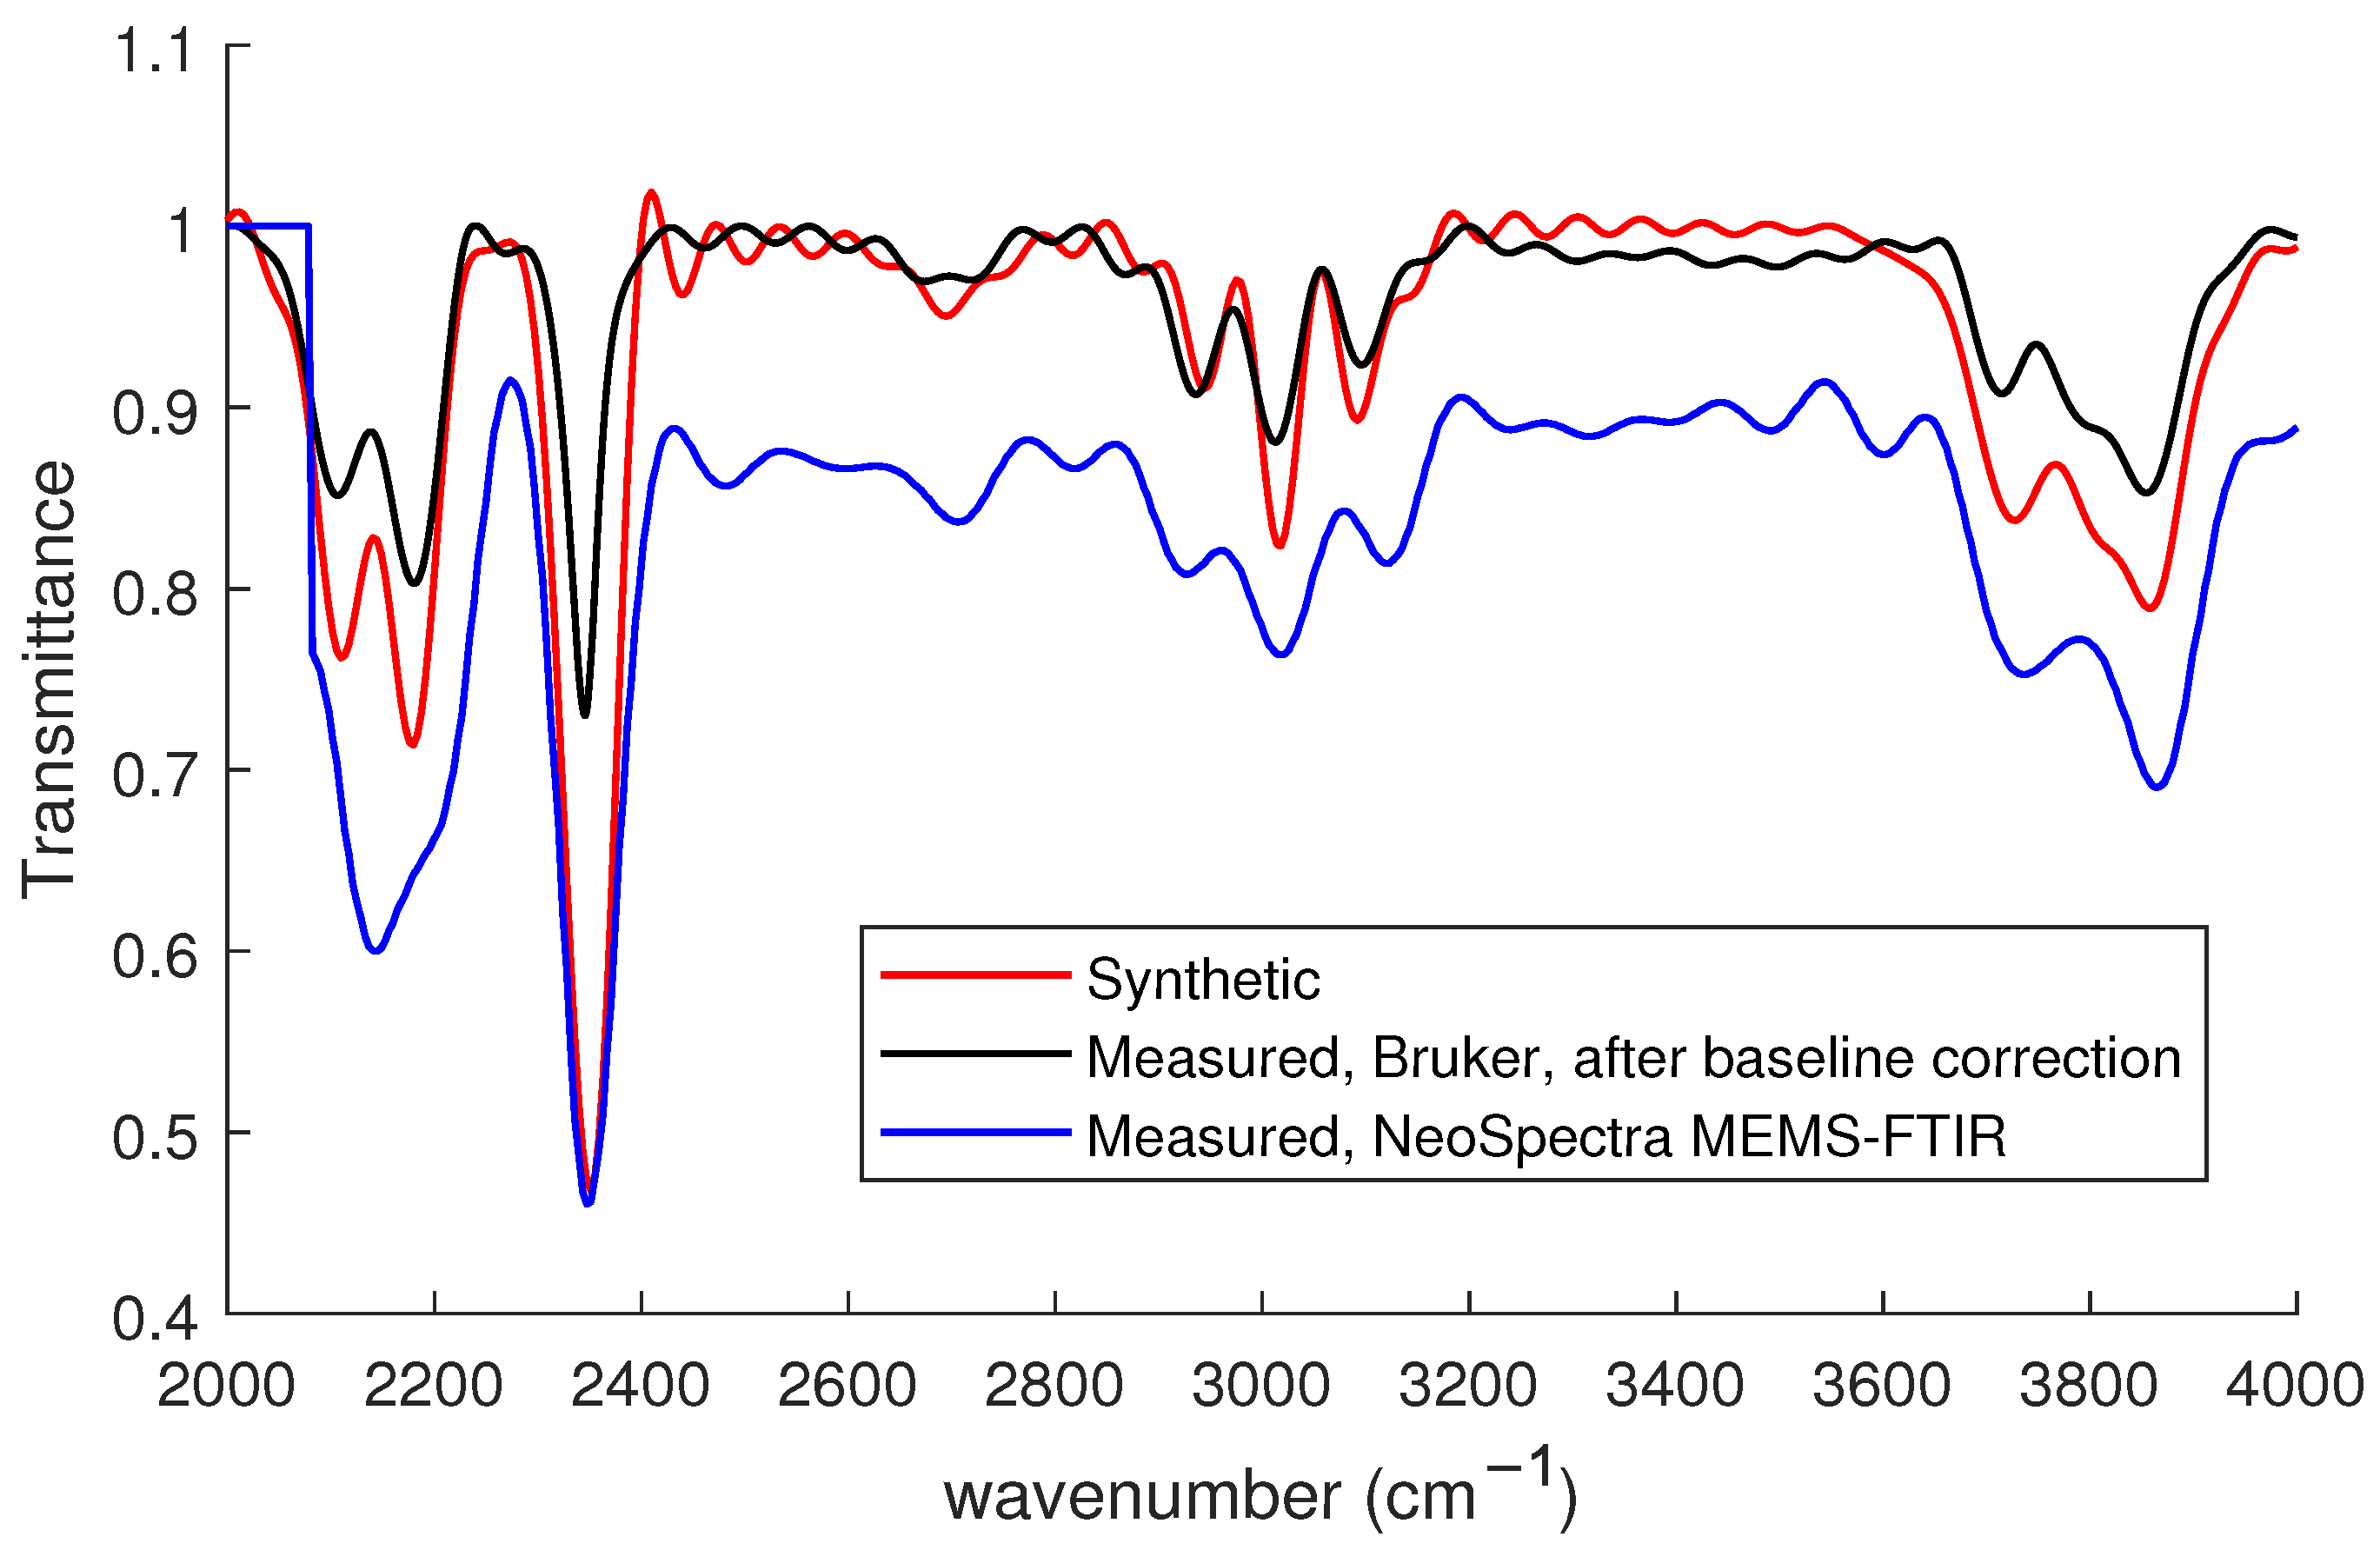
Figure 6 depicts both the synthetic low-resolution and measured spectrums of the same cell using both bench-top device and MEMS FTIR spectrometers. The bench-top device measured spectrum is shown after baseline removal, as mentioned above. As the figure shows, even after baseline removal, there is still some discrepancy between the theoretical and measured spectra; this is expected to affect the performance of the trained network in resolving real measurements. Moreover, the spectrum measured using the MEMS FTIR spectrometer shows further differences compared to the other two spectra, as it is affected by the other factors mentioned above.
3.2.1. Enhancing Bench-Top Spectrometer Measured Spectrum
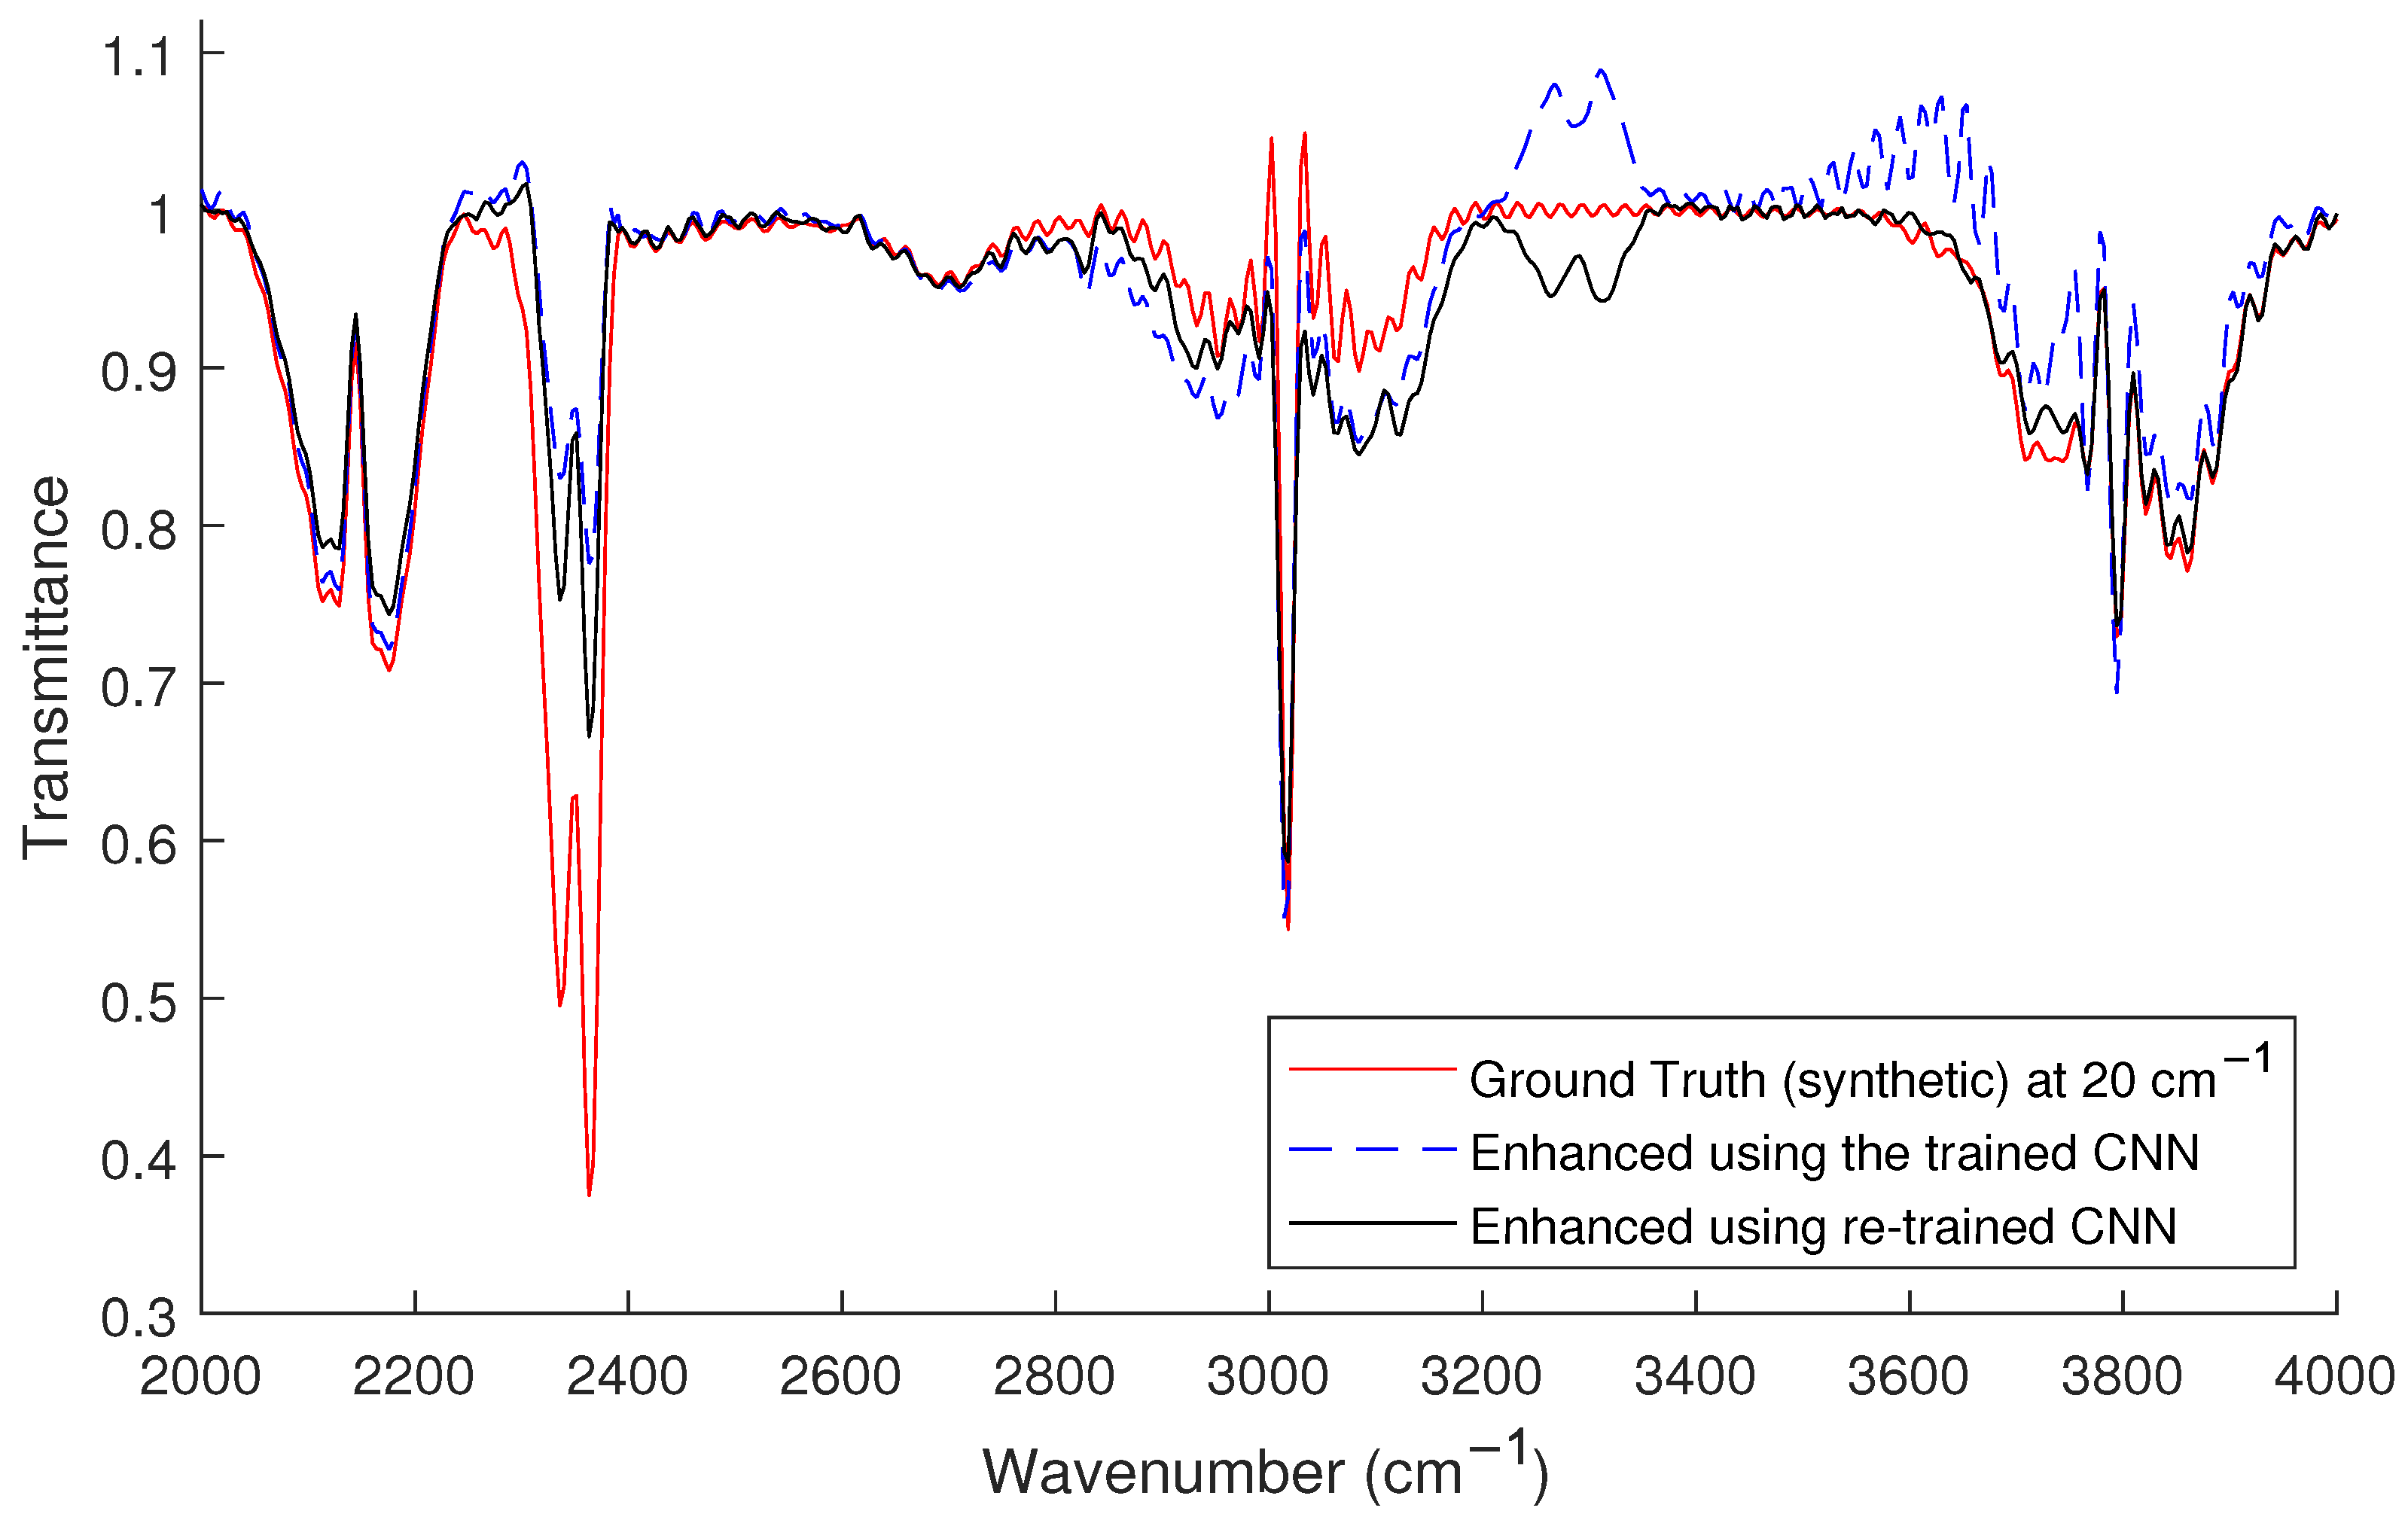
The predicted high-resolution spectrum from the bench-top device measurement using the trained CNN is illustrated in
Figure 7 (in blue-dashed line). The figure also shows the low-resolution measured spectrum. And for comparison, two high-resolution versions of the same spectrum are shown; a synthetic (theoretical ground truth) version that was constructed given the contents of the gas cell, and an experimental high-resolution version that was measured using the bench-top spectrometer.
We note here that there is amplitude discrepancy between the synthetic spectrum and the high-resolution measured spectrum (as well as the enhanced spectrum). This is mainly due to distortions in the measurement process. The major difference in peak amplitude is encountered around 2400 and 3700 , the location of Carbon dioxide peaks. This indicates that the measuring process was affected by some factors such as the CO in the atmosphere or the measuring setup itself. A CNN model that is trained over synthetic data would not be able to mitigate this effect.
The original CNN model recognized all the peaks of the spectrum and enhanced the resolution of the given low-resolution spectrum. The main discrepancy between the two spectra is the existence of a ’flipped’ peak around 3300
in the predicted spectrum. This is mainly due to the difference between the measured and synthetic spectra as shown in
Figure 6, which is mainly a baseline error that was not totally corrected in the pre-processing of the measured spectrum. This problem was mitigated by re-training the network with an extra set of synthetic data in which artificial baselines were induced. The new spectrum enhanced using the re-trained CNN is shown in the same figure in black solid line. In comparison to the synthetic spectrum, using the re-trained CNN has reduced the MSE of the enhanced spectrum from 4.2
, to 3.5
. The MSE between the enhanced spectrum and the high-resolution measurement is approximately 2.75
. The amplitude discrepancy between the predicted and measured high-resolution spectrum is lower than that between the predicted and the synthetic, therefore the error is lower. However, because the measured spectrum has to go through a baseline correction process, as explained above, and the baseline correction algorithm is not unique, a baseline error can be seen in the measured spectrum between wavenumber values of 3200 and 3600
, which would contribute to increasing the overall error between the measured and predicted spectra.
Moreover, in
Figure 7, regardless of the overestimation of some peaks, all the peaks between 3600 and 4000
that are due to the overlapped spectra of CO
and H
S were resolved, even though not all of them appeared in the low-resolution measured spectrum. This comes as no surprise as the trained network relies on the global features of the spectra and was able to recognize the existence of both gases. This represents one example in which the influence of global features is desirable.
3.2.2. Enhancing MEMS FTIR Spectrometer Measured Spectrum
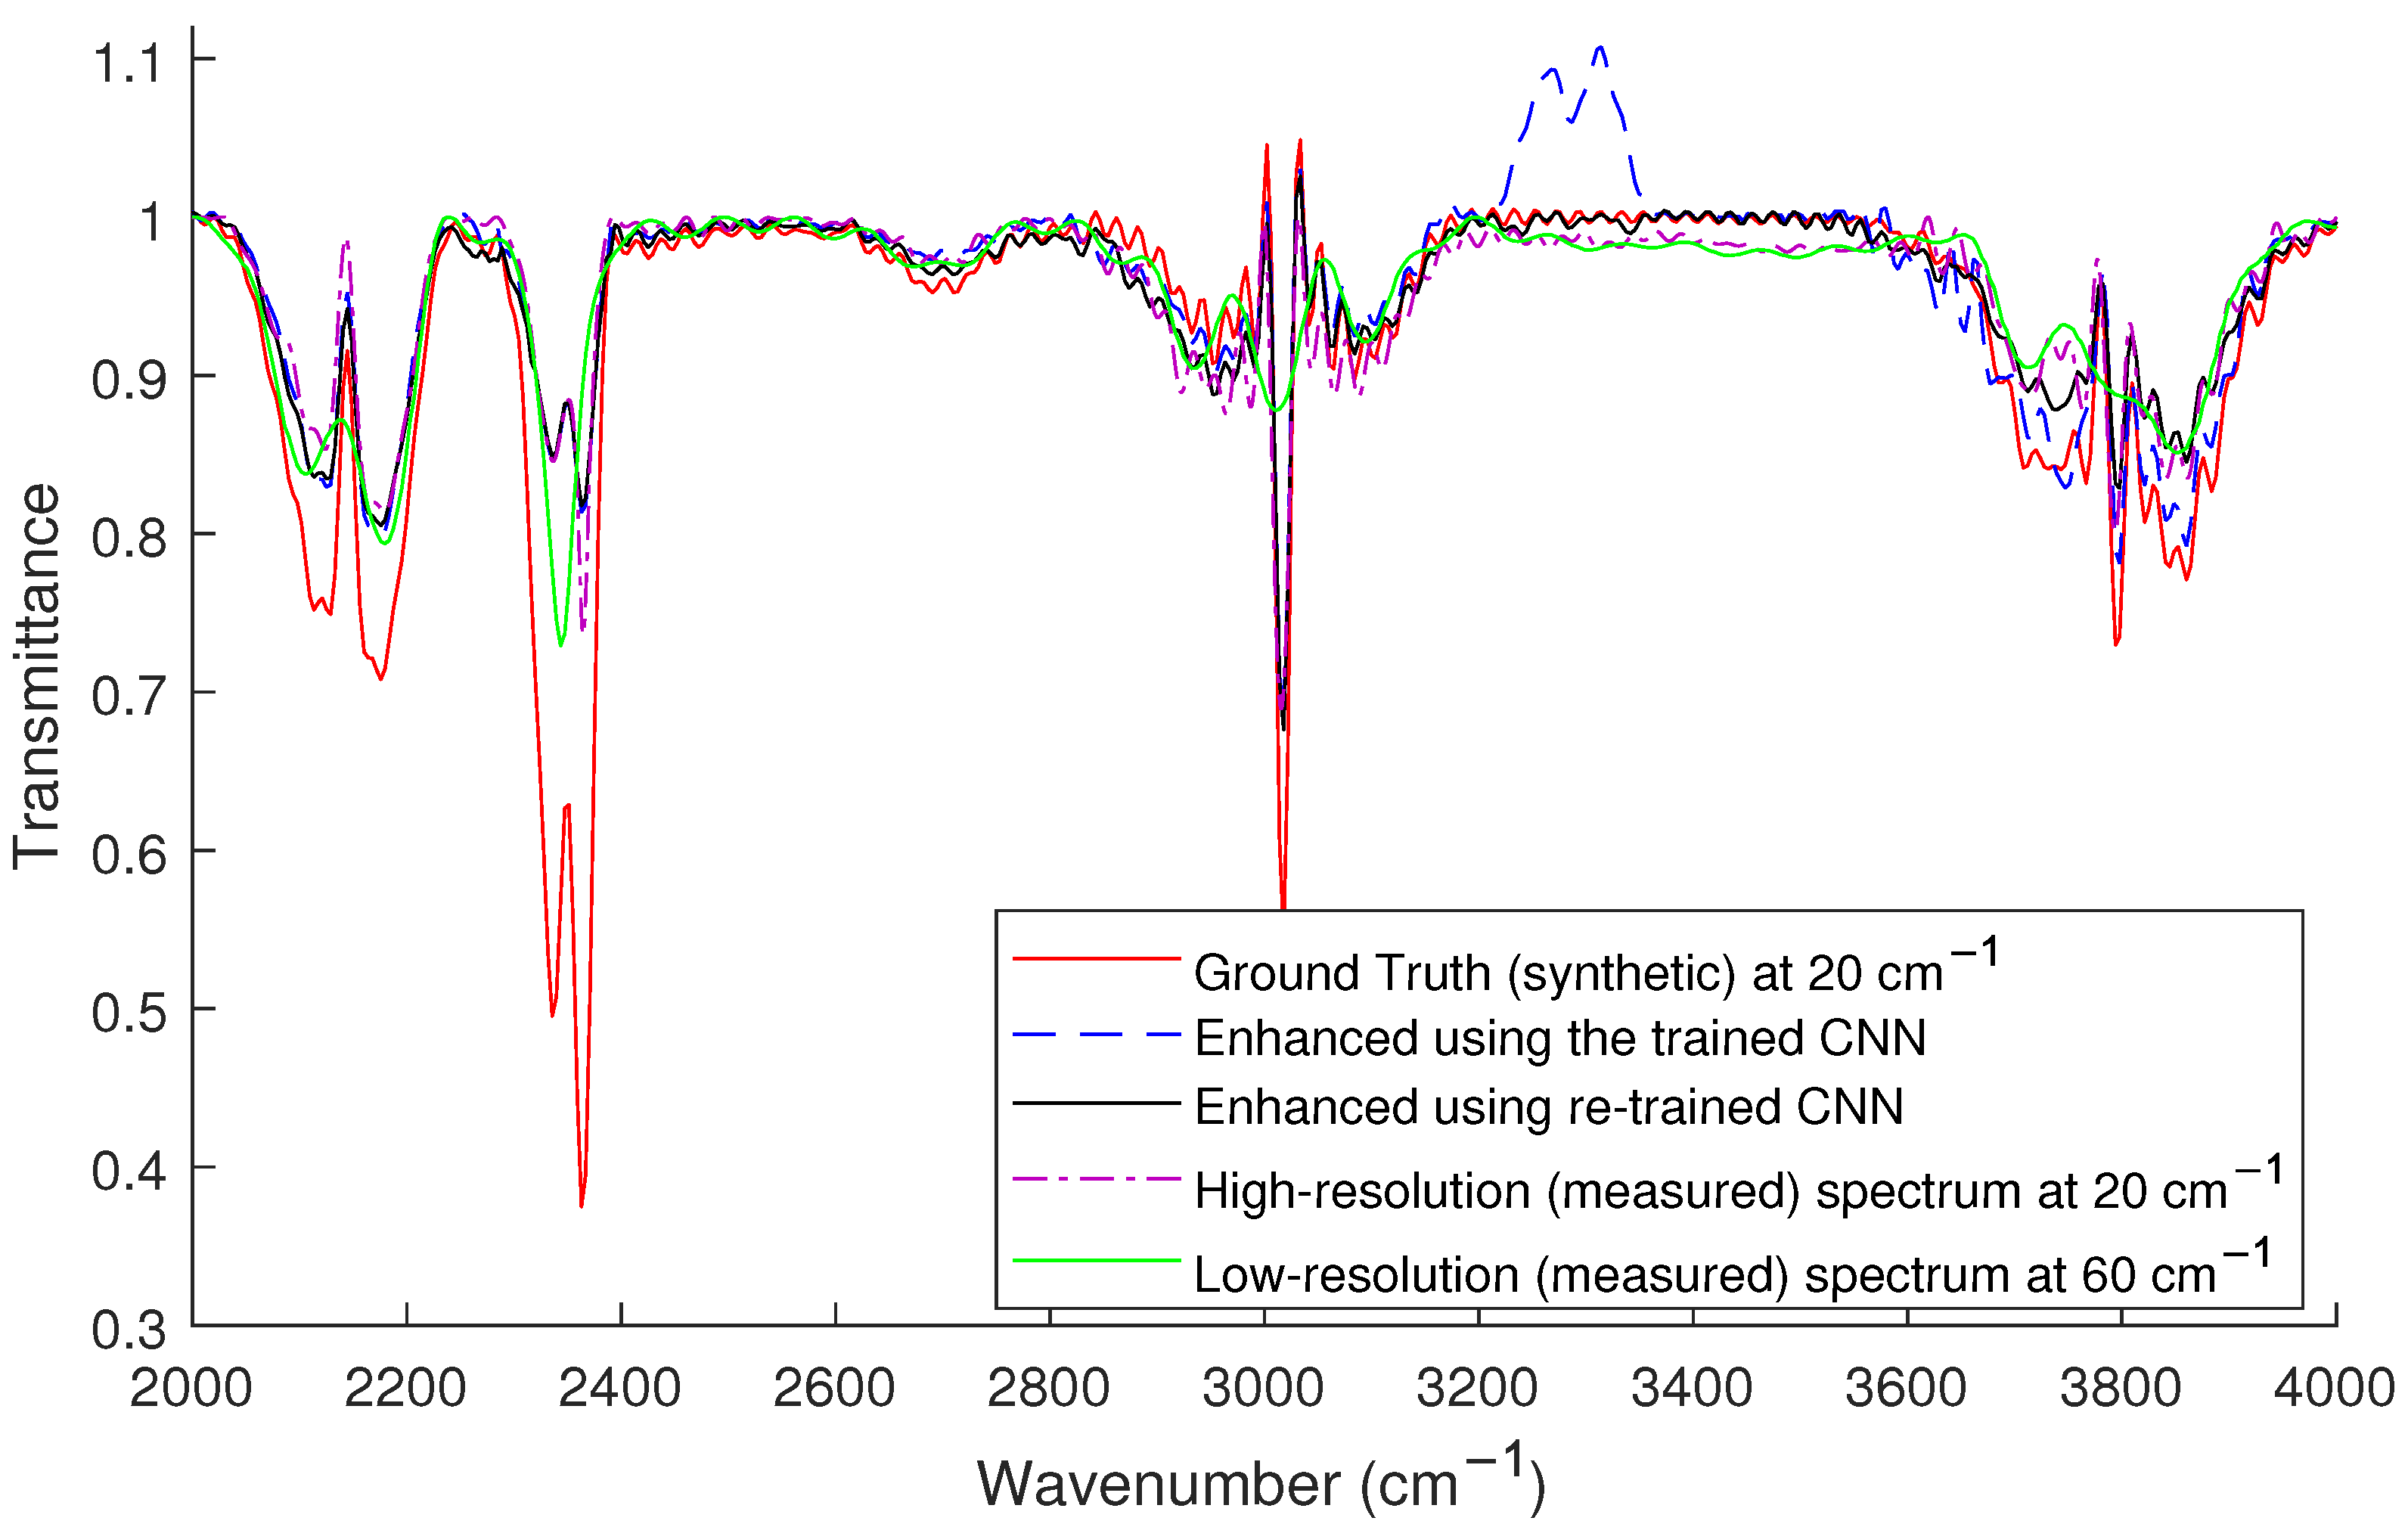
The predicted high-resolution spectrum from the MEMS FTIR measurement using the originally trained CNN is illustrated in
Figure 8 (in blue dashed line) along with the ground-truth high-resolution spectrum.
Similar to the previously discussed case, the original CNN recognized all the peaks of the spectrum and enhanced the resolution of the given low-resolution spectrum. The main discrepancy between the two spectra was the existence of a ’flipped’ peak around 3300
in the predicted spectrum. Again, this is due to the difference between the measured and synthetic spectra as shown in
Figure 6. As discussed earlier, miniaturized MEMS FTIR spectrometers induce several effects on their measurements. Data that model these effects were added to the training process in different trials. The network performance showed improvement when re-trained with an extra set of synthetic data in which the effect of non-uniform SNR was modeled. The new enhanced spectrum is shown in the same figure in black solid line. The MSE of both enhanced spectra are 4.7
, and 2.4
, respectively. It is worth mentioning here that although the false peaks were not totally removed, the SNR in this case is better than the enhancement of the bench-top device’s measurement compared to the synthetic spectra as discussed above, because the other peaks of the spectrum better match the synthetic ground truth. The reason can be seen when comparing the low-resolution measurements shown in
Figure 6, where MEMS FTIR measurement (due to the non-linearities of the device) is closer in amplitude to the theoretical spectrum of the content of the cell.
Since a mean square error down to 2.4 in the transmission spectra was obtained, it is expected that the error in production will be in that order. The exact values depend on the specific gas mixture concentrations and has to be calculated for case by case. Since the transmission , one can deduce that the error in concentration is given by .


