
First Study on Ammonia Spray Characteristics with a Current GDI Engine Injector
by
 and
and
Ronan Pelé
1,*, 
Christine Mounaïm-Rousselle
1,*,
Pierre Bréquigny
1,
Camille Hespel
1 and
Jérôme Bellettre
2 1
Université d’Orléans, NSA-CVL, EA 4229—PRISME, 45072 Orléans, France
2
Laboratoire de Thermique et Energie de Nantes (LTeN UMR Université de Nantes—CNRS 6607), Rue Christian Pauc, CS 50609, CEDEX 3, 44306 Nantes, France
*
Authors to whom correspondence should be addressed.
Fuels 2021, 2(3), 253-271; https://0-doi-org.brum.beds.ac.uk/10.3390/fuels2030015
Submission received: 13 April 2021
/
Revised: 11 June 2021
/
Accepted: 21 June 2021
/
Published: 25 June 2021
(This article belongs to the Special Issue Advances in Propulsion and Energy Systems Utilising Alternative Fuels: Fuel Injection and Combustion Systems)
Abstract
:Using carbon free energy sources is one of the keys to mitigate climate change. Hydrogen promises to be one of these carbon free energies, but its storage is difficult and expensive. Ammonia, however, is interesting as it can store hydrogen safely and can be used in combustion engines instead of hydrocarbon fuels. In this experimental work, the spray characteristics of ammonia under different air densities and temperatures were investigated in constant volume and were compared to a biofuel, ethanol, and a common fuel, gasoline. The Schlieren technique was used to capture images of liquid and liquid + vapor spray. The penetration length, the angle near the injector and the angle at half-penetration length were measured. The results show that the spray geometry of ammonia differs from that of the other fuels and that its sensitivity to air density and temperature is greater. The flash boiling condition at ambient temperature was explored for ammonia and indicated a wider spray at half-penetration length at phase change. Moreover, a semi-empirical correlation for penetration length as a function of physical parameters was found with a high accuracy for the global spray. These experimental data provide the first information about ammonia injection with a current spark-ignition GDI injector.
1. Introduction
Climate change has been one of the greatest challenges in recent decades and is unfortunately still an ongoing concern. In 2015, 195 states adopted the Paris Agreement at the Conference of the Parties (COP21). This convention aims to limit global warming by “holding the increase in the global average temperature to well below 2 °C above pre-industrial levels and pursuing efforts to limit the temperature increase to 1.5 °C above pre-industrial levels” [1]. To achieve these goals, it is essential to use carbon free energy.
Hydrogen energy is an interesting solution as it is an attractive energy carrier [2]. However, hydrogen has certain hazardous properties such as an extremely low ignition energy and very wide flammability range [3], and its transportation presents various technical and economic issues [4].
Ammonia not only contains a large amount of hydrogen (17.8% by weight) but is also more easily storable than hydrogen because of its high vapor pressure. Liquid ammonia can be stored easily at approximately 9 bar at ambient temperature or −34 °C at ambient pressure. Due to these advantages, ammonia is one of the most promising hydrogen carriers [5]. This assignment would change a 100-year-old industry that, to date, has mainly focused on fertilizer production for agriculture [6].
Most studies have addressed the potential of ammonia as an ignition/combustion promoter in internal combustion engines, mainly blended with another fuel, as reviewed in Mounaïm-Rousselle and Brequigny [7] and Dimitriou and Javaid [4]. For instance, Lhuillier et al. [8] recently confirmed that ammonia is a suitable fuel for current spark ignition engines with no design modifications but filled with a gaseous ammonia/hydrogen/air mixture. As mentioned in [7], while injecting ammonia directly can be advantageous for efficiency due to a better filling, it affects the engine stability due to the decrease of in-cylinder temperature. However, so far, no study has been conducted on the liquid injection of ammonia. Okafor et al. [9] performed the first successful study on liquid ammonia spray combustion, but for a gas turbine application, not for an SI engine.
The injection process is a fundamental aspect of internal combustion engine optimization as it allows the control of the in-cylinder air-to-fuel ratio and therefore the reduction of pollutant emissions [10]. Direct fuel injection generally uses high-pressure injection systems [11] as increasing the injection pressure is a key to improving the atomization process, affecting combustion and soot emission. These atomized small droplets enhance the liquid-air interface, the vaporization and the fuel/air mixing [12,13]. The effects of injection pressure on droplet size reduction become limited or even disappear when the injection pressure reaches a threshold [11]. Another possibility to reduce droplet size is the flash boiling condition, which produces finer droplets and a more uniform fuel/air mixture [11]. Flash boiling is a thermodynamic state of fuel spray which occurs when a subcooled liquid is rapidly depressurized to a pressure below its liquid saturation pressure [14]. This state of the fuel is different from the collapse effect, which is the result of the plume-to-plume interaction that can sometimes appear in flash boiling conditions [15]. The formation of flash boiling comprises three stages: bubble nucleation, bubble growth, and the two-phase flow. Two flash boiling regimes can be identified: internal and external flashing. Internal flashing occurs when the bubbles grow inside the injector orifice and two-phase flow (vapor and liquid) is ejected at the exit of the orifice. External flashing occurs when the liquid jet is intact until the end of the orifice but is then rapidly vaporized outside the injector [16]. Flash boiling is influenced by several factors such as the fuel temperature [17], hole length and step hole diameter [18], hole number and shape of the injector orifice [19], making this phenomenon difficult to characterize.
This study aimed to compare liquid and vapor sprays of ammonia generated by means of a current gasoline direct injector, with those of 2 different fuels: gasoline, as the reference spark-ignition fuel, and ethanol as the main biofuel for spark-ignition engines. Spray geometrical characteristics such as penetration length and the spray angles (near the injector and at half spray penetration) were measured as a function of air density, temperature, and pressure at a constant injection pressure of 120 bar. Due to the higher saturation pressure of ammonia at ambient temperature compared to that of conventional fuels, flash boiling may occur. In addition to providing the first data on ammonia-generated sprays, this work also aims to provide the first information about flash boiling for ammonia at ambient temperature.
2. Materials and Methods
2.1. Experimental Setup
A constant volume 2.5 L chamber, shown in Figure 1, was used to follow the spray development. As described in [20], it can be pressurized to the desired pressure until 30 bar by an air compressor and warmed up to 200 °C by wall heating resistances. Between each spray, the chamber is purged with flush air that is evacuated to the outside. Figure 2 presents a scheme of the experimental setup. All the different fuels are pressurized up to 120 bar thanks to pressurized Helium. A current gasoline direct Bosch injector (7 holes of 365 µm diameter) is used to generate the spray. The temperature and injection duration are controlled by means of an automation system driven through a Labview program. The pressure and the temperature are measured by a pressure sensor from KELLER (PAA-33X model) and a T thermocouple, respectively.
2.2. Schlieren Setup
The Schlieren technique, based on the measurement of the deviation of the light source through the test section, was used to follow the liquid and vapor spray development. This high sensitivity to refractive index gradients makes it possible to identify the limit of the line of sight between the vaporized fuel and the ambient gases [21]. The sensitivity is a function of the light intensity and is adjustable by a diaphragm in front of the camera; a small diaphragm opening increases the sensitivity. Figure 2 presents a scheme of the optical setup: two concave mirrors (f = 863.6 mm, d = 108 mm) are mounted in front of the optical windows of the chamber at 57 cm (N°2, Figure 2) and 84 cm (N°5, Figure 2). A 538 nm light beam from a LED (HardSoft DLR IL104G) passes through the concave mirror, crosses the chamber and by means of another concave mirror passes through a diaphragm. Depending on the diaphragm diameter, 6 mm or 1.5 mm, only the liquid or the liquid + vapor phase can be observed, respectively. The images are recorded at 15,000 frames per second with a CMos high speed camera (PHOTRON FastCam SA5, Photron, High Wycombe, UK), associated to a 105 mm Nikkon camera lens, to reach an image resolution of 768 × 648 pixels2, with a spatial resolution of 0.160 mm/pixel.
For each operating condition, 100 images were recorded, and each experiment was repeated 20 times.
2.3. Image Post-Processing
Post-processing of 100 raw images (Figure 3a) was performed in several steps in the Matlab environment. The first six raw images were used to generate an average background. After subtraction of this average background and inversion, the image was binarized (Figure 3b) using the Otsu threshold [22] for the liquid phase and using an adapted threshold for the vapor phase. On the edge of the vapor spray, the greyscale level is smoother than the greyscale level of the liquid phase, making the Otsu threshold unsatisfactory. To simplify the calculation of spray penetration and the different angles, the binarized image was rotated as shown in Figure 3c. On the rotated image, spray penetration length (SP) and 2 spray angles were calculated (Figure 3d):
- -
- SP is the distance between the injector and the end of spray.
- -
- spray angle is the angle averaged on the first hundred pixels (or 16 mm).where yinj is the vertical position of the injector and Spray angle (i) is the angle for the vertical position i.
- -
- spray angle at ½ SP is the value of the angle from the injector outlet to the half spray penetration length.
2.4. Experimental Conditions
For all conditions of ambient pressure and temperature, i.e., air density, the injection pressure, Pfuel, was set at 120 bar and the injection temperature, Tfuel, was estimated at 20 °C with an injection timing of 3.9 ms. Table 1 summarizes the conditions studied for all fuels.
To highlight the flash boiling phenomenon in the case of ammonia, further conditions were added to the previous ones, as indicated in Table 2.
Figure 4 shows the experimental conditions and the vapor pressure curves related to gasoline, ethanol [23], and ammonia [24]. The vapor pressure curve for ammonia is clearly higher than the vapor pressure for gasoline and ethanol. The same experimental conditions for ammonia and the other fuels will generate different atomization processes. For gasoline and ethanol, the conditions are above the state change curve but are below for ammonia, and the complementary conditions for ammonia are in the liquid phase region to study the impact of phase change on the spray geometry.
3. Results and Discussion
In Figure 5, examples of the raw spray images are shown for the three fuels, 1 ms after the start of injection under the conditions given in Table 1, both for the liquid and the liquid + vapor set-up. The influence of the fuel on the spray geometry is clearly visible: the spray penetration is longer in the case of ammonia especially at low density due to the collapse of the jets but the difference in penetration between the fuels decreases as the density increases. For instance, at T = 20 °C and higher density the sprays are very similar in terms of spray shape, penetration and angle. The spray angle in general is lower with ammonia spray and appears to be more sensitive to the temperature than the gasoline or ethanol sprays. In the flash boiling condition, liquid spray is still visible, showing that the vaporization process is not instantaneous. The work by Montanaro et al. [10] with iso-octane showed that liquid spray is also visible in the flash boiling condition and that its distribution is uniform along the spray axis, while vapor is mostly found in the lower part of the spray plume. At low air density and T = 120 °C, ammonia vapor is mostly found at the end of the spray, confirming the findings of Montanaro et al.
3.1. Comparison of Gasoline, Ethanol, and Ammonia Sprays for Liquid and Liquid + Vapor Phase
3.1.1. Penetration Length
Figure 6 presents the evolution of the penetration length as a function of density and temperature conditions for the different fuels. In each figure, open and closed symbols have been added to identify the penetration length for liquid and liquid + vapor phases, respectively. At low air density, for both temperatures the penetration is faster for ammonia in comparison to gasoline and ethanol. The difference between liquid and liquid + vapor penetration lengths is greater for gasoline and ethanol than for ammonia. As can be seen in Figure 6b, the penetration velocity is reduced as a function of the increase in air density and no clear difference between the fuels or between the phases can be identified. As observed in Figure 5, at higher air density, the jet plumes disappear for gasoline and ethanol, and the sprays become more compact, limiting the vaporization process. Moreover, at this pressure (7 bar), ammonia is closer to its vapor saturation state (8.8 bar), which contributes to decreasing the vaporization process. At Tair = 120 °C, the difference between the fuels is pronounced: the ammonia spray reaches the chamber wall after 1.5 ms from the start of injection but after 3.5 ms and 3 ms in the case of gasoline and ethanol respectively. Moreover, the temperature increase accelerates the spray strongly in the case of ammonia for both air density conditions. At higher air density, the increase in temperature causes a difference in spray penetration between the liquid and the liquid + vapor state.
These observations show that all three fuels are air density sensitive but with a greater impact for ammonia. This sensitivity to air density is common for conventional fuels. Payri et al. [25] demonstrated the strong influence of air density on diesel penetration [13] and the same observations were made with gasoline [26] and isooctane [16]. Moreover, ammonia seems more sensitive to the change of temperature than gasoline and ethanol.
3.1.2. Evolution of Spray Angles
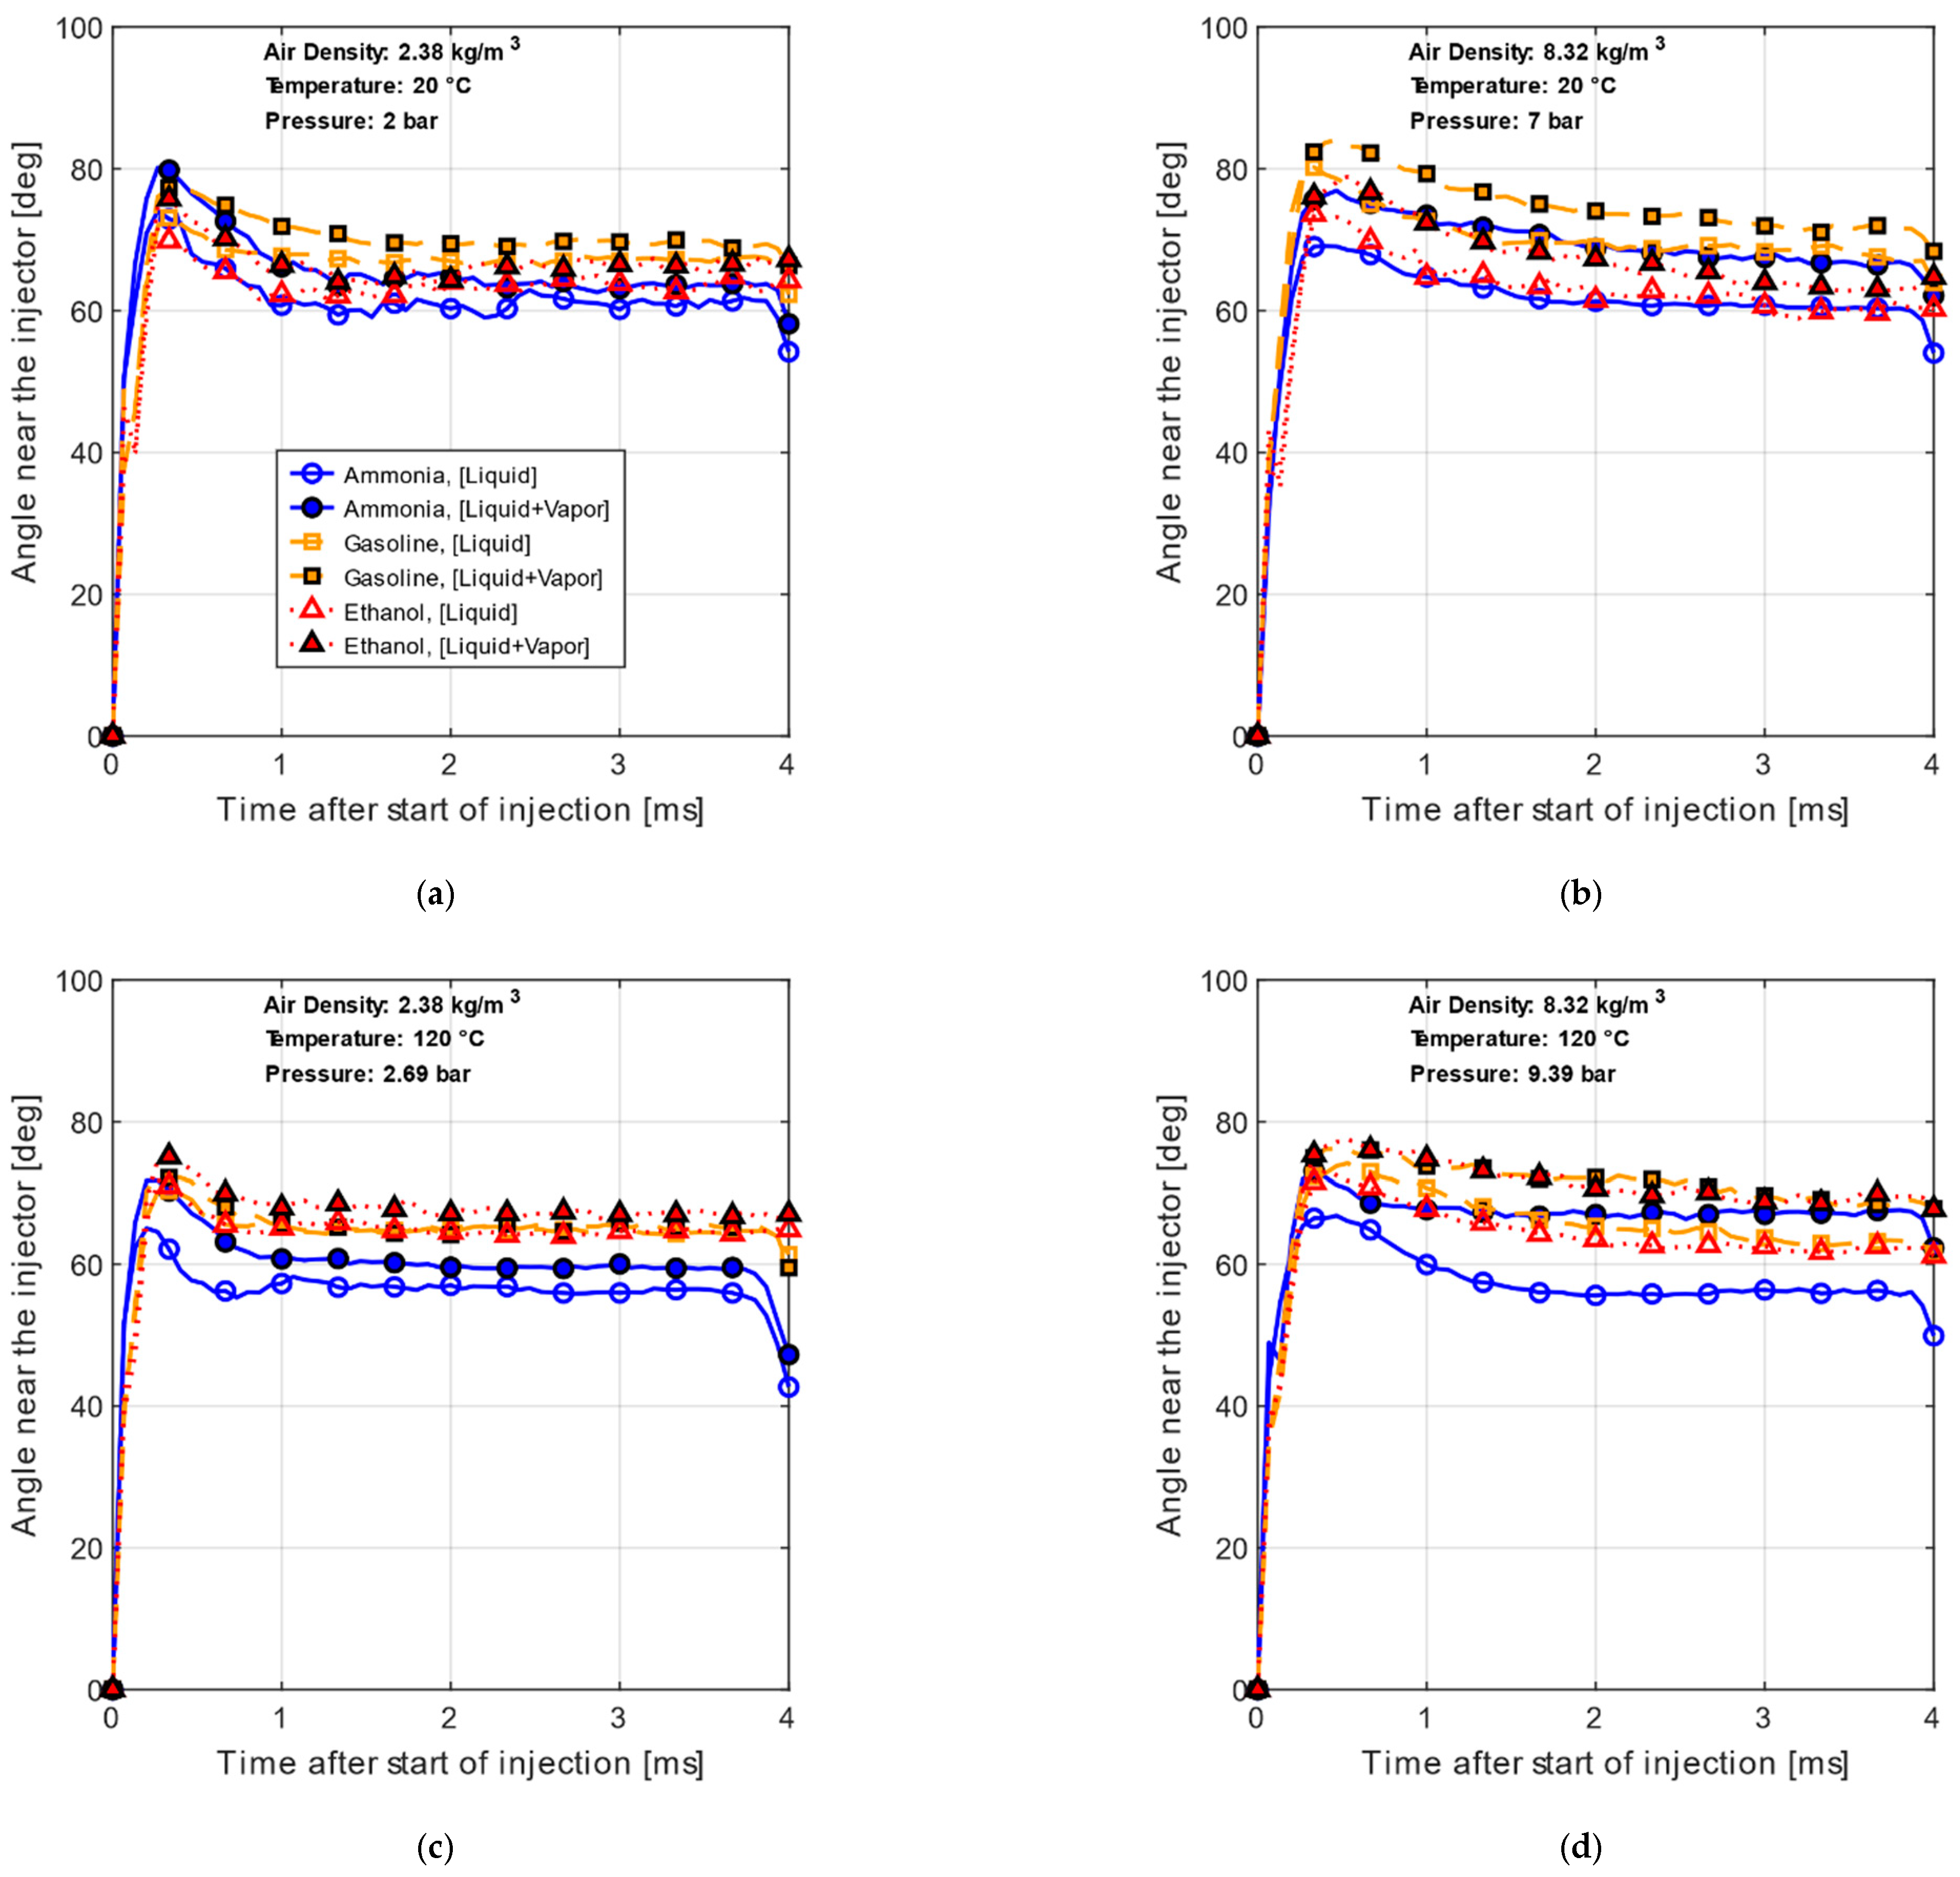
As presented in Figure 3d, two spray angles can be estimated from the images: the angle near the injector top and the angle at half-penetration length. In Figure 7, the evolution of the angle near the injector top is plotted for the same conditions as penetration length.
For all conditions, the spray angles of gasoline and ethanol are higher than that of ammonia fuel. The effect of density is less pronounced than the effect of the temperature for the liquid phase. At 3 ms, the liquid spray angle of ammonia is 60° and 55° for low and high density respectively but without any change as a function of ambient temperature. However, the difference between liquid and liquid + vapor phases is more marked for higher air density conditions and more so for ammonia than for gasoline and ethanol. The liquid spray angle does not appear to be sensitive to any change in air density, contrary to the liquid + vapor phase.
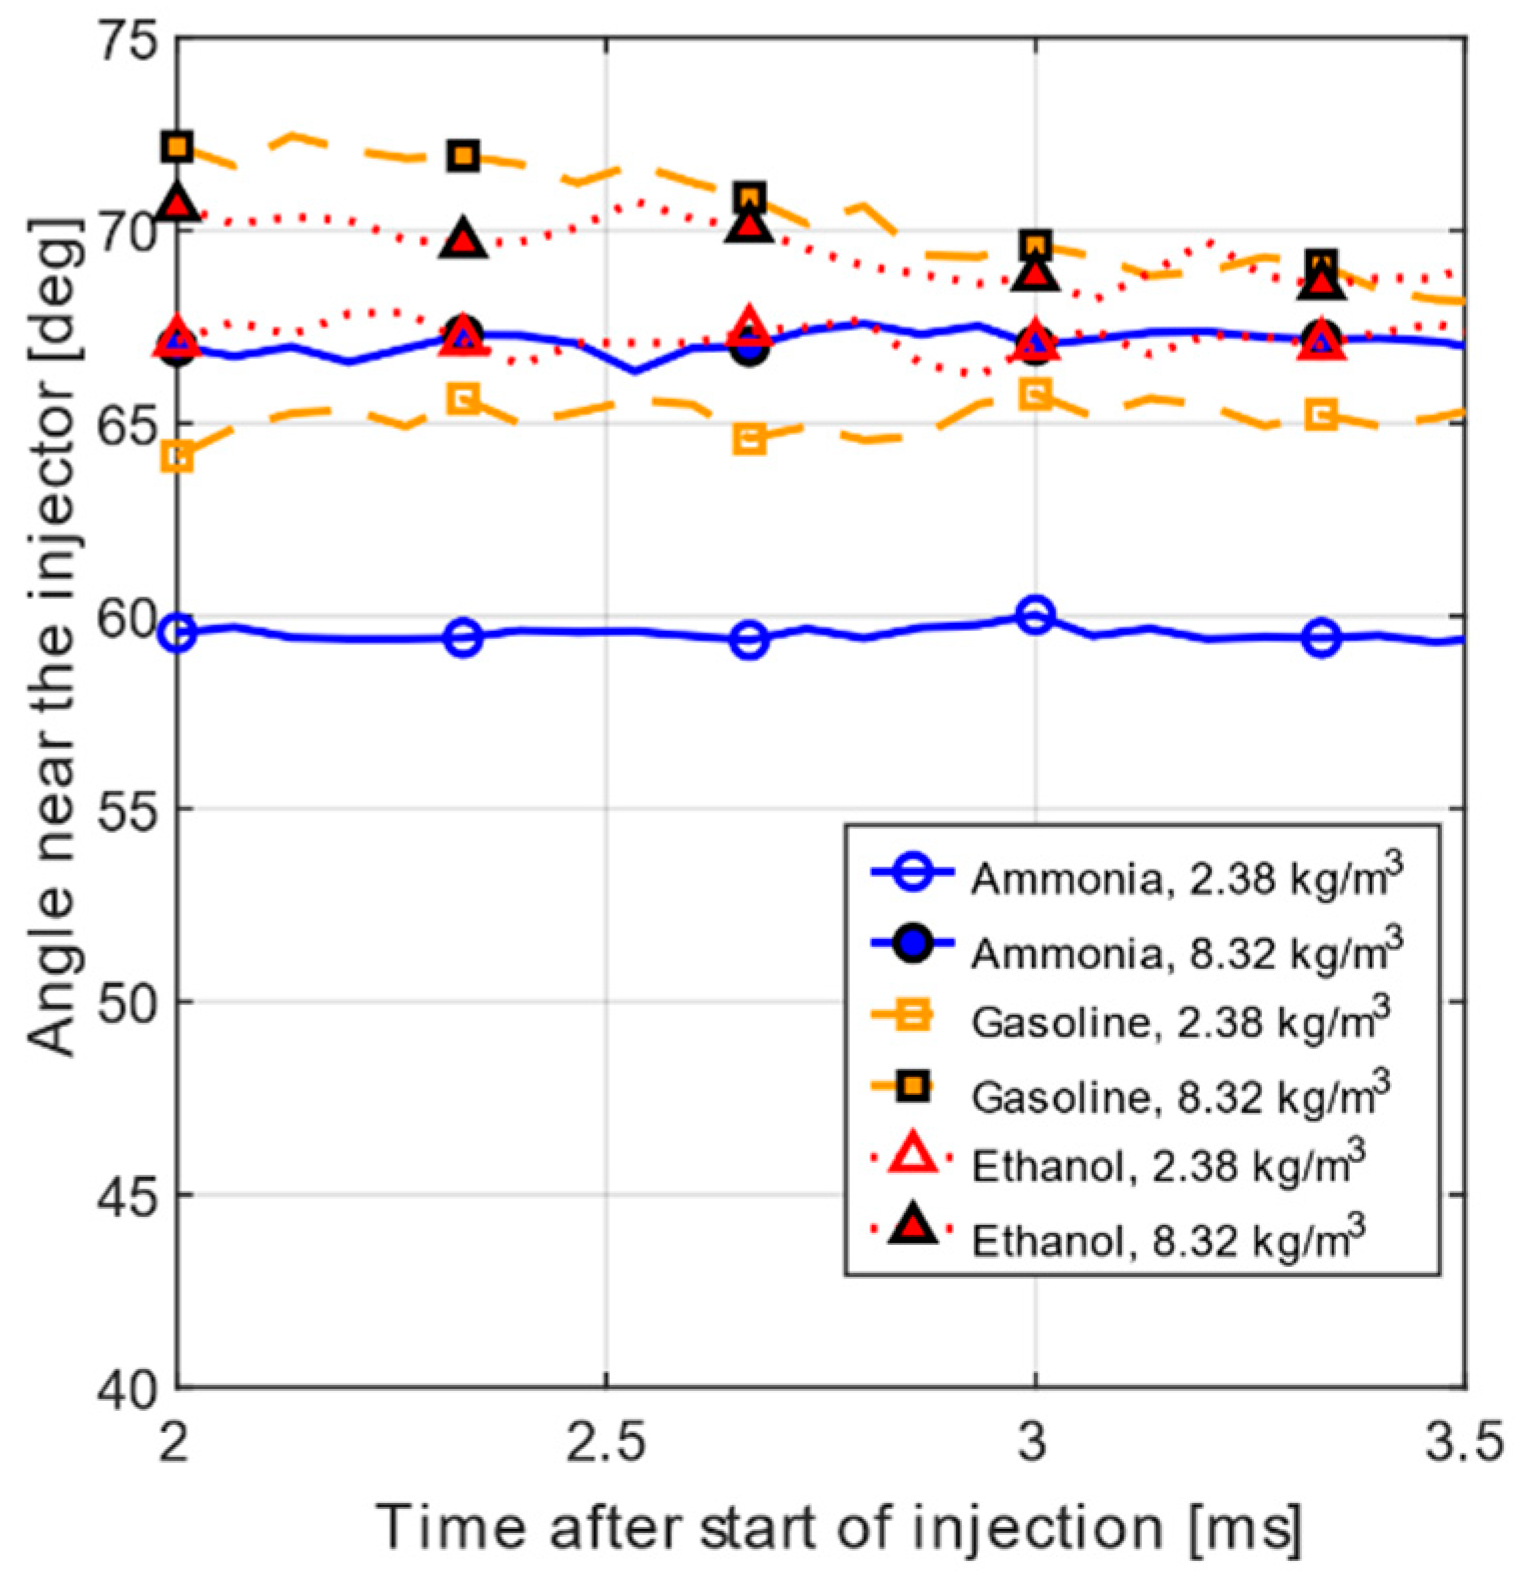
The liquid + vapor spray angle appears to be more sensitive to the air density variation for ammonia than for gasoline and ethanol. For T = 120 °C, as can be seen in Figure 8, the liquid + vapor spray angle of ammonia increases by 8° for high density and this difference remains constant between 2 ms and 3.5 ms, while in the case of gasoline and ethanol the increases are 8° and 3°, respectively, at 2 ms but are only around 3° and 2°, respectively, at 3.5 ms.
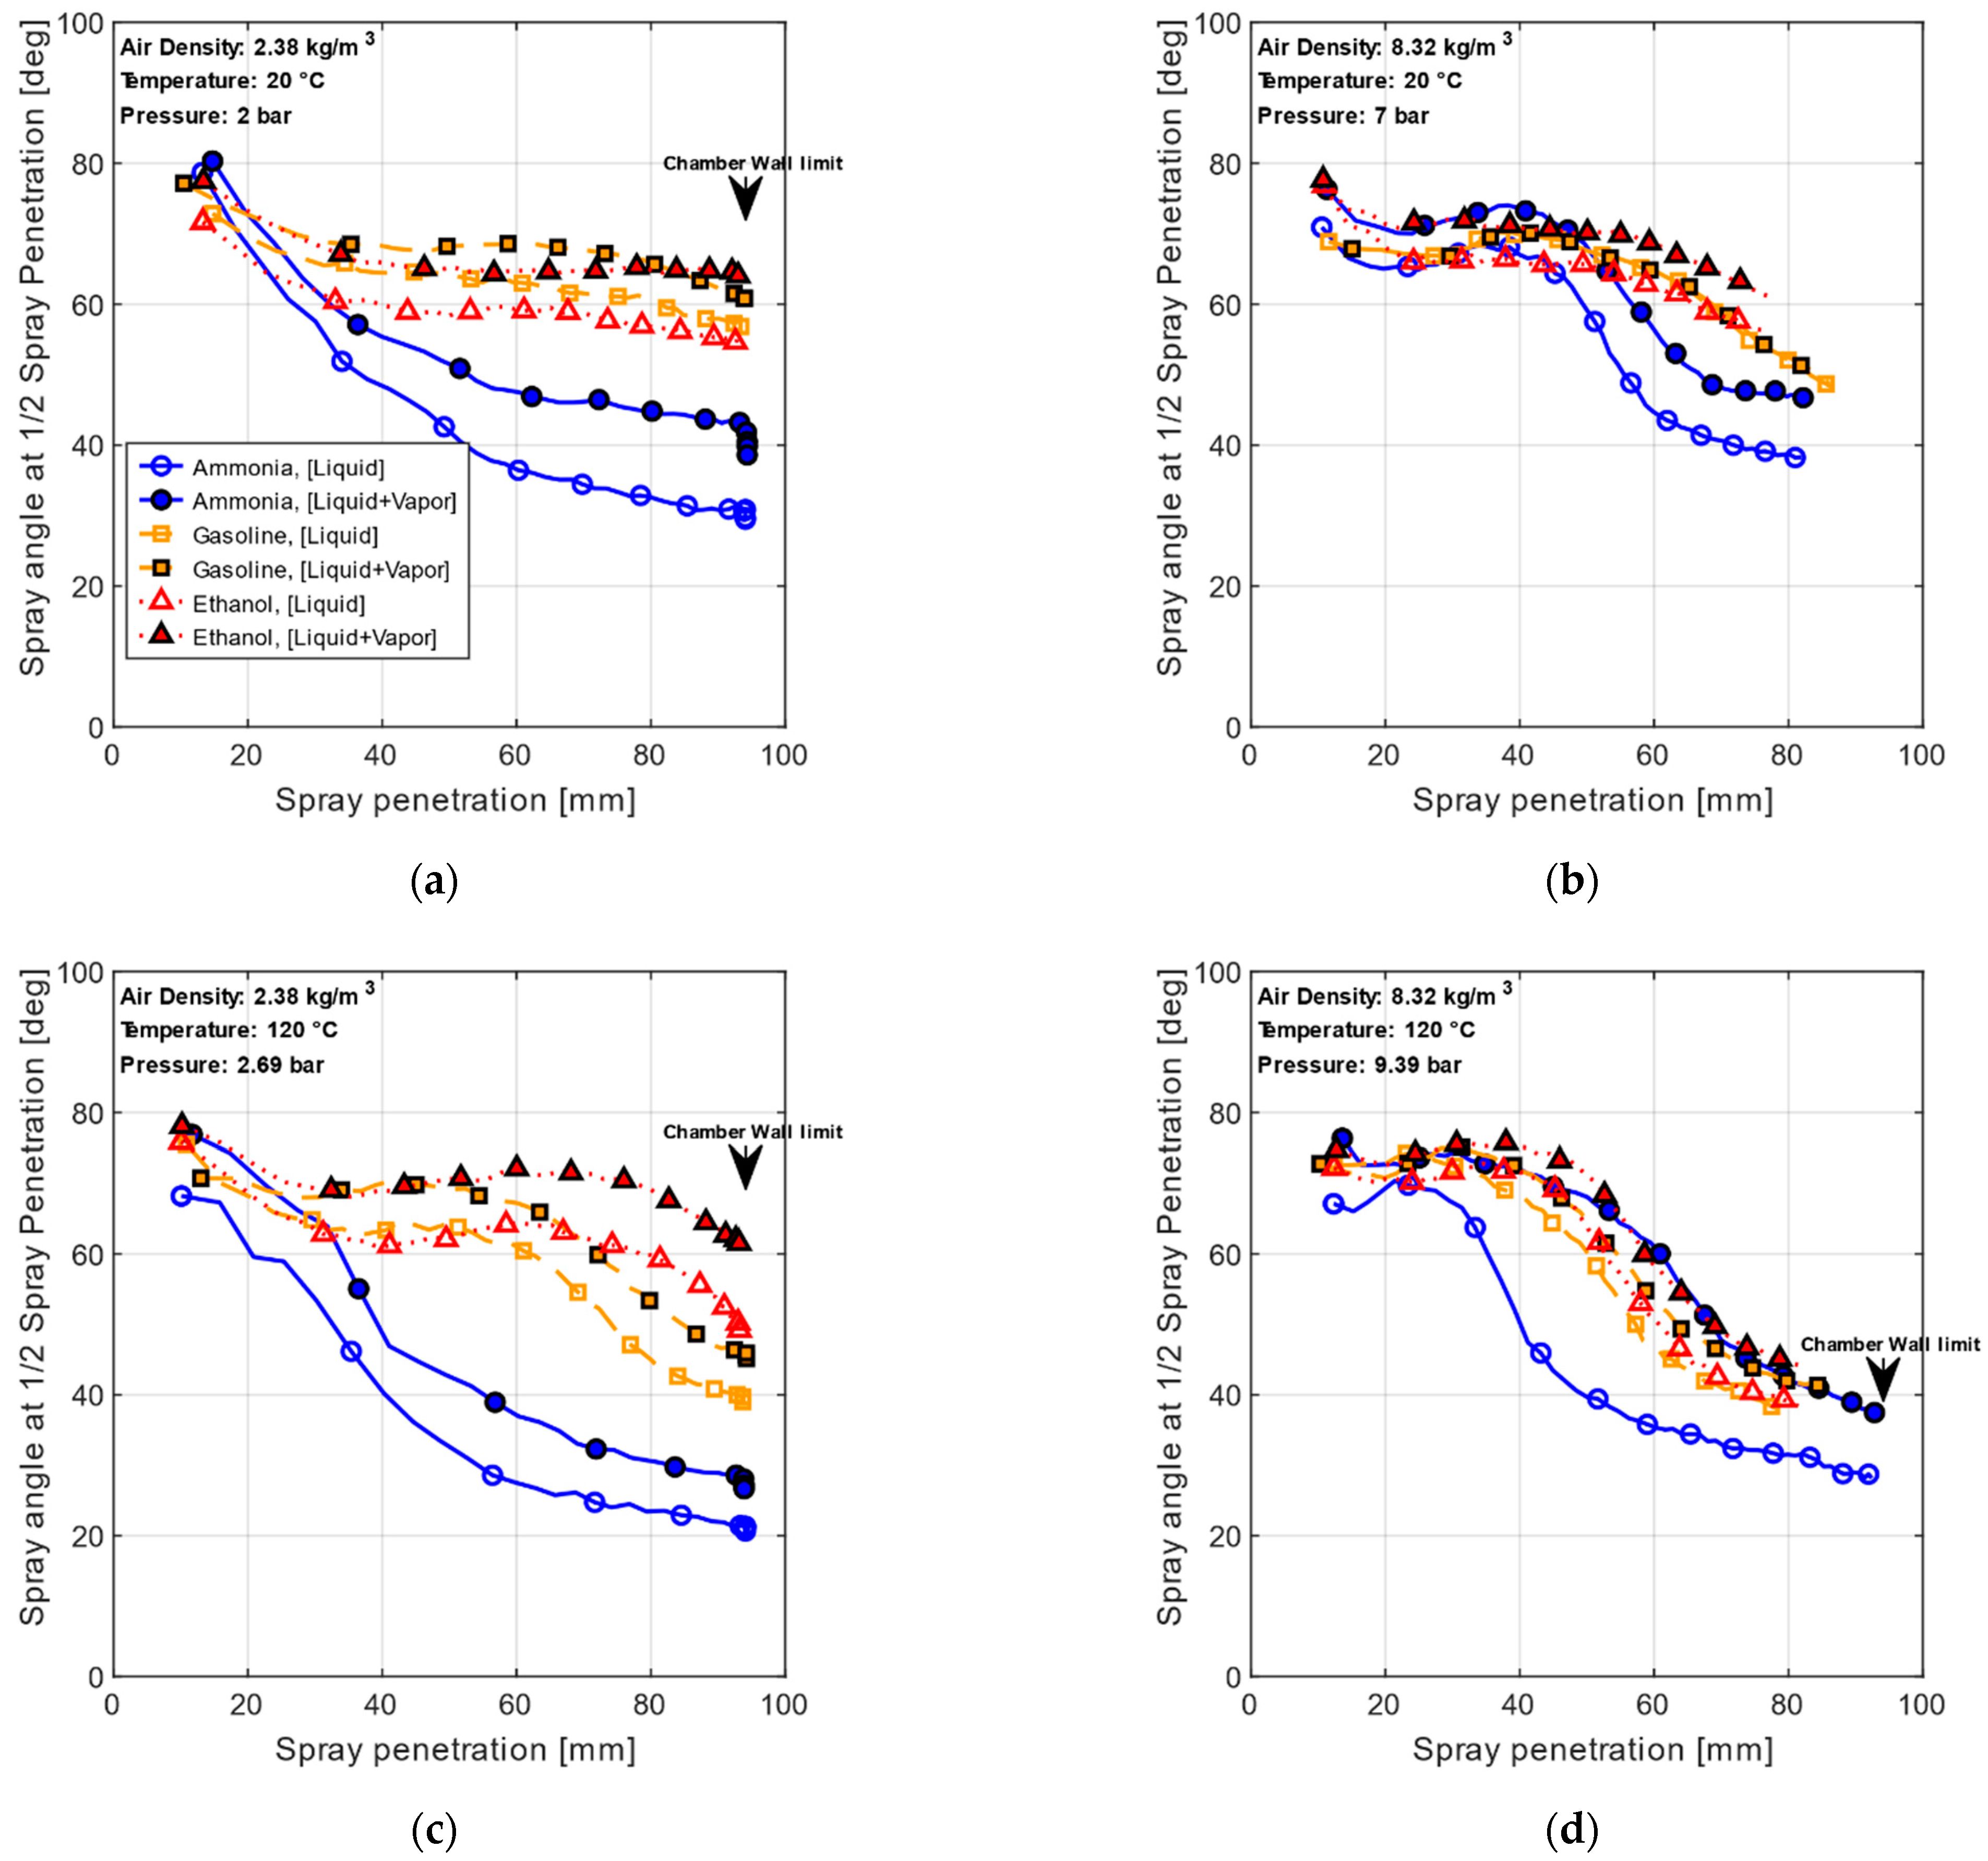
The results obtained for spray angle at half the penetration length as a function of the penetration length after the first part of injection (<10 mm) are given in Figure 9. Some sprays reach the chamber wall when the penetration length is around 93 mm, Figure 6. At low air density, this spray angle is greater and more constant for gasoline and ethanol than for ammonia. In the case of ammonia, the spray angles at half the penetration length of the liquid and vapor + liquid phases decrease rapidly while those of gasoline and ethanol remain almost constant at low temperature and are constant at the beginning and then decrease at high temperature. The difference between liquid and liquid + vapor phases is reduced for high air density except for ammonia at 120 °C. At higher air density, all the vapor + liquid angles are similar except at 20 °C; in this case, the ammonia angle is lower than the ethanol and gasoline angles after 45 mm of penetration length.
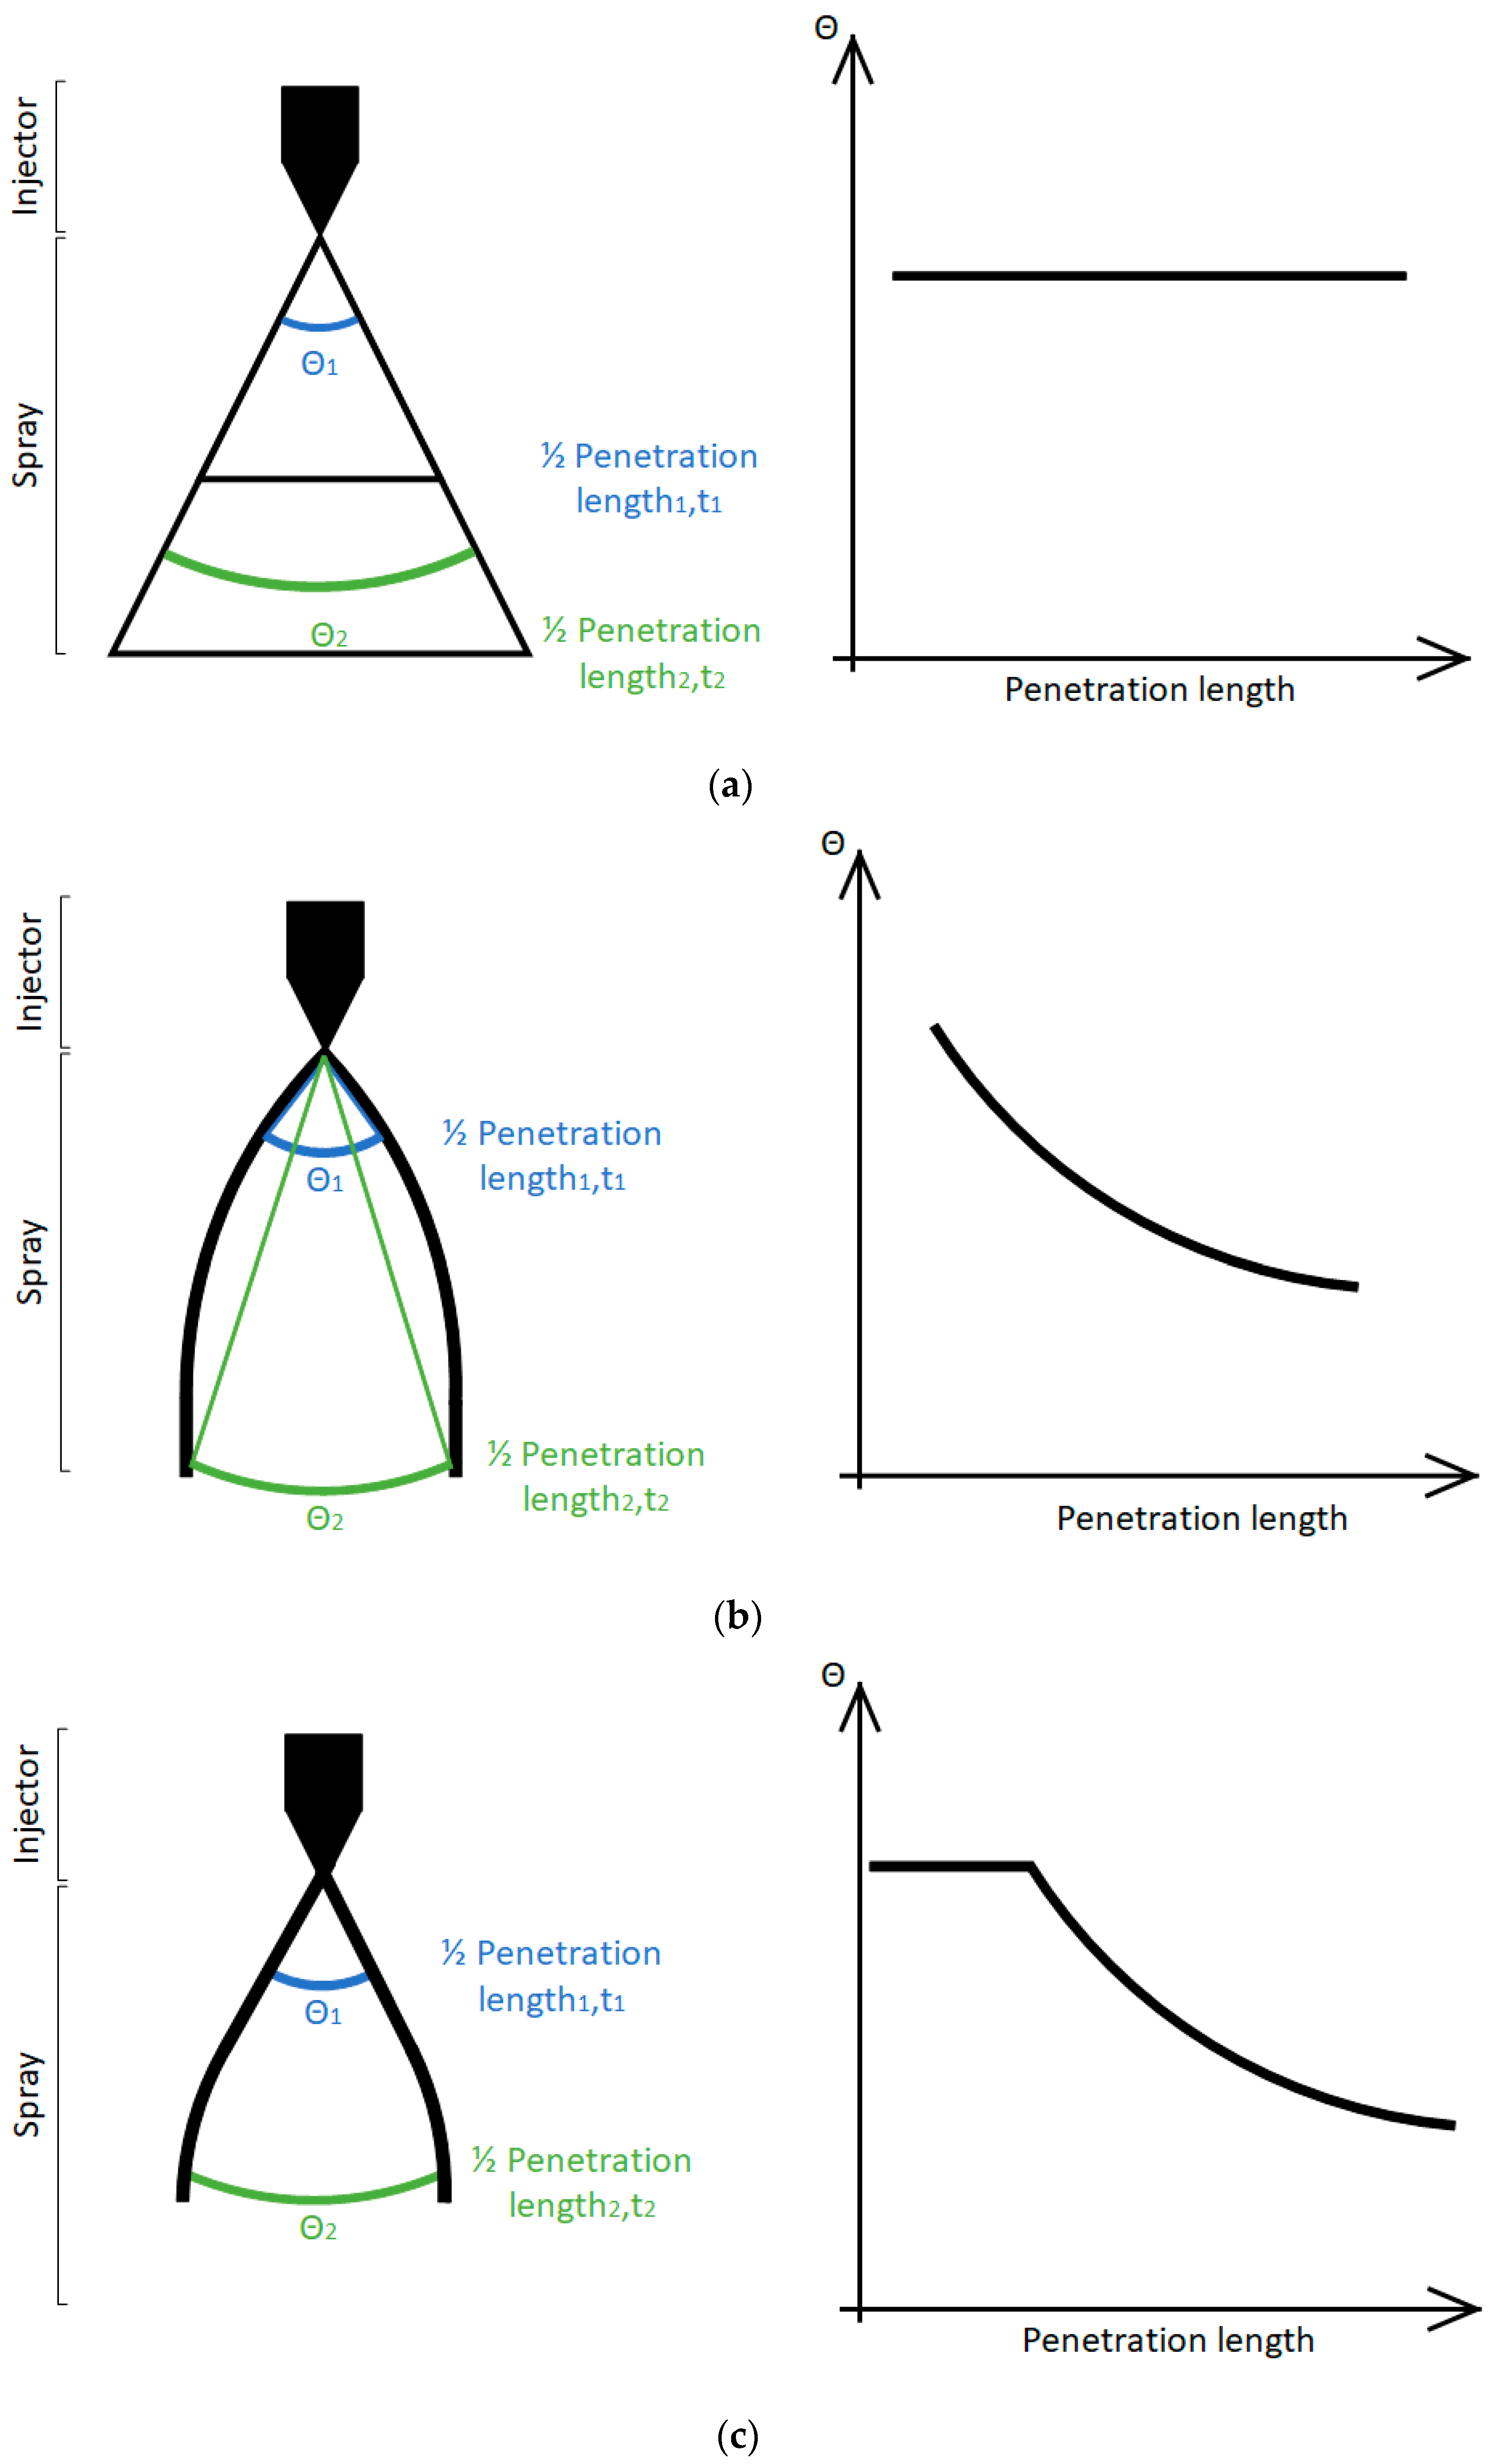
Figure 10 schematizes the geometry of the spray development with the evolution of the spray angle at half the penetration length. A constant spray angle at half the penetration length during spray development means that the spray is conical, without any strong plume-to-plume interactions (case a). A strong plume-to-plume interaction means that the spray angle at half the penetration length decreases and that the spray becomes tighter (case b). The plume-to-plume interaction can evolve during spray development, with the spray being conical at the beginning and becoming tighter later (case c). In the present study, at low air density the ammonia case corresponds to Figure 10a while the ethanol and gasoline case corresponds to Figure 10b or Figure 10c. At high density, all the fuels studied here are in the condition depicted in Figure 10c.
3.2. Effect of Flash Boiling on Ammonia Fuel
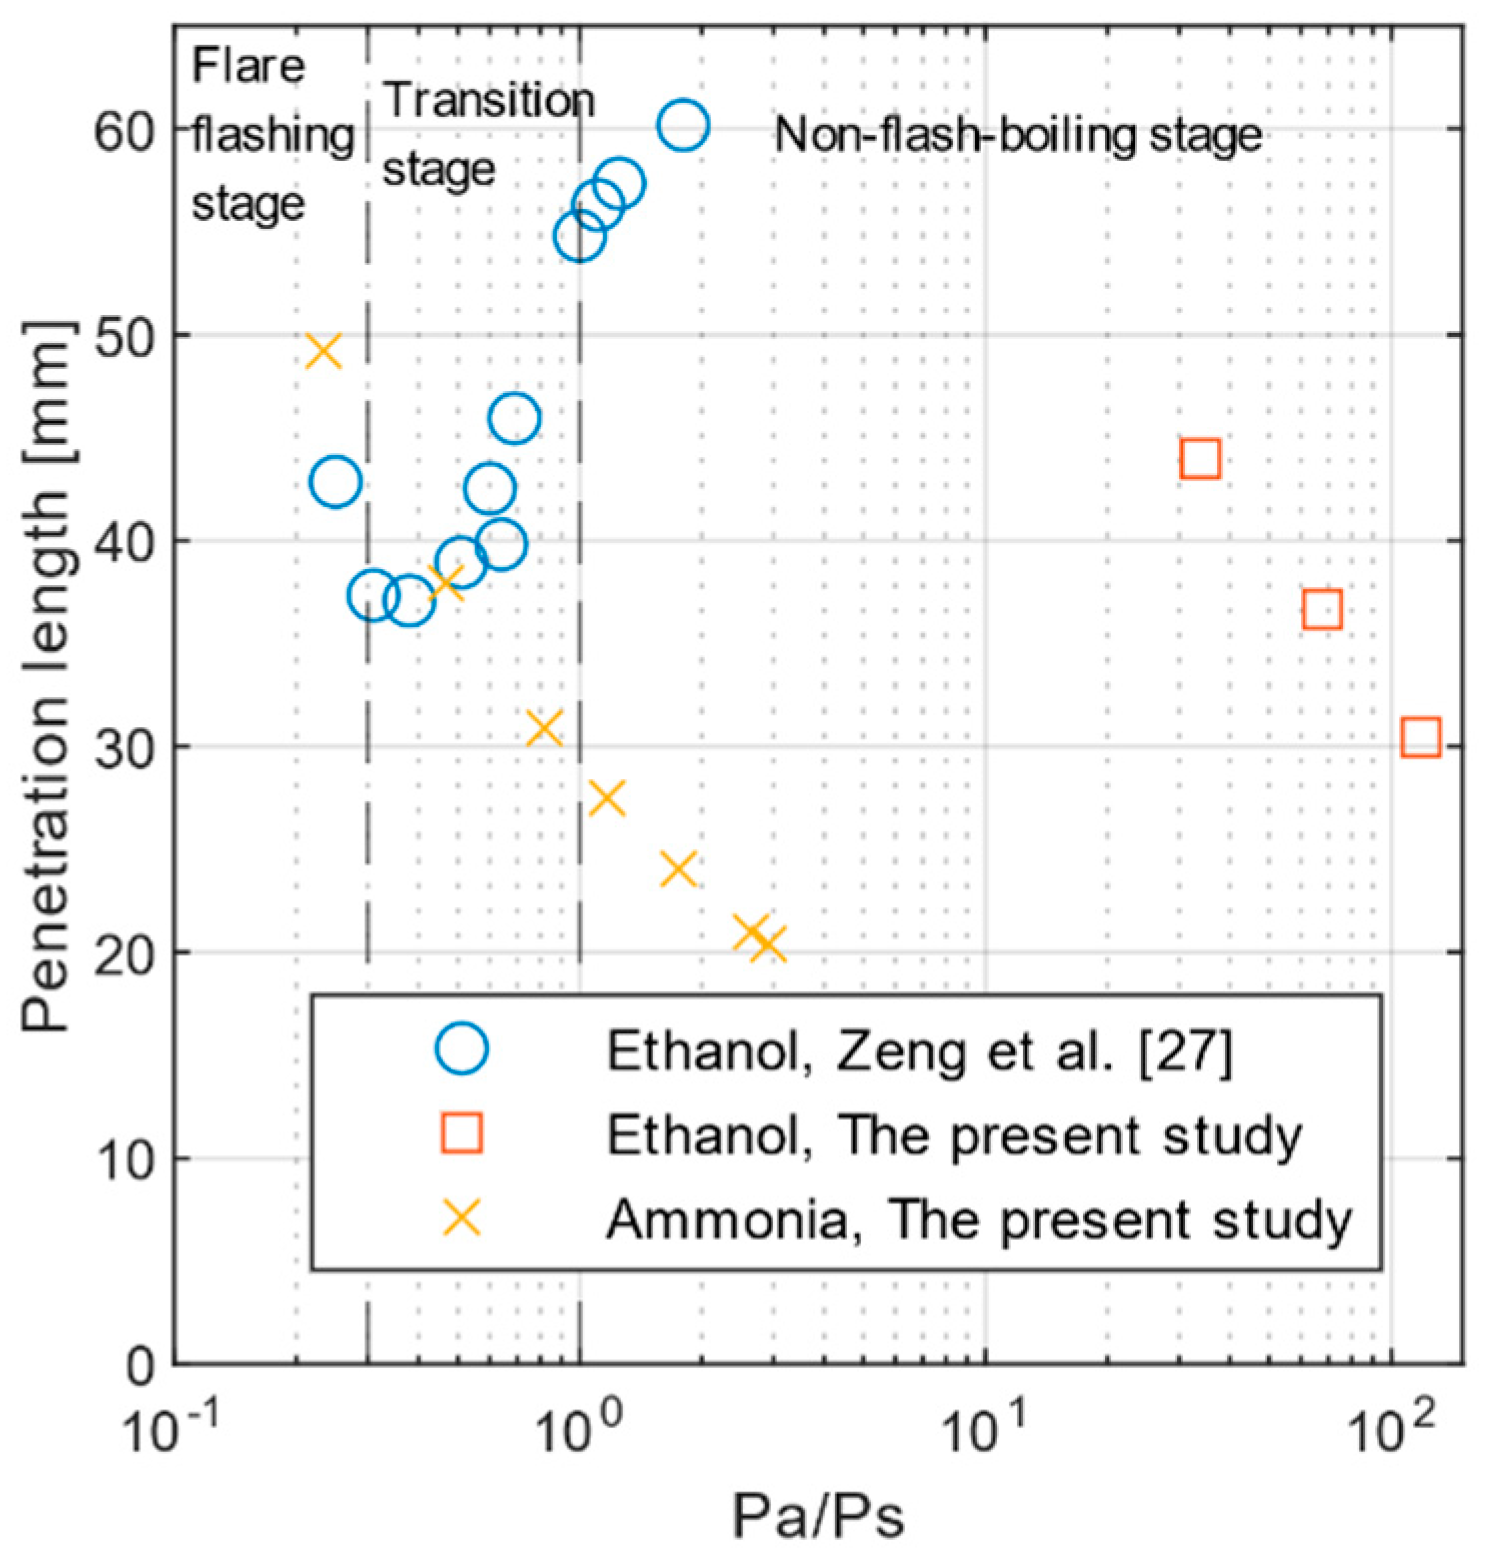
The flash boiling condition is being increasingly considered for current fuels due to its potential of reducing soot and of improving fuel–air mixing [12]. Free carbon fuels as ammonia do not produce soot but have different vapor pressure curves than current fuels, Figure 4, increasing the flash boiling apparition compared to current fuels for classical conditions, therefore, its study is essential. Several studies [16,23,27] investigated the effect of flash boiling for different fuel temperatures and considered the following parameters, or to provide a dimensionless description of the spray structural transformation and vaporization, with and the ambient and saturated vapor pressures, the fuel and boiling temperatures. For alcohol fuels, it was seen that a flare flash boiling stage occurs for , and a transition stage between 0.3 and 1 [27].
Figure 11 compiles data for ethanol from [11,27] for different fuel temperatures and air pressures and data for ethanol and ammonia from this work at ambient temperature with the associated pressures (see Table 1). Zeng et al. [27] explored low pressure conditions (20 kPa to 100 kPa), below the vapor pressure curve, and classified three stages, unlike the present work where the pressure was high to highlight the change phase of ammonia (8.8 bar at 20 °C). However, the three stages noticed with ethanol by Zeng et al. [27] are not observed with ammonia in this work.
However, in the present study, the exact fuel temperature is unknown because only the chamber walls are heated, and no temperature sensors can be inserted inside the injector core. Therefore, the fuel temperature at injection is between the fuel temperature in the pipe (ambient temperature) and the chamber temperature due to heat transfers through the injector and unfortunately without an exact fuel temperature, the vapor pressure cannot be determined. However, at ambient temperature in the chamber, there is no heat transfer and the fuel temperature at injection is equal to the ambient temperature. For this reason, the study of flash boiling of ammonia was done only at ambient temperature.
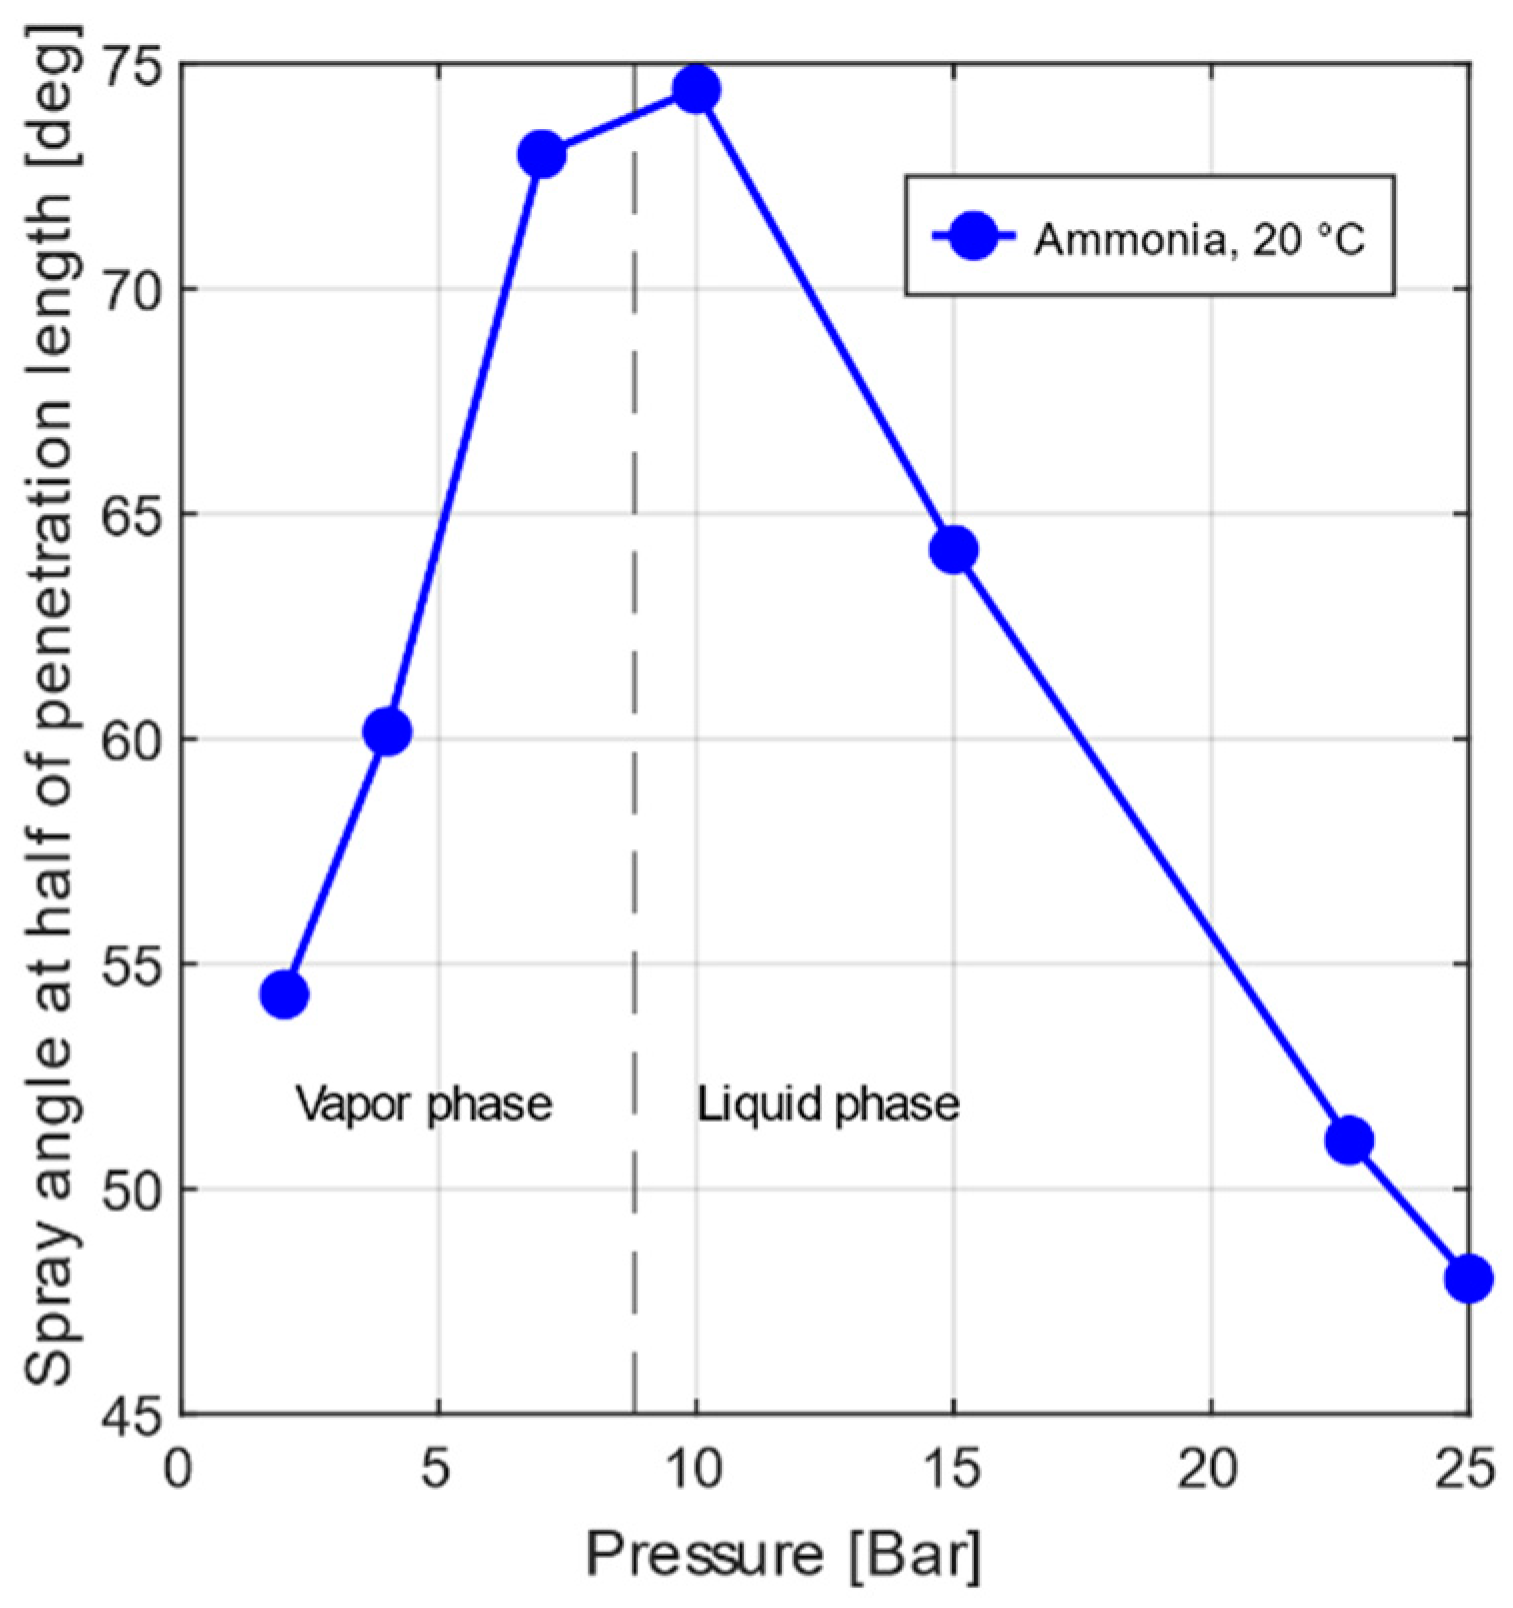
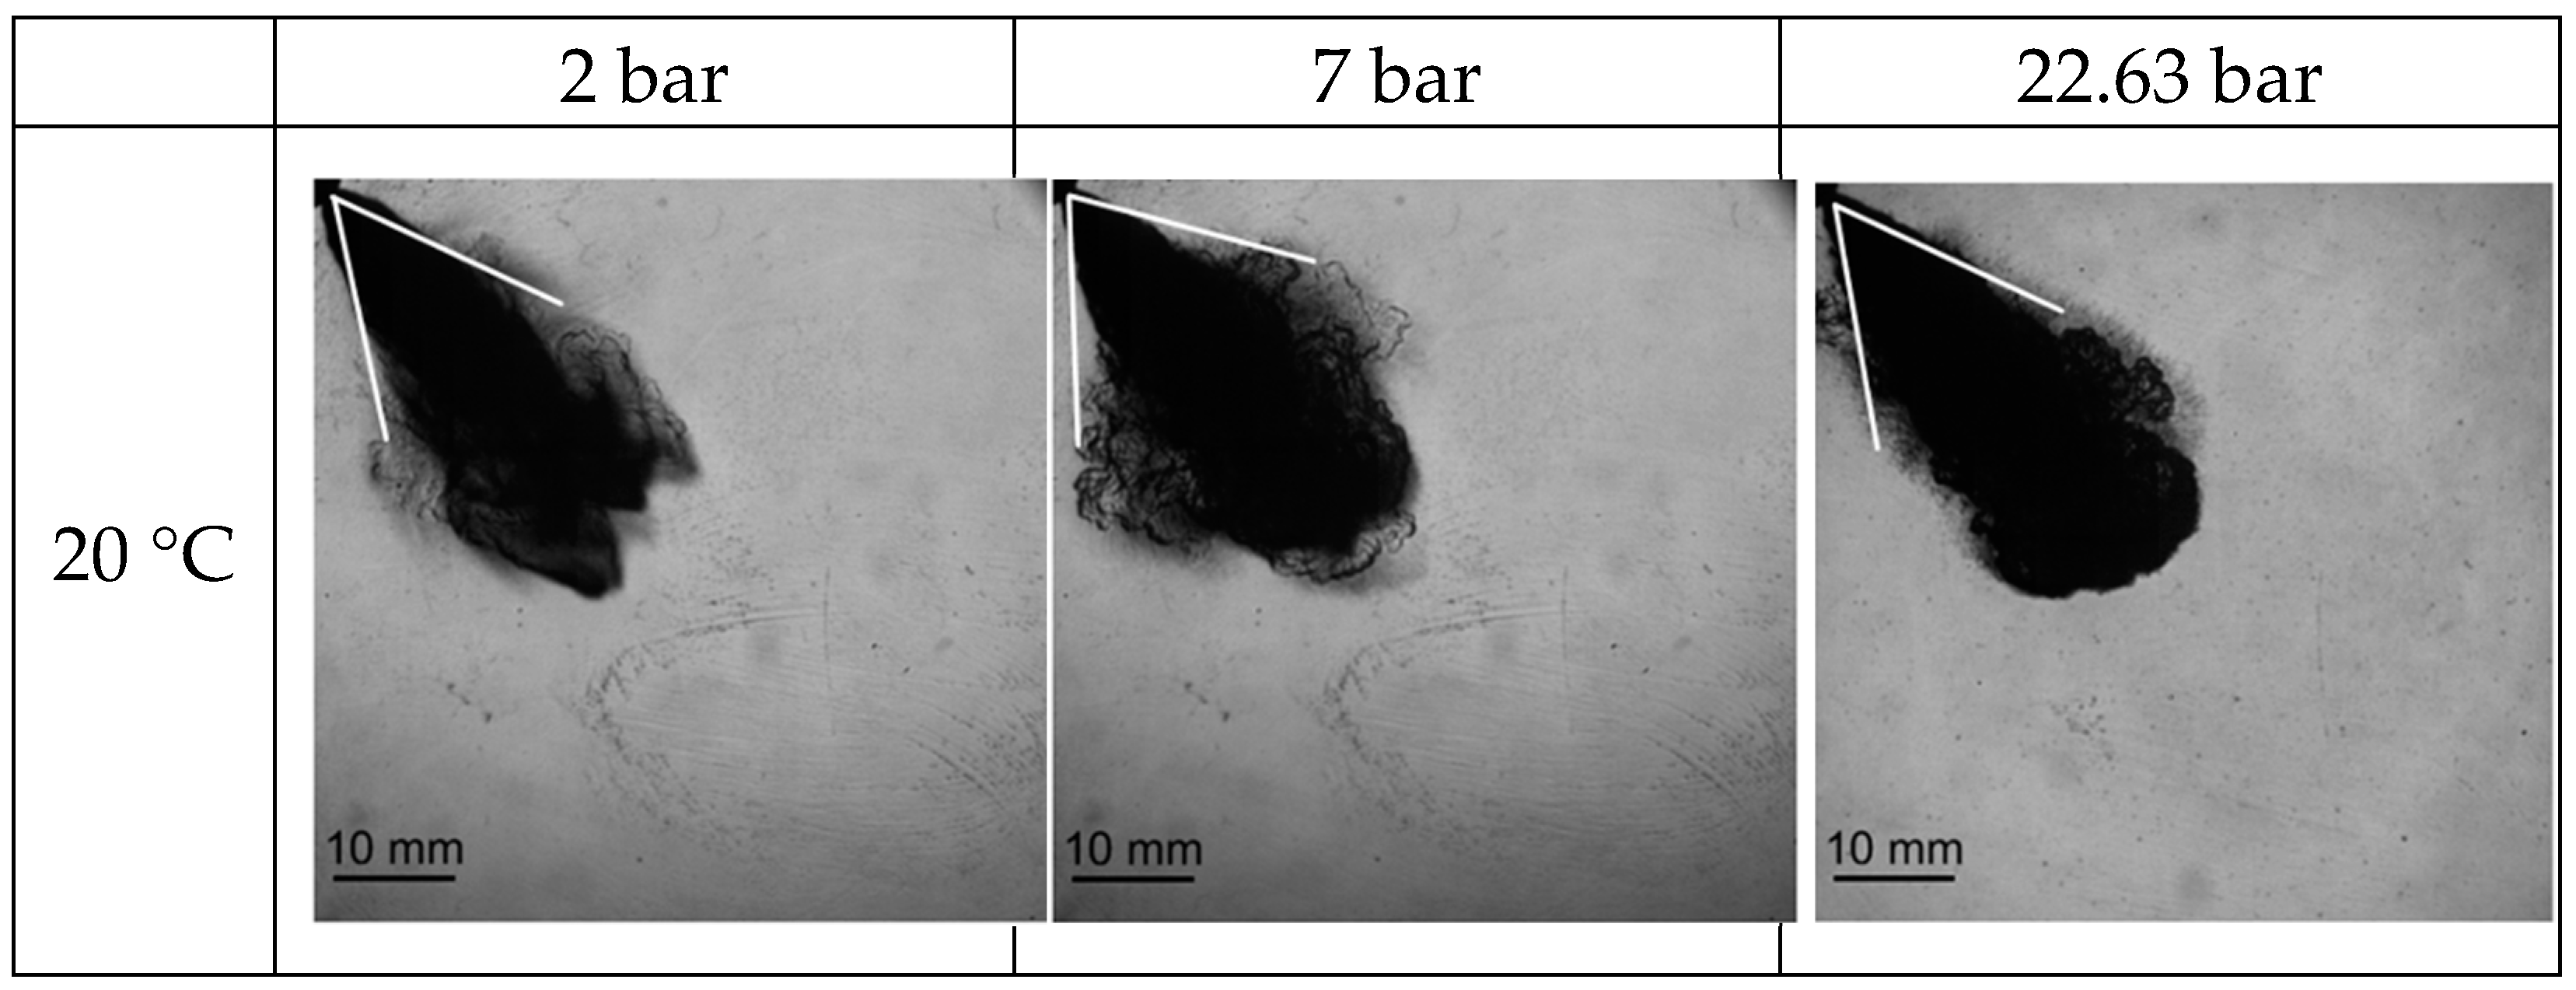
Figure 12 shows the spray angle at half the penetration length for a constant penetration length of 40 mm as a function of the ambient pressure. Figure 13 displays three images of the ammonia spray for 2, 7, and 22.63 bar. At 20 °C, the phase change of ammonia is around 8.8 bar (Figure 4), corresponding to the maximum spray angle at half the penetration length in Figure 12 and Figure 13. In the flash boiling condition, the spray is collapsed, Figure 5, possibly due to vapor condensation. The occurrence of condensation can greatly reduce the partial pressure of vapor inside the spray and produce a local low-pressure zone, leading to collapse. This vapor condensation results from a temperature drop inside the spray due to the vapor expansion during bubble bursting [28]. This collapse effect tends to decrease the spray width.
3.3. Improvement of Semi-Empirical Correlation for Penetration Length as a Function of Physical Parameters
Several studies have proposed a temporal expression of spray penetration and spray angle for one spray plume. Hiroyasu and Arai [29] developed one of the first temporal expressions for diesel spray. They identified two regimes in the spray development: one directly proportional to time and a second one proportional to the square root of time. is the moment of regime change defined as a function of liquid density of the fuel, air density, pressure, and diameter of the injector holes. Recently, Payri et al. [25] successfully explored a theoretical approach based on momentum flux conservation along the spray axis for diesel. Du et al. [30] expressed the diesel spray penetration as with a unique time dependence. These studies have made a significant contribution to our understanding of diesel spray, but flash boiling was not investigated. Recent work identified that the temporal spray evolution is proportional to but also dependent on conditions [27].
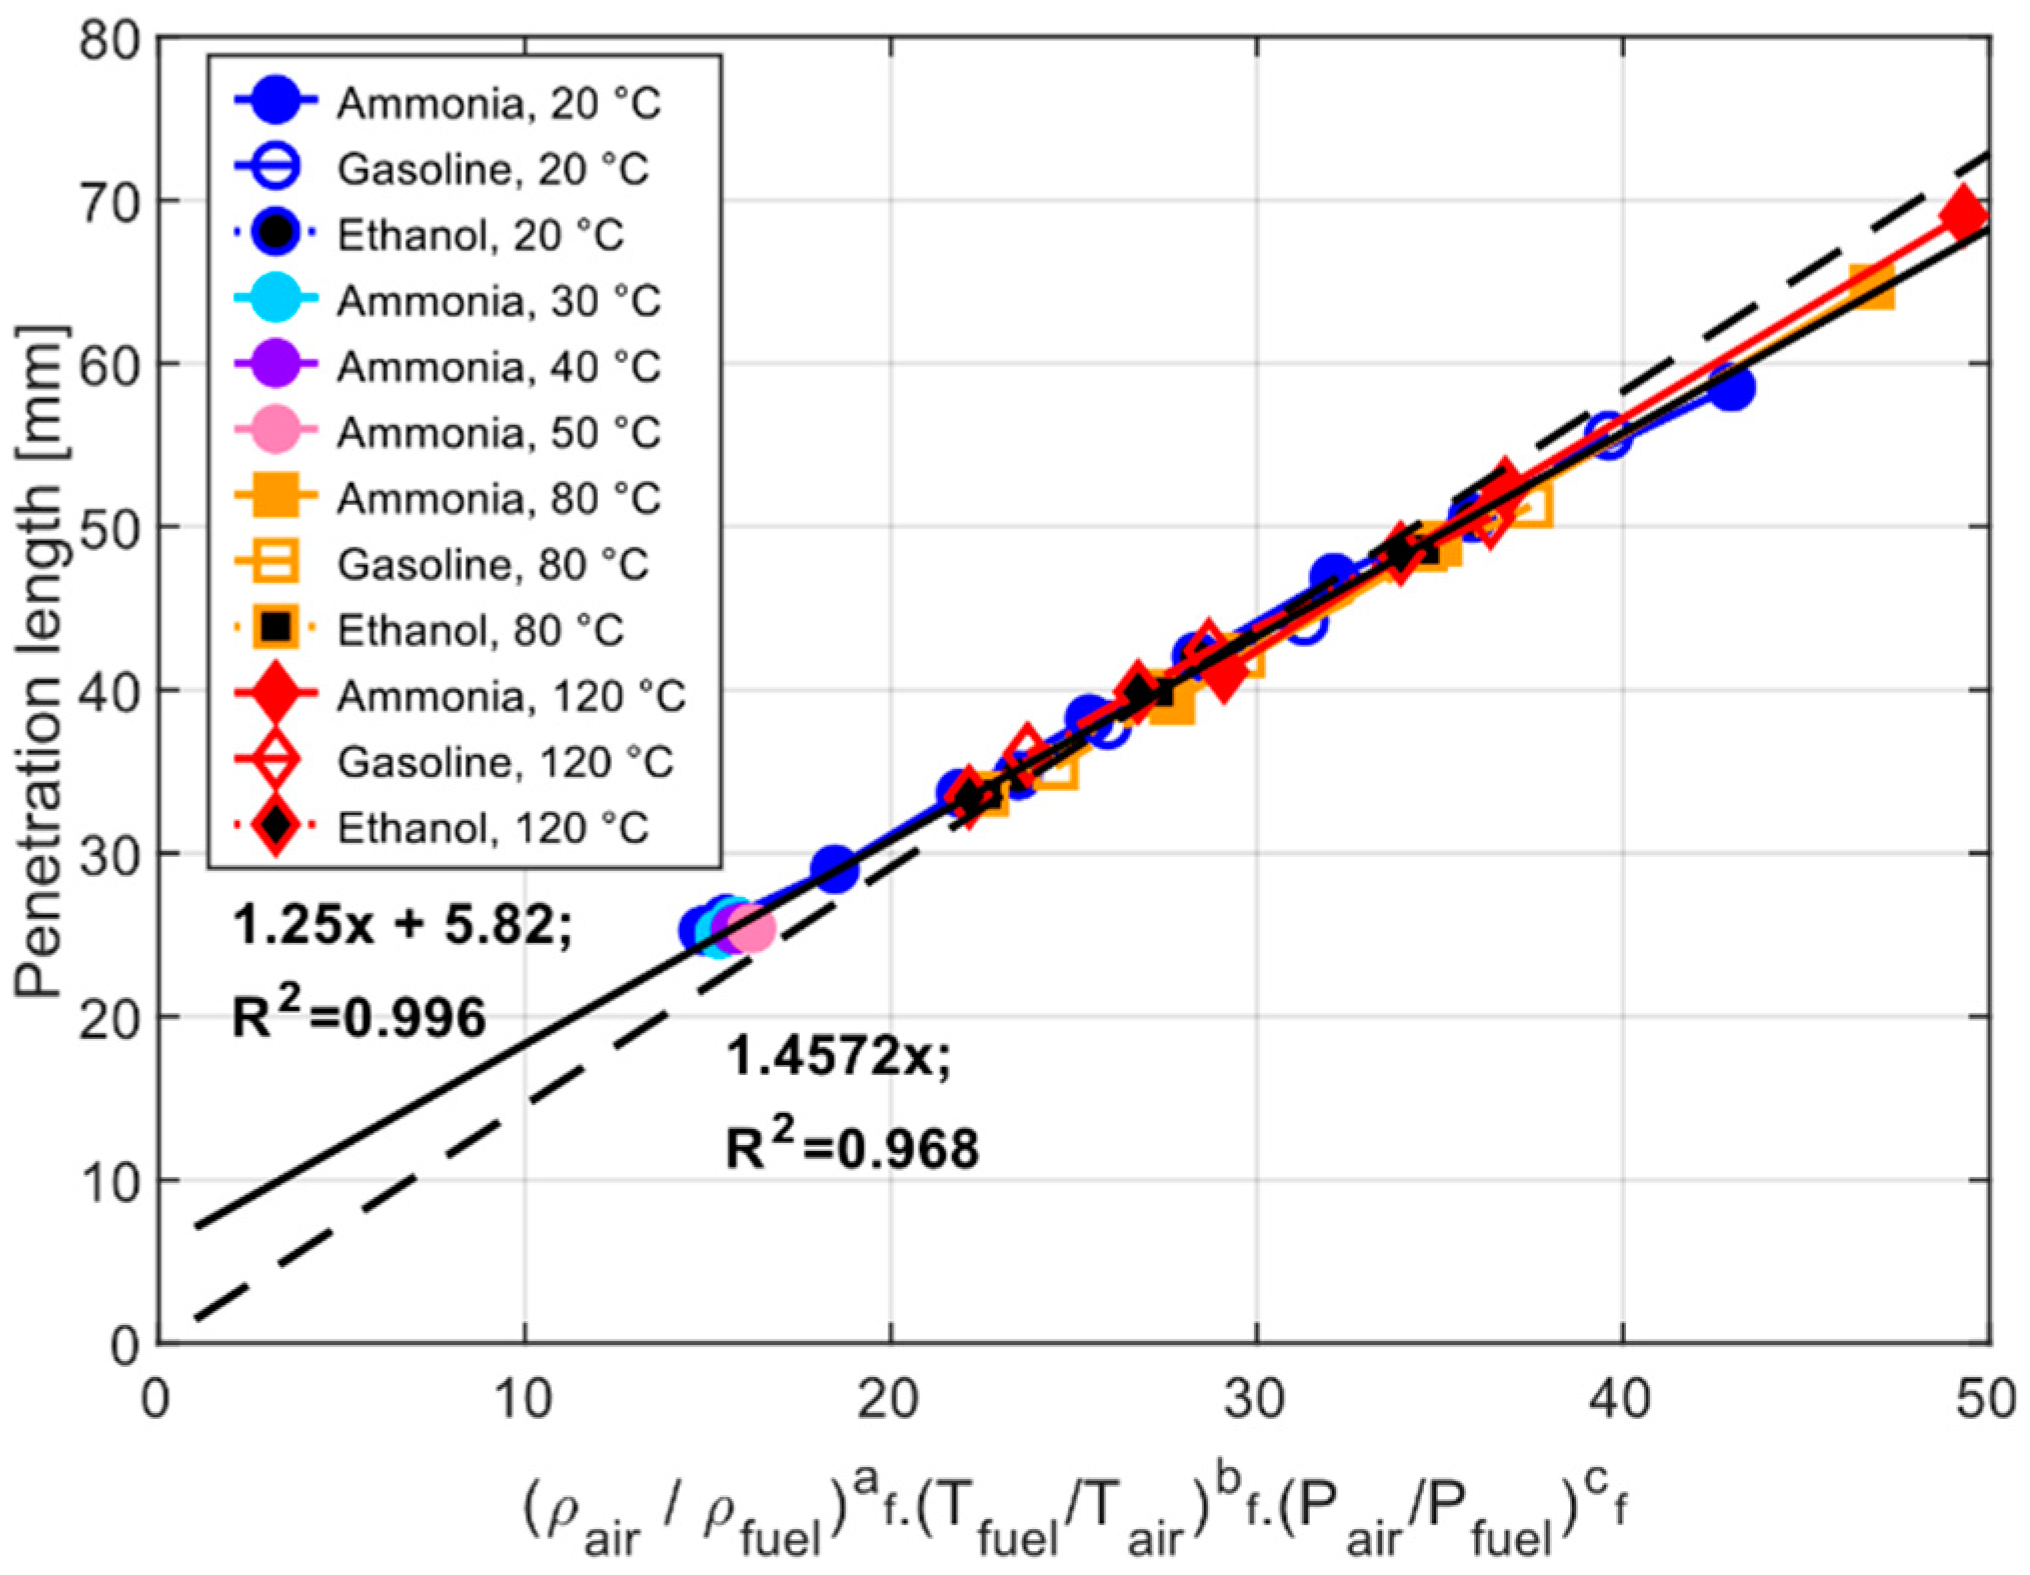
In this study, a perfect linearity for the global spray (all plumes), for all conditions of air density, temperature, and pressure and the three fuels was found. An example at t = 1 ms is given in Figure 14. This linearity is conserved for [0.8 ms; 1.8 ms] with R2 > 0.98. The penetration length, SP, can then be expressed as:
with R2 > 0.98 and [0.8 ms; 1.8 ms].
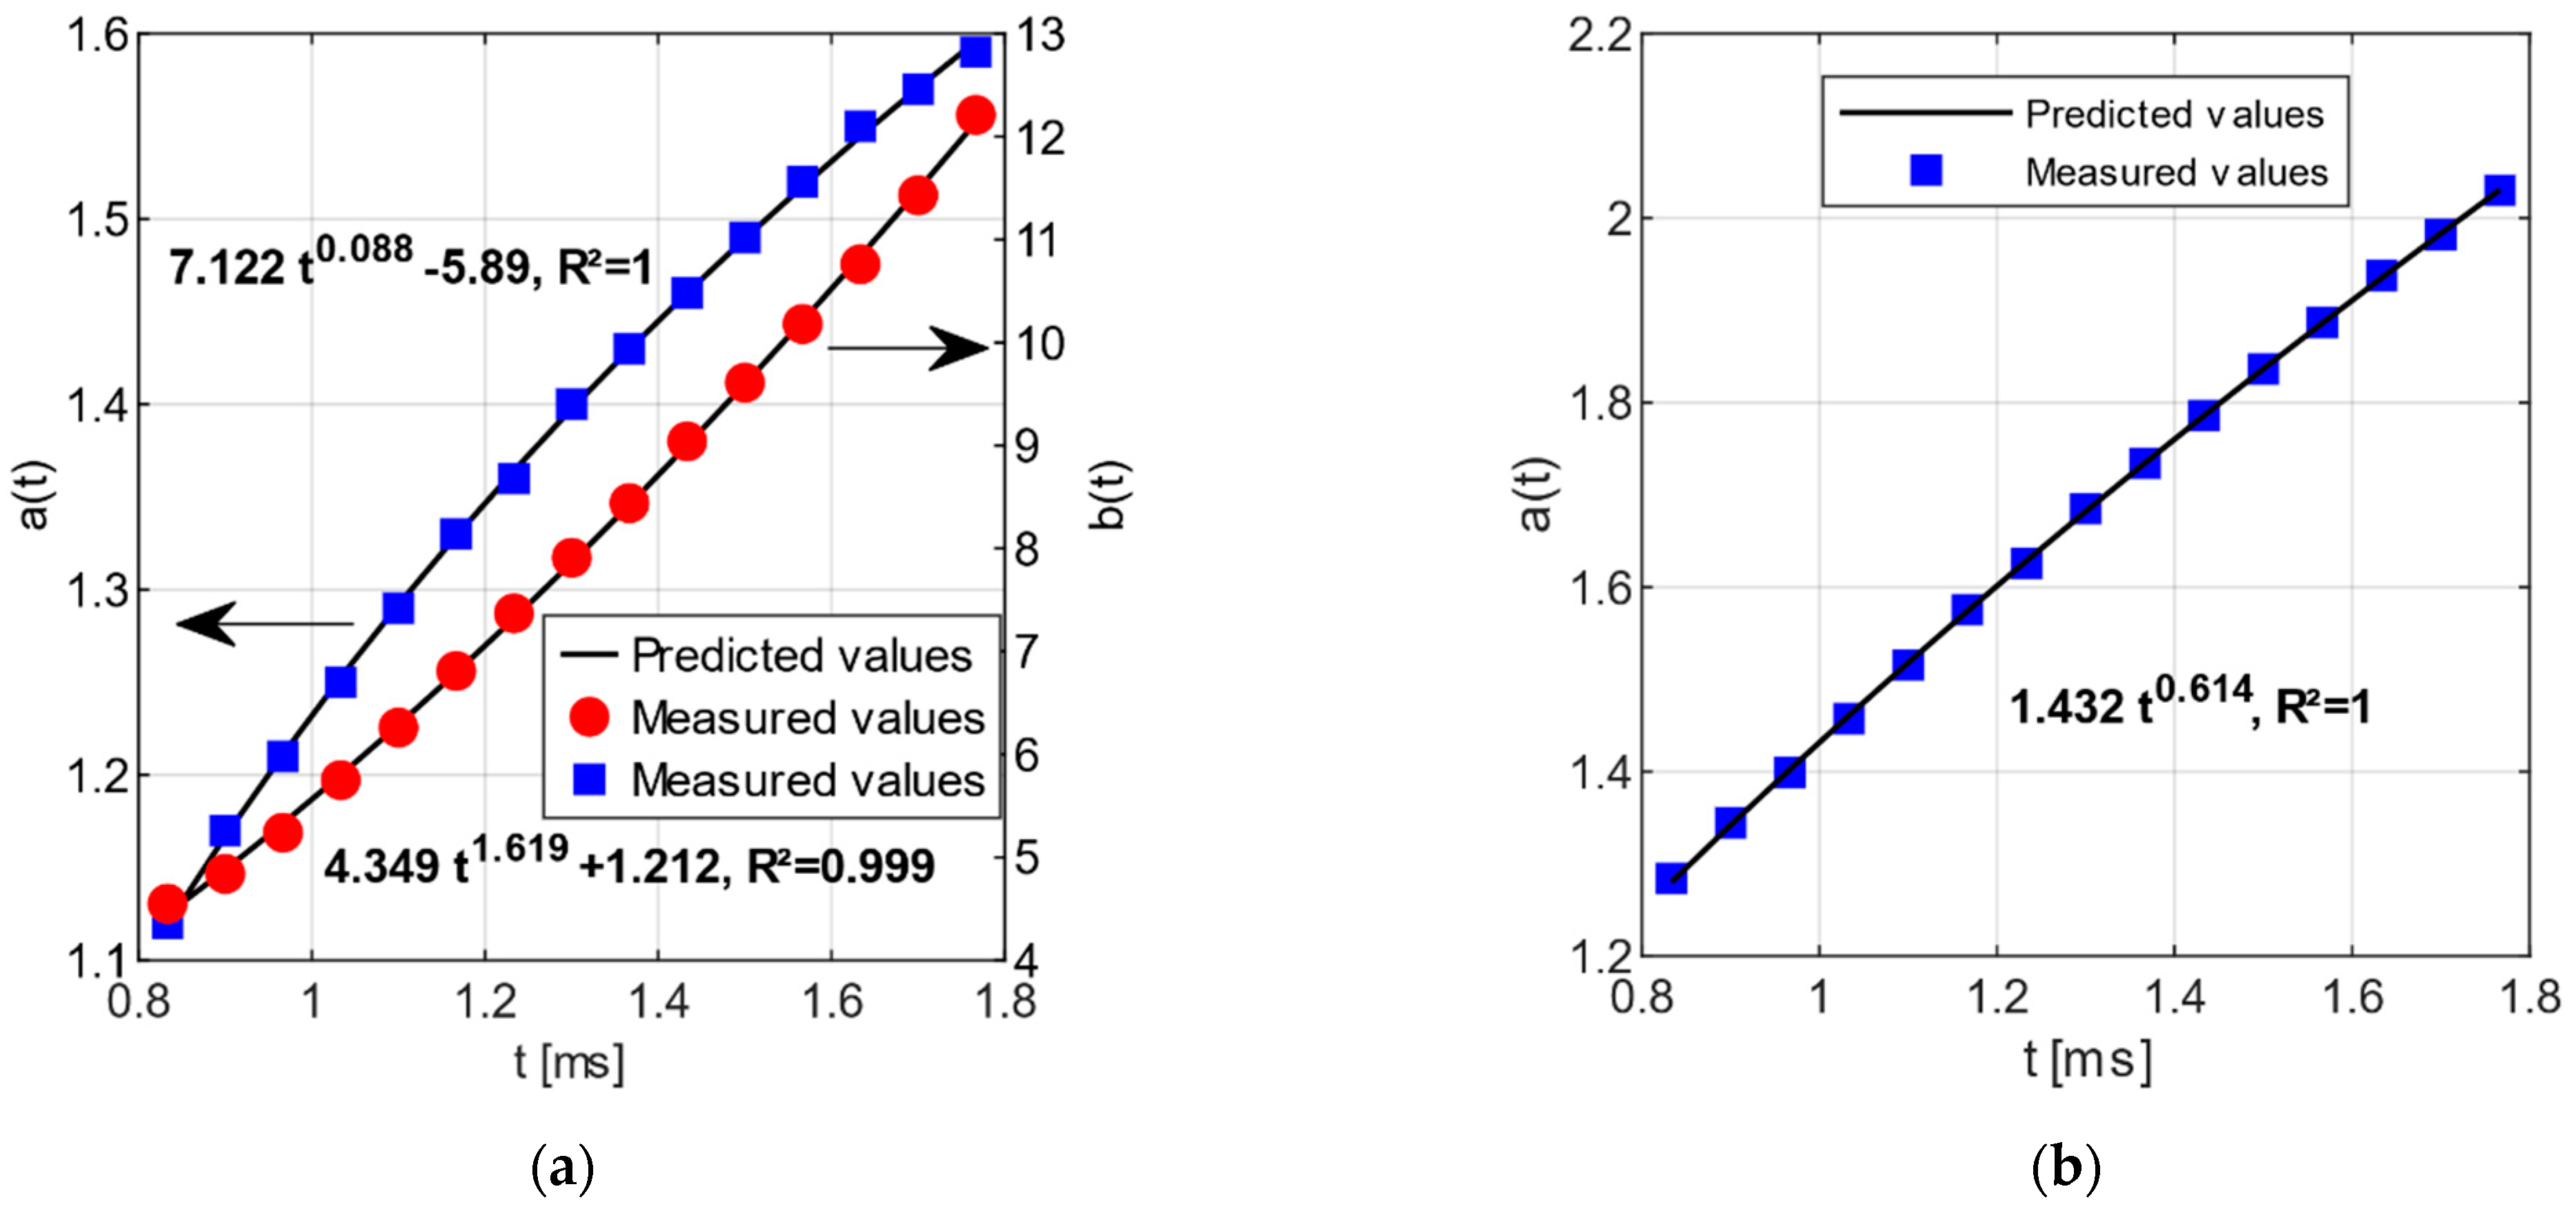
is the liquid fuel density at fuel injection temperature; all temperatures are in Kelvin. The exponent coefficients, , and , which are only fuel dependent, were obtained by using an error minimization routine, but the linear coefficients a(t) and b(t) are time-dependent. Nevertheless, the correlations found in literature have only one time dependence as the correlation find by Du et al. [30], therefore, the influence of the time-dependent parameter b(t) is investigated in this part. In the first case, the correlation is expressed with the two time-dependent parameters, the continuous line in Figure 14, and in the second case, the second time dependence is neglected, the dashed line in Figure 14. The two time-dependent parameters allow to follow the trend with a higher accuracy than with only one, Figure 14.
By replacing the air pressure by the perfect gas law, the expression becomes:
Table 3 shows the exponent coefficients found for the different fuels. A negative or positive coefficient means that the penetration length decreases or increases respectively by increasing the parameter. The absolute value of the coefficient indicates the sensitivity of the parameter—the higher the absolute value, the higher the sensitivity. All the fuels have a negative density sensitivity (af + cf), as was found for diesel fuel (−0.25) by Hiroyasu and Arai [29] and Dent [31]; gasoline and ethanol have the same sensitivity while ammonia is more sensitive. Ammonia is more sensitive to temperature (cf − bf) than gasoline and ethanol: 0.46 vs. 0.30 and 0.21 in absolute values, respectively. Moreover, ammonia is positively impacted by temperature, whereas the coefficient is negative for gasoline and ethanol. Dent [31] also found a sensitivity of −0.25 for diesel, which is around the values of gasoline and ethanol.
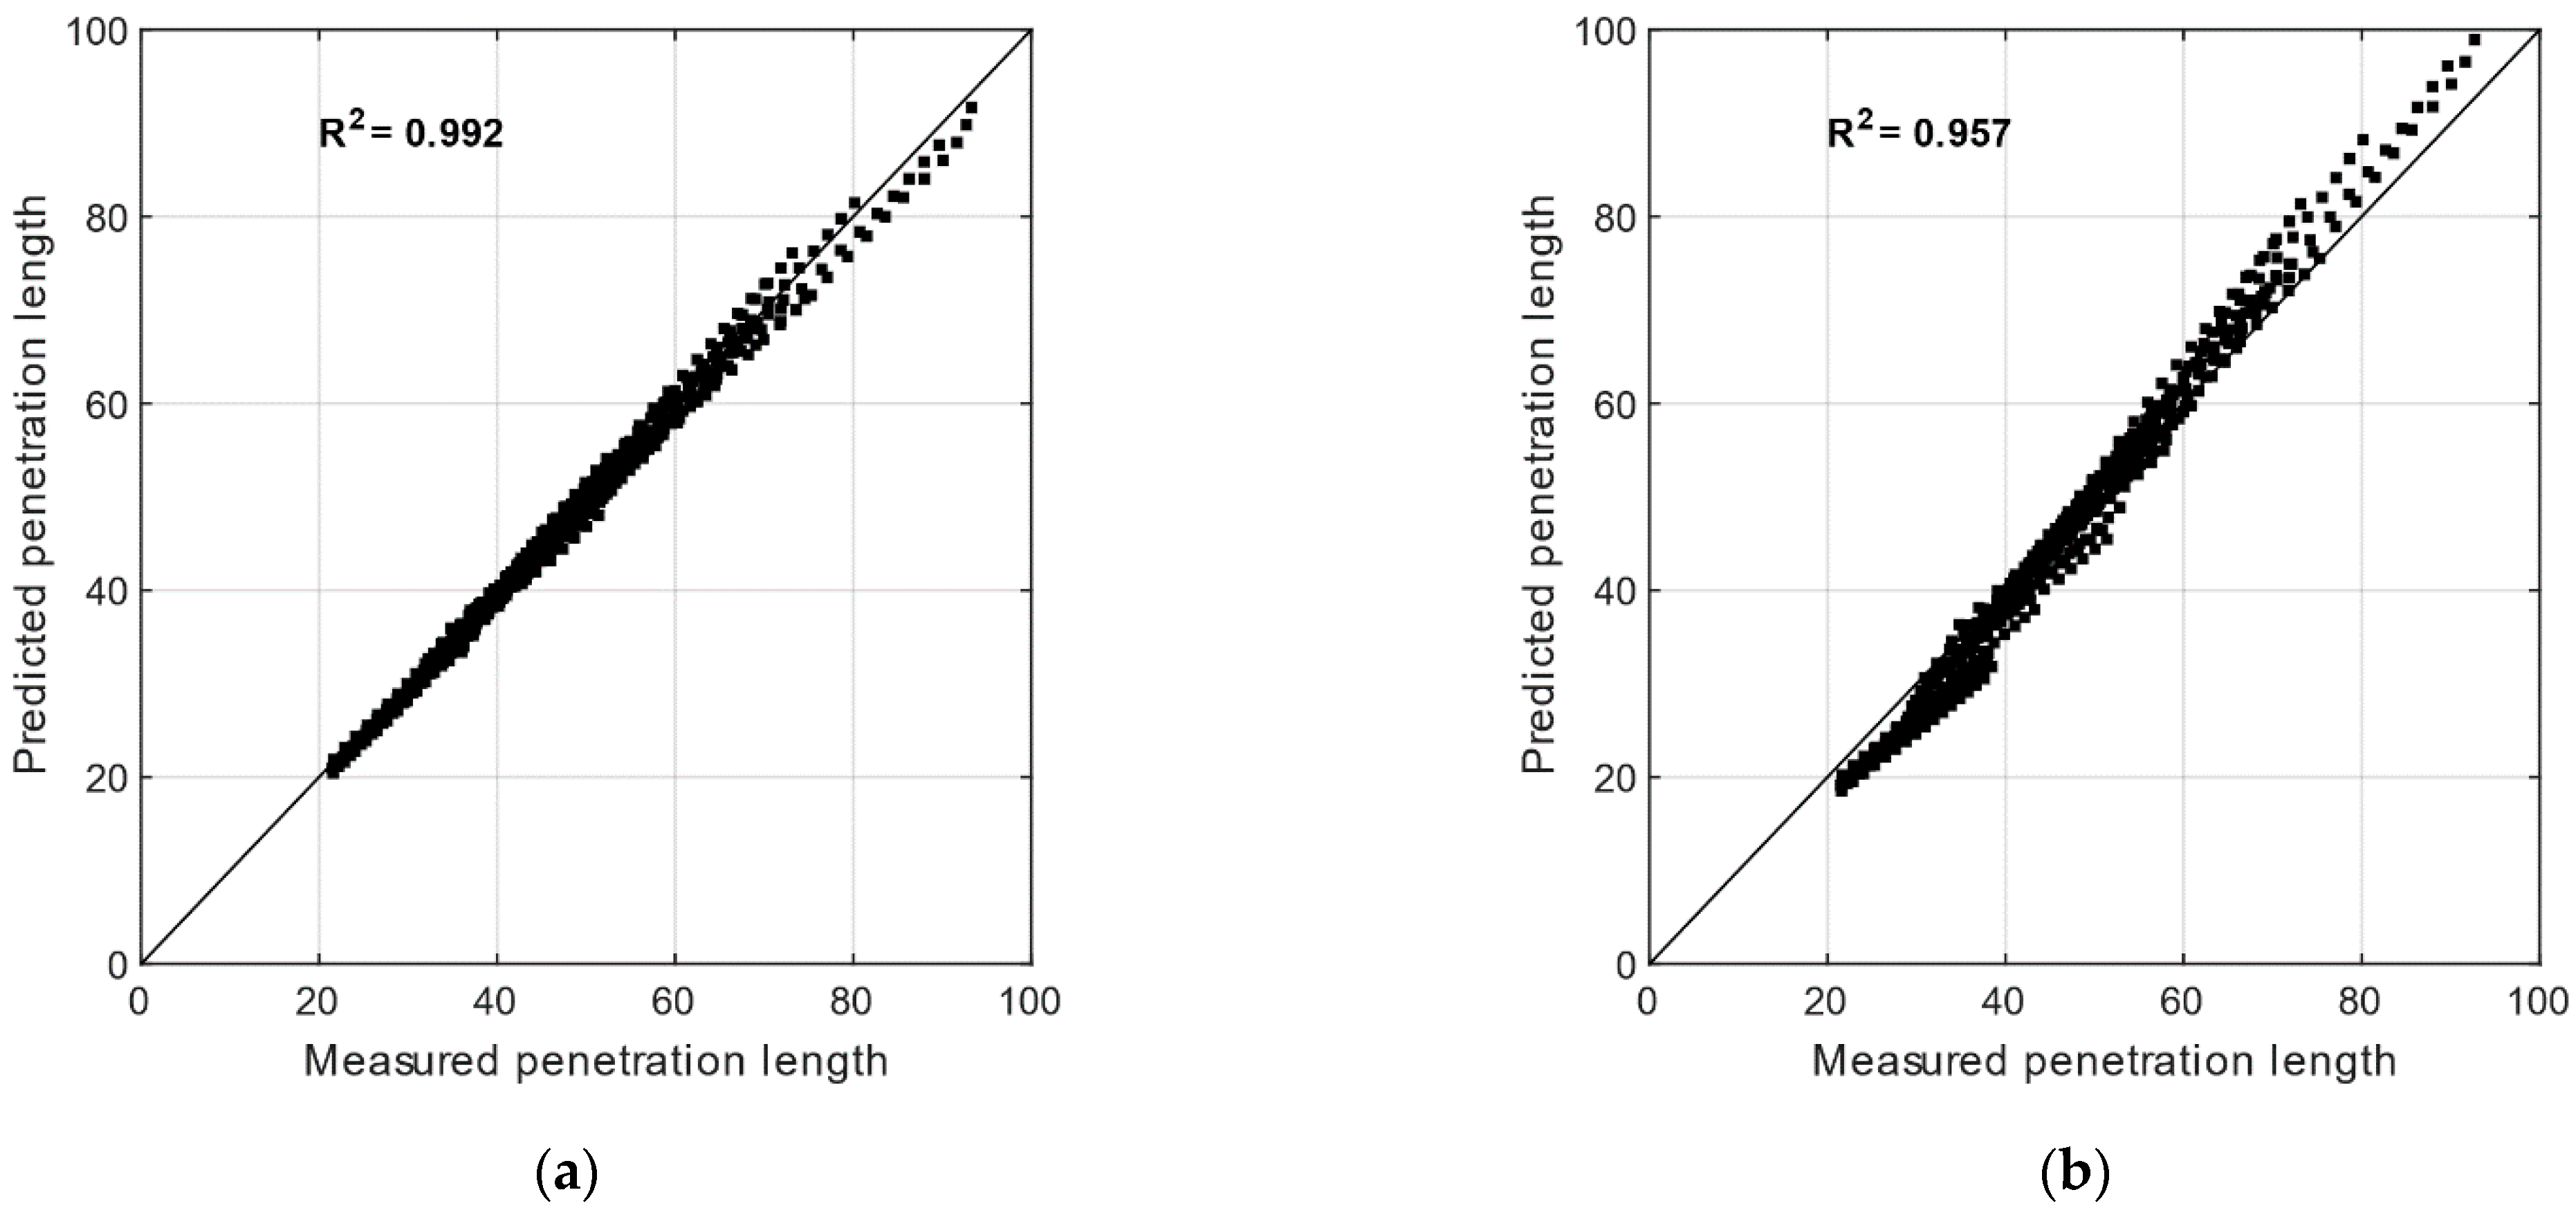
The correlations of the time-dependent parameters a(t) and b(t) in the first case and a(t) in the second case are plotted in Figure 15, with a very good R2 value (above 0.99) when . For t > 1.8 ms, the correlation is distorted since some spray penetrations have reached the wall chamber limit. Generally, the exponent of time is equal to 1.0 or 0.5 before or after for one spray plume [13,30]. However, this relation is for the global spray, which may explain the difference in the exponent found. The predicted penetration lengths for all conditions and fuels are plotted with the measured one for both cases in Figure 16. The accuracy of the correlation is higher in Figure 16a with a R2 = 0.992 than in Figure 16b where the R2 = 0.957. Therefore, the semi-empirical correlation (3) with the two time-dependent parameters provides a very good estimation of the penetration length for the different fuels, even in flash boiling conditions.
This correlation is validated for the ranges of temperature between 20 °C to 120 °C, back pressure between 2 bar to 9.39 bar for ethanol and gasoline, and up to 25 bar for ammonia. However, this correlation is determined only for one injection pression, 120 bar, one fuel temperature (assumed to be 20 °C) and one injector of 7 holes limiting its use but it allows to highlight the sensitivity of the different fuels to the thermodynamic parameters. The relation found by Zeng et al. [27] is also determined at a constant injection pressure of 50 bar with one injector of 2 holes, but shows the dependence to the saturation pressure. The relation developed by Hiroyasu and Arai [29] covers the injection pressure from 750 bar to 1600 bar and the ambient temperature from 600 K to 1400 K, but only for diesel sprays.
4. Conclusions
The spray geometry of ammonia, gasoline, and ethanol was studied for multiple experimental conditions. Spray penetration, spray angle near the injector, and at half penetration length were measured experimentally for both liquid and liquid + vapor phases by using high speed Schlieren imaging. Flash boiling conditions were explored for ammonia at ambient conditions.
The main points are following:
- The geometry of ammonia spray differs from that of gasoline and ethanol, it is longer and thinner under most conditions than the sprays of the current fuels studied. It evolves differently with temperature and changes in air density; overall, gasoline and ethanol have the same characteristics.
- The spray angle at half the penetration length is maximum at the saturation pressure for ammonia.
- A new correlation of penetration length was validated for ammonia, gasoline, and ethanol and for temperatures between 20 °C to 120 °C, back pressures between 2 bar to 9.39 bar for ethanol and gasoline and up to 25 bar for ammonia, an injection pressure of 120 bar and an injector of 7 holes. Their temperature and air density sensitivities were explored and show that ammonia is more sensitive for both parameters than the other fuels.
To adapt ammonia to GDI engines, the condition of ambient temperature and pressure at 20 °C and 7 bar, respectively, seems macroscopically interesting because the spray penetration of ammonia is very close to that of gasoline. The outlet vapor spray angle of ammonia is only 5 degrees lower than that of gasoline in this case and the vapor spray angle at half the penetration length for ammonia is similar to that of gasoline before 45 mm of penetration. However, to respect these conditions, the injection time needs to be below 1.2 ms. Moreover, at 7 bar, the collapse is weak, since the ambient pressure is close to the saturation pressure of ammonia, so the spray is large; the air–fuel mixing is then optimized. However, the spray requirements to guarantee optimum fuel air mixing cannot be clearly defined due to lack of knowledge about atomization process for ammonia spray.
In future work, a higher injection pressure will be generated to assess the evaporation process in conditions close to real use as a function of the injection strategy, in terms of macroscopic parameters together with the droplet size distribution.
Author Contributions
Conceptualization, C.M.-R., C.H. and P.B.; methodology, C.M.-R., C.H., P.B. and R.P.; validation, C.M.-R., C.H., P.B. and R.P.; investigation R.P.; writing—original draft preparation, R.P.; writing—review and editing, C.M.-R., C.H., P.B., J.B. and R.P.; supervision, C.M.-R. All authors have read and agreed to the published version of the manuscript.
Funding
This research received no external funding.
Acknowledgments
The research leading to these results has received funding from the French Government’s “Investissement d’Avenir” program: “Laboratoire d’Excellence CAPRYSSES” (Grant No ANR-11-LABX-0006-01).
Conflicts of Interest
The authors declare no conflict of interest.
References
- United Nation. The Paris Agreement. Available online: http://unfccc.int/files/essential_background/convention/application/pdf/english_paris_agreement.pdf (accessed on 19 January 2021).
- Sacramento, E.M.; Carvalho, P.; Lima, L.C.; Veziroglu, T. Feasibility study for the transition towards a hydrogen economy: A case study in Brazil. Energy Policy 2013, 62, 3–9. [Google Scholar] [CrossRef]
- Li, Y.; Bi, M.; Li, B.; Zhou, Y.; Huang, L.; Gao, W. Explosion hazard evaluation of renewable hydrogen/ammonia/air fuels. Energy 2018, 159, 252–263. [Google Scholar] [CrossRef]
- Dimitriou, P.; Javaid, R. A review of ammonia as a compression ignition engine fuel. Int. J. Hydrogen Energy 2020, 45, 7098–7118. [Google Scholar] [CrossRef]
- Rehbein, M.C.; Meier, C.; Eilts, P.; Scholl, S. Mixtures of Ammonia and Organic Solvents as Alternative Fuel for Internal Combustion Engines. Energy Fuels 2019, 33, 10331–10342. [Google Scholar] [CrossRef]
- Kobayashi, H.; Hayakawa, A.; Somarathne, K.D.K.A.; Okafor, E.C. Science and technology of ammonia combustion. Proc. Combust. Inst. 2019, 37, 109–133. [Google Scholar] [CrossRef]
- Mounaim-Rousselle, C.; Brequigny, P. Ammonia as Fuel for Low-Carbon Spark-Ignition Engines of Tomorrow’s Passenger Cars. Front. Mech. Eng. 2020, 6, 70. [Google Scholar] [CrossRef]
- Lhuillier, C.; Brequigny, P.; Contino, F.; Mounaïm-Rousselle, C. Experimental study on ammonia/hydrogen/air combustion in spark ignition engine conditions. Fuel 2020, 269, 117448. [Google Scholar] [CrossRef]
- Okafor, E.C.; Yamashita, H.; Hayakawa, A.; Somarathne, K.D.K.A.; Kudo, T.; Tsujimura, T.; Uchida, M.; Ito, S.; Kobayashi, H. Flame stability and emissions characteristics of liquid ammonia spray co-fired with methane in a single stage swirl combustor. Fuel 2020, 287, 119433. [Google Scholar] [CrossRef]
- Montanaro, A.; Allocca, L. Study of Liquid and Vapor Phases of a GDI Spray. Combust. Sci. Technol. 2019, 191, 1600–1608. [Google Scholar] [CrossRef]
- Xu, M.; Zhang, Y.; Zeng, W.; Zhang, G.; Zhang, M. Flash Boiling: Easy and Better Way to Generate Ideal Sprays than the High Injection Pressure. SAE Int. J. Fuels Lubr. 2013, 6, 137–148. [Google Scholar] [CrossRef]
- Chang, M.; Lee, Z.; Park, S.; Park, S. Characteristics of flash boiling and its effects on spray behavior in gasoline direct injection injectors: A review. Fuel 2020, 271, 117600. [Google Scholar] [CrossRef]
- Naber, J.D.; Siebers, D.L. Effects of gas density and vaporization on penetration and dispersion of diesel sprays. SAE Tech. Pap. 1996, 105, 82–111. [Google Scholar]
- Chang, M.; Park, J.H.; Kim, H.I.; Park, S. Flash boiling macroscopic spray characteristics of multi-hole direct injection injectors with different hole arrangement. Appl. Therm. Eng. 2020, 170, 114969. [Google Scholar] [CrossRef]
- Lacey, J.; Poursadegh, F.; Brear, M.J.; Gordon, R.; Petersen, P.; Lakey, C.; Butcher, B.; Ryan, S. Generalizing the behavior of flash-boiling, plume interaction and spray collapse for multi-hole, direct injection. Fuel 2017, 200, 345–356. [Google Scholar] [CrossRef]
- Wang, L.; Wang, F.; Fang, T. Flash boiling hollow cone spray from a GDI injector under different conditions. Int. J. Multiph. Flow 2019, 118, 50–63. [Google Scholar] [CrossRef]
- Zhang, G.; Xu, M.; Zhang, Y.; Hung, D.L.S. Characteristics of flash boiling fuel sprays from three types of injector for spark ignition direct injection (SIDI) engines. Lect. Notes Electr. Eng. 2013, 189, 443–454. [Google Scholar]
- Chang, M.; Park, S. Spray characteristics of direct injection injectors with different nozzle configurations under flash-boiling conditions. Int. J. Heat Mass Transf. 2020, 159, 120104. [Google Scholar] [CrossRef]
- Bar-Kohany, T.; Levy, M. State of the art review of flash-boiling atomization. At. Sprays 2016, 26, 1259–1305. [Google Scholar] [CrossRef]
- Dernotte, J. Influence des Propriétés Physico-Chimiques des Hydrocarbures sur l’Injection et la Combustion Diesel. Available online: https://hal.archives-ouvertes.fr/tel-00752061/ (accessed on 16 February 2021).
- Nilaphai, O.; Hespel, C.; Chanchaona, S.; Mounaïm-Rousselle, C. Spray and Combustion Characterization of the Alcohol Blends in the High-Pressure High-Temperature Conditions. In Proceedings of the ILASS–Asia 2017, Jeju, Korea, 18–21 October 2017. [Google Scholar]
- Otsu, N. A Threshold Selection Method from Gray-Level Histograms. IEEE Trans. Syst. Man Cybern. 1979, 9, 62–66. [Google Scholar] [CrossRef] [Green Version]
- Huang, Y.; Huang, S.; Huang, R.; Hong, G. Spray and evaporation characteristics of ethanol and gasoline direct injection in non-evaporating, transition and flash-boiling conditions. Energy Convers. Manag. 2016, 108, 68–77. [Google Scholar] [CrossRef] [Green Version]
- Toolbox Website. Ammonia—Vapour Pressure at Gas-Liquid Equilibrium. Available online: https://www.engineeringtoolbox.com/ammonia-pressure-temperatured_361.html (accessed on 11 November 2020).
- Payri, R.; Salvador, F.J.; Martí-Aldaraví, P.; Vaquerizo, D. ECN Spray G external spray visualization and spray collapse description through penetration and morphology analysis. Appl. Therm. Eng. 2017, 112, 304–316. [Google Scholar] [CrossRef]
- Lee, M.Y.; Lee, G.S.; Kim, C.J.; Seo, J.H.; Kim, K.H. Macroscopic and microscopic spray characteristics of diesel and gasoline in a constant volume chamber. Energies 2018, 11, 2056. [Google Scholar] [CrossRef] [Green Version]
- Zeng, W.; Xu, M.; Zhang, G.; Zhang, Y.; Cleary, D.J. Atomization and vaporization for flash-boiling multi-hole sprays with alcohol fuels. Fuel 2012, 95, 287–297. [Google Scholar] [CrossRef]
- Guo, H.; Ding, H.; Li, Y.; Ma, X.; Wang, Z.; Xu, H.; Wang, J. Comparison of spray collapses at elevated ambient pressure and flash boiling conditions using multi-hole gasoline direct injector. Fuel 2017, 199, 125–134. [Google Scholar] [CrossRef]
- Hiroyasu, H.; Arai, M. Structures of Fuel Sprays in Diesel Engines. SAE Tech. Pap. Ser. 1990, 99, 1050–1061. [Google Scholar]
- Du, J.; Mohan, B.; Sim, J.; Fang, T.; Roberts, W.L. Experimental and analytical study on liquid and vapor penetration of high-reactivity gasoline using a high-pressure gasoline multi-hole injector. Appl. Therm. Eng. 2019, 163, 114187. [Google Scholar] [CrossRef] [Green Version]
- Dent, J.C. A basis for the comparison of various experimental methods for studying spray penetration. SAE Tech. Pap. 1971, 80, 1881–1884. [Google Scholar]
Figure 1.
View of the spray chamber with optical accesses.

Figure 2.
Scheme of the experimental and optical setup; 1 Light ED source; 2 and 5 Concave mirrors; 3 Chamber; 4 Injector; 6 Plane mirror; 7 Adjustable diaphragm; 8 CMos FastCam (High speed camera).
Figure 2.
Scheme of the experimental and optical setup; 1 Light ED source; 2 and 5 Concave mirrors; 3 Chamber; 4 Injector; 6 Plane mirror; 7 Adjustable diaphragm; 8 CMos FastCam (High speed camera).

Figure 3.
Definition of spray characteristics for liquid spray of gasoline as an example, (a) Raw image, (b) Binarized image, (c) Rotated image and (d) Calculations.
Figure 3.
Definition of spray characteristics for liquid spray of gasoline as an example, (a) Raw image, (b) Binarized image, (c) Rotated image and (d) Calculations.


Figure 4.
Experimental conditions and vapor pressure curves of gasoline, ethanol [23], and ammonia [24].

Figure 5.
Comparison of spray shape, 1 ms after the start of injection, obtained for liquid and liquid + vapor—left column: ammonia, middle column: gasoline, right column: ethanol—for 2 air density conditions and 3 ambient temperatures, 1ms after injection. The yellow section corresponds to flash boiling.

Figure 6.
Comparison of spray penetration for ammonia (continuous line), gasoline (dashed line), and ethanol (dotted line), (a) Tair = 20 °C and Pair = 2 bar, (b) Tair = 20 °C and Pair = 7 bar, (c) Tair = 120 °C and Pair = 2.69 bar, and (d) Tair = 120 °C and Pair = 9.39 bar.
Figure 6.
Comparison of spray penetration for ammonia (continuous line), gasoline (dashed line), and ethanol (dotted line), (a) Tair = 20 °C and Pair = 2 bar, (b) Tair = 20 °C and Pair = 7 bar, (c) Tair = 120 °C and Pair = 2.69 bar, and (d) Tair = 120 °C and Pair = 9.39 bar.

Figure 7.
Comparison of spray angle near the injector for ammonia (continuous line), gasoline (dashed line) and ethanol (dotted line), (a) Tair = 20 °C and Pair = 2 bar, (b) Tair = 20 °C and Pair = 7 bar, (c) Tair = 120 °C and Pair = 2.69 bar, and (d) Tair = 120 °C and Pair = 9.39 bar.
Figure 7.
Comparison of spray angle near the injector for ammonia (continuous line), gasoline (dashed line) and ethanol (dotted line), (a) Tair = 20 °C and Pair = 2 bar, (b) Tair = 20 °C and Pair = 7 bar, (c) Tair = 120 °C and Pair = 2.69 bar, and (d) Tair = 120 °C and Pair = 9.39 bar.

Figure 8.
Comparison at Tair = 120 °C between low air density (open grey symbol) and high air density (closed black symbol) of liquid + vapor spray angle near the injector for ammonia (continuous line), gasoline (dashed line), and ethanol (dotted line).
Figure 8.
Comparison at Tair = 120 °C between low air density (open grey symbol) and high air density (closed black symbol) of liquid + vapor spray angle near the injector for ammonia (continuous line), gasoline (dashed line), and ethanol (dotted line).

Figure 9.
Comparison of spray angle at half the penetration length for ammonia (continuous line), gasoline (dashed line) and ethanol (dotted line), (a) Tair = 20 °C and Pair = 2 bar, (b) Tair = 20 °C and Pair = 7 bar, (c) Tair = 120 °C and Pair = 2.69 bar, and (d) Tair = 120 °C and Pair = 9.
Figure 9.
Comparison of spray angle at half the penetration length for ammonia (continuous line), gasoline (dashed line) and ethanol (dotted line), (a) Tair = 20 °C and Pair = 2 bar, (b) Tair = 20 °C and Pair = 7 bar, (c) Tair = 120 °C and Pair = 2.69 bar, and (d) Tair = 120 °C and Pair = 9.

Figure 10.
Schematic explanation of the relation between spray geometry and spray angle at half the penetration length, (a) constant spray angle, (b) decrease in spray angle and (c) constant spray angle and then decrease in spray angle.
Figure 10.
Schematic explanation of the relation between spray geometry and spray angle at half the penetration length, (a) constant spray angle, (b) decrease in spray angle and (c) constant spray angle and then decrease in spray angle.

Figure 11.
Effect of Pa/Ps on spray penetration for ethanol and ammonia under various fuel temperatures and ambient pressure conditions from [27] and this study.
Figure 11.
Effect of Pa/Ps on spray penetration for ethanol and ammonia under various fuel temperatures and ambient pressure conditions from [27] and this study.

Figure 12.
Effect of flash boiling on the liquid + vapor spray angle at half the penetration length for a penetration length of 40 mm.
Figure 12.
Effect of flash boiling on the liquid + vapor spray angle at half the penetration length for a penetration length of 40 mm.

Figure 13.
Comparison of angle at half the penetration length for vapor + liquid spray of ammonia for a penetration length of 40 mm.
Figure 13.
Comparison of angle at half the penetration length for vapor + liquid spray of ammonia for a penetration length of 40 mm.

Figure 14.
Example at t = 1 ms of the relationship between vapor + liquid spray penetration and air density, temperature, and pressure.
Figure 14.
Example at t = 1 ms of the relationship between vapor + liquid spray penetration and air density, temperature, and pressure.

Figure 15.
Correlations of the temporal coefficients, (a) correlation with two time-dependent parameters, and (b) correlation with only one time-dependent parameter.
Figure 15.
Correlations of the temporal coefficients, (a) correlation with two time-dependent parameters, and (b) correlation with only one time-dependent parameter.

Figure 16.
Predicted VS measured values for all fuels during the adequate period, (a) correlation with two time-dependent parameters, and (b) correlation with only one time-dependent parameter.
Figure 16.
Predicted VS measured values for all fuels during the adequate period, (a) correlation with two time-dependent parameters, and (b) correlation with only one time-dependent parameter.


Table 1.
Experimental conditions for all fuels.
| Ambient Temperature (°C) | Ambient Pressure (bar) | Air Density (kg/m3) |
|---|---|---|
| 20 | 2 | 2.38 |
| 4 | 4.76 | |
| 7 | 8.32 | |
| 80 | 2.41 | 2.38 |
| 4.82 | 4.76 | |
| 8.43 | 8.32 | |
| 120 | 2.69 | 2.38 |
| 5.37 | 4.76 | |
| 9.39 | 8.32 |
Table 2.
Experimental conditions for ammonia only.
| Ambient Temperature (°C) | Ambient Pressure (bar) | Air Density (kg/m3) |
|---|---|---|
| 20 | 10 | 11.88 |
| 15 | 17.82 | |
| 22.68 | 26.99 | |
| 30 | 23.45 | |
| 40 | 24.23 | 26.99 |
| 50 | 25 | |
| 20 | 25 | 29.75 |
| 30 | 28.77 | |
| 40 | 27.85 | |
| 50 | 26.99 |
Table 3.
Exponent coefficients of ammonia, gasoline, and ethanol.
| Fuel | af | bf | cf | af + cf | cf − bf |
|---|---|---|---|---|---|
| Ammonia | −1.41 | 0.53 | 0.99 | −0.42 | 0.46 |
| Gasoline | −1.39 | 1.35 | 1.05 | −0.34 | −0.30 |
| Ethanol | −1.28 | 1.15 | 0.94 | −0.34 | −0.21 |
Publisher’s Note: MDPI stays neutral with regard to jurisdictional claims in published maps and institutional affiliations. |
© 2021 by the authors. Licensee MDPI, Basel, Switzerland. This article is an open access article distributed under the terms and conditions of the Creative Commons Attribution (CC BY) license (https://creativecommons.org/licenses/by/4.0/).
Share and Cite
MDPI and ACS Style
Pelé, R.; Mounaïm-Rousselle, C.; Bréquigny, P.; Hespel, C.; Bellettre, J. First Study on Ammonia Spray Characteristics with a Current GDI Engine Injector. Fuels 2021, 2, 253-271. https://0-doi-org.brum.beds.ac.uk/10.3390/fuels2030015
AMA Style
Pelé R, Mounaïm-Rousselle C, Bréquigny P, Hespel C, Bellettre J. First Study on Ammonia Spray Characteristics with a Current GDI Engine Injector. Fuels. 2021; 2(3):253-271. https://0-doi-org.brum.beds.ac.uk/10.3390/fuels2030015
Chicago/Turabian StylePelé, Ronan, Christine Mounaïm-Rousselle, Pierre Bréquigny, Camille Hespel, and Jérôme Bellettre. 2021. "First Study on Ammonia Spray Characteristics with a Current GDI Engine Injector" Fuels 2, no. 3: 253-271. https://0-doi-org.brum.beds.ac.uk/10.3390/fuels2030015