
Development and Evaluation of Simulation-Based Low Carbon Mobility Assessment Models


1
Traffic Team (M80 Upgrade Project), CPB Contractors, Melbourne 3000, Australia
2
Department of Civil and Construction Engineering, Swinburne University of Technology, Hawthorn 3122, Australia
*
Author to whom correspondence should be addressed.
Future Transp. 2021, 1(2), 134-153; https://0-doi-org.brum.beds.ac.uk/10.3390/futuretransp1020009
Submission received: 7 May 2021
/
Revised: 30 May 2021
/
Accepted: 9 June 2021
/
Published: 5 July 2021
Abstract
:The transport sector is a significant contributor to global emissions. In Australia, it is the third largest source of greenhouse gases and is responsible for around 17% of emissions with passenger cars accounting for around half of all transport emissions. Governments at all levels have identified a need for a reduction in transport carbon emissions to meet their net zero emissions targets. This research aims to help decision makers estimate the carbon footprint of transport networks within their jurisdictions and evaluate the impacts of emission-reduction interventions, through development of a simulation-based low carbon mobility assessment model. The model was developed based on a framework that integrates multiple mobility components including individual travel preferences, traffic simulation, and an assessment interface to create a seamless tool for the end-user. The feasibility of the assessment model was demonstrated in a case study for a local city council in Melbourne. In one of many scenarios reported in this paper, the model showed that maintaining current levels of emissions would require a 20% reduction in vehicle trips by 2030, and a much larger reduction would be required to reduce the levels of greenhouse gas emissions and achieve desired emissions reduction targets. The paper concludes with recommendations and future directions to extend the model’s capabilities and applications.
1. Introduction
The transport sector contributes significantly to global emissions and presents challenges to both developed and emerging economies. In Australia, for example, it is the third largest source of emissions and is responsible for around 17% of greenhouse gases with passenger cars accounting for approximately half of all transport emissions. Transport is also one of the highest emissions growth factors in Australia with emissions from transport increasing more than any other sector, by nearly 60% since 1990. The Australian Government and various infrastructure bodies and organisations have already identified a need for a reduction in transport carbon emissions citing Australia as one of the world’s highest polluting countries.
This paper is a result of a research initiative that aimed to address the problem of transport emissions by developing and evaluating a new model to help decision-makers at local governments levels to estimate current carbon impacts of the transport networks within the boundaries of their municipalities, and to evaluate the impacts and reductions resulting from proposed interventions.
The model was developed based on a framework that integrates multiple components which work together to create a seamless modelling framework for the end-user. Although it relies on a complex traffic simulation component, it has a user-friendly and easy to use interface that makes it appealing for use by decision makers. The key components of the tool include a travel preference survey, a traffic simulation model, and the digital assessment interface. To help evaluate the model, a pilot study of the Port Phillip Council in Melbourne was completed to demonstrate the benefits.
1.1. Transport and the Environment
The impact of transport carbon emissions (and other greenhouse gases) has been well documented in literature over recent decades particularly the negative impact on the environment because of excessive pollution [1,2]. The level of pollution generated in Australia is much higher than many other nations, such as the United Kingdom [3]. This is likely attributed to several factors including the reduced density of Australian cities and typically much longer commutes.
Transportation activities contribute to a significant portion of the emissions released into the atmosphere including 20% of the carbon dioxide emissions [4]. Australia has one of the world’s highest per capita greenhouse gas emissions [5]. Infrastructure-related emissions in Australia account for half of the country’s overall greenhouse gas emissions, with the transport sector accounting for 17% [6]. Personal transportation is constantly reported to be the largest emission contributor to this sector [7].
Results from the 2013–2016 Victorian Integrated Survey of Travel and Activity show that private passenger trips comprise 74% of all trips across Victoria [8]. This high level of private trips directly relates to a higher levels of energy consumption and carbon emissions, with up to 98% of the energy used in transportation in Melbourne attributed to private transport [3]. Because transportation has a significant impact on economic, social, and environmental impacts, it is, therefore, an important factor to consider when developing sustainable and low carbon cities [4].
1.2. Low Carbon Mobility Solutions
Low carbon mobility solutions refer to a range of interventions that have received popular acceptance in recent years in cities around the world. These include the use of more sustainable modes of transport, such as public transport (including trains, trams and buses), as well as more fuel-efficient combustion engine vehicles and electric or hybrid vehicles. Low carbon mobility solutions also include more reliance on micro-mobility interventions, such as the use of bicycles and scooters both privately owned, as well as those offered on leased or shared basis through leasing and rental companies which in recent years has been facilitated significantly through the sharing economy and use of apps and digital innovations in urban mobility.
The changing behaviours towards sustainable transport and the environment is providing new opportunities to address emissions within the transport industry. In particular, advanced transport technologies and new business models, both established and emerging, offer opportunities to reduce reliance on private vehicles and promote more sustainable modes of transport. These include the use of emerging mobility solutions, such as micro-mobility, car sharing, and ride sharing to bridge the car dependency gap. Planning also plays a key part in the development and widespread use of these transportation solutions. This study is well-aligned with these directions and proposes a digital assessment model to help with planning for widespread deployment and adoption of low carbon mobility interventions at a precinct or municipality level.
Improving the sustainability of infrastructure can simply mean finding better ways to use them more efficiently, and technology can play an important role in realising this objective. In transport, this entails making better use of network capacity by spreading peak demand or moving passengers and freight to the most suitable and most energy- efficient modes, thus saving time and reducing travel costs for all users [9].
One of the opportunities available for developing a sustainable transport network is through better utilisation of existing assets [10]. Most vehicles, and specifically private cars, typically spend more than 90% of the time parked, with usage restrained to the morning and evening commute periods. Car sharing and ride sharing open up the use of this asset. There are numerous car sharing models today ranging from the prominent car rental model, to the new emerging peer-to-peer marketplace model, and many hybrid models in-between [11]. These models can be classified as business to customer models, and peer to peer models [12].
Empirical evidence shows that car sharing has a direct impact on the reduction in vehicle ownership, and can provide numerous environmental, societal, and transportation benefits such as reduced congestion and carbon emissions [11,13]. Some studies have shown that each additional car share vehicle added to a transport network replaces between 4.6 and 20 private vehicles [14] and, thus, results in less congestion and pollution.
Consistent with the benefits of car sharing, including reduced car ownership, some government councils within Melbourne are allowing developments with a provision of car parking below the statutory limit outlined in the Victorian Planning Scheme due to the proximity and availability of car share and in some cases dedicated car sharing facilities on-site [15].
Furthermore, the natural evolution of the sharing economy is the inclusion of bikes under a similar scheme to car sharing. Bike-sharing is available in a few places around the world, where a bike can be hired via a mobile app to allow cyclists to travel quickly around the city [16]. Many cities around the world, including Melbourne, have witnessed a variety of bike sharing schemes over the years trying to tackle the last mile (or first mile) problem. The City of Melbourne and surrounding councils started with a government backed bike and docking system [17] which was followed by a commercial dockless bike rental service, oBike, but both services have since ceased operation. There are, currently, ongoing trials of the Jump eBike service in collaboration with the City of Melbourne [18]. Elsewhere, bike share and scooter share programs are becoming popular and may be displacing some of the shorter traffic trips [19]. An increase in active transport levels is associated with improvements in access and mobility, liveability, environment quality, road safety, and health [20].
Another vehicle sharing scheme is carpooling which is the sharing of a trip so that only one vehicle and one driver is required. This commonly occurs when two people need to reach the same destination, and both start the trip nearby to each other. Ride sharing as we know it today was developed from these principles of carpooling. Ride sharing is the dynamic matching of supply to demand where the process occurs in real-time and is often facilitated through the use of an app [21,22].
Aside from continuous technical advancements and fuel efficiency increases, the introduction of new mass-produced electric vehicles has become one of the most significant developments in the automotive industry. Electric vehicles found recent popularity and uptake largely thanks to car manufacturers, such as Tesla and Toyota, who have been producing electric only and electric hybrid vehicles for a number of years. As early as 1974, Australia was considering the adoption of electric vehicles to reduce the country’s reliance on imported fuels [23]. Although electric vehicles are generally seen as a no emission transport option, the emissions created as a by-product for the generation of electricity also need to also be considered [24,25]. Adopting electric vehicles for certain regions may also see an increase in greenhouse gases depending on how the electricity is generated [26]. Furthermore, electric vehicles may not necessarily reduce congestion if the same patterns of private vehicle ownership and low occupancy travel persist.
Overall, significant strides are being made in the transportation industry to lessen the carbon impact of the industry as a whole. The digital revolution brought new car ownership and service models with the advent of car sharing and ride sharing allowing for a reduction in car ownership without losing out on the personal benefits. Some of these transformations have been driven by policy. For example, European Commission emission standards which require technological progress, resulted in production and sale of new cars and trucks emitting less emissions than before. The availability of partially sustainable fuel sources, such as Ethanol blended fuel, is also helping to reduce emissions.
Previous solutions to solving transport problems have slowly started to lose the impact that they once commanded [27]. The simple equation of solving traffic congestion with additional road capacity is no longer true, nor is it sustainable or does it improve mobility in cities [28]. New approaches are needed, and this work aims to develop the modelling tools to help evaluate their impacts.
1.3. Low Carbon Mobility Policy Assessment Models
To successfully implement low carbon mobility initiatives and maintain momentum and successful behavioural changes, major policy, technological, and behavioural changes are required. To ensure the developed policies achieve the desired outcomes, policymaking must be guided by proven science. Typically these policies target one of three key areas: “Avoid”, “Shift”, “Improve”. The “Avoid” policies generally work at the macro level and target initiatives to avoid or reduce the need for travel. The “Shift” policies also generally work the macro level and focus on transitioning travel from high energy-intensive modes of transport to lower or more efficient modes (e.g., cycling or public transport). The “Improve” policies are aimed at technological or infrastructure improvements to improve operations and reduce energy consumption, and are, thus, generally more suited as micro level interventions. More recently a fourth area of policies “Share” has started to emerge. The “Share” policies focus on overcoming barriers to promote a shift to shared modes of travel (e.g., ride sharing or carpooling) and are good strategies for both macro and micro level interventions [25].
Even though some policy solutions have been very successful in encouraging innovation and technical advancement, the benefits achieved have ultimately been eroded as vehicle numbers have increased and the desire for larger and heavier cars have also increased [29]. Similarly, policies intended to improve fuel efficiency of cars can have undesired rebound effects where they encourage more driving (because drivers perceive travel is more economical) and, thus, the desired reduction in fossil fuel consumption is not achieved [30].
To address these issues, carbon reduction assessment models have gained popularity as public understanding of greenhouse gases has grown. Governments, conservation groups, and even universities have created numerous low carbon mobility digital assessment tools that allow for evaluating impacts at both the micro and macro levels [7]. These tools vary in their level of sophistication and theoretical underpinnings which may limit their applications and widespread adoption by different stakeholders, particularly if the evidence-base used in their development is not verified or well-established and understood.
This paper extends previous work in this field and presents the development and evaluation of an advanced and transparent simulation-based low carbon mobility assessment model, and demonstrates its feasibility using a case study for Melbourne.
2. Methodology and Research Framework
Emissions mitigation assessment models are important tools for communicating carbon impacts [31] and can result in a range of impacts from behavioural changes (with personal calculators) through to evidence base to support policy changes [32]. These models have witnessed a surge in popularity in the transport sector over the past decade as a result of increased public awareness of transport emissions [7]. Although the results of these models are vastly different between each other, they help individual users to monitor and reduce their carbon impacts [33]. These models also have different areas of focus such as personal, household, or business carbon footprints, while others focus on more specific transport aspects, such as freight or heavy vehicle transport. Some of the transport focused models that were reviewed before embarking on this study included the Share Benefits Mobility Calculator [34], Green Star Sustainable Transport Calculator [35], Trip Reduction Impacts of Mobility Management Strategies (TRIMMS) [36], and Walk Score [37]. Some of these tools provide qualitative results and are only suitable for comparison with other projects that have also been assessed with the same tool.
To improve the level of accuracy and consistency of a carbon footprint models, the data and methodology should be based on evidence and on results obtained from scholarly literature [7]. Furthermore, these tools typically rely on static datasets. Some studies have also developed frameworks that integrate multiple dynamic models to produce more accurate results than the static framework counterparts [38].
Whilst most existing carbon and emissions estimation models are based on static datasets, research has shown that frameworks that integrate multiple dynamic models together yield more accurate results [38]. This study investigates a new digital assessment tool that can respond to changes in the transport environment dynamically. This framework incorporates a dynamic traffic simulation model to improve the accuracy of the results [39,40,41,42,43,44]. Whilst the core components are well-established and tested, the overall framework links together complex models to improve the accuracy and quality of results.
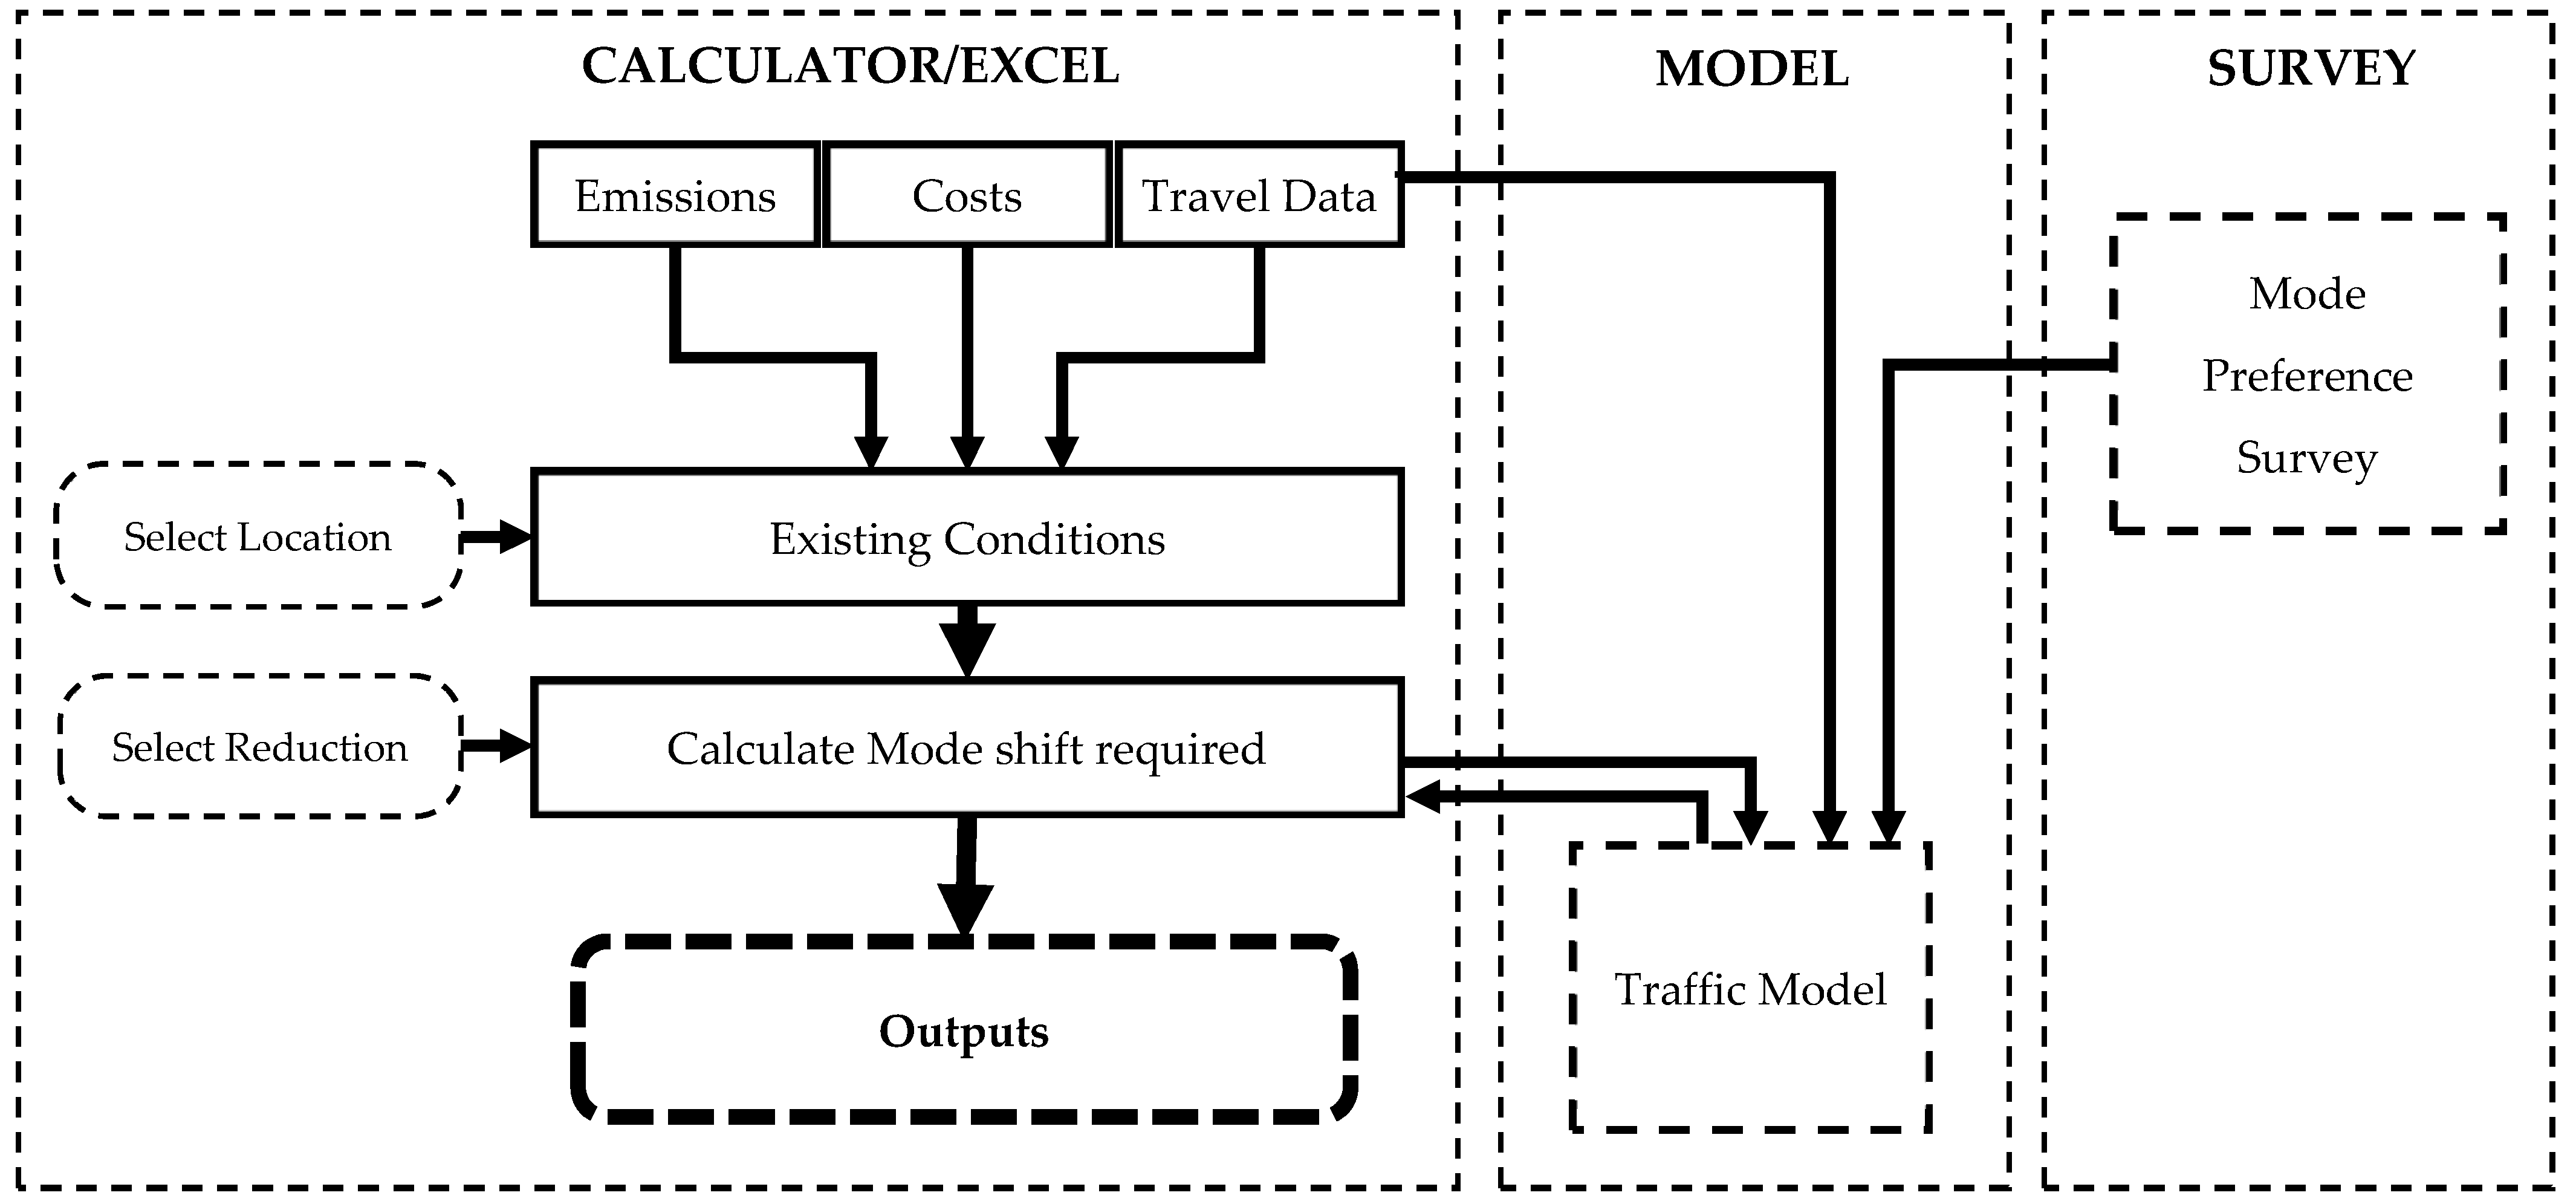
The digital assessment framework (Figure 1) comprises three key modules: A travel preference survey, a traffic simulation model, and an assessment calculator. These three modules integrate with each other to provide an adjusted travel mode composition of the study area being assessed, and the carbon impacts following the reduction in private vehicle trips.
2.1. Study Area
The study area selected for this research was the Port Philip City Council in the inner part of Metropolitan Melbourne (Figure 2). A total of 1.2 million trips are generated from and attracted to Port Phillip Council every day. The majority of these trips are internal to the council, with 68% of the trips remaining within the council boundaries. The remainder of the trips are external trips with the most prominent movement being to or from the City of Melbourne (9.2% of all trips). An investigation into the existing mode share for Port Phillip Council showed a dominant mode of private vehicle accounting for 57.6% of all trips. This council study area provided a valuable opportunity for a case study to be conducted to demonstrate the benefits of the low carbon mobility digital assessment model where even a small increase in low carbon trips would displace a large portion of private cars from the road and result in a sizeable decrease in carbon emissions in the study area.
2.2. Traffic Redistribution: Travel Preference Survey
To ensure high-quality results, a robust travel preferences survey was completed for the study area under consideration. This research started with a considerable review of available relevant data. In recent times, Australia has been conducting a compulsory national census every five years that achieves a completion rate of 95% but that includes limited information about travel habits [45,46]. Detailed travel studies in comparison may only contain up to 5000 results, or only 0.02% of a population. The review also found that detailed travel studies are conducted at the state level as part of the planning for infrastructure and public transport developments. In Melbourne, the Victorian Government completes travel surveys sporadically with the most recent study being a four-year study collecting results from 4000 households each year [8]. The data collection methods vary between survey types with different studies adopting different approaches. Transport for NSW [47] completes face-to-face interviews to collect results whilst Statistics Netherlands, for example, initially completes face-to-face interviews to collect data but over the years have transitioned between various methods to try to capture the most amount of data [48]. The Victorian Department of Transport’s [8] approach was to provide self-completion paper-based or online-based travel diaries, however these were found to have a low completion rate and follow up phone calls where completed to prompt a higher response rate [49,50].
For the development of the low carbon mobility digital assessment model for this study, a different approach was taken, and it was important to undertake a local travel preferences survey to provide data specific the target council area. This was intended to reduce reliance on generalised datasets from previous studies from other cities, states, or countries, as is the case with some other low carbon mobility calculators reported in the literature.
2.2.1. Survey Design
The travel preferences survey designed for this study adopted several key principles to achieve its objectives which included the need for simple, short, relevant, and targeted approach to ensure quality data are collected.
The survey was essentially designed to capture trip preference data and included questions about each participant’s current mode of travel, and what their second preference or backup travel mode would be.
The primary method of data collection was online, followed up by a letter drop to attract as many geographic-specific results as possible. Media posts through online newsletters via several local channels were also used to attract as large a response as possible.
It is also important to note that in order to understand the requirements of the end-users, namely the council that will be using the models, consultations with Port Phillip Council were also undertaken. The outcomes of the consultation benefited the survey design as the council mainly intended for the models to be used for development of polices based on the provided evidence; and for the results to be used for community consultation and communication by providing evidence about the current situation and impacts of potential low carbon interventions.
2.2.2. Survey Results
At the conclusion of the survey period there were 127 eligible responses from a total of 159 submitted surveys. The survey returned an excellent sample of participants across all age groups for the study area under consideration. There was a particularly large percentage of respondents from the 25–34 age group, which is likely related to the type of audience engaging with the online platforms where the survey was promoted.
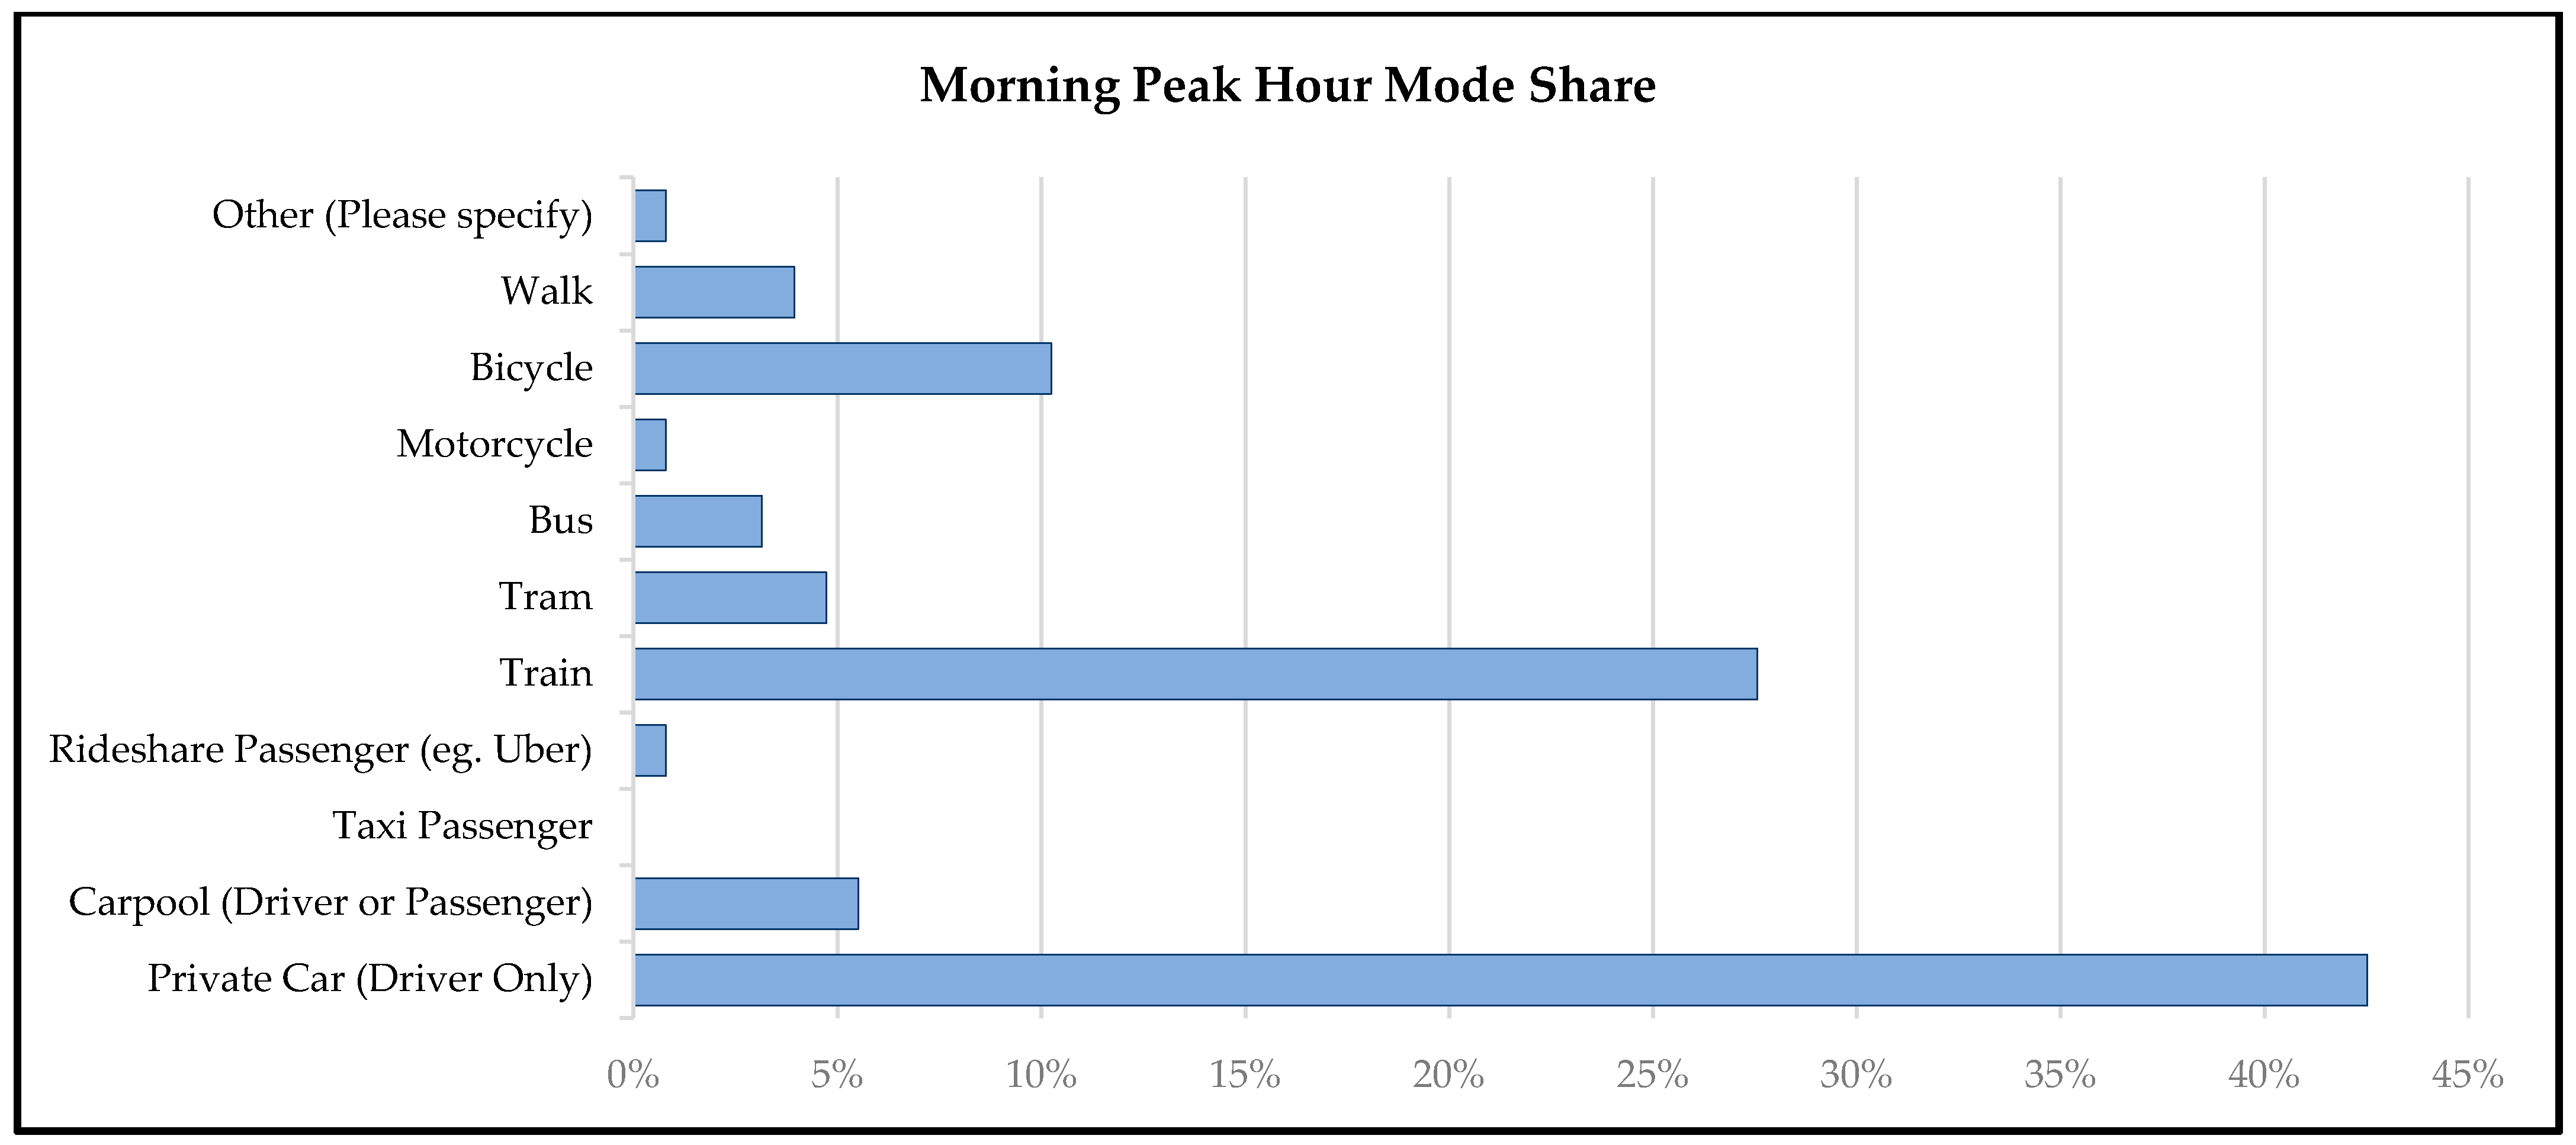
To develop a travel redistribution matrix, information about the morning peak hour trips were collected, as shown in Figure 3. This part of the survey asked respondents to state their current mode of transport and trip purpose. As expected, the results showed the primary purpose for morning trips is travelling to and from work (92% of responses) and also around 40% of those surveyed travelled in a single occupant vehicle. These are important considerations to acknowledge at the start as they would influence how the end-users might determine the type of alternative travel modes most suited to their particular travel needs.
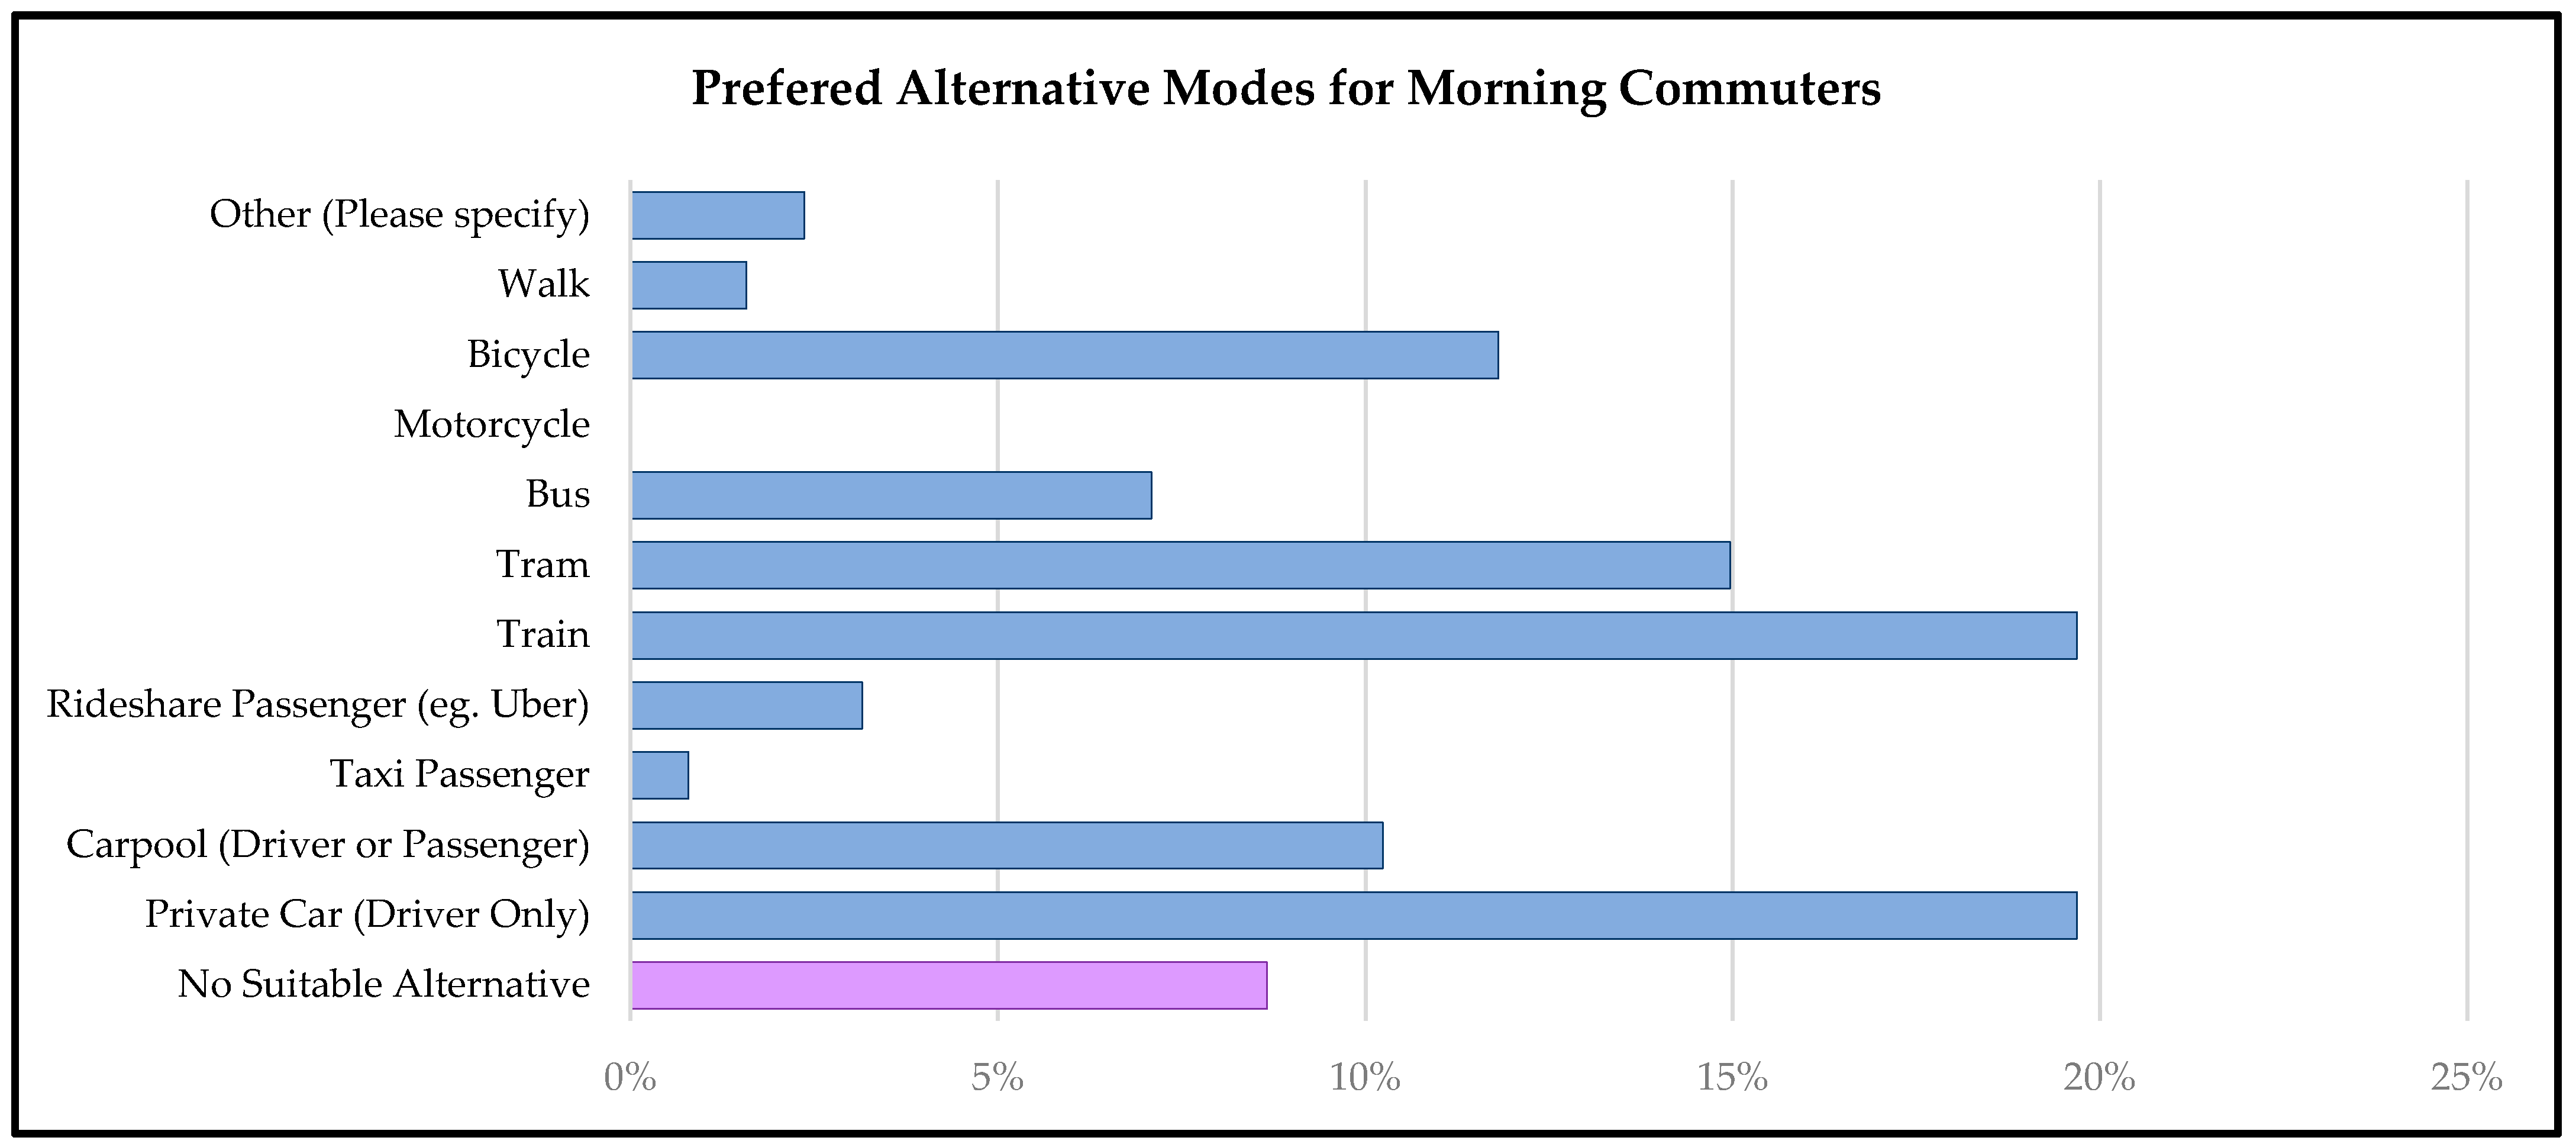
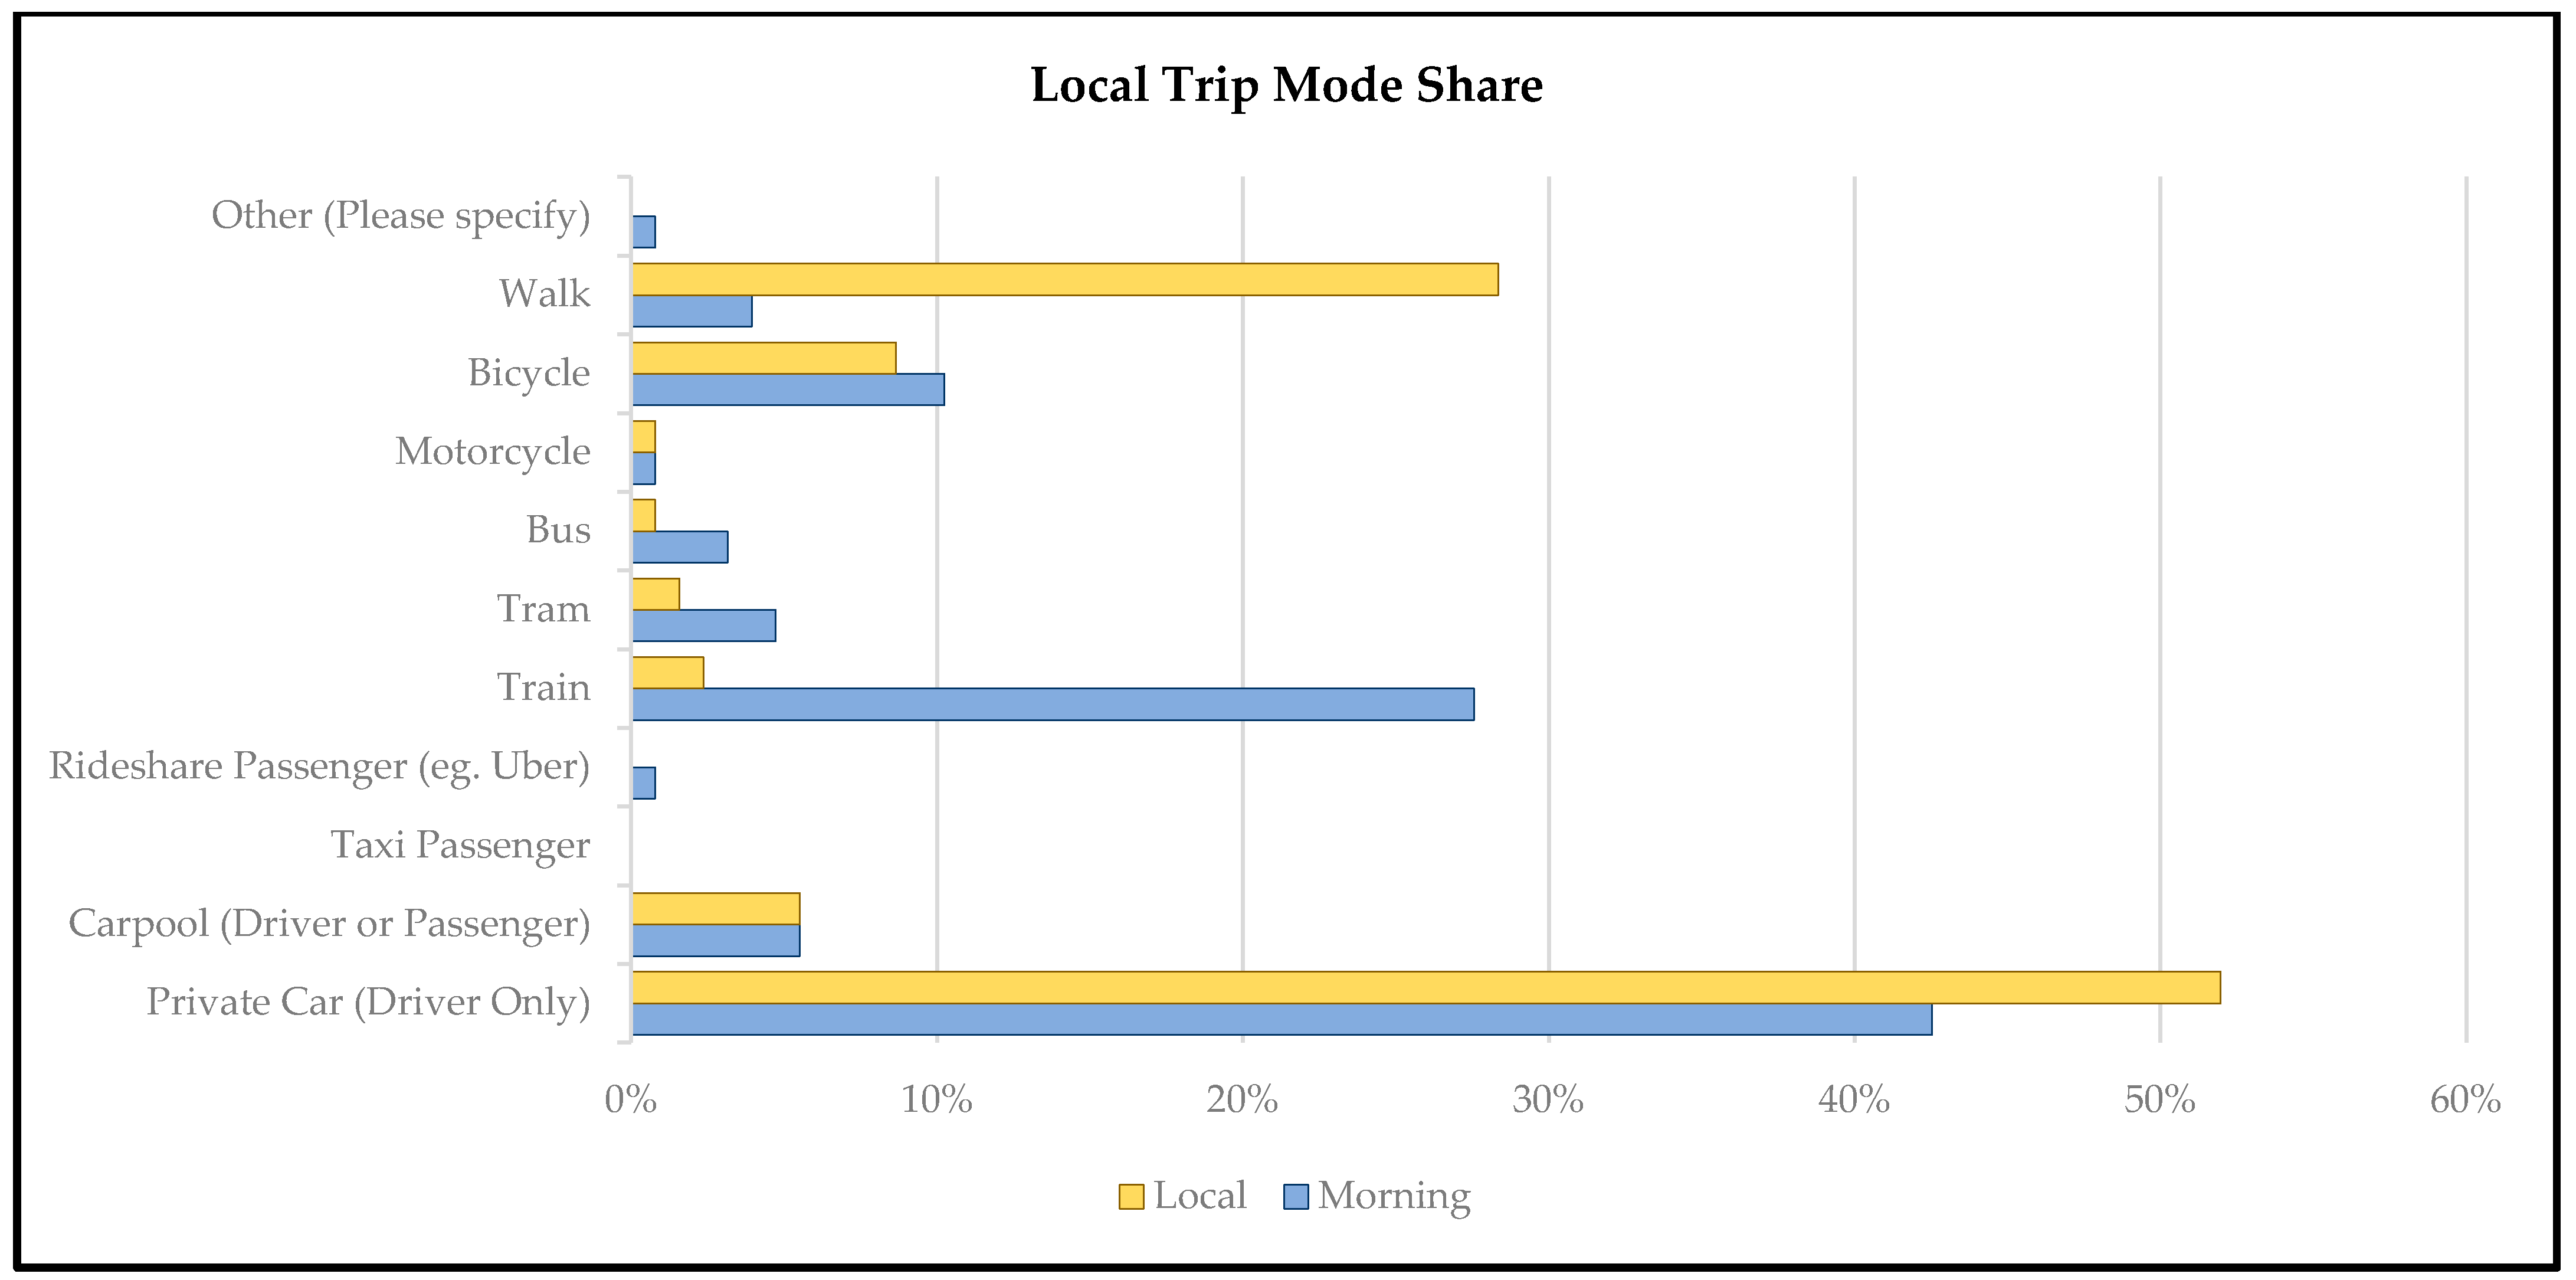
To understand the respondents’ travel preferences, they were asked what mode they would use if their primary mode of transport was not available. They were also asked to list a secondary alternative mode in the situation where both their primary and alternative choices were unavailable, as illustrated in Figure 4. Of particular interest in the responses was the number of trips that the respondents reported could not be made by an alternative mode of travel of (approximately 9% of trips). This could be due to unwillingness to change modes, or a work requirement, such as the need to have and travel in a work vehicle. The respondents were also asked about their mode choices for local trips (Figure 5), where a local trip was defined as a trip that occurred entirely within the same precinct, such as a visit to the shops or nearby park.
As can be observed in Figure 4, private car mode choices for local trips increased compared to morning commute mode choices as did walking with a significant decline in train trips.
2.3. Traffic Modelling
Due to the study’s requirements, a multimodal traffic model of the transport system for the study area was developed. Transport modelling, at its core, is a complex dynamic interaction between travel demand, infrastructure supply, and traveller behaviour and preferences with supply representing the capacity of the network and the various modes. The demand side of the equation represents travellers with mobility needs and a set of preferences for mode and time of travel. There are also the external forces of regulation as set by governments and transport companies and operators which affect the balance of the equation through the implementation of policies and pricing strategies [51]. Traffic modelling exists at different levels depending on the level of complexity and outputs required and the objective of the study [52]. Traffic models can typically be categorised by both the model resolution and the underlying modelling solutions [52,53]. The details of a model can range from a static macroscopic level which broadly defines the roads and the capacity of each link, to a highly detailed dynamic microscopic model which details the lane widths, intersection details, signal phasing, etc., and are more suited for operational modelling and analysis of the dynamics of a transport system. A dynamic mesoscopic model lies between these two options and has all the details of a macroscopic model but with additional dynamic details such as intersection signal phasing to more accurately calculate dynamic travel times for example.
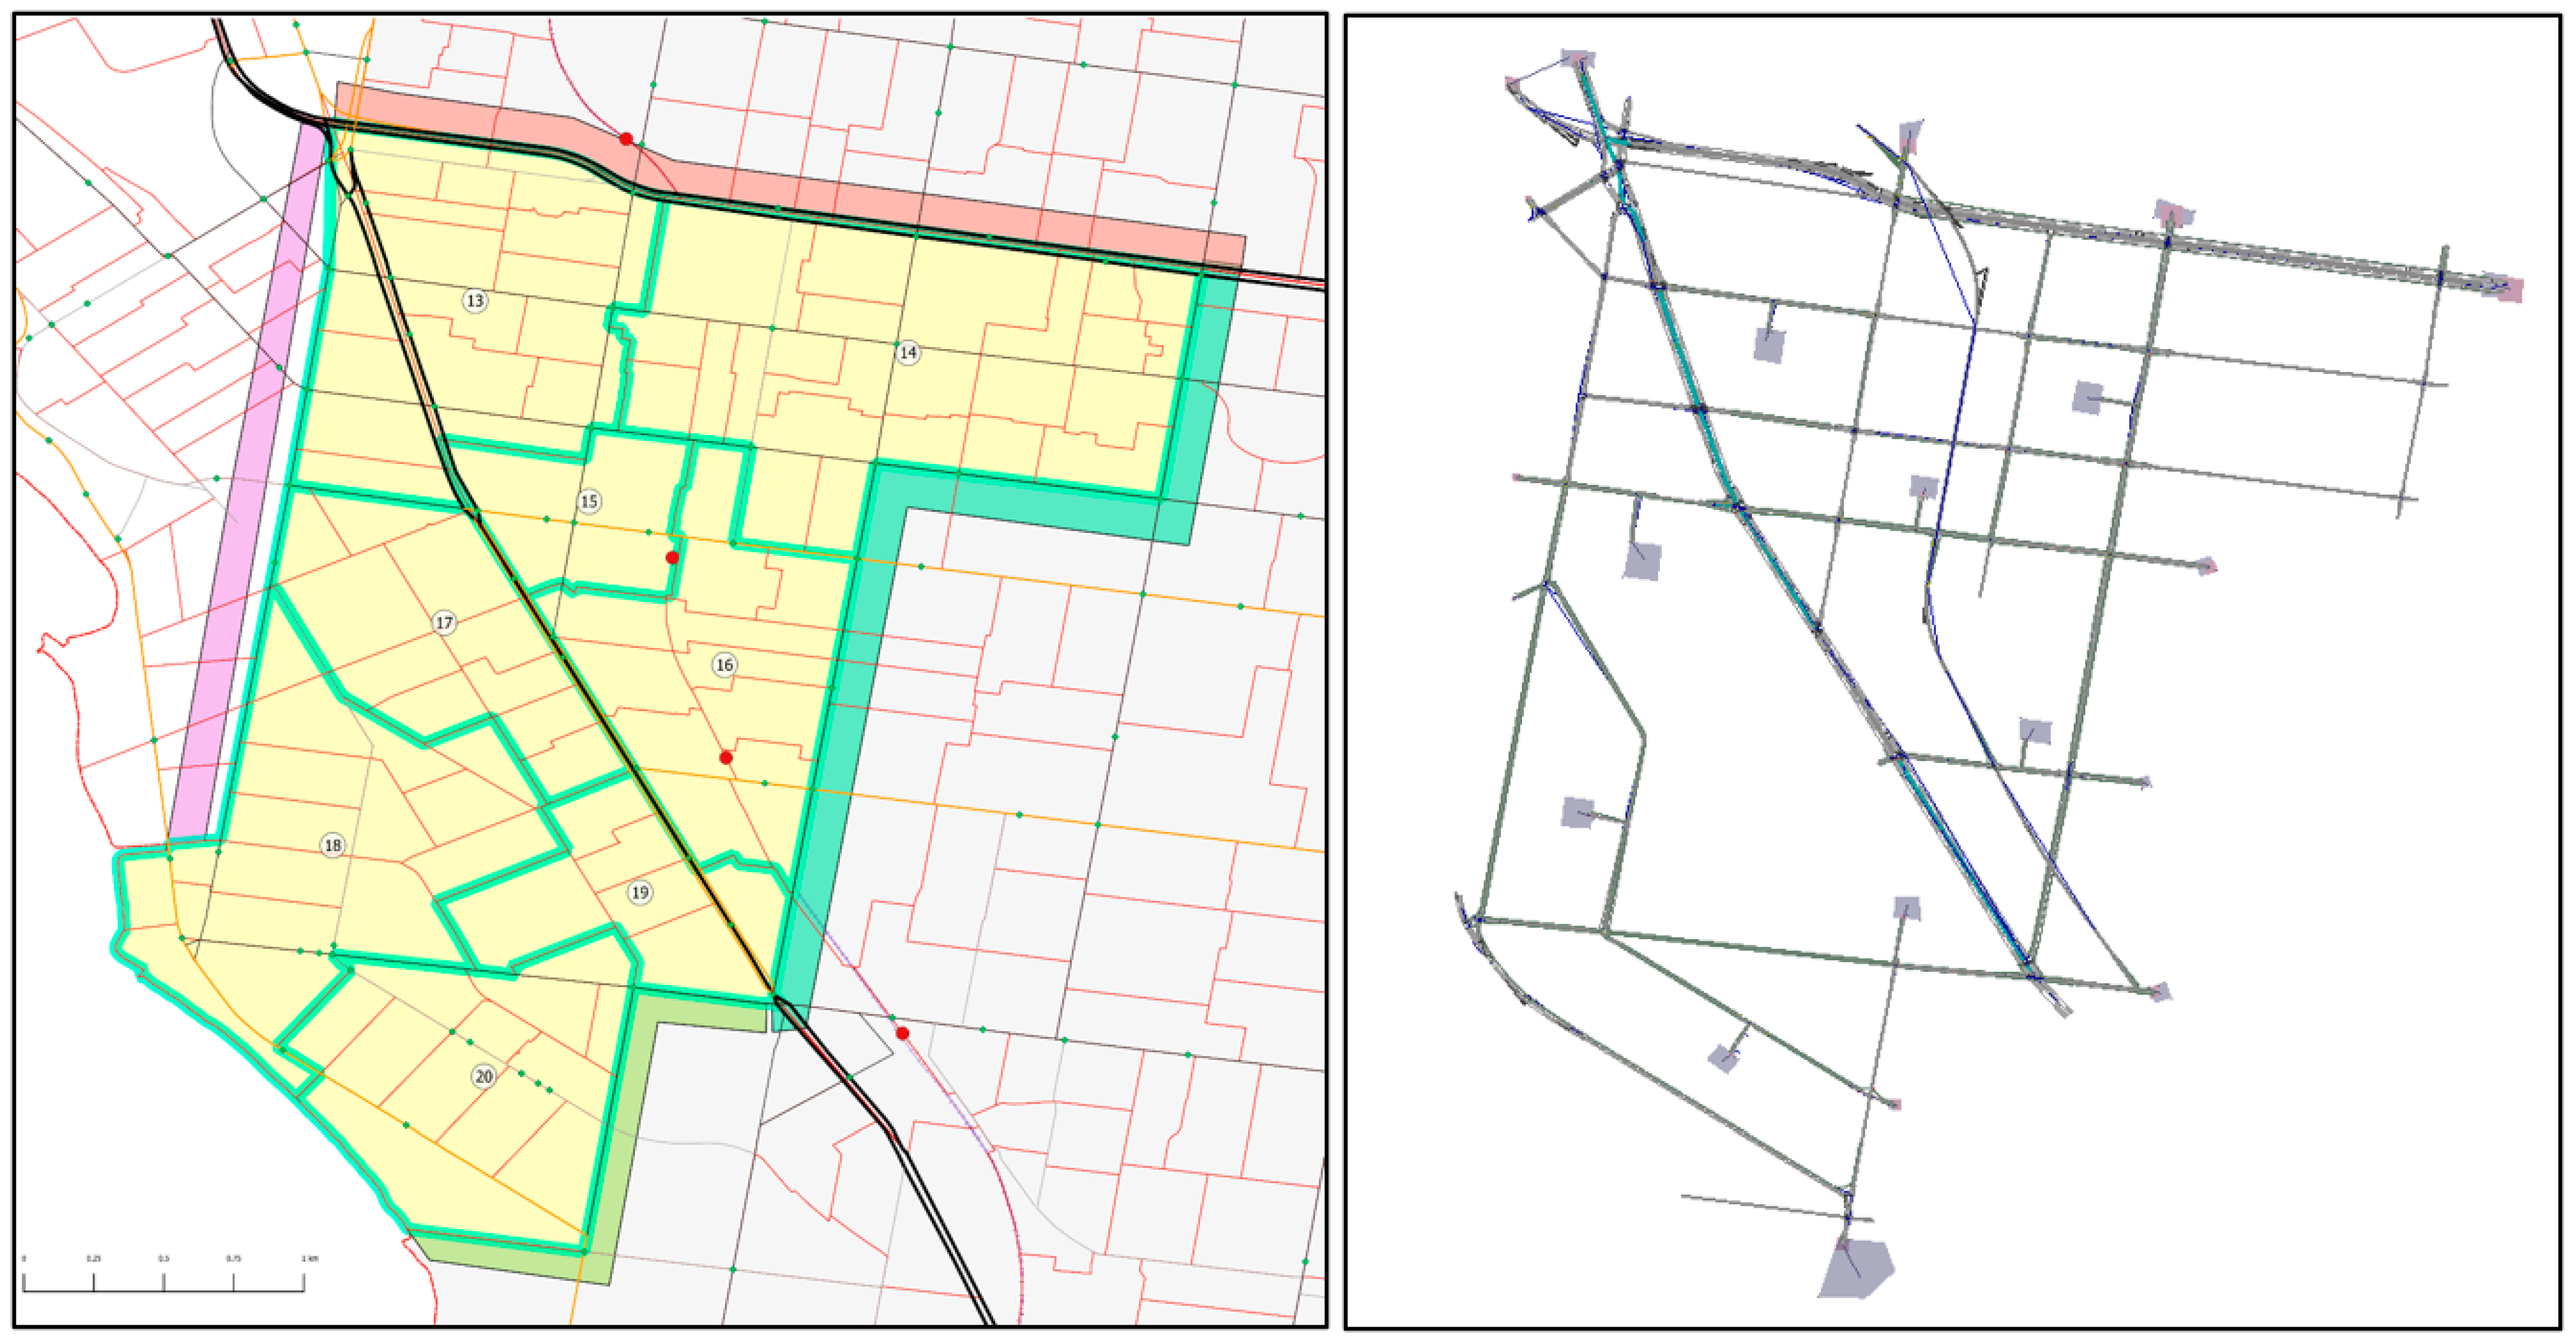
For this study, a traffic model for the study area was developed using the software tool Commuter. This is an agent-based modelling platform (with agents being the people or vehicles in the model) which is capable of performing complex microscopic simulations of the study area for various scenarios [54]. The modelled precinct was subdivided into 12 areas for the purposes of modelling (Figure 6).
This included four areas that allowed external interactions with the model. The areas were developed as an amalgamation of the Victorian Integrated Survey of Travel Activity (VISTA) study areas [8] with each area’s zone amalgamated to form areas of similar trip counts, approximately similar shaped regions, and access to public transport services. As this tool’s focus is to quantify the mobility impacts at a local council level, and they would need to be developed and adopted by each council, trips that originate or end within a council’s boundaries were included. However, through traffic or trips that continue through the study area were not considered because generally such trips are more likely to use major arterial roads rather than use local streets or roads. Such trips would also be picked up or included in the relevant local council low carbon mobility models where they originated or ended their travel. All public transport services were modelled. Within the study area, all train, tram, and bus routes and tracks were included, as well as public transport stops and timetables for the morning peak period. Within the area there was also a level crossing that was modelled to ensure trains always had right of way. For this study, ride share and taxis were not included considering they were not commonly used for morning commutes except in exceptional circumstances. However, carpooling was included.
The cycling network within this study area comprised predominantly of the road network with some dedicated on-road cycling lanes. Given that the area is heavily urbanised, there are no off-road bicycle networks. To reflect cyclists’ behaviours within the network, the model was calibrated for cyclists to take shorter distance trips and avoid certain roads such as freeways. This precinct is near a coastline and is very flat, so steep elevations are generally not a consideration for cyclists.
For trip distribution, the VISTA travel survey dataset was used as the basis with relevant trip data extracted for trips to and from the study area, within the study area, and only during the assumed peak period of 8 a.m. to 9 a.m.
To try to replicate the modal split experienced within this precinct and allow flexibility for the model agents to make choices about which modes to use, the model was set up such that there were four types of behaviours adopted. Without explicit traveller behaviours and preferences, the traffic model will always adopt the least cost route which is not an accurate replication of reality according to the survey results for the study area. The travellers in the model were assumed to have the following behaviours or preferences: (1) average commuters (they adopt a travel mode choice with the lowest generalised cost); (2) drivers only (represent the absolute minimum number of cars on the road); (3) carpooling travellers; and (4) cyclists. For the base case scenario, the model was calibrated by adjusting the costs of each link and mode choice preferences to match the modal split values from VISTA.
The final step in model development included specification of route choice which is the distribution of trips across the transport network which is a standard and established procedure in traffic simulation models [55,56]. This included a cost-based approach, but the costs assigned to various links, modes, delays, and other factors needed to be considered and specified to get an acceptable outcome and a good replication of reality.
Following the development of the traffic model that approximated the observed results, the travel preference survey data was then integrated to reflect traveller behaviours and determine the possible and likely outcomes to be expected in the study area based on the travel survey results.
3. Modelling Results
A set of scenarios were then tested in the model which included the base case scenario reflecting current conditions in addition to a number of desired future scenarios that reflected different low carbon mobility futures. The desired scenarios aimed to investigate impacts of low carbon interventions that could deliver 20%, 40%, 60%, 80%, and maximum possible reduction in private vehicle trips, respectively. It is noted that the results from the travel survey identified a number of private vehicle trips that cannot be replaced with other modes of travel. Therefore, although the final scenario was intended to produce complete reductions, the actual reduction was constrained to around 82.4%. Based on this requirement and travel preferences, the following scenarios (Table 1) were developed and tested in the model.
Mode shares for each of the modelled scenarios are presented in Figure 7. The results show the propensity of each scenario to reduce private vehicle trips and the percentages of shift from private vehicle trips to other modes of sustainable and low carbon transport.
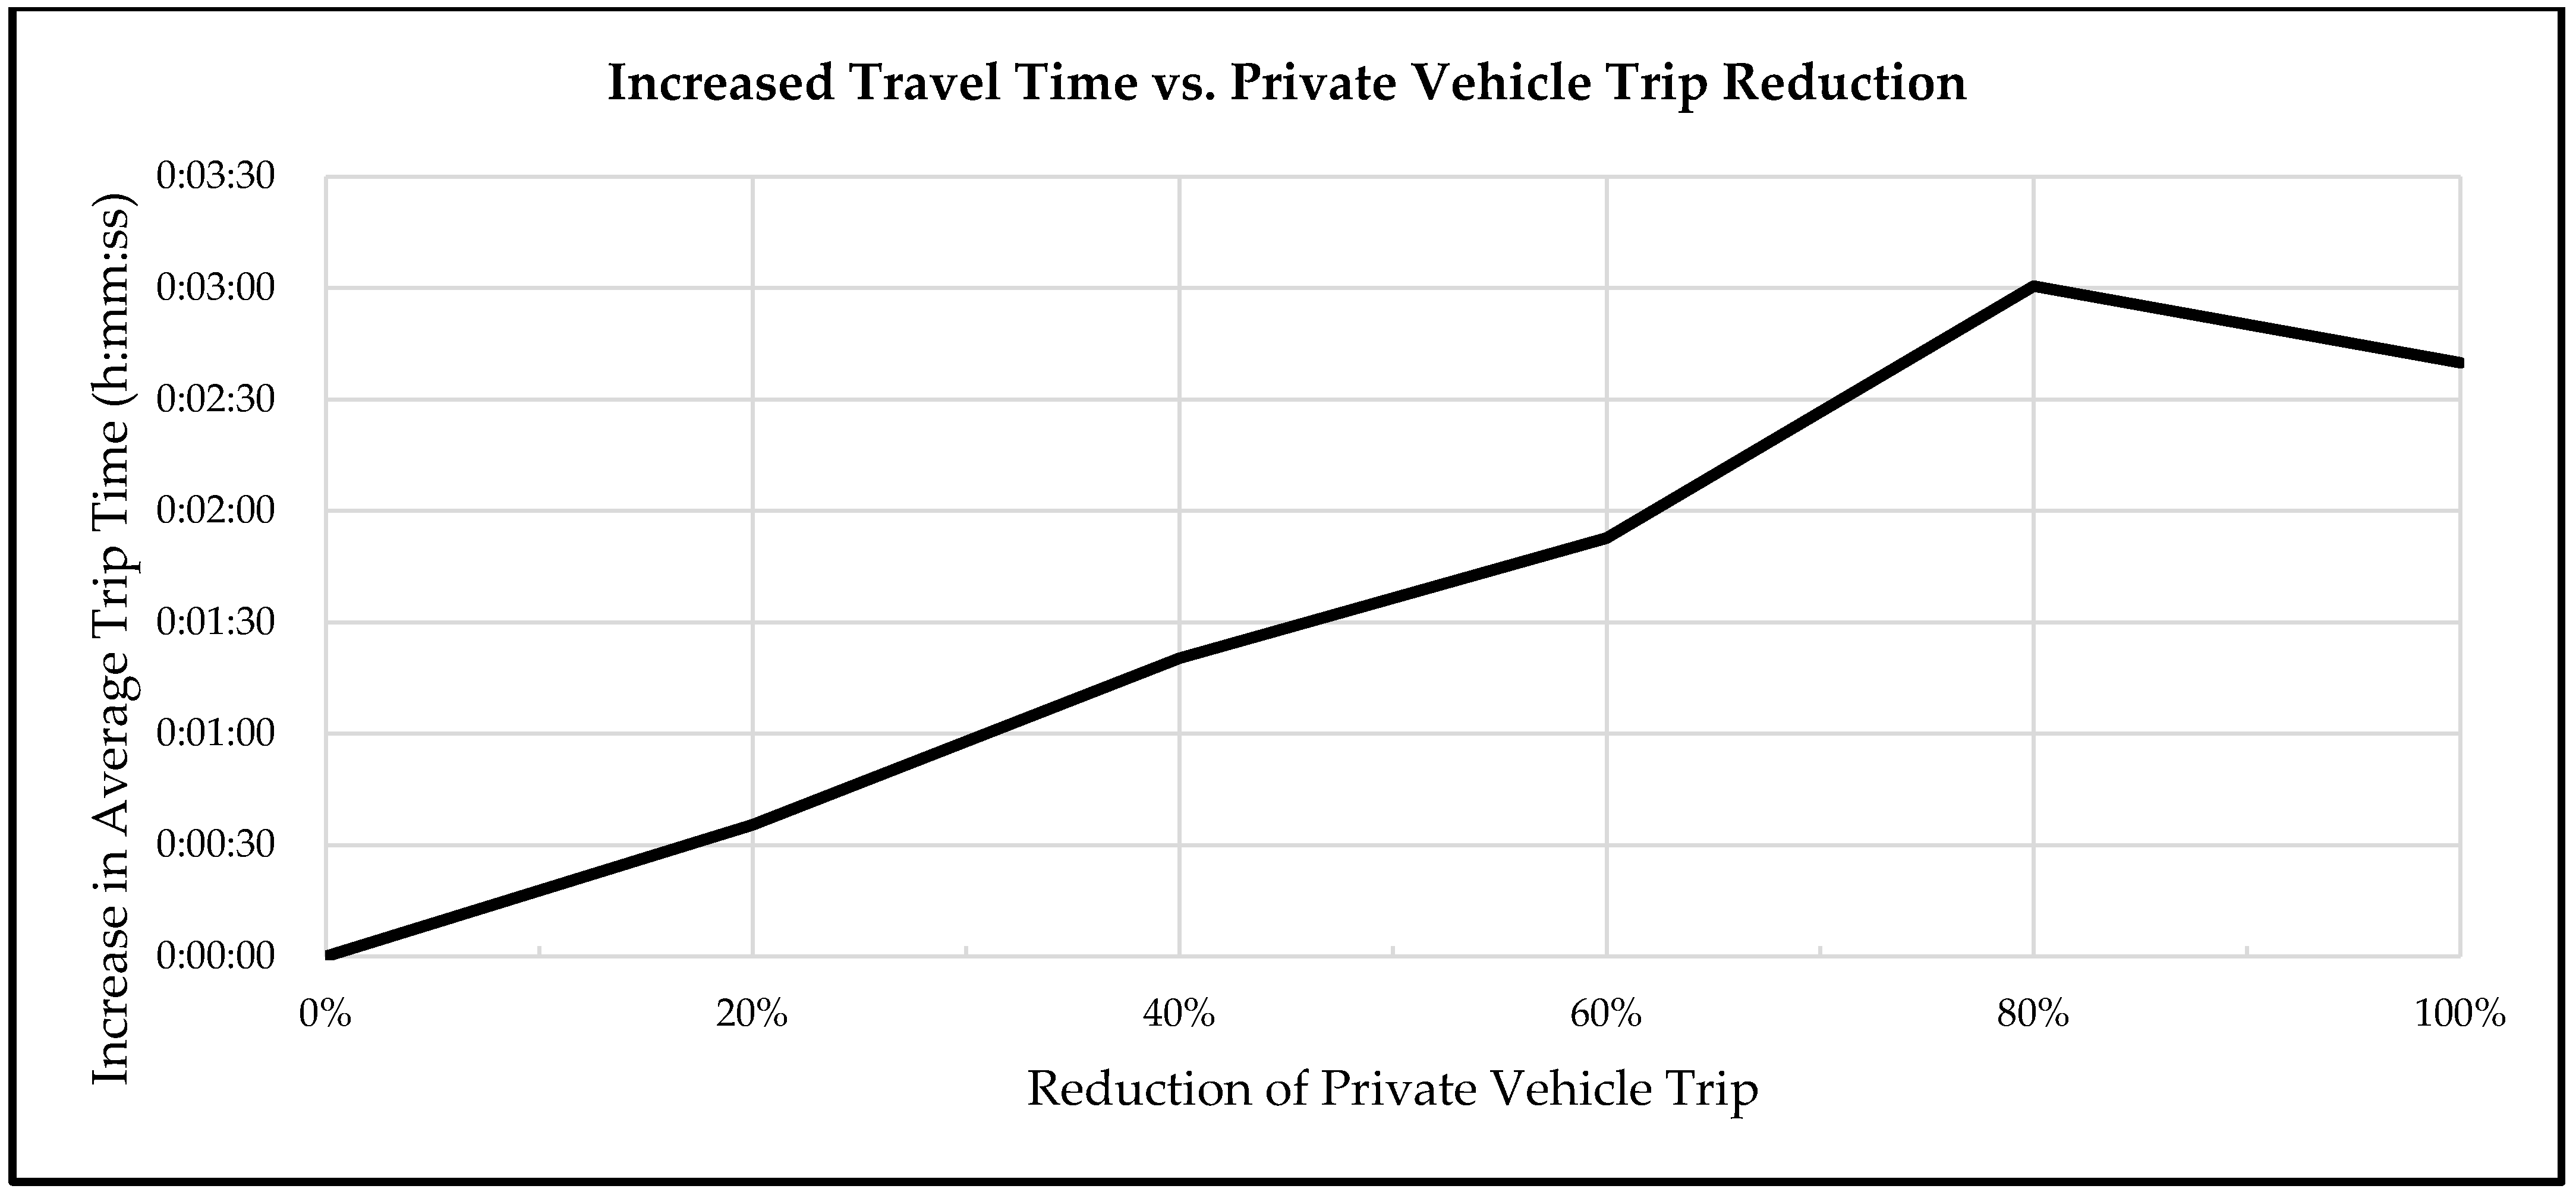
Inspection of these results shows carpooling is the preferred alternative mode of transport for reducing private vehicle trips for travellers in the study area, followed by cycling, trams, walking, buses, and trains. It is interesting to note that the modelling results also showed (Figure 8) that adoption of these alternative modes of transport will result in slight increases in travel times compared to travel time in private vehicles.
The results in Figure 8 quantify these impacts and show that the average travel times increase between 30 s for the scenario which reduces private vehicle use by 20%, through to an increase in 3 min in average travel times for the scenario which reduces private vehicle trips by 80%. These increases in travel times are insignificant and are due to the fact that the alternative modes of transport do not provide the shortest distance door-to-door travel offered by private vehicles especially for public transport vehicles that travel along set routes and often move at lower speeds, travel longer distances, and have multiple stops along their routes to pick up and drop passengers.
3.1. Carbon Impacts
Two main methods for calculating transport emissions were considered: Fuel-based approach, or a distance-based approach. The fuel-based approach relies on the fuel consumption for a trip multiplied by an emissions factors for that fuel. Distance-based approaches use a factor based on the average emissions emitted per distance or kilometre of travel [57].
The carbon impacts of different transport modes have been widely reviewed by academics and government agencies and vary worldwide due to multiple factors that affect the measurements. These factors include the composition and age of vehicle fleets and the regulatory environments for each country in relation to clean transport and vehicle emission standard. In this study, the methodology for calculating the greenhouse gas emissions adopts appropriate values for each mode of travel from numerous Australian sources [58,59,60,61,62].
For electric vehicles, it is important to note that whilst there are no direct emissions from these vehicles, the generation of electricity used in powering these vehicles will create emissions unless the electricity is generated from renewable resources. For this research, the study area is located within the state of Victoria in Australia which generates the majority of its power from brown coal power plants which render electric vehicles in the State as ‘less green’ compared to other geographies and jurisdictions [61]. According to studies based on the Australian average energy mix, charging an electric vehicle will produce approximately 180 g CO2e, only 35% lower than the average petrol car [23].
3.2. Low Carbon Assessment Tool Design
The tool developed in this work has a simple and powerful interface, driven by a dynamic dataset to provide relevant outputs and meaningful metrics. The interface of the tool allows the end-user to select a target year and a desired reduction in private vehicle trips. If the user would like more defined control, they can also apply capacity constraints to each travel mode. This allows the calculator to factor in potential capacity constraints, for example for public transport services, if it is not possible to provide more services. For example, where tram services are already running at capacity and there is limited opportunities to add new tracks or infrastructure to increase capacity, then this can be provided as a constraint so that the model does not assume solutions that are not feasible or impossible to implement.
Carbon Impacts Calculations
To estimate emissions, the distance-based method was adopted whereby the distance travelled by each mode is multiplied by the reduction impacts from that mode and the global warming factors. This provides all modes with a common dimension (Carbon Dioxide Equivalent (CO2e)) which is then totalled to represent the impact of all modes. Equation (1) demonstrates a typical calculation that is used to determine the total greenhouse gas emissions for a particular mode of transport in the study.
The second measured impact is personal cost which is a function of trip time and a base cost. Equation (2) represents the calculation method for this impact. Trip costs are represented as a fixed cost for public transport according to the pricing scheme adopted for public transport in Melbourne. The costs of driving are adopted from the Australian Taxation Office cost estimates of 68 cents per km travelled [63]. This is considered to include all costs relating to the ownership, operations and maintenance of a motor vehicle. The final measured impact is passenger kilometres travelled on the road. This is a metric that accounts for personal vehicle trips, motorcycles, and carpooling. The impact is derived from the summation of the trip distances
where
- —Travel Distance of Travel Mode I;
- —Carbon Dioxide Emissions of Travel Mode i;
- —Methane Emissions of Travel Mode I;
- —Nitrous Oxide Emissions of Travel Mode I;
- —Methane conversion factor;
- —Nitrous Oxide conversion factor.
- —Travel Distance of Travel Mode i;
- —Variable Cost of Travel of Mode i;
- —Fixed Cost of Travel Mode i.
3.3. Travel Redistribution Calculations
To redistribute the trips accurately, the tool interpolates the traffic modelling results between the scenarios to estimate the mode share for the private vehicle trip reduction desired by the user. The mode share results determine the number of trips that will be taken by each mode, which, in turn, is used to calculate the carbon impacts and other benefits. If the user has opted to provide additional capacity constraints, these are also considered during the redistribution. The metrics reported by the tool include: greenhouse gas emissions (reported as tonnes of equivalent carbon dioxide); personal cost (reported as the individual cost of the average commuter); and private vehicle kilometres (a summation of the total driven distance, indicative of the road network usage). These impacts are presented for the peak period and annual totals.
4. Case Study
To demonstrate the feasibility of the approach and capability of the digital tool, it was used for a case study of Port Phillip Council in three scenarios to be discussed next.
The process for the use of the digital tool for the case study can be summarised in three steps:
- Setup and Calibration: The first step includes the collection of the required data including a travel preference survey, and the study area is modelled with a traffic model;
- Tool Application: This step include data input and specification of targets and user defined constraints. Once these are identified, the model is run and results generated;
- Review and Feedback: This step is where the end-user reviews the results and if the model needs refinement returns to Step 2 to make adjustments as required.
4.1. Scenario A
This first scenario was developed to demonstrate a simple case with a minimum level of input required. For Scenario A, the objective was to achieve a 50% reduction in private vehicle trips and calculate the estimated benefits. The impacts that were calculated included greenhouse gas emissions, personal cost benefits, and reduction in private trips. These key impacts and benefits are presented in Table 2.
The benefits reported include peak hour impacts, annual impacts (peak hour multiplied by two peaks per day, five working days per week, and 48 working weeks per year), and annual individual impacts (annual impact divided by the relevant population). These results were only representative of peak hour impacts. Trips that occurred outside this peak hour window are subject to different behavioural patterns and thus were not estimated.
The key metric output was greenhouse gas reductions of 133 Tonnes per peak, which equates to around 31% reduction in greenhouse gases for a reduction of 50% of private vehicle trips. Notably the reduction in greenhouse gases does not decrease at the same rate as private vehicle trips because most other trips have a base level of greenhouse gases. The other two metrics, private vehicle kilometres and personal costs are consequential benefits (in most cases) of the reduction in private vehicle trips that can offer some preliminary insights into the impacts before investing resources into developing accurate impact statements. The reduction of 331,000 private vehicle kilometres represents a reduction of 50% of single occupant vehicles off the road, and, therefore, is a simple relative measurement of the improvement to road congestion. Personal travel cost is a metric that measures the cost of each individual’s commute. An individual benefit of $613 was estimated based on averages across all trips. These benefits were a result from the decrease in car ownership and running and maintenance costs, offset by an increase in public transport fares. Whilst this scenario demonstrated a simple approach to the model, it provided meaningful results that would help the user in testing during the early stages of planning to narrow down on targets for inclusion in policies and strategies. As outlined before, it is expected that each council would develop and adopt their own low carbon mobility initiatives and models. Therefore, whilst these results measure the impacts of travel within the study area, the impacts of through traffic are not included as these would be picked up by the relevant council low carbon mobility models. There is certainly scope in future research studies to consider how the different low carbon mobility models for adjacent councils can be either integrated or fused to ensure that there are consistent strategies that target through traffic in their areas such as provision of by-pass routes to encourage a shift of through traffic to major arterial roads rather than local council roads.
4.2. Scenario B
This scenario extends Scenario A and assumes the tram network is nearing maximum capacity (which is a reflection of reality) with some room to accommodate 10% more trips, and that no further improvement works are available for this network (without significant costs). The key impacts and benefits for this scenario are presented in Table 3.
Overall, Scenario A and Scenario B results are similar. As expected, the private vehicle kilometres travelled are unchanged, as the target reduction in private vehicle trips is the same. There is a slight decrease in the reduction in greenhouse gases by limiting the number of tram trips, this is due to the reduced tram capacity being offset by additional uptake in carpooling trips. Comparatively, the reduction in greenhouse gases is almost the same (31.2% vs. 31.9%). The results showed that some of the offset trips were redirected to walking and cycling modes which also helped to reduce personal costs compared to Scenario A, reducing the cost by a further $34 per person.
The change in trip allocations between Scenario A and Scenario B is also highlighted in Table 4 to demonstrate how the results change by adding a capacity constraint. The impact of the constraint is evident showing reduction in tram trips by 1327 trip, which is then redistributed across the other modes in accordance with the findings of the traffic model and travel preference survey with higher weighting given to carpool and walking modes.
Scenario B allows the user to quickly check what the changes to the benefits would be given a network constraint. As demonstrated, the only change between the two scenarios was the input of a single value which redistributed the trip modes accordingly and recalculated the results. This tool can speed up the development and testing of policies and strategies whereby a potential hurdle that arises, such as with trams in this scenario, the model recalculate outputs to update the policy and strategy plans factoring in the constraint. This provides the user with flexibility to make changes to address shortcomings and deliver results quickly which can speed up the planning and strategy development process.
4.3. Scenario C
This scenario considered a greenhouse gas reduction target of 25% by year 2030. In this case, the model considers an iterative approach that was based on an initial private vehicle reduction target of 50%, which was then incrementally increased until the greenhouse gas reduction target was achieved. The key results for this scenario are shown in Table 5.
One key difference between the assumptions for the different scenarios is that they have been based on different demands for travel. For Scenario C, the travel demand in 2030 would be higher compared to the base year demands assumed in Scenario A and Scenario B. Therefore, Scenario C demonstrates how the tool has flexibility to accommodate different forecast time horizons. Although Scenario C produced a significant 62% reduction in private vehicle trips, the overall benefits calculated for Scenario C were lower than Scenario A and Scenario B. The benefits from private vehicle reductions were offset by the forecast substantial increase in population by 2030 and the resulting increase in number of future trips. Due to the increase in population and future trips, it was estimated there would be an annual increase of 46 kilotonnes of greenhouse gases. These results can be considered and interpreted in a number of ways for planning purposes. If the aim was to reduce emissions by 25% compared to base case conditions, then a private vehicle trip reduction target of 62% would be needed to reduce the impacts by 54 kilotonnes in 2030. Another way to interpret this is that if the reduction target could be achieved today, it would result in a reduction of 82 kilotonnes. To counter the effects of the population growth and the associated transport demands, which inevitably would result in increased greenhouse gases, a larger target of private vehicle trips reduction would need to be adopted.
Scenario C demonstrated the application of this model to future transport network conditions, and how it can be used to target a greenhouse gas reduction. For decision makers who work on policy development, these processes can take years to come to fruition. As was demonstrated in this scenario, a 62% reduction in private vehicle trips today could result in 40% reduction in greenhouse gases, but in a decade that would reduce to 25%.
5. Conclusions and Future Directions
The low carbon mobility assessment models discussed in this paper represent a radical departure from existing assessment models reported in the literature. The key distinction is that while most existing carbon and emissions estimation models are based on static datasets, this research developed and evaluated a vigorous assessment framework that integrates multiple dynamic models that work together to yield more accurate and robust results that respond to changing network conditions and traveller behavioural preferences.
The value of these models is that they can respond to changes in the transport environment dynamically without the need for model re-development or re-structure to meet the changed conditions. By incorporating travel behavioural patterns of residents within the study area, which was established using the travel behaviour and preferences surveys, the model’s capabilities are extended at more granular levels leading to a better under understanding of travel behaviour and network performance and constraints. These types of surveys help to identify if there are limitations or constraints to the extent to which private vehicles can be removed from the transport network taking into considerations travellers who are unable or unwilling to travel without a private vehicle. As was shown in the results, the model was also sensitive to constraints in service provision such as limited capacity to expand the tram network which the model then considers when evaluating shifts from private vehicles to other modes of transport. The model was also useful in quantifying different impacts including changes in travel times and importantly in emissions and pollution that resulted from different modelling scenarios.
Future research pathways can look into extending the model’s capabilities by testing it on different precincts and study areas to derive patterns that would allow for a simplified setup and generalisation of models in different regions. The models can also be extended by updating the vehicle fleet composition to include electric, petrol, diesel, hybrid, and other types of vehicle to get a better understanding of the impacts of transitioning the existing vehicle fleets to more energy efficient modes of transport.
Another focus for future research would be the inclusion of additional road transport modes such as autonomous on-demand shared mobility. These future solutions may allow for a higher reduction in carbon impacts by reducing reliance on car ownership and encouraged more sharing of assets and vehicles. A finer level of detail would be required to understand the split of private trips between these sub categories, and further behavioural studies to understand the potential uptake.
Author Contributions
H.D. and D.M.: Planning and conceptualisation. D.M.: Methodology, model development, generation of results and analysis. D.M.: Drafting of paper content. H.D.: Reviewing and Editing. H.D.: Supervision and mentoring of research student. All authors have read and agreed to the published version of the manuscript.
Funding
This research received funding from the Australian Cooperative Research Centre (CRC) for Low Carbon Living, grant number NP3007.
Informed Consent Statement
This research has received research ethics approval from Swinburne University (Research ethics number 2018/231) in accordance with the Australian NHMRC National Statement on Ethical Conduct in Human Research available at www.nhmrc.gov.au.
Data Availability Statement
The Victorian Integrated Survey of Travel Activity used in this research is publicly available at: https://transport.vic.gov.au/about/data-and-research/vista.
Acknowledgments
Damian Moffatt acknowledges the research scholarship awarded to him by the CRC for Low Carbon Living to undertake this research for his Master’s Degree. The sponsor was not involved in the study design, collection, analysis, interpretation of data or the writing of this article. The opinions expressed in this paper are those of the authors and do not necessarily reflect the views of the study’s sponsor.
Conflicts of Interest
The authors declare no conflict of interest.
References
- Smit, R.; Dia, H.; Morawska, L. Road Traffic Emission and Fuel Consumption Modelling: Trends, New Developments and Future Challenges. In Traffic Related Air Pollution; Demidov, S., Bonnet, J., Eds.; Nova Science Publishers: Hauppauge, NY, SAD, 2009; pp. 29–68. [Google Scholar]
- Gans, J.; King, S.; Mankiw, G. Principles of Microeconomics, 5th ed.; Cengage Learning Australia: Melbourne, Australia, 2011. [Google Scholar]
- Newman, P. Global Cities, Transport, Energy and the Future: Will Ecosocialization Reverse the Historic Trends. In Making Urban Transport Sustainable; Low, N., Gleeson, B., Eds.; Palgrave Macmillan: Hampshire, UK, 2003; pp. 25–41. [Google Scholar]
- Reisi, M.; Rajabifard, A.; Ngo, T.; Aye, L. Transport sustainability index: Melbourne case study. Ecol. Indic. 2014, 43, 288–296. [Google Scholar] [CrossRef]
- Australia. Infrastructure Australia. Australian Infrastructure Plan—Priorities and Reforms for Our Nation’s Future, Australian Government Infrastructure Australia. February 2016. Infrastructure Australia. Available online: https://www.infrastructureaustralia.gov.au/sites/default/files/2019-06/Australian_Infrastructure_Plan.pdf (accessed on 25 May 2017).
- Australia. Infrastructure Australia, Sustainability and Resilience—Australian Infrastructure Plan. 2016. Infrastructure Australia. Available online: http://infrastructureaustralia.gov.au/policy-publications/publications/files/IA_J16-2330_Fact_Sheet_Sustainability_and_Resilience_v1.2.pdf (accessed on 25 May 2017).
- Birnik, A. An evidence-based assessment of online calculators. Int. J. Greenh. Gas Control. 2003, 17, 280–293. [Google Scholar] [CrossRef]
- Victorian Integrated Survey of Travel and Activity (VISTA). 2017. Available online: https://transport.vic.gov.au/about/data-and-research/vista (accessed on 4 July 2021).
- Stirzaker, C.; Dia, H. Evaluation of Transportation Infrastructure Management Strategies Using Microscopic Traffic Simulation. J. Infrastruct. Syst. 2007, 13, 168–174. [Google Scholar] [CrossRef]
- Abduljabbar, R.; Dia, H. Predictive Intelligence: A Neural Network Learning System for Traffic Condition Prediction and Monitoring on Freeways. J. East. Asia Soc. Transp. Stud. 2019, 13, 1785–1800. [Google Scholar] [CrossRef]
- Shaheen, S.A.; Mallery, M.A.; Kingsley, K.J. Personal vehicle sharing services in North America. Res. Transp. Bus. Manag. 2012, 3, 71–81. [Google Scholar] [CrossRef] [Green Version]
- Nijland, H.; van Meerkerk, J. Mobility and environmental impacts of car sharing in the Netherlands. Environ. Innov. Soc. Transit. 2017, 23. [Google Scholar] [CrossRef]
- Jian, S.; Rey, D.; Dixit, V. 2016 Dynamic Optimal Vehicle Relocation in Carshare Systems. Transp. Res. Rec. J. Transp. Res. Board 2016, 2567, 1–9. [Google Scholar] [CrossRef] [Green Version]
- Hampshire, R.; Gaites, C. Peer-to-Peer Carsharing: Market Analysis and Potential Growth. Transp. Res. Rec. J. Transp. Res. Board 2011, 2217, 119–126. [Google Scholar] [CrossRef]
- GoGet. Development Partners, 2018. GoGet. Available online: https://www.goget.com.au/developer-partners/ (accessed on 7 January 2018).
- Goldman, T.; Gorham, R. Sustainable urban transport: Four innovative directions. Technol. Soc. 2006, 28, 261–273. [Google Scholar] [CrossRef]
- City of Melbourne. Melbourne Bike Share, 2021. Melbourne Bike Share. Available online: https://www.melbournebikeshare.com.au/ (accessed on 4 April 2021).
- City of Melbourne. Lime e-Bike Hire, 2021. City of Melbourne. Available online: https://www.melbourne.vic.gov.au/parking-and-transport/cycling/Pages/bike-hire.aspx (accessed on 4 April 2021).
- Mulvaney, D. Low-Carbon Mobility. In Sustainable Energy Transitions; Palgrave Macmillan: Hampshire, UK, 2020. [Google Scholar] [CrossRef]
- Arsenio, E.; Ribeiro, P. The Economic Assessment of Health Benefits of Active Transport. In Sustainable Urban Transport (Transport and Sustainability); Attard, M., Shiftan, Y., Eds.; Emerald Group Publishing: Bingley, UK, 2015; Volume 7, pp. 1–22. [Google Scholar]
- Rayle, L.; Dai, D.; Chan, N.; Cervero, R.; Shaheen, S. Just a better taxi? A survey-based comparison of taxis, transit, and ridesourcing services in San Francisco. Transp. Policy 2016, 45, 168–178. [Google Scholar] [CrossRef] [Green Version]
- Moran, M.; Lasley, P. Legislating Transportation Network Companies. Transp. Res. Rec. J. Transp. Res. Board 2017, 2650, 163–171. [Google Scholar] [CrossRef]
- Järvinen, J.; Orton, F.; Nelson, T. Electric vehicles in Australia’s National Electricity Market: Energy Market and Policy Implications. Electr. J. 2012, 25, 63–87. [Google Scholar] [CrossRef]
- Mills, G.; MacGill, I. Assessing greenhouse gas emissions from electric vehicle operation in Australia using temporal vehicle charging and electricity emission characteristics. Int. J. Sustain. Transp. 2017, 11, 20–30. [Google Scholar] [CrossRef]
- Dia, H. Policy principles for low carbon mobility. In Low Carbon Mobility for Future Cities: Principles and Applications; Dia, H., Ed.; The Institution of Engineering and Technology: Stevenage, UK, 2017; pp. 41–63. [Google Scholar]
- Abdul-Manan, A.F.N. Uncertainty and differences in GHG emissions between electric and conventional gasoline vehicles with implications for transport policy making. Energy Policy 2015, 87, 1–7. [Google Scholar] [CrossRef]
- Abduljabbar, R.; Dia, H. A Deep Learning Approach for Freeway Vehicle Speed and Flow Prediction. In Proceedings of the Australasian Transport Research Forum (ATRF), Canberra, Australia, 30 September–2 October 2019. [Google Scholar]
- Dia, H. Urban mobility: Challenges and opportunities. In Low Carbon Mobility for Future Cities: Principles and Applications; Dia, H., Ed.; The Institution of Engineering and Technology: Stevenage, UK, 2017; pp. 13–39. [Google Scholar]
- Kohler, J.; Whitmarsh, L.; Nykvist, B.; Schilperoord, M.; Bergman, N.; Haxeltine, A. A transitions model for sustainable mobility. Ecol. Econ. 2009, 68, 2985–2995. [Google Scholar] [CrossRef]
- Stephenson, J.; Spector, S.; Hopkins, D.; McCarthy, A. Deep interventions for a sustainable transport future. Transp. Res. Part D 2018, 61, 356–372. [Google Scholar] [CrossRef]
- Mulrow, J.; Machaj, K.; Deanes, J.; Derrible, S. The state of carbon footprint calculators: An evaluation of calculator design and user interaction features. Sustain. Prod. Consum. 2019, 18, 33–40. [Google Scholar] [CrossRef]
- Padgett, J.P.; Steinemann, A.C.; Clarke, J.H.; Vandenbergh, M.P. A comparison of carbon calculators. Environ. Impact Assess. Rev. 2008, 2, 106–115. [Google Scholar] [CrossRef]
- Rahman, F.; O’Brien, C.; Ahamed, S.I.; Zhang, H.; Liu, L. Design and implementation of an open framework for ubiquitous carbon footprint calculator applications. Sustain. Comput. Inform. Syst. 2011, 1, 257–274. [Google Scholar] [CrossRef]
- Shared-Use Mobility Centre. Shared Mobility Benefits Calculator, Share-Use Mobility Centre, 2016. Shared-Use Mobility Centre. Available online: http://calculator.sharedusemobilitycenter.org/#/ (accessed on 8 March 2018).
- Green Building Council of Australia. Sustainable Transport Performance Pathway Calculator Guide, 2015. GBCA. Available online: https://www.gbca.org.au/uploads/233/35817/Sustainable%20Transport%20Calculator%20Guide_03122015.pdf?_ga=2.172943397.780664450.1556103208-1398988242.1556103208 (accessed on 23 June 2017).
- National Centre for Transit Research. TRIMMS Trip Reduction Impacts of Mobility Management Strategies, 2018. TRIMMS. Available online: http://trimms.com/ (accessed on 2 February 2018).
- Walk Score. Live Where You Love, 2018. Walk Score. Available online: https://www.walkscore.com/ (accessed on 2 February 2018).
- Vallamsundar, S.; Lin, J.; Konduri, K.; Zhou, X.; Pendyala, R.M. A comprehensive modelling framework for transportation-induced population exposure assessment. Transp. Res. Part D 2016, 46, 94–113. [Google Scholar] [CrossRef]
- Thomas, K.; Dia, H.; Cottman, N. Simulation of arterial incident detection using neural networks. In Proceedings of the 8th World Congress on Intelligent Transport Systems, Sydney, Australia, 30 September–4 October 2001. [Google Scholar]
- Nigarnjanagoo, S.; Dia, H. Evaluation of a Dynamic Signal Optimisation Control Model using Traffic Simulation. Special Issue on the Computerisation of Transportation: Sophisticated Systems Incorporating IT in the Mobility of People and Goods. J. Int. Assoc. Traffic Saf. Sci. 2005, 29, 22–30. [Google Scholar]
- Dia, H.; Rose, G. Development of artificial neural network models for automated detection of freeway incidents. In Proceedings of the 7th World Conference on Transport Research (Modelling Transportation Systems), Sydney, Australia, 16–21 July 1995; pp. 107–122. [Google Scholar]
- Dia, H.; Rose, G.; Snell, A. Comparative performance of freeway automated incident detection algorithms. In Proceedings of the Roads 96: Joint 18th ARRB Transport Research Conference & Transit New Zealand Land Transport Symposium, Christchurch, New Zealand, 2–6 September 1996; pp. 359–374. [Google Scholar]
- Thomas, K.; Dia, H. Comparative Evaluation of Freeway Incident Detection Models Using Field Data. IEE Proc. Intell. Transp. Syst. 2006, 153, 230–241. [Google Scholar] [CrossRef]
- Panwai, S.; Dia, H. Development and Evaluation of a Reactive Agent-Based Car Following Model. In Proceedings of the Intelligent Vehicles and Road Infrastructure Conference (IVRI’05), Melbourne, Australia, 16–17 February 2005. [Google Scholar]
- Australia. Bureau of Statistics. Population Estimates: Concepts, Source and Methods, 2009. ABS, cat no. 3228.0.55.001. Available online: http://www.abs.gov.au/ausstats/[email protected]/Products/F3AF616665E821A6CA2575D2001AA12E?opendocument (accessed on 2 January 2019).
- Australia. Bureau of Statistics. How Australia Takes a Census, 2011. ABS, cat no. 2903.0. Available online: http://www.abs.gov.au/ausstats/[email protected]/lookup/2903.0Main%20Features162011 (accessed on 2 January 2019).
- New South Wales. Transport for NSW. Household Travel Survey (HTS), 2018. NSW Government. Available online: https://www.transport.nsw.gov.au/data-and-research/passenger-travel/surveys/household-travel-survey-hts (accessed on 21 August 2018).
- Van Evert, H.; Brog, W.; Erl, E. Survey Design: The Past, the Present and the Future, In Travel Survey Methods: Quality and Future Directions; Stopher, P., Stecher, C., Eds.; Emerald Publishing Limited: Bingley, UK, 2006; pp. 75–93. [Google Scholar]
- IPSOS. VISTA 2015–16 Technical Report, 2017. Department of Transport. Available online: https://transport.vic.gov.au/about/data-and-research/vista/vista-data-and-publications (accessed on 22 January 2019).
- International Transport Forum. Shared Mobility Simulations for Helsinki: Case-Specific Policy Analysis, 2017. International Transport Forum. Available online: https://www.itf-oecd.org/sites/default/files/docs/shared-mobility-simulations-helsinki.pdf (accessed on 21 October 2017).
- Janic, M. Transport Systems—Modelling, Planning and Evaluation; CRC Press: Boca Raton, FL, USA, 2017. [Google Scholar]
- New South Wales. Transport Roads & Maritime Services. Traffic Modelling Guidelines, 2013, NSW Government. Available online: https://www.rms.nsw.gov.au/business-industry/partners-suppliers/documents/technical-manuals/modellingguidelines.pdf (accessed on 20 October 2018).
- Ortuzar, J.D.; Willumsen, L.G. Modelling Transport, 3rd ed.; John Wiley & Sons: Hoboken, NJ, USA, 2001. [Google Scholar]
- Azalient. Commuter User Guide—Manual; Azalient Commuter: Sydney, Australia, 2013. [Google Scholar]
- Sutandi, C.; Dia, H. Performance Evaluation of an Advanced Traffic Control System in a Developing Country. In Proceedings of the 6th EASTS Conference (5), Bangkok, Thailand, 21–24 September 2005; pp. 1572–1585. [Google Scholar]
- Dia, H.; Harney, D.; Boyle, A. Dynamics of drivers’ route choice decisions under advanced traveler information systems. Roads Transp. Res. 2001, 10, 2–12. [Google Scholar]
- Liu, C.; Zhao, Y. The Features of Carbon Emissions from Urban Passenger Transport System and the Measures of Reduction. In Proceedings of the 11th International Conference of Chinese Transportation Professionals (ICCTP), Nanjing, China, 14–17 August 2011; pp. 2614–2622. [Google Scholar] [CrossRef]
- Lenzen, M. Total requirements of energy and greenhouse gases for Australian transport. Transp. Res. Part D 1999, 4, 265–290. [Google Scholar] [CrossRef]
- United Kingdom. Department for Business, Energy & Industrial Strategy. 2018 Government Ghg Conversion Factors for Company Reporting Methodology Paper for Emission Factors: Final Report, 2018. UK Government. Available online: https://assets.publishing.service.gov.uk/government/uploads/system/uploads/attachment_data/file/726911/2018_methodology_paper_FINAL_v01-00.pdf (accessed on 24 September 2018).
- Barter, P.; Kenworthy, J.; Laube, F. Lessons from Asia on Sustainable Urban Transport. In Making Urban Transport Sustainable; Low, N., Gleeson, B., Eds.; Palgrove Macmillan: Hampshire, UK, 2003; pp. 252–270. [Google Scholar]
- Australia. Department of the Energy and Environment. National Greenhouse Accounts Factors: Australian Greenhouse Accounts, 2017. Australian Government Department of the Energy and Environment. Available online: https://www.environment.gov.au/system/files/resources/5a169bfb-f417-4b00-9b70-6ba328ea8671/files/national-greenhouse-accounts-factors-july-2017.pdf (accessed on 7 January 2018).
- Australia. Bureau of Statistics. Survey of Motor Vehicle Use, 2016. ABS, cat no. 9208.0. Available online: http://www.abs.gov.au/ausstats/[email protected]/mf/9208.0 (accessed on 25 August 2017).
- Australia. Taxation Office. Car Expenses, 2019. ATO. Available online: https://www.ato.gov.au/Individuals/Income-and-deductions/Deductions-you-can-claim/Vehicle-and-travel-expenses/Car-expenses/#centsperkm (accessed on 23 January 2019).
Figure 1.
Simplified Framework of Digital Assessment Tool.

Figure 2.
Schematic of Study Area—Port Philip City Council in Melbourne (Inset: Study area comparison to Melbourne and surrounding councils).
Figure 2.
Schematic of Study Area—Port Philip City Council in Melbourne (Inset: Study area comparison to Melbourne and surrounding councils).

Figure 3.
Current mode share—Port Philip Council study area.

Figure 4.
Preferred alternative modes for users that cannot use their preferred mode.

Figure 5.
Mode share for morning peak hour and local trips.

Figure 6.
Study area (left) and digital twin traffic model representation (right).

Figure 7.
Propensity of each scenario to reduce private vehicle travel.

Figure 8.
Increases in average travel time for each scenario.


Table 1.
Modelled scenarios.
| Mode | Base | Scenario 1 (20% Reduction) | Scenario 2 (40% Reduction) | Scenario 3 (60% Reduction) | Scenario 4 (80% Reduction) | Scenario 5 (Max Reduction) |
|---|---|---|---|---|---|---|
| Drive | 34.0% | 27.2% | 20.4% | 13.6% | 6.8% | 6.0% (82.4% Reduction) |
| CarPool | 11.0% | 12.0% | 13.1% | 14.1% | 15.2% | 15.3% |
| Cycle | 16.0% | 16.9% | 17.9% | 18.8% | 19.8% | 19.9% |
| Commuter * | 39.0% | 43.8% | 48.6% | 53.4% | 58.2% | 58.8% |
* Public transport modes.
Table 2.
Results for Scenario A.
| Metric | Peak Hour Impact | Annual Impact | Annual Individual Impact (per Person) |
|---|---|---|---|
| Greenhouse Gases | −133 Tonne | −64 Kilotonne | −553 kg |
| Private Vehicle Km | −331,000 km | −159,160,000 km | −1372 km |
| Personal Travel Costs | −$148,000 | −$71,140,000 | −$613 |
Table 3.
Scenario B results.
| Metric | Peak Hour Impact | Annual Impact | Annual Individual Impact (per Person) |
|---|---|---|---|
| Greenhouse Gases (CO2e) | −130 Tonne | −63 Kilotonne | −541 kg |
| Private Vehicle Km | −331,000 km | −159,160,000 km | −1372 km |
| Personal Travel Costs | −$156 K | −$75,080,000 | −$647 |
Table 4.
Differences in trips between Scenario A and Scenario B.
| Mode | Additional Trips (Scenario A) | Additional Trips (Scenario B) | Difference in Daily Morning Trips (Mode Share Change) |
|---|---|---|---|
| Private Car | −26,251 | −26,251 | 0 |
| Carpool | 7255 | 8572 | +1327 (0.8%) |
| Train | 854 | 1009 | +155 (0.1%) |
| Tram | 5572 | 1819 | −3753 (−2.2%) |
| Bus | 3924 | 4637 | +713 (0.4%) |
| Bicycle | 2734 | 3230 | +496 (0.3%) |
| Walking | 5909 | 6980 | +1071 (0.6%) |
Table 5.
Scenario C results.
| Metric | Peak Hour Impact | Annual Impact | Annual Individual Impact (per Person) |
|---|---|---|---|
| Greenhouse Gases (CO2e) | −105 Tonne | −50 Kilotonne | −352 kg |
| Private Vehicle Km | −351,000 km | −168,440,000 km | −1178 km |
| Personal Travel Costs | −$53,000 | −$25,520,000 | −$178 |
Publisher’s Note: MDPI stays neutral with regard to jurisdictional claims in published maps and institutional affiliations. |
© 2021 by the authors. Licensee MDPI, Basel, Switzerland. This article is an open access article distributed under the terms and conditions of the Creative Commons Attribution (CC BY) license (https://creativecommons.org/licenses/by/4.0/).
Share and Cite
MDPI and ACS Style
Moffatt, D.; Dia, H. Development and Evaluation of Simulation-Based Low Carbon Mobility Assessment Models. Future Transp. 2021, 1, 134-153. https://0-doi-org.brum.beds.ac.uk/10.3390/futuretransp1020009
AMA Style
Moffatt D, Dia H. Development and Evaluation of Simulation-Based Low Carbon Mobility Assessment Models. Future Transportation. 2021; 1(2):134-153. https://0-doi-org.brum.beds.ac.uk/10.3390/futuretransp1020009
Chicago/Turabian StyleMoffatt, Damian, and Hussein Dia. 2021. "Development and Evaluation of Simulation-Based Low Carbon Mobility Assessment Models" Future Transportation 1, no. 2: 134-153. https://0-doi-org.brum.beds.ac.uk/10.3390/futuretransp1020009