Evolution of Cooperation with Peer Punishment under Prospect Theory


1
Research Center for Ethi-Culture Studies, RINRI Institute, Tokyo 102-0094, Japan
2
Faculty of Business Administration, Rissho University, Tokyo 141-8602, Japan
3
Faculty of Business Administration, Soka University, Tokyo 192-8577, Japan
4
F-Power Inc., Tokyo 106-6119, Japan
5
Faculty of Mathematics, University of Vienna, 1090 Vienna, Austria
*
Author to whom correspondence should be addressed.
Games 2019, 10(1), 11; https://0-doi-org.brum.beds.ac.uk/10.3390/g10010011
Submission received: 4 December 2018
/
Revised: 15 February 2019
/
Accepted: 15 February 2019
/
Published: 21 February 2019
(This article belongs to the Special Issue The Evolution of Cooperation in Game Theory and Social Simulation)
Abstract
:Social dilemmas are among the most puzzling issues in the biological and social sciences. Extensive theoretical efforts have been made in various realms such as economics, biology, mathematics, and even physics to figure out solution mechanisms to the dilemma in recent decades. Although punishment is thought to be a key mechanism, evolutionary game theory has revealed that the simplest form of punishment called peer punishment is useless to solve the dilemma, since peer punishment itself is costly. In the literature, more complex types of punishment, such as pool punishment or institutional punishment, have been exploited as effective mechanisms. So far, mechanisms that enable peer punishment to function as a solution to the social dilemma remain unclear. In this paper, we propose a theoretical way for peer punishment to work as a solution mechanism for the dilemma by incorporating prospect theory into evolutionary game theory. Prospect theory models human beings as agents that estimate small probabilities and loss of profit as greater than they actually are; thus, those agents feel that punishments are more frequent and harsher than they really are. We show that this kind of cognitive distortion makes players decide to cooperate to avoid being punished and that the cooperative state achieved by this mechanism is globally stable as well as evolutionarily stable in a wide range of parameter values.
Keywords:
evolution of cooperation; social dilemma; punishment; evolutionary games; prospect theory; nonlinear utilityPACS classifications:
02.30.Hq; 02.70.-c; 05.45.-a; 87.15.Aa; 87.23.-n; 87.23.KgJEL classifications:
C72; C73; D911. Introduction
Although cooperative relationships can be found in diverse systems ranging from microbiological communities to global economic spheres, cooperation frequently poses a scientific puzzle. Cooperation is clearly important to make biological and human societies effective and smooth, and evolutionary biologists and social scientists have long puzzled over the origin of cooperation. In recent decades, extensive theoretical efforts from various disciplines, such as economics, biology, mathematics, or even physics, have been made to figure out solution mechanisms to the cooperation dilemma [1,2,3,4,5,6,7].
In the literature, the cooperation puzzle is often called the social dilemma or the free rider problem. This can be described as follows: (1) individuals in a society have binary choices: cooperation (contributing to the community) or defection (refusing to contribute, i.e., free-riding), (2) a society consisting of cooperators is more profitable than that with only defectors, (3) but within a society, individual defectors do better than individual cooperators, since cooperators must incur a cost for contribution, while defectors do not.
Thus, the defective strategy dominates the cooperative strategy and is the Nash equilibrium in the framework of game theory. In other words, it is more advantageous for individuals to choose defection regardless of what other individuals choose, which, by natural selection or social learning, leads to a society with only defectors. The theoretical issue therefore is to explain why cooperation is so ubiquitous in the real world.
In the literature on the evolution of cooperation, various mechanisms have been proposed and investigated. Representative examples include kin selection, direct reciprocity, indirect reciprocity, group selection, and spatial and network reciprocity [8]. Besides these well-studied mechanisms, punishment is thought to be one of the effective mechanisms and is extensively investigated in the literature [9,10,11,12,13,14]. If individuals have a possibility of being punished when they do not pay costs for cooperation and if the strength of the punishment is so harsh that it cancels the profit obtained by free-riding, the players are expected to choose cooperation.
The most elementary type of punishment is informal or peer punishment, typified by the “As you wronged me, I will punish you” attitude. However, the evolution of this type of punishment remains a theoretical challenging puzzle [15,16,17]: a simple theory on the evolution of peer punishment predicts that no one chooses to punish to avoid bearing the implementation cost of the punishment. This new type of dilemma caused by the introduction of punishment is called the second-order dilemma. In fact, punishment itself incurs a cost on punishers; consequently, those who perform the punishment earn less payoff than those who do not punish. Punishment would be effective if there were those who choose to punish in the population. In this sense, punishers can be interpreted as a different type of contributor than cooperators. However, rational individuals will never choose to punish others. Thus, the second-order dilemma occurs.
Peer punishment itself is interpreted as a cooperative act; thus, it could be used for the avoidance of the second-order dilemma. One way is to introduce the possibility of punishing those who do not punish defectors—the second-order punishment. However, this again raises the third-order dilemma that no one chooses to implement the second-order punishment since it is costly. In general, an introduction of the -th order punishment raises the -th order dilemma, which results in an infinite regress of peer punishment [18,19,20]. The theoretical task is therefore to search for ways or mechanisms to cut the infinite chain.
In order to prevent the emergence of higher order dilemmas (which mean the -th order dilemmas for ), additional and mostly complex mechanisms have been proposed in the literature on evolutionary game theory [21,22,23,24,25,26,27,28,29,30,31]. For instance, if players are asked whether to contribute to public goods that will be used for punishment in the future, the second-order dilemma can be avoided; thus, cooperation evolves. This type of punishment is called formal or pool punishment.
In this present paper, we show a way for peer punishment to work without additional mechanisms. To do this, we take cognitive distortions of human beings into account. Most game-theory studies on the evolution of cooperation are based on the linear expected utility theory, which asserts that individuals’ decisions rely on accurate calculations of expected payoffs. On the other hand, experimental researches in behavioral economics and experimental economics have revealed that real human beings are not so rational that they can objectively estimate probabilities and values without biases, both of which are elements of expected payoffs [32,33,34,35,36,37]. Thus, payoffs attributed to real human beings are subjective, and this fact plays an essential role in actual decision-making processes.
One of the most successful theories describing irrationality is prospect theory [38,39,40]. In this theory, distortions of probabilities and values are modeled as a weighted function and a value function, respectively. The nonlinearities and asymmetric properties of these functions represent the irrationality of human beings in prospect theory. What happens if we analyze peer punishment, not assuming the linear expected utility theory but based on prospect theory to estimate expected payoffs? This is the main issue considered in this paper.
Thus, this paper gives the first opportunity to study the coevolution of cooperation and peer punishment in the framework of evolutionary game theory combined with prospect theory. Our main finding is that enlarging the effect of small probabilities makes it possible to avoid the second-order dilemma, which enables cooperation to evolve and to be sustained.
In the next section, we describe the game, strategies, and the model setting of this paper. Then, we derive the results and discuss them.
2. Materials and Methods
2.1. Game and Strategies
An infinitely large, well-mixed population of individuals (or players) is considered. From time to time, two players are selected at random from the population and made to engage in a “donation game” [5]: each player decides whether to support the opponent at a personal cost, . If a player chooses to support the other, the opponent receives a benefit ; otherwise, the player obtains nothing. Each individual in the population will experience such decision-making many times. From here on, we denote the action “support” by “C” and “refuse” by “D”. Table 1 shows the payoffs player A obtains when playing the donation game with player B.
After they have played the donation game, both players consider whether to punish their opponents or not if the other player chose D in the donation game. If a player chooses to punish its opponent, the other player’s payoff is reduced by . The punishment is not free but costly and therefore incurs a cost on the punisher. We assume the strength of punishment is greater than the punishment cost . We denote the decisions “punish” and “not punish” by “P” and “N”, respectively.
Thus, the game considered in this paper consists of two phases, which we call “donation phase” and “punishment phase”. We call the combined game “donation–punishment game”. In the donation phase, individuals consider whether to cooperate (support the other) or not, and in the punishment phase, they consider whether to punish their opponents when they choose D in the donation phase.
As a result, individuals have 4 options in total, i.e., there are 4 types of strategies: cooperate punish (CP), cooperate not-punish (CN), defect punish (DP), and defect not-punish (DN). Each individual follows one of these strategies and makes decisions according to the strategy. We denote the payoff matrix of the donation–punishment game described in Table 2 by .
We assume that individuals sometimes deviate from their strategies due to error. By a small probability, those individuals who intend to cooperate do not cooperate and vice versa. In the same way, individuals who intend to punish may not punish and vice versa. Note that we assume symmetric deviations in double meanings to reduce parameters. Firstly, probabilities of deviations from C (P) to D (N) and from D (N) to C (P) are the same. Secondly, probabilities of deviations from C to D and from P to N are the same, which implies that error between C and D and error between P and N are independent. All probabilities of deviations are denoted by one parameter, .
2.2. Payoff and Strategy Switching
2.2.1. Linear Expected Utility Theory
The long-term payoff of an individual depends on its strategy and other individuals’ strategies. For the sake of convenience, we denote the strategies by numbers: we call CP strategy 1, CN strategy 2, DP strategy 3, and DN strategy 4. Then denotes the frequency of the -th strategy in the population. These frequencies affect the expected payoffs that individuals obtain.
As mentioned above, we assume that individuals sometimes commit errors. This means that the strategy of an individual and its decisions may be different since actual actions can deviate from its strategies due to errors. We denote a strategy and an action actually chosen in a game by the same label. For instance, either means strategy CP or action CP, depending on the context.
Clearly, errors also affect the expected payoffs. Since an error occurs in decisions both for the donation and for the punishment, an individual with strategy may actually choose any other action. In order to calculate the expected payoffs, considering these, we introduce error vectors. A player with strategy 1 actually chooses its actions according to the following error vector: ( is the probability that an error does not occur.)
Here, the first element of the vector (the square of ) gives the probability that the individual chooses action 1 (CP), because a player with strategy 1 actually chooses action C (cooperation) with probability and P (punishment) with the same probability . The second, the third, and the fourth elements are defined in the same way. Thus, provides the probability distribution of actions chosen in a game of individuals with strategy 1.
Similarly, the vectors characterize the probability distributions on the action space of individuals with their corresponding strategies.
With these error vectors, the expected payoff of an individual with strategy when playing a game with an individual with strategy is given by
Since the probability that an individual with strategy encounters an individual with strategy is by the definition, the expected payoff of an individual with strategy is given by
We obtain the same expected payoff with a different approach. This approach will be used to derive distorted expected payoffs in the framework of prospect theory. The vector
represents the probability distribution of actions chosen by an arbitrary player selected at random from the population. Now we define matrix by
The element of the matrix is interpreted as the probability that a player with strategy obtains a payoff of of the payoff matrix of the donation–punishment game. Thus, matrix is a probability distribution over payoff matrix in the eyes of individuals with strategy . The expected payoff is then expressed as a sum of values (payoffs) multiplied by probabilities.
Players adaptively switch their strategies, aiming at more expected payoffs, which results in gradual changes of strategy frequencies. We assume that the time evolution of the frequency of strategy is governed by the replicator equation [41]:
2.2.2. Prospect Theory
The element of the matrix represents the probability that the outcome of the game is realized. Following prospect theory, we assume that this probability is subjectively calculated in a distorted way. The subjective probability is given by applying a nonlinear function called weighted function to the objective probability
with
where is an objectively given probability.
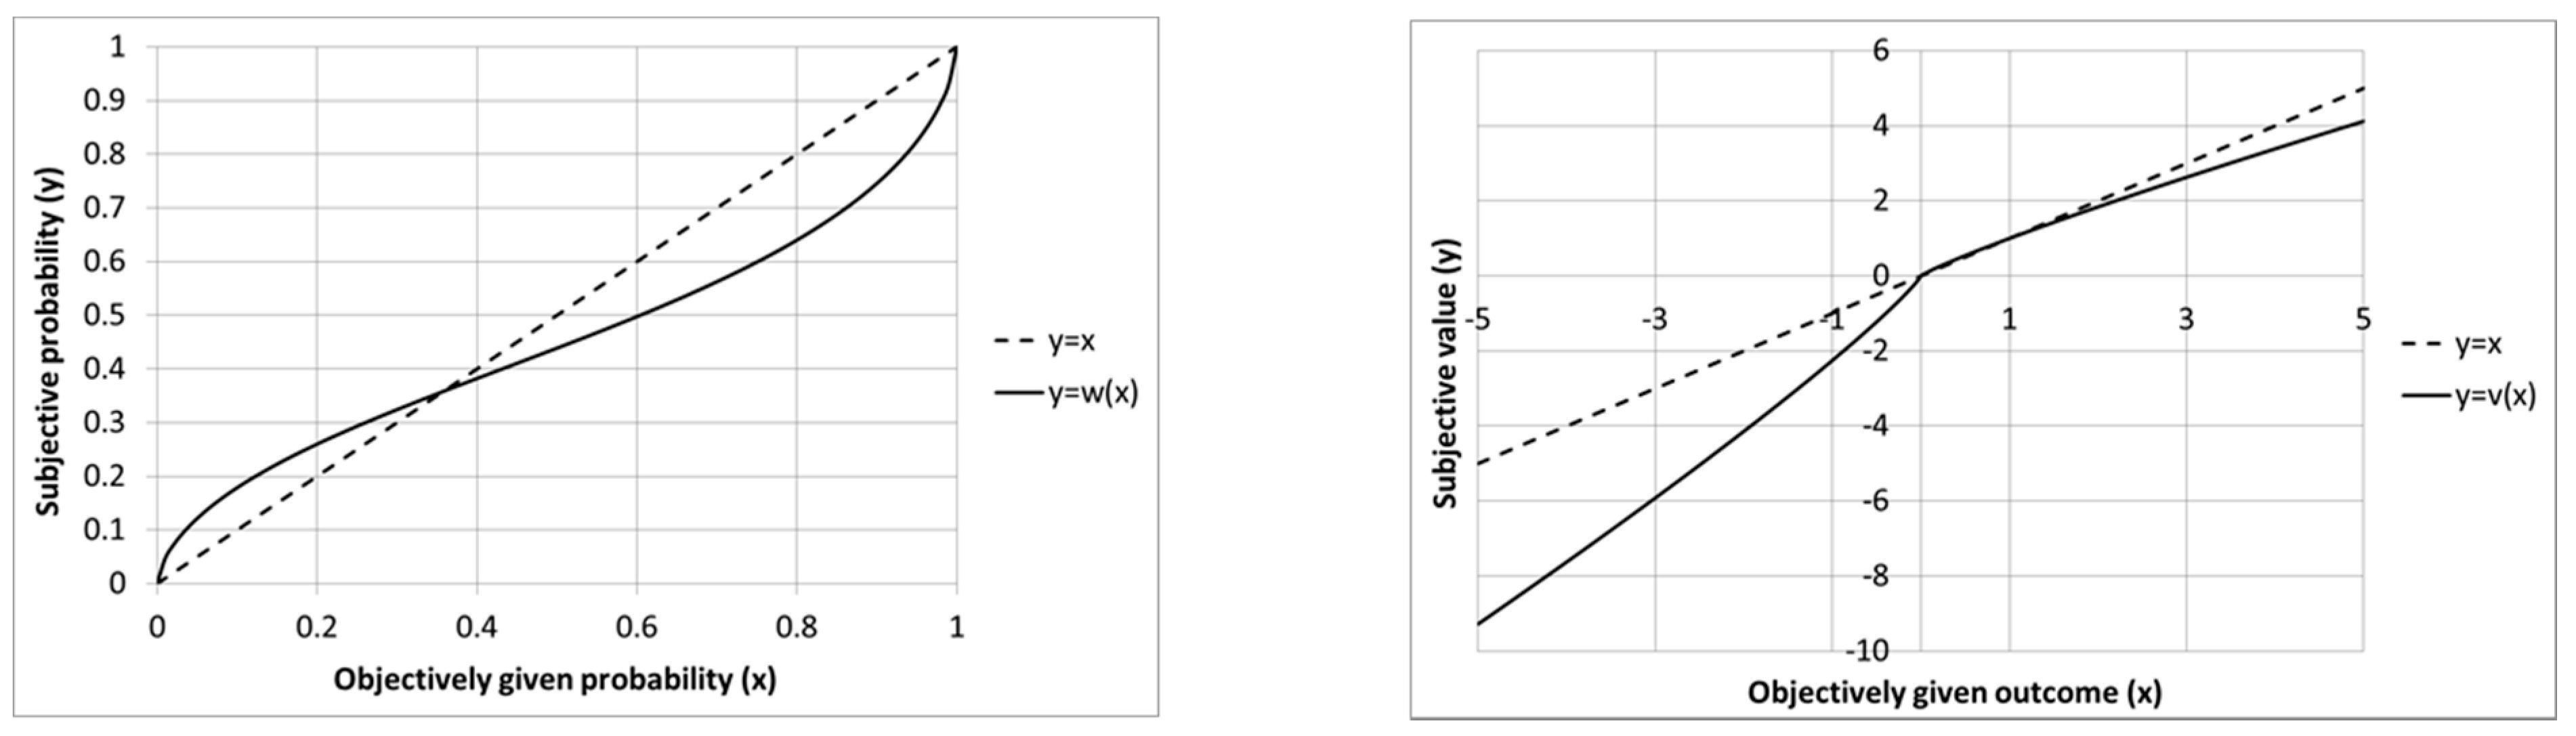
The function contains a parameter . If , the function is linear, and this case corresponds to linear expected utility theory. The smaller is, the more distorted the subjective probability is. If is too small ( the function is not monotonically increasing anymore. Therefore must be equal to or greater than 0.28 theoretically. In the literature of prospect theory, it is reported that values of around 0.65 best fit experimental results [38,39,40]. We set to 0.65 in the following analysis. The shape of the function with this parameter value is shown in the left panel of Figure 1. According to this function, small objective probabilities are estimated to be greater than they are because of for small . Analyses with other values of can be found in the supporting material.
Thus, the matrix is interpreted as a subjective probability distribution on in the eyes of individuals with strategy . Note that the probability distribution is not normalized; thus, the sum of subjective probabilities is not one in general because there is no experimental evidence that people are so rational that they normalize probabilities. In fact, the weighted function given by Equation (9) is asymmetric with respect to , which implies that is not equal to one (see the left panel of Figure 1).
In the same way as in the case of probabilities, the payoff matrix is also distorted by a nonlinear function
The function is called the value function, which is given by
where represents an objectively given outcome. The value function depends on two parameters and . If both parameters are one, the function is linear, which corresponds with the linear expected utility theory. In the original literature on the prospect theory [38], and are typical values that best fit experimental data. We adopt these parameter values in the following analysis. The right panel in Figure 1 shows the value function with these parameter values. Parameter implies that the value function is concave and that a person obeying this function is risk-averse. Parameter means that a person following this function is more sensitive to a loss than a gain (“loss-averse” so to say).
The subjectively distorted payoff matrix does not depend on strategies. Note that since the function is nonlinear, the baseline of the payoff matrix or the reference point influences the results, which is different from the linear expected utility theory. We assume that the payoff obtained from the outcome in , which is zero, is the reference point.
With these subjective probabilities and payoffs, the expected payoff is calculated by
The strategy change is described by the ordinary replicator dynamics mentioned in the last subsection (Equation (7)).
3. Results
By calculating for all and , we find some basic characteristics of the model. Firstly, the contradictory strategy DP (strategy three) is dominated by DN. Since it never becomes evolutionarily stable, we eliminate the strategy from the analysis. We are interested in the time evolution of the vector , which we call the state of the population.
Secondly, if the strength of punishment is so large that it exceeds , holds for the linear expected utility theory. This means that strategy two (CN) dominates strategy four (DN). In other words, the second-order dilemma does not occur even with the linear expected utility theory. We exclude these trivial situations and focus on the parameter region , in which the second-order dilemma (thus the first-order dilemma) occurs in the framework of the linear expected utility theory. The addressed question is whether the second-order dilemma will be solved in this parameter region under the prospect theory.
In the following analysis, we set and to reduce the dimension of the parameter space. Therefore, the variable parameters are the strength of punishment and error rate .
3.1. Vector Fields
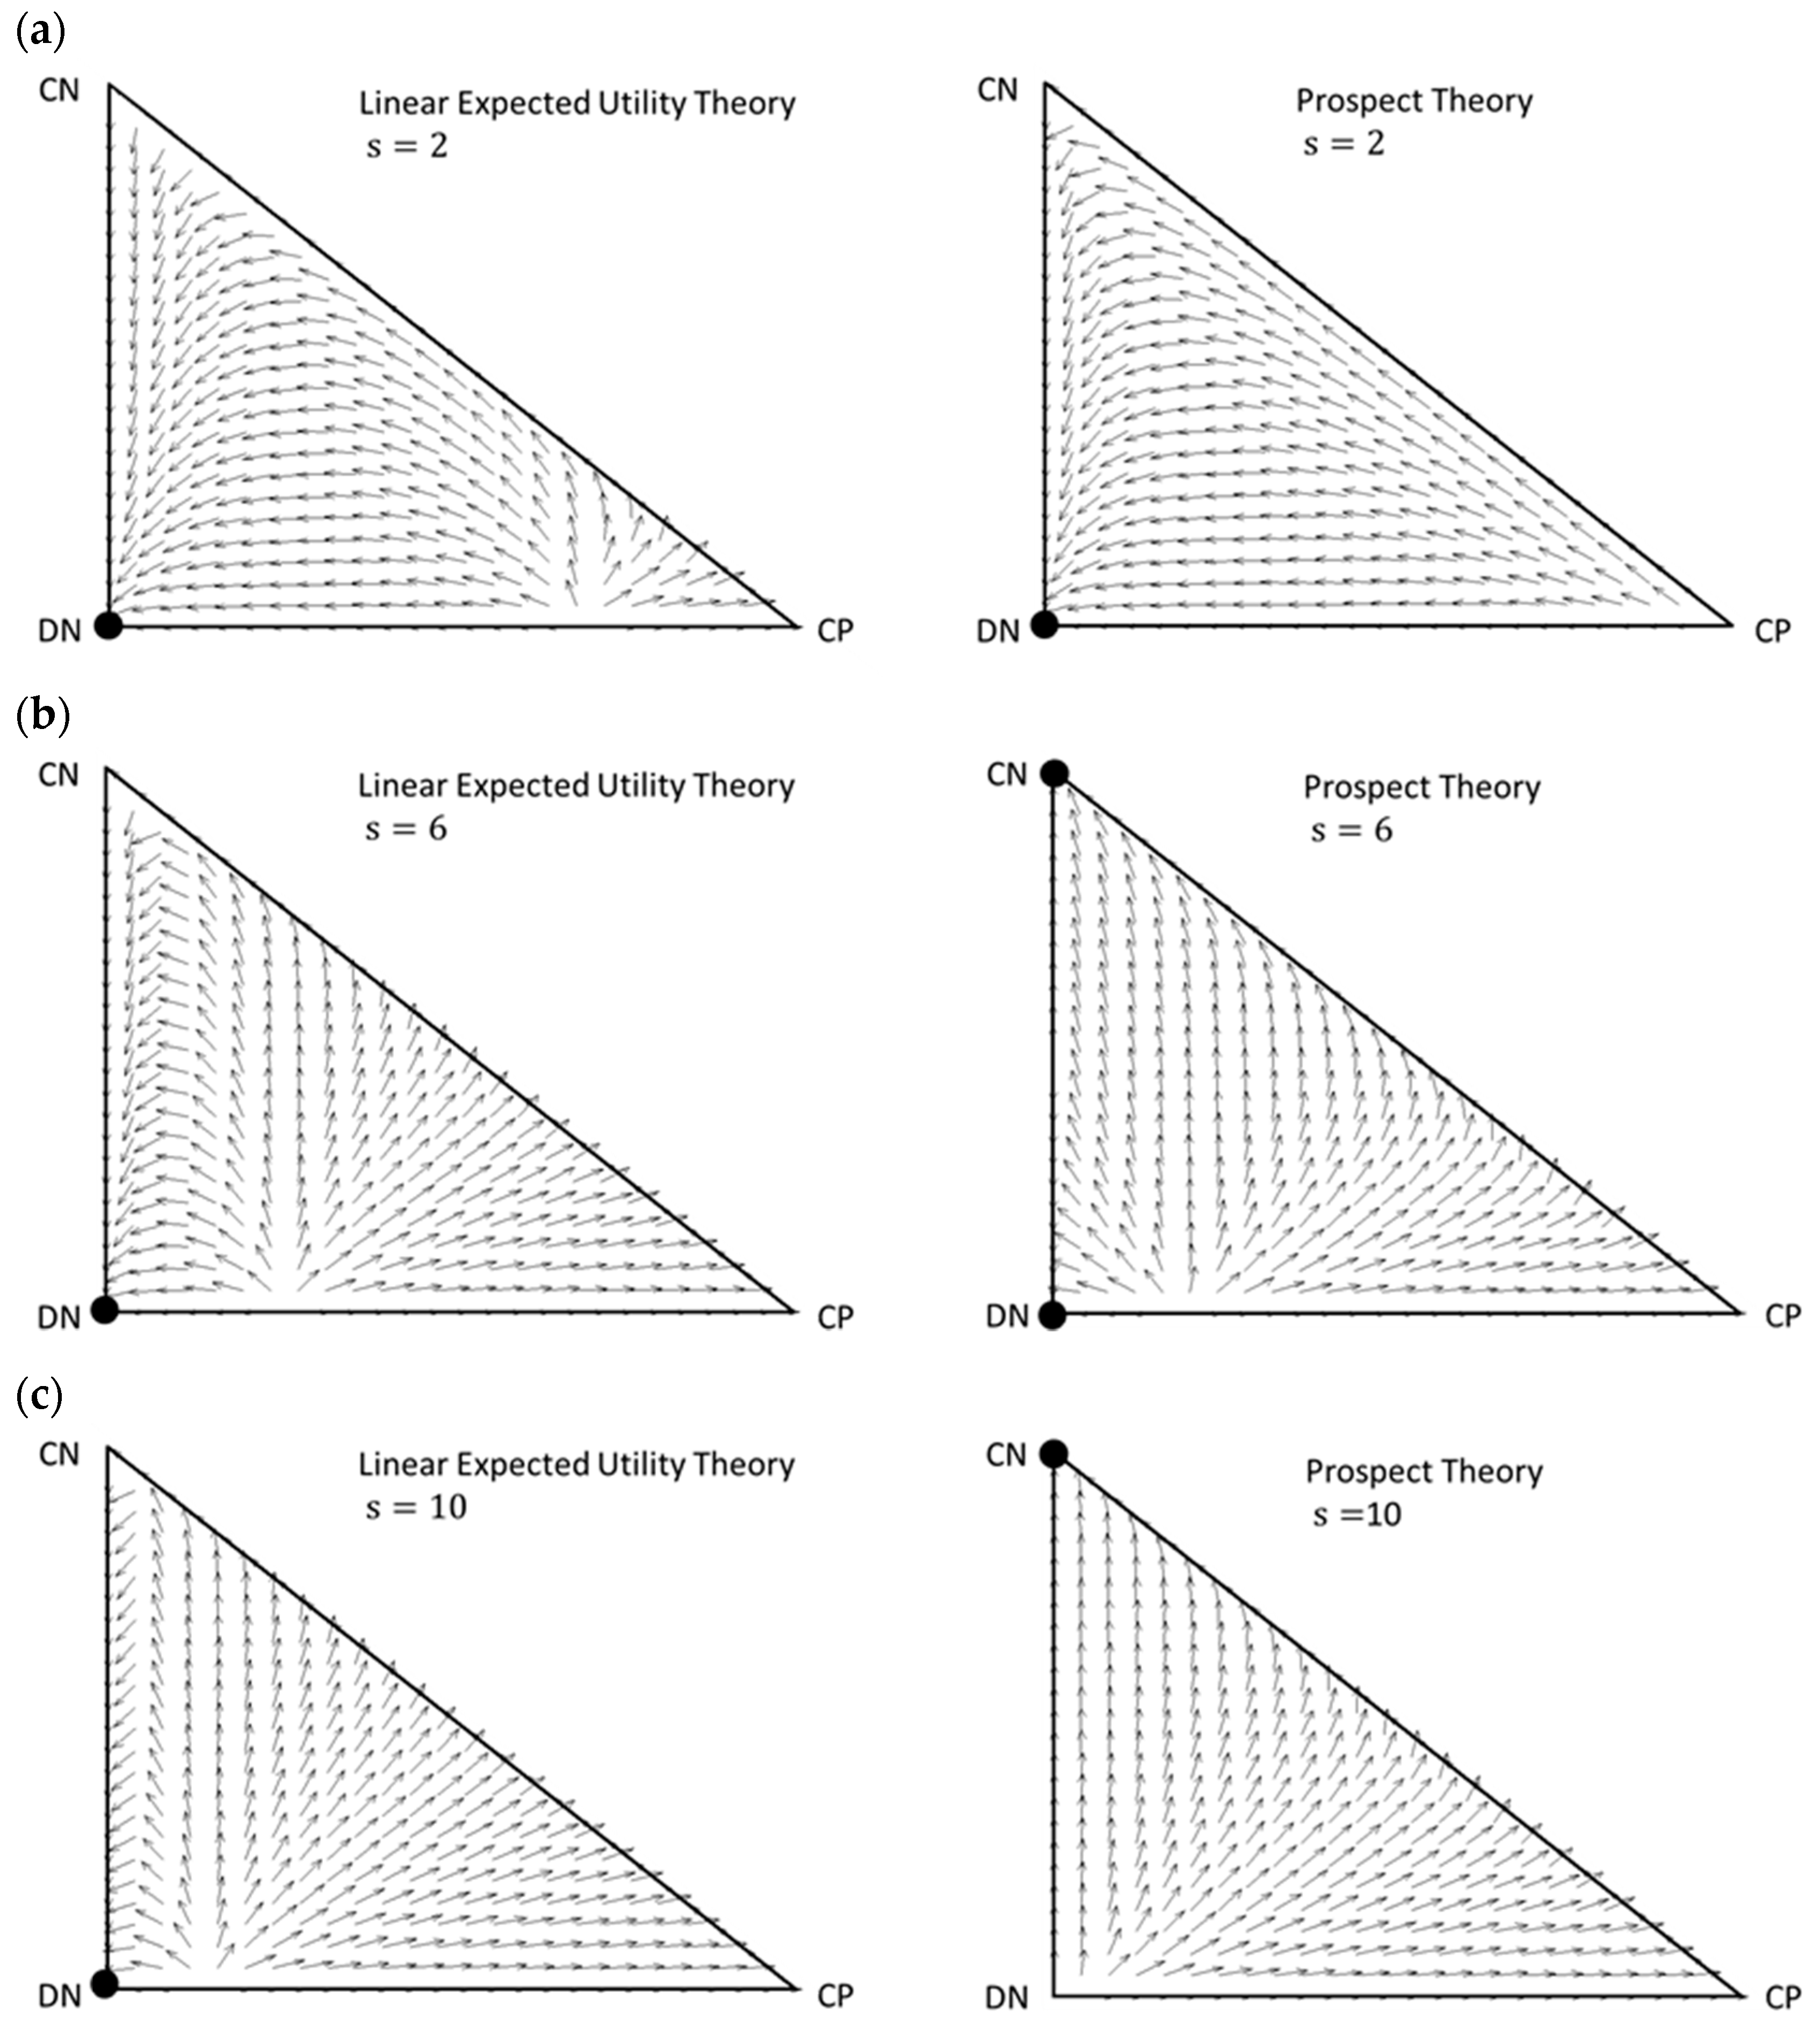
We show vector fields generated by the respective replicator dynamics derived from the linear expected utility theory and prospect theory, and we compare them in Figure 2. The state space is the simplex , which will be represented as a rectangular triangle in Figure 2. The vertex CP corresponds to , CN to , and DN to . The state of the population evolves along the vector fields in the state space. In the figure, stable fixed points are illustrated as solid circles. Note that the vector fields are normalized so that all vectors’ lengths are one. The strength of punishment is varied from , , to and we set the error rate at 0.05 as an example here. As we will see, we find qualitatively different outcomes (vector fields) with these three parameter sets. The same changes in outcomes occur if we set the error rate at other values (see Figure 3 in the next subsection in which both parameters and are varied).
If the strength of the punishment is low (panel (a)), the defective state DN is the only stable fixed point in both cases. On the edge CP–CN, CN dominates, and on the edge CN–DN, DN dominates. The difference of the two theories is found in the edge DN–CP. In the case of the linear expected utility theory, there is an unstable fixed point in the edge, and the system is bistable. On the other hand, strategy DN dominates strategy CP in the edge in case of prospect theory.
This tendency does not change if the strength of punishment is increased in the framework of the linear expected utility theory (the left picture of panel (b)). However, in the case of the prospect theory (the right picture of panel (b)), two unstable fixed points emerge in the edge CN–DN and in the edge DN–CP. As a result, the system becomes bistable. Thus, depending on initial conditions, trajectories approach either the cooperative state CN or defective state DN.
When the strength of punishment is increased further, there is no qualitative change for the linear expected utility theory (the left picture of panel (c)). Still, DN is the unique stable fixed point. In the case of prospect theory, however, DN becomes unstable and CN is the only stable fixed point in the state space; all trajectories (except for trajectories starting in the edge DN–CP) approach the cooperative state CN.
3.2. Stability Analysis of DN and CN
The above analysis clarified that the strength of punishment largely affects the system in the prospect theory. In fact, CN becomes “more” stable as the strength of punishment becomes large. Moreover, CP is always unstable regardless of the parameters. Taking these into account, we focus on the relation between CN and DN in the framework of prospect theory in this subsection. In order to investigate the effect of both parameters and , we look for conditions for the parameters with which CN can invade DN and/or vice versa.
To do this, we define as the expected payoff of individuals with strategy in the situation where they only encounter individuals with strategy . This expected payoff is given by
where and are the value function and the weighted function, respectively, is the -element of payoff matrix , and is the m-th (n-th) element of the error vector . Or, we can obtain by substituting into defined by Equation (12): with .
For instance, represents the expected payoff in the situation where individuals with the DN strategy only encounter those with the CN strategy, and is the expected payoff in the situation where individuals with the CN strategy only encounter those with the DN strategy.
Then, the inequality implies that a DN individual can invade into the population consisting of CN individuals. The inequality means that the population consisting of DN individuals cannot be invaded into by a CN individual. If both inequalities hold, which corresponds to the right panel of Figure 2a), we see that DN is globally stable. Likewise, if both inequalities and are true, CN is globally stable, which corresponds to the right panel of Figure 2c. If both and hold, DN cannot invade into CN and vice versa. Therefore, the system is bistable (The right panel of Figure 2b). We look for regions in the parameter space in which the above inequalities hold.
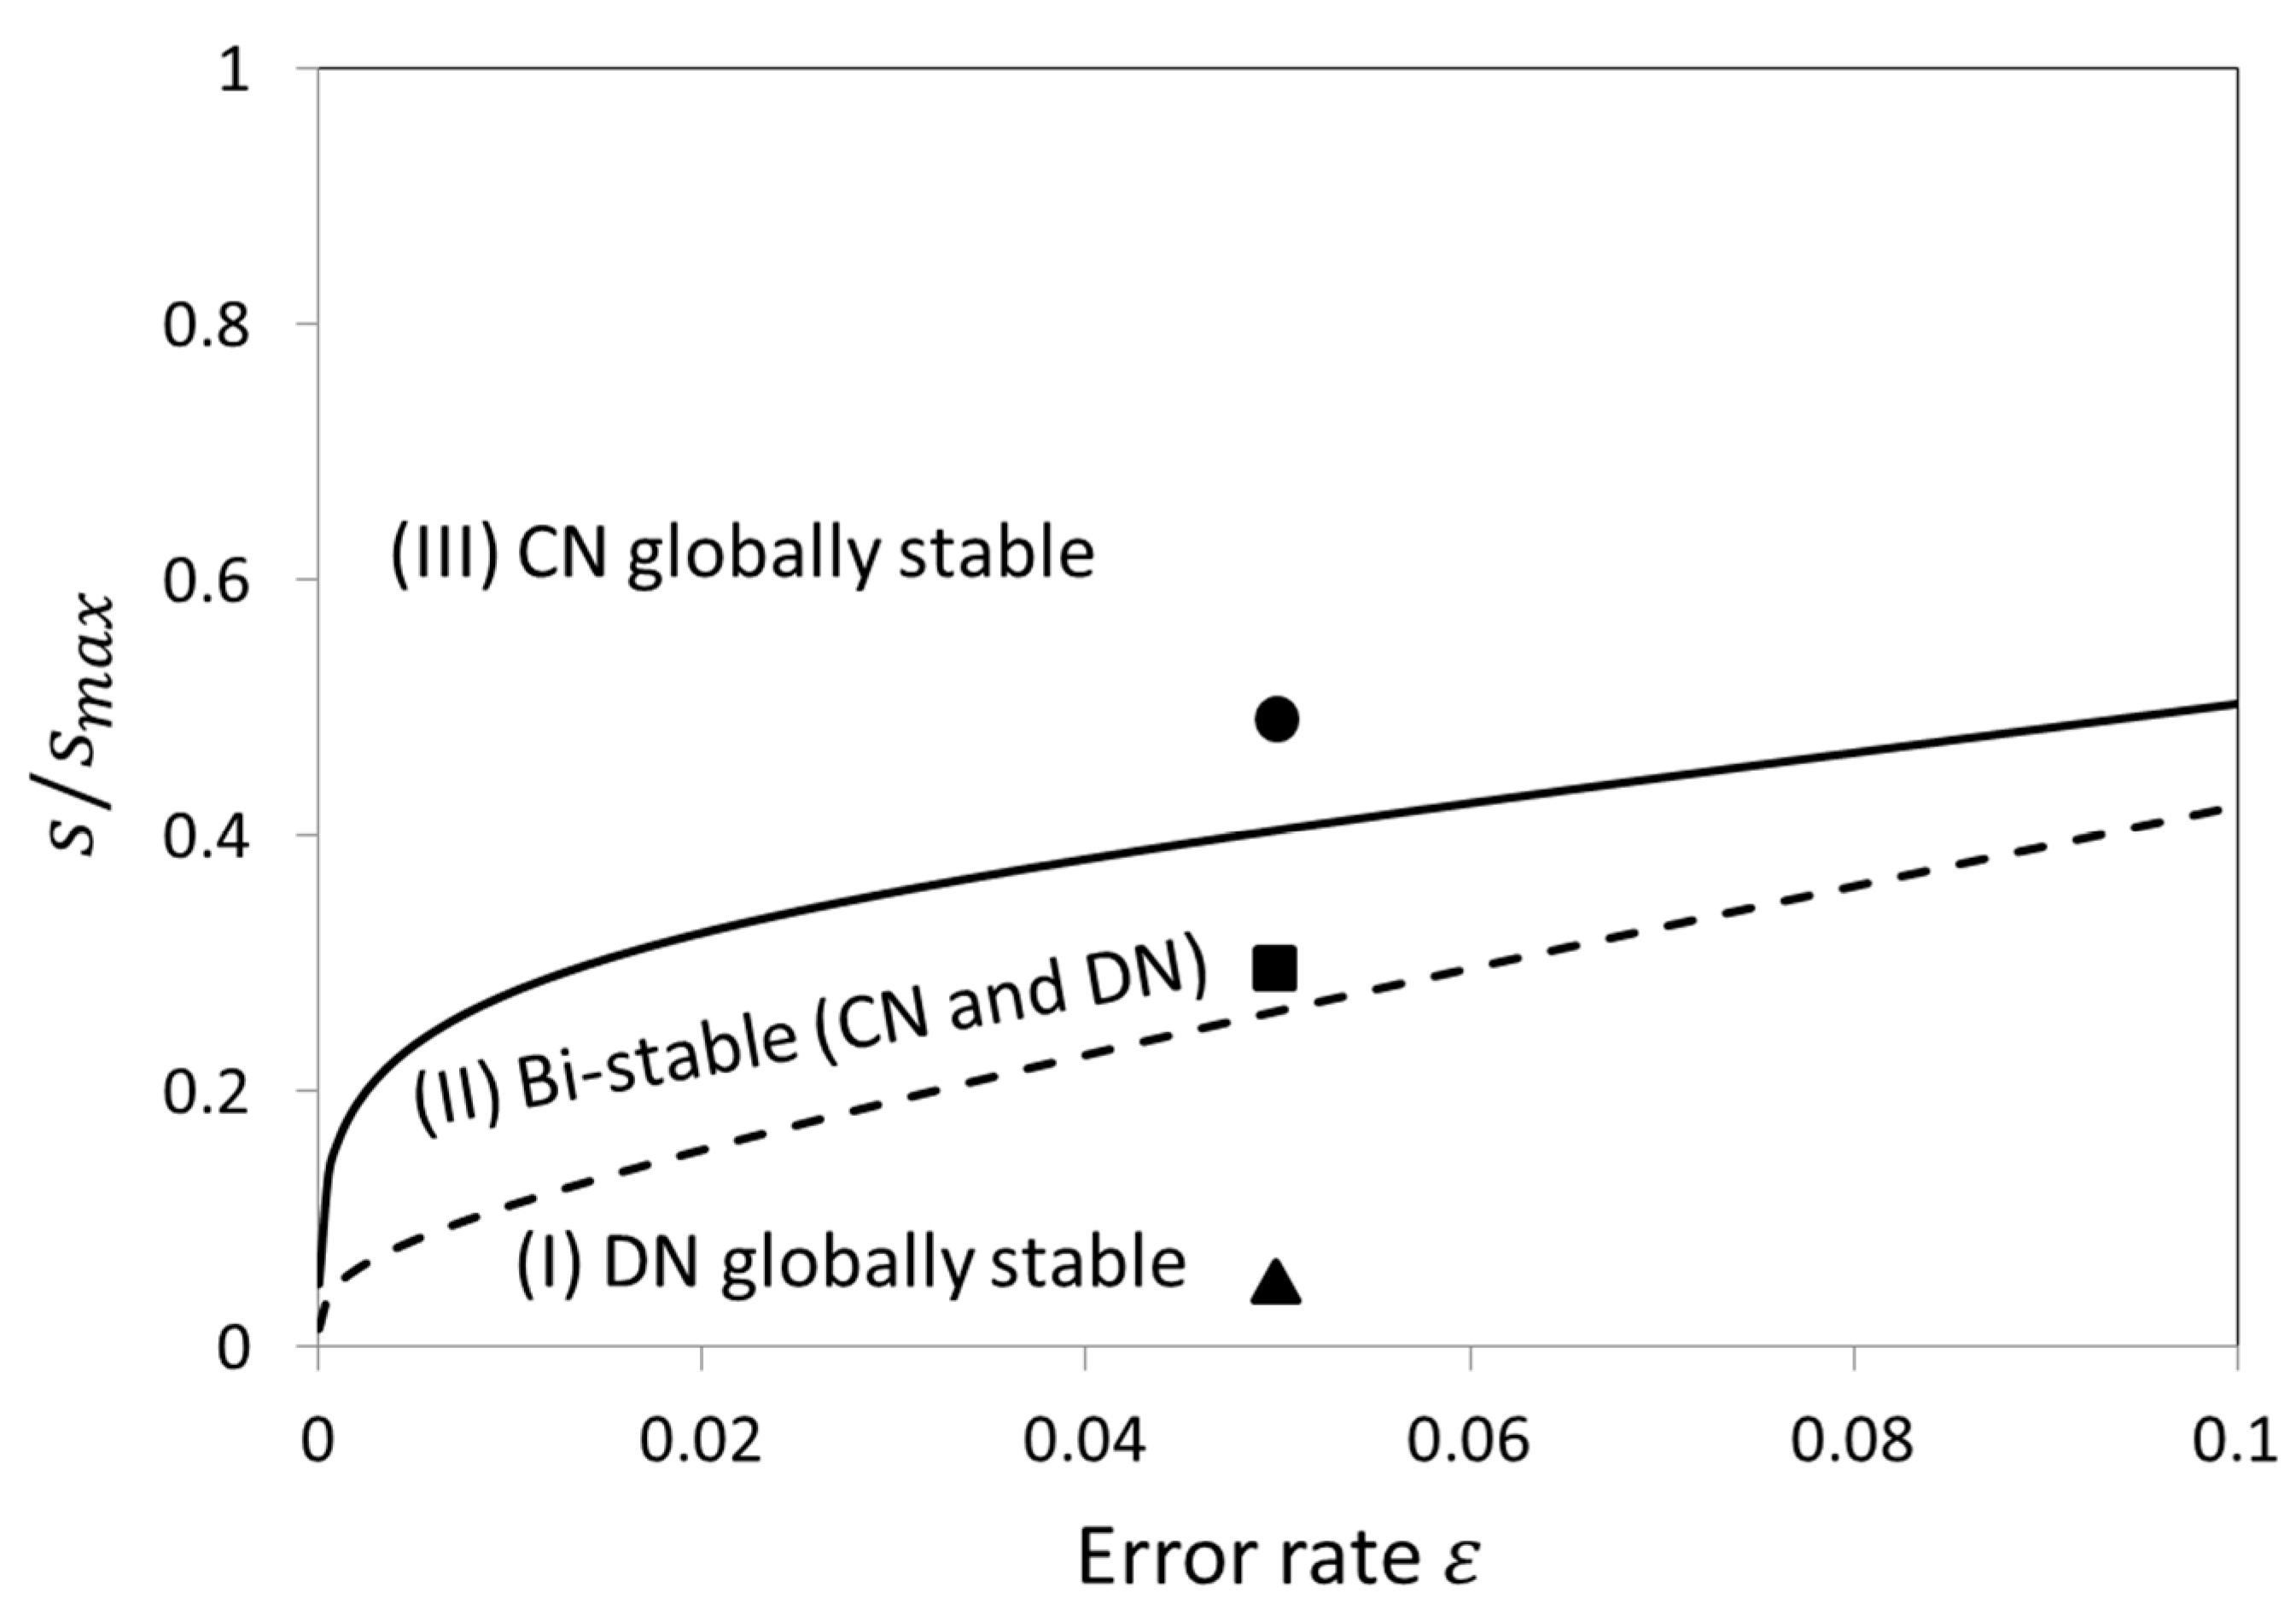
The result is shown in Figure 3. Note that the strength of punishment is normalized; thus, the vertical axis represents the value of . If this parameter value exceeds 1, the second-order dilemma is resolved even in the case of the linear expected utility theory, and CN is globally stable. This means that in the parameter space given in the figure, the second-order dilemma occurs in the case of the linear expected utility theory; thus, DN is globally stable. The question is where the prospect theory can resolve the dilemma in this parameter region.
In the framework of the prospect theory, regardless of parameter , DN is globally stable with small (region (I)). In this region there is no qualitative difference from the linear expected utility theory. The solid triangle illustrated in this region in the figure corresponds to the parameter set used to generate Figure 2a. However, increasing the strength of punishment gradually destabilizes DN and alternatively stabilizes CN in the case of the prospect theory. As a result, the system becomes bistable (region (II)) with moderate . The solid square in this region corresponds to , which was used to generate Figure 2b. With high , CN becomes able to invade DN populations, and CN becomes globally stable. We also see that the values of that represent boundaries between the regions (illustrated by solid and dashed curves in the figure) become large as functions of error rate . The solid circle put above the boundary in this region corresponds to used for Figure 2c.
The boundary drawn by the dashed curve in Figure 3 was found by numerically solving the equation with respect to for , where , , and . Note that we excluded , since cooperation cannot evolve even under the prospect theory in this case. The inequality ( holds under (above) this boundary. In order to find the boundary illustrated by the solid curve in Figure 3, the equation with respect to was solved. The inequality ( holds under (above) this boundary.
As mentioned above, we used a specific set of values for parameters , and to produce Figure 3. We also generated figures with different parameter values, which are presented in the supporting material. No qualitative differences are found when the values of these parameters are varied. Nevertheless, we see that stable regions become larger as values of parameters and are smaller and that the parameter does not affect the results very much. This indicates that the system becomes more easily stable as the weighted function, and the value function gains “more nonlinearity”.
4. Discussion
We explored the effects of cognitive distortions described by the prospect theory in the context of the evolution of cooperation by peer punishment. Our main finding is that cognitive distortions make it possible for cooperation to evolve even in the parameter region in which cooperation cannot be achieved in the framework of the linear expected utility theory. We also found that the cooperative punitive strategy (CP) is dominated by cooperative nonpunitive strategy (CN). Thus, not CP but CN plays an essential role to sustain cooperation.
The CN players basically do not punish others, but they actually punish with a small probability due to error. This erroneous punishment effectively drives cooperation as far as the prospect theory is utilized. The same erroneous punishment cannot promote cooperation when the linear expected utility theory is adopted.
A key reason for why the error has a large impact on the population in the case of the prospect theory is found in the weighted function and the value function . According to the weighted function, individuals estimate small probabilities greater than they really are, and according to the value function, they assess the loss of benefit more than it actually is. Therefore, agents described by the prospect theory feel that punishment is more frequent and harsher than they really are.
In other words, individuals described by prospect theory are more sensitive to peer punishment than those described by the linear expected theory. Alternatively, we could say that individuals described by the prospect theory have the ability to imagine punishment, and this kind of imagination induces the fear to be punished. Such individuals who are afraid of punishment, even if it seldom occurs due to error, choose to cooperate to avoid being punished.
In spite of the findings mentioned so far, we have to remark that there remain several issues relevant for the coevolution of cooperation and peer punishment. The model studied in this present research especially has many limitations, which offers some tasks for future research.
Here, we mention the following two issues: the emergence problem and antisocial punishment. The emergence problem relates to the question about who starts giving punishment for the first time in the population [28]. Even in pool punishment, it is not easy to start costly punishment successfully, since punishing right and left in a sea of defectors imposes too much effort and cost on punishers. Several studies have proposed additional mechanisms or assumptions to overcome this emergence problem [42,43,44,45,46]. A similar problem holds for the peer punishment studied in this paper. We assumed that individuals punish others due to an error with a small probability. That is, individuals have an idea that they have the option to punish others from the beginning, even though the punishing activities are performed unintentionally. Under this assumption, we analyzed differences between the linear expected utility theory and the prospect theory.
Moreover, we assumed that only defectors are punished, and there is no chance for cooperators to be punished. Allowing punishment against prosocial behavior, such as cooperative actions, can offset the payoff advantage of the cooperators over free-riding. If antisocial punishment is included into our model, individuals afraid of counterpunishment might stop choosing cooperation. This problem caused by antisocial punishment occurs not only in our model, but is widely recognized as a serious issue in the literature of evolution of cooperation with punishment [47,48,49].
On the other hand, if we turn our attention to indirect reciprocity, which is known to be a powerful mechanism for the evolution of cooperation, the evolution of social norms is extensively investigated [50,51,52,53,54,55]. Social norms are defined as views on what is “good” or “bad”, and indirect reciprocity works in the way that bad individuals are discriminated in the population (bad individuals are not supported). However, there are many possibilities for the definitions of what is good or bad (thus social norms), and one of the main tasks in indirect reciprocity is to search for evolutionarily stable social norms that can maintain cooperation.
From the viewpoint of indirect reciprocity, the assumption that only defectors are punished is equivalent to assuming that the population has the unique social norm that prescribes to assessments of defectors as bad (and bad individuals are punished). This type of social norm is named “Scoring” in the literature. Then, punishing cooperators (antisocial punishment) is equivalent to the social norm that regards cooperators as bad (“Antiscoring”). However, these are just a few examples of social norms. It is possible to consider other types of social norms, for instance, a norm that regards those as bad who cooperate with bad individuals.
A recent study using agent-based simulations revealed that prosocial norms such as “Scoring” can evolve, and antisocial norms such as “Antiscoring” become extinct in the melting pot of social norms if not a few but diverse norms coexist in the population [56]. In the model of this study, bad individuals are not punished, but they are not given help in the population. We can modify the model so that bad individuals are punished. Whether prosocial norms can also evolve in this modified model and thus whether the problem of antisocial punishment is solved is interesting and necessary research yet to be done. Recently, a paper was published which studies the coevolution of indirect reciprocity and punishment [57].
In extending our model with many social norms, agent-based simulations could be useful rather than an analytical approach taken in this paper. In this paper, we have discussed the evolution of cooperation in an analytical way under the assumption that there is a unique social norm in the population, and we have provided the first step to study the effects of cognitive distortions on the evolution of cooperation via peer punishment.
Supplementary Materials
The following are available online at https://0-www-mdpi-com.brum.beds.ac.uk/2073-4336/10/1/11/s1, Figure S1: Different domains in the parameter space for prospect theory (the upper panel) and the used weighted function and value function.). The parameter is varied from 1.5 to 3.0 with and fixed (at 0.65 and 0.88 respectively). The blue curves correspond to red curves to and green curves to . Figure S2: Different domains in the parameter space for prospect theory (the upper panel) and the used weighted function and value function (the left-lower panel and the right lower panel). The parameter is varied from 0.8 to 0.96 with and fixed (at 0.65 and 2.25 respectively), Figure S3: Different domains in the parameter space for prospect theory (the upper panel) and the used weighted function and value function (the left-lower panel and the right lower panel). The parameter is varied from 1.5 to 3.0 with and fixed (at 0.65 and 0.88 respectively).
Author Contributions
All authors conceived and designed the project. S.U. and H.Y. built and analyzed the model. S.U. wrote the paper. All authors discussed the results, helped draft and revised the manuscript, and approved the submission.
Funding
Part of this work was supported by JSPS (Grants-in-Aid for Scientific Research) 15KT0133 (HY), 17KK0055(IO), 16H03120(HY and IO), 17H02044(IO and HY), 18H03498 (HY and IO) and the Austrian Science Fund (FWF) P27018-G11 (TS).
Conflicts of Interest
The authors declare no conflict of interest. The founding sponsors had no role in the design of the study; in the collection, analyses, or interpretation of data; in the writing of the manuscript, and in the decision to publish the results.
References
- Nowak, M.A.; Highfield, R. Super Cooperators; Free Press: New York, NY, USA, 2011. [Google Scholar]
- Ostrom, E. Governing the Commons: The Evolution of Institutions for Collective Action; Cambridge University Press: Cambridge, UK, 1990. [Google Scholar]
- Bowls, S.; Gintis, H. A Cooperative Species; Princeton University Press: Princeton, UK; Oxford, UK, 2011. [Google Scholar]
- Yamagishi, T. Trust: The Evolutionary Game of Mind and Society; Springer: New York, NY, USA, 2011. [Google Scholar]
- Sigmund, K. The Calculus of Selfishness; Princeton University Press: Princeton, UK; Oxford, UK, 2010. [Google Scholar]
- Perc, M.; Jordan, J.J.; Rand, D.G.; Wang, Z.; Boccaletti, S.; Szolnoki, A. Statistical physics of human cooperation. Phys. Rep. 2017, 68, 1–51. [Google Scholar] [CrossRef]
- Nowak, M.A. Evolutionary Dynamics; Harvard University Press: Cambridge, MA, USA, 2006. [Google Scholar]
- Nowak, M.A. Five rules for the evolution of cooperation. Science 2006, 314, 1560–1563. [Google Scholar] [CrossRef] [PubMed]
- Balliet, D.; Mulder, L.B.; Van Lange, P.A. Reward, punishment, and cooperation: A meta-analysis. Psychol. Bull. 2011, 137, 594–615. [Google Scholar] [CrossRef] [PubMed]
- Guala, F. Reciprocity: Weak or strong? What punishment experiments do (and do not) demonstrate. Behav. Brain Sci. 2012, 35, 1–15. [Google Scholar] [CrossRef] [PubMed]
- Axelrod, R. An evolutionary approach to norms. Am. Political Sci. Rev. 1986, 80, 1095–1111. [Google Scholar] [CrossRef]
- Henrich, J.; McElreath, R.; Barr, A.; Ensminger, J.; Barrett, C.; Bolyanatz, A.; Cardenas, J.C.; Gurven, M.; Gwako, E.; Henrich, N.; et al. Costly punishment across human societies. Science 2006, 312, 1767–1770. [Google Scholar] [CrossRef] [PubMed]
- Mathew, S.; Boyd, R. Punishment sustains large-scale cooperation in prestate warfare. Proc. Natl. Acad. Sci. USA 2011, 108, 11375–11380. [Google Scholar] [CrossRef] [PubMed]
- Casari, M.; Luini, L. Cooperation under alternative punishment institutions: An experiment. J. Econ. Behav. Organ. 2009, 71, 273–282. [Google Scholar] [CrossRef]
- Fehr, E.; Gächter, S. Altruistic punishment in humans. Nature 2002, 415, 137–140. [Google Scholar] [CrossRef] [PubMed]
- Boyd, R.; Gintis, H.; Bowles, S.; Richerson, P.J. The evolution of altruistic punishment. Proc. Natl. Acad. Sci. USA 2003, 100, 3531–3535. [Google Scholar] [CrossRef] [PubMed]
- Sigmund, K.; Hauert, C.; Nowak, M.A. Reward and punishment. Proc. Natl. Acad. Sci. USA 2001, 98, 10757–10762. [Google Scholar] [CrossRef] [PubMed]
- Milinski, M.; Rockenbach, B. Human behaviour: Punisher pays. Nature 2008, 452, 297–298. [Google Scholar] [CrossRef] [PubMed]
- Kosfeld, M.; Okada, A.; Riedl, A. Institution formation in public goods games. Am. Econ. Rev. 2009, 99, 1335–1355. [Google Scholar] [CrossRef]
- Boyd, R.; Richerson, P.J. Punishment allows the evolution of cooperation (or anything else) in sizable groups. Ethol. Sociobiol. 1992, 13, 171–195. [Google Scholar] [CrossRef]
- Sigmund, K.; de Silva, H.; Traulsen, A.; Hauert, C. Social learning promotes institutions for governing the commons. Nature 2010, 466, 861–863. [Google Scholar] [CrossRef] [PubMed]
- Yamagishi, T. The provision of a sanctioning system as a public good. J. Personal. Soc. Psychol. 1986, 51, 110–116. [Google Scholar] [CrossRef]
- Traulsen, A.; Röhl, T.; Milinski, M. An economic experiment reveals that humans prefer pool punishment to maintain the commons. Proc. Biol. Sci. 2012, 279, 3716–3721. [Google Scholar] [CrossRef] [PubMed]
- Andreoni, J.; Gee, L.K. Gun for hire: Delegated enforcement and peer punishment in public goods provision. J. Public Econ. 2012, 96, 1036–1046. [Google Scholar] [CrossRef]
- Zhang, B.; Li, C.; De Silva, H.; Bednarik, P.; Sigmund, K. The evolution of sanctioning institutions: An experimental approach to the social contract. Exp. Econ. 2014, 17, 285–303. [Google Scholar] [CrossRef]
- Schoenmakers, S.; Hilbe, C.; Blasius, B.; Traulsen, A. Sanctions as honest signals—The evolution of pool punishment by public sanctioning institutions. J. Theor. Biol. 2014, 356, 36–46. [Google Scholar] [CrossRef] [PubMed]
- Okada, I.; Yamamoto, H.; Toriumi, F.; Sasaki, T. The effect of incentives and meta-incentives on the evolution of cooperation. PLoS Comput. Biol. 2015, 11, e1004232. [Google Scholar] [CrossRef] [PubMed]
- Sasaki, T.; Uchida, S.; Chen, X. Voluntary rewards mediate the evolution of pool punishment for maintaining public goods in large populations. Sci. Rep. 2015, 5, 8917. [Google Scholar] [CrossRef] [PubMed]
- Hilbe, C.; Traulsen, A.; Röhl, T.; Milinski, M. Democratic decisions establish stable authorities that overcome the paradox of second-order punishment. Proc. Natl. Acad. Sci. USA 2014, 111, 752–756. [Google Scholar] [CrossRef] [PubMed]
- Sasaki, T.; Brännström, Å.; Dieckmann, U.; Sigmund, K. The take-it-or-leave-it option allows small penalties to overcome social dilemmas. Proc. Natl. Acad. Sci. USA 2012, 109, 1165–1169. [Google Scholar] [CrossRef] [PubMed]
- Sasaki, T.; Okada, I.; Uchida, S.; Chen, X. Commitment to cooperation and peer punishment: Its evolution. Games 2015, 6, 574. [Google Scholar] [CrossRef]
- Tversky, A.; Kahneman, D. Judgement under uncertainty: Heuristics and biases. Science 1974, 185, 1124–1131. [Google Scholar] [CrossRef] [PubMed]
- Tversky, A.; Kahneman, D. Extensional vs. intuitive reasoning: The conjunction fallacy in probability judging. Psychol. Rev. 1983, 90, 293–315. [Google Scholar] [CrossRef]
- Schmeidler, D. Subjective probability and expected utility without additivity. Econometrica 1989, 57, 571–587. [Google Scholar] [CrossRef]
- Gilboa, I.; Schmeidler, D. Maxmin expected utility with a non-unique prior. J. Math. Econ. 1989, 18, 141–153. [Google Scholar] [CrossRef]
- Starmer, C. Developments in non-expected utility theory: The hunt for a descriptive theory of choice under risk. J. Econ. Lit. 2000, 38, 332–382. [Google Scholar] [CrossRef]
- Machina, M.J. Expected utility analysis without the independence axiom. Econometrica 1982, 50, 277–323. [Google Scholar] [CrossRef]
- Kahneman, D.; Tversky, A. Prospect theory: Analysis of decision under risk. Econometrica 1979, 47, 263–291. [Google Scholar] [CrossRef]
- Tversky, A.; Kahneman, D. Loss aversion in riskless choice: A reference-dependent model. Q. J. Econ. 1991, 106, 1039–1061. [Google Scholar] [CrossRef]
- Wakker, P.P. Prospect Theory: For Risk and Ambiguity; Cambridge University Press: Cambridge, UK, 2010. [Google Scholar]
- Hofbauer, J.; Sigmund, K. Evolutionary Games and Population Dynamics; Cambridge University Press: Cambridge, UK, 1998. [Google Scholar]
- Boyd, R.; Gintis, H.; Bowles, S. Coordinated punishment of defectors sustains cooperation and can proliferate when rare. Science 2010, 328, 617–620. [Google Scholar] [CrossRef] [PubMed]
- Raihani, N.J.; Bshary, R. The evolution of punishment in n-player public goods games: A volunteer’s dilemma. Evolution 2011, 65, 2725–2728. [Google Scholar] [CrossRef] [PubMed]
- Brandt, H.; Hauert, C.; Sigmund, K. Punishing and abstaining for public goods. Proc. Natl Acad. Sci. USA 2006, 103, 495–497. [Google Scholar] [CrossRef] [PubMed]
- Dercole, F.; De Carli, M.; Della Rossa, F.; Papadopoulos, A.V. Overpunishing is not necessary to fix cooperation in voluntary public goods games. J. Theor. Biol. 2013, 326, 70–81. [Google Scholar] [CrossRef] [PubMed]
- Hauert, C.; Traulsen, A.; Brandt, H.; Nowak, M.A.; Sigmund, K. Via freedom to coercion: The emergence of costly punishment. Science 2007, 316, 1905–1907. [Google Scholar] [CrossRef] [PubMed]
- Nikiforakis, N. Punishment and counter-punishment in public good games: Can we really govern ourselves? J. Public Econ. 2008, 92, 91–112. [Google Scholar] [CrossRef]
- Rand, D.G.; Nowak, M.A. The evolution of antisocial punishment in optional public goods games. Nat. Commun. 2011, 2, 434. [Google Scholar] [CrossRef] [PubMed]
- García, J.; Traulsen, A. Leaving the loners alone: Evolution of cooperation in the presence of antisocial punishment. J. Theor. Biol. 2012, 307, 168–173. [Google Scholar] [CrossRef] [PubMed]
- Ohtsuki, H.; Iwasa, Y. The leading eight: Social norms that can maintain cooperation by indirect reciprocity. J. Theor. Biol. 2006, 239, 435–444. [Google Scholar] [CrossRef] [PubMed]
- Nowak, M.A.; Sigmund, K. Evolution of indirect reciprocity. Nature 2005, 437, 1292–1298. [Google Scholar] [CrossRef] [PubMed]
- Sasaki, T.; Okada, I.; Nakai, Y. The evolution of conditional moral assessment in indirect reciprocity. Sci. Rep. 2017, 7, 41870. [Google Scholar] [CrossRef] [PubMed]
- Uchida, S.; Sigmund, K. The competition of assessment rules for indirect reciprocity. J. Theor. Biol. 2010, 263, 13–19. [Google Scholar] [CrossRef] [PubMed]
- Chalub, F.; Santos, F.C.; Pacheco, J.M. The evolution of norms. J. Theor. Biol. 2006, 241, 233–240. [Google Scholar] [CrossRef] [PubMed]
- Uchida, S.; Yamamoto, H.; Okada, I.; Sasaki, T. A Theoretical Approach to Norm Ecosystems: Two Adaptive Architectures of Indirect Reciprocity Show Different Paths to the Evolution of Cooperation. Front. Phys. 2018, 6, 14. [Google Scholar] [CrossRef]
- Yamamoto, H.; Okada, I.; Uchida, S.; Sasaki, T. A norm knockout method on indirect reciprocity to reveal indispensable norms. Sci. Rep. 2017, 7, 44146. [Google Scholar] [CrossRef] [PubMed]
- Schlaepfer, A. The emergence and selection of reputation systems that drive cooperative behaviour. Proc. R. Soc. B Biol. Sci. 2018, 285, 20181508. [Google Scholar] [CrossRef] [PubMed]
Figure 1.
Left panel: The weighted function (solid curve) defined by Equation (9) with parameter . The horizontal axis represents objectively given probabilities and the vertical axis is subjective probability denoted by . The linear function with corresponding to the linear expected utility theory is also displayed (dashed line). Right panel: The value function (solid curve) given by Equation (11) with parameters . The -axis represents objectively given outcomes and the -axis subjective values. The linear function with is also shown (dashed line).

Figure 2.
The vector fields yielded by the replicator dynamics for the linear expected utility theory (left panel) and for the prospect theory (right panel). The state space is the simplex defined by , which is drawn as a rectangular triangle. The arrows in each triangle show in which direction the state evolves in the rectangular triangle (including its edges). Parameters: . The strength of punishment is varied: (a) , (b) , (c) . Stable fixed points are illustrated as solid circles. We see that CN becomes stable as becomes larger for prospect theory, while DN is the unique stable fixed point in all cases for the linear expected utility theory.

Figure 3.
Different domains in the parameter space for prospect theory: (I) DN is globally stable (under the dashed line) in the case of the prospect theory, (II) both CN and DN are stable (the region sandwiched by the solid and dashed line). (III) CN is globally stable (the region above the solid line). In the parameter region shown in the figure, DN is globally stable in the case of the linear expected utility theory. The solid triangle in the figure corresponds to the parameter set used to generate Figure 2a, the solid square to , which was used to generate Figure 2b and the solid circle to for Figure 2c. We see that CN becomes stable as becomes larger for each error rate. However, the boundaries depicted by solid and dashed curves are monotonically increasing functions of error rate .


Table 1.
Payoffs player A obtains in donation game.
| Player B’s Options Player A’s Options | Cooperate (C) | Defect (D) |
|---|---|---|
| Cooperate (C) | b − c | −c |
| Defect (D) | b | 0 |
Table 2.
Payoffs player A obtains in donation-punishment game.
| Player B’s Options Player A’s Options | Cooperate Punish (CP) | Cooperate Not-Punish (CN) | Defect Punish (DP) | Defect Not-Punish (DN) |
|---|---|---|---|---|
| Cooperate Punish (CP) | b − c | b − c | −c − r | −c − r |
| Cooperate Not-punish (CN) | b − c | b − c | −c | −c |
| Defect Punish (DP) | b − s | b | −s − r | −r |
| Defect Not-punish (DN) | b − s | b | −s | 0 |
© 2019 by the authors. Licensee MDPI, Basel, Switzerland. This article is an open access article distributed under the terms and conditions of the Creative Commons Attribution (CC BY) license (http://creativecommons.org/licenses/by/4.0/).
Share and Cite
MDPI and ACS Style
Uchida, S.; Yamamoto, H.; Okada, I.; Sasaki, T. Evolution of Cooperation with Peer Punishment under Prospect Theory. Games 2019, 10, 11. https://0-doi-org.brum.beds.ac.uk/10.3390/g10010011
AMA Style
Uchida S, Yamamoto H, Okada I, Sasaki T. Evolution of Cooperation with Peer Punishment under Prospect Theory. Games. 2019; 10(1):11. https://0-doi-org.brum.beds.ac.uk/10.3390/g10010011
Chicago/Turabian StyleUchida, Satoshi, Hitoshi Yamamoto, Isamu Okada, and Tatsuya Sasaki. 2019. "Evolution of Cooperation with Peer Punishment under Prospect Theory" Games 10, no. 1: 11. https://0-doi-org.brum.beds.ac.uk/10.3390/g10010011
Note that from the first issue of 2016, this journal uses article numbers instead of page numbers. See further details here.