
Economic Harmony—A Rational Theory of Fairness and Cooperation in Strategic Interactions

Department of Psychology, University of Haifa, Abba Khoushy Avenue 199, Haifa 3498838, Israel
Games 2022, 13(3), 34; https://0-doi-org.brum.beds.ac.uk/10.3390/g13030034
Submission received: 19 February 2022
/
Revised: 20 March 2022
/
Accepted: 8 April 2022
/
Published: 21 April 2022
Abstract
:Experimental studies show that the Nash equilibrium and its refinements are poor predictors of behavior in non-cooperative strategic games. Cooperation models, such as ERC and inequality aversion, yield superior predictions compared to the standard game theory predictions. However, those models are short of providing a general theory of behavior in economic interactions. In two previous articles, we proposed a rational theory of behavior in non-cooperative games, termed Economic Harmony theory (EH). In EH, we retained the rationality principle but modified the players’ utilities by defining them as functions of the ratios between their actual and aspired payoffs. We also abandoned the equilibrium concept in favor of the concept of “harmony,” defined as the intersection of strategies at which all players are equally satisfied. We derived and tested the theory predictions of behavior in the ultimatum game, the bargaining game with alternating offers, and the sequential common-pool resource dilemma game. In this article, we summarize the main tenets of EH and its previous predictions and test its predictions for behaviors in the public goods game and the trust game. We demonstrate that the harmony solutions account well for the observed fairness and cooperation in all the tested games. The impressive predictions of the theory, without violating the rationality principle nor adding free parameters, indicate that the role of benevolent sentiments in promoting fairness and cooperation in the discussed games is only marginal. Strikingly, the Golden Ratio, known for its aesthetically pleasing properties, emerged as the point of fair demands in the ultimatum game, the sequential bargaining game with alternating offers, and the sequential CPR dilemma game. The emergence of the golden ratio as the fairness solution in these games suggests that our perception of fairness and beauty are correlated. Because the harmony predictions underwent post-tests, future experiments are needed for conducting ex ante tests of the theory in the discussed games and in other non-cooperative games. Given the good performance of economic harmony where game theory fails, we hope that experimental economists and other behavioral scientists undertake such a task.
Keywords:
game theory; Nash equilibrium; subgame perfect equilibrium; social dilemmas; common-pool resource dilemma; public goods; trust game; ultimatum game; bargaining games; alternating offers; aspiration level; expectations; cooperation; fairness; economic harmony; golden ratio; Fibonacci numbers1. Introduction
Standard game theory is one of the foundations of modern economic theory. It also serves as an important tool for analyzing and predicting behavior in many fields, including management sciences, social psychology, sociology, evolutionary sciences, sociobiology, and computer sciences, in which interactions between players could be modeled as strategic games. Underlying game theory is the assumption of neoclassical economics, prescribing that each player’s utility is non-decreasing with his payoff and independent on other players’ payoffs. For non-cooperative games, which comprise the focus of this paper, game theory predicts that players will eventually reach an “equilibrium”. The Nash equilibrium [1,2,3] is by far the most famous equilibrium. A set of strategies are in a Nash equilibrium if each strategy is the best response to the other strategies, such that if all players adhere to their equilibrium strategies, then no player could benefit by deviating from his or her equilibrium strategy unilaterally. Another well-known equilibrium concept is the sub-game perfect equilibrium, proposed by Reinhart Selten [4,5].
Despite being self-consistent and mathematically sound, game theory fails in predicting human behavior in many games that model important, real-life, socioeconomic interactions. This includes situations known as “social dilemmas”, such as the public goods (PG) game [6,7,8,9]), the common pool resource dilemma (CPR) game [10,11], and the trust game [12,13,14]. It also fails in predicting behavior in two-person bargaining games, such as the ultimatum game (UG) [15] and bargaining games with alternating offers [16,17]. As examples, for the single-trial PG game, the theory predicts that no player should contribute any portion of his or her endowment to public goods. In contrast, experiments show that many group members do contribute, and that under some conditions, they contribute all their endowments. For the trust game, game theory predicts that the first player should not transfer any of his endowment to the second player and that the second player should not transfer back any amount, had he received any transfer from the first player. In contrast, experiments on the trust game demonstrate that first players send significant portions of their endowments to the second player, and many second players “respect” the trust bestowed in them, and return non-negligible amounts to the first player [12,13,14].
For the standard UG, the sub-game perfect equilibrium predicts that the proposer demand and receive almost all the pie. Once again, this prediction fails when contrasted with experimental data, which show that the modal offer is half of the pie, and the mean offer is about forty percent.
A commonality to all the previously mentioned games is that the interacting individuals behave significantly more cooperatively and fairly than what game theory prescribes. To account for fairness and cooperation in strategic games, several theoretical models were proposed. Common to such models is the incorporation of other-regarding components in the player’s utility function. Prominent examples of such models include the “inequality aversion” theory (IA) [18] and the “equity, reciprocity and competition” (ERC) theory [19]. IA assumes that, along with the motivation to maximize their own payoffs, individuals are motivated to reduce the difference between their payoffs and the payoffs of others, although with a greater distaste for having lower rather than higher earnings. ERC assumes that along with their pecuniary gains, individuals are motivated by the ratio between their own payoff and the payoffs of others. Another model of cooperation and fairness is based on the concept of “cooperative equilibrium” [20]. This model assumes that players have a natural inclination to cooperate. Other models proposed to account for cooperation and fairness by including considerations of envy [21], empathy [22], and reputation effects [23].
All attempts to account for the fairness and cooperation observed in experimental games have undertaken that by modifying the players’ utility functions. However, the concept of equilibrium has remained untouched. In previous articles [24,25] we proposed a rational theory of fairness, termed Economic Harmony (EH), in which we modified the players’ utility functions in a manner that does not violate the rationality principle. We also abandoned the game-theoretic concept of equilibrium and replaced it with a novel concept of “harmony,” defined as the point of intersection of players’ strategies where all players are equally satisfied. In [24], we derived the harmony solutions for the demand in the standard ultimatum game and the requests in the sequential CPR game. Strikingly, the predicted demand in the UG turned out to be equal to the famous Golden Ratio (≈0.618 of the entire pie), and the ratio between the requests of players in subsequent positions in the game (, i = 1, 2, … n − 1) was also equal to the Golden Ratio. Those predictions were shown to be in excellent agreement with previous experimental data. In [25], we applied EH theory to the case of bargaining games with alternating offers and showed that the derived solution is successful in predicting the opening demands reported in several experiments on bargaining games with equal and unequal discount factors and game horizons. Strikingly, the predicted opening demand was also equal to the Golden Ratio.
In this paper, we first describe the main tenets of EH theory, and summarize the main results reported in [24,25]. We then utilize EH theory to generate predictions of behavior in the public goods game and the trust game. For each game, we derive a harmony prediction and pit it against the comparable equilibrium prediction in their success in accounting for experimental results.
2. Theory
Consider an economic interaction involving n players. Let denote the vector of player i’s admissible strategies. = , where is strategy j of player i (j = 1, 2, …, i = 1, 2, …, n). We define the subjective utility of each player i as:
where is player i’s actual payoff, is his or her aspired payoff, and u(..) is a bounded, non-decreasing utility function with its argument. For simplicity, we assume that u(0) = 0 and u(1) = 1.
Note that, unlike in ERC and Inequality Aversion theories, the individual utility function as defined above retains the rationality assumption. By this, we mean that the focal player is assumed to care only about his or her own self-interest. However, while in the standard economic model, the utility of a player i is a function of his or her own payoff in EH theory the utility of player i is a function of the ratio between the player’s actual payoff, , and his or her aspired payoff, . Note that while, in the classical model of utility, a normalization of the utility function is needed, in EH theory, the utility function is normalized by definition, since is bounded between 0 and 1 for all .
It is reasonable to think that the aspiration levels, (i = 1, 2, …, n), depend on the interaction between the individuals’ distinctive personalities, the game structure, and the players’ positions in the game. Ideally, one would measure the individuals’ aspirations. In the absence of empirical measures, as a first-order estimation, we shall make plausible assumptions regarding the aspiration levels of players in the discussed games.
A point of harmony in an interaction is defined as an intersection point of strategies played by the interacting players, at which the utilities of all players, as defined above, are equal. In formal terms, a point of harmony, in an interaction between n players, is a vector of outcomes = () for which the subjective utilities of all n players satisfy:
Assuming linear utilities, Equation (2) becomes:
One might ask how players could infer about other players’ aspirations, and why they should care about others’ satisfaction levels. The answer is two-fold. First, by using their theory of mind, players can imagine themselves in the positions of others and estimate their levels of aspiration. As an example, a proposer in the ultimatum game would take the perspective of the responder and ask himself, “What would I aspire for, had I been in the proposer’s position”. Second, in repeated games, the estimates of others’ aspirations are expected to evolve through learning. Similar to the Nash equilibrium and its refinements, in repeated interactions, players are not expected to “solve” the game and play their harmonious strategies. Rather, it is conjectured that harmonious strategies can emerge through some processes of learning and adaptation.
3. Predicting Behavior in Strategic Games
In this section, we first summarize the main results reported in [24,25] for the standard ultimatum game, the bargaining game with alternating offers, and the sequential CPR game. We then utilize EH to derive harmony solutions for the public goods game and the trust game and contrast them with experimental data.
3.1. The Ultimatum Game
In the standard ultimatum game, one player, designated as the proposer, receives an amount of monetary units and must decide how much to keep, and how much to transfer to another player (the responder). The responder replies either by accepting the proposed allocation, in which case both players receive their shares, or by rejecting the proposal, in which case the two players receive nothing. Thus, whereas the proposer has complete entitlement to make an offer, the responder can inflict a harsh, although costly, punishment on an unfair proposer.
Game theory predicts that a rational proposer, who believes that the responder is also rational, should offer the smallest amount possible, since the responder, being rational, will accept any positive offer. Experimental findings of numerous ultimatum studies refute this prediction. The modal offer in most experiments is the equal split, and the mean offer is ≈40% of the entire amount [15,26,27]. A meta-analysis on ultimatum experiments conducted in twenty-six countries with different cultural backgrounds [28] reported a mean offer of 41.5% (std = 5.7%), and yet another large cross-cultural study conducted in 15 small-scale societies [29] reported a mean offer of 40.5% (std = 8.3). Thus, in stark difference with the prediction of game theory, in the previously cited studies, and in many other uncited studies, divisions of ≈60–40 (%) for the proposer and responder, respectively, seem to be robust across countries, cultures, socio-economic levels, monetary stakes, etc.
To derive the EH prediction for the standard ultimatum game, let us assume, without loss of generality, that the proposer must divide one monetary unit (1MU). If he or she offers to keep x MUs (and transfer 1 − x MUs to the responder), then using Equation (3) we can write:
where and are the aspiration levels of the proposer and the responder, respectively. Solving for x yields:
and the amount offered to the responder is:
Determining , which guarantees equal levels of satisfaction, requires the measurement of the players’ maximal aspirations. In the absence of such measurements, it is reasonable to think that a self-interested proposer would aspire for the entire sum ( = 1). Hypothesizing about the responder’s aspired payoff is trickier. We consider two plausible possibilities: (1) the responder might aspire to receive half of the total amount; (2) he or she might aspire to receive an amount that equals the amount the proposer offers to keeps to himself or herself. Although at first sight, the two conjectures seem identical, they are not. Under the first assumption, we have = 1 and = . Substitution in Equations (5) and (6) yields:
and the amount offered to the responder is:
Under the second assumption, = 1 and = x. Substitution in Equation (5) yields:
Solving for , we get:
which solves for:
where φ is the Golden Ratio [30,31] , where is the nth term of the Fibonacci Series: 0, 1, 1, 2, 3, 5, 8, 13, 21, 34, 55, 89, 144, …, in which each term is equal to the sum of the two preceding terms, or: . The corresponding portion for the responder is:
In [24], we tested the above prediction using data from the aforementioned meta-analysis study [28], and the small-scale societies study [29]. The reported mean proportional offers in the two aforementioned studies were, respectively, 0.395 and 0.405, both quite close to the Golden Ratio prediction of 1 − φ ≈ 0.382. A two one-sided test of equivalence (TOST) (cf. [32]) validated this conjecture. For study [28], the analysis yielded significant results for the upper and lower bounds of the equivalence range (upper bound = 42.016, p < 0.0001; lower bound = 34.377, p = 0.0425; overall significance = 0.0425). For study [29], the results were also significant (upper bound = 42.016, p = 0.012; lower bound = 34.377, p = 0.0255; overall significance = 0.0255).
It is important to stress that the harmony solution is not an equilibrium. For example, if the proposer deviates from the harmony point (Proposer offers (φ, 1 − φ), φ ≈ 0.618; responder accepts) by raising their demand to, say, 0.8, then their utility will increase, and consequently, the lower offer will result in decreasing the utility of the responder. Notwithstanding, the empirical results, even in one-period ultimatum games, show unequivocally, that, on average, players opt for the unstable, out-of-equilibrium harmony solution.
The instability of the harmony solution is also characteristic of the harmony solutions of all the games discussed in this article and is not restricted to the case of the ultimatum game. Notwithstanding, there are numerous studies showing that various social mechanisms are effective in achieving and stabilizing high levels of cooperation and fairness in strategic games, in which the unique equilibrium is an overreaching defection. Punishment is a prominent mechanism, which has attracted much research interest. In the standard ultimatum game discussed previously, the respondent can inflict a costly punishment on an unfair proposer. The sanctioning agency can also be a third party, as in a dictator game with third party punishment [29], a group punishment as in public goods games [33], punishment by a group leader [34], or by a central authority [35]. Another well-studied mechanism that has been shown to be instrumental in achieving and stabilizing cooperation, is reputation [36,37,38].
Notably, the prediction of a Golden Ratio division in the ultimatum game was obtained independently by Schuster [39], using the method of infinite continued fractions and the Fibonacci numbers. The emergence of the Golden Ratio as the point of Harmony at which the proposer and responder are equally satisfied, adds to its numerous appearances in all sciences and in the arts, aesthetics, and design. In the concluding section, we shall say more about appearances of the golden ratio in the sciences and arts. The fact that a fairness solution is also aesthetically appealing, suggests that our perceptions of beauty and fairness are correlated.
3.2. Bargaining Games with Alternating Offers
In a typical bargaining game with a fixed discounting factor, one player (P1) proposes a division of a “pie”, which another player (P2) must accept or reject. If P2 accepts, the game ends and the parties receive their shares of the pie. If P2 rejects the proposal, the game continues for another period, and the right to make a counterproposal goes to P2. If P1 accepts the proposal of P2, the game ends with the two receiving their respective shares, but if P1 rejects the proposal of P2, the right to propose a division goes back to P1, and so on. Importantly, the value of the pie shrinks during each period. The shrinkage from one period to another could be equal for the two players, or different for each player. In a game with a finite horizon, if agreement is not reached in a fixed number of periods, both parties receive zero payoffs. In the infinite horizon game, the alternation of offers continue until an agreement is reached, or alternatively, until the pie shrinks to zero.
The game-theoretic solution for the finite game could be worked out using the backward induction method. For the infinite horizon game, back induction does not apply. For such games, Ariel Rubinstein [16] proved the existence of a unique SPE, which depends on the form of the pie shrinkage. For a game with fixed discount factors (1), the only SPE prescribes that the game should end in the first period, with Player1 demanding , and for the special case = δ, the aforementioned solution reduces to (0 < δ <1).
As noted by many researchers, the SPE is a poor predictor of bargainers’ demands and offers [40,41,42,43]. It has been repeatedly shown by experiments that human subjects do not engage in backward induction as much as game theory prescribes [43,44,45,46], they seldom reach subgame perfect equilibria [43,44,46], they show considerable levels of fairness, and they do not exploit their advantageous strategic positions in the bargaining environment [46,47,48].
In addition to the failure of the SPE in making quantitative predictions of demands, it also fails to explain some puzzling results in bargaining experiments. One unexplained result, which contradicts SPE reasoning, indicates that second players who reject opening offers from the first players, often give disadvantageous counterproposals, which yields to them less than what they would have received had they accepted the opening offer of the first player [40,41,42,43].
In a recent article [25], we derived the harmony solution for the bargaining game. Our reasoning was as follows: Suppose that the size of the pie at round one is one monetary unit (1MU), and that the two players have completed n − 1 periods without reaching an agreement. For n, an odd number, it is now the turn of P1 to make an offer on dividing a pie, which has now shrunk from 1MU in period 1, to MU for P1, and to MU for P2. Assume that P1 demands a portion of ( ≤ 1) and offers 1 − Harmony will be achieved if:
where and are the discount factors of P1 and P2, respectively (, < 1), and are the aspiration levels of P1 and P2 at period n, respectively. In [25], we reasoned that while a rational P1 would aspire for the entire pie, i.e., = , P2’s aspiration depends on the ethical norms governing their aspiration. We discuss two prominent norms: first, equality, which implies that P2 should aspire to receive half of the pie, i.e., = , and second, equity, which implies that P2 should aspire for proportional equality, i.e., = . In other words, P2 would aspire that, in relative terms, P1 treats P2 as P1 treats himself or herself. Here, we only summarize the prediction for the equity norm (a detailed analysis and predictions for the two-abovementioned norms is detailed in [25]).
Substituting = = in Equation (13) gives:
which yields
denote = R. For positive , Equation (15) solves for:
Thus, the harmony demand and transfer for P1 and P2 are, respectively:
and
For the case of equal discount factors: = = δ (R = 1), Equations (16)–(18) reduce to:
and
Since 0 < < 1, the maximal payoff for P1, and P2, while maintaining harmony, is achieved in period n = 1. Setting n = 1 in Equations (20) and (21), the respective demand of P1 and transfer to P2 become:
and
Thus, for the case of equal discount factors, Economic Harmony theory predicts that the game should end in period 1, with P1 making an opening demand of = φ ≈ 0.618 of the pie and P2 accepting a share of (1 − φ) ≈ 0.382. Strikingly, this prediction is identical to the one derived by the theory for the one-period ultimatum game discussed in the previous section.
Detailed analysis and predictions for the case in which, for some reason, agreement is not reached in period 1, is detailed in [25].
A similar analysis for the general case of unequal discount factors is detailed in [25]. We found that in games ending in period 1, the predicted harmony demand exhibits a non-monotonicity (or “knee”) effect, which depends only on the discount factor of the second player. For values of ≤ φ, P1 should demand a portion of the pie equaling the Golden Ratio. For values of > φ, the harmony demand of P1 in the first period is predicted to decline linearly with delta, with a slope equaling φ. In addition, in [25], we derived and tested the prediction that in games with ≤ φ ≈ 0.618 that does not end in agreement in the first round, the demand of P2 in the second round will be less than what they had been offered by P1 and was rejected by him or her in the first round. We found that the weighted average of disadvantageous counterproposals from six experiments with unequal discount factors yielded a high percentage of 74.3%, which nicely agrees with EH’s theory prediction (for more details see [25]).
3.2.1. Comparison with Experimental Results
In [25], we tested EH theory predictions using data from five studies, which employed a variety of discount factors and game horizons. The investigated experiments, together with their parameters, are depicted in Table 1. Studies [41,43] provide data for testing the predicted “knee” effect, and studies [42,43] enables to test the theory predictions for the case of unequal discount factors.
3.2.2. Equal Discount Factors
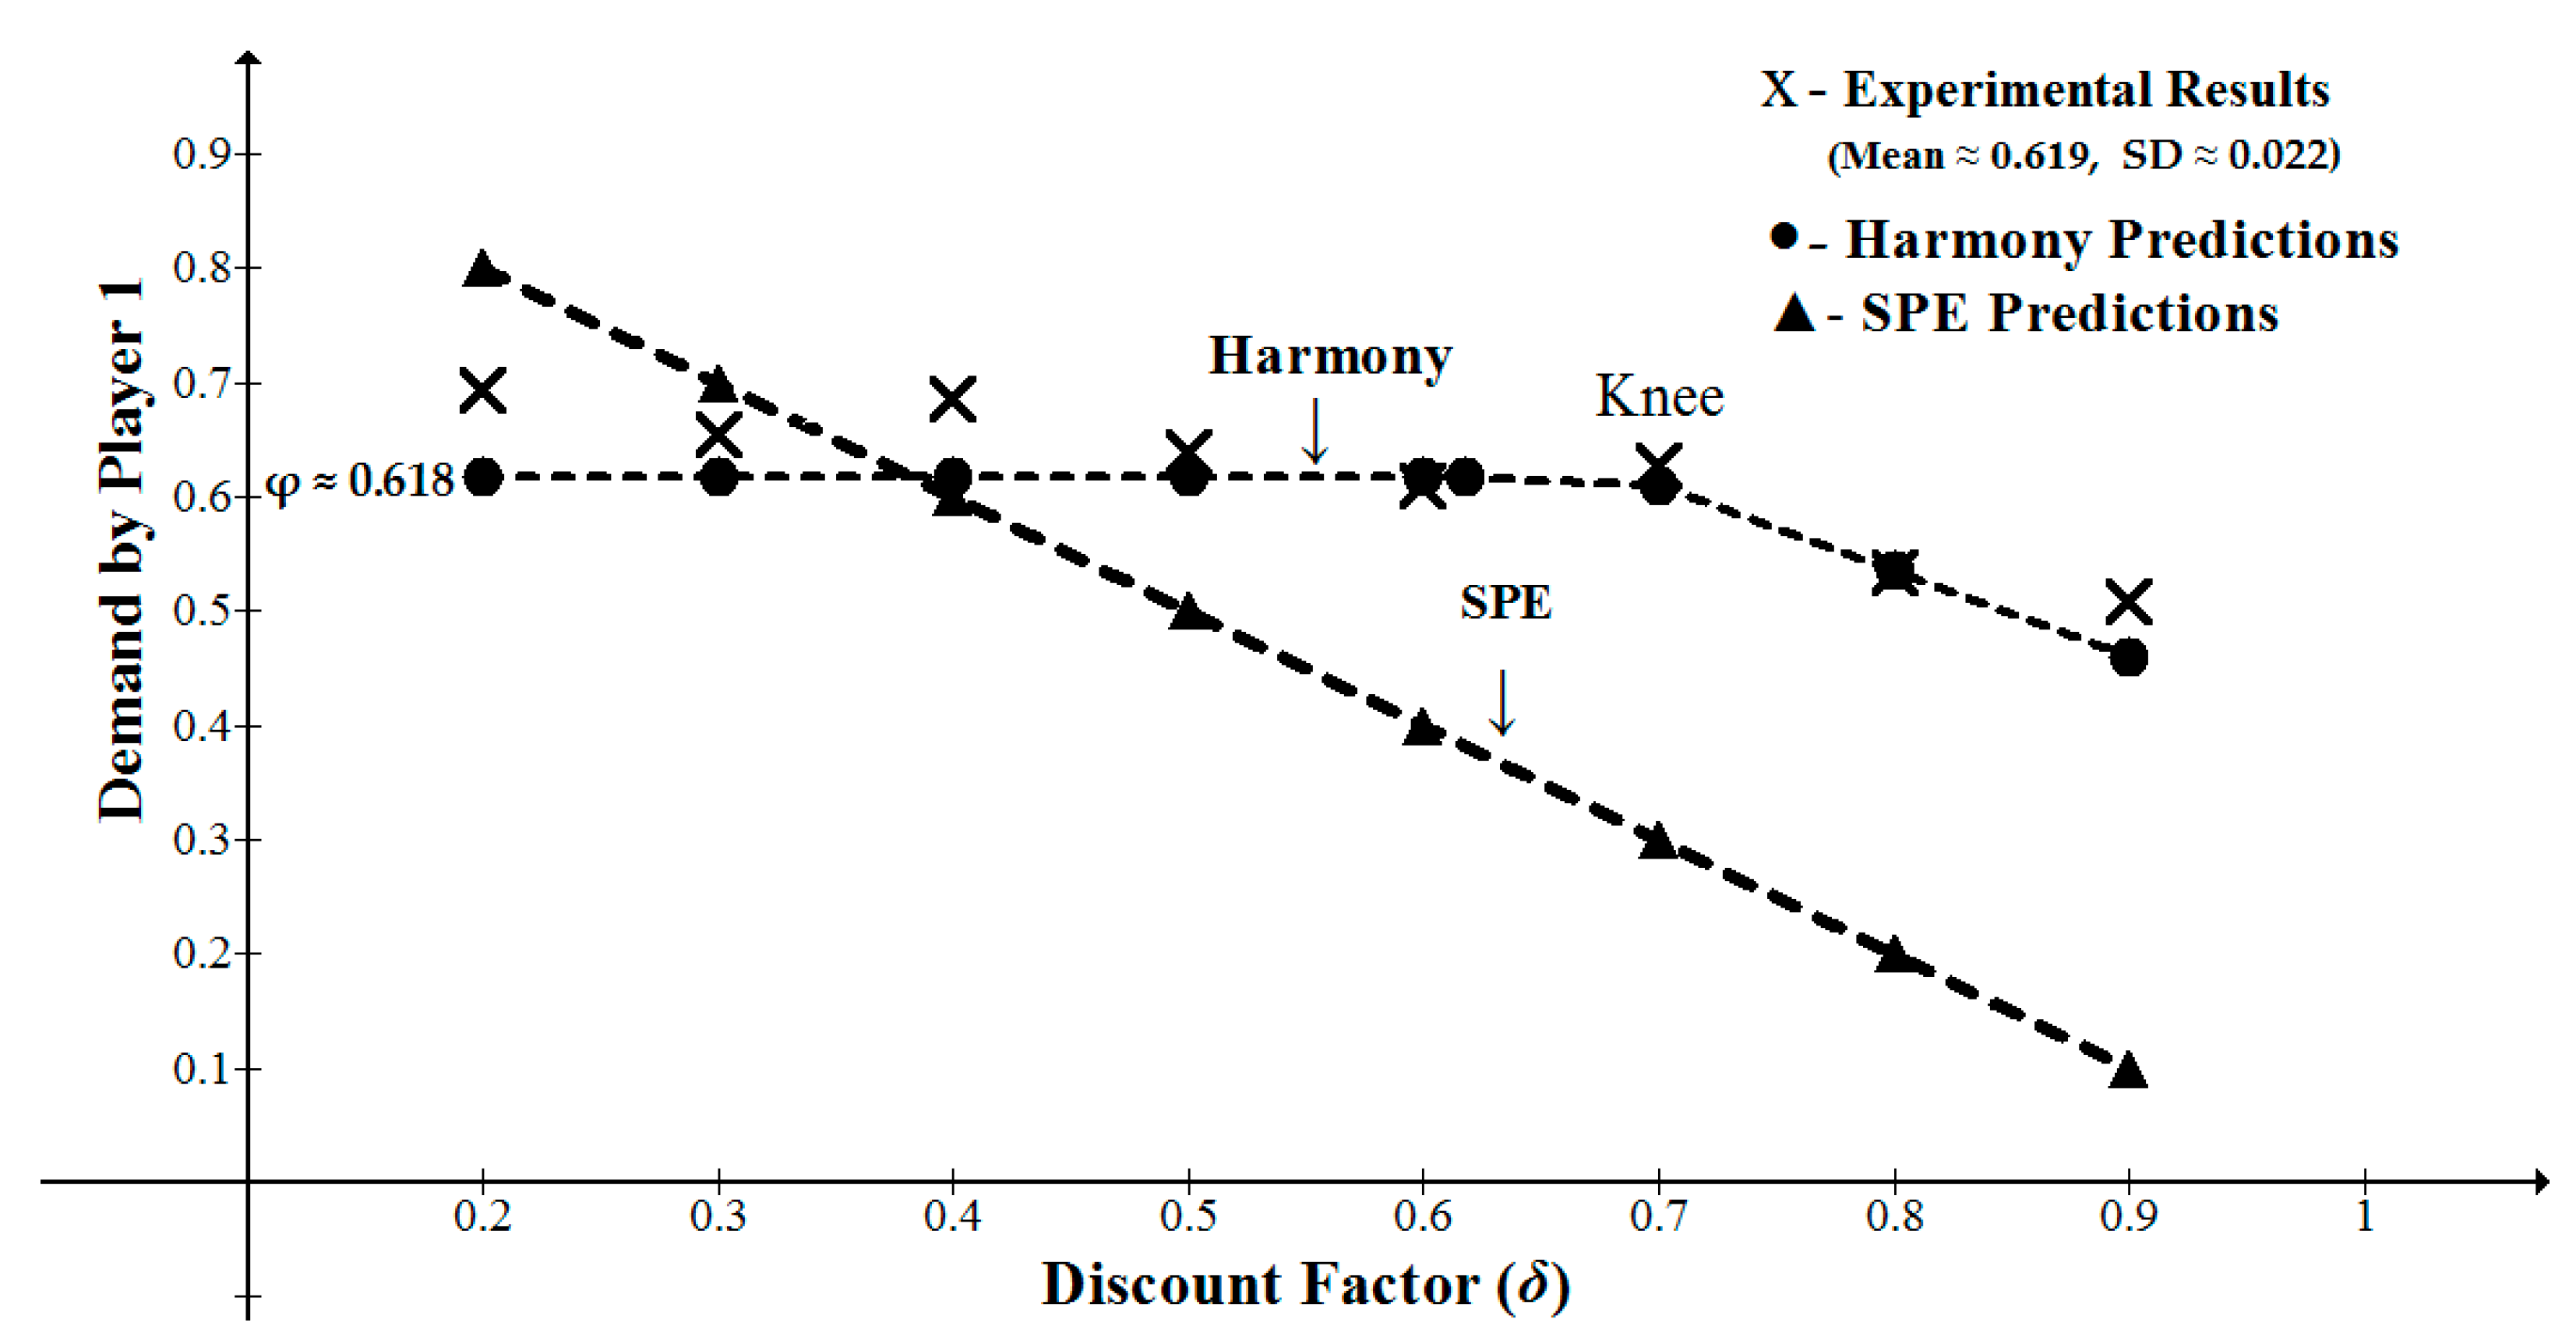
Binmore et al. [41] reported experiments with one-stage and two-stage bargaining games with alternating offers and various discount factors. Their main objective was to examine whether players will respect backward induction. They found that the players’ behavior systematically violated both subgame and truncation consistency. In their study, Game III included two periods played under eight discount factors (see Table 2). The five lower discount factors (δ = 0.2–0.6) are below the “knee” at δ ≈ 0.618 predicted by EH theory, while the remaining three discount factors (δ = 0.7, 0.8, 0.9) are above the “knee”. For the lower five δ conditions, the theory predicts that agreement should end in period 1, with P1 demanding ≈0.618 of the pie. For the highest three δ conditions, the predicted opening demand by P1 is 1 − φ δ ≈ 1 − 0.618 δ. Table 2 and Figure 1 depict the mean demands under each δ condition, together with the predictions of EH theory and the SPE solution. A linear regression of the observed demand on the predicted demand by economic harmony yields an of ≈ 0.82. The superiority of EH theory over the SPE solution is evident. The prediction error for EH is ) × 100 = 7.3%, and the prediction errors of the SPE is 36.4%. Strikingly, the demand of P1 exhibits a “knee” effect at δ ≈ 0.6, which is almost identical to the Golden Ration (see Figure 1).
3.2.3. Unequal Discount Factors
Weg et al. [43] investigated a two-person bargaining game with alternating offers and infinite horizon. They reported two experiments in which the discount factors of the players were manipulated in a between-subjects design, such that the discount factor for P1 was more than, equal to, or less than the discount factor of P2. The authors termed the three conditions, respectively, as Strong (S), Equal (E), and Weak (W). In all conditions, the pie to be split was 60 NIS (about $16). In the first experiment, the discount factors were ( = 0.9, = 0.5) ( = 0.67, = 0.67), and ( = 0.5, = 0.9), and in the second experiment, the conditions were ( = 0.50, = 0.17), ( = 0.17, = 0.17), and ( = 0.17, = 0.50). Here we present only the results of the first experiment, since the values chosen for in this experiment (0.5, 0.67, 0.9) allows us to test the predicted discontinuity effect. This prediction prescribes that, for = 0.5, P1 should demand φ ≈ 0.618 of the pie, while for the other two conditions ( = 0.67, and = 0.9), the demands of P1 are predicted to be equal to 1 − φ . For = 0.67, the predicted demand is 1 − 0.618 × 0.67 = 0.586, and for = 0.9, the predicted demand is 1 − 0.618 × 0.9 = 0.444. The SPE prediction of P1’s demand, using the Rubinstein solution, is equal to . For the three tested conditions ( = 0.9, = 0.5), ( = 0.67, = 0.67), and ( = 0.5, = 0.9), the SPE predictions are 0.909, 0.599, and 0.181, respectively. The results of the experiment revealed that, on average, 79.4% of the games ended with agreement in period 1. The mean proportional opening demands were 0.50, 0.48, and 0.393 for the strong, equal, and weak conditions, respectively.
Figure 2, adopted from [25] depicts the experimental results together with the EH and SPE predictions. The mean prediction error for the harmony solution is ) × 100 = 19.55%, compared with 53.51% for the SPE solution. The differences between the harmony predictions and the experimental results for conditions = 0.5 and = 0.67 are almost equal (0.118 and 0.106, respectively). Thus, a moderate risk aversion or security level added to the utility function of subjects in the role of P1 could lower the harmony prediction error, without affecting the error of the SPE in a similar manner.
Strikingly, the discontinuity effect predicted by the model is supported qualitatively by the data, although the observed decline after the knee is less steep in the experimental figure than in the EH prediction (see Figure 2).
3.3. Three Social Dilemmas
Social dilemmas are situations defined by two properties: (a) each individual receives a higher payoff for a socially defecting choice than for a socially cooperative choice, no matter what the other individuals in society do, but (b) all individuals are better off if all cooperate than if all defect [49]. Here, we discuss three prominent dilemma games: The common-pool resource (CPR) game, investigated in [24], the public goods (PG) game, and the trust game. For each game, we derive the harmonious solution, and compare it with experimental data.
3.3.1. The Common-Pool Resource Dilemma Game
The common-pool resource (CPR) dilemma game models situations in which a group of people consumes a limited, shared resource. Consumption of public resources, such as fresh water, poses a dilemma since overconsumption, which is in the interest of each individual, will eventually result in the depletion, or even destruction, of the resource [50].
Experimental studies on CPR dilemmas utilized various protocols of play [51]. Two of the most investigated protocols of play are the simultaneous and the sequential protocols. Under the simultaneous protocol, players make their requests from the CPR simultaneously and anonymously. Under the sequential protocol, which we discuss here, individual requests are made in an exogenously determined order, which is common knowledge, such that each player knows his position in the sequence and the requests of the players who have preceded him or her in the sequence. For a resource with a fixed and commonly known size, the sub-game perfect equilibrium of the sequential CPR game prescribes that the first player in the sequence should demand almost all the amount available in CPR, leaving an infinitesimally small portion to others. This prediction is strongly refuted by experimental results, showing that first players in the sequence do not exploit their position, leaving much of the resource for others’ consumptions [52,53,54,55]. In addition, studies reveal a robust position effect: individuals’ requests are inversely related to their positions in the sequence, with the first mover requesting the most, and the last mover requesting the least [52,55,56,57].
In [24], we derived and tested the harmony solution for a step-level sequential CPR game. In this version of the game, if the sum of all requests exceeds a commonly known threshold, the CPR “collapses”, and all players receive nothing. The derivation of the harmony solution for such a game could be summarized as follows: Denote the requests of players occupying positions i and i + 1 in the sequence, i = 1, 2, …, n − 1, by and . The subgame between two successive players, and has the structure of a two-person ultimatum game, in which harmony is achieved if:
where φ is the Golden Ratio.
3.3.2. Comparison with Experimental Results
In [24], we tested the above prediction using data reported in one study using groups of three players and three studies using groups of five players [55,56]. In all studies, the pool size was 500 points. The resulting predictions (using Equation (24) and a pool size of 500), together with the experimental results are depicted Figure 3 (adopted from [24]). As shown in the figure, the match between the theoretical predictions and the experimental results is impressive, although the requests of players appearing later in the sequence are underestimated by the theory. For the three-player game, a Kolmogorov–Smirnov test showed that the differences between the theoretical and the observed requests are non-significant. The maximum difference between the cumulative distributions is 0.091 (p = 1). A similar conclusion holds for the five-players game. The maximum difference between the cumulative distributions is 0.20 with a corresponding (p = 0.975).
3.4. The Public Goods Game
Public goods are defined by two properties: jointness of supply and impossibility of exclusion [58,59]. Standard game theory and the rationality principle predict that under the voluntary contribution mechanism, public goods will be underprovided relative to demand, or in the extreme case, it will not be provided at all. This is because “rational and selfish individuals will recognize the opportunity to ‘free ride’ on the contributions of others… in the knowledge that they can share in the good once it is provided… and will withhold or severely curtail their own contributions” ([58], p. 112). In a typical public goods game, each of the n players receives an endowment of e MUs and must decide how much to invest in a public project. For each 1MU invested in the project, each player receives a positive payoff that is less than 1MU, regardless of the amount he or she contributed. This payoff is usually referred to as the “marginal per capita return” (MPCR). The reward for player j, who contributed is given by:
From Equation (25), it follows that it is in the best interest of each rational player j to withhold their contribution and free ride on the contributions of others. Hence, the Nash equilibrium of the game is the deficient all-defect unique equilibrium. However, it is well documented in real life situations, and in experimental public goods games, that group members contribute something, and that under some conditions, subjects achieve nearly full cooperation, although the self-interest model predicts complete defection [7,8,9].
To solve for the harmony points of the game, from Equation (25), the maximal aspiration for each player i is:
Harmony is achieved when:
or
Substituting the values and from Equation (25) and simplifying yields:
and the reward for each player j at harmony is:
For MPCR < , the maximum reward is achieved for = 0 for all i, that is, when all players contribute nothing; for MPCR > maximum reward is achieved for = e for all i, that is, when all players contribute all their endowments.
Comparison with Experimental Results
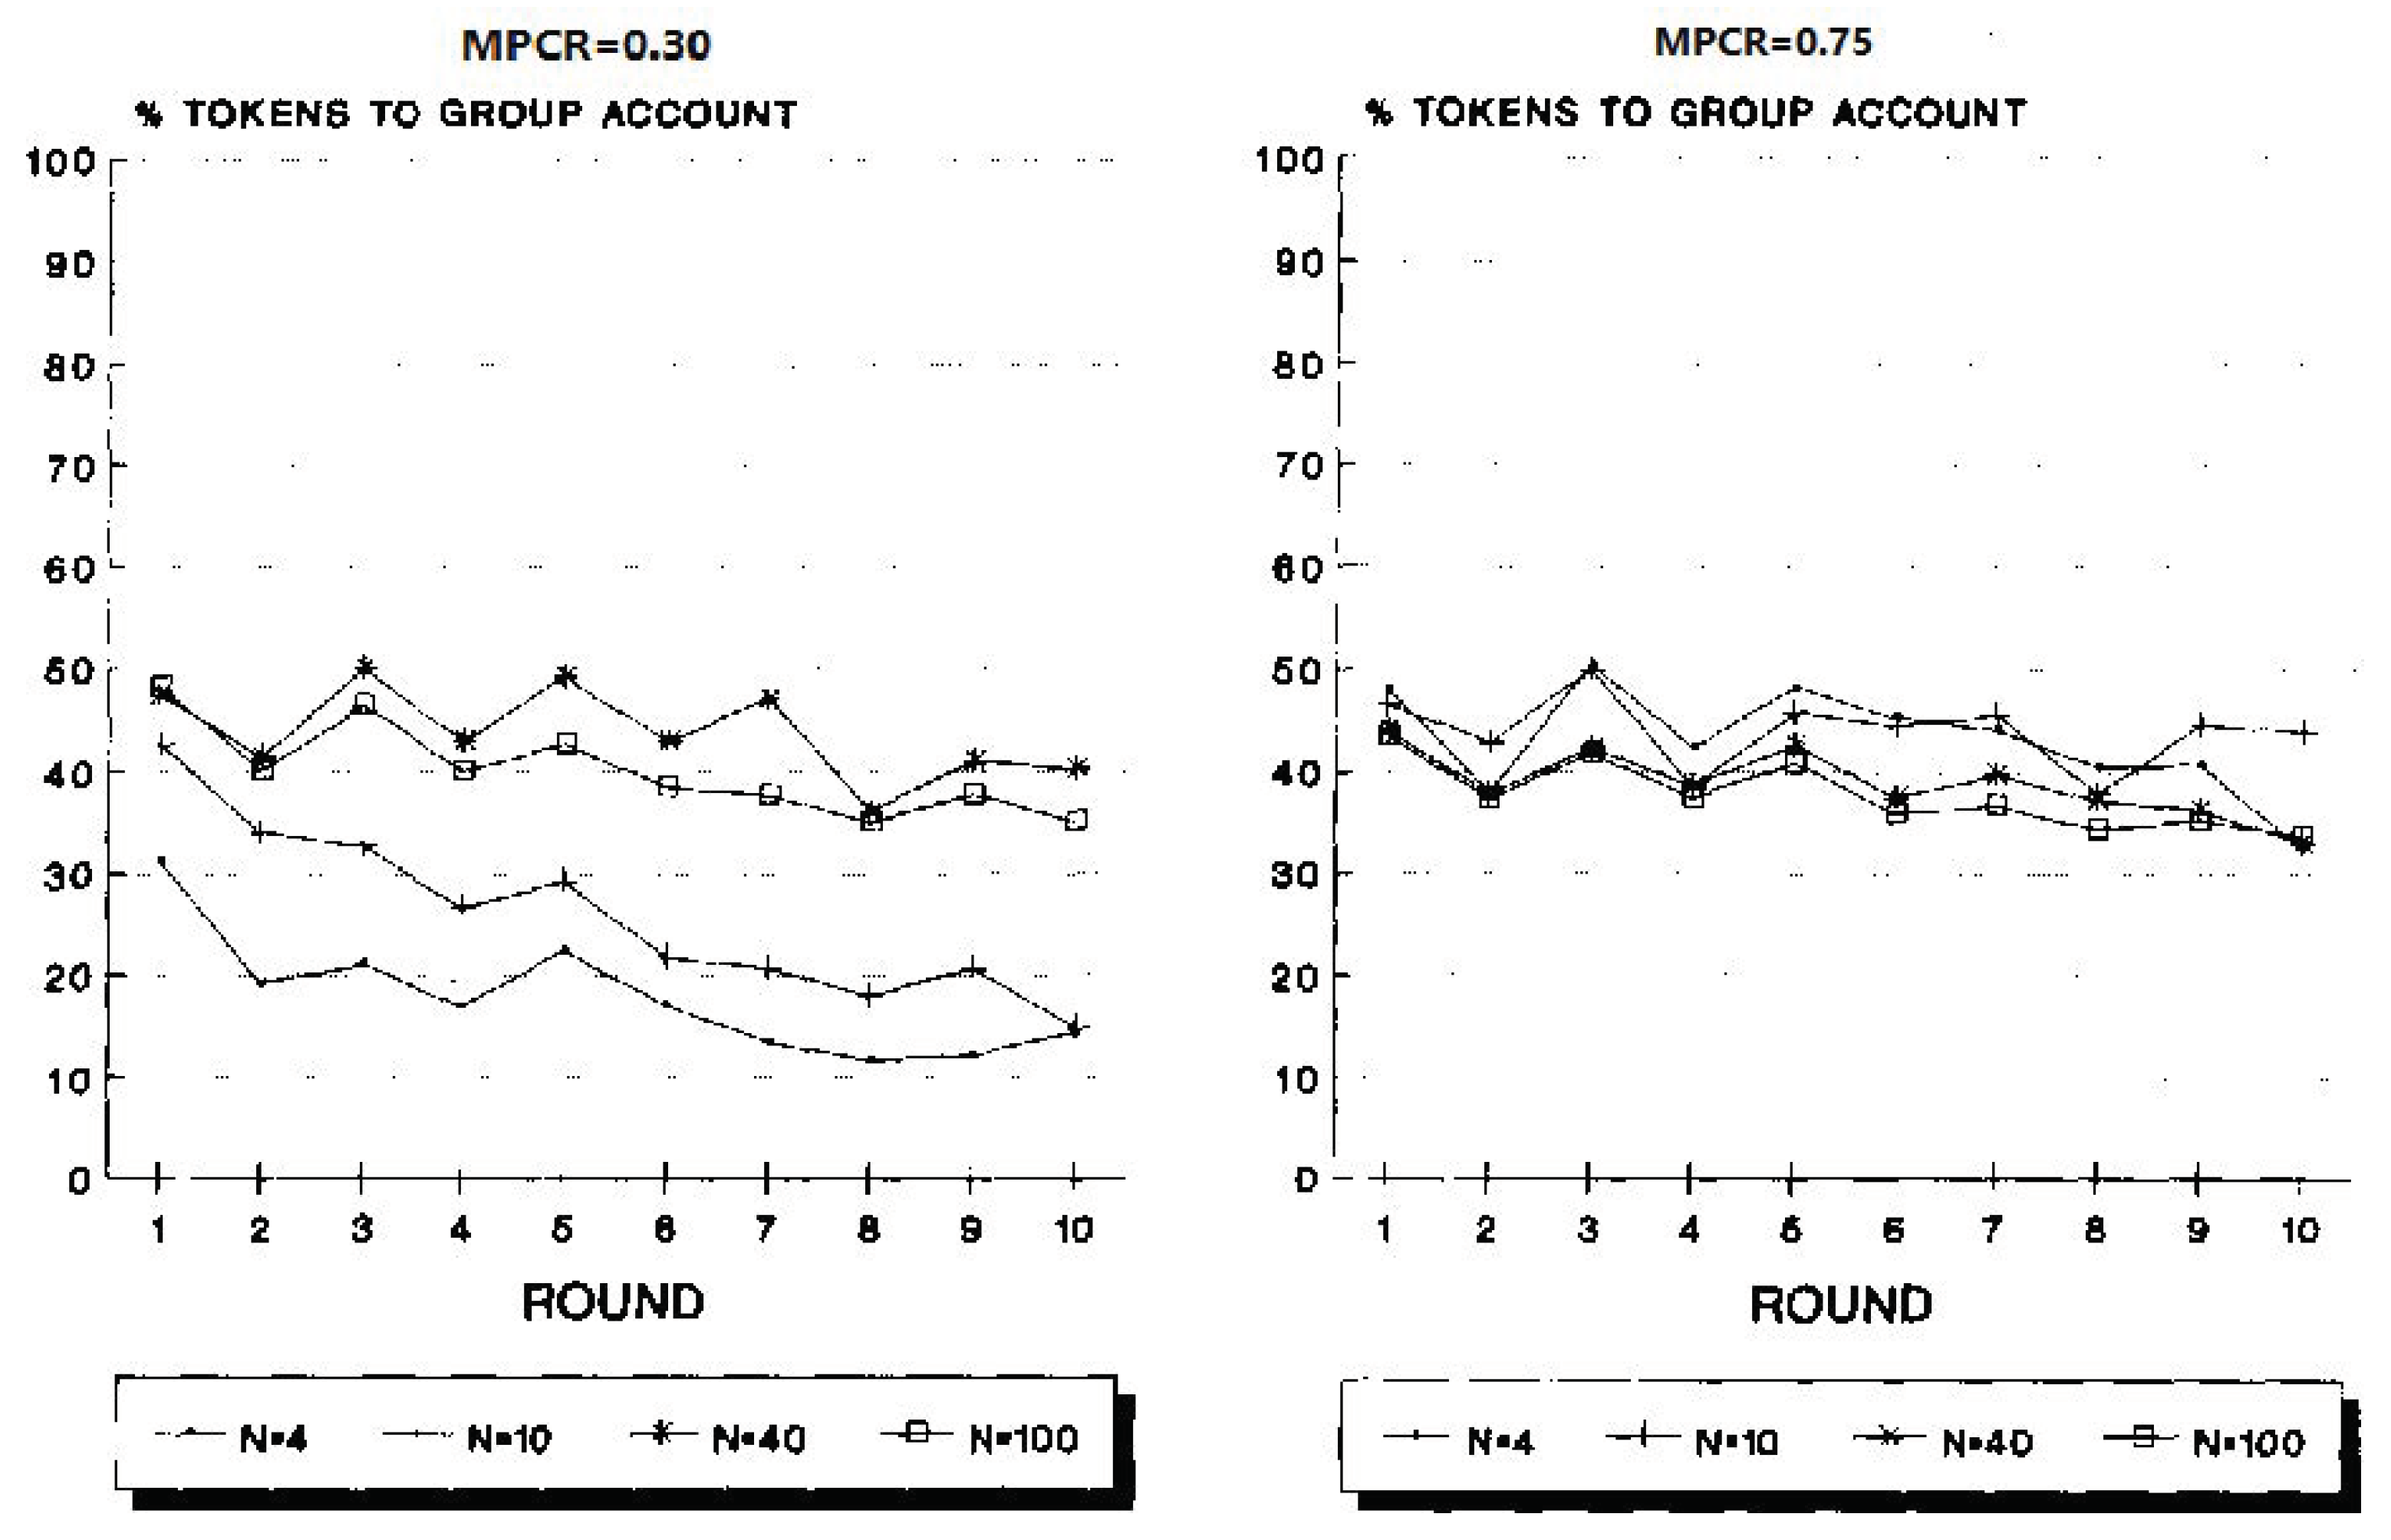
The data reported in Isaac et al. [60] included many experiments utilizing group sizes of 4, 10, 40 and 100, and MPCR values of 0.3, 0.75, and 0.03. The data provided strong evidence against the held view that a group’s ability to provide the optimal level of a pure public good is inversely related to its size. For all tested group sizes, the left panel of Figure 4, adopted from [60], depicts the mean allocations for MPCR = 0.3, and the right panel depicts the comparable results for MPCR = 0.75. Isaac et al. found that for MPCR = 0.30, group sizes of 40 and 100 allocated, on average, significantly more tokens to the group account than did group sizes of 4 and 10. For MPCR = 0.75, no significant difference was found in allocations to the group account across group sizes.
As shown above, economic harmony theory predicts that for MPCR < , all players should contribute nothing, while for MPCR > , all players should contribute all their endowments. We define Δ(MPCR, n) as:
For MPCR = 0.3, we have:
which agrees nicely with the result reported in [54] for this condition (see Figure 4).
Δ(100) = 0.29 ≈ Δ(40) = 0.275 > Δ(10) = 0.2 > Δ(4) = 0.05
For MPCR = 0.75, we have:
which is in partial agreement with the reported results.
Δ(100) = 0.74 ≈ Δ(40) = 0.725 > Δ(10) = 0.65 > Δ(40) = 0.5
Isaac et al. also tested groups with a very low MPCR equaling 0.03, and n = 40. Their objective was to further investigate the obtained disappearance of the MPCR effect in large groups. The reported results (see Figure 5, adopted from [60]) revealed a substantial decay in allocations to the group account. They concluded that "the MPCR effect does appear to exist in 40-person experiments for MPCR values, which are much smaller than those used by IW (Isaac and Walker [61])” ([60], p. 27).
Substituting MPCR = 0.03 and n = 40 in Equation (31), we get:
which implies that group members are predicted to be indifferent between allocating something to the group account and withholding their contributions.
3.5. Trust Game
In the trust game [12,13], one player (the investor) is given an endowment of e MUs and is requested to transfer any amount, x, between 0 and e, to a second player (the trustee). The amount transferred to the second player is multiplied by a factor α (α > 1), and the second player is requested to transfer back any amount y, between 0 and α x. The unique Nash equilibrium for the trust game with perfect information is transfer = 0, and return = 0. In contrast, there is ample experimental evidence suggesting that a considerable proportion of players in two-person trust games deviate from the equilibrium prediction. Investors transfer substantial amounts of money and trustees transfer back significant amounts of the total gain [12,13,62,63,64,65]. As implied by the title of their pioneering study, Berg, Dickhaut, and McCabe [12], who invented the trust game, concluded that returning money to the investor is driven by reciprocity. Smith and Wilson [60] disagree. They argue that by sending money, the first mover is offering to cooperate; by returning money, the second mover is accepting the offer in an exchange; they argue that “‘reciprocity’ is simply a word for describing those two actions. How can a description of what transpires be an explanation of why we observe the behavior? The argument is circular” [66]. Another explanation, convincingly dismissed by Smith [67], is the “social preference” explanation proposed by models like “inequality aversion” [18] and ERC [19], which views “other-regarding actions” as direct consequences of other-regarding preference in the players’ utility functions. Smith and Wilson [66] proposed a new theory, inspired by Adam Smith’s ‘Sentiments’ [68], according to which a clear distinction is made between preference and behavior. In their theory, termed Humanomics, Smith and Wilson argue that “cooperation stems from human sociability and is governed by our rule-following conduct; … a pattern of proper manners emanating from our judgement of each other. Our actions are other-regarding as well as own-regarding. Moreover, these actions are not direct consequences of our preferences, which are strictly self-interested, and not in any way conflictual with our actions” ([67], p. 10). In Humanomics, prediction of cooperative behavior is derivative of the “principle of beneficent reciprocity” ([61], p. 16), which postulates, “Kindness is the parent of kindness” ([68], p. 331).
Smith [67] explains the application of the principle of beneficent reciprocity to players’ behavior in the trust game as follows: “The first mover is clearly under no obligation to send any money, nor for the recipient to return money if any is sent. Moreover, the first mover is clearly at risk in getting nothing back. Knowing this, the recipient of any money sent can only infer that money was sent intentionally—an action that obviously and unambiguously benefits the recipient …. The recipient feels gratitude and is motivated to reward the action by returning some money. How much? Well, more in positive relation to the benefit and gratitude felt” ([67], p. 13).
To solve for the harmony points, denote the rewards for the investor and the trustee, respectively, by , and . We can write:
and,
Applying Equation (3), we get:
The maximal aspiration of both player is to receive a reward of . Substituting the values of from Equations (35) and (36), in Equation (37), and setting = , we get:
yielding:
Substituting the value of y in Equations (35) and (36), we get:
and
Any pair (x, y) that satisfies Equation (39) qualifies as a harmony point. Using the principle of payoff dominance articulated by Harsanyi and Selten [69], the preferred harmony point is the one that yields the highest rewards for both players. This point is attained if the first player invests = e, yielding
The respective rewards for both players are:
and
Thus, the harmony solution prescribes that the first player should transfer his or her entire endowment to player 2, and player 2 should send back half of the gain.
Comparison with Experimental Results
We compared the harmony prediction with the experimental results of [12,13,14]. The first study by Berg, Dickhaut, and McCabe [12] included a no-history and history treatments, where in the latter treatment, the players were paired again with the same partner. In both treatments, the endowment was e = $10, the multiplication factor was α = 3, and Player 1 could invest any amount between $0 and $10. The results of the no-history showed that only 2 out of 32 participants in the role of Player 1 sent zero. The amounts sent were variable, ranging from $1 to $10. For investments of $5, the average payback was $7.17, while for investments of $10, the average payback was $10.20. On average, the investment was $5.16, and the payback was $4.66. In the “social history” treatment, only 3 of 28 invested $0. Fifty percent sent 5 or 10 dollars. The payback of 6 of the 24 participants in the role of Player 2 was 0 or 1 dollar, while the payback of 13 was higher than the investment. For investments of $5, the average payback was 7.14, and for investments of $10, the average payback was $13.17. On average, the investment was $5.36, and the payback was $6.46.
Economic Harmony predicts that for an investment of $x, the harmonious payback should equal = = 1.5 x. Thus, for an investment of x = $5, the predicted payback is 1.5 × 5 = $7.5, while for investment of x = $10, the predicted payback is 1.5 × 10 = $15. Comparison between these predictions and the experimental results summarized above shows that the predictions are pretty close to the actual behavior.
The second study by Ortmann et al. [13] replicated the Berg et al. [12] experiment but modified the way in which information was presented to the participants and, through a questionnaire, prompted strategic reasoning. To the surprise of the researchers, none of their various treatments led to a reduction in the amount invested. They concluded that the results reported by Berg et al. in [12] are robust to changes in the information presentation and strategic reasoning prompts.
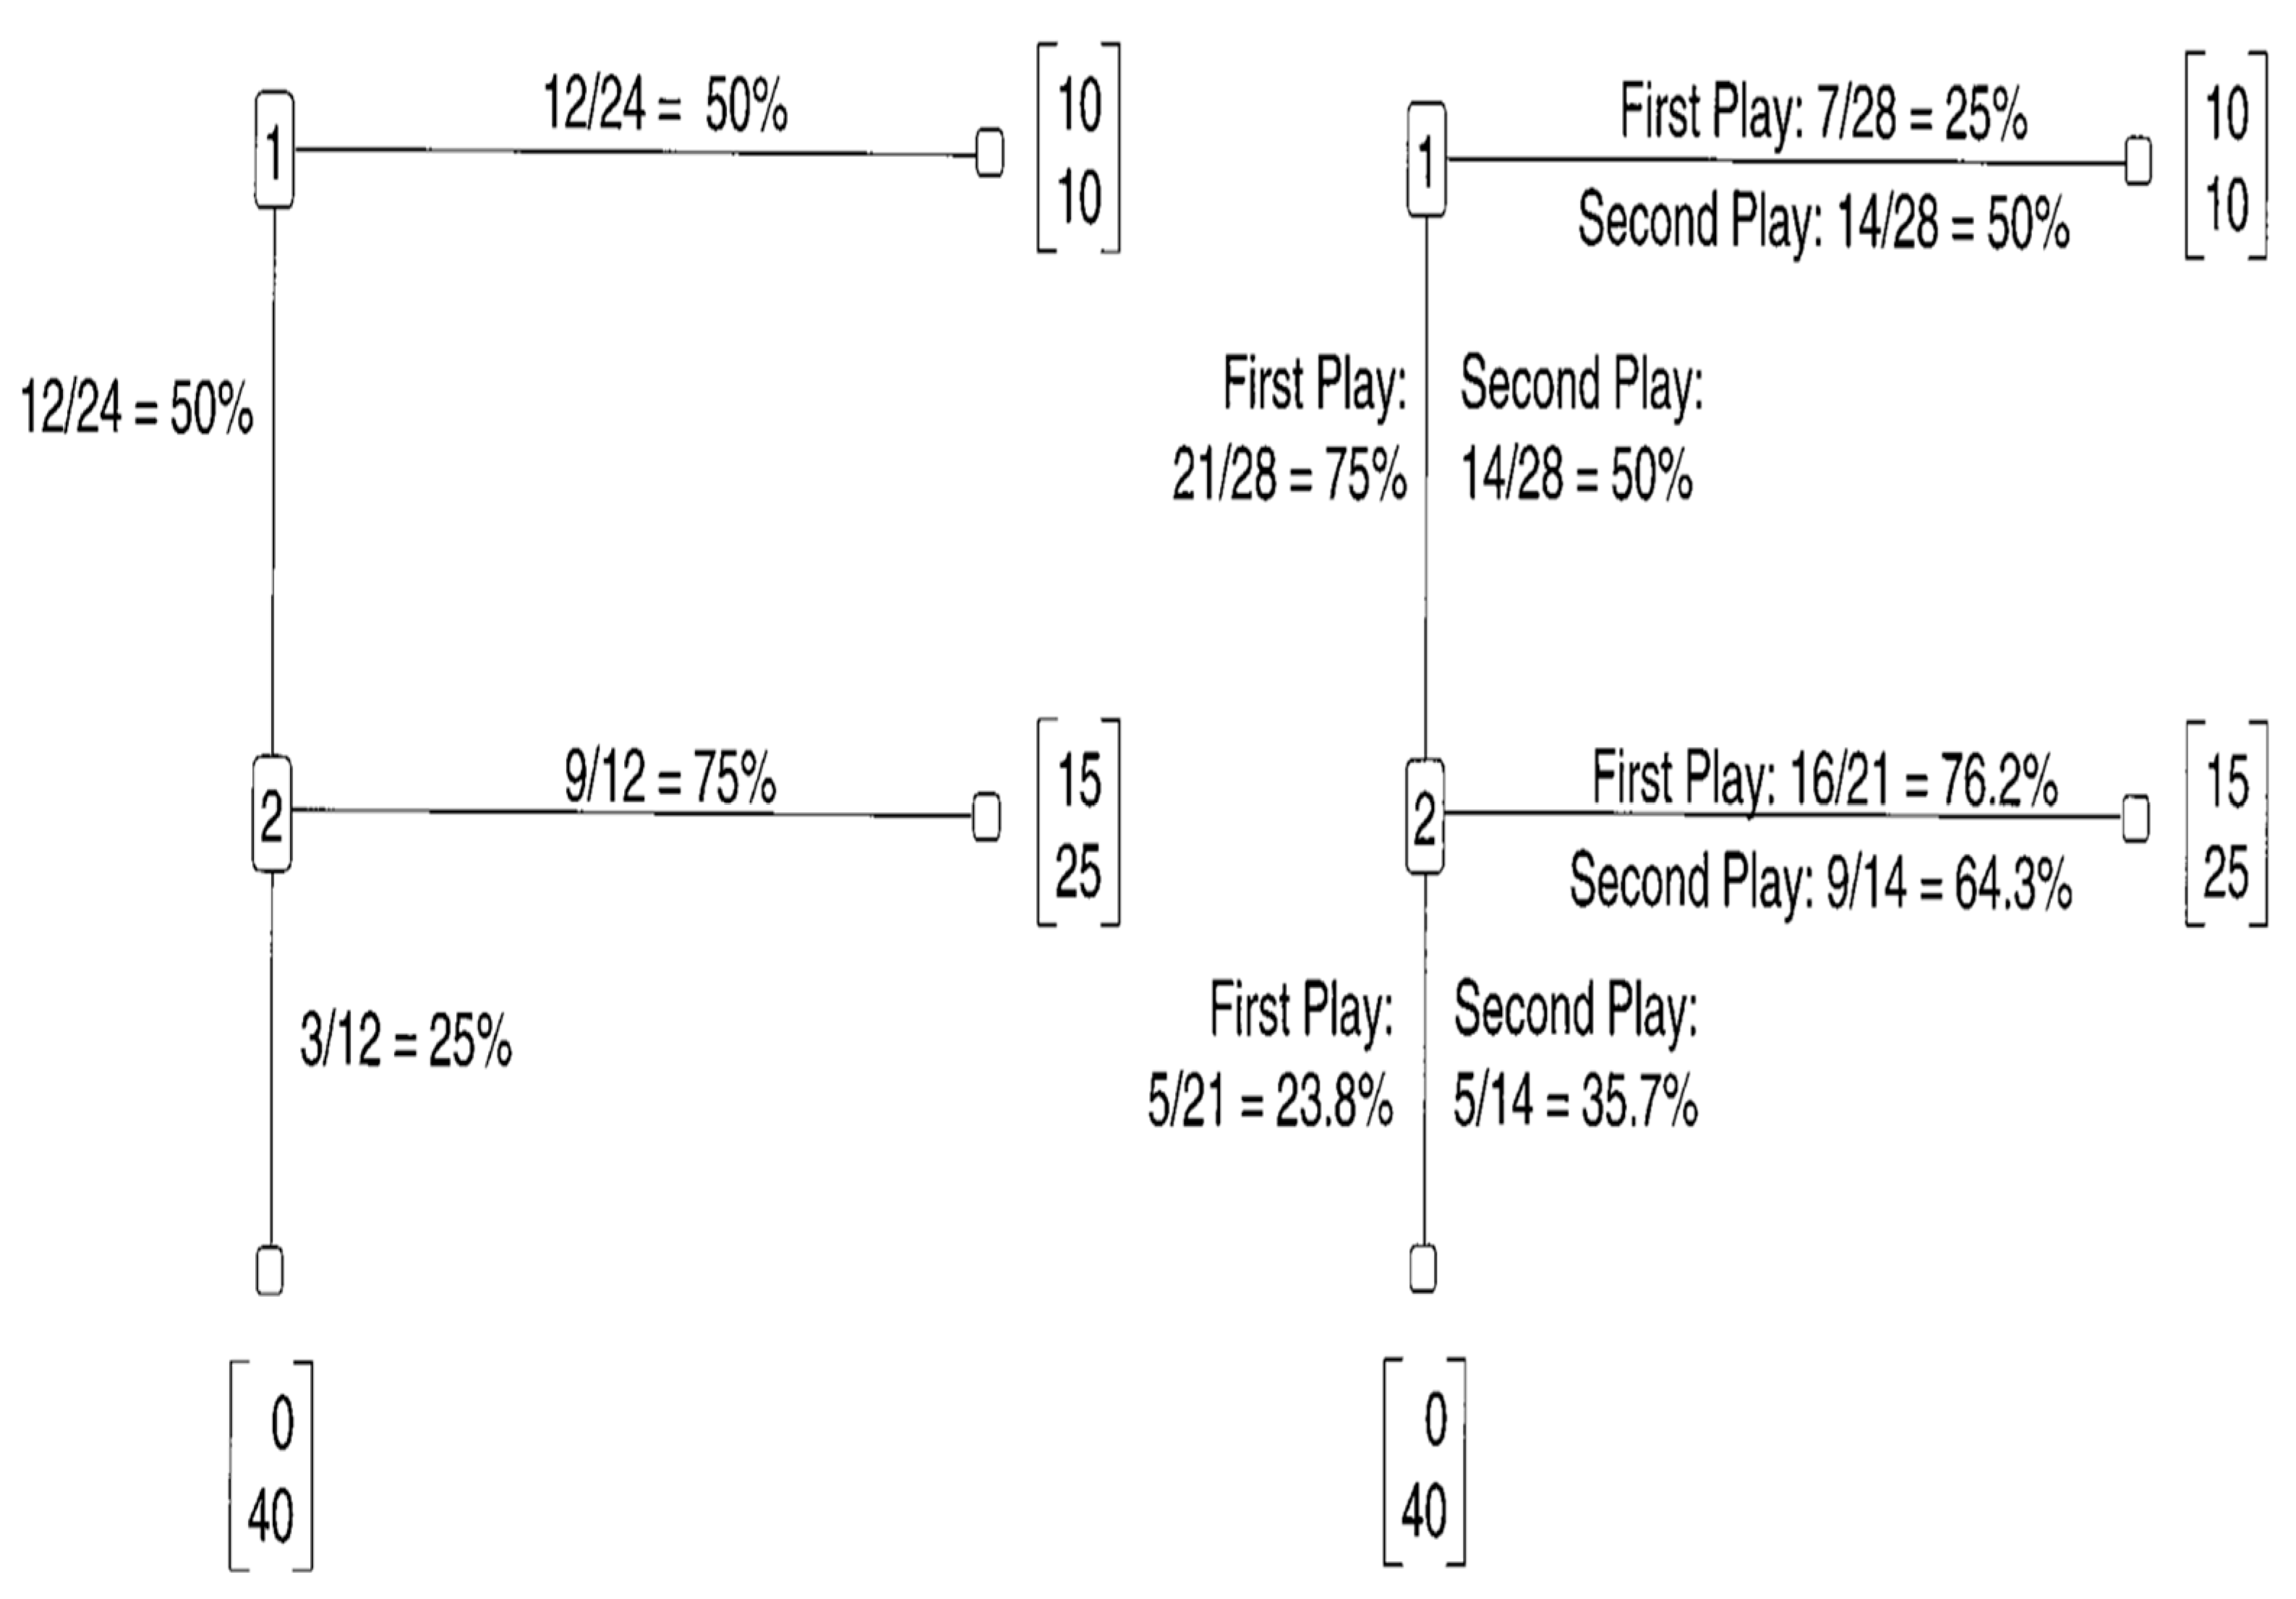
The third study, by McCabe and Smith [14], examined an abstract, extensive form game. It begins by Player 1 having to choose between allocating $10 for himself, and $10 for Player 2, and passing the decision to Player 2, who must then choose between allocating $15 for Player 1 and $25 for himself, and allocating $0 for Player 1, and $40 for himself. This abstract game is equivalent to a trust game in which Player 1 can invest $10, which becomes $30, which Player 2 can split equally between himself and Player 1, or take them all. The subgame perfect equilibrium prediction for this game is the unique equilibrium in which Player 1 chooses to invest $0, and Player 2 chooses to keep the entire amount resulting from any dollars transferred. Figure 6, adopted from [14], depicts the results of the two conducted experiments, one played by undergraduates (left panel), and the other by graduates (right panel). In the graduate experiment, the game was repeated twice with the same partner. The results indicated that the decrease in cooperation by graduate students in the second round was not significant. However, in the single-play condition, 50% (12/24) of the participants in the role of P1 chose not to invest, and 25% (3/12) of the participants in the role of P2 who received P1’s investment, chose to not to return money to P1. The corresponding results in the first play by graduate students indicated that 25% (7/28) of the P1 players did not invest, and 23.8% (5/21) of the P2 players who received P1’s investments chose not to return money to P1.
Economic harmony theory predicts that the payoff-dominant harmony point prescribes that P1 should invest their $10 endowment, and that P2 should return $15 to P1, which is half of the total gain of $30. Pooling the data of the undergraduate students’ and the graduate students’ first round reveals that about 63% of the P1 players (33/52) chose to invest their endowment, and that about 76% of the P2 players (25/33) chose to return half of the total gain. The rest of P1 players (37%) and of P2 plyers (24%) chose not to cooperate. While it is most likely that the P2 players who did not cooperate (chose down) played their subgame perfect equilibrium strategies, the equal payoffs of ($10, $10) received when P1s did not cooperate (chose right) makes it difficult to interpret if their actions were an equilibrium strategy or a harmony one.
4. Discussion
Several experiments on social dilemmas and bargaining games have repeatedly shown that even under complete unanimity, the standard model of utility and the game-theoretical notion of equilibrium fail to account for the experimental data. Moreover, models, such as ERC and inequality aversion, that seek to improve the equilibrium predictions by adding other-regarding components in the individual utility function suffer from several drawbacks that disqualify them as general alternative theories of economic behavior. Primarily, such models violate the principle of individual rationality. They also incorporate free parameters, which are fit ex post based on the tested experiment data. Moreover, their predictions are usually limited to one or very few game structures.
Economic harmony theory has none of the aforementioned problems. First, defining the individual’s utility as u(, where x is the actual and a is the aspired payoff, preserved the rationality assumption. Second, the theory’s predictions are independent of the experimental results, thus enabling it to formulate ex ante predictions of experimental results. Third, the theory fairs well, without adding any free parameters, in predicting behaviors in several prominent non-cooperative games.
The success of the theory’s predictions shows that fairness and cooperativeness of interacting players does not require them to be benevolent or altruistic, since it is in the best interest of each player to play their harmony strategy. We do not preclude other-regarding sentiments of being among the motivations behind fairness and cooperation in non-cooperative games. However, the impressive success of our theory in predicting behavior indicates that if other-regarding intentions were also behind the observed fairness and cooperation in the discussed games, their marginal effect was minor. Our conclusion is supported by several experiments on ultimatum bargaining that strongly rejects the hypothesis that considerations of fairness drive bargaining outcomes [27,70,71,72].
Notably, the only variables in the theory that need to be hypothesized or estimated empirically are the players’ aspiration levels, which could be measured independently from their behavior in the tested game. The experiments discussed in this paper were not designed as direct tests of the theory. Because the players’ aspiration levels were not measured in these experiments, we made plausible assumptions about them, depending on the game structure and the players’ positions in the game. Notwithstanding, the derived predictions for most of the discussed experiments were nicely correlated with their respective results. We expect that the theory’s predictions could be improved in future studies in which players’ aspiration levels and reservation values could be measured. Another straightforward improvement of the theory is accounting for nonlinearities resulting from individual differences in risk preferences.
A fundamental feature of economic harmony is that it abandons the basic concept of game theory—the equilibrium concept—and replaces it with the concept of harmony. This modification embodies a significant paradigmatic shift in the moral and ideological foundations of economics. Neoclassical economic theory assumes that each rational player seeks to maximize their individual utilities, which are non-decreasing functions of their payoffs. The theory further assumes that in interactive situations for which game theory is a major analytical tool, all players will play their equilibrium strategies, even when the equilibrium point is payoff-deficient for some, or even for all. Clearly, the motivation behind the adherence to an equilibrium strategy is the knowledge of each individual that they will receive a lower payoff by deviating unilaterally from the reached equilibrium. Thus, for some players, and in certain cases for all players, the bonding glue of the equilibrium solution has fear in its ingredients. For example, in the UG, the fear of a rational recipient from receiving nothing is what ought to compel them, according to the theory, to accept insultingly low offers. Thus, the supposed “greed” of a rational proposer, which drives them to demand most of the pie, is supported by the “fear” of a rational recipient. These anticipations, based on the neoclassical utility theory and game theory, are strongly refuted by numerous experiments showing that the mean offer in the UG is around 0.4 of the pie and that offers of 0.2 or less are usually rejected. In contrast, the guiding moral sentiment of economic harmony is that player will adhere to strategies that ensure that the satisfaction levels of all players are equal.
Our theory closely resembles John Nash’s solution of the bargaining problem [1], which determines “the amount of satisfaction each individual should expect to get from the situation” ([1], p. 155). Nash stated clearly that rational expectations “should be realizable by an appropriate agreement between the two” and that “there should be an available anticipation which gives each the amount of satisfaction he should expect to get” ([1], p. 158).
4.1. The Golden Ratio as a Point of Harmony
Strikingly, the famous Golden Ratio (φ ≈ 0.618), known for its aesthetically pleasing properties, emerged as a point of harmony in the UG, the sequential bargaining game with alternating offers, and the CPR dilemma. As mentioned earlier, a similar solution for the UG was derived independently by Schuster [39]. Also, independently from our theory and of Schuster’s solution, the golden ratio appears in the context of the “justice evaluation function” (JEF), which compares the actual reward and the just reward [73,74].
The emergence of the golden ratio as the point of balance or homeostasis between the players’ satisfaction levels adds to its many appearances in life sciences [75,76]; chemistry [77]; quantum physics [78]; the human brain’s functioning [79,80]; the arts, aesthetics, and design [81]; and much more. In Phyllotaxis (arrangement of leaves on a stem and of seeds in flowers), the numbers of petals are Fibonacci numbers (like 5, 8, 13, …), and the seeds of many flowers display Fibonacci spiraling patterns. It is argued that a maximally uniform spread of leaves, according to a deviation angle equaling the Golden Ratio, is optimal for the plant’s collection of radiation energy [76]. In quantum physics, a study published in Science demonstrated that applying a magnetic field at right angles to an aligned chain of cobalt niobate atoms makes the cobalt enter a quantum critical state, in which the ratio between the frequencies of the first two notes of the resonance equals the Golden Ratio [78]. The same result was predicted theoretically by Information Relativity Theory (IRT) [82,83,84]. At cosmic scales, IRT predicts that a similar critical phase transition occurs at a recession velocity of the universe equaling the Golden Ratio, φ multiplied by the velocity of light, which is equivalent to a redshift, z, equaling 1 + φ ≈ 1.618. The relative matter energy density at this point is predicted to be equal to ≈ , which equals (to the eighth decimal digit) Hardy’s maximum probability of obtaining an event that contradicts local realism [85,86].
The fact that the Golden Ratio plays a key role in human’s sense of beauty suggests that our tastes for fairness and beauty might be correlated [87]. Some support for this conjecture is found in the results of a recent fMRI study [88], showing that participants who performed aesthetic judgments on both faces and scenes containing moral acts exhibited common involvement of the orbitofrontal cortex (OFC), inferior temporal gyrus, and medial superior frontal gyrus.
4.2. Concluding Remarks
The demonstrated success of economic harmony theory in generating good predictions for players’ behavior in various strategic games, for which the equilibrium predictions fail, is not enough for abandoning the equilibrium concept. One just needs to think of game theory’s extensions, such as evolutionary game theory (see, e.g., [89,90]), and its many successful and enriching applications in sociobiology and the social sciences at large. Another noteworthy fair success of the equilibrium model is in predicting competitive market behavior (see, e.g., [91]). We argue that the demonstrated success of the harmony concept in predicting behavior in five prominent and extensively studied games is very encouraging and calls for competitively testing economic harmony theory against game theory in other games, including in competitive markets. The need in science for competitive theories against which a mainstream theory should be tested has been recently underscored by Vernon L. Smith [92]. He argued, “In the absence of a competing theory, what does it mean to “test” a theory’s prediction? No matter how close the correspondence between observation and prediction, we have no guideposts in a single-theory world for imputing meaning to “close”. Only when we have at least one competing theory can we decide which theory prediction is nearest to an observation. If there is only one theory, science becomes an increasingly sophisticated ever-improving curve-fitting exercise” ([92], p. xii).
We are aware of the extreme difficulties in undergoing paradigm shifts in science. Notwithstanding, one must always be prepared to put a theory, no matter how it is widely accepted, in competitive tests against new theories. Given the good performance of economic harmony where game theory fails, we hope that experimental economists and other behavioral scientists undertake such a task.
Funding
This research received no external funding.
Informed Consent Statement
Not applicable.
Acknowledgments
We thank the Editor and two anonymous reviewers for their helpful remarks.
Conflicts of Interest
The author declares no conflict of interest.
References
- Nash, J. Equilibrium points in n-person games. Proc. Natl. Acad. Sci. USA 1950, 36, 48–49. [Google Scholar] [CrossRef] [PubMed] [Green Version]
- Nash, J. Non-Cooperative Games. Ann. Math. 1951, 54, 286–295. [Google Scholar] [CrossRef]
- Osborne, M.J. An Introduction to Game Theory; Oxford University Press: Oxford, UK, 2004. [Google Scholar]
- Selten, R. Reexamination of the perfectness concept for equilibrium points in extensive games. Int. J. Game Theory 1975, 4, 25–55. [Google Scholar] [CrossRef] [Green Version]
- Van Damm, E. Strategic Equilibrium. Handb. Game Theory Econ. Appl. 2002, 3, 1521–1596. [Google Scholar]
- Samuelson, P.A. The pure theory of public expenditure. Rev. Econ. Stat. 1954, 36, 387–389. [Google Scholar] [CrossRef]
- Barry, B.; Hardin, R. (Eds.) Rational Man and Irrational Society; Sage: Beverly Hills, CA, USA, 1982. [Google Scholar]
- Ledyard, J. Public goods: A survey of experimental research. In Handbook of Experimental Economics; Kagel, J., Roth, A., Eds.; Princeton University Press: Princeton, NJ, USA, 1995; pp. 253–279. [Google Scholar]
- Fehr, E.; Fischbacher, U. The nature of human altruism. Nature 2003, 425, 785–791. [Google Scholar] [CrossRef] [PubMed]
- Gardner, R.; Elinor, O.; Walker, J.M. The Nature of Common-Pool Resource Problems. Ration. Soc. 1990, 2, 335–358. [Google Scholar] [CrossRef]
- Keser, C.; Gardner, R. Strategic behavior of experienced subjects in a common pool resource game. Int. J. Game Theory 1999, 28, 241–252. [Google Scholar] [CrossRef]
- Berg, J.; Dickhaut, J.; McCabe, K. Trust, reciprocity, and social history. Games Econ. Behav. 1995, 10, 122–142. [Google Scholar] [CrossRef] [Green Version]
- Ortmann, A.; Fitzgerald, J.; Boeing, C. Trust, reciprocity, and social history: A re-examination. Exp. Econ. 2000, 3, 81–100. [Google Scholar] [CrossRef]
- McCabe, K.A.; Smith, V.L. A Comparison of naïve and sophisticated subject behavior with game theoretic predictions. Proc. Natl. Acad. Sci. USA 2000, 97, 3777–3781. [Google Scholar] [CrossRef]
- Güth, W.; Schmittberger, R.; Schwartze, B. An experimental analysis of Ultimatum games. J. Econ. Behav. Organ. 1982, 3, 367–388. [Google Scholar] [CrossRef] [Green Version]
- Rubinstein, A. Perfect equilibrium in a bargaining model. Econometrica 1982, 50, 97–109. [Google Scholar] [CrossRef] [Green Version]
- Stahl, I. Bargaining Theory; Stockholm School of Economics: Stockholm, Sweden, 1972. [Google Scholar]
- Fehr, E.; Schmidt, K.M. A theory of fairness, competition, and cooperation. Q. J. Econ. 1999, 114, 817–868. [Google Scholar] [CrossRef]
- Bolton, G.E.; Ockenfels, A. ERC: A theory of equity, reciprocity, and competition. Am. Econ. Rev. 2000, 90, 166–193. [Google Scholar] [CrossRef] [Green Version]
- Capraro, V. A model of human cooperation in social dilemmas. PLoS ONE 2013, 8, e72427. [Google Scholar] [CrossRef] [PubMed] [Green Version]
- Kirchsteiger, G. The role of envy in ultimatum games. J. Econ. Behav. Org. 1994, 25, 373–389. [Google Scholar] [CrossRef] [Green Version]
- Page, K.M.; Nowak, M.A. Empathy leads to fairness. Bull. Math. Biol. 2002, 64, 1101. [Google Scholar] [CrossRef]
- Nowak, M.A.; Page, K.M.; Sigmund, K. Fairness versus reason in the ultimatum game. Science 2000, 289, 1773–1775. [Google Scholar] [CrossRef] [Green Version]
- Suleiman, R. Economic harmony: An epistemic theory of economic interactions. Games 2017, 8, 2. [Google Scholar] [CrossRef] [Green Version]
- Suleiman, R. On gamesmen and fairmen: Explaining fairness in noncooperative bargaining games. R. Soc. Open Sci. 2018, 5, 171709. [Google Scholar] [CrossRef] [PubMed] [Green Version]
- Kahneman, D.; Knetsch, J.L.; Thaler, R.H. Fairness and the assumptions of economics. J. Bus. 1986, 59, 285–300. [Google Scholar] [CrossRef]
- Suleiman, R. Expectations and fairness in a modified ultimatum game. J. Econ. Psychol. 1996, 17, 531–554. [Google Scholar] [CrossRef]
- Oosterbeek, H.; Sloof, R.; Van de Kuilen, G. Cultural differences in ultimatum game experiments: Evidence from a meta-analysis. J. Exp. Econ. 2004, 7, 171–188. [Google Scholar] [CrossRef]
- Henrich, J.; Boyd, R.; Bowles, S.; Camerer, C.; Fehr, E.; Gintis, H.; McElreath, R.; Alvard, M.; Barr, A.; Ensminger, J.; et al. “Economic man” in cross-cultural perspective: Behavioral experiments in 15 small-scale societies. Behav. Brain Sci. 2005, 28, 795–855. [Google Scholar] [CrossRef] [PubMed] [Green Version]
- Dunlap, R.A. The Golden Ratio and Fibonacci Numbers; World Scientific: Singapore, 1997. [Google Scholar]
- Livio, M. The Golden Ratio: The Story of Phi, the World’s Most Astonishing Number; Broadway Books: New York, NY, USA, 2002. [Google Scholar]
- Liua, J.P.; Chow, S.C. A two one-sided tests procedure for assessment of individual bioequivalence. J. Biopharm. Stat. 1997, 7, 49–61. [Google Scholar] [CrossRef] [PubMed]
- Fehr, E.; Gächter, S. Altruistic punishment in humans. Nature 2002, 415, 137–140. [Google Scholar] [CrossRef]
- O’Gorman, R.; Henrich, J.; Van Vugt, M. Constraining free riding in public goods games: Designated solitary punishers can sustain human cooperation. Proc. R. Soc. B 2009, 276, 323–329. [Google Scholar] [CrossRef] [Green Version]
- Samid, Y.; Suleiman, R. Effectiveness of coercive and voluntary institutional solutions to social dilemmas. In New Issues and Paradigms in Research on Social Dilemmas; Biel, A., Eek, D., Garling, T., Gustafsson, M., Eds.; Springer: Berlin, Germany, 2008; pp. 124–141. [Google Scholar]
- Ostrom, E. Building Trust to Solve Commons Dilemmas: Taking Small Steps to Test an Evolving Theory of Collective Action. In Games, Groups, and the Global Good; Levin, S., Ed.; Springer Series in Game Theory (The Official Series of the Game Theory Society); Springer: Berlin/Heidelberg, Germany, 2009. [Google Scholar]
- Brandt, H.; Hauert, C.; Sigmund, K. Punishment and reputation in spatial public goods games. Proc. R. Soc. Lond. B 2003, 270, 1099–1104. [Google Scholar] [CrossRef] [Green Version]
- Cong, R.; Wu, B.; Qiu, Y.; Wang, L. Evolution of Cooperation Driven by Reputation-Based Migration. PLoS ONE 2012, 7, e35776. [Google Scholar] [CrossRef] [Green Version]
- Schuster, S. A new solution concept for the ultimatum game leading to the golden ratio. Sci. Rep. 2017, 7, 5642. [Google Scholar] [CrossRef] [PubMed] [Green Version]
- Neelin, J.; Sonnenschein, H.; Spiegel, M. A further test of noncooperative bargaining theory. Am. Econ. Rev. 1988, 78, 824–836. [Google Scholar]
- Binmore, K.; McCarthy, J.; Pontic, G.; Samuelson, L.; Shaked, A. A backward induction experiment. J. Econ. Theory 2002, 104, 48–88. [Google Scholar] [CrossRef] [Green Version]
- Ochs, J.; Roth, A.E. An experimental study of sequential bargaining. Am. Econ. Rev. 1989, 79, 355–384. [Google Scholar]
- Weg, E.; Rapoport, A.; Felsenthal, D.S. Two-person bargaining behavior in fixed discounting factors games with infinite horizon. Games Econ. Behav. 1990, 2, 76–95. [Google Scholar] [CrossRef]
- Camerer, C.F.; Johnson, E.J.; Rymon, T.; Sen, S. Cognition and framing in sequential bargaining for gains and losses. In Frontiers of Game Theory; Binmore, K., Kirman, A., Tani, P., Eds.; MIT Press: Cambridge, MA, USA, 1993; pp. 27–48. [Google Scholar]
- Johnson, E.J.; Camerer, C.; Sen, S.; Rymon, T. Detecting failures of backward induction: Monitoring information search in sequential bargaining. J. Econ. Theory 2002, 104, 16–47. [Google Scholar] [CrossRef] [Green Version]
- Weg, E.; Zwick, R. Toward the settlement of the fairness issues in ultimatum games: A bargaining approach. JEBO 1994, 24, 19–34. [Google Scholar]
- Spiegel, M.; Currie, J.; Sonnenschein, H.; Sen, A. Understanding when agents are fairmen or gamesmen. Games Econ. Behav. 1994, 7, 104–115. [Google Scholar] [CrossRef]
- Binmore, K.; Shaked, A.; Sutton, J. Testing noncooperative bargaining theory: A preliminary study. Am. Econ. Rev. 1985, 75, 1178–1780. [Google Scholar]
- Dawes, R.M. Social Dilemmas. Annu. Rev. Psychol. 1980, 31, 69–193. [Google Scholar] [CrossRef]
- Hardin, G.R. The tragedy of the commons. Science 1968, 162, 1243–1248. [Google Scholar] [CrossRef] [PubMed] [Green Version]
- Harrison, G.; Hirshleifer, J. An experimental evaluation of weakest-link/best-shot models of public goods. J. Public Econ. 1989, 97, 201–225. [Google Scholar] [CrossRef] [Green Version]
- Rapoport, A.; Budescu, D.V.; Suleiman, R. Sequential requests from randomly distributed shared resources. J. Math. Psychol. 1993, 37, 241–265. [Google Scholar] [CrossRef]
- Budescu, D.V.; Au, W.; Chen, X. Effects of protocol of play and social orientation in resource dilemmas. J. Organ. Behav. Hum. Dec. 1997, 69, 179–193. [Google Scholar] [CrossRef]
- Budescu, D.V.; Au, W. A model of sequential effects in common pool resource dilemmas. J. Behav. Decis. Mak. 2002, 15, 37–63. [Google Scholar] [CrossRef]
- Suleiman, R.; Budescu, D.V. Common pool resource (CPR) dilemmas with incomplete information. In Games and Human Behavior; Budescu, D.V., Erev, I., Zwig, R., Eds.; Lawrence Erlbaum Associates, Inc.: Hillsdale, NJ, USA, 1999; pp. 387–410. [Google Scholar]
- Budescu, D.V.; Rapoport, A.; Suleiman, R. Common pool resource dilemmas under uncertainty: Qualitative tests of equilibrium solutions. Games Econ. Behav. 1995, 10, 171–201. [Google Scholar] [CrossRef]
- Budescu, D.V.; Suleiman, R.; Rapoport, A. Positional order and group size effects in resource dilemmas with uncertain resources. J. Organ. Behav. Hum. Dec. 1995, 61, 225–238. [Google Scholar] [CrossRef]
- Rapoport, A. Public goods and the MCS experimental paradigm. Am. Political Sci. Rev. 1985, 79, 48–155. [Google Scholar] [CrossRef]
- Van de Kragt, A.J.C.; Orbell, J.M.; Dawes, R.M. The minimal contributing set as a solution to public goods problems. Am. Political Sci. Rev. 1983, 77, 112–122. [Google Scholar] [CrossRef] [Green Version]
- Isaac, R.M.; Walker, J.M.; Williams, A.W. Group size and the voluntary provision of public goods: Experimental evidence utilizing large groups. J. Public Econ. 1994, 54, 1–36. [Google Scholar] [CrossRef]
- Isaac, M.; Walker, J. Group size effects in public goods provision: The voluntary contribution mechanism. Q. J. Econ. 1988, 103, 179–200. [Google Scholar] [CrossRef]
- Cox, J.C. How to identify trust and reciprocity. Games Econ. Behav. 2004, 46, 260–281. [Google Scholar] [CrossRef]
- Pillutla, M.M.; Malhotra, D.; Murnigham, J.K. Attributions of trust and the calculus of reciprocity. J. Exp. Soc. Psychol. 2003, 39, 448–455. [Google Scholar] [CrossRef]
- Bchir, M.A.; Rozan, A.; Willinger, M. Does higher trust lead to higher performance? An experimental investigation. Econ. Bull. 2012, 32, 1873–1877. [Google Scholar]
- Johnson, N.D.; Mislin, A.A. Trust games: A meta-analysis. J. Econ. Psychol. 2011, 32, 865–889. [Google Scholar] [CrossRef]
- Smith, V.L.; Wilson, B.J. HUMANOMICS: Moral Sentiments and the Wealth of Nations for the Twenty-First Century; Cambridge University Press: Cambridge, MA, USA, 2019. [Google Scholar]
- Smith, V.L. Trust, Reciprocity, and Social History: New Pathways of Learning When Max U (Own Reward) Fails Decisively; ESI Working Paper; Chapman University, Economic Science Institute: Orange, CA, USA, 2020; pp. 20–28. [Google Scholar]
- Smith, A. (1759; 1853): Or, an Essay towards an Analysis of the Principles by Which Men Naturally Judge the Conduct and Character, First of Their Neighbors and Then of Themselves. With a Biographical Critical Memoir of the Author, by Dugald Stewart. London: Henry, G. Bohm, Second Edition. Available online: http:/Ioll.libertyfund.org/titles/2620 (accessed on 15 February 2022).
- Harsanyi, J.C.; Selten, R.A. General Theory of Equilibrium Selection in Games; MIT-Press: Cambridge, MA, USA, 1988. [Google Scholar]
- Hoftman, E.; McCabe, K.; Shachat, K.; Smith, V. Preferences, property rights and anonymity in bargaining games. Games Econ. Behav. 1994, 7, 346–380. [Google Scholar] [CrossRef]
- Forsythe, R.; Horowitz, J.L.; Savin, N.E.; Sefton, M. Fairness in simple bargaining experiments. Games Econ. Behav. 1994, 6, 347–369. [Google Scholar] [CrossRef]
- Harrison, G.W.; McCabe, K.A. Expectations and fairness in a simple bargaining experiment. Int. J. Game Theory 1996, 25, 303–327. [Google Scholar] [CrossRef]
- Jasso, G. Homans and the study of justice. In History, Theory, and Method; Treviño, A.J., Homans, G.C., Eds.; Paradigm Press: Boulder, CO, USA, 2006; pp. 203–227. [Google Scholar]
- Jasso, G. Theoretical unification in justice and beyond. Soc. Justice Res. 2007, 20, 336–371. [Google Scholar] [CrossRef] [Green Version]
- Klar, A.J.S. Fibonacci’s flowers. Nature 2000, 417, 595. [Google Scholar] [CrossRef]
- Mitchison, G.J. Phyllotaxis and the Fibonacci series. Science 1977, 196, 270–275. [Google Scholar] [CrossRef] [PubMed] [Green Version]
- Shechtman, D.; Blech, I.; Gratias, D.; Cahn, J.W. Metallic phase with long-range orientational order and no translational symmetry. Phys. Rev. Lett. 1984, 53, 1951–1954. [Google Scholar] [CrossRef] [Green Version]
- Coldea, R.; Tennant, D.A.; Wheeler, E.M.; Wawrzynska, E.; Prabhakaran, D.; Telling, M.; Habicht, K.; Smeibidl, P.; Kiefer, K. Quantum criticality in an Ising chain: Experimental evidence for emergent E8 symmetry. Science 2010, 327, 177–180. [Google Scholar] [CrossRef] [PubMed] [Green Version]
- Weiss, H.; Weiss, V. The golden mean as clock cycle of brain waves. Chaos Solitons Fract. 2003, 18, 643–652. [Google Scholar] [CrossRef] [Green Version]
- Roopun, A.K.; Kramer, M.A.; Carracedo, L.M.; Kaiser, M.; Davies, C.H.; Traub, R.D.; Kopell, N.J.; Whittington, M.A. Temporal interactions between cortical rhythms. Front. Neurosci. 2008, 2, 145–154. [Google Scholar] [CrossRef] [Green Version]
- Pittard, N.; Ewing, M.; Jevons, C. Aesthetic theory and logo design: Examining consumer response to proportion across cultures. Int. Mark. Rev. 2007, 24, 457–473. [Google Scholar] [CrossRef]
- Suleiman, R. The dark side revealed: A complete relativity theory predicts the content of the universe. Prog. Phys. 2013, 4, 34–40. [Google Scholar]
- Suleiman, R. A model of dark matter and dark energy based on relativizing Newton’s physics. World J. Condens. Matter Phys. 2018, 8, 130–155. [Google Scholar] [CrossRef] [Green Version]
- Suleiman, R. Relativizing Newton; Nova Science Publishers: New York, NY, USA, 2019. [Google Scholar]
- Hardy, L. Nonlocality of a single photon revisited. Phys. Rev. Lett. 1994, 73, 2279–2283. [Google Scholar] [CrossRef]
- Otto, H.H. Reciprocity relation between the mass constituents of the universe and Hardy’s quantum entanglement probability. World J. Condens. Matter Phys. 2018, 8, 30–35. [Google Scholar] [CrossRef] [Green Version]
- Scarry, E. On Beauty and Being Just; Princeton University Press: Princeton, NJ, USA, 1999. [Google Scholar]
- Wang, T.; Mo, L.; Mo, C.; Tan, L.H.; Cant, J.S.; Zhong, L.; Cupchik, G. Is moral beauty different from facial beauty? Evidence from an fMRI study. Soc. Cogn. Affect. Neurosci. 2015, 10, 814–823. [Google Scholar] [CrossRef] [PubMed] [Green Version]
- Weibull, J.W. Evolutionary Game Theory; MIT Press: Cambridge, MA, USA, 1995. [Google Scholar]
- Newton, J. Evolutionary game theory: A renaissance. Games 2018, 9, 31. [Google Scholar] [CrossRef] [Green Version]
- Smith, V.L. An experimental study of competitive market behavior source. J. Political Econ. 1962, 70, 111–137. [Google Scholar] [CrossRef]
- Smith, V.L. Foreword. In Relativizing Newton; Suleiman, R., Ed.; Nova Science Publishers: New York, NY, USA, 2019. [Google Scholar]
Figure 1.
Experimental and theoretical opening demands by Player 1 for the Binmore et al., 2002 study, as functions of the discount factor δ.
Figure 1.
Experimental and theoretical opening demands by Player 1 for the Binmore et al., 2002 study, as functions of the discount factor δ.

Figure 2.
Experimental and theoretical opening demands by Player 1 for the Weg et al. (1990) study, as functions of the discount factor of Player 2.
Figure 2.
Experimental and theoretical opening demands by Player 1 for the Weg et al. (1990) study, as functions of the discount factor of Player 2.

Figure 3.
Empirical and predicted mean of requests in a sequential CPR Dilemma with resource size = 500 for n = 5 players (upper panel) and n = 3 players (lower panel).
Figure 3.
Empirical and predicted mean of requests in a sequential CPR Dilemma with resource size = 500 for n = 5 players (upper panel) and n = 3 players (lower panel).

Figure 4.
Group size comparison for high (0.75) and low (0.30) MPCR.

Figure 5.
Experiments using a very low MPCR of 0.03 and a group size of 40.

Figure 6.
Left panel: Trust game. Single play by undergraduates (n = 24 pairs). Right panel: Trust game. Played twice by advanced graduate students in economics (n = 28 pairs). Adopted from [14].
Figure 6.
Left panel: Trust game. Single play by undergraduates (n = 24 pairs). Right panel: Trust game. Played twice by advanced graduate students in economics (n = 28 pairs). Adopted from [14].


Table 1.
Experimental conditions of the five investigated studies.
| Study | Pie Size | Discount Factors Equal (δ) | Horizon (T) |
|---|---|---|---|
| 1. Binmore et al. (1985) | 100 pennies. | 0.25 | 2 |
| 2. Neelin et al. (1988) | $5 & $10 | 0.25, 0.5, 0.34 | 2, 3, 5 |
| 3. Binmore et al. (2002) | 100 points payoffs determined by a roulette | 0.2, 0.3, 0.4, 0.5, 0.6, 0.7, 0.8, 0.9 | 2 |
| Unequal,) | |||
| 4. Ochs and Roth (1989) | $30 | (0.4, 0.4), (0.6, 0.4), (0.6, 0.6), (0.4, 0.6) | 2, 3 |
| 5. Weg et al. (1992) | 60 NIS | (0.9, 0.5), (0.67, 0.67), (0.5, 0.9) | Infinite |
Table 2.
Experimental and theoretical opening demands by Player 1 for each δ condition.
| Discount Factor (δ) | ||||||||
|---|---|---|---|---|---|---|---|---|
| Demand | 0.2 | 0.3 | 0.4 | 0.5 | 0.6 | 0.7 | 0.8 | 0.9 |
| Experimental | 0.693 | 0.655 | 0.686 | 0.639 | 0.610 | 0.628 | 0.534 | 0.509 |
| Harmony Prediction | 0.618 | 0.618 | 0.618 | 0.618 | 0.618 | 0.567 | 0.506 | 0.444 |
| SPE Prediction | 0.80 | 0.70 | 0.60 | 0.50 | 0.40 | 0.30 | 0.20 | 0.10 |
Publisher’s Note: MDPI stays neutral with regard to jurisdictional claims in published maps and institutional affiliations. |
© 2022 by the author. Licensee MDPI, Basel, Switzerland. This article is an open access article distributed under the terms and conditions of the Creative Commons Attribution (CC BY) license (https://creativecommons.org/licenses/by/4.0/).
Share and Cite
MDPI and ACS Style
Suleiman, R. Economic Harmony—A Rational Theory of Fairness and Cooperation in Strategic Interactions. Games 2022, 13, 34. https://0-doi-org.brum.beds.ac.uk/10.3390/g13030034
AMA Style
Suleiman R. Economic Harmony—A Rational Theory of Fairness and Cooperation in Strategic Interactions. Games. 2022; 13(3):34. https://0-doi-org.brum.beds.ac.uk/10.3390/g13030034
Chicago/Turabian StyleSuleiman, Ramzi. 2022. "Economic Harmony—A Rational Theory of Fairness and Cooperation in Strategic Interactions" Games 13, no. 3: 34. https://0-doi-org.brum.beds.ac.uk/10.3390/g13030034
Note that from the first issue of 2016, this journal uses article numbers instead of page numbers. See further details here.