1. Introduction
There are many examples of small groups trying to provide a public good: the football team keeping their locker room clean, MBA students doing a group project together or faculty making sure all departmental needs are met. Additionally, something that can increase the provision of these public goods is allowing peers to punish each other. For example, football teammates may not guard an inconsiderate quarterback very well; a student can give a bad rating to a lazy group member; or a faculty member can speak negatively about a bad citizen at a faculty meeting. Such punishments are a common mechanism for increasing the provision of public goods in real life and in lab experiments. However, punishments do not always increase net welfare because often, the costs of punishment outweigh any gains in public good provision. For example, the football team may have a spotless locker room, but no one to enjoy it due to excessive injuries.
There are many reasons a group may punish to the point that net welfare is reduced. One such reason is that punishment can express anger about free-riding. If this is the case, then tools that manage that anger could decrease the use of punishments while keeping welfare high. Additionally, it seems likely that such emotion regulation may be particularly beneficial to individuals and groups who are more aggressive. One can imagine that the highly aggressive football team may benefit from tools that reduce anger more than a group of Quakers raising a barn.
In the present lab experiment, we examine the impact of both emotion regulation and levels of aggression on monetary and mental welfare. Subjects play a linear public goods game with punishment in groups. We randomly assign groups to receive one of two types of instructions. In sessions with objective instructions, subjects are told to “please adopt a neutral, analytical and objective attitude in order to stay calm,” while in those with natural instructions, they are told to “please respond naturally with whatever thoughts and emotions occur to you spontaneously.” In addition, we use a pre-screen survey to measure subjects’ baseline aggression levels to randomly assign subjects to homogeneous groups of all high or low aggression types.
We find that objective instructions decrease the use of punishments. However, the interaction of aggression type and objective instructions is not significant. Only the low aggression types have a statistically significant reduction in punishments, while the results are in the same direction but statistically insignificant for high aggression types. In addition, objective instructions improve both net earnings and self-reported negative emotion when compared to natural instructions. However, these improvements are not statistically significant for low or high aggression types.
Our findings suggest that using emotion regulation instructions decreases punishments and does not harm either monetary or emotional welfare. Our emotion regulation is a very light touch. As such, it is easy to imagine how a message like “adopt a neutral, analytical and objective attitude in order to stay calm” could be paired with opportunities to punish a free-riding peer in the real world (e.g., when being asked to rate a colleague or group member).
In the next section, we briefly describe the related experimental literature. We detail the experimental design in
Section 3, report results in
Section 4 and offer conclusions in
Section 5.
2. Related Experiments
Peer punishment can raise contributions to the public good in lab experiments, but the effects on monetary welfare as measured by net earnings (group earnings minus punishment costs) are mixed. The majority of the previous experiments find that peer punishments decrease net earnings
1, with only a handful of studies finding that peer punishments increase monetary welfare [
6,
7,
8].
Previous work has shown that there are a number of ways to increase the effectiveness of punishment by increasing the severity of punishment [
8], coordinating punishment through a centralized mechanism [
9,
10,
11,
12], eliminating counter-punishment [
13,
14,
15], eliminating antisocial punishment [
16] or by allowing a longer timeline for learning how to use punishment [
4]. In this paper, we propose using emotion regulation to increase the effectiveness of punishment.
There is evidence that people use punishments to express their anger about free-riding. The work in [
6] shows that subjects will use non-monetary disapproval messages to punish free-riders, and they suggest that the use of such messages is a means of expressing anger with free-riders. The work in [
17] finds that subjects will pay for the right to assign punishment to free-riders personally rather than let someone else do the punishing. Additionally, [
14] find that punishment of a non-cooperator by another subject is not a substitute for one’s own punishment of that non-cooperator. The fact that subjects have a preference to assign punishments themselves suggests that they may be using punishments to express anger about free-riding. The work in [
18] finds that observing free-riding triggers negative emotions and that punishing free-riders is associated with higher self-reported positive feelings. However, they also find that those who are punished experience negative emotions. Overall, the effect of punishments on group emotional welfare is ambiguous.
To our knowledge, only one paper tries to improve group monetary welfare by controlling subjects’ emotions. The work in [
19] designs three treatments to help subjects release their negative emotions before making punishment decisions. The first treatment adds a cooling off period. The second treatment adds a self-reporting of emotional states to the cooling off period. The third treatment adds virtual punishment points to the cooling off period and the self-reporting. Results show that subjects have the highest net earnings in the cooling off-only treatment. Excessive emotion venting in the second and third treatments reduces contribution levels and decreases the punishment’s effectiveness.
Dickinson and Masclet [
19] nicely illustrate the potential for interventions that alter emotions to have an impact on behavior in public goods’ contexts. It remains unclear, though, what it is about the cooling off period that has the effects they observed. What were participants doing in that 5-min period? One possibility is that participants were thinking about things unrelated to the game (“can’t forget to buy eggs on the way home”); or, maybe they were attempting to think differently about the game itself (“it’s just a game; keep a level head”). Both of these options represent effective ways to alter emotions, but they represent different forms of emotion regulation [
20], with the former focused on altering attention to the situation and the latter focused on altering appraisal of the situation. Our study makes a novel contribution by explicitly manipulating just one form of emotion regulation, cognitive reappraisal.
Cognitive reappraisal refers to the process of reinterpreting emotion-triggering situations in order to alter one’s emotional response. For example, faced with criticism from a friend, a person might interpret the criticism as an opportunity to learn or consider the situation from the friend’s perspective. These alternative interpretations may mitigate the anger one might otherwise feel. Indeed, a recent meta-analysis summarizing the results of previous experiments indicates that cognitive reappraisal is an effective way of regulating emotions as reflected in self-report and behavioral measures [
20]. In this work, we apply this strategy to the context of a public goods scenario. Specifically, we instruct participants to adopt a neutral, analytical and objective attitude in order to remain calm while making decisions. It was our hope that cognitive reappraisal would reduce the use of punishments while still improving net earnings and emotional welfare.
Previous work has found that emotions can affect actions in a variety of settings and specifically in the use of punishment
2. Among all of the negative emotions that might increase the amount of punishment assigned, anger’s role is especially emphasized. The work in [
15,
28] shows that higher anger intensity is positively related to higher punishment. The work in [
29] uses a short video to induce subjects’ happiness or anger before they play the public goods game and find that angry subjects tend to contribute less and punish more than happy subjects. The work in [
29] shows that induced anger increases the use of punishments, so a next step is to test if those with a pre-existing tendency to anger/aggression punish more than those with lower pre-existing aggression levels.
Finally, the design of this experiment allowed us to determine whether pre-existing aggression levels might moderate the effect of cognitive reappraisal on punishments and/or monetary or emotional welfare. Previous studies have shown these kinds of individual-difference moderation effects in other domains. For example, [
30] found that those with a pre-existing tendency to ruminate on negative aspects of the self and life in general exhibited different patterns of change in brain activation when using cognitive reappraisal. In this work, we examine whether those with a pre-existing tendency to be aggressive exhibit different levels of punishments, earnings and/or emotional welfare when using cognitive reappraisal in a public goods scenario. To our knowledge, no existing studies point to the specific interaction pattern we might expect in this context. Intuitively, lower aggression people may be less likely to be overly emotional in their decision making and so might be less affected by emotion regulation. We acknowledge, however, that other patterns are possible.
3. Experimental Design
3.1. Pre-Screen and Recruitment
In October 2014, we began collecting responses to an online pre-screen survey using Qualtrics from students at Tufts University. The median time to complete the pre-screen survey was 2 min. Respondents answered 29 Buss–Perry Aggression Scale questions [
31] and reported their gender and age (see the
Appendix for full pre-screen survey). The Buss–Perry score, which exhibited acceptable internal consistency reliability in this sample (Cronbach’s alpha = 0.89), is highly associated with aggressive behaviors in economic decision making and video games [
32,
33]. Respondents with a total aggression score above 2.58 were defined as a high aggressive type
3. We used 2.58 as the cut-off value to define two aggression groups because this was the median value of 223 responses collected before our experiment started in October 2015
4. Subjects were never informed of their aggression score or that of any other player.
In total, we had 487 respondents to our pre-screen survey between October 2014 and January 2016. We invited these respondents to participate in our 21 experimental sessions, which ran between October 2015 and March 2016
5.
3.2. Session Procedures
Subjects played ten periods of a linear public goods (LPG) game in fixed groups of four with random identifiers that changed each period to mitigate reputations and revenge motives. Each session had at least eight participants to ensure subjects did not know who they were specifically interacting with
6.
3.2.1. Group Assignment
At the beginning of each session, subjects checked in with an experimenter and were assigned to a computer. Using data from the pre-screen survey, subjects were assigned to play in a four-person group that was either all high aggression individuals or all low aggression individuals. Subjects were not made aware of the group’s aggression makeup during the session, and groups of both types were allowed to be in the same session.
We use groups with all of the same aggression types because there is a well-documented tendency for people’s social networks to be made up of those who are similar to themselves [
35]. Furthermore, if we had groups with heterogeneous aggression types, it would be difficult to disentangle the effect of emotion regulation from the effect of group makeup. Last, we expect that if there are differing treatment effects by aggression type, they will be most pronounced in homogeneous groups, so all high or low aggression types seemed a natural starting point
7.
Table 1 shows the individual aggression scores by aggression type (low or high) and whether subjects received objective emotion regulation or natural instructions. Using G*Power 3.1.9.2, we determined that, with a minimum of 32 subjects in each group, we had sufficient power to detect medium effects (Cohen’s d = 0.50) with power (1 −
β) = 0.80 for the objective versus natural emotion regulation instruction comparison within each aggression type, aggregated across periods.
3.2.2. Overview of Experiment
Subjects were seated at a computer and made choices using ztree software [
36]. First, all subjects completed a mood rating survey
8. Then, the experimenter read instructions for the first five periods, which consisted of a linear public goods game with punishment and instructions on “how to approach this task.” Although every session followed the same general experimental procedures, sessions with the natural versus objective treatments differed in “approach” instructions, which we will detail in a moment. Subjects had to correctly complete a comprehension quiz before playing the first five periods. Subjects were told there would be a total of ten periods, and they would be paid for one randomly-chosen period
9.
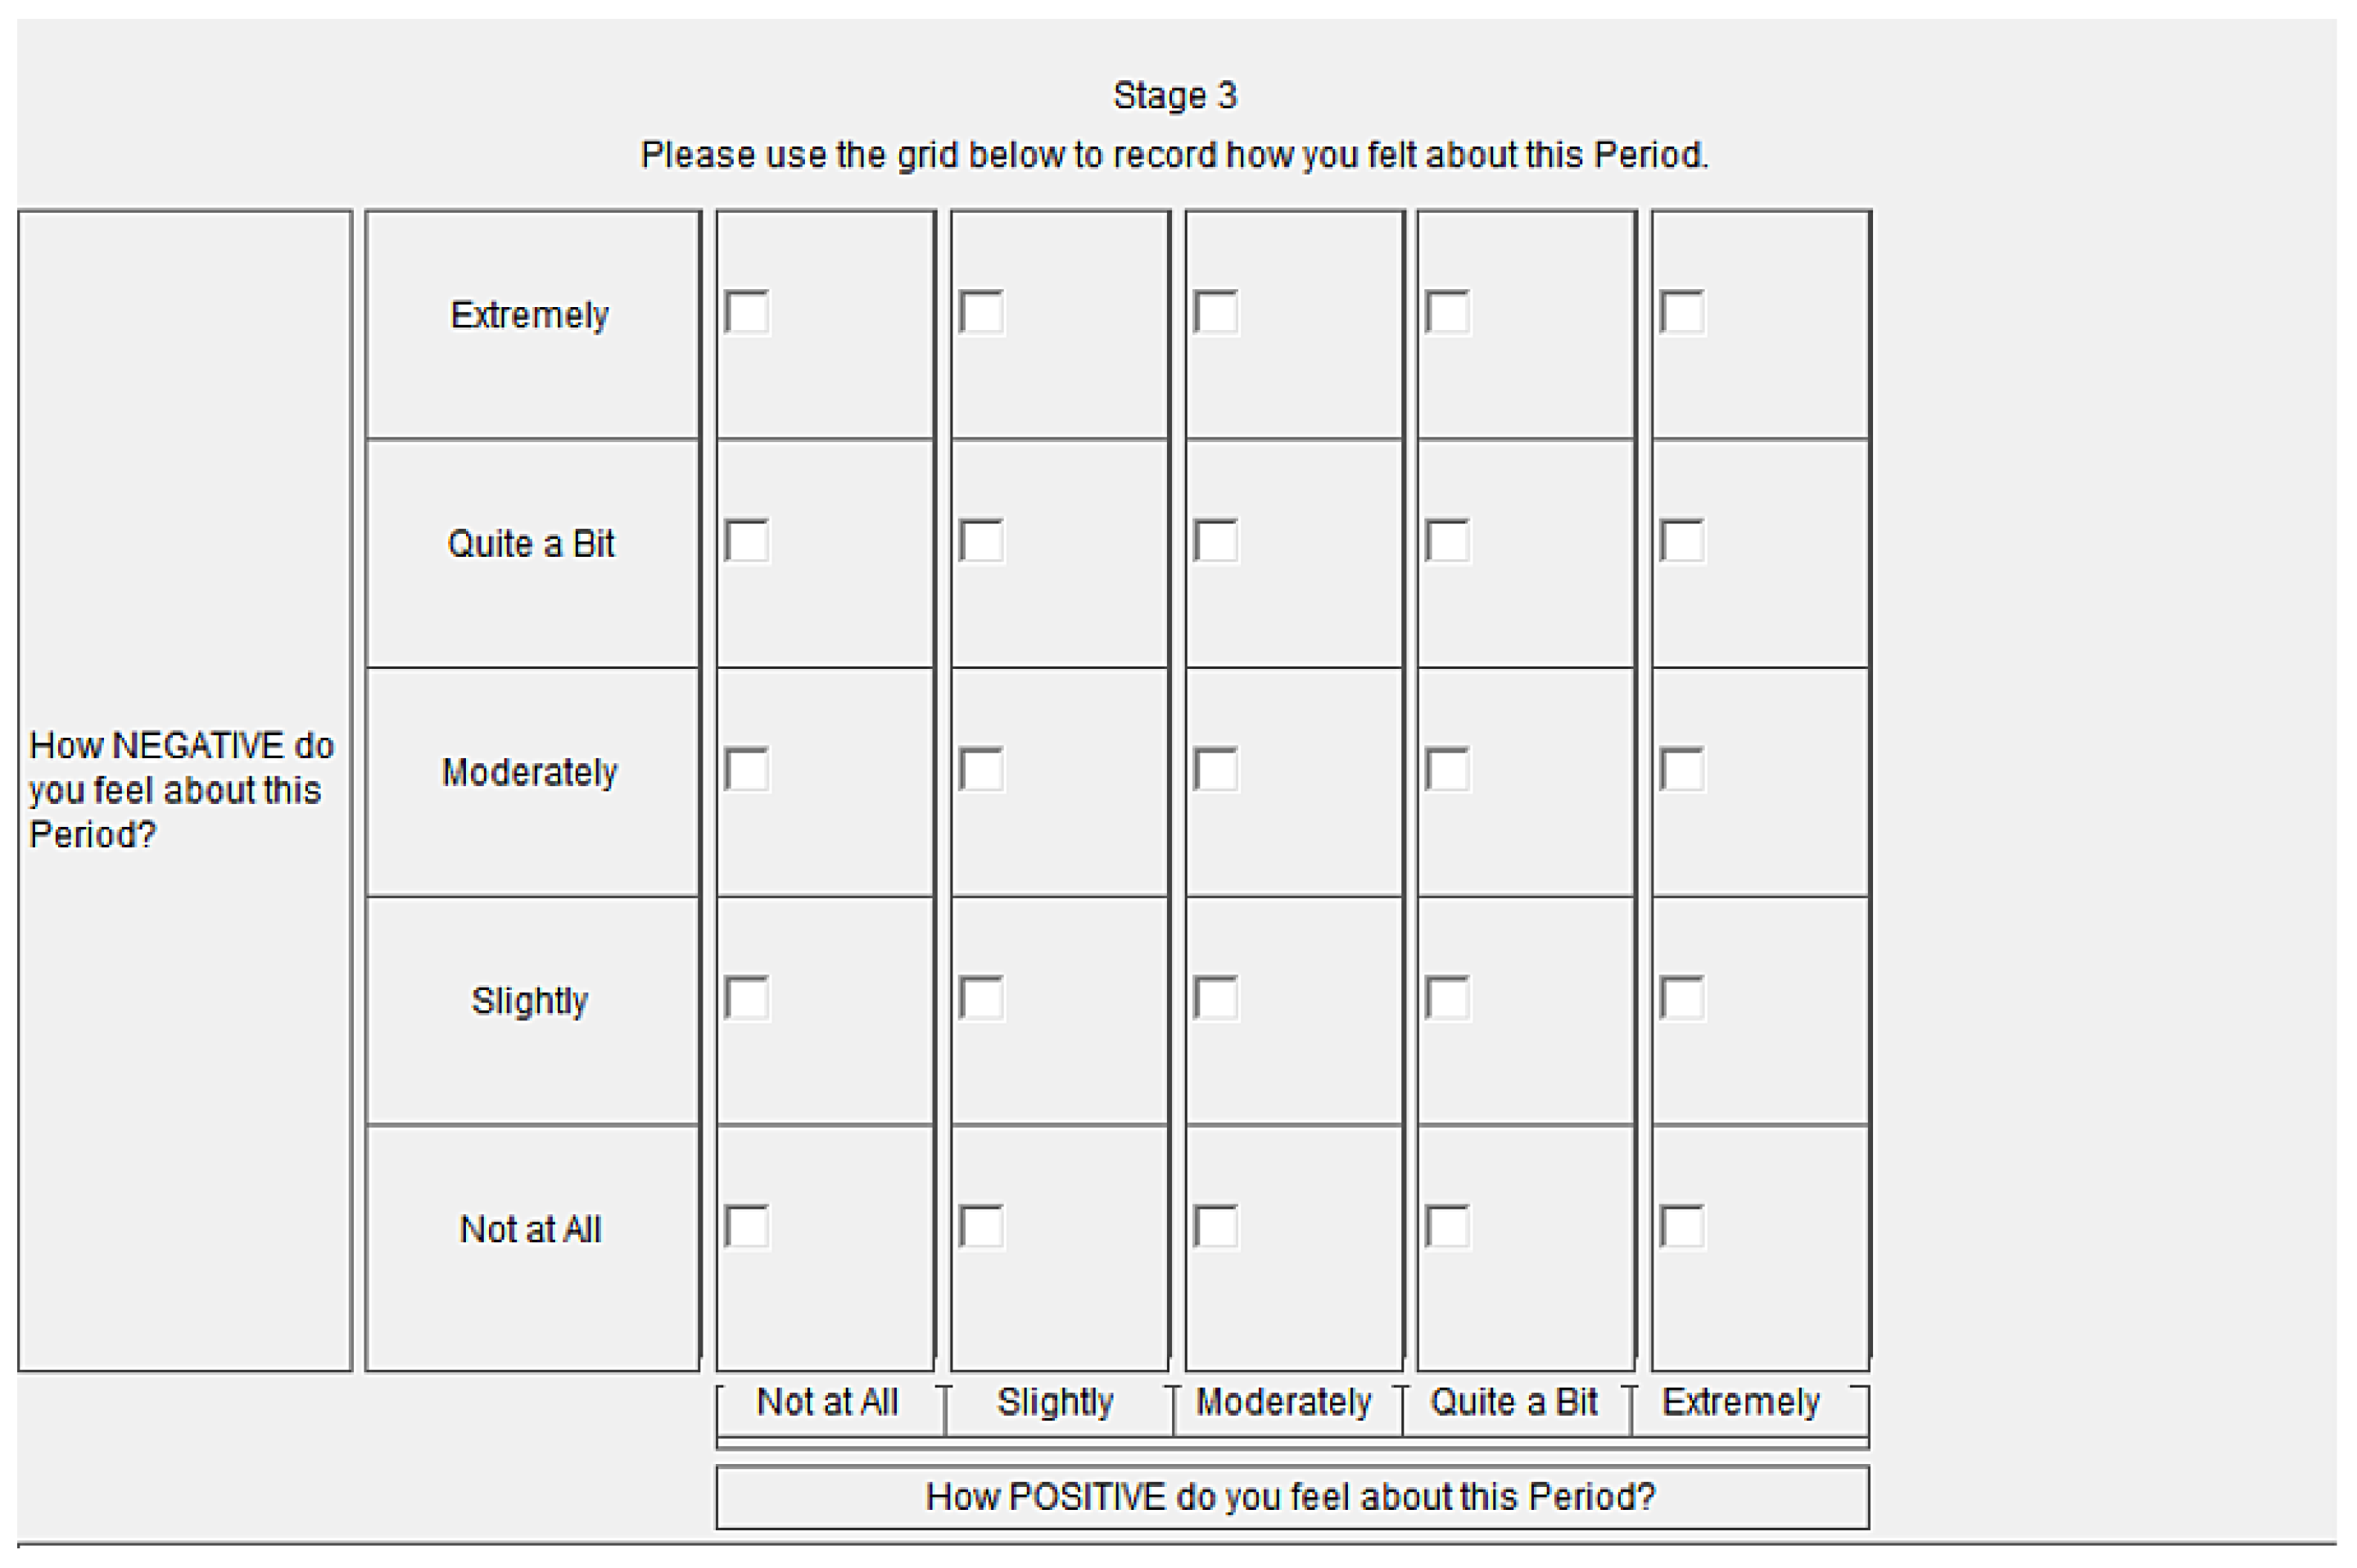
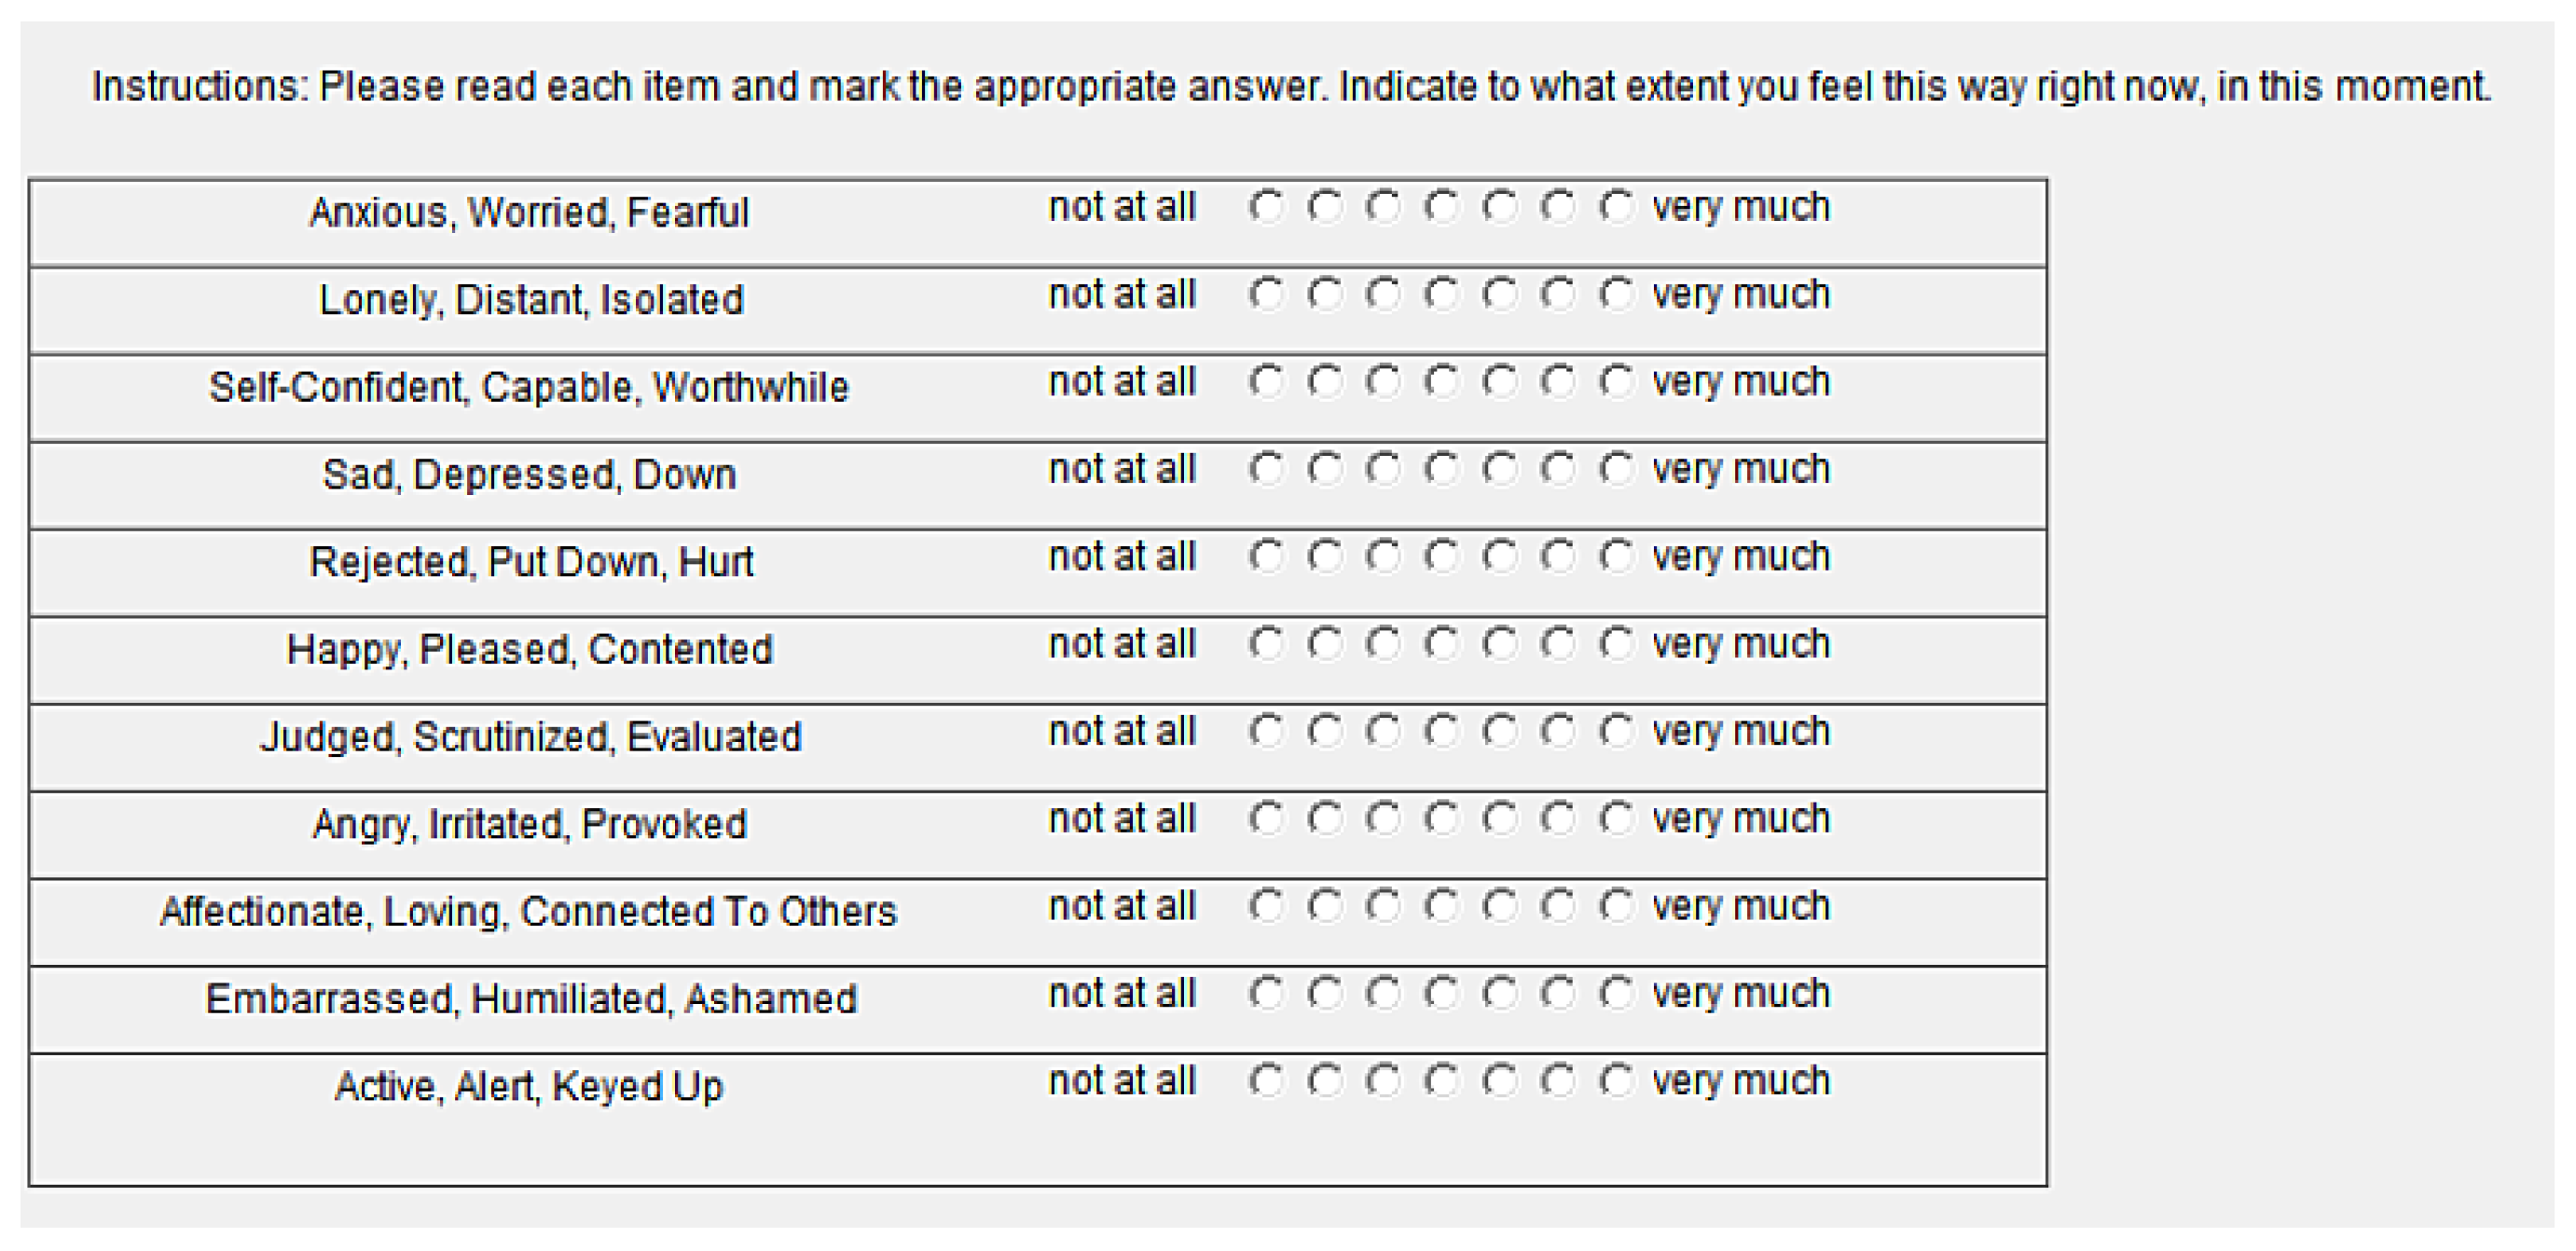
Upon completion of the fifth period, instructions for Periods 6 to 10 were read aloud. In these last five periods, subjects played the same game with the same instructions on “how to approach this task.” The only difference was that at the end of each period, after all actions had taken place and results had been reported, subjects rated their positive and negative emotions using the well-validated evaluative space grid [
38], as shown in
Figure 1. We chose to collect self-reported emotions because we wanted to measure both emotional and monetary welfare. However, self-reporting emotions is itself a form of emotional venting [
19], so we only did this in Periods 6 to 10.
We used the evaluative grid space because it allows subjects to efficiently report negative and positive emotions, both of which might be particularly important in our study. Previous work shows the co-existence of both positive and negative emotions in other economic games [
27]. For example, how might a subject feel who earned a low payoff this period, but who punished the free-riding group member? This subject may feel negative about the low payoff, but positive about punishing the free-rider. The grid rating procedure yielded two scores that ranged from zero to four, one for negative affect and one for positive affect, for Periods 6 to 10.
After all ten periods had been played, participants completed the same mood rating survey they did at the beginning of the session.
3.2.3. Linear Public Goods Game with Punishment
Each period, subjects were given a five-token endowment. In Stage 1, subjects can keep tokens in a private good that pays $1.50 per token to only them or they can contribute tokens to a public good that pays $1.00 per token to all four members of their group
10. Because the individual return to keeping a token ($1.50) is greater than the individual return to contributing to the public good ($1.00), the Nash equilibrium of the one shot game is zero public contributions
11. Stage 1 payoffs are:
In Stage 2, subjects are shown the Stage 1 contributions and earnings of their group members with randomly-created identifiers that change each period. Subjects can then assign punishment points to any other person in their group
12. A punishment point costs $1 to assign and reduces the income of the subject receiving the punishment by $3
13. Thus, Stage 2 payoffs are Stage 1 payoffs minus the cost of punishment assigned by
i to others and minus three-times the punishment points assigned to
i:
In the final period of play, there is no reason to pay the costs to assign punishment points as they cannot deter future free-riding behavior, so we expect in the final period. As such, if no punishment points are assigned in Stage 2, an own profit-maximizing player will set . The game is played a finite number of times, so using backward induction, we expect that own profit-maximizing players will choose for all ten periods, and if all players choose this amount, they will each earn $7.50 from the game. However, the group welfare-maximizing contribution is . If all players choose this amount, they will each earn $20.00 from the game.
3.2.4. Emotion Regulation: How to Approach the Task
We ran sessions with either natural instructions or objective emotion regulation instructions. The difference between these two types of sessions was reflected in how subjects were instructed to approach the task, as follows:
Natural: “For this experiment, we’d like you to please respond naturally with whatever thoughts and emotions occur to you spontaneously. Thus, while remaining focused on the task, please allow yourself to respond naturally to the intentions of other group members and the investment and deduction decisions they are making.”
Objective: “For this experiment, we’d like you to please think about your decisions in this task in a way that helps you stay calm. Thus, while remaining focused on the task, please do your best to adopt a neutral, analytical, and objective attitude about the intentions of other group members and the investment and deduction decisions they are making.”
Subjects were also reminded of how to approach the task each period with a screen prior to making punishment decisions that displayed the following messages:
Natural: “Remember: As you consider your decisions, please respond naturally with whatever thoughts and emotions occur to you spontaneously.”
Objective: “Remember: As you consider your decisions, please adopt a neutral, analytical, and objective attitude in order to stay calm.”
Last, these same messages appeared on the screen used to make punishment decisions as shown in
Figure 2.
The objective instructions were intended to encourage subjects to use a specific strategy, cognitive reappraisal, to regulate their emotions in order to stay calm. The natural instructions, roughly matched in terms of length and focus on other group members, were intended to serve as an active control condition as a basis of comparison. Subjects were not encouraged to regulate their emotions. Instead, they were encouraged to respond naturally. We felt it was important to compare the effect of the objective instructions to a treatment with other written instructions because the mere mention of how to approach the decision might have an effect, and we wanted to keep this constant across our treatments.
It is important to note that most if not all subjects who received objective instructions probably intuited that the instructions were meant to impact their behavior and emotions in the game (i.e., reduce punishments, increase contributions and/or improve emotional state). Much like how a patient undergoing anger management training knows that the goal of their counselor is to reduce the patient’s anger, this experimenter demand effect is part of the treatment of interest, not a limitation in this study context.
4. Results
We sought to determine whether emotion regulation via cognitive reappraisal might reduce the use of punishment while improving monetary and emotional welfare. We further sought to determine whether pre-existing tendencies toward anger/aggression might have an opposing effect on punishments and, possibly, moderate the effect of the cognitive reappraisal treatment on punishments and welfare. Importantly, subjects who were randomly assigned to objective emotion regulation instruction sessions did not differ from those assigned to natural instruction sessions on age, gender, average aggression score or starting mood
14.
Table 2 presents summary statistics by aggression type and instructions.
4.1. Public Contributions
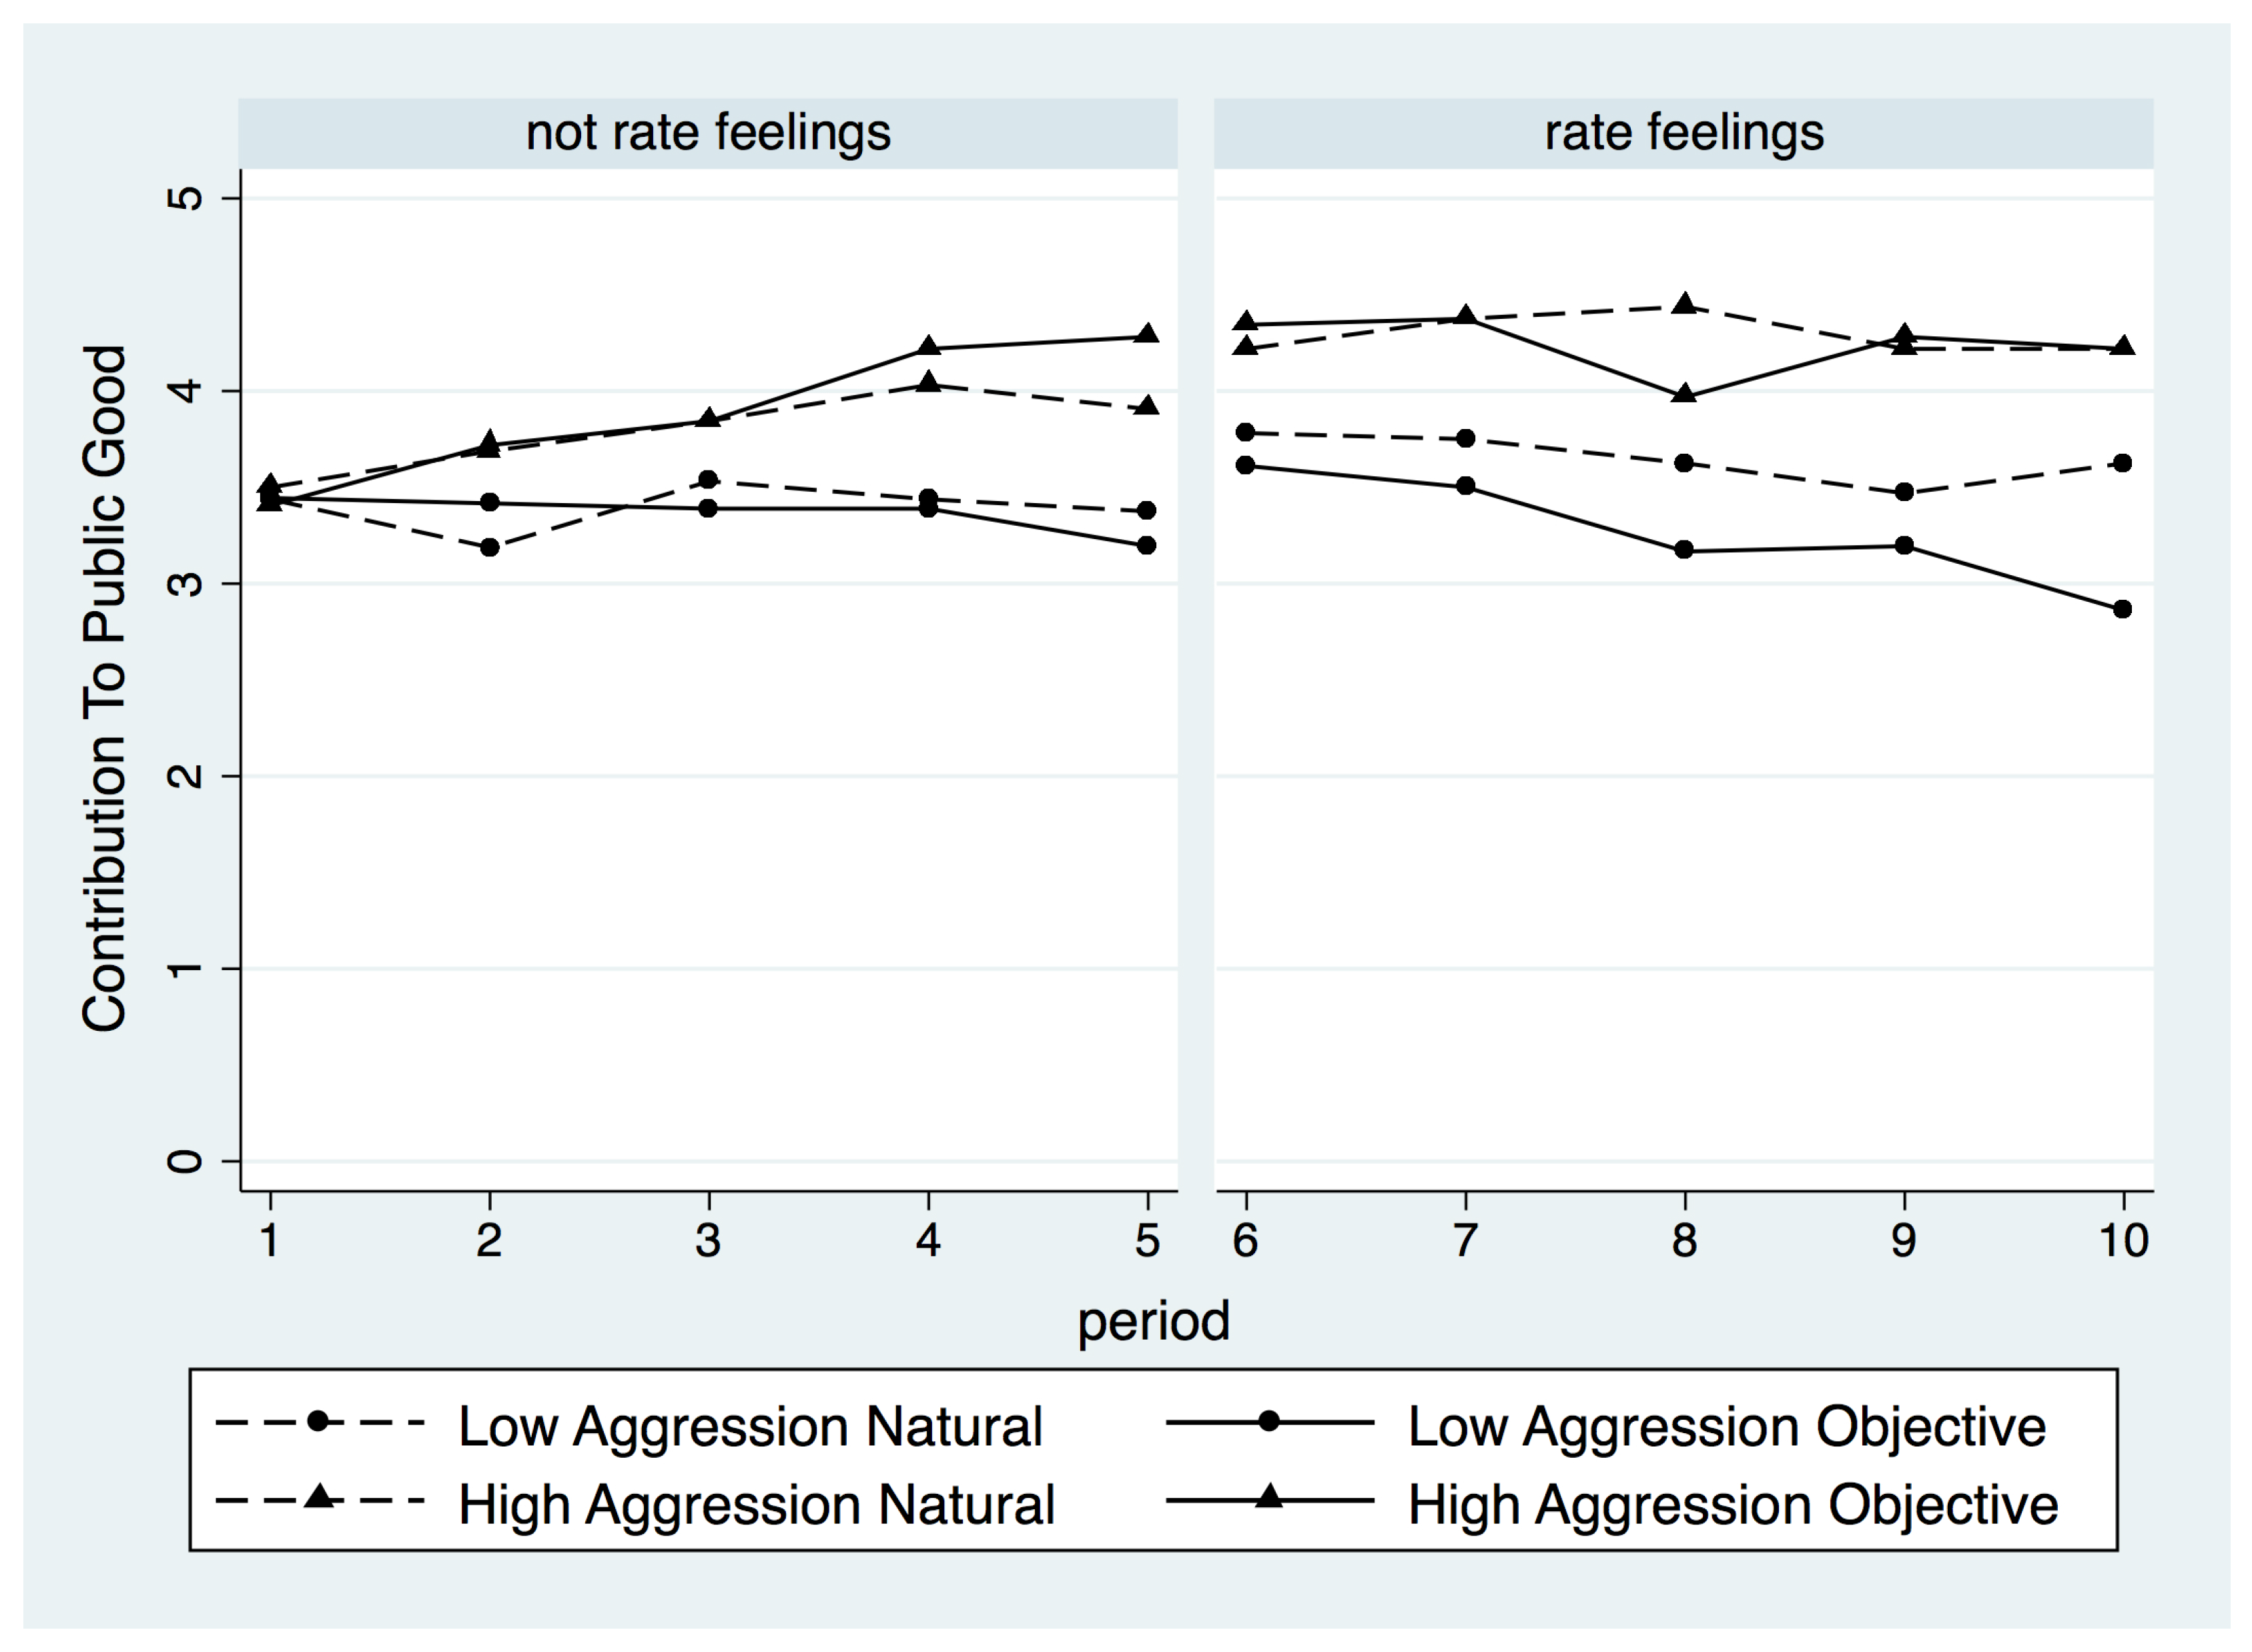
We did not have expectations before the experiment about the level of contribution by aggression type because we were most interested in measuring the use of punishments and monetary/emotional welfare. However, it is interesting to note that contributions to the public good are higher for the high aggression types than the low aggression types and that these differences become larger over time as illustrated by
Figure 315. As such, we include group public contributions as a control in our analysis of punishment behavior to account for the different contributions by low and high types.
4.2. Punishment
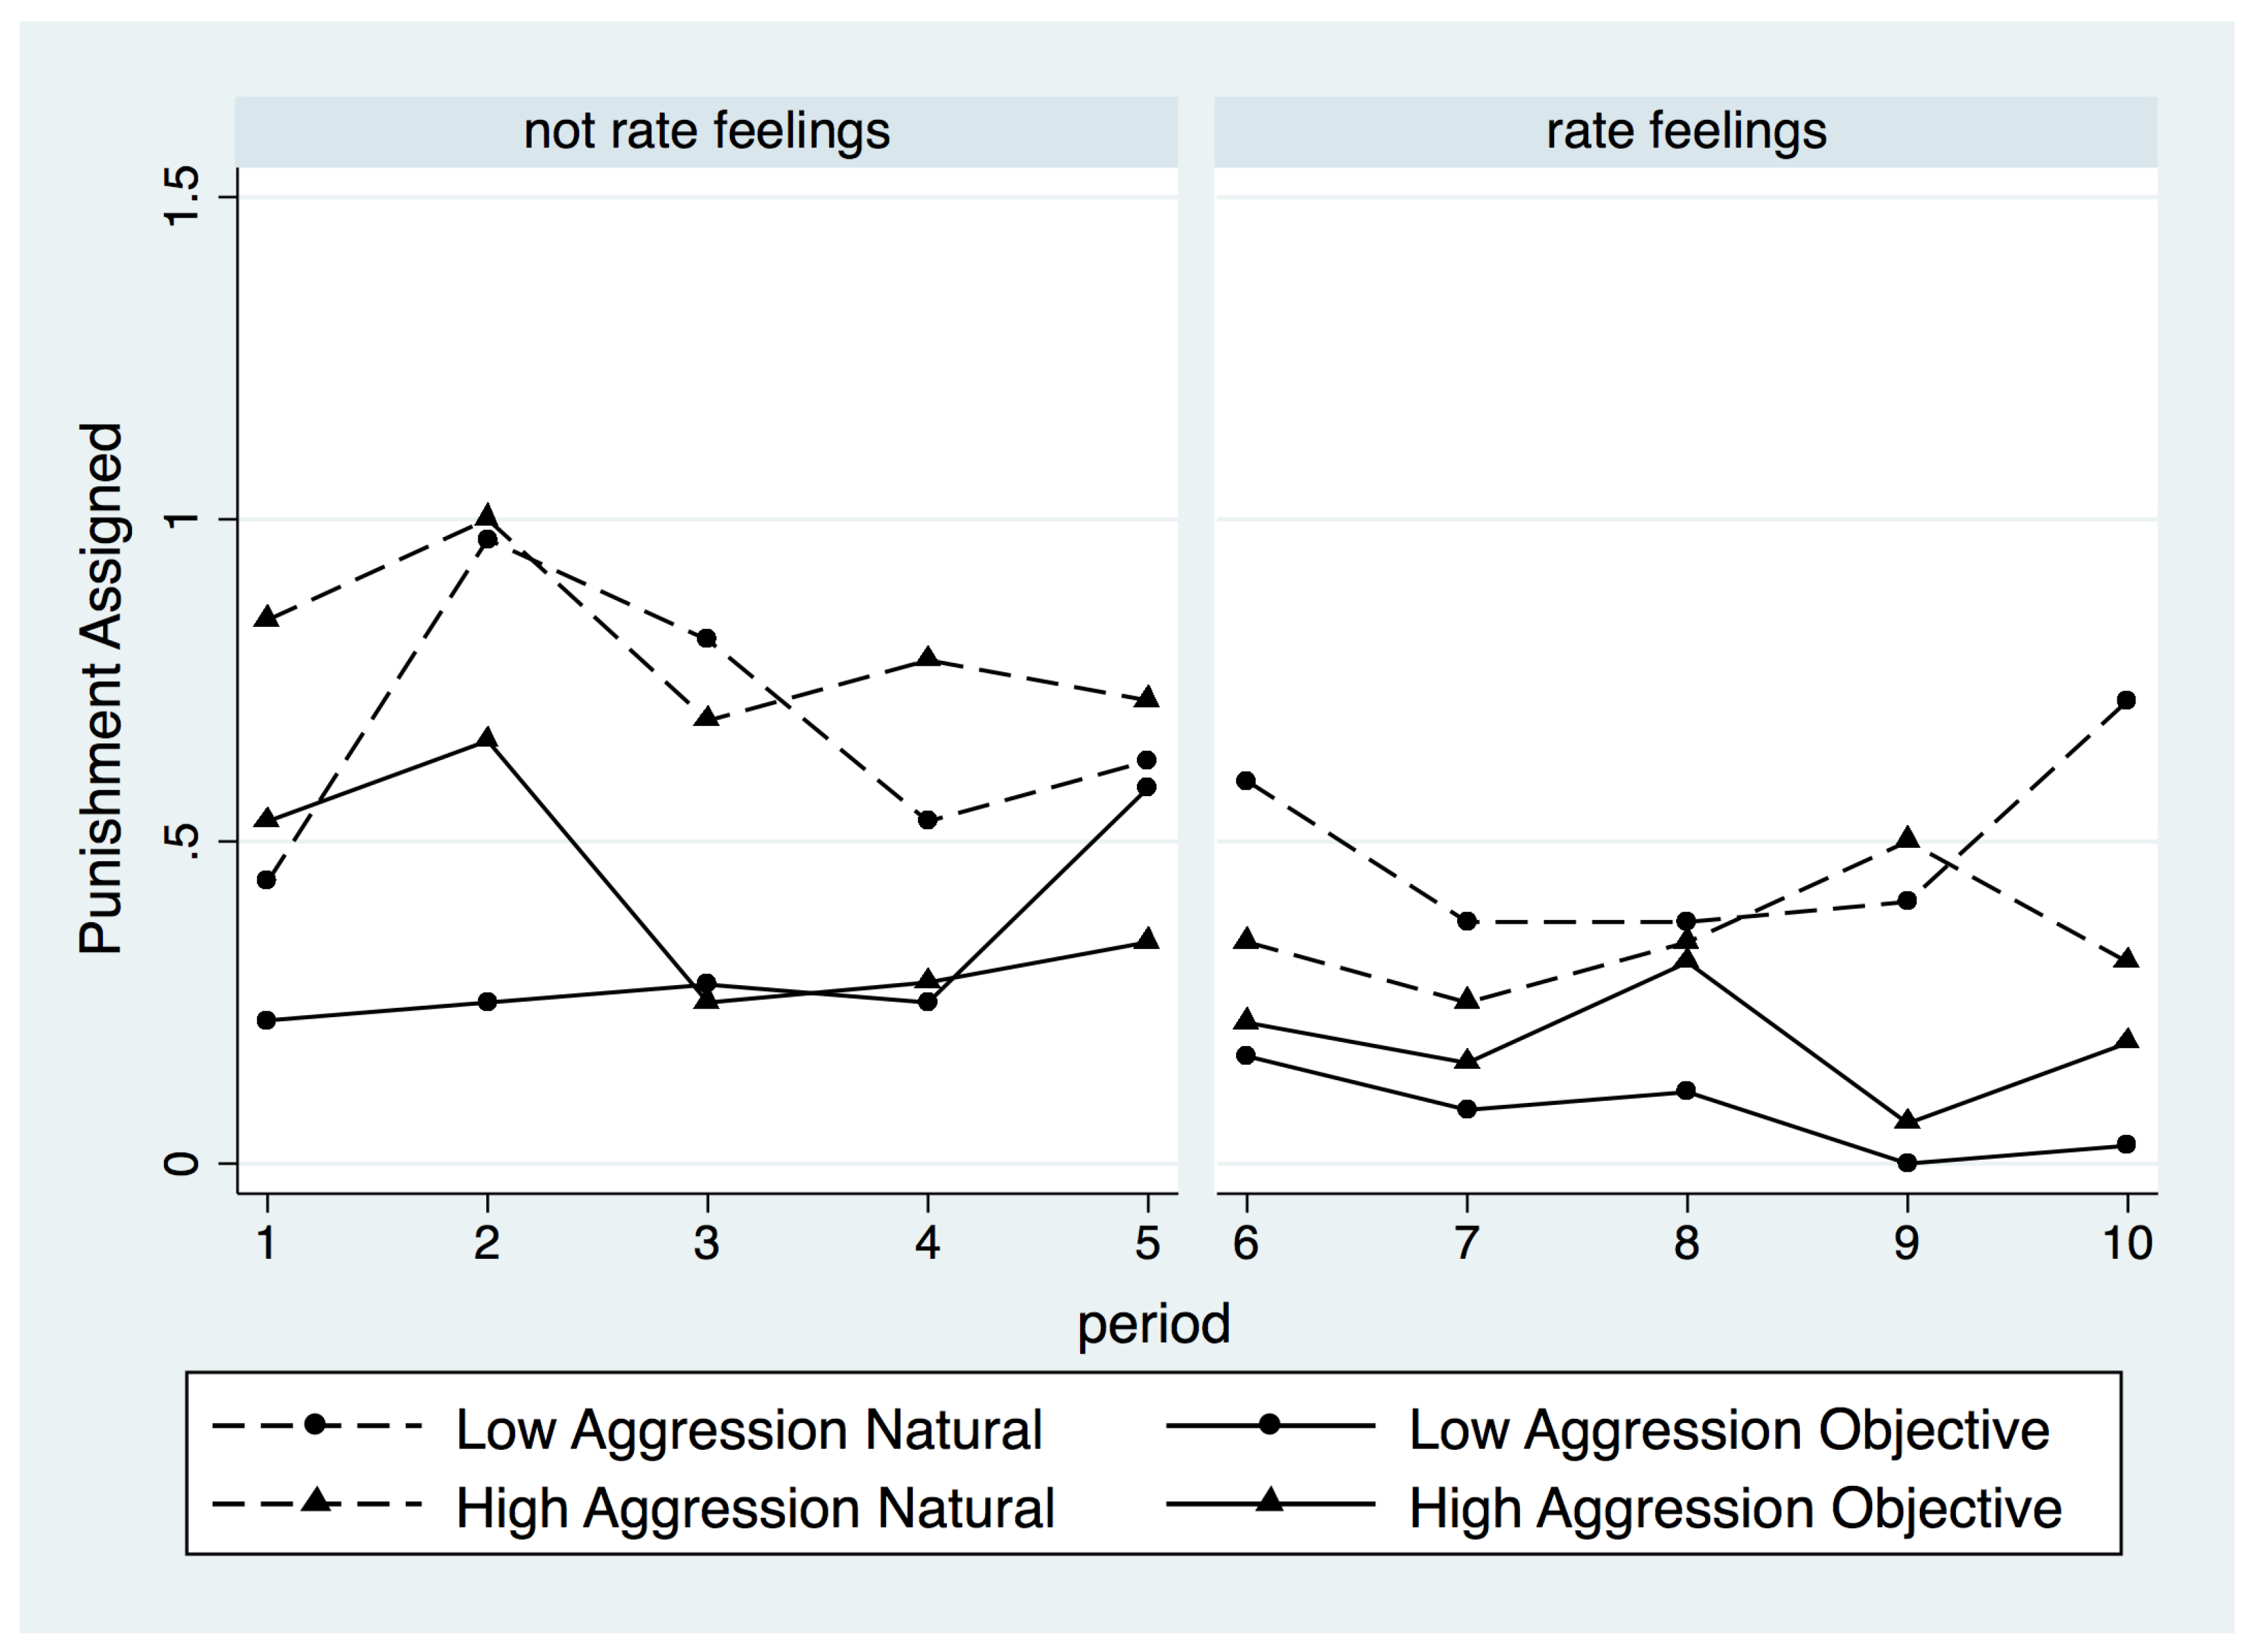
Figure 4 shows that, in all ten periods, subjects of either aggression type punish less when they read the objective emotion regulation instructions. We did not have expectations about the use of punishment over time before the experiment. However,
Figure 4 shows that the difference in the use of punishments by type of instructions falls over time for both types. This may be partially driven by changes in public contributions over time as illustrated in
Figure 316.
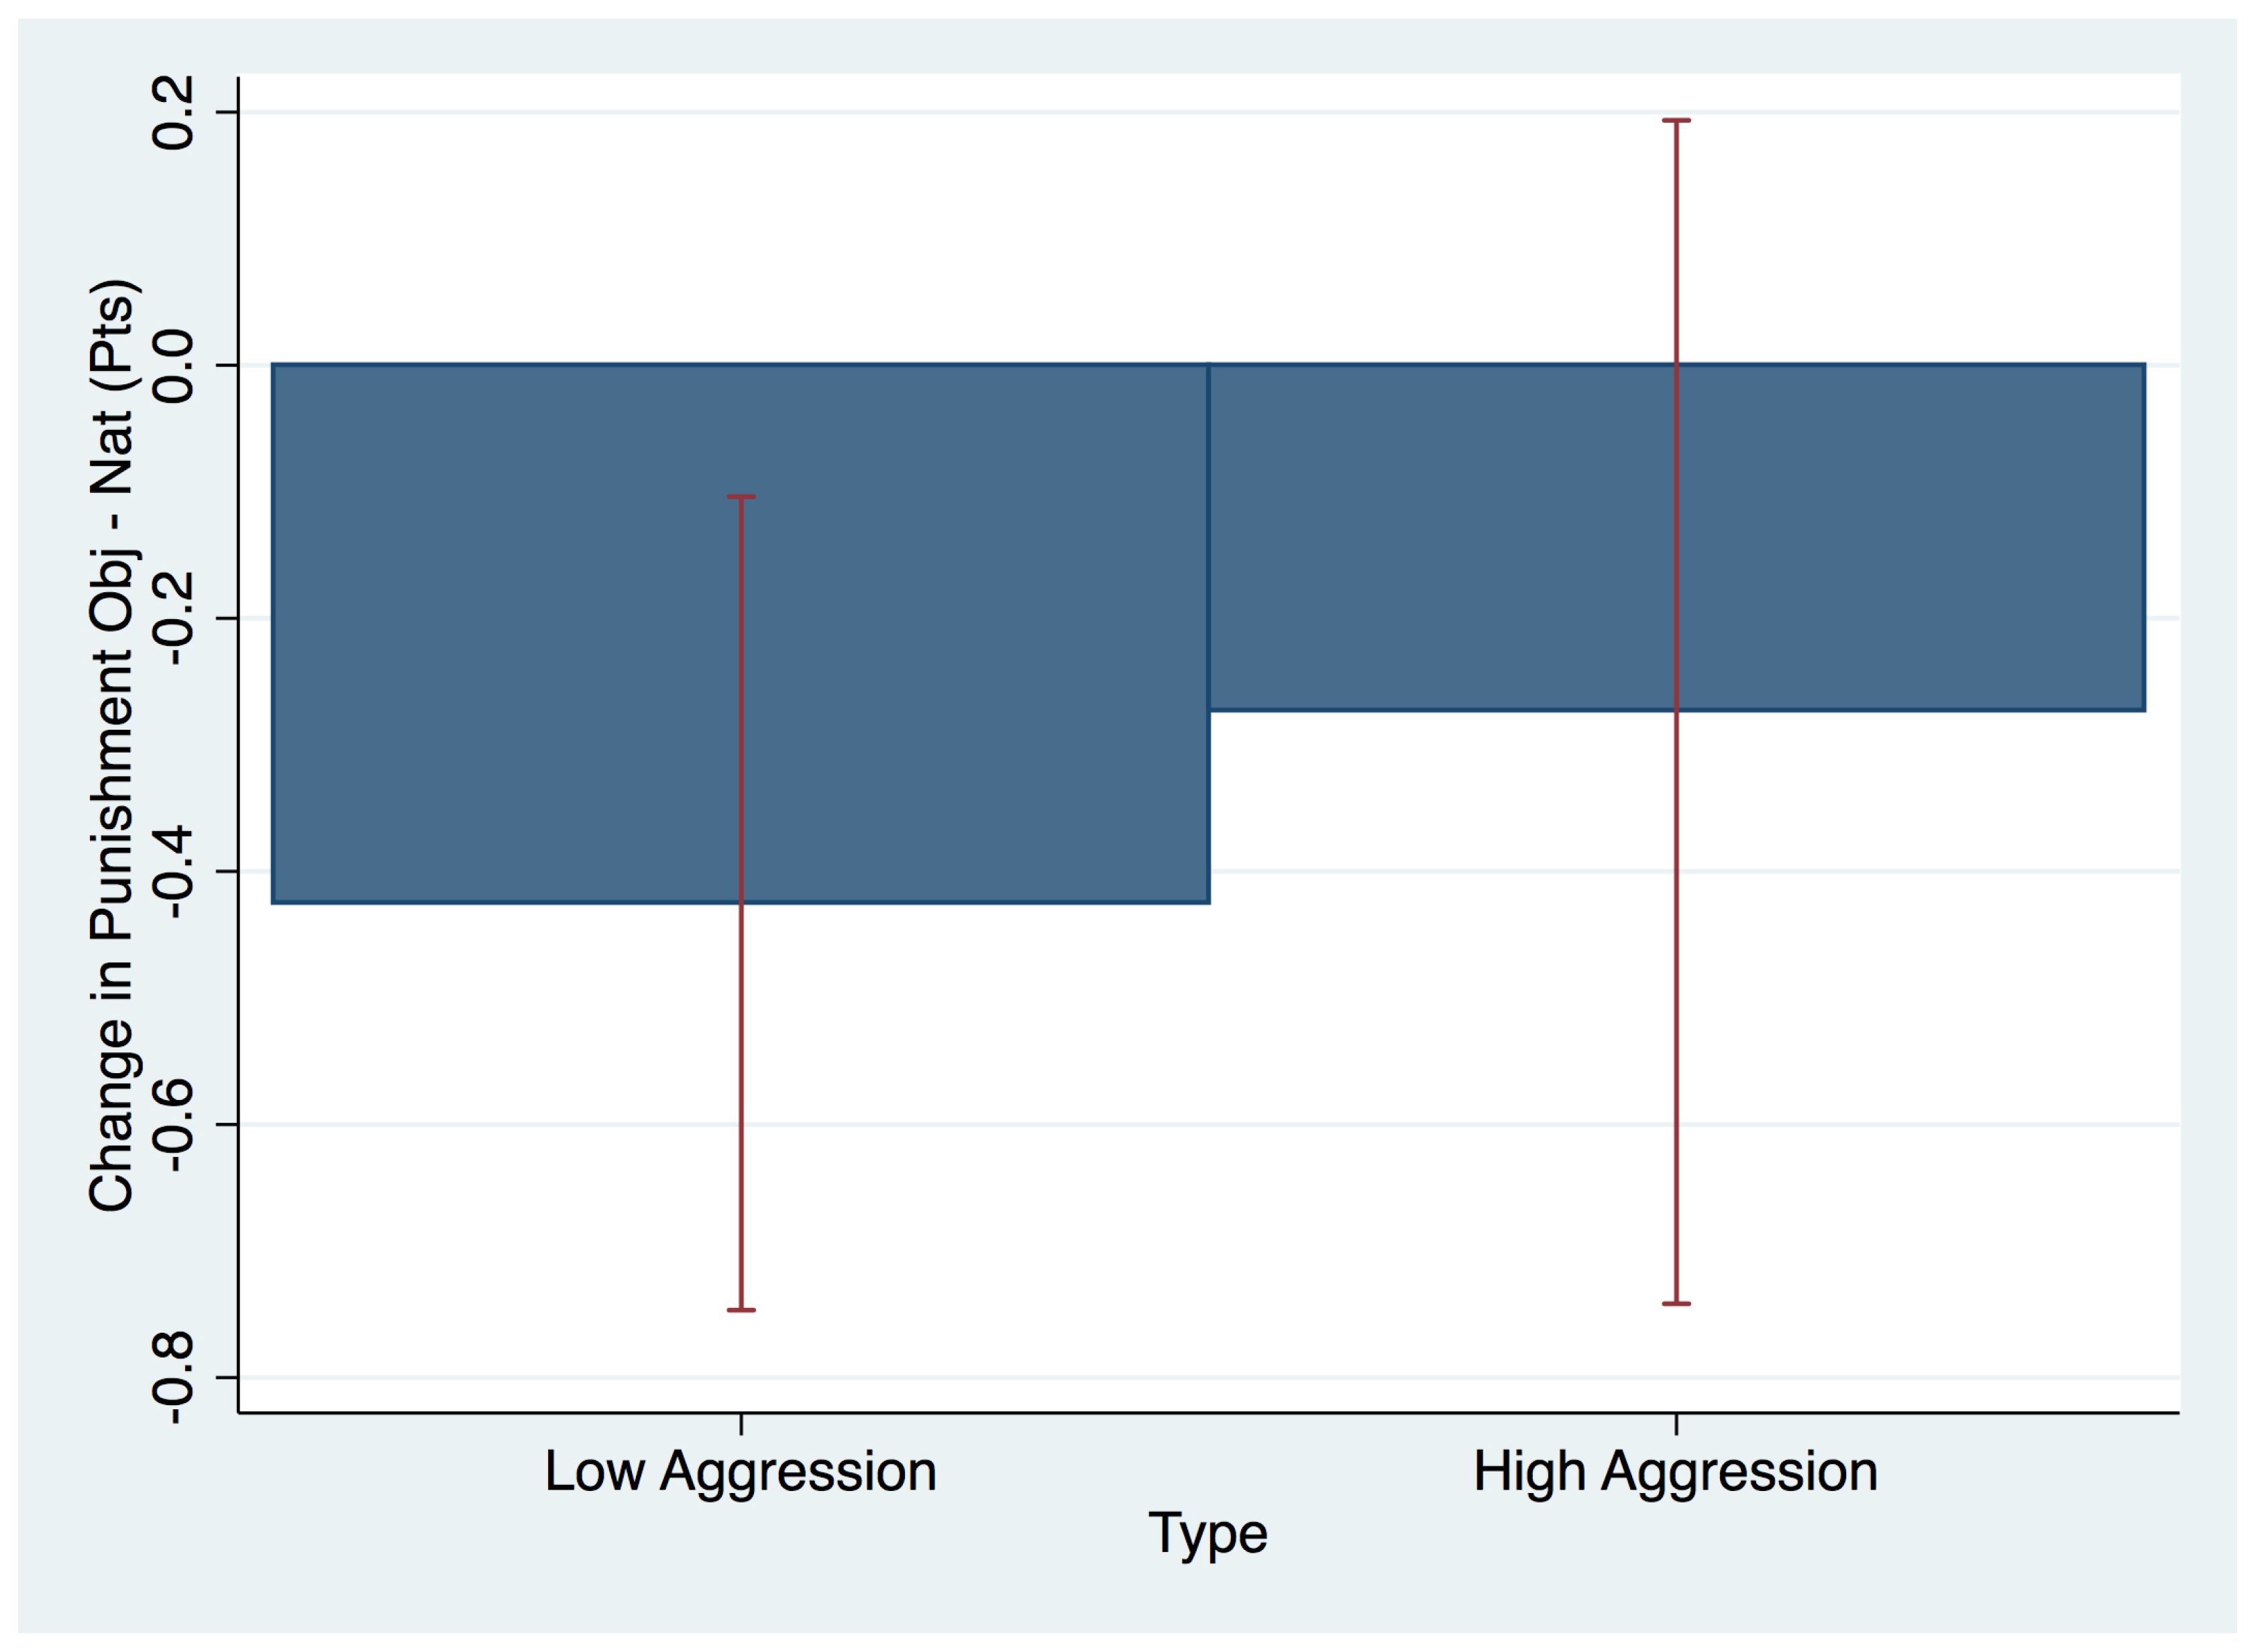
Figure 5 shows the effect of the objective instructions on the number of punishment points assigned from a random effects regression that controls for group level public good provision. We use a random effects model to account for each subject playing 10 periods, and we use standard errors clustered at the group level to account for groups interacting over 10 periods
17. Using this preferred specification, we find that for low aggression types, the objective emotion regulation instructions result in a statistically-significant decrease of 0.43 punishment points, about a 74% decline from the mean for low aggression types using natural instructions (
). This represents a roughly medium effect size (Cohen’s d = 0.56, 95% CI (0.08, 1.05))
18. The objective emotion regulation instructions also decrease punishment for high aggression types, in this case by 0.27 points, a 47% decline,
, from the mean for high aggression types using natural instructions. This difference is not statistically significant, but represents an effect that is small to medium in size (Cohen’s d = 0.36, 95% CI (−0.14, 0.85))
19. Overall, this pattern suggests that objective emotion regulation instructions reduce the use of punishments. The objective emotion regulation instructions reduce the use of punishments more for low than high aggression types, although this difference is not statistically significant.
4.2.1. Antisocial Punishment
One particular type of punishment that has been shown to be harmful to net earnings is antisocial punishment [
16,
44,
45,
46]. Antisocial punishment is punishment assigned to contributors rather than free-riders. The work in [
16] defines weak antisocial punishment as occurring when a subject
i assigns punishment points to subject
j, but subject
j’s public contribution was greater than or equal to subject
i’s contribution. Using this measure, we found that under the natural instructions, 34% of punishments by high aggression types are antisocial, but only 19% are antisocial for low aggression types. The use of the objective instructions lowers the amount of antisocial punishment to 27% for high types, but had no effect on the level for low types. The use of the objective instructions does not result in a statistically-significant difference in the number of antisocial punishment points assigned for either low or high types. We take this as suggestive, but inconclusive evidence that the objective instructions decrease the amount of antisocial punishments for high aggression types
20.
We have shown that the objective emotion regulation instructions decrease the use of punishment points and the amount of antisocial punishment, at least for high aggression types. In the next section, we determine whether emotion regulation instructions and levels of aggression improve monetary and emotional welfare.
4.3. Monetary and Emotional Welfare
Figure 6 shows that, within each aggression group, subjects have higher net earnings when there is emotion regulation (objective) compared to when there is not (natural) in eight of ten periods
21. However, the difference is not statistically significant, as shown in
Figure 7a.
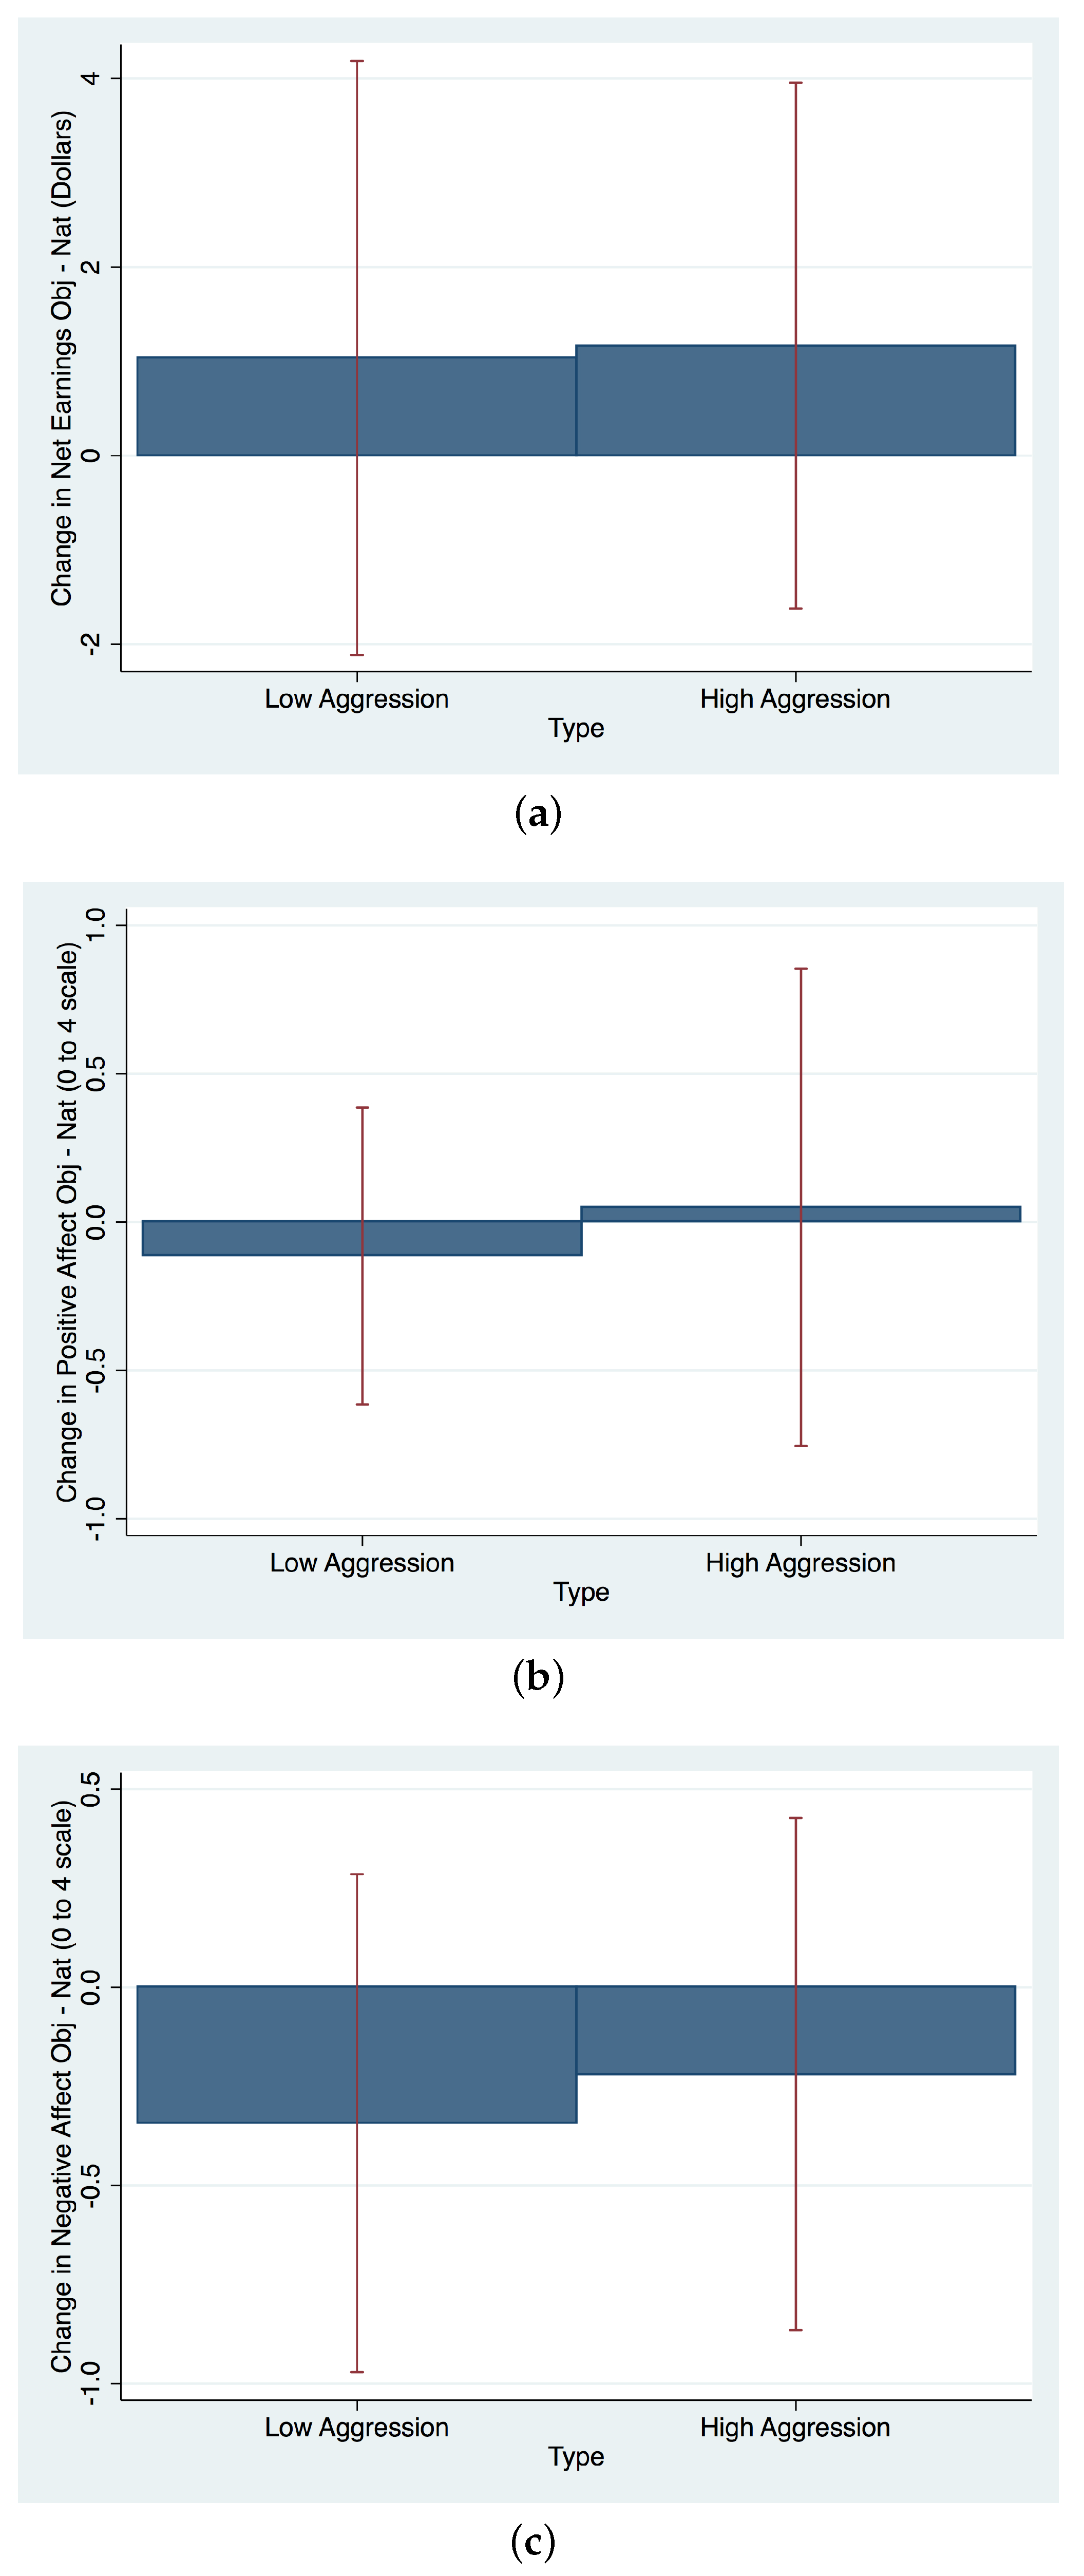
Figure 7 shows the effect of the objective instructions on our three welfare measures: net earnings, positive affect and negative affect. These estimates come from random effects regressions (
Appendix Table A2)
22.
Figure 7a shows that net earnings increase with the objective emotion regulation instructions for high aggression types by $1.17 a 8% rise from the mean for high types with natural instructions (
; Cohen’s d = 0.38, 95% CI (−0.12, 0.87)) and for low aggression types by $1.03 a 7% rise for low types with natural instructions (
; Cohen’s d = 0.31, 95% CI (−0.17, 0.78)), but neither of these differences is statistically significant.
Figure 7b shows that positive affect is similar in Periods 6 to 10 for subjects with the natural instructions or with the objective emotion regulation instructions. With the objective emotion regulation instructions, high aggression types report an increase of 0.05 points in positive affect, a 2% rise from the mean for high types with natural instructions (
; Cohen’s d = 0.04, 95% CI (−0.45, 0.53)). By contrast, low aggression types report a decrease of 0.11 points, a 5% decline from the mean for low types with natural instructions (
; Cohen’s d = 0.11, 95% CI (−0.37, 0.59)). Neither of these differences are statistically significant.
In parallel, with the objective emotion regulation instructions, high aggression types report a decrease of 0.22 points in negative affect, a 24% decrease from the mean for high types with natural instructions (
; Cohen’s d = 0.24, 95% CI (−0.25, 0.73)). Similarly, low aggression types report a decrease of a 0.34 points in negative affect, a 43% decrease from low types with natural instructions (
; Cohen’s d = 0.37, 95% CI (−0.11, 0.85)). Again, neither of these differences are statistically significant, as shown in
Figure 7c.
23We also explore whether there are any changes in the 11 mood ratings taken at the beginning and end of the experiment. We find that the objective emotion regulation instructions reduce feeling rejected and embarrassed for low aggression types, while they reduce feeling lonely and active for high aggression types
24.
In short, although the point estimates for most of the measures of monetary and emotional welfare improve, the differences are not statistically significant.
5. Conclusions
Much of the previous work has found that peer punishments increase public good provision, but they can decrease group earnings net of the costs of punishments. In this paper, we show that using objective emotion regulation instructions instead of natural instructions decreased the use of punishments and caused a statistically insignificant increase in net earnings and emotional well-being. The punishment benefit accrued most clearly to our low aggression groups in that, although emotion regulation instructions prompted our high aggression groups to decrease punishment, the decrease was not statistically significant. Overall, it appears that objective emotion regulation instructions improve outcomes, but effects are sometimes small and perhaps noisy. The promise represented in these results suggests that more research into how various types of emotion regulation can affect behavior is needed.
Those in our study who receive the objective emotion regulation instructions see the message “please adopt a neutral, analytical and objective attitude in order to stay calm”, while those who see the natural instructions are told “please respond naturally with whatever thoughts and emotions occur to you spontaneously”. This type of emotion regulation is a very light touch. One can easily imagine displaying such messages in environments where peer punishment might be exacted on group members (e.g., when being asked to rate a colleague or teammate). In fact, the emotion regulation manipulation may have been too subtle as evidenced by the non-significant decrease in negative affect. A less subtle manipulation may have more powerfully reduced anger and, thus, produced fewer null effects.
Although the changes are not always statistically significant, both high and low aggression types use less punishment, have higher net earnings and report lower negative affect when receiving the objective emotion regulation instructions. This pattern indicates that emotion regulation might improve outcomes. The policy implication of our experiment might be that messages encouraging emotion regulation should be implemented alongside the availability of punishment.
Acknowledgments
We would like to thank David Garman for his help in the writing of this paper, as well as Michael Manzi, Eitan Scheinthal, Emily Santora and Berfu Negiz for their excellent research assistance. This research was part of Xinxin Lyu’s master’s thesis. This research was approved by the Tufts Social, Behavioral and Educational Research IRB (1307002). This project was supported by a contract with the U.S. Army Natick Soldier Research, Development and Engineering Center (W911QY-13-C-0012). Open access publishing fees were supported by the Tufts University Faculty Research Awards Committee. Permission was granted by the U.S. Army Natick Soldier RDEC to publish this material. The views expressed in this article are solely those of the authors and do not reflect the official policies or positions of the Department of the Army, the Department of Defense or any other department or agency of the U.S. government.
Author Contributions
All authors contributed significantly to this work. L.G. and H.U. conceived of the initial research design. X.L. managed data collection. X.L. and L.G. conducted the analyses and drafted the original manuscript. All three authors interpreted the results and wrote the final manuscript.
Conflicts of Interest
The authors declare no conflicts of interest.
Appendix A
Table A1.
Dependent variable: assigned punishment.
Table A1.
Dependent variable: assigned punishment.
| | Random Effects | Random Effects | Tobit | Tobit |
|---|
| | 1 | 2 | 3 | 4 |
|---|
| High Aggression | −0.01 | 0.09 | 0.17 | 0.48 |
| (0.18) | (0.19) | (0.40) | (0.41) |
| [0.25] | [0.27] | [1.03] | [1.07] |
| objective | −0.39 | −0.43 | −2.18 | −2.28 |
| (0.18) * | (0.18) * | (0.46) *** | (0.46) *** |
| [0.15] ** | [0.16] ** | [0.66] ** | [0.66] *** |
| High Aggression × Objective | 0.11 | 0.15 | 1.02 | 1.07 |
| (0.26) | (0.26) | (0.62)6 | (0.61) |
| [0.28] | [0.29] | [1.31] | [1.27] |
| Period | −0.04 | −0.04 | −0.27 | −0.24 |
| (0.01) *** | (0.01) *** | (0.05) *** | (0.05) *** |
| [0.01] ** | [0.01] ** | [0.07] *** | [0.07] *** |
| Group Public Cont. | | −0.05 | | −0.15 |
| | (0.01) *** | | (0.04) *** |
| | [0.02] ** | | [0.06] * |
| Constant | 0.82 | 1.44 | −1.37 | 0.59 |
| (0.14) *** | (0.19) *** | (0.42) ** | (0.60) |
| [0.16] *** | [0.30] *** | [0.56] * | [0.85] |
| Sigma Constant | | | 3.86 | 3.82 |
| | | (0.21) *** | (0.21) *** |
| | | [0.36] *** | [0.36] *** |
| N | 1320 | 1320 | 1320 | 1320 |
| Test of high Aggnatural = high Agg objective with unclustered SE |
| or | 0.13 | 0.14 | 0.01 | 0.00 |
| Test of high Agg natural = high Agg objective with clustered SE |
| or | 0.24 | 0.25 | 0.31 | 0.27 |
Table A2.
Dependent variable: welfare measures.
Table A2.
Dependent variable: welfare measures.
| | Net Earnings | Positive Affect | Negative Affect |
|---|
| | 1 | 2 | 3 |
|---|
| High Aggression | 1.33 | 0.50 | −0.22 |
| (0.81) | (0.27) | (0.23) |
| [1.66] | [0.36] | [0.37] |
| objective | 1.04 | −0.11 | −0.34 |
| (0.79) | (0.26) | (0.22) |
| [1.61] | [0.26] | [0.32] |
| High Aggression × Objective | 0.13 | 0.16 | 0.12 |
| (1.13) | (0.38) | (0.32) |
| [2.15] | [0.48] | [0.46] |
| Period | 0.26 | 0.00 | 0.05 |
| (0.03) *** | (0.02) | (0.02) * |
| [0.09] ** | [0.04] | [0.03] |
| Constant | 12.53 | 2.06 | 0.73 |
| (0.60) *** | (0.27) *** | (0.24) ** |
| [1.38] *** | [0.39] *** | [0.33] * |
| N | 1320 | 660 | 660 |
| Test of high Agg natural = high Agg objective with unclustered SE |
| or | 0.15 | 0.85 | 0.34 |
| Test of high Agg natural = high Agg objective with clustered SE |
| or | 0.41 | 0.90 | 0.51 |
Appendix A.1. Pre-Screen Survey
Respondents were asked to please rate each of the following items in terms of how characteristic they are, where a rating of one means extremely uncharacteristic of me and seven means extremely characteristic of me. Respondents could also select “don’t know” or “prefer not to say.” Higher scores denote higher aggression levels. Therefore, for statements like “I am an even-tempered person,” the scale is reversed for analysis.
I am an even-tempered person.
I am sometimes eaten up with jealousy.
There are people who pushed me so far that we came to blows.
I can think of no good reason for ever hitting a person.
I know that “friends” talk about me behind my back.
I wonder why sometimes I feel so bitter about things.
If somebody hits me, I hit back.
I flare up quickly but get over it quickly.
When people are especially nice, I wonder what they want.
I sometimes feel like a powder keg ready to explode.
When people annoy me, I may tell them what I think of them.
I can’t help getting into arguments when people disagree with me.
When frustrated, I let my irritation show.
Other people always seem to get the breaks.
I get into fights a little more than the average person.
I tell my friends openly when I disagree with them.
Sometimes I fly off the handle for no good reason.
I am suspicious of overly friendly strangers.
I often find myself disagreeing with people.
Some of my friends think I’m a hothead.
I have become so mad that I have broken things.
Given enough provocation, I may hit another person.
I have threatened people I know.
I have trouble controlling my temper.
Once in a while I can’t control the urge to strike another person.
I sometimes feel that people are laughing at me behind my back.
If I have to resort to violence to protect my rights, I will.
At times I feel I have gotten a raw deal out of life.
My friends say that I’m somewhat argumentative.
What is your gender?
male
female
prefer not to say
What is your age in years? (Enter 999 if you prefer not to say.)
Appendix A.2. Mood Ratings
In
Figure A1, we show the mood rating task that is done at the beginning and end of the experiment.
Figure A1.
Mood rating used at the beginning and the end of the experiment. Note: In this figure, we show the screen to rate eleven moods including: anxiety, loneliness, self-confidence, sadness, feeling of being rejected, happiness, feeling of being judged, anger, feeling of being loved, embarrassment, feeling of being active and alert. The rating is a seven-point scale, from “not at all” to “very much”.
Unfortunately, due to some technical issues, we are missing the end mood rating for four high aggression subjects who were in a session with the natural instructions. We compute the change in mood rating for each individual by subtracting the score at the start of the session from the score at the end of the session. Then, we take the average at the group level to account for group interactions throughout the experiment. We are left with 32 group level observations for the 11 moods we measured. For most moods, there is no statistically-significant difference as a function of whether there is emotion regulation for high or low aggressive groups. We find that emotion regulation reduces feeling anxious and rejected for low aggression types, while it reduces feeling active for high aggression types. This is most easily illustrated by omitting the low aggression group without regulation as shown in
Table A3 and omitting the high aggression group without regulation in
Table A4.
Table A3.
Change in mood over session, omitting the category low aggression, natural.
Table A3.
Change in mood over session, omitting the category low aggression, natural.
| | Anxious | Lonely | Self-confident | Sad | Rejected | Happy | Judged | Angry | Affectionate | Embarrassed | Active |
|---|
| | 1 | 2 | 3 | 4 | 5 | 6 | 7 | 8 | 9 | 10 | 11 |
|---|
| Objective | −0.63 | −0.23 | 0.29 | −0.54 | −0.70 ** | 0.39 | −0.03 | −0.18 | 0.39 | −0.44 | −0.08 |
| (0.41) | (0.27) | (0.31) | (0.37) | (0.24) | (0.44) | (0.39) | (0.45) | (0.32) | (0.25) | (0.35) |
| Constant | −0.09 | 0.06 | −0.13 | 0.09 | 0.53 ** | −0.72 * | 0.00 | 0.91 * | −0.72 ** | 0.19 | −0.06 |
| (0.30) | (0.20) | (0.23) | (0.27) | (0.17) | (0.32) | (0.28) | (0.33) | (0.24) | (0.18) | (0.25) |
| Adj R | 0.07 | −0.02 | −0.01 | 0.07 | 0.33 | −0.01 | −0.07 | −0.06 | 0.03 | 0.12 | −0.06 |
| N | 17. | 17 | 17 | 17 | 17 | 17 | 17 | 17 | 17 | 17 | 17 |
Table A4.
Change in mood over session, omitting the category high aggression, natural.
Table A4.
Change in mood over session, omitting the category high aggression, natural.
| | Anxious | Lonely | Self-confident | Sad | Rejected | Happy | Judged | Angry | Affectionate | Embarrassed | Active |
|---|
| | 1 | 2 | 3 | 4 | 5 | 6 | 7 | 8 | 9 | 10 | 11 |
|---|
| objective | 0.16 | −0.38 | −0.17 | 0.43 | 0.37 | −0.51 | 0.51 | 0.25 | 0.03 | 0.48 | −0.71 |
| | (0.25) | (0.21) | (0.38) | (0.42) | (0.44) | (0.48) | (0.50) | (0.55) | (0.38) | (0.32) | (0.33) |
| Constant | −0.75 ** | −0.25 | 0.11 | −0.68 * | −0.43 | 0.82 * | −0.82 * | 0.79 | 0.04 | −0.61 * | 0.71 * |
| | (0.19) | (0.15) | (0.28) | (0.30) | (0.32) | (0.35) | (0.36) | (0.40) | (0.28) | (0.24) | (0.24) |
| Adj R | −0.05 | 0.14 | −0.06 | 0.00 | −0.02 | 0.01 | 0.00 | −0.06 | −0.08 | 0.08 | 0.20 |
| N | 15 | 15 | 15 | 15 | 15 | 15 | 15 | 15 | 15 | 15 | 15 |
Table A5.
Correlation between Buss–Perry (BP) aggression score and 11 moods.
Table A5.
Correlation between Buss–Perry (BP) aggression score and 11 moods.
| | B-P Score | Anxious | Lonely | Self-confident | Sad | Rejected | Happy | Judged | Angry | Affectionate | Embarrassed | Active |
|---|
| B-P score | 1.00 | 0.14 | 0.19 | −0.10 | 0.19 | 0.17 | −0.27 | 0.26 | 0.11 | −0.12 | 0.16 | −0.06 |
| anxious | 0.14 | 1.00 | 0.48 | −0.33 | 0.40 | 0.41 | −0.26 | 0.37 | 0.39 | −0.17 | 0.44 | −0.16 |
| lonely | 0.19 | 0.48 | 1.00 | −0.29 | 0.65 | 0.67 | −0.35 | 0.29 | 0.48 | −0.13 | 0.50 | −0.18 |
| self-confident | −0.10 | −0.33 | −0.29 | 1.00 | −0.32 | −0.23 | 0.53 | −0.11 | −0.08 | 0.46 | −0.26 | 0.37 |
| sad | 0.19 | 0.40 | 0.65 | −0.32 | 1.00 | 0.69 | −0.32 | 0.22 | 0.36 | −0.07 | 0.51 | −0.33 |
| rejected | 0.17 | 0.41 | 0.67 | −0.23 | 0.69 | 1.00 | −0.39 | 0.27 | 0.56 | −0.05 | 0.58 | −0.13 |
| happy | −0.27 | −0.26 | −0.35 | 0.53 | −0.32 | −0.39 | 1.00 | −0.13 | −0.25 | 0.52 | −0.31 | 0.33 |
| judged | 0.26 | 0.37 | 0.29 | −0.11 | 0.22 | 0.27 | −0.13 | 1.00 | 0.29 | −0.15 | 0.35 | 0.06 |
| angry | 0.11 | 0.39 | 0.48 | −0.08 | 0.36 | 0.56 | −0.25 | 0.29 | 1.00 | −0.10 | 0.39 | 0.02 |
| affectionate | −0.12 | −0.17 | −0.13 | 0.46 | −0.07 | −0.05 | 0.52 | −0.15 | −0.10 | 1.00 | −0.06 | 0.29 |
| embarrassed | 0.16 | 0.44 | 0.50 | −0.26 | 0.51 | 0.58 | −0.31 | 0.35 | 0.39 | −0.06 | 1.00 | −0.06 |
| active | −0.06 | −0.16 | −0.18 | 0.37 | −0.33 | −0.13 | 0.33 | 0.06 | 0.02 | 0.29 | −0.06 | 1.00 |
Table A6.
Correlation between Buss–Perry (BP) aggression score and 11 moods for low aggression groups.
Table A6.
Correlation between Buss–Perry (BP) aggression score and 11 moods for low aggression groups.
| | B-P Score | Anxious | Lonely | Self-confident | Sad | Rejected | Happy | Judged | Angry | Affectionate | Embarrassed | Active |
|---|
| B-P score | 1.00 | −0.06 | 0.02 | 0.05 | −0.04 | −0.21 | −0.03 | −0.09 | −0.16 | 0.04 | −0.08 | −0.02 |
| anxious | −0.06 | 1.00 | 0.60 | −0.27 | 0.29 | 0.50 | −0.27 | 0.45 | 0.61 | −0.25 | 0.48 | −0.04 |
| lonely | 0.02 | 0.60 | 1.00 | −0.28 | 0.53 | 0.63 | −0.24 | 0.42 | 0.62 | −0.16 | 0.52 | −0.01 |
| self-confident | 0.05 | −0.27 | −0.28 | 1.00 | −0.36 | −0.12 | 0.56 | −0.30 | −0.11 | 0.54 | −0.22 | 0.32 |
| sad | −0.04 | 0.29 | 0.53 | −0.36 | 1.00 | 0.49 | −0.25 | 0.26 | 0.26 | −0.27 | 0.38 | −0.33 |
| rejected | −0.21 | 0.50 | 0.63 | −0.12 | 0.49 | 1.00 | -0.26 | 0.38 | 0.75 | −0.14 | 0.45 | 0.13 |
| happy | −0.03 | −0.27 | −0.24 | 0.56 | −0.25 | −0.26 | 1.00 | −0.37 | −0.25 | 0.59 | −0.17 | 0.25 |
| judged | −0.09 | 0.45 | 0.42 | −0.30 | 0.26 | 0.38 | −0.37 | 1.00 | 0.39 | −0.31 | 0.29 | 0.10 |
| angry | −0.16 | 0.61 | 0.62 | −0.11 | 0.26 | 0.75 | −0.25 | 0.39 | 1.00 | −0.12 | 0.46 | 0.09 |
| affectionate | 0.04 | −0.25 | −0.16 | 0.54 | −0.27 | −0.14 | 0.59 | −0.31 | −0.12 | 1.00 | 0.01 | 0.30 |
| embarrassed | −0.08 | 0.48 | 0.52 | −0.22 | 0.38 | 0.45 | −0.17 | 0.29 | 0.46 | 0.01 | 1.00 | 0.03 |
| active | −0.02 | −0.04 | −0.01 | 0.32 | −0.33 | 0.13 | 0.25 | 0.10 | 0.09 | 0.30 | 0.03 | 1.00 |
Table A7.
Correlation between Buss–Perry (BP) aggression score and 11 moods for high aggression groups.
Table A7.
Correlation between Buss–Perry (BP) aggression score and 11 moods for high aggression groups.
| | B-P Score | Anxious | Lonely | Self-confident | Sad | Rejected | Happy | Judged | Angry | Affectionate | Embarrassed | Active |
|---|
| B-P score | 1.00 | −0.01 | −0.11 | 0.09 | −0.03 | −0.09 | −0.03 | 0.29 | 0.17 | −0.09 | 0.02 | 0.28 |
| anxious | −0.01 | 1.00 | 0.28 | −0.24 | 0.36 | 0.23 | −0.19 | 0.30 | 0.15 | −0.18 | 0.34 | −0.19 |
| lonely | −0.11 | 0.28 | 1.00 | −0.15 | 0.68 | 0.65 | −0.29 | 0.12 | 0.36 | −0.08 | 0.42 | −0.20 |
| self-confident | 0.09 | −0.24 | −0.15 | 1.00 | −0.12 | −0.14 | 0.49 | 0.05 | 0.13 | 0.49 | −0.15 | 0.44 |
| sad | −0.03 | 0.36 | 0.68 | −0.12 | 1.00 | 0.75 | −0.31 | 0.06 | 0.35 | 0.01 | 0.53 | −0.31 |
| rejected | −0.09 | 0.23 | 0.65 | −0.14 | 0.75 | 1.00 | −0.41 | 0.14 | 0.39 | 0.00 | 0.58 | −0.22 |
| happy | −0.03 | −0.19 | −0.29 | 0.49 | −0.31 | −0.41 | 1.00 | 0.09 | −0.28 | 0.46 | −0.29 | 0.43 |
| judged | 0.29 | 0.30 | 0.12 | 0.05 | 0.06 | 0.14 | 0.09 | 1.00 | 0.13 | −0.07 | 0.46 | 0.18 |
| angry | 0.17 | 0.15 | 0.36 | 0.13 | 0.35 | 0.39 | −0.28 | 0.13 | 1.00 | −0.08 | 0.28 | 0.10 |
| affectionate | −0.09 | −0.18 | −0.08 | 0.49 | 0.01 | 0.00 | 0.46 | −0.07 | −0.08 | 1.00 | −0.04 | 0.35 |
| embarrassed | 0.02 | 0.34 | 0.42 | −0.15 | 0.53 | 0.58 | −0.29 | 0.46 | 0.28 | −0.04 | 1.00 | −0.09 |
| active | 0.28 | −0.19 | −0.20 | 0.44 | −0.31 | −0.22 | 0.43 | 0.18 | 0.10 | 0.35 | −0.09 | 1.00 |
Appendix A.3. Mixed and Homogeneous Groups
Our results in the main text report on groups with all of the same aggression types. We also had a total of 36 subjects who participated in mixed aggression level groups. Below, we replicate our analysis at an individual level including those 36 subjects. We also report the summary statistics for the 36 additional subjects by whether they were low or high aggression and whether they received emotion regulation.
Table A8.
Buss–Perry aggression score by aggression type and regulation condition.
Table A8.
Buss–Perry aggression score by aggression type and regulation condition.
| | Mean | SD | Min | Max | Subjects |
|---|
| High aggression, natural | 3.19 | 0.50 | 2.59 | 4.55 | 13 |
| High aggression, objective | 3.08 | 0.32 | 2.59 | 3.50 | 11 |
| Low aggression, natural | 2.35 | 0.13 | 2.21 | 2.55 | 7 |
| Low aggression, objective | 1.98 | 0.38 | 1.52 | 2.43 | 5 |
Table A9.
Summary statistics by aggression type and emotion regulation.
Table A9.
Summary statistics by aggression type and emotion regulation.
| Contribution | Punishment Assigned | Net Earnings | Positive Affect | Negative Affect |
|---|
| High aggression, natural | 3.72 | 0.35 | 14.96 | 2.22 | 1.20 |
| High aggression, objective | 3.85 | 1.54 | 11.71 | 2.18 | 1.24 |
| Low aggression, natural | 4.14 | 0.70 | 15.91 | 2.23 | 0.97 |
| Low aggression, objective | 3.76 | 0.82 | 11.98 | 1.56 | 1.04 |
| N | 360 | 360 | 360 | 180 | 180 |
| Min | 0 | 0 | −22.5 | 0 | 0 |
| Max | 5 | 21 | 22.5 | 4 | 4 |
Table A10.
Dependent variable: assigned punishment (parallel to
Table A1, but with both homogeneous and mixed groups).
Table A10.
Dependent variable: assigned punishment (parallel to Table A1, but with both homogeneous and mixed groups).
| | Random Effects | Random Effects | Tobit | Tobit |
|---|
| | 1 | 2 | 3 | 4 |
|---|
| High Aggression | −0.09 | −0.02 | −0.15 | 0.09 |
| (0.29) | (0.29) | (0.49) | (0.49) |
| [0.21] | [0.23] | [1.09] | [1.11] |
| Objective | −0.33 | −0.40 | −1.95 | −2.11 |
| (0.29) | (0.29) | (0.54) *** | (0.54) *** |
| [0.16] * | [0.18] * | [0.89] * | [0.90] * |
| High Aggression × Objective | 0.44 | 0.52 | 1.52 | 1.70 |
| (0.40) | (0.41) | (0.72) * | (0.73) * |
| [0.41] | [0.43] | [1.71] | [1.73] |
| Period | −0.02 | −0.01 | −0.25 | −0.22 |
| (0.01) * | (0.01) | (0.06) *** | (0.06) *** |
| [0.02] | [0.02] | [0.07] *** | [0.07] ** |
| Group Public Cont. | | −0.06 | | −0.18 |
| | (0.01) *** | | (0.04) *** |
| | [0.02] ** | | [0.07] * |
| Constant | 0.72 | 1.51 | −2.76 | −0.42 |
| (0.22) *** | (0.27) *** | (0.52) *** | (0.74) |
| [0.17] *** | [0.33] *** | [1.27] * | [1.39] |
| Sigma Constant | | | 5.24 | 5.21 |
| | | (0.24) *** | (0.24) *** |
| | | [1.14] *** | [1.15] *** |
| N | 1680 | 1680 | 1680 | 1680 |
| Test of high Agg natural = high Agg objective with unclustered SE |
| or | 0.71 | 0.65 | 0.38 | 0.40 |
| Test of high Agg natural = high Agg objective with clustered SE |
| or | 0.79 | 0.76 | 0.76 | 0.76 |
Table A11.
Dependent variable: welfare measures (parallel to
Table A2, but with both homogeneous and mixed groups).
Table A11.
Dependent variable: welfare measures (parallel to Table A2, but with both homogeneous and mixed groups).
| | Net Earnings | Positive Affect | Negative Affect |
|---|
| | 1 | 2 | 3 |
|---|
| High Aggression | 0.88 | 0.37 | −0.11 |
| (0.88) | (0.24) | (0.21) |
| [1.34] | [0.31] | [0.31] |
| Objective | 0.32 | −0.19 | −0.28 |
| (0.90) | (0.24) | (0.22) |
| [1.45] | [0.23] | [0.27] |
| High Aggression × Objective | −0.27 | 0.23 | 0.12 |
| (1.24) | (0.34) | (0.30) |
| [1.95] | [0.41] | [0.41] |
| Period | 0.18 | 0.03 | 0.02 |
| (0.03) *** | (0.02) | (0.02) |
| [0.09] * | [0.04] | [0.03] |
| Constant | 13.31 | 1.89 | 0.97 |
| (0.66) *** | (0.25) *** | (0.22) *** |
| [1.23] *** | [0.38] *** | [0.30] ** |
| N | 1680 | 840 | 840 |
| Test of high Agg natural = high Agg objective with unclustered SE |
| or | 0.95 | 0.86 | 0.43 |
| Test of high Agg natural = high Agg objective with clustered SE |
| or | 0.97 | 0.91 | 0.63 |
Appendix A.4. Periods 1–5 vs. 6–10
Table A12.
Dependent variable: public contribution.
Table A12.
Dependent variable: public contribution.
| | Periods 1 to 10 | Periods 1 to 5 | Periods 6 to 10 |
|---|
| High Aggression | 0.52 | 0.40 | 0.64 |
| (0.31) | (0.32) | (0.34) |
| [0.48] | [0.46] | [0.53] |
| Objective | −0.21 | −0.03 | −0.38 |
| (0.30) | (0.31) | (0.33) |
| [0.56] | [0.51] | [0.62] |
| High Aggression × Objective | 0.23 | 0.13 | 0.33 |
| (0.43) | (0.44) | (0.48) |
| [0.69] | [0.63] | [0.79] |
| Period | 0.04 | 0.07 | −0.08 |
| (0.01) *** | (0.03) * | (0.02) *** |
| [0.02] | [0.04] | [0.03] ** |
| Constant | 3.33 | 3.18 | 4.26 |
| (0.23) *** | (0.24) *** | (0.29) *** |
| [0.41] *** | [0.39] *** | [0.42] *** |
| N | 1320 | 660 | 660 |
| Test of high Agg natural = high Agg objective with unclustered SE |
| or | 0.96 | 0.91 | 0.87 |
| Test of high Agg natural = high Agg objective with clustered SE |
| or | 0.94 | 0.79 | 0.75 |
Table A13.
Dependent variable: assigned punishment; parallel to
Table A1, but for Periods 1 to 5 only.
Table A13.
Dependent variable: assigned punishment; parallel to Table A1, but for Periods 1 to 5 only.
| | Random Effects | Random Effects | Tobit | Tobit |
|---|
| | 1 | 2 | 3 | 4 |
|---|
| High Aggression | 0.13 | 0.21 | 0.63 | 0.90 |
| (0.25) | (0.25) | (0.55) | (0.55) |
| [0.34] | [0.35] | [1.01] | [1.03] |
| Objective | −0.36 | −0.36 | −1.72 | −1.71 |
| (0.24) | (0.24) | (0.60) ** | (0.59) ** |
| [0.25] | [0.26] | [0.94] | [0.96] |
| High Aggression × Objective | −0.04 | −0.01 | 0.44 | 0.42 |
| (0.34) | (0.34) | (0.82) | (0.81) |
| [0.38] | [0.38] | [1.40] | [1.35] |
| Period | −0.01 | 0.00 | −0.16 | −0.11 |
| (0.03) | (0.03) | (0.14) | (0.14) |
| [0.04] | [0.04] | [0.15] | [0.16] |
| Group Public Cont. | | −0.05 | | −0.16 |
| | (0.02) ** | | (0.05) ** |
| | [0.02] * | | [0.07] * |
| Constant | 0.71 | 1.33 | −1.98 | 0.01 |
| (0.20) *** | (0.28) *** | (0.62) ** | (0.85) |
| [0.21] *** | [0.33] *** | [0.75] ** | [0.98] |
| Sigma Constant | | | 3.93 | 3.89 |
| | | (0.26) *** | (0.26) *** |
| | | [0.48] *** | [0.48] *** |
| N | 660 | 660 | 660 | 660 |
| Test of high Agg natural = high Agg objective with unclustered SE |
| or | 0.11 | 0.13 | 0.02 | 0.02 |
| Test of high Agg natural = high Agg objective with clustered SE |
| or | 0.17 | 0.17 | 0.23 | 0.19 |
Table A14.
Dependent variable: Assigned punishment; parallel to in-text
Table A1, but for Periods 6 to 10.
Table A14.
Dependent variable: Assigned punishment; parallel to in-text Table A1, but for Periods 6 to 10.
| | Random Effects | Random Effects | Tobit | Tobit |
|---|
| | 1 | 2 | 3 | 4 |
|---|
| High Aggression | −0.14 | −0.09 | −0.39 | −0.01 |
| (0.16) | (0.16) | (0.57) | (0.59) |
| [0.23] | [0.24] | [1.25] | [1.28] |
| Objective | −0.42 | −0.45 | −2.74 | −3.02 |
| (0.16) ** | (0.16) ** | (0.70) *** | (0.72) *** |
| [0.12] *** | [0.12] *** | [0.74] *** | [0.70] *** |
| High Aggression × Objective | 0.25 | 0.28 | 1.76 | 1.94 |
| (0.22) | (0.23) | (0.92) | (0.93) * |
| [0.25] | [0.25] | [1.56] | [1.54] |
| Period | −0.00 | −0.01 | −0.14 | −0.18 |
| (0.02) | (0.02) | (0.16) | (0.16) |
| [0.03] | [0.03] | [0.19] | [0.19] |
| Group Public Cont. | | −0.02 | | −0.14 |
| | (0.01) * | | (0.05) ** |
| | [0.01] * | | [0.06] ** |
| Constant | 0.51 | 0.90 | −1.93 | 0.47 |
| (0.18) ** | (0.25) *** | (1.34) | (1.55) |
| [0.23] * | [0.29] ** | [1.63] | [1.78] |
| Sigma Constant | | | 3.68 | 3.65 |
| | | (0.34) *** | (0.33) *** |
| | | [0.28] *** | [0.29] *** |
| N | 660 | 660 | 660 | 660 |
| Test of high Agg natural = high Agg objective with unclustered SE |
| or | 0.31 | 0.30 | 0.12 | 0.09 |
| Test of high Agg natural = high Agg objective with clustered SE |
| or | 0.45 | 0.45 | 0.48 | 0.44 |
Table A15.
Dependent variable: monetary welfare measures.
Table A15.
Dependent variable: monetary welfare measures.
| | All Periods | Periods 1 to 5 | Periods 6 to 10 |
|---|
| High Aggression | 1.33 | 0.48 | 2.18 |
| (0.81) | (0.90) | (0.88) * |
| [1.66] | [1.90] | [1.72] |
| Objective | 1.04 | 1.37 | 0.71 |
| (0.79) | (0.87) | (0.85) |
| [1.61] | [1.73] | [1.74] |
| High Aggression × Objective | 0.13 | 0.46 | −0.20 |
| (1.13) | (1.25) | (1.22) |
| [2.15] | [2.37] | [2.31] |
| Period | 0.26 | 0.22 | −0.18 |
| (0.03) *** | (0.10) * | (0.06) ** |
| [0.09] ** | [0.20] | [0.14] |
| Constant | 12.53 | 12.61 | 16.09 |
| (0.60) *** | (0.70) *** | (0.80) *** |
| [1.38] *** | [1.54] *** | [1.44] *** |
| N | 1320 | 660 | 660 |
| Test of high Agg natural = high Agg objective with unclustered SE |
| or | 0.15 | 0.04 | 0.56 |
| Test of high Agg natural = high Agg objective with clustered SE |
| or | 0.41 | 0.26 | 0.74 |
Figure A2.
Histogram of aggression scores. Note: In this figure, we show the proportion of subjects in our study who had each Buss–Perry aggression score. This includes all 168 subjects who were in both our homogeneous and mixed group sessions.
Figure A2.
Histogram of aggression scores. Note: In this figure, we show the proportion of subjects in our study who had each Buss–Perry aggression score. This includes all 168 subjects who were in both our homogeneous and mixed group sessions.
3.The Buss–Perry questionnaire measures an individual’s aggression on four dimensions, namely physical aggression, verbal aggression, anger and hostility. The version of the Buss–Perry questionnaire we used differs from the original in a few ways. First, subjects rated each item on a 1 to 7 scale, rather than the original 1 to 5 scale (see the version posted on Professor Craig A. Anderson’s website [34]). Second, we provided “prefer not to say” and “don’t know” response options. Third, Buss and Perry calculated a total score as the sum across 29 items. We elected instead to create sub-scores for each of the four dimensions (since a different number of questions was in each dimension) and then average these four sub-scores. Thus, total scores ranged from 1 to 7; the higher the score, the higher the aggression level. Last, Buss and Perry did not report how they handled missing items. What we did is assign null values to items for which people responded with “prefer not say” or “don’t know”. Then, for each dimension, we calculated sub-scores only for people with fewer than 3 null answers. A total score was only calculated for participants with valid sub-scores for all four dimensions; we excluded one respondent based on this criterion. 4.From October 2015 to 21 January 2016 (the last date we recruited eligible participants), we collected 264 additional survey responses.
5.Those who actually participated in our experiment were not different on observable variables from those who did not participate. They were balanced on gender (participated: 52% female; others: 56% ), age (participated: 21.6 years old; others: 22.5 ) and average total Buss–Perry score (participated: 2.68; others: 2.79 ). We have more demographic details for those who participated. The 132 subjects who we report on in the main text came from 38 majors. The two most represented majors were Economics (16%) and International Relations (14%). Over 95% were undergraduate students. Seventy percent were U.S. nationals. See Appendix Figure A2 for the full distribution of Buss–Perry scores for those who participated in our experiment. The average time that elapsed between taking the pre-screen survey and participating in the study was 145 days, so we believe it is unlikely that the pre-screen survey had a priming effect on subjects’ actions. Even if the pre-screen survey acted as a prime, there is no reason to believe it did so differentially across treatments. 6.Each session had both high and low aggression types, so that sessions only varied by whether objective or natural instructions were used.
7.However, one can also imagine that a high aggression type in a mixed group might react more to emotion regulation than a low aggression type in that same group. Therefore, we added an additional 36 subjects in mixed groups (20 without regulation, 16 with regulation) as a robustness check. If we replicate our analysis at the individual level while including these subjects in mixed groups, the statistically-significant results are quite similar (see Appendix A.3). 8.The 11 moods include: anxiety, loneliness, self-confidence, sadness, feeling of being rejected, happiness, feeling of being judged, anger, feeling of being loved, embarrassment, feeling of being active and alert. Subjects rated their level of each mode on a seven-point scale. The full instructions and screenshots are available at Laura K. Gee’s website. In Appendix Table A5, Table A6 and Table A7, we show correlations between the mood ratings taken at the beginning of the experiment and the Buss–Perry aggression score. All correlations are below 0.3. 9.Paying for multiple rounds could cause distortions (e.g., a subject may become more risk seeking after losing money in early rounds). Paying for a single round should eliminate such distortions according to [37]. 10.We used neutral language in our experiment. We called the public good the “blue investment” and the private good the “red investment.” This type of neutral language has been used by numerous previous studies [11,12,39,40,41]. There is some research that indicates certain colors are associated with certain emotions [42], so we kept the colors of the investments the same across all treatments. Because we make comparisons across treatments, we have no reason to believe our color choices should affect these cross-treatment comparisons. 11.We chose a show-up fee of $5, an endowment of five tokens, a private return of $1.50 and a public good return of $1.00 to obtain average payments of around $20 for an hour-long session. We chose 10 periods because that kept the experiment at about 1 h. Average earnings were $19.60 (inclusive of the $5 show-up fee).
12.In the experimental instructions, punishment points were called deduction points.
13.We chose a constant fine to fee ratio as recommended by [43]. We chose the 3:1 ratio because this has been shown to be effective in increasing public good contributions [8]. 14.Two-way t-tests comparing these variables for the 64 subjects with natural instructions to the 68 subjects with objective emotion regulation instructions are not significant at the 10% level. Results available from the authors by request.
15.The finding that high types contribute more than low types is statistically significant at the 10% level using a random effects regression to control for subjects playing multiple periods in fixed groups with standard errors clustered at the group level (33 clusters).
17.The regression results are in Appendix Table A1 along with the results from alternative specifications that do not control for group contribution, using a Tobit model, and these same models without clustered standard errors. 18.Here and elsewhere below, we calculated Cohen’s d for key comparisons as the standardized mean difference between the objective and natural conditions averaged across periods within each aggression type (absolute value). We also report the 95% confidence interval (CI) for each effect size, calculated in SPSS according to Wuensch (2012).
19.If we do not cluster standard errors and we use a Tobit model, then there is a statistically-significant decline in punishment points for high aggression types who read the objective instructions (Appendix Table A1). 20.Following [16], we find the following levels of antisocial punishment by treatment.
| Treatment | Pun Pts to | Antisocial Pts | Percent Antisocial |
| High aggression, natural | 185 | 63 | 34.05% |
| High aggression, objective | 96 | 26 | 27.08% |
| Low aggression, natural | 187 | 37 | 19.79% |
| Low aggression, objective | 71 | 14 | 19.72% |
21.See Appendix A.4 for analysis for Periods 1 to 5 and 6 to 10 separately. 22.We use a random effects model to account for each subject playing 10 periods, and we use standard errors clustered at the group level to account for groups interacting over 10 periods. The regression results are in Appendix Table A2 along with the results without clustered standard errors. 23.At the time that subjects report their positive/negative affect, they know many things about the previous period. Specifically, they know their own and others’ contributions, punishments received and net earnings. If we control for these, either as group totals or broken into own and others’ actions, the treatment dummy variables remain statistically insignificant. However, if we only control for total group contributions, then we find that, for low aggression types, the addition of the objective emotion regulation instructions results in a statistically-significant decrease in negative affect. Results available from the authors by request.
References
- Dreber, A.; Rand, D.G.; Fudenberg, D.; Nowak, M.A. Winners don’t punish. Nature 2008, 452, 348–351. [Google Scholar] [CrossRef] [PubMed] [Green Version]
- Gächter, S.; Fehr, E. Collective action as a social exchange. J. Econ. Behav. Organ. 1999, 39, 341–369. [Google Scholar] [CrossRef]
- Fehr, E.; Gachter, S. Cooperation and Punishment in Public Goods Experiments. Am. Econ. Rev. 2000, 90, 980–994. [Google Scholar] [CrossRef]
- Gächter, S.; Renner, E.; Sefton, M. The long-run benefits of punishment. Science 2008, 322, 1510. [Google Scholar] [CrossRef] [PubMed]
- Egas, M.; Riedl, A. The economics of altruistic punishment and the maintenance of cooperation. Proc. R. Soc. Lond. B Biol. Sci. 2008, 275, 871–878. [Google Scholar] [CrossRef] [PubMed]
- Masclet, D.; Noussair, C.; Tucker, S.; Villeval, M.C. Monetary and nonmonetary punishment in the voluntary contributions mechanism. Am. Econ. Rev. 2003, 93, 366–380. [Google Scholar] [CrossRef]
- Denant-Boemont, L.; Masclet, D.; Noussair, C.N. Punishment, counterpunishment and sanction enforcement in a social dilemma experiment. Econ. Theory 2007, 33, 145–167. [Google Scholar] [CrossRef]
- Nikiforakis, N.; Normann, H.T. A comparative statics analysis of punishment in public-good experiments. Exp. Econ. 2008, 11, 358–369. [Google Scholar] [CrossRef]
- Yamagishi, T. The provision of a sanctioning system as a public good. J. Personal. Soc. Psychol. 1986, 51, 110–116. [Google Scholar] [CrossRef]
- Decker, T.; Stiehler, A.; Strobel, M. A comparison of punishment rules in repeated public good games an experimental study. J. Confl. Resolut. 2003, 47, 751–772. [Google Scholar] [CrossRef]
- Andreoni, J.; Gee, L.K. Gun for hire: Delegated enforcement and peer punishment in public goods provision. J. Public Econ. 2012, 96, 1036–1046. [Google Scholar] [CrossRef]
- Andreoni, J.; Gee, L.K. Gunning for efficiency with third party enforcement in threshold public goods. Exp. Econ. 2015, 18, 154–171. [Google Scholar] [CrossRef]
- Nikiforakis, N. Punishment and counter-punishment in public good games: Can we really govern ourselves? J. Public Econ. 2008, 92, 91–112. [Google Scholar] [CrossRef]
- Casari, M.; Luini, L. Peer punishment in teams: Expressive or instrumental choice? Exp. Econ. 2012, 15, 241–259. [Google Scholar] [CrossRef]
- Hopfensitz, A.; Reuben, E. The importance of emotions for the effectiveness of social punishment. Econ. J. 2009, 119, 1534–1559. [Google Scholar] [CrossRef]
- Faillo, M.; Grieco, D.; Zarri, L. Legitimate punishment, feedback, and the enforcement of cooperation. Games Econ. Behav. 2013, 77, 271–283. [Google Scholar] [CrossRef]
- Duersch, P.; Muller, J. Taking punishment into your own hands: An experiment. J. Econ. Psychol. 2015, 46, 1–11. [Google Scholar] [CrossRef]
- Joffily, M.; Masclet, D.; Noussair, C.N.; Villeval, M.C. Emotions, sanctions, and cooperation. South. Econ. J. 2014, 80, 1002–1027. [Google Scholar] [CrossRef]
- Dickinson, D.L.; Masclet, D. Emotion venting and punishment in public good experiments. J. Public Econ. 2015, 122, 55–67. [Google Scholar] [CrossRef]
- Webb, T.L.; Miles, E.; Sheeran, P. Dealing with feeling: A meta-analysis of the effectiveness of strategies derived from the process model of emotion regulation. Psychol. Bull. 2012, 138, 775–808. [Google Scholar] [CrossRef] [PubMed]
- Pillutla, M.M.; Murnighan, J.K. Unfairness, anger, and spite: Emotional rejections of ultimatum offers. Organ. Behav. Hum. Decis. Process. 1996, 68, 208–224. [Google Scholar] [CrossRef]
- Ketelaar, T.; Au, W. The effects of guilt feelings on the behavior of uncooperative individuals in repeated social bargaining games: An affectas-information interpretation of the role of emotion in social interaction. In Evolutionary Psychology, Public Policy and Personal Decisions; Lawrence Erlbaum: Hillsdale, NJ, USA, 2003; pp. 145–168. [Google Scholar]
- Capra, C.M. Mood-driven behavior in strategic interactions. Am. Econ. Rev. 2004, 94, 367–372. [Google Scholar] [CrossRef]
- Dunn, J.R.; Schweitzer, M.E. Feeling and believing: The influence of emotion on trust. J. Personal. Soc. Psychol. 2005, 88, 736–748. [Google Scholar] [CrossRef] [PubMed]
- Kausel, E.E.; Connolly, T. Do people have accurate beliefs about the behavioral consequences of incidental emotions? Evidence from trust games. J. Econ. Psychol. 2014, 42, 96–111. [Google Scholar] [CrossRef]
- Schniter, E.; Sheremeta, R.M. Predictable and predictive emotions: Explaining cheap signals and trust re-extension. Front. Behav. Neurosci. 2014, 8, 401. [Google Scholar] [CrossRef] [PubMed]
- Schniter, E.; Sheremeta, R.M.; Shields, T.W. Conflicted emotions following trust-based interaction. J. Econ. Psychol. 2015, 51, 48–65. [Google Scholar] [CrossRef]
- Ben-Shakhar, G.; Bornstein, G.; Hopfensitz, A.; van Winden, F. Reciprocity and emotions in bargaining using physiological and self-report measures. J. Econ. Psychol. 2007, 28, 314–323. [Google Scholar] [CrossRef]
- Drouvelis, M.; Grosskopf, B. The effects of induced emotions on pro-social behaviour. J. Public Econ. 2016, 134, 1–8. [Google Scholar] [CrossRef]
- Ray, R.D.; Ochsner, K.N.; Cooper, J.C.; Robertson, E.R.; Gabrieli, J.D.; Gross, J.J. Individual differences in trait rumination and the neural systems supporting cognitive reappraisal. Cogn. Affect. Behav. Neurosci. 2005, 5, 156–168. [Google Scholar] [CrossRef] [PubMed]
- Buss, A.H.; Perry, M. The aggression questionnaire. J. Personal. Soc. Psychol. 1992, 63, 452–459. [Google Scholar] [CrossRef]
- Zhang, Q.; Zhang, D.; Wang, L. Is aggressive trait responsible for violence? Priming effects of aggressive words and violent movies. Psychology 2013, 4, 96–100. [Google Scholar] [CrossRef]
- Carnagey, N.L.; Anderson, C.A.; Bushman, B.J. The effect of video game violence on physiological desensitization to real-life violence. J. Exp. Soc. Psychol. 2007, 43, 489–496. [Google Scholar] [CrossRef]
- Buss-Perry Scale. Available online: http://public.psych.iastate.edu/caa/Scales/BussPerry.pdf (accessed on 9 January 2017).
- McPherson, M.; Smith-Lovin, L.; Cook, J.M. Birds of a feather: Homophily in social networks. Annu. Rev. Sociol. 2001, 27, 415–444. [Google Scholar] [CrossRef]
- Fischbacher, U. z-Tree: Zurich toolbox for ready-made economic experiments. Exp. Econ. 2007, 10, 171–178. [Google Scholar] [CrossRef]
- Azrieli, Y.; Chambers, C.P.; Healy, P.J. Incentives in Experiments: A Theoretical Analysis. 2016. Available online: http://www.econ.ohio-state.edu/pdf/healy/wp16-03.pdf (accessed on 9 January 2017).
- Larsen, J.T.; Norris, C.J.; McGraw, A.P.; Hawkley, L.C.; Cacioppo, J.T. The evaluative space grid: A single-item measure of positivity and negativity. Cogn. Emot. 2009, 23, 453–480. [Google Scholar] [CrossRef]
- Andreoni, J.; Petrie, R. Public goods experiments without confidentiality: A glimpse into fund-raising. J. Public Econ. 2004, 88, 1605–1623. [Google Scholar] [CrossRef]
- Kench, B.T.; Niman, N.B. Giving, Taking, and Punishment in a Public Goods Environment. J. Appl. Bus. Econ. 2014, 16, 40–56. [Google Scholar]
- Delaney, J.; Jacobson, S. Payments or persuasion: Common pool resource management with price and non-price measures. Environ. Resour. Econ. 2016, 65, 747–772. [Google Scholar] [CrossRef]
- Kaya, N.; Epps, H.H. Relationship between color and emotion: A study of college students. Coll. Stud. J. 2004, 38, 396–405. [Google Scholar]
- Casari, M. On the design of peer punishment experiments. Exp. Econ. 2005, 8, 107–115. [Google Scholar] [CrossRef]
- Herrmann, B.; Thöni, C.; Gächter, S. Antisocial punishment across societies. Science 2008, 319, 1362–1367. [Google Scholar] [CrossRef] [PubMed]
- Gächter, S.; Herrmann, B.; Thöni, C. Culture and cooperation. Philos. Trans. R. Soc. B Biol. Sci. 2010, 365, 2651–2661. [Google Scholar] [CrossRef] [PubMed]
- Gächter, S.; Herrmann, B. The limits of self-governance when cooperators get punished: Experimental evidence from urban and rural Russia. Eur. Econ. Rev. 2011, 55, 193–210. [Google Scholar] [CrossRef]
© 2017 by the authors; licensee MDPI, Basel, Switzerland. This article is an open access article distributed under the terms and conditions of the Creative Commons Attribution (CC BY) license (http://creativecommons.org/licenses/by/4.0/).


