
The Current Status and Future Prospects of KAGRA, the Large-Scale Cryogenic Gravitational Wave Telescope Built in the Kamioka Underground

 , , ,
, , , 
Abstract
:1. Introduction
2. The Design of KAGRA
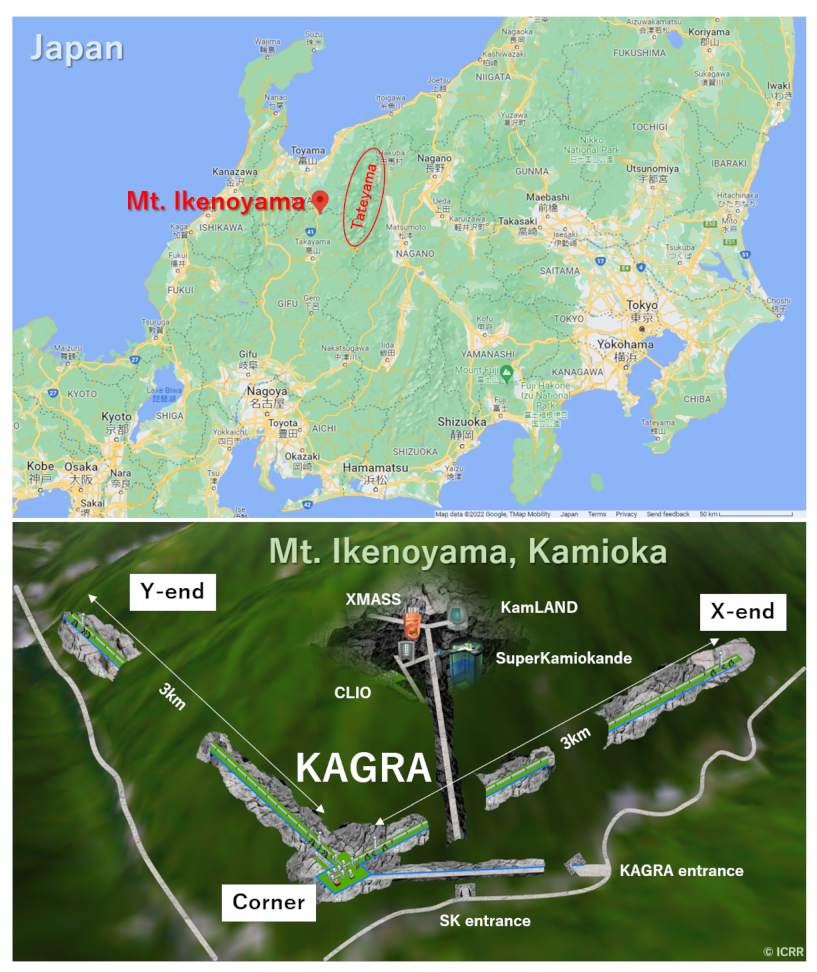
2.1. Location
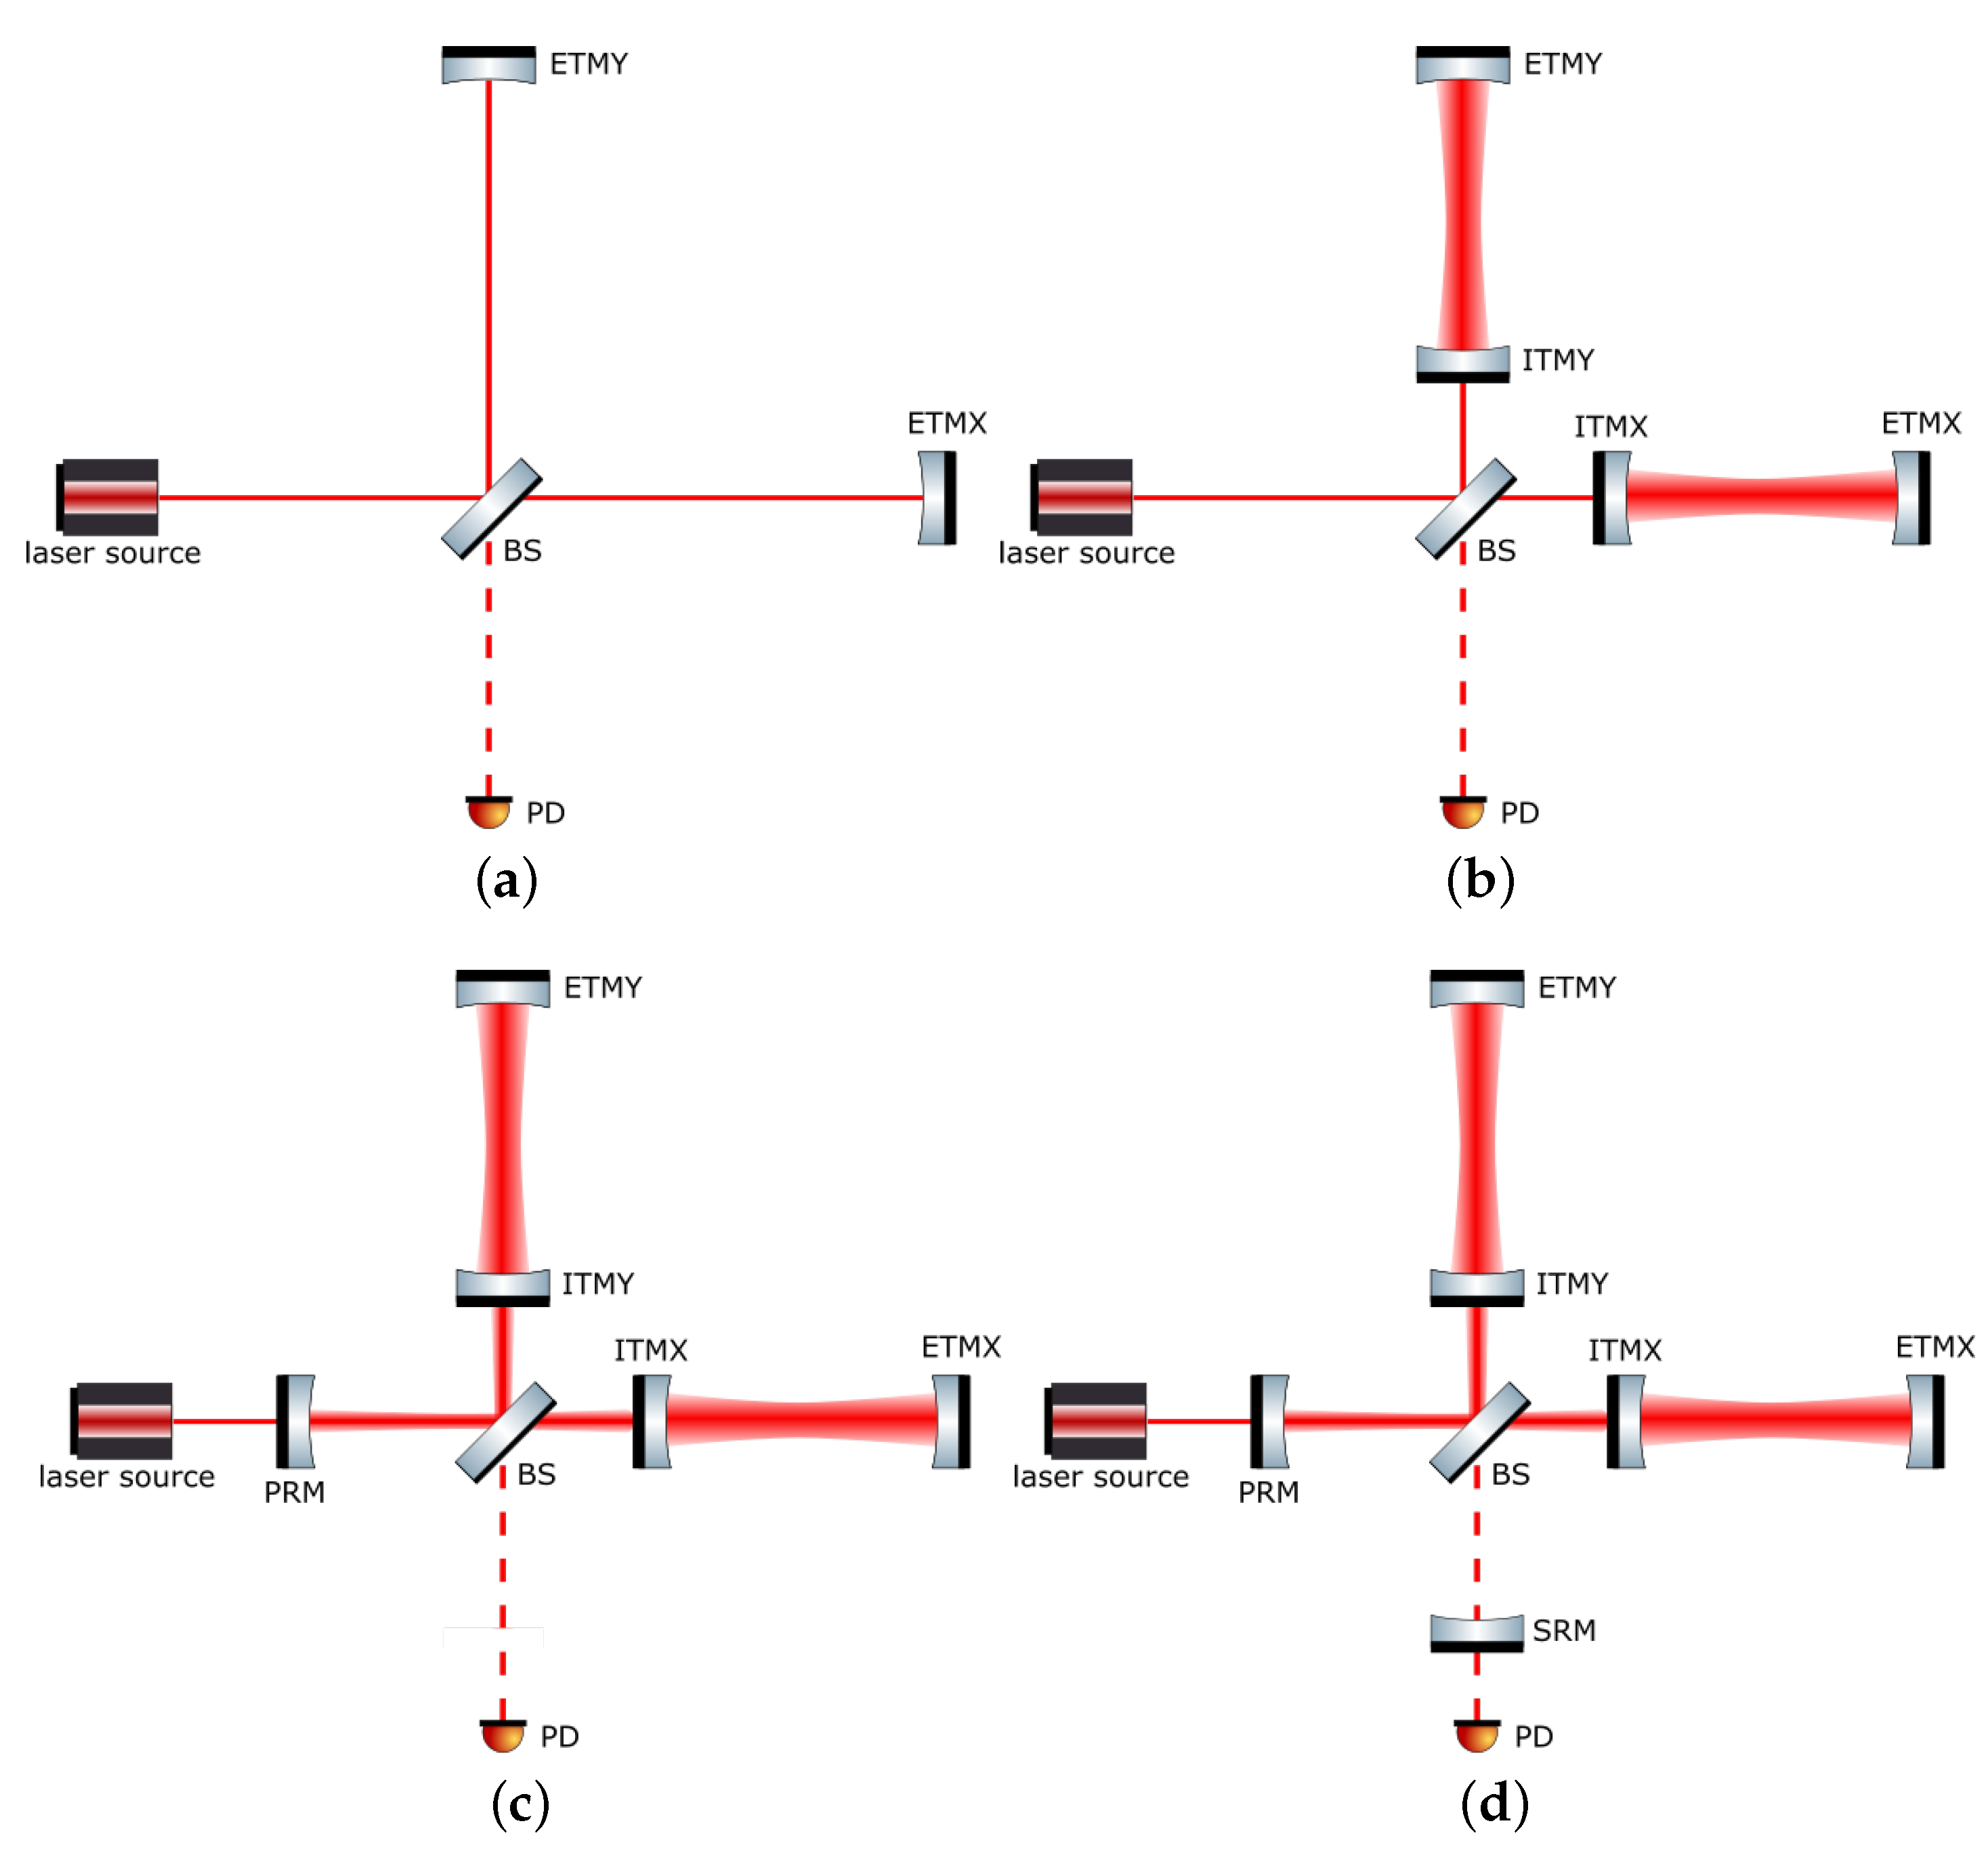
2.2. Interferometer Configuration
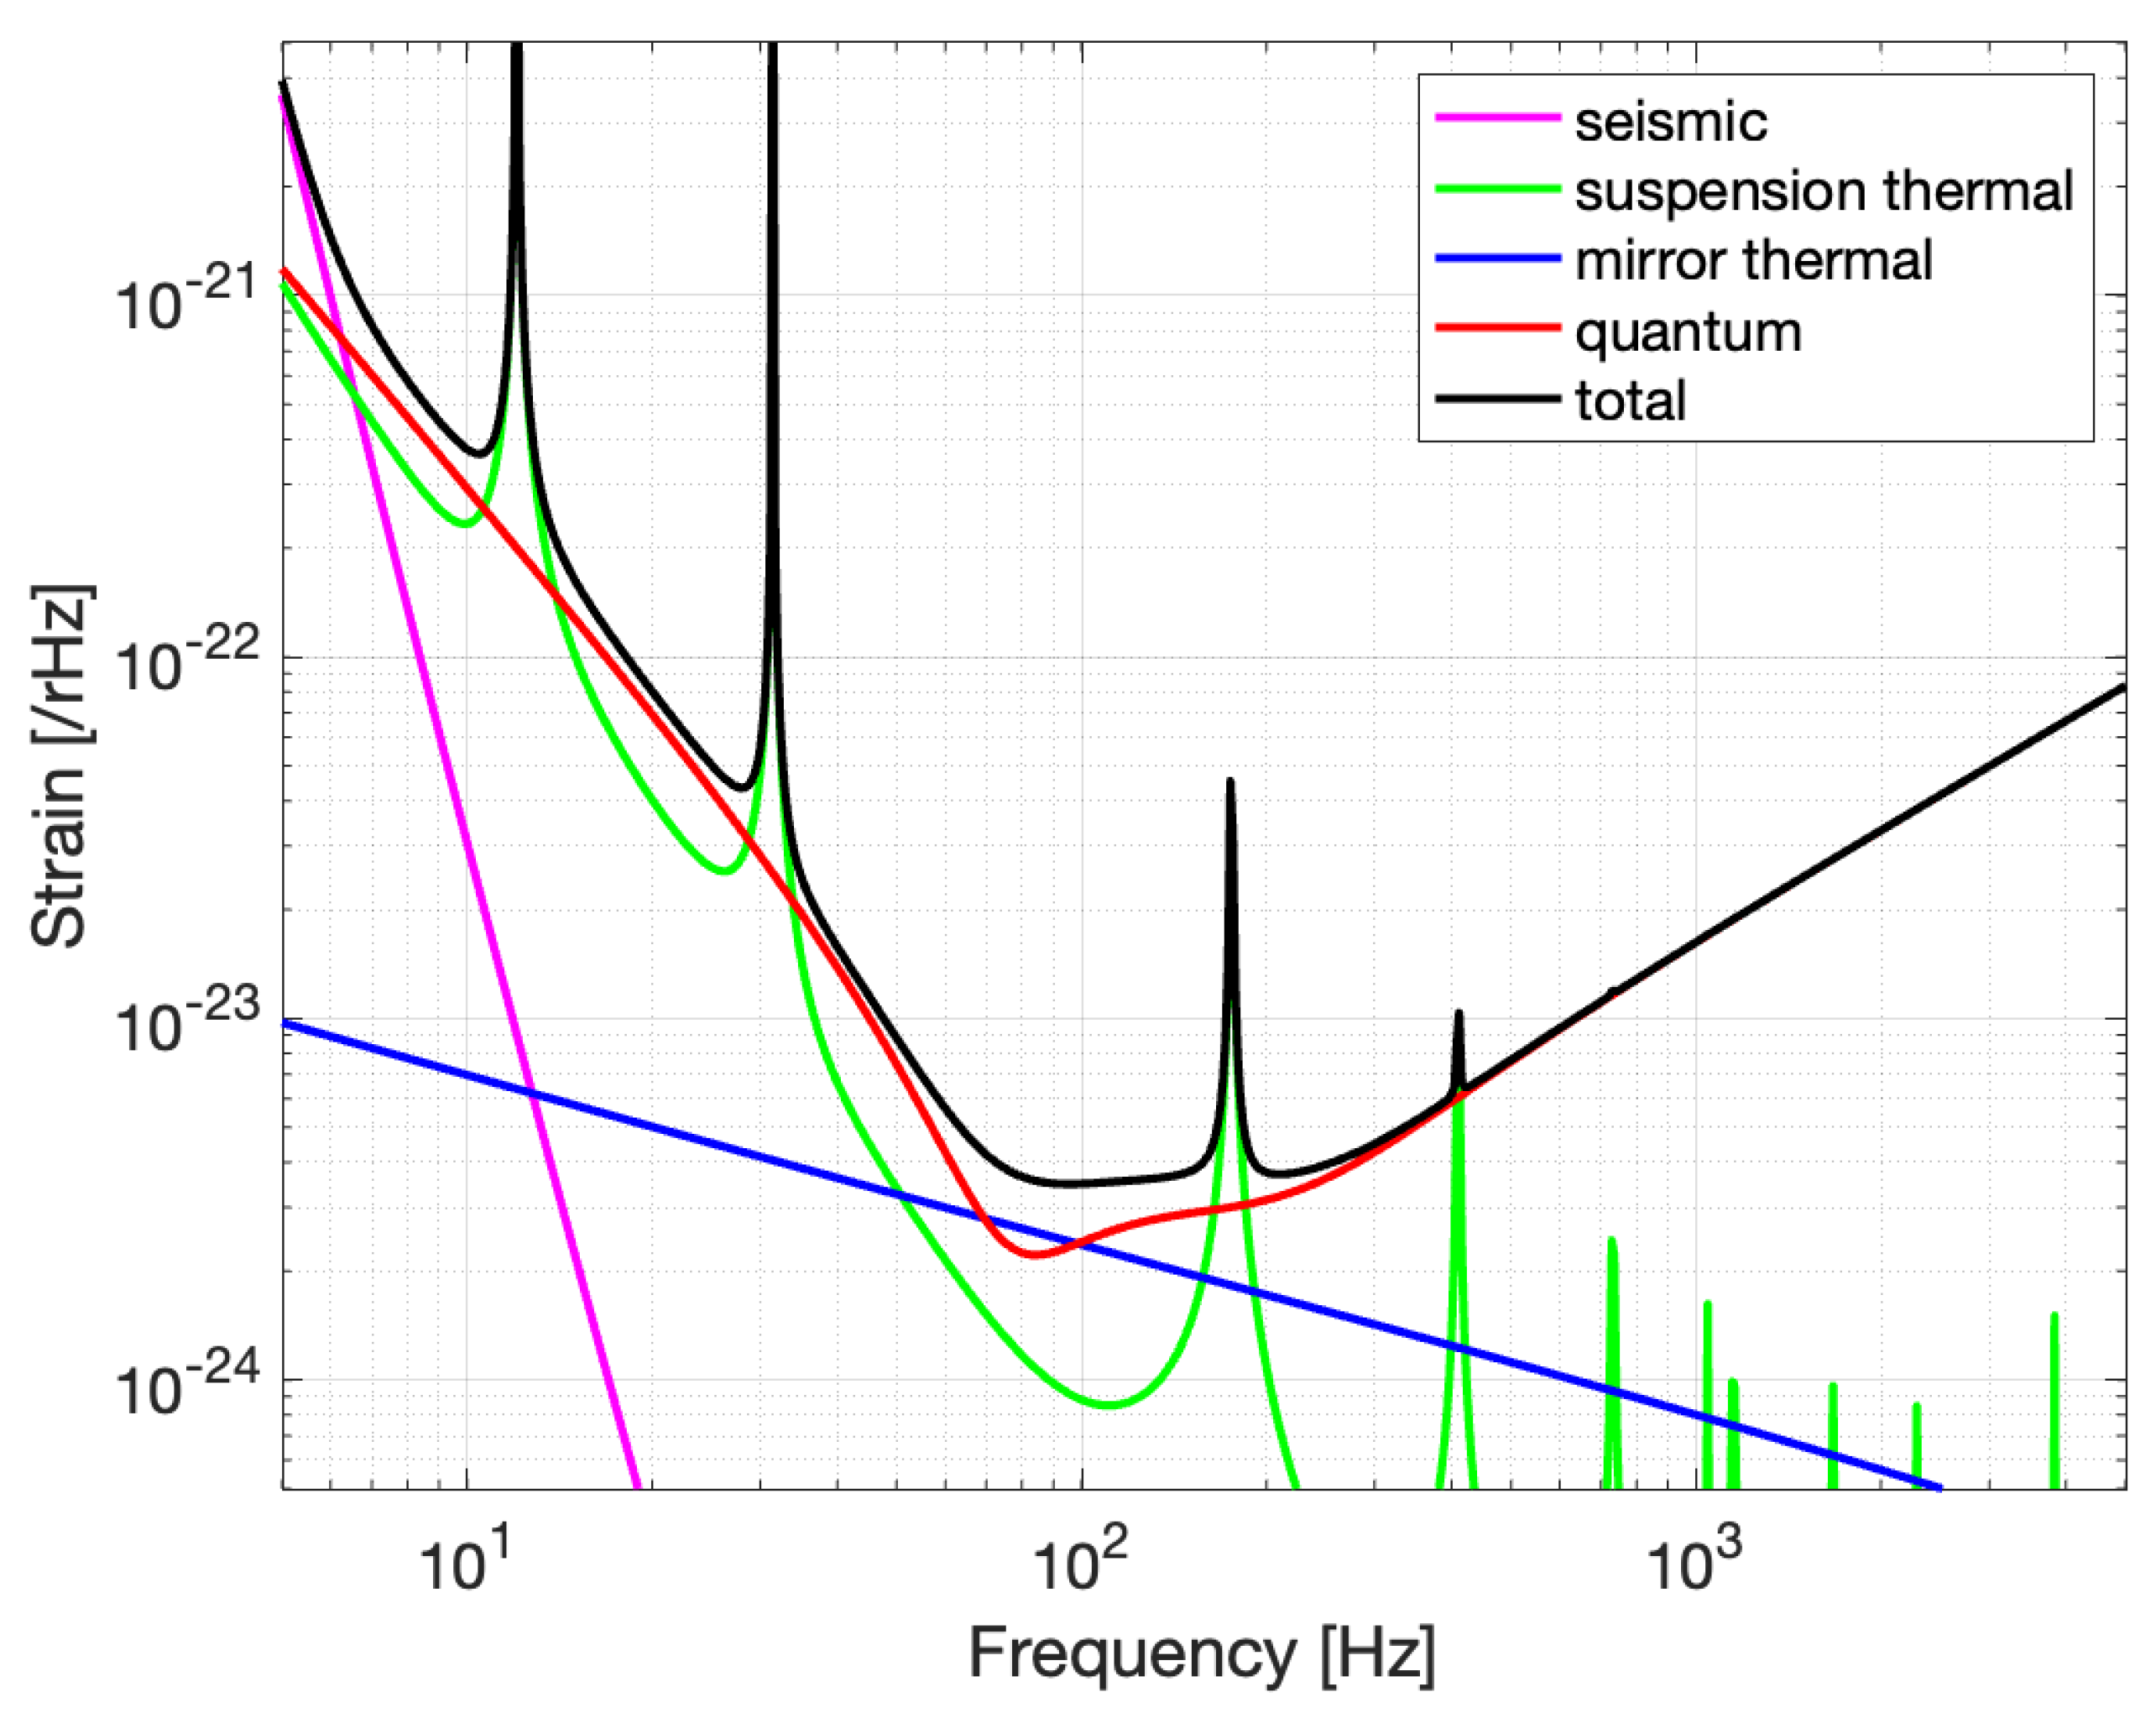
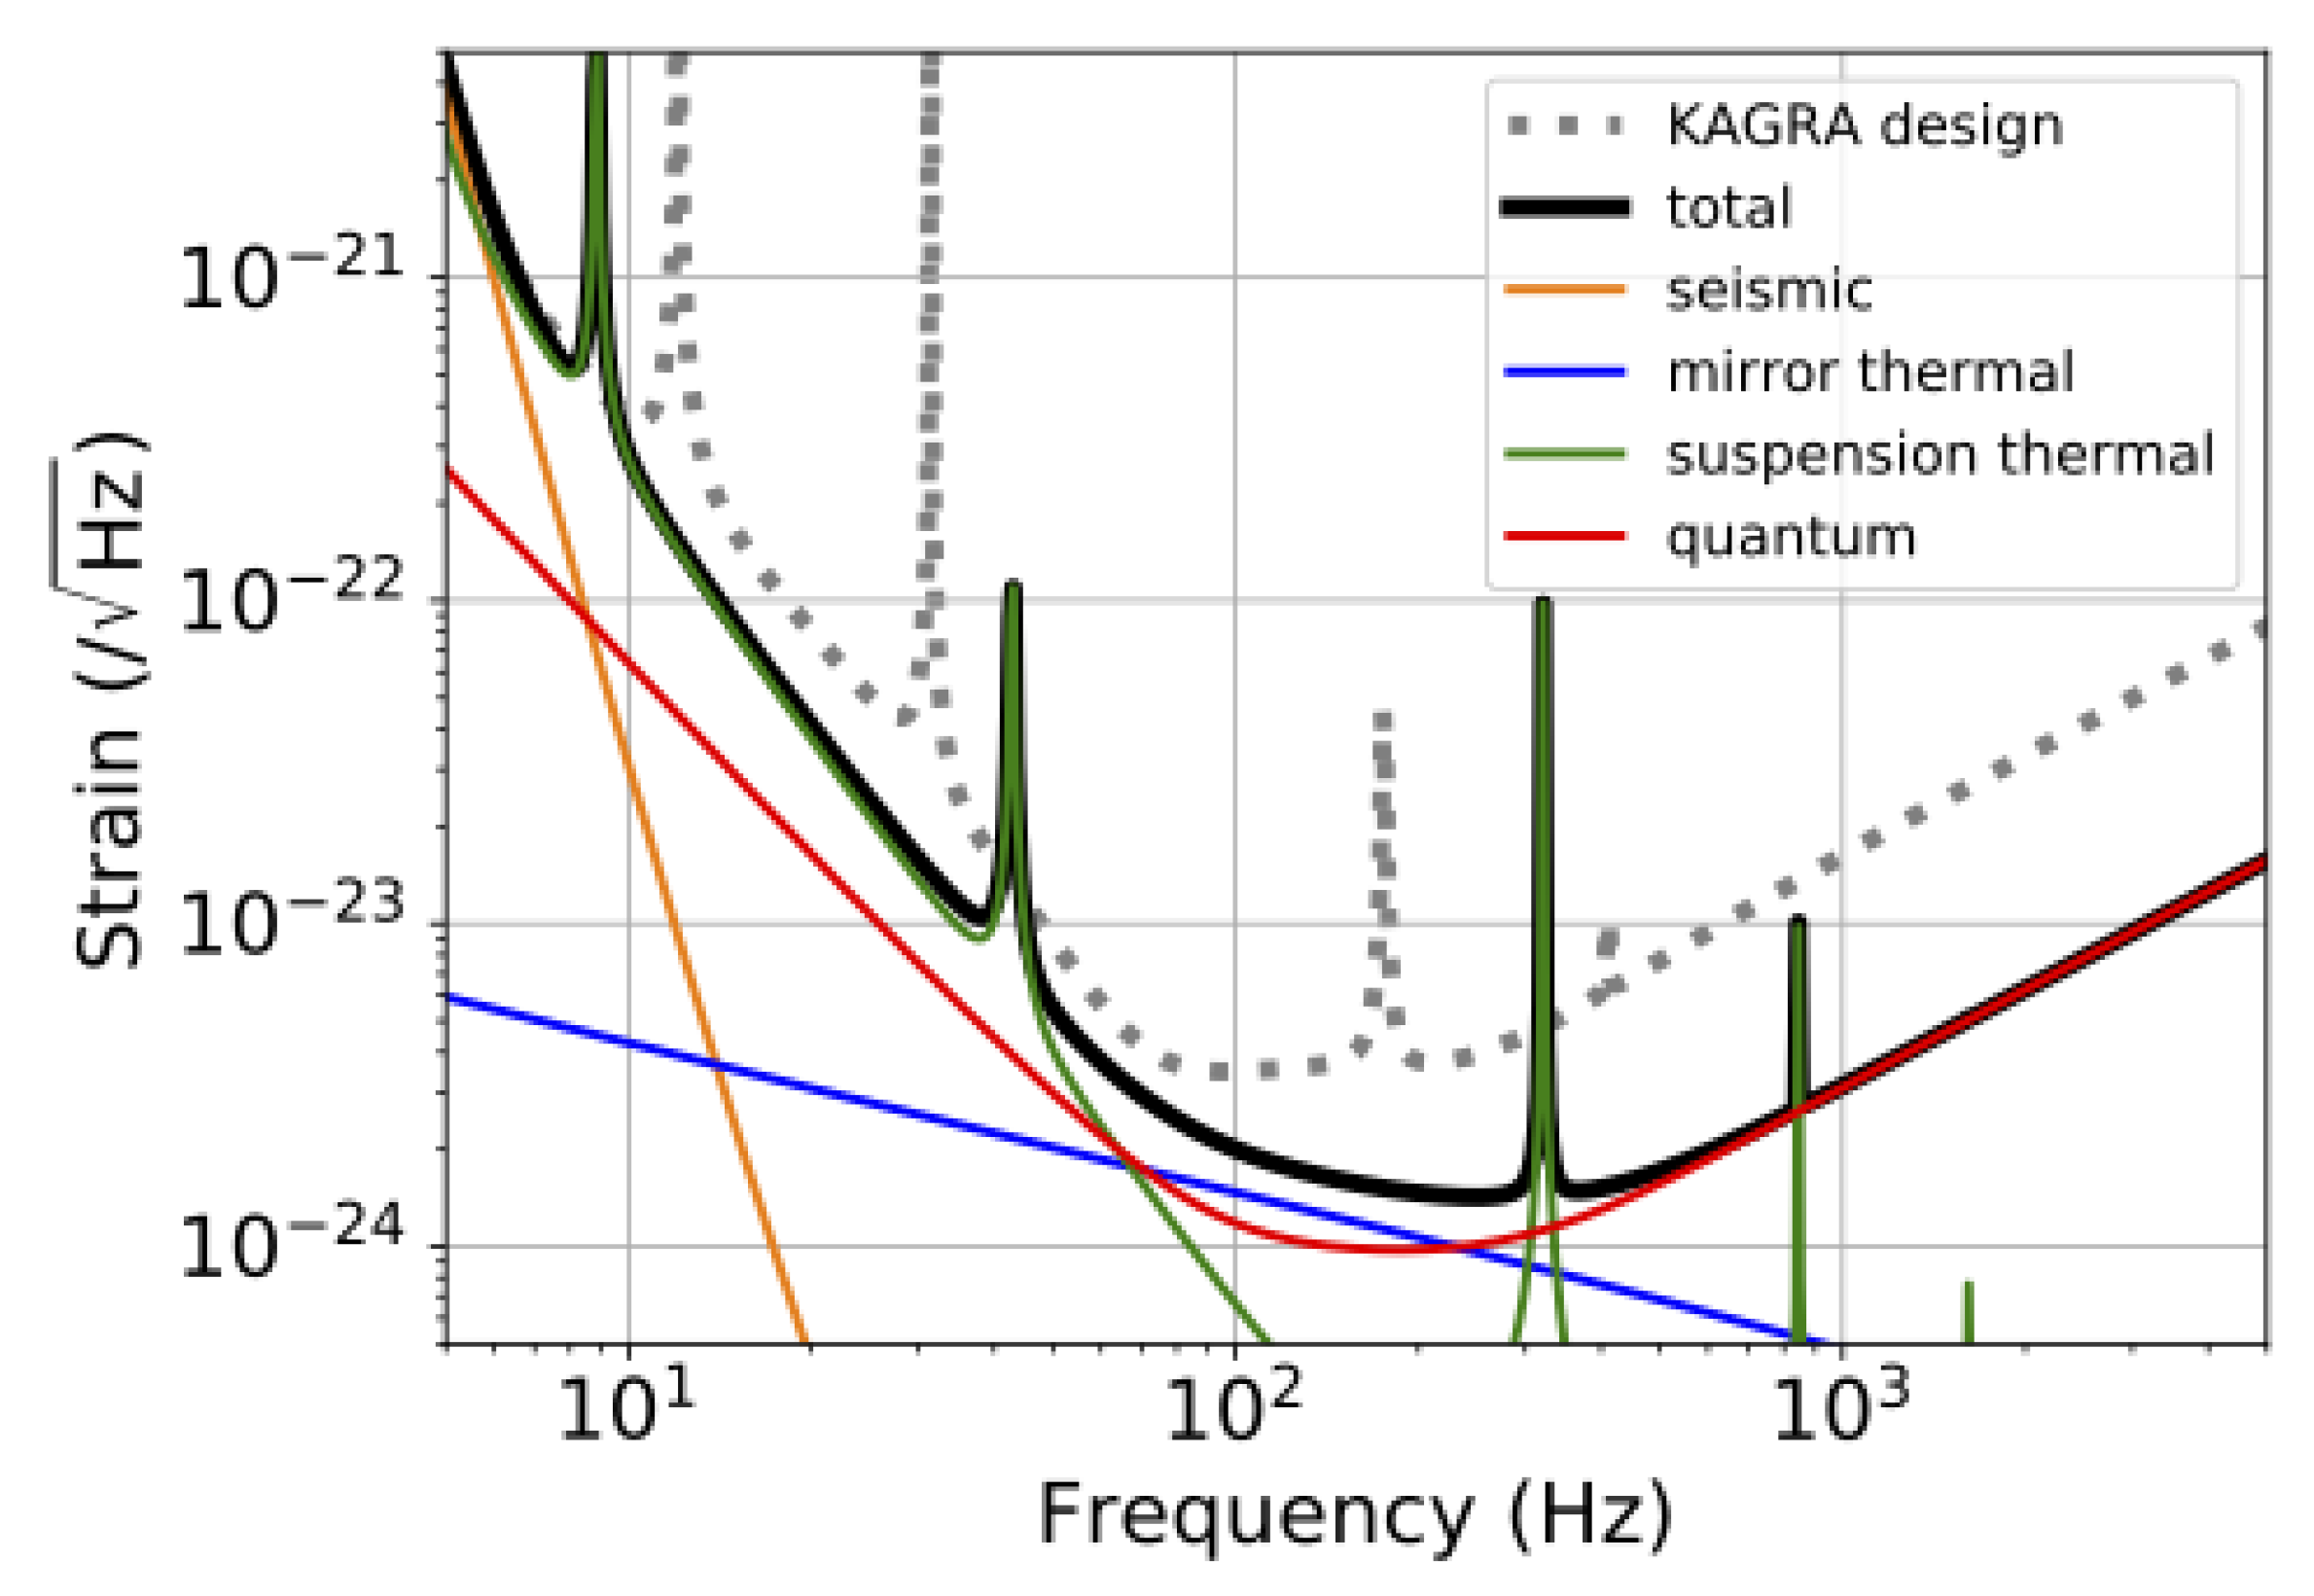
2.3. Design Sensitivity
2.4. Key Features of KAGRA
2.4.1. Underground
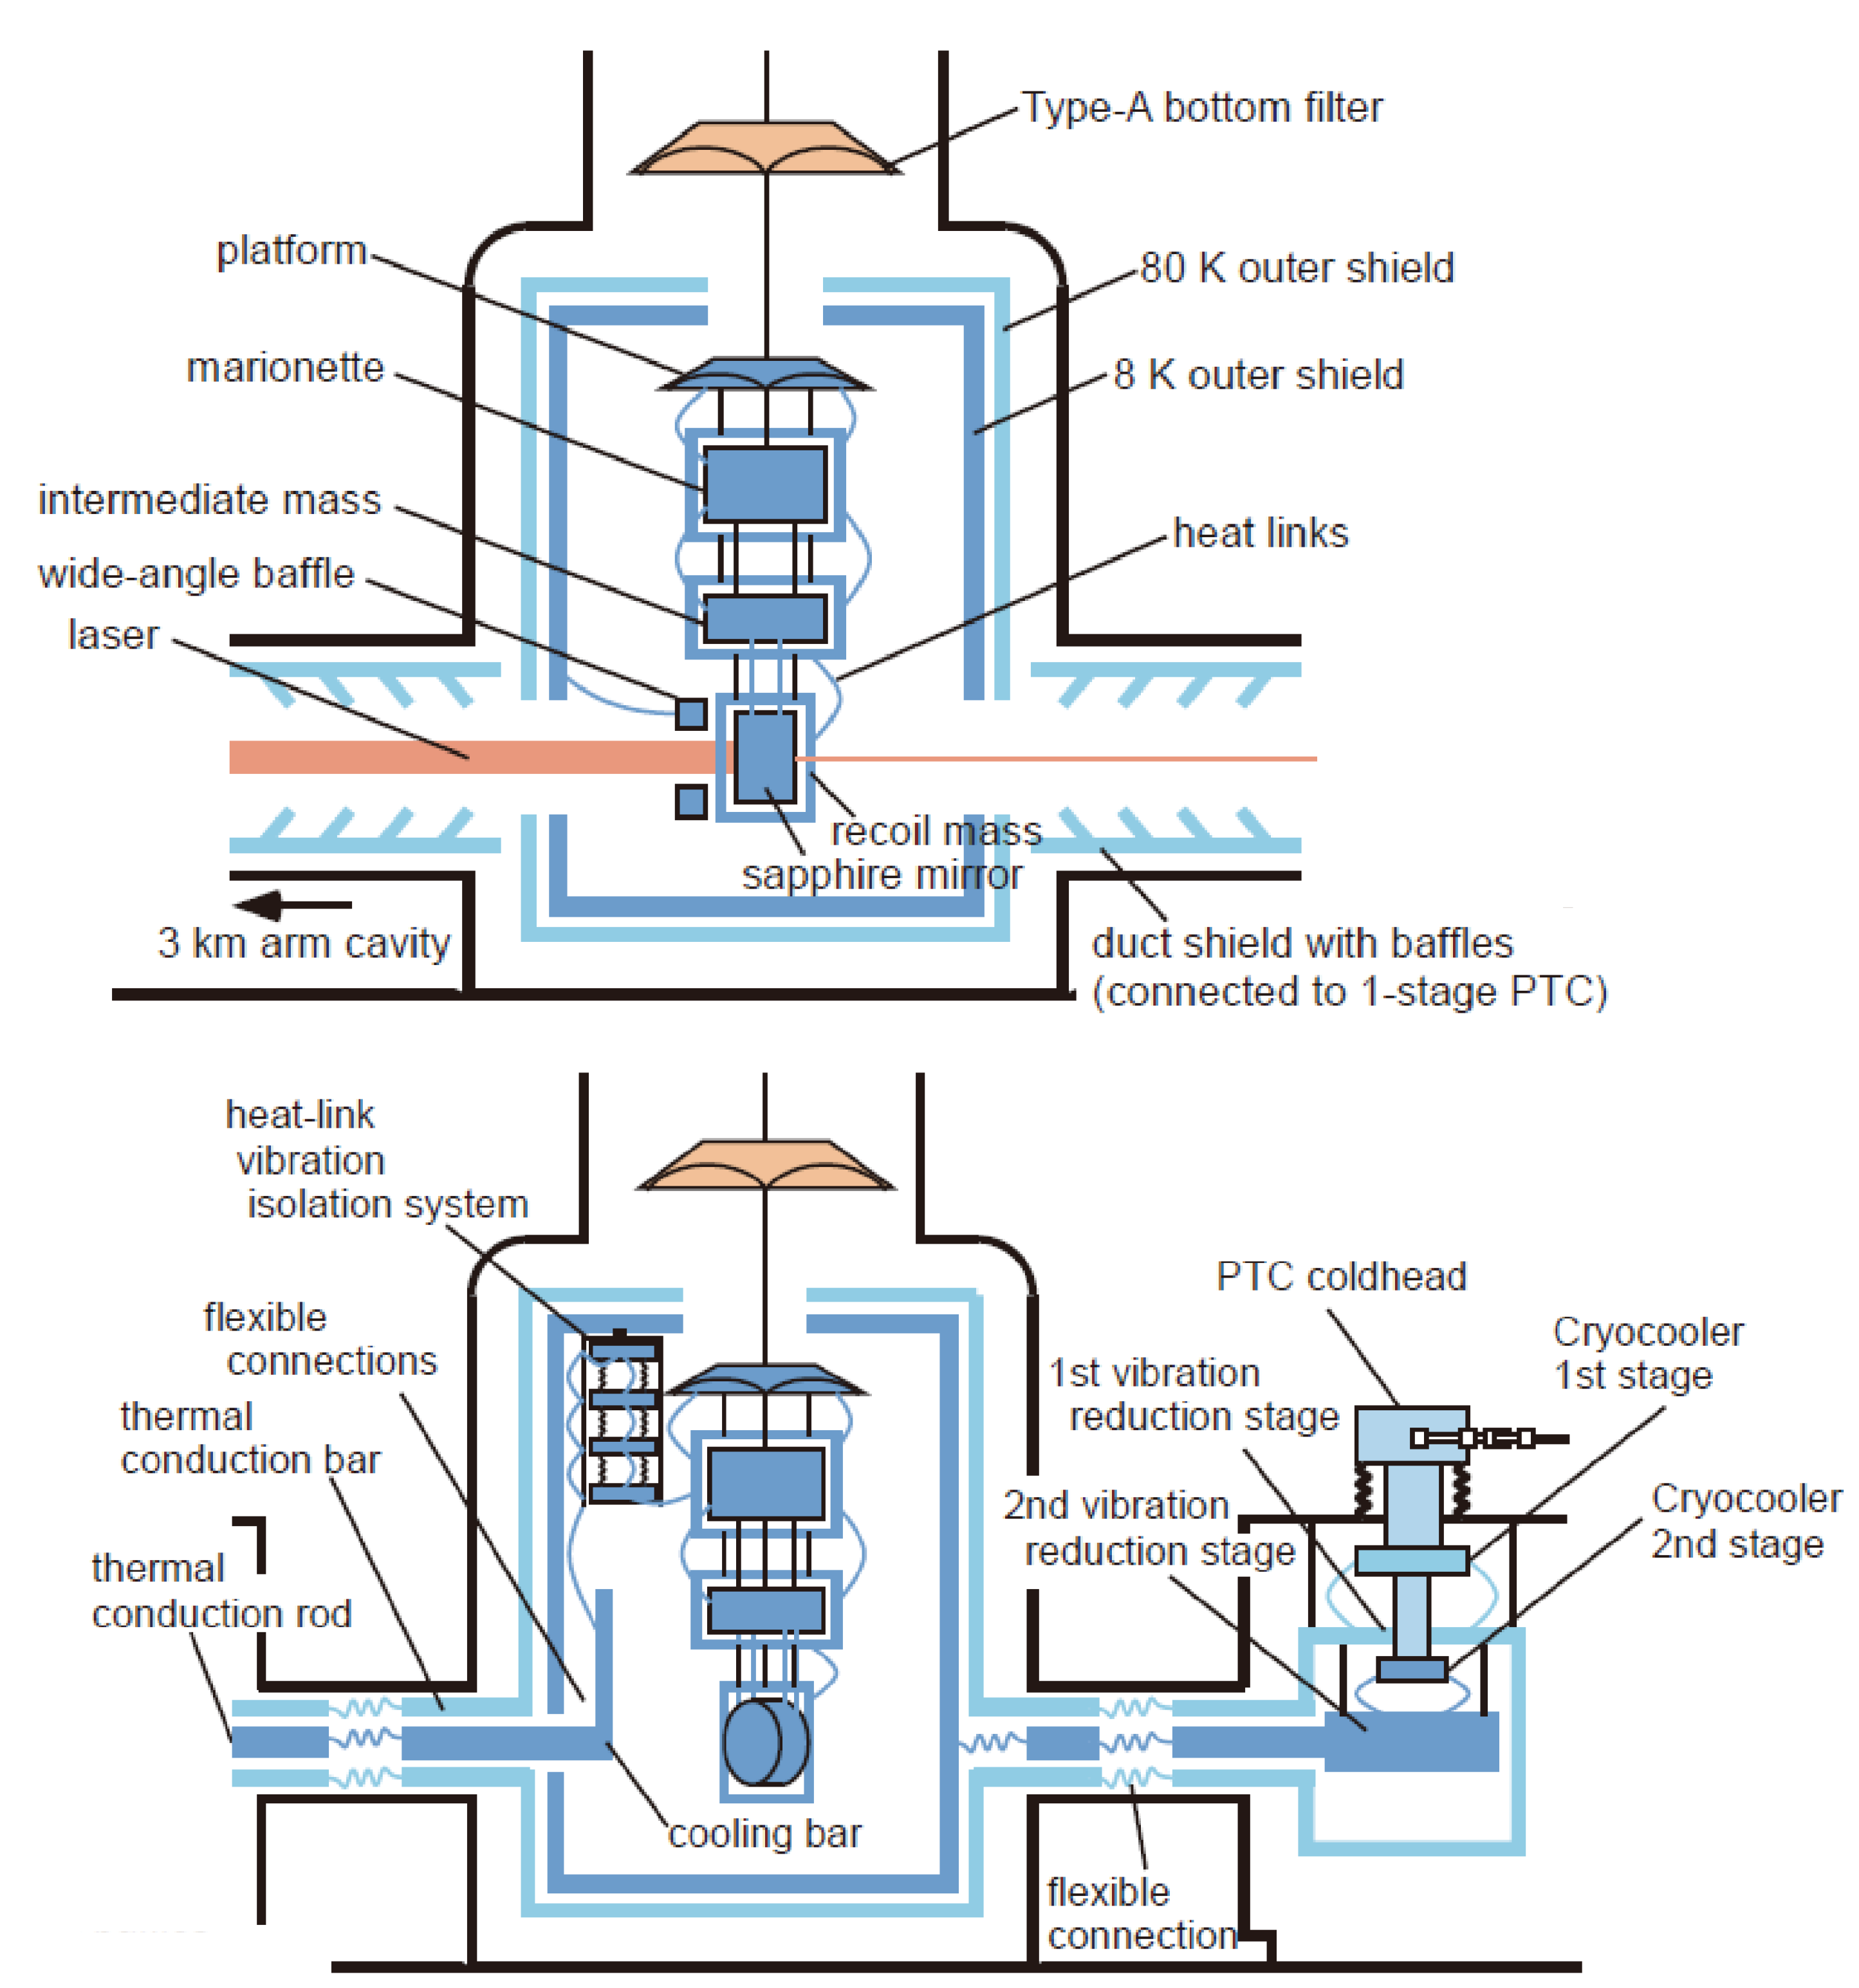
2.4.2. Cryogenics
3. Recent Status
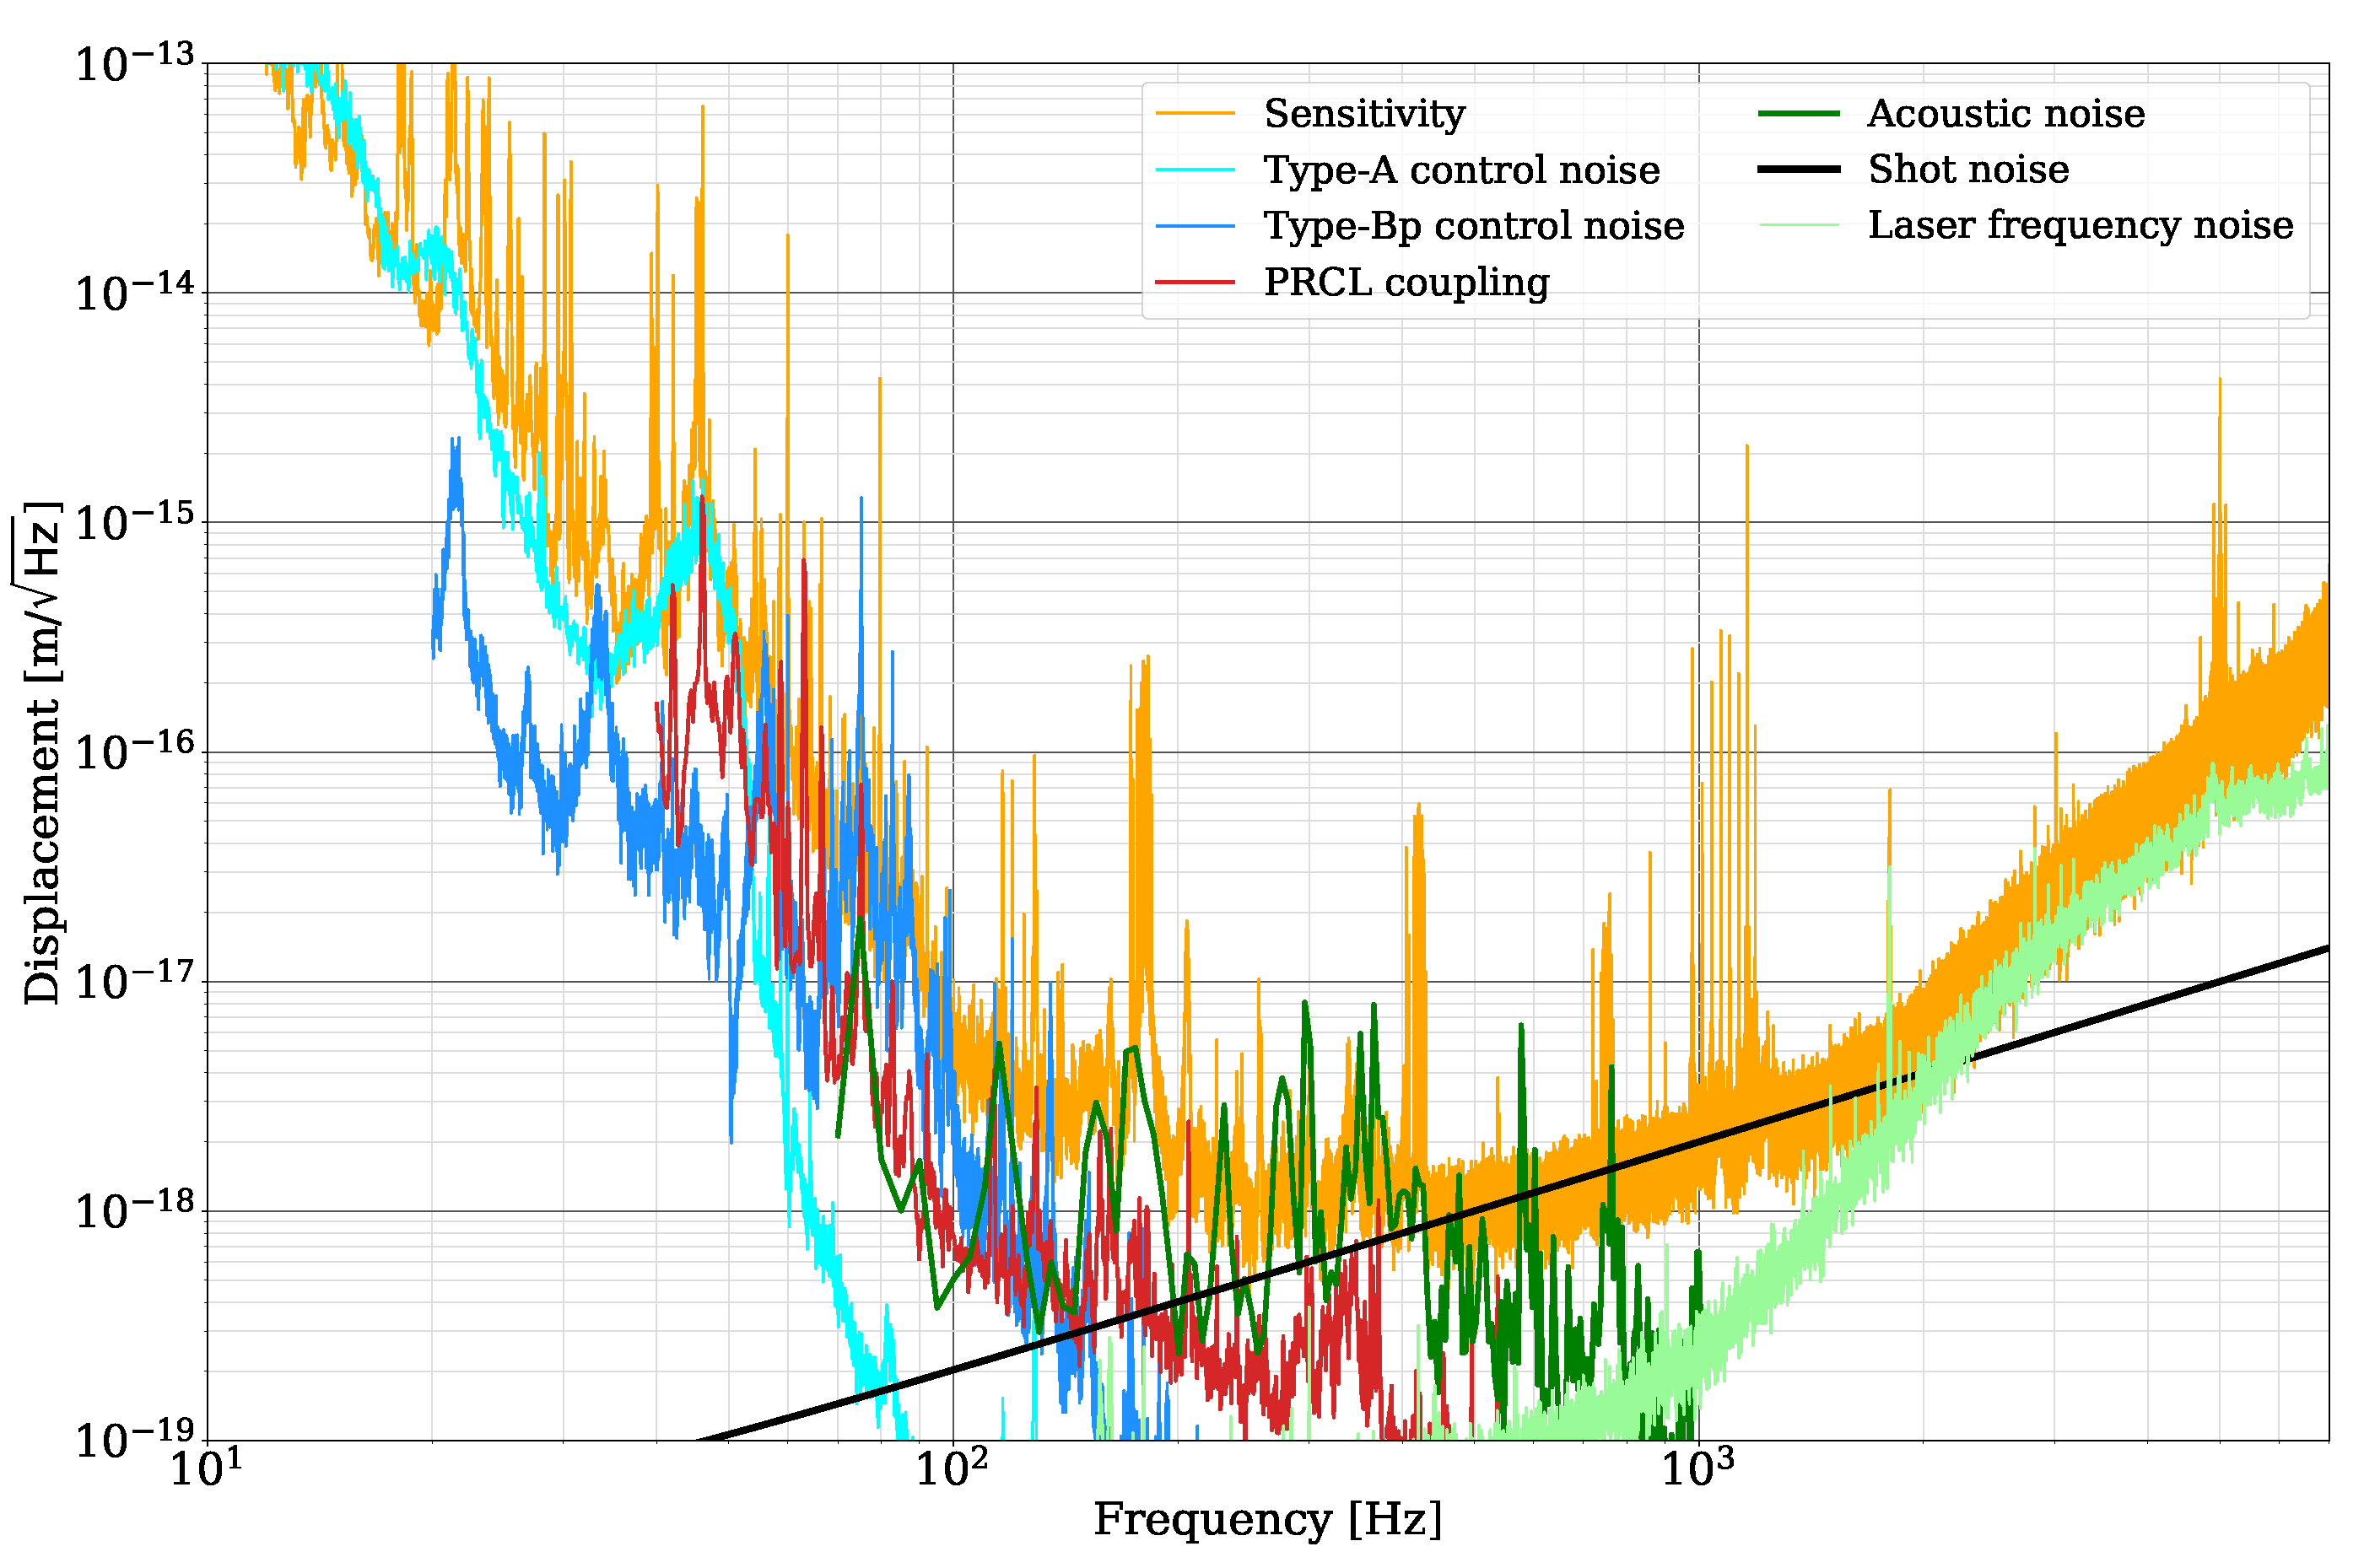
3.1. Detector Performance during the O3GK Observation Run
3.2. Toward the O4 Observation Run
3.2.1. Upgrade for Improving the Duty Factor
3.2.2. Upgrade for Improving Sensitivity
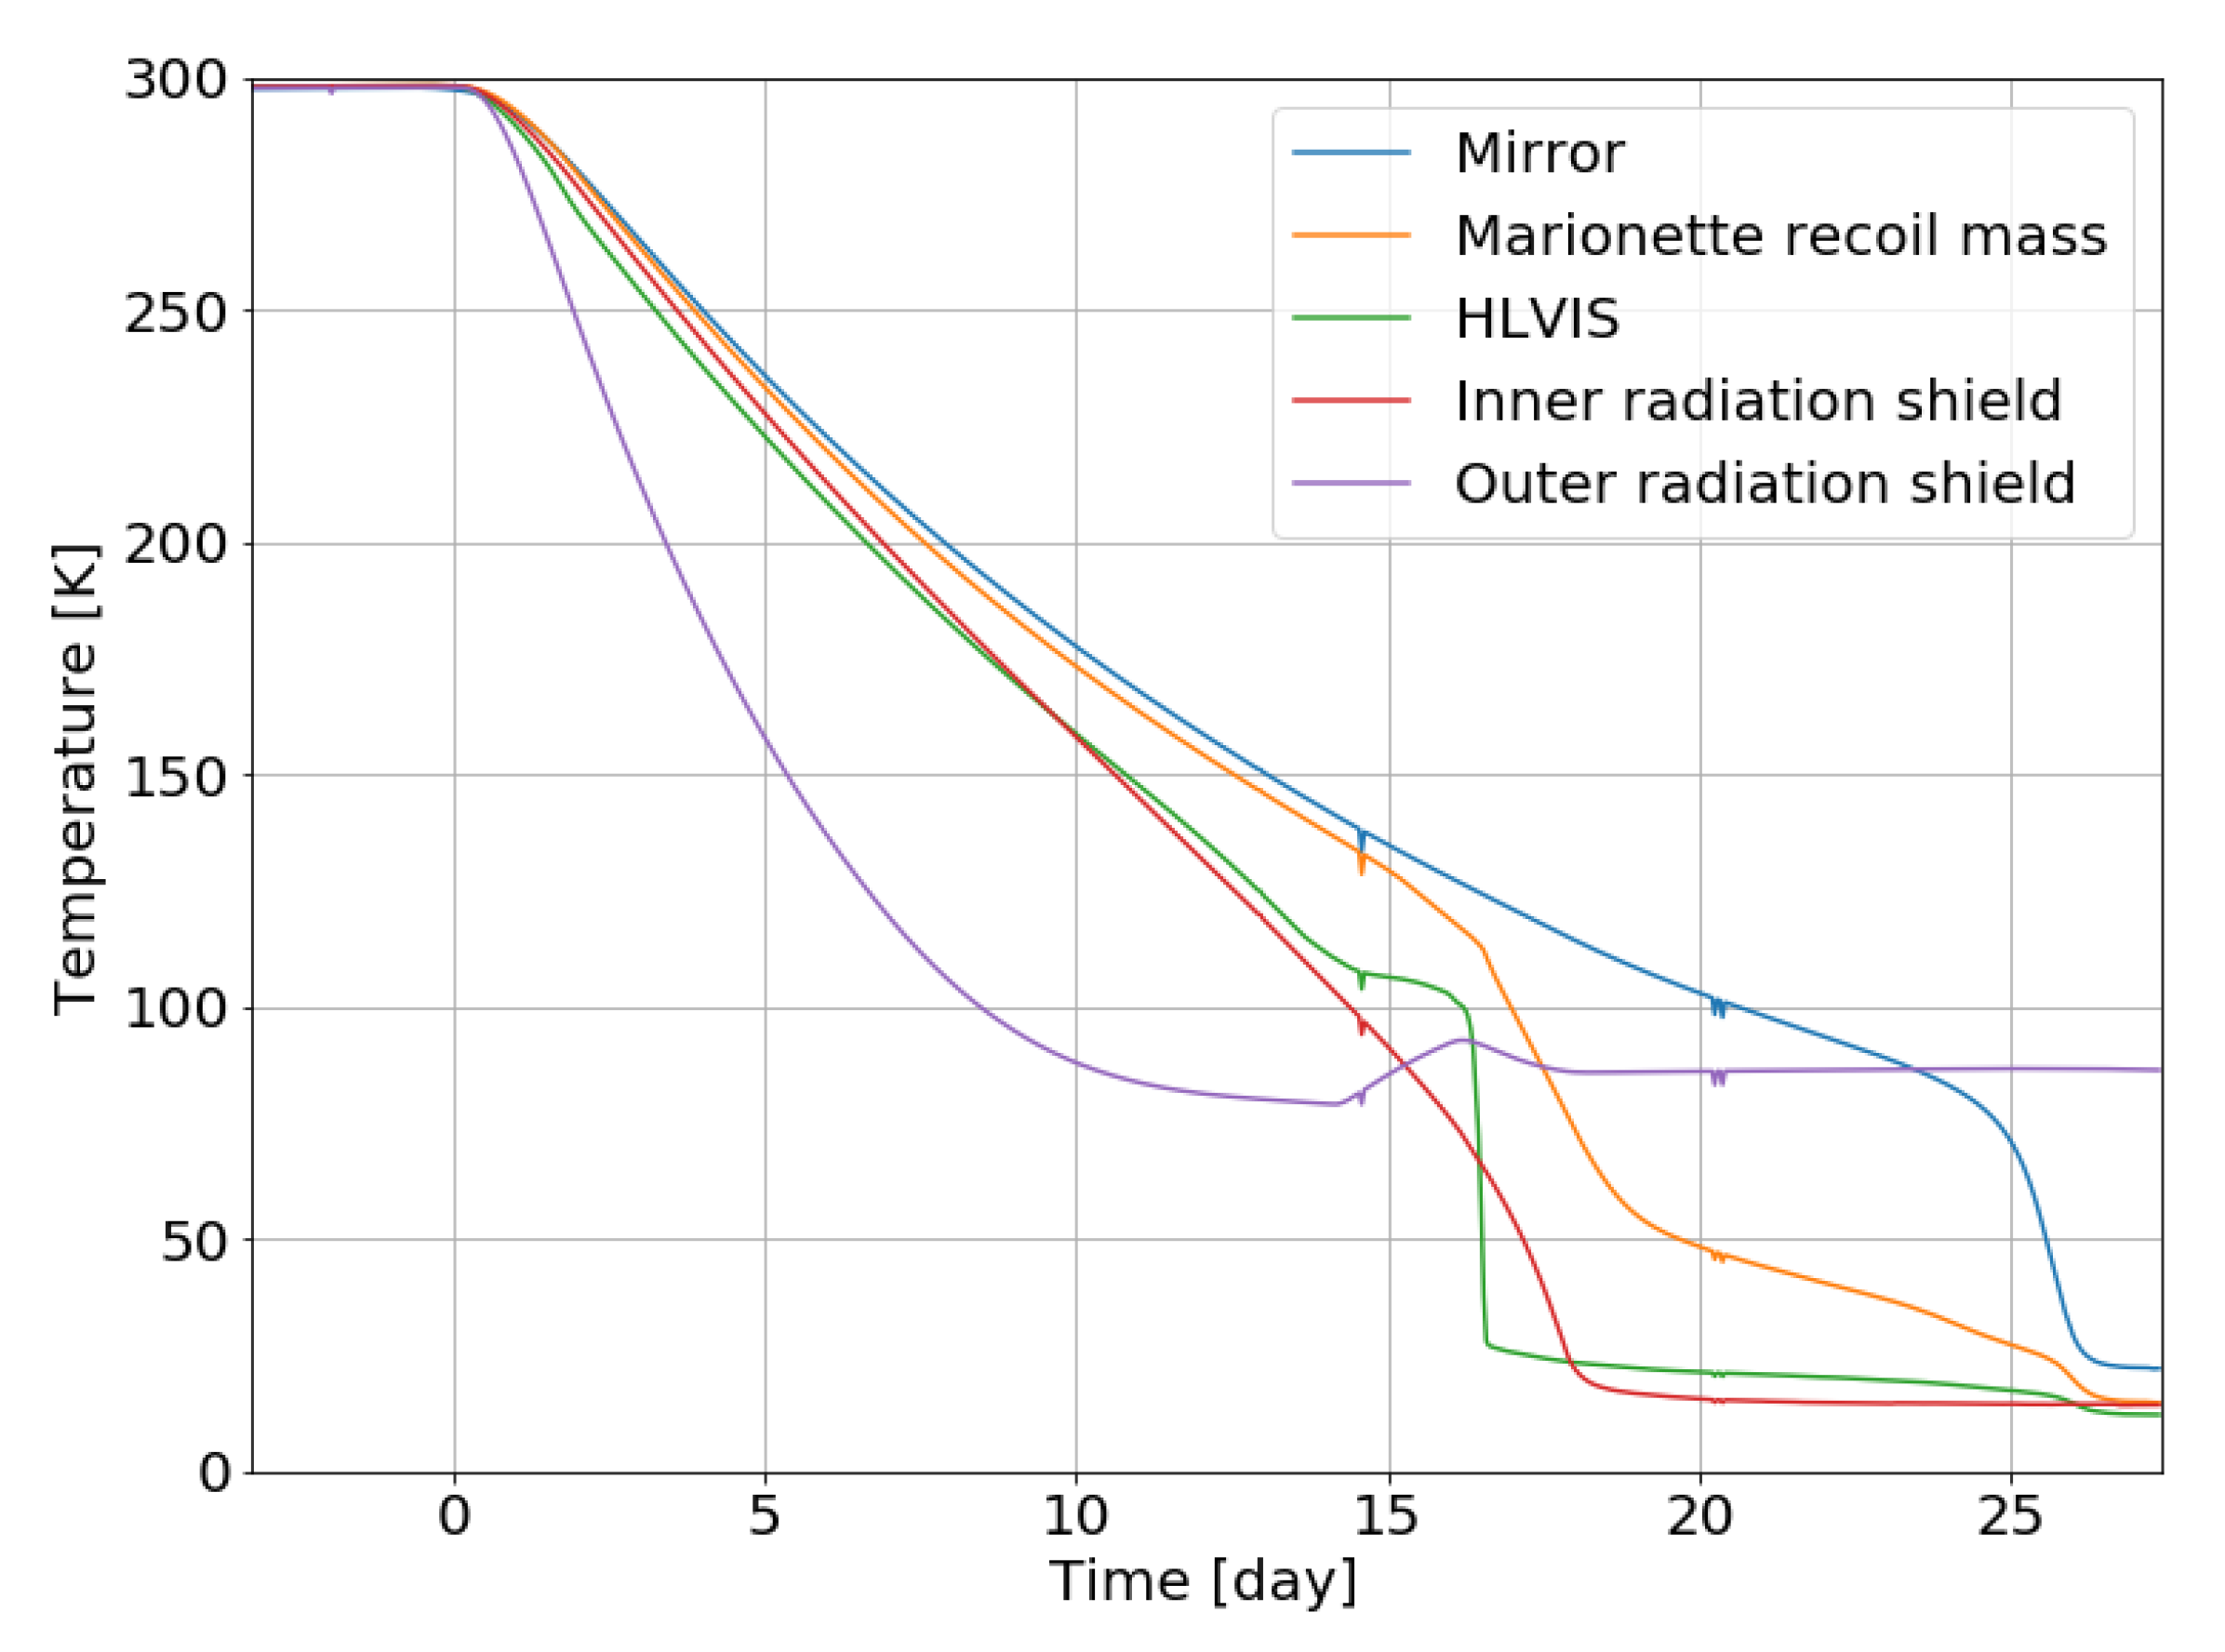
3.2.3. Recent Results on Cryogenics
4. Evaluations of the Underground Environment
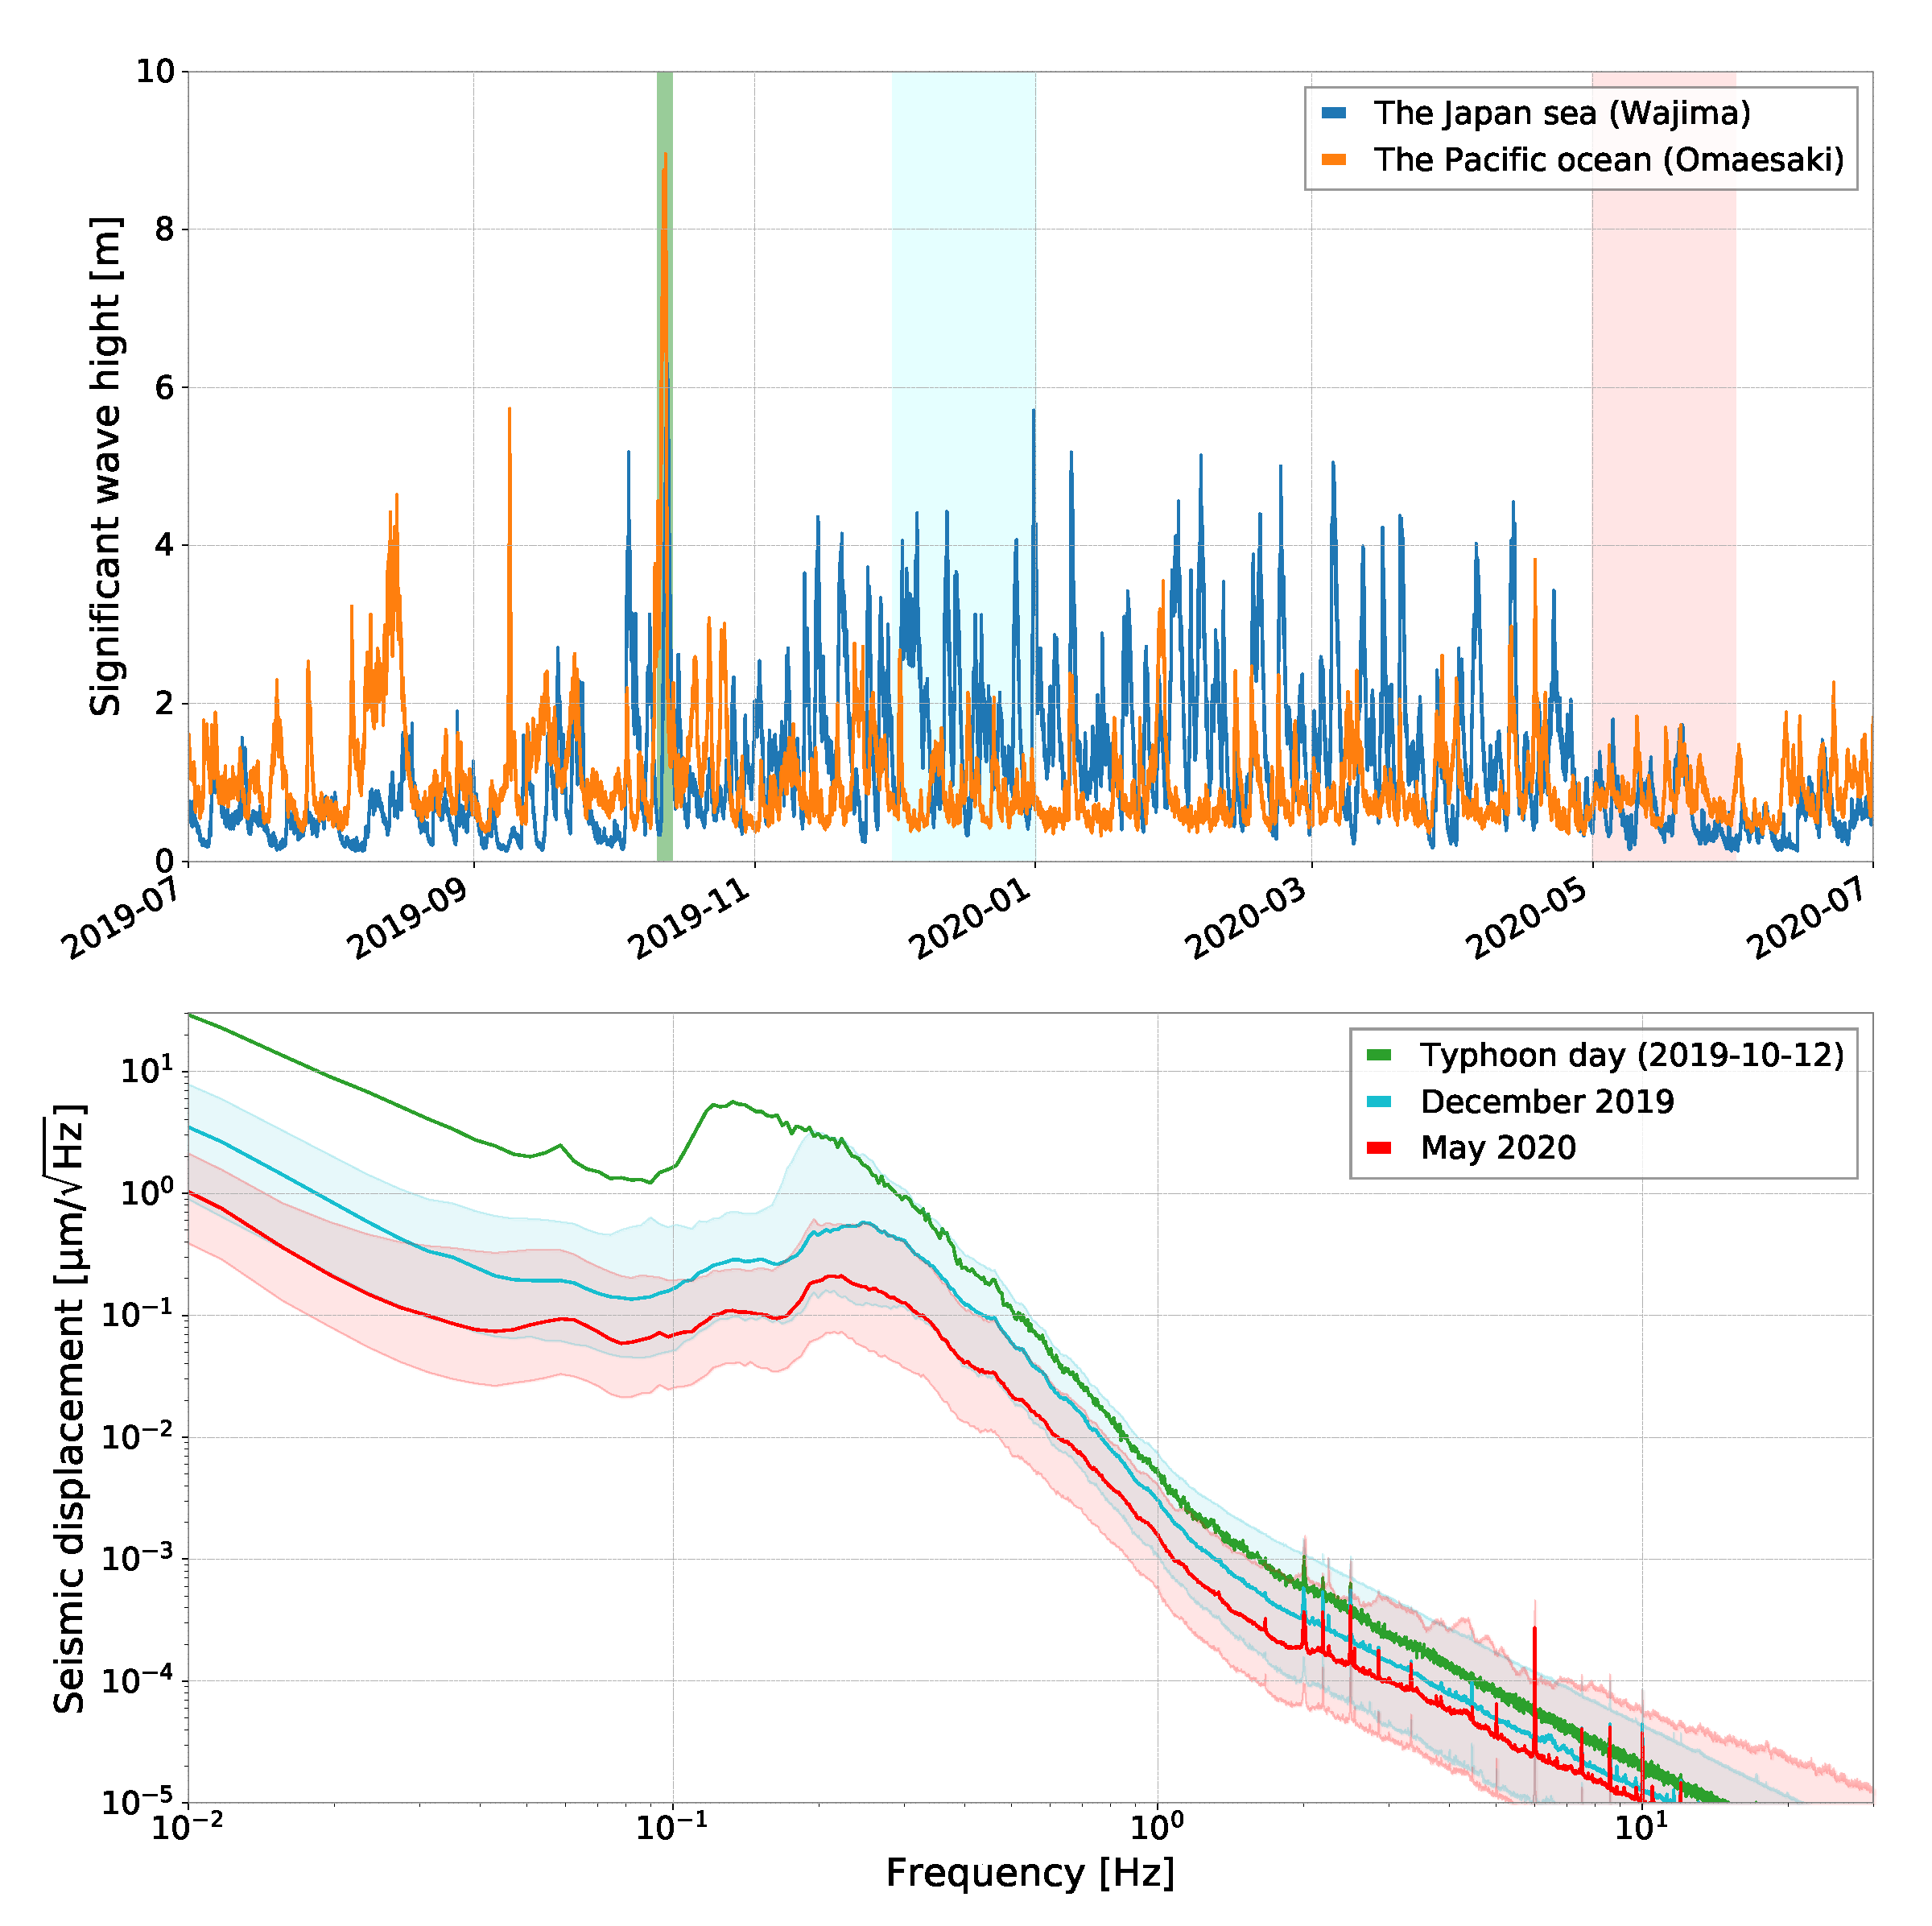
4.1. Seismic Motion
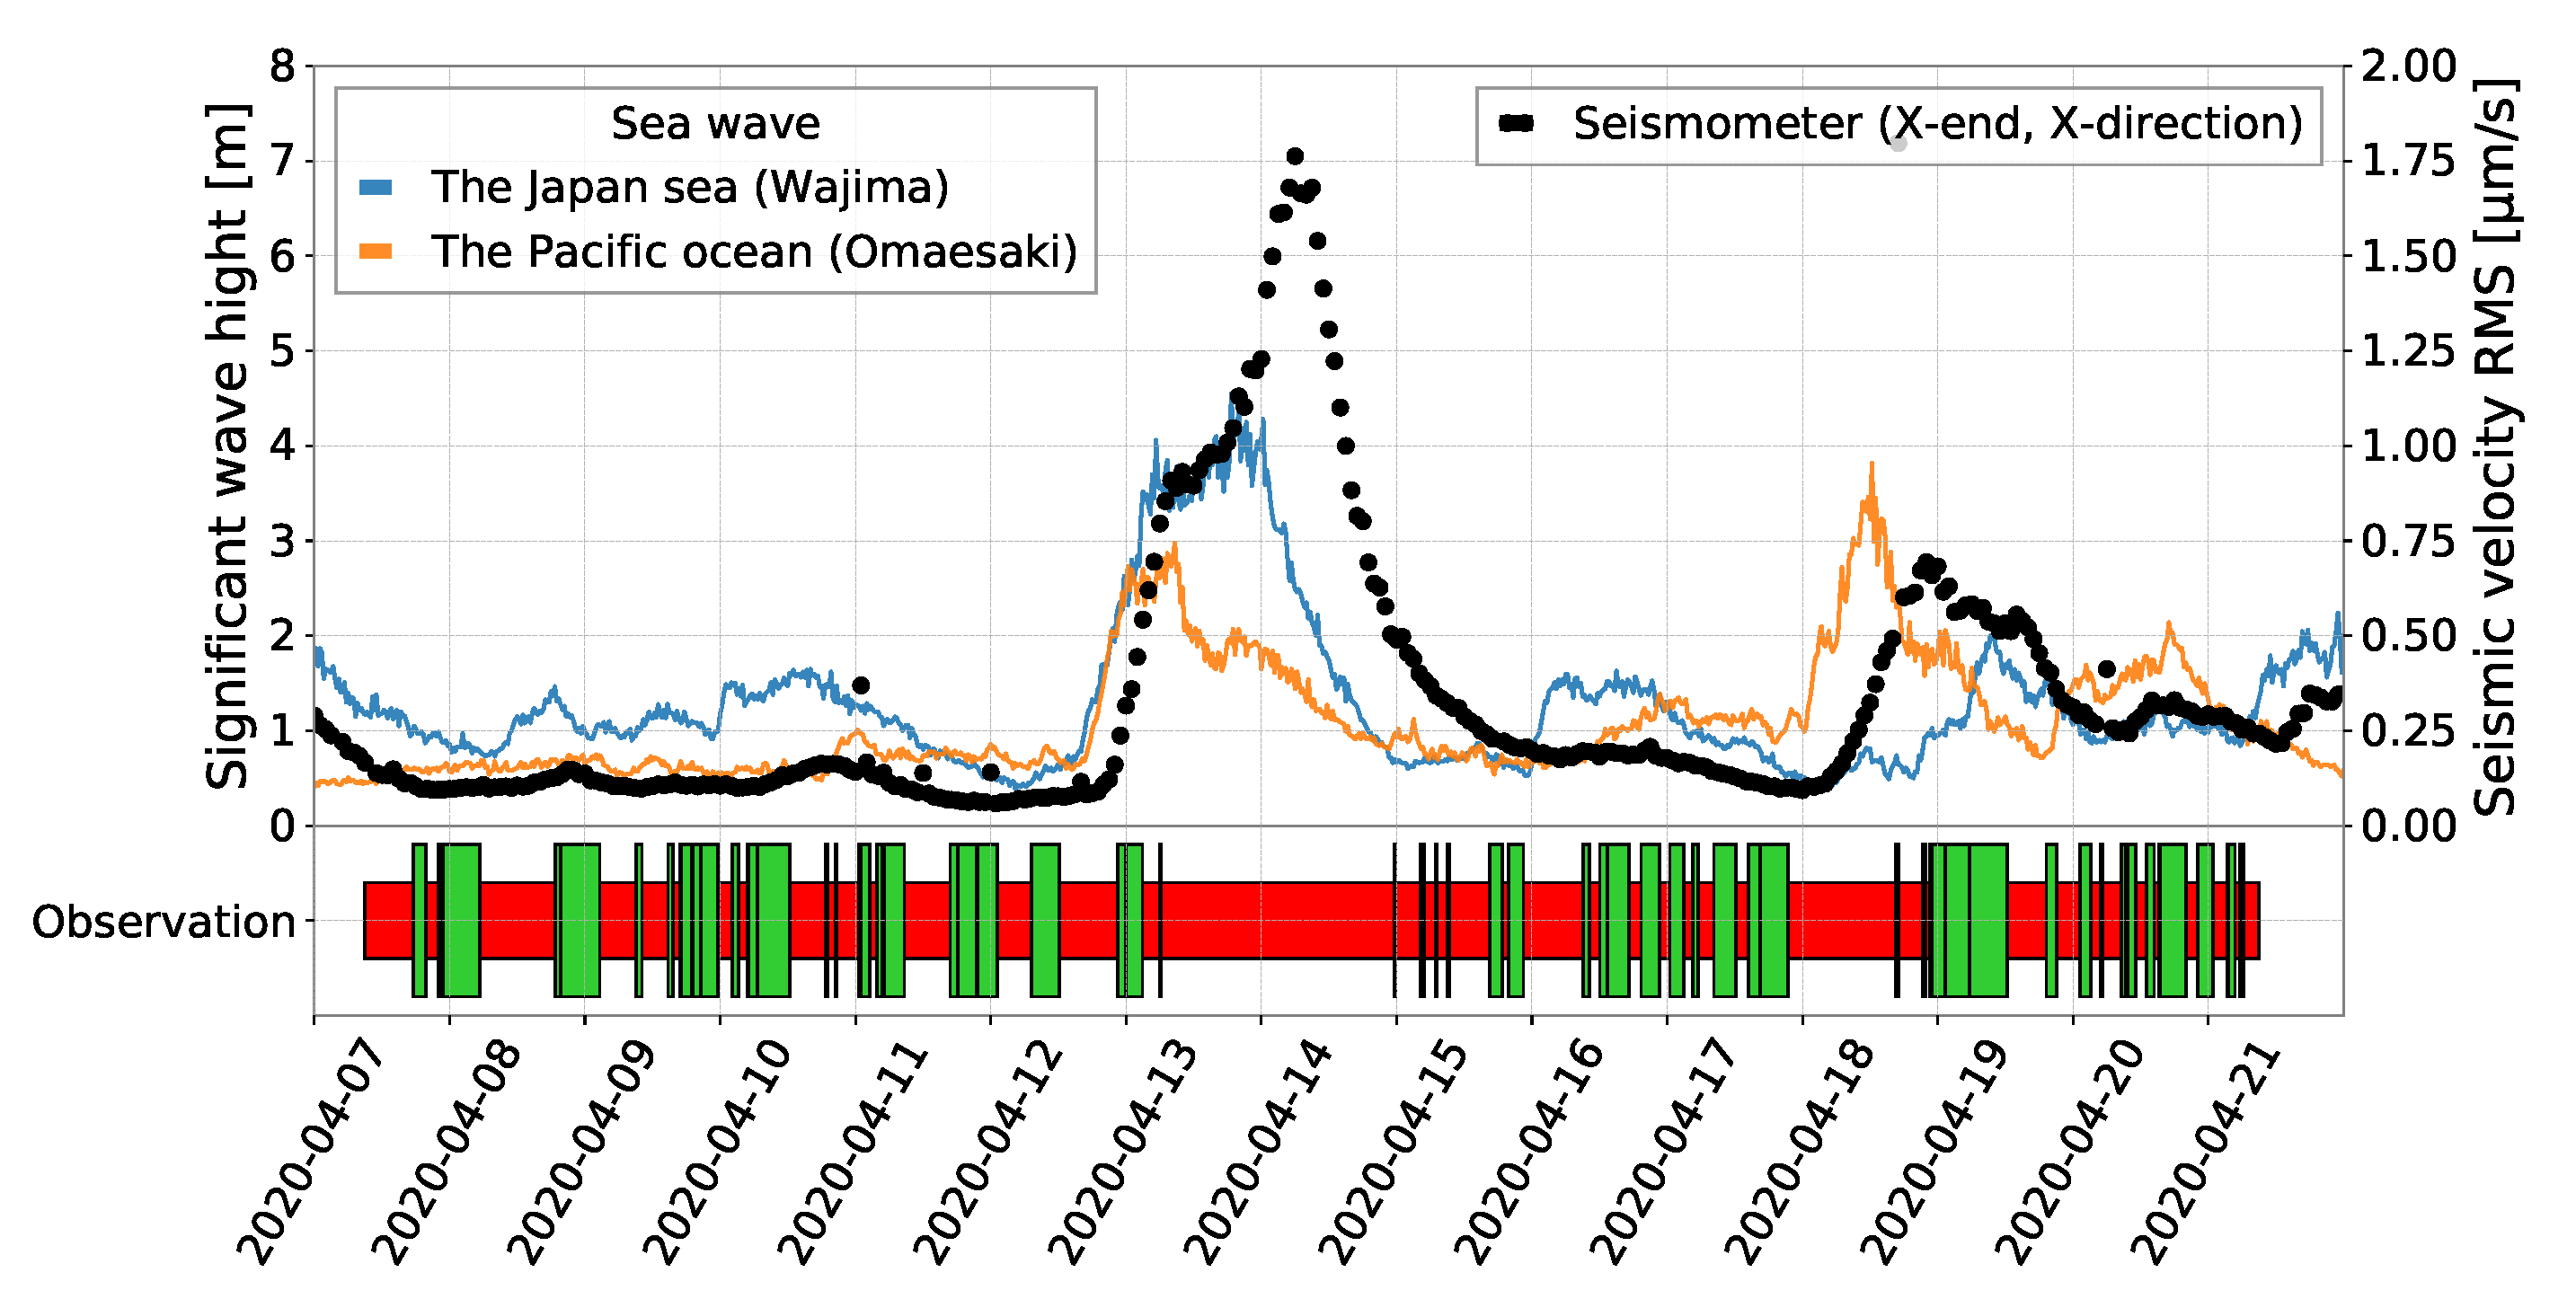
4.1.1. Microseismic Motion
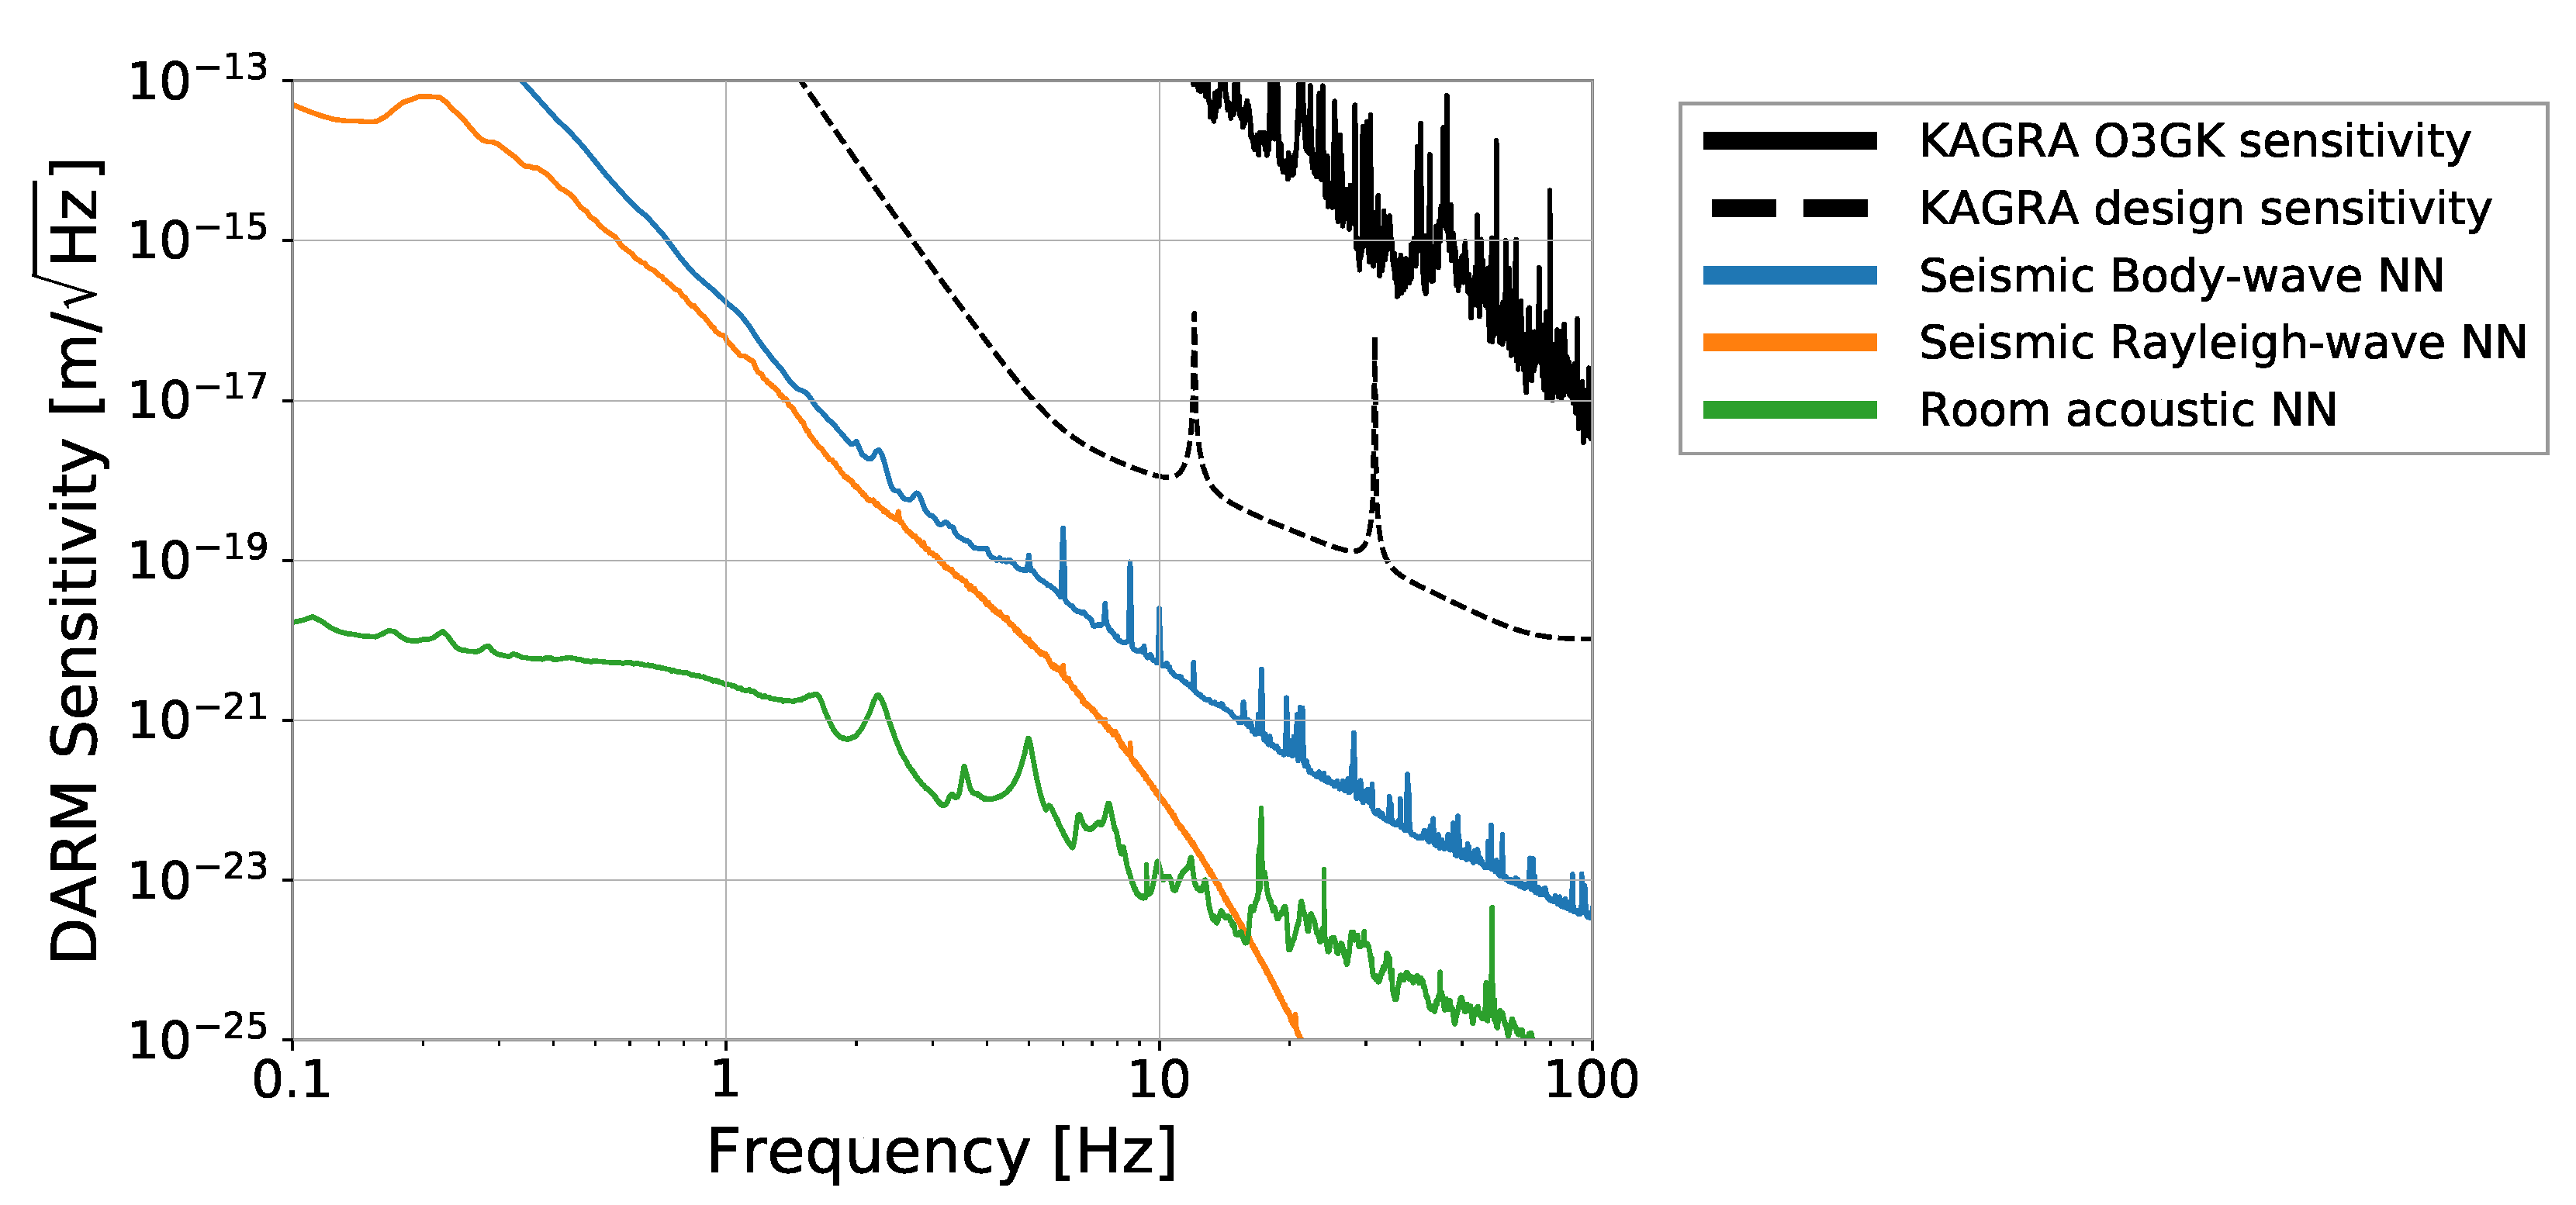
4.1.2. Seismic Newtonian Noise
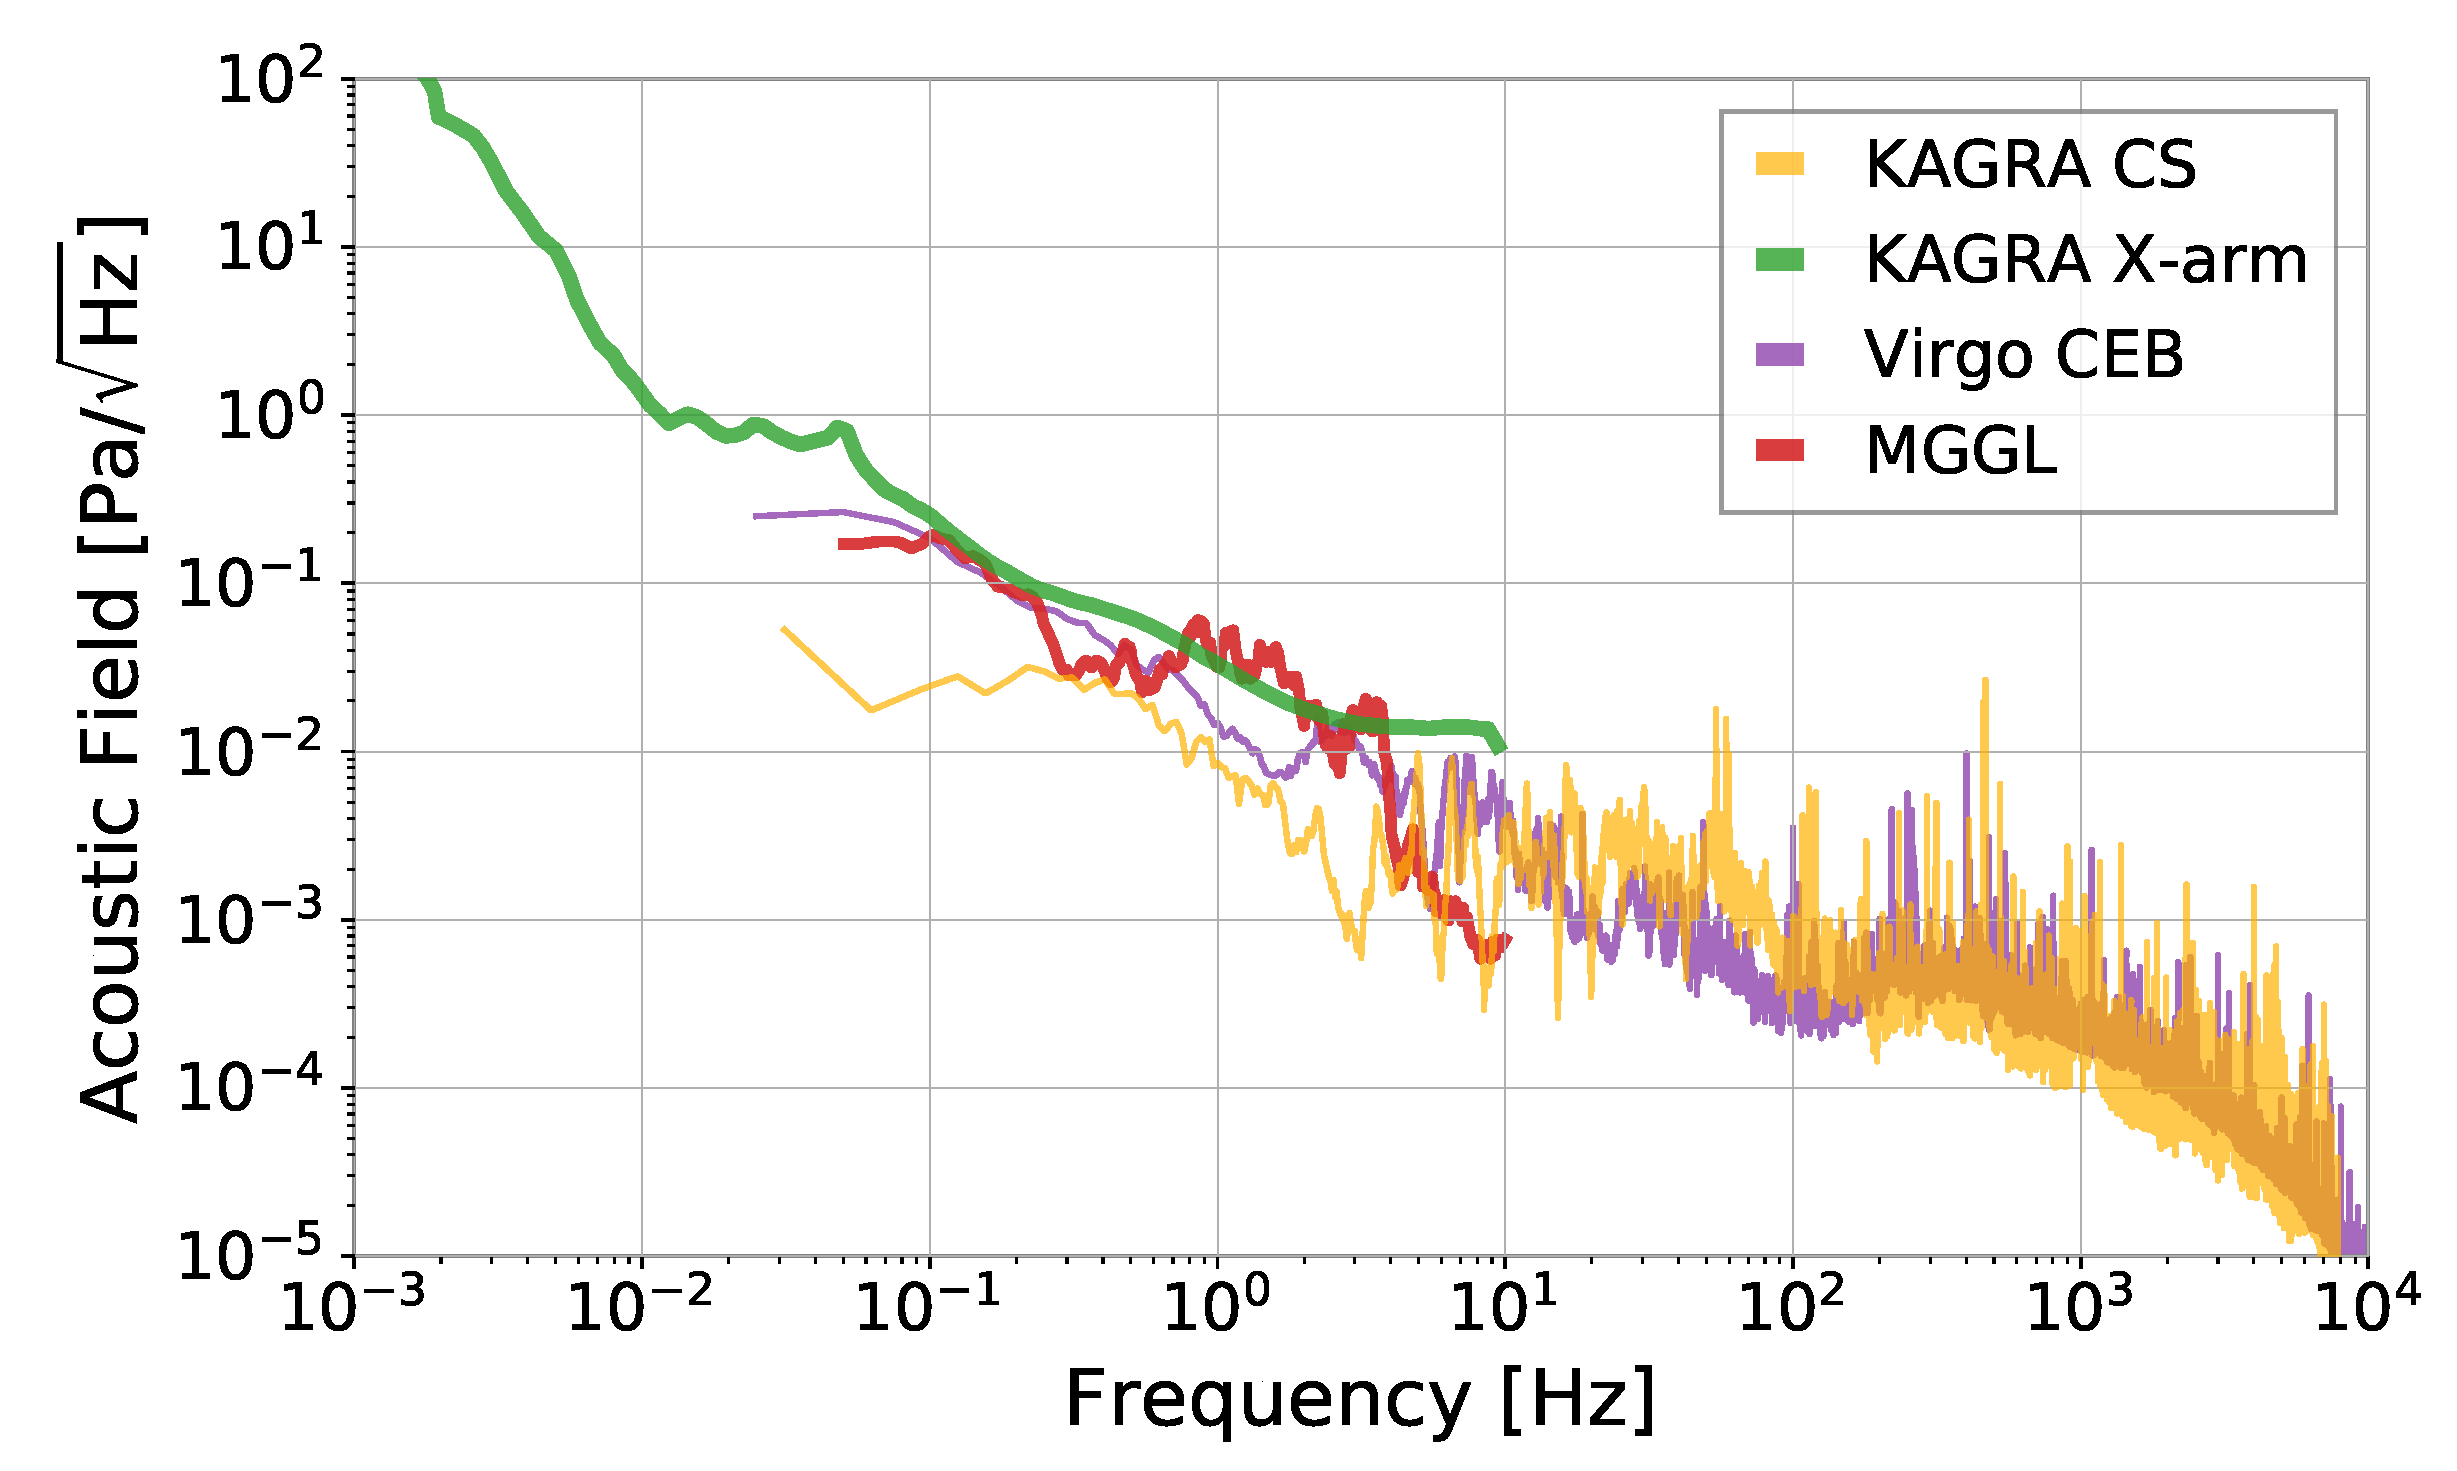
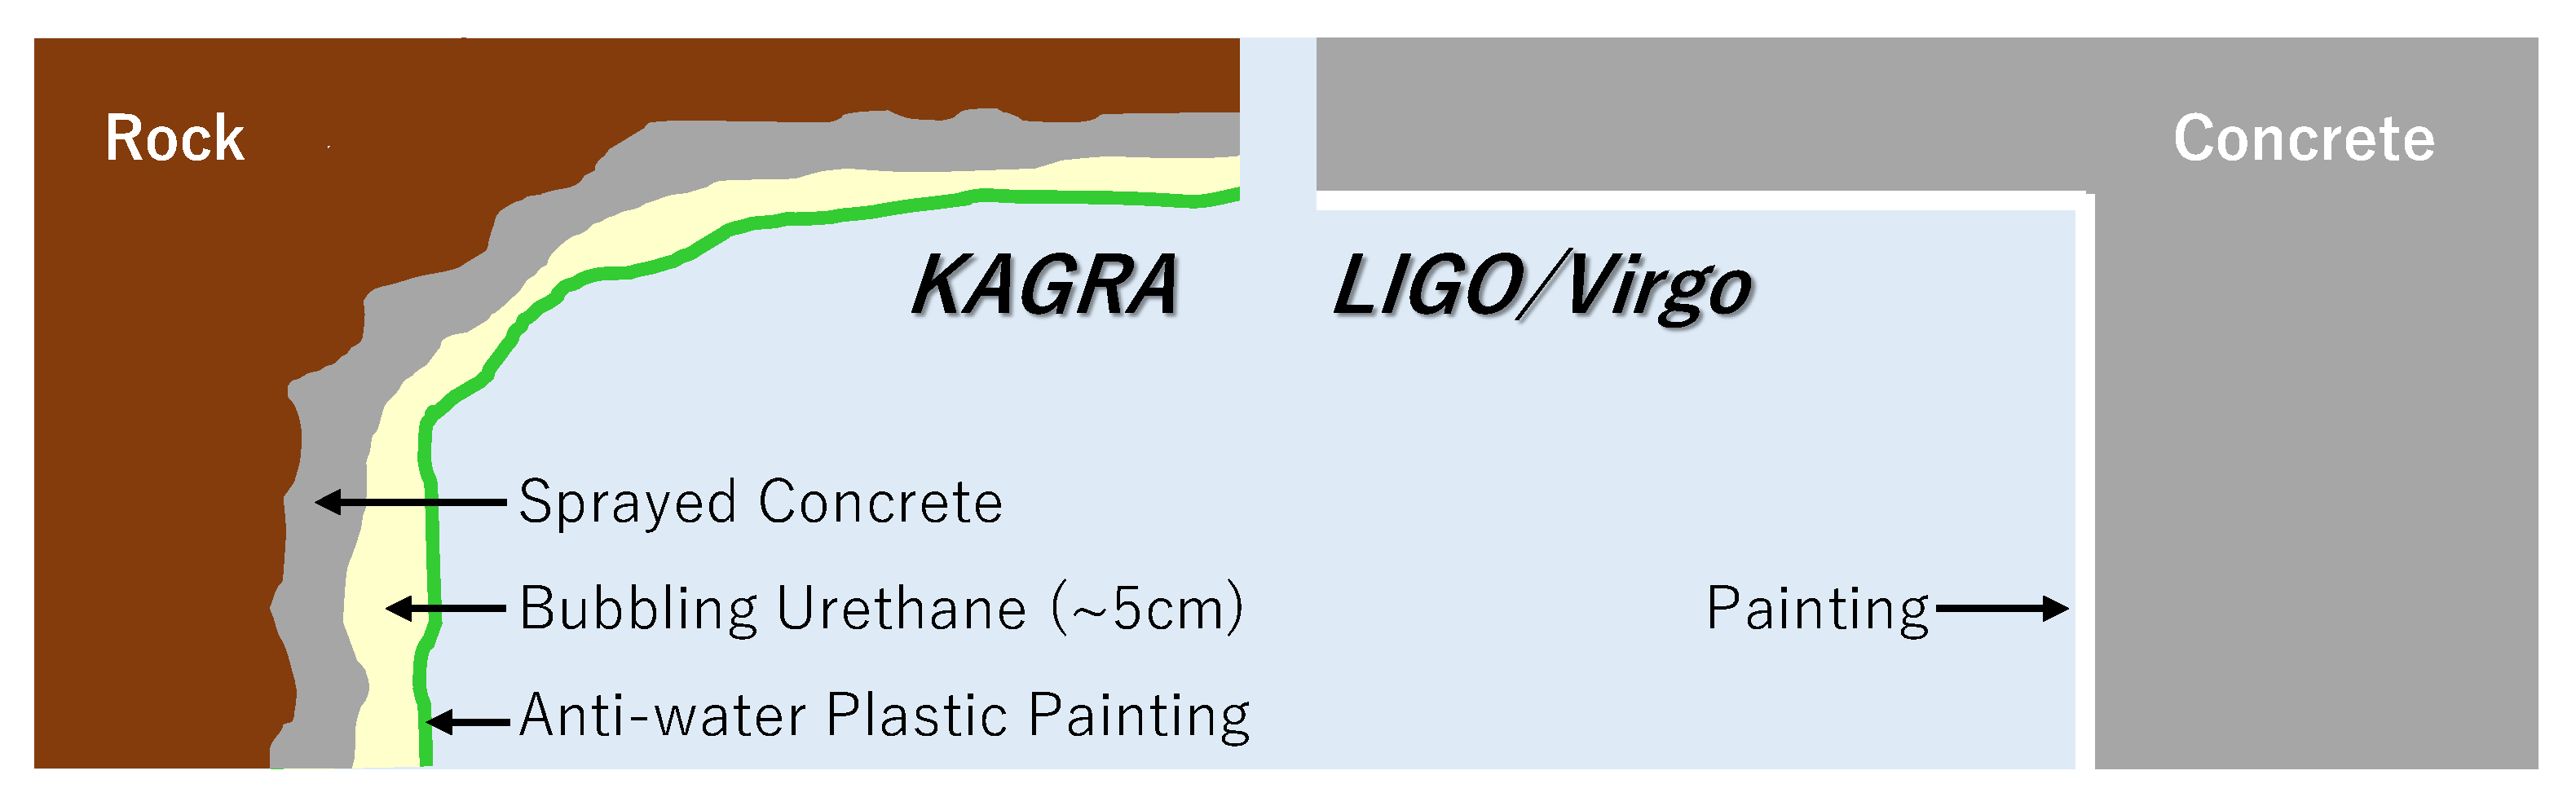
4.2. Acoustic Field
4.3. Magnetic Field
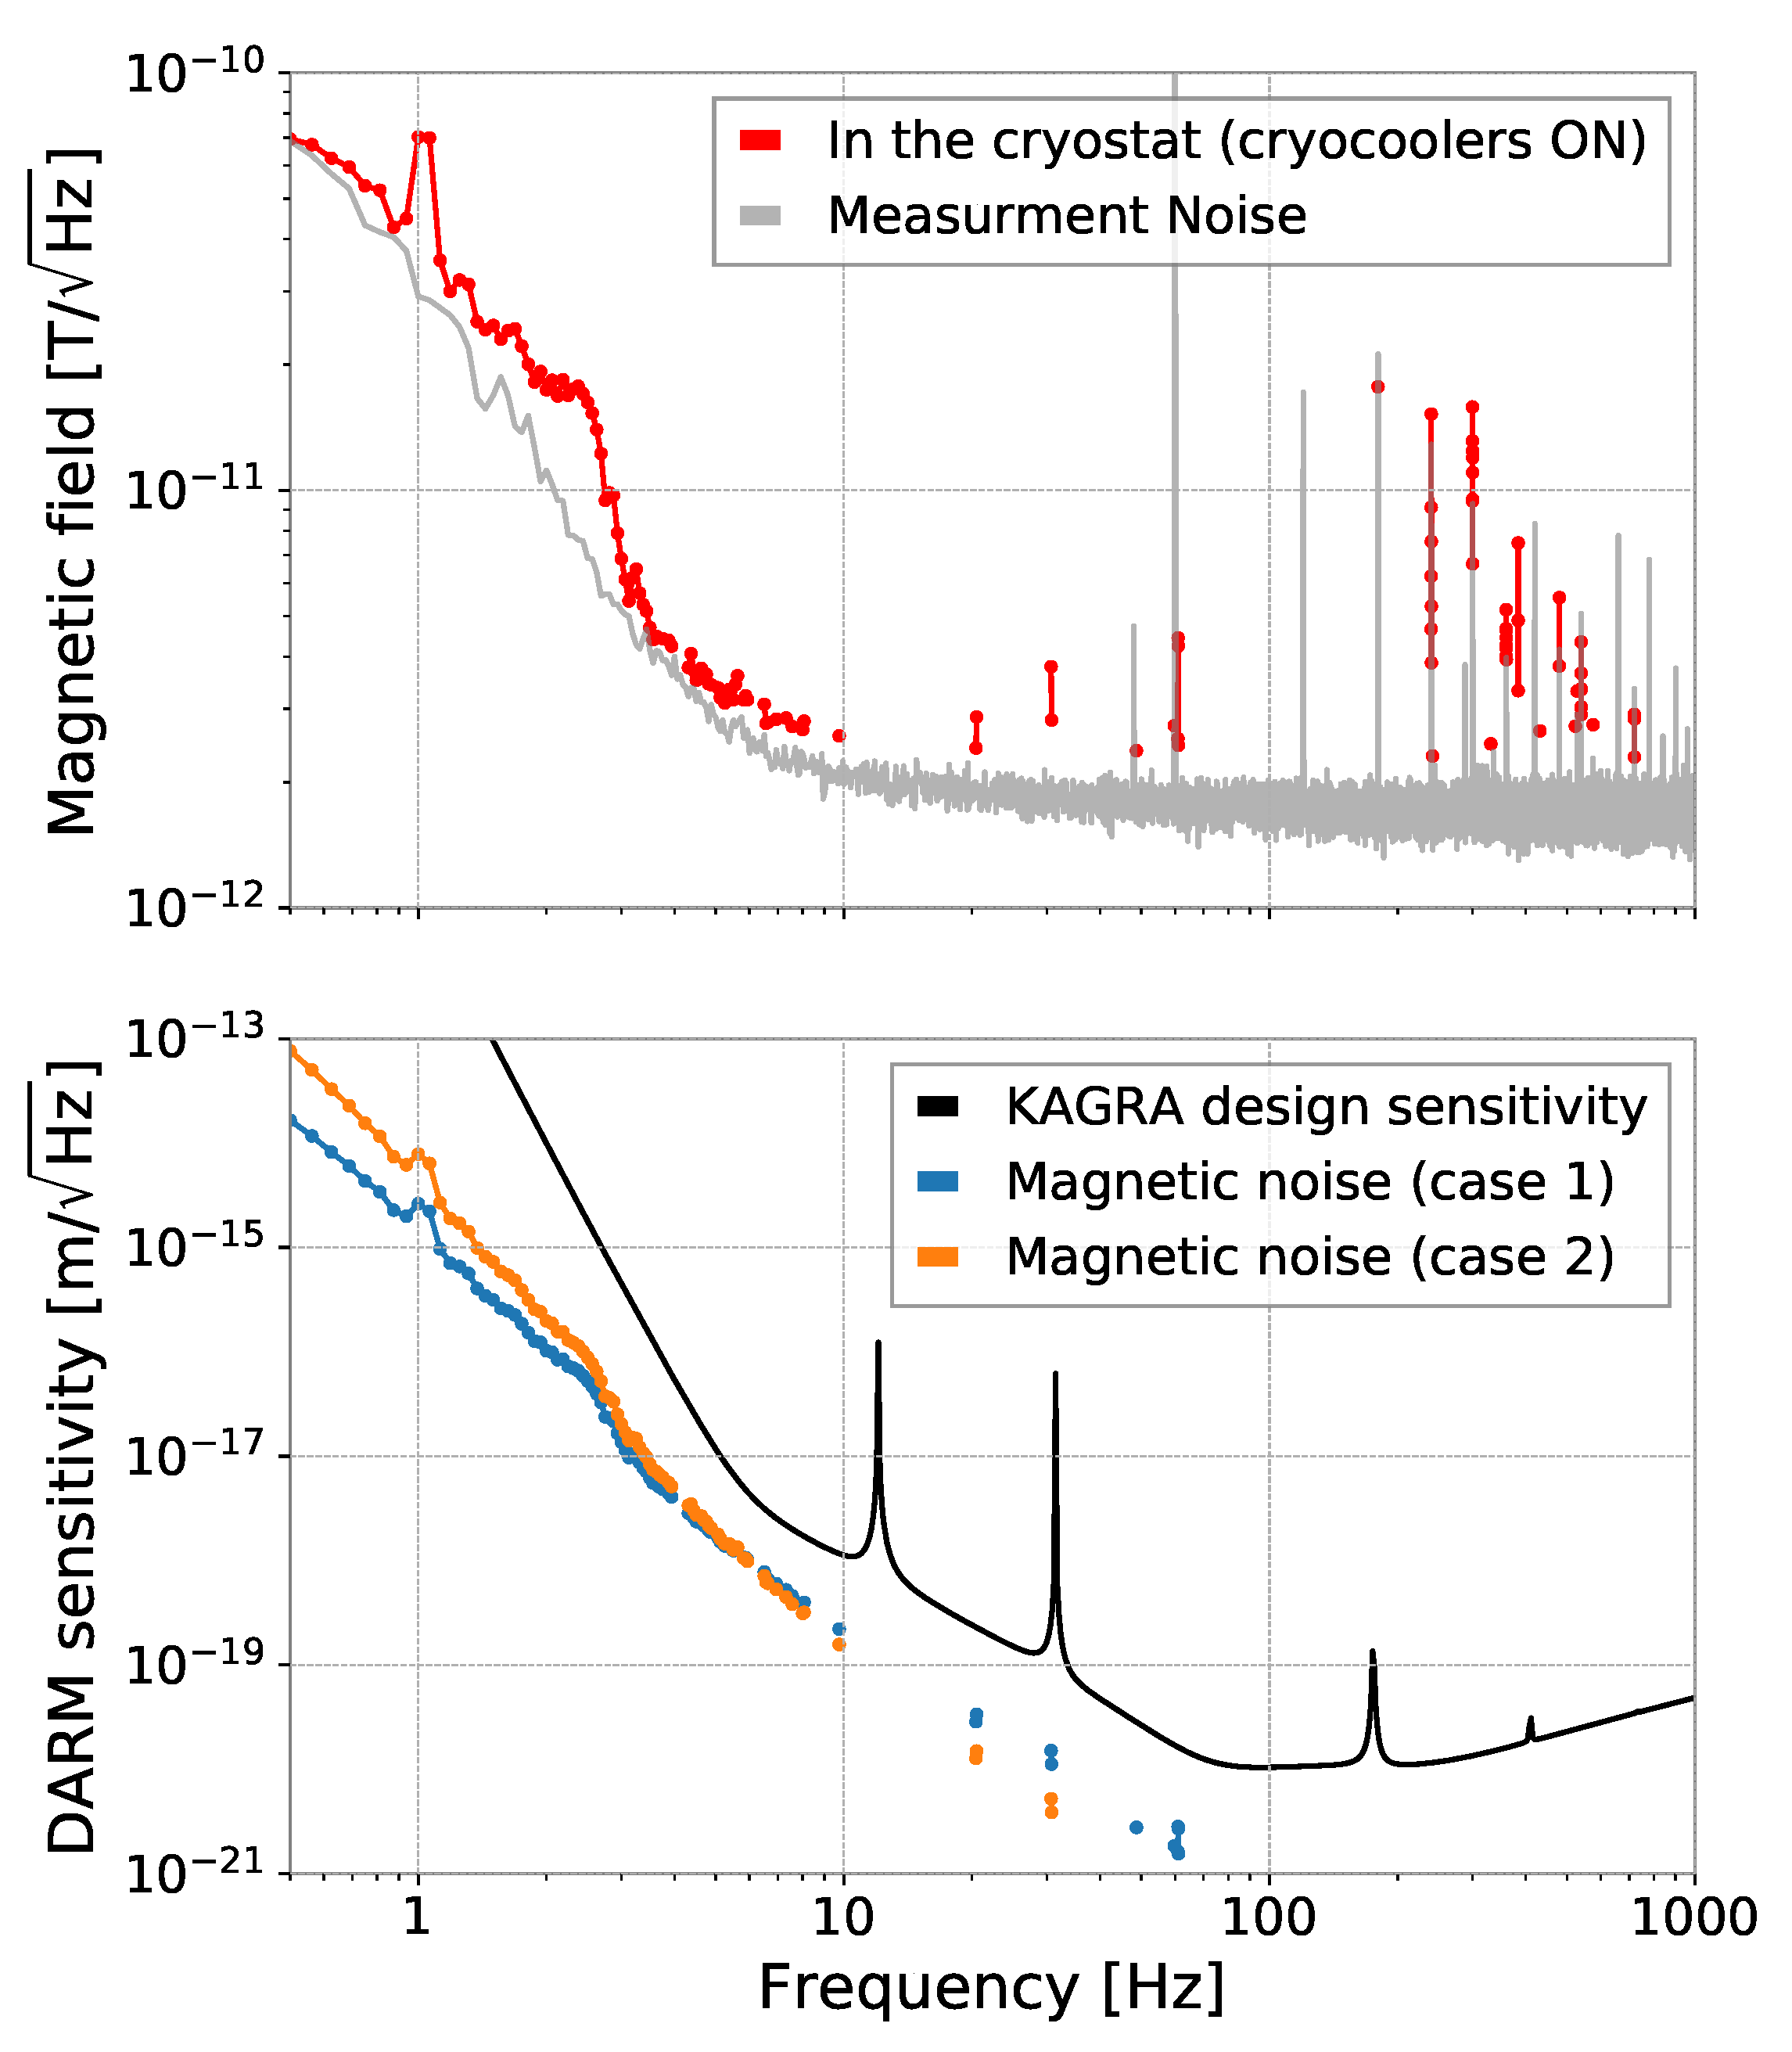
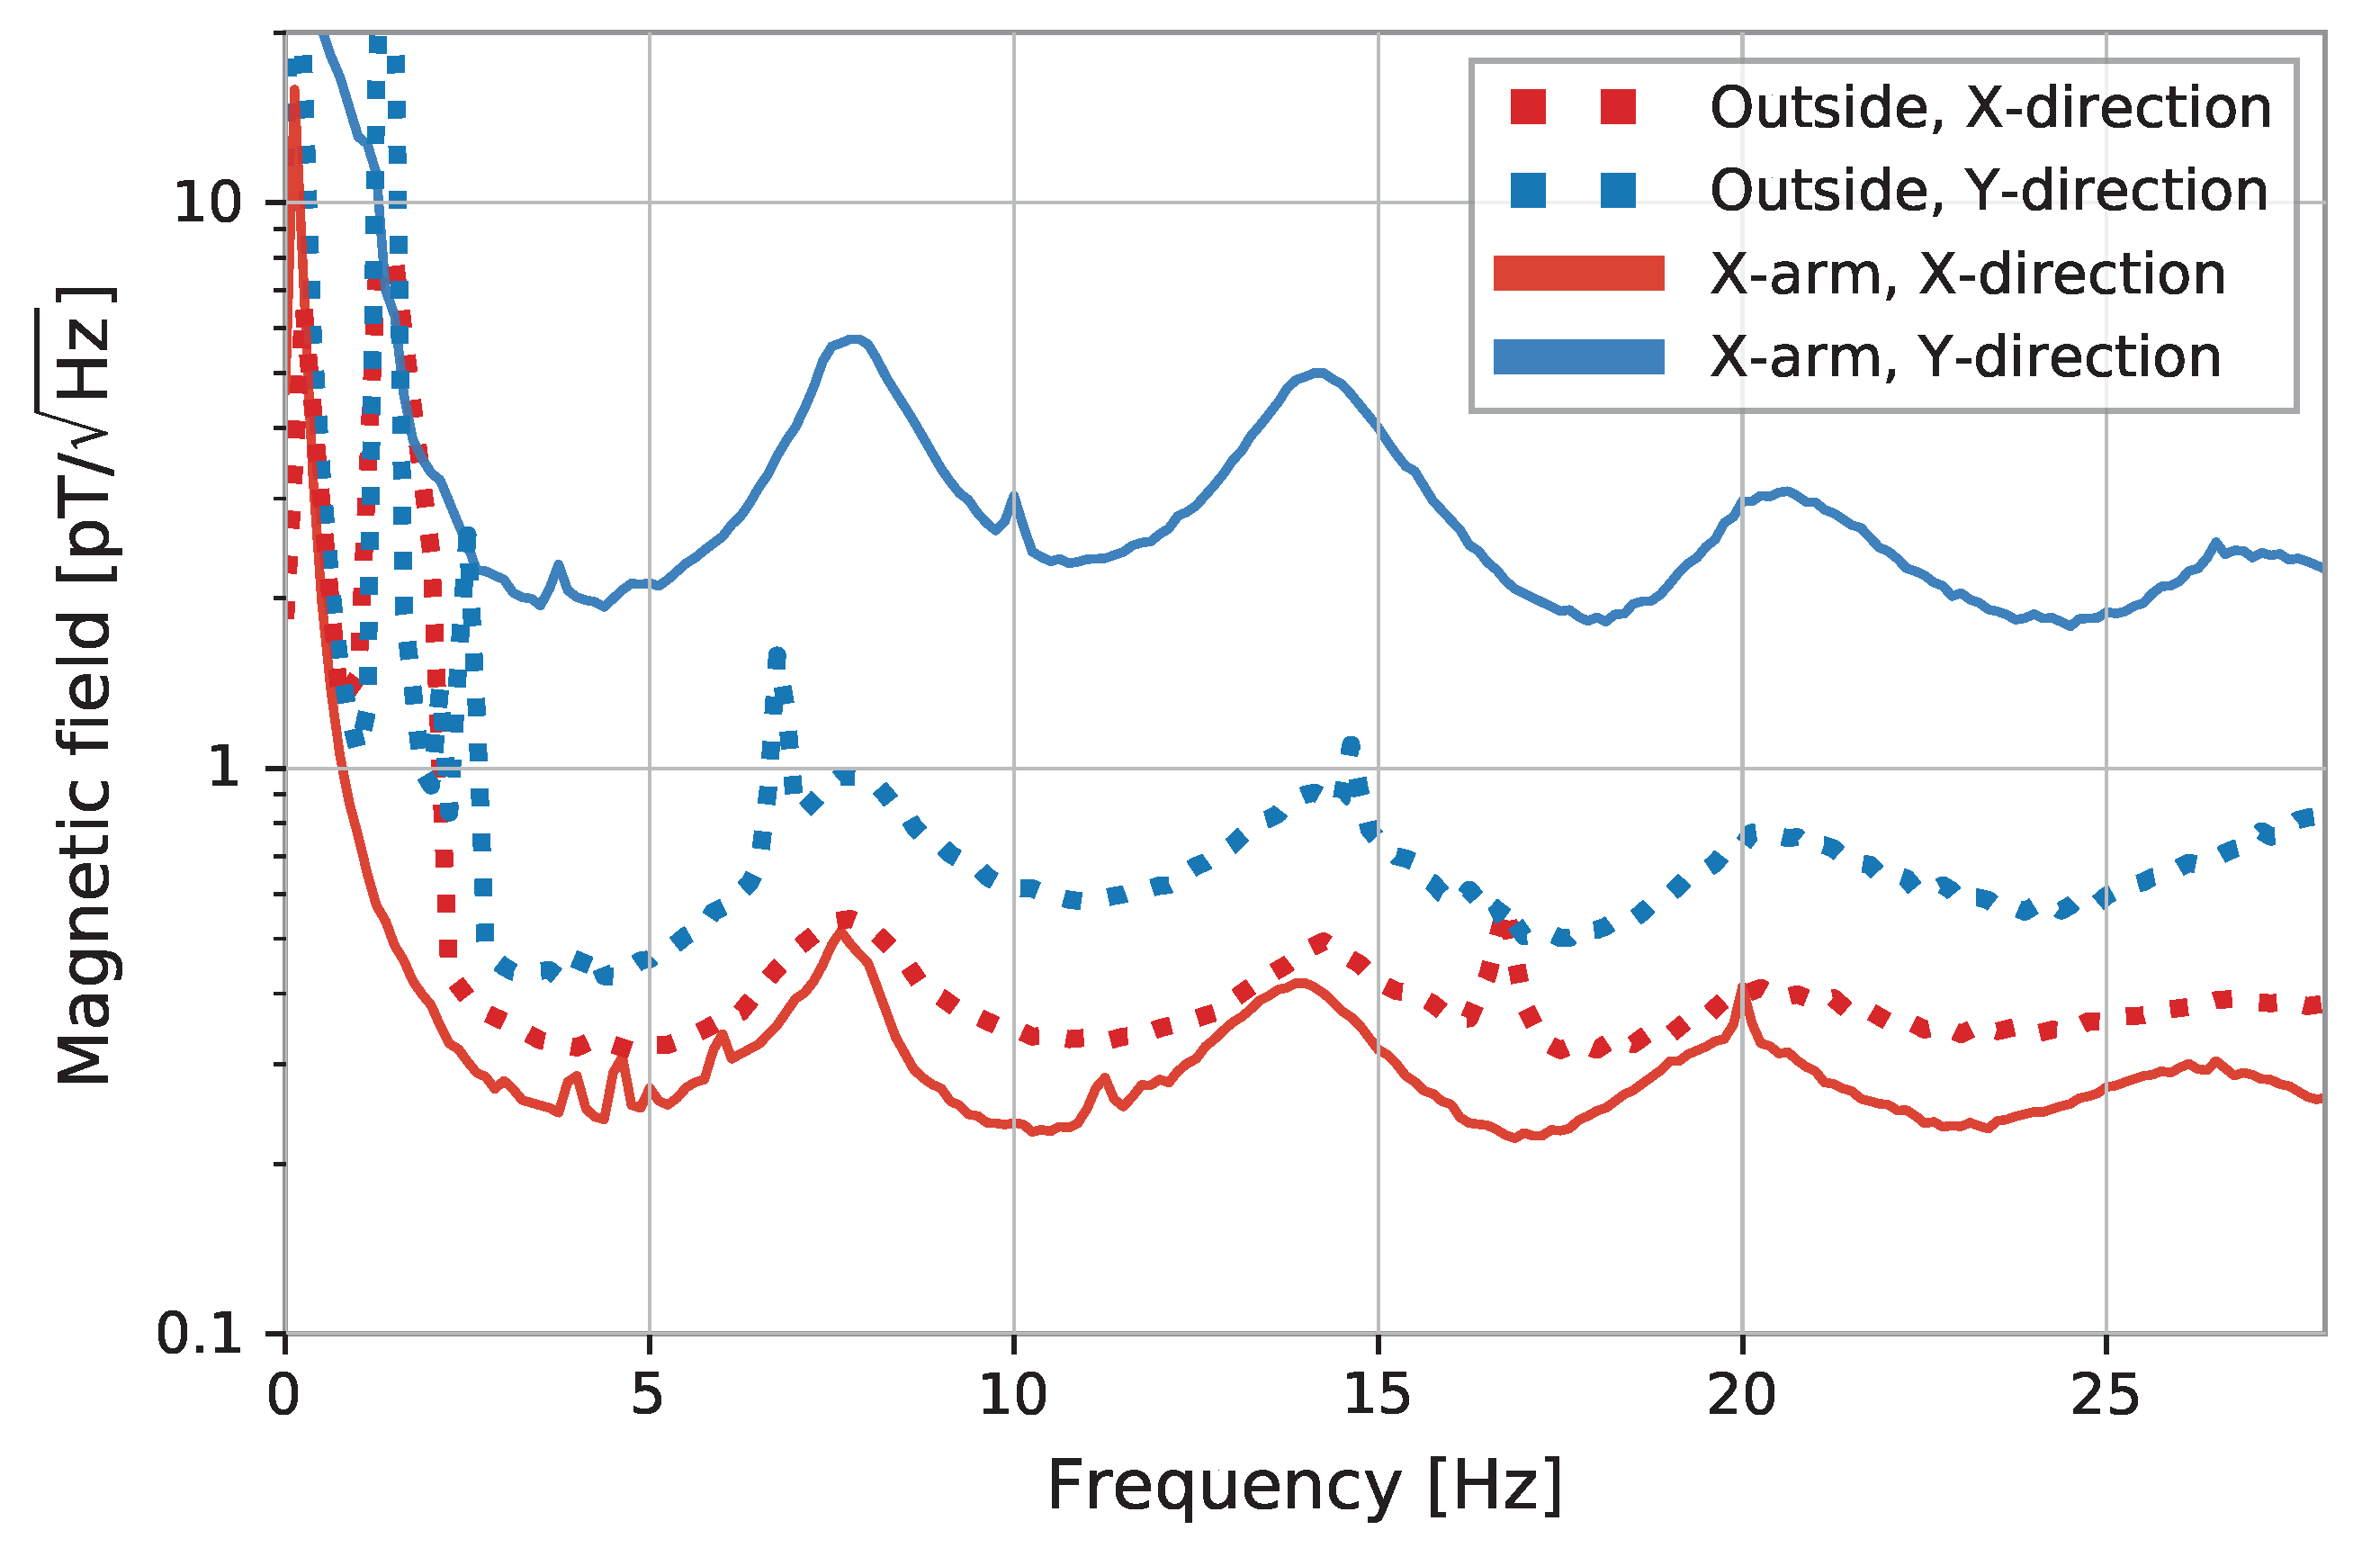
4.3.1. Magnetic Noise Estimation
4.3.2. Schumann Resonance
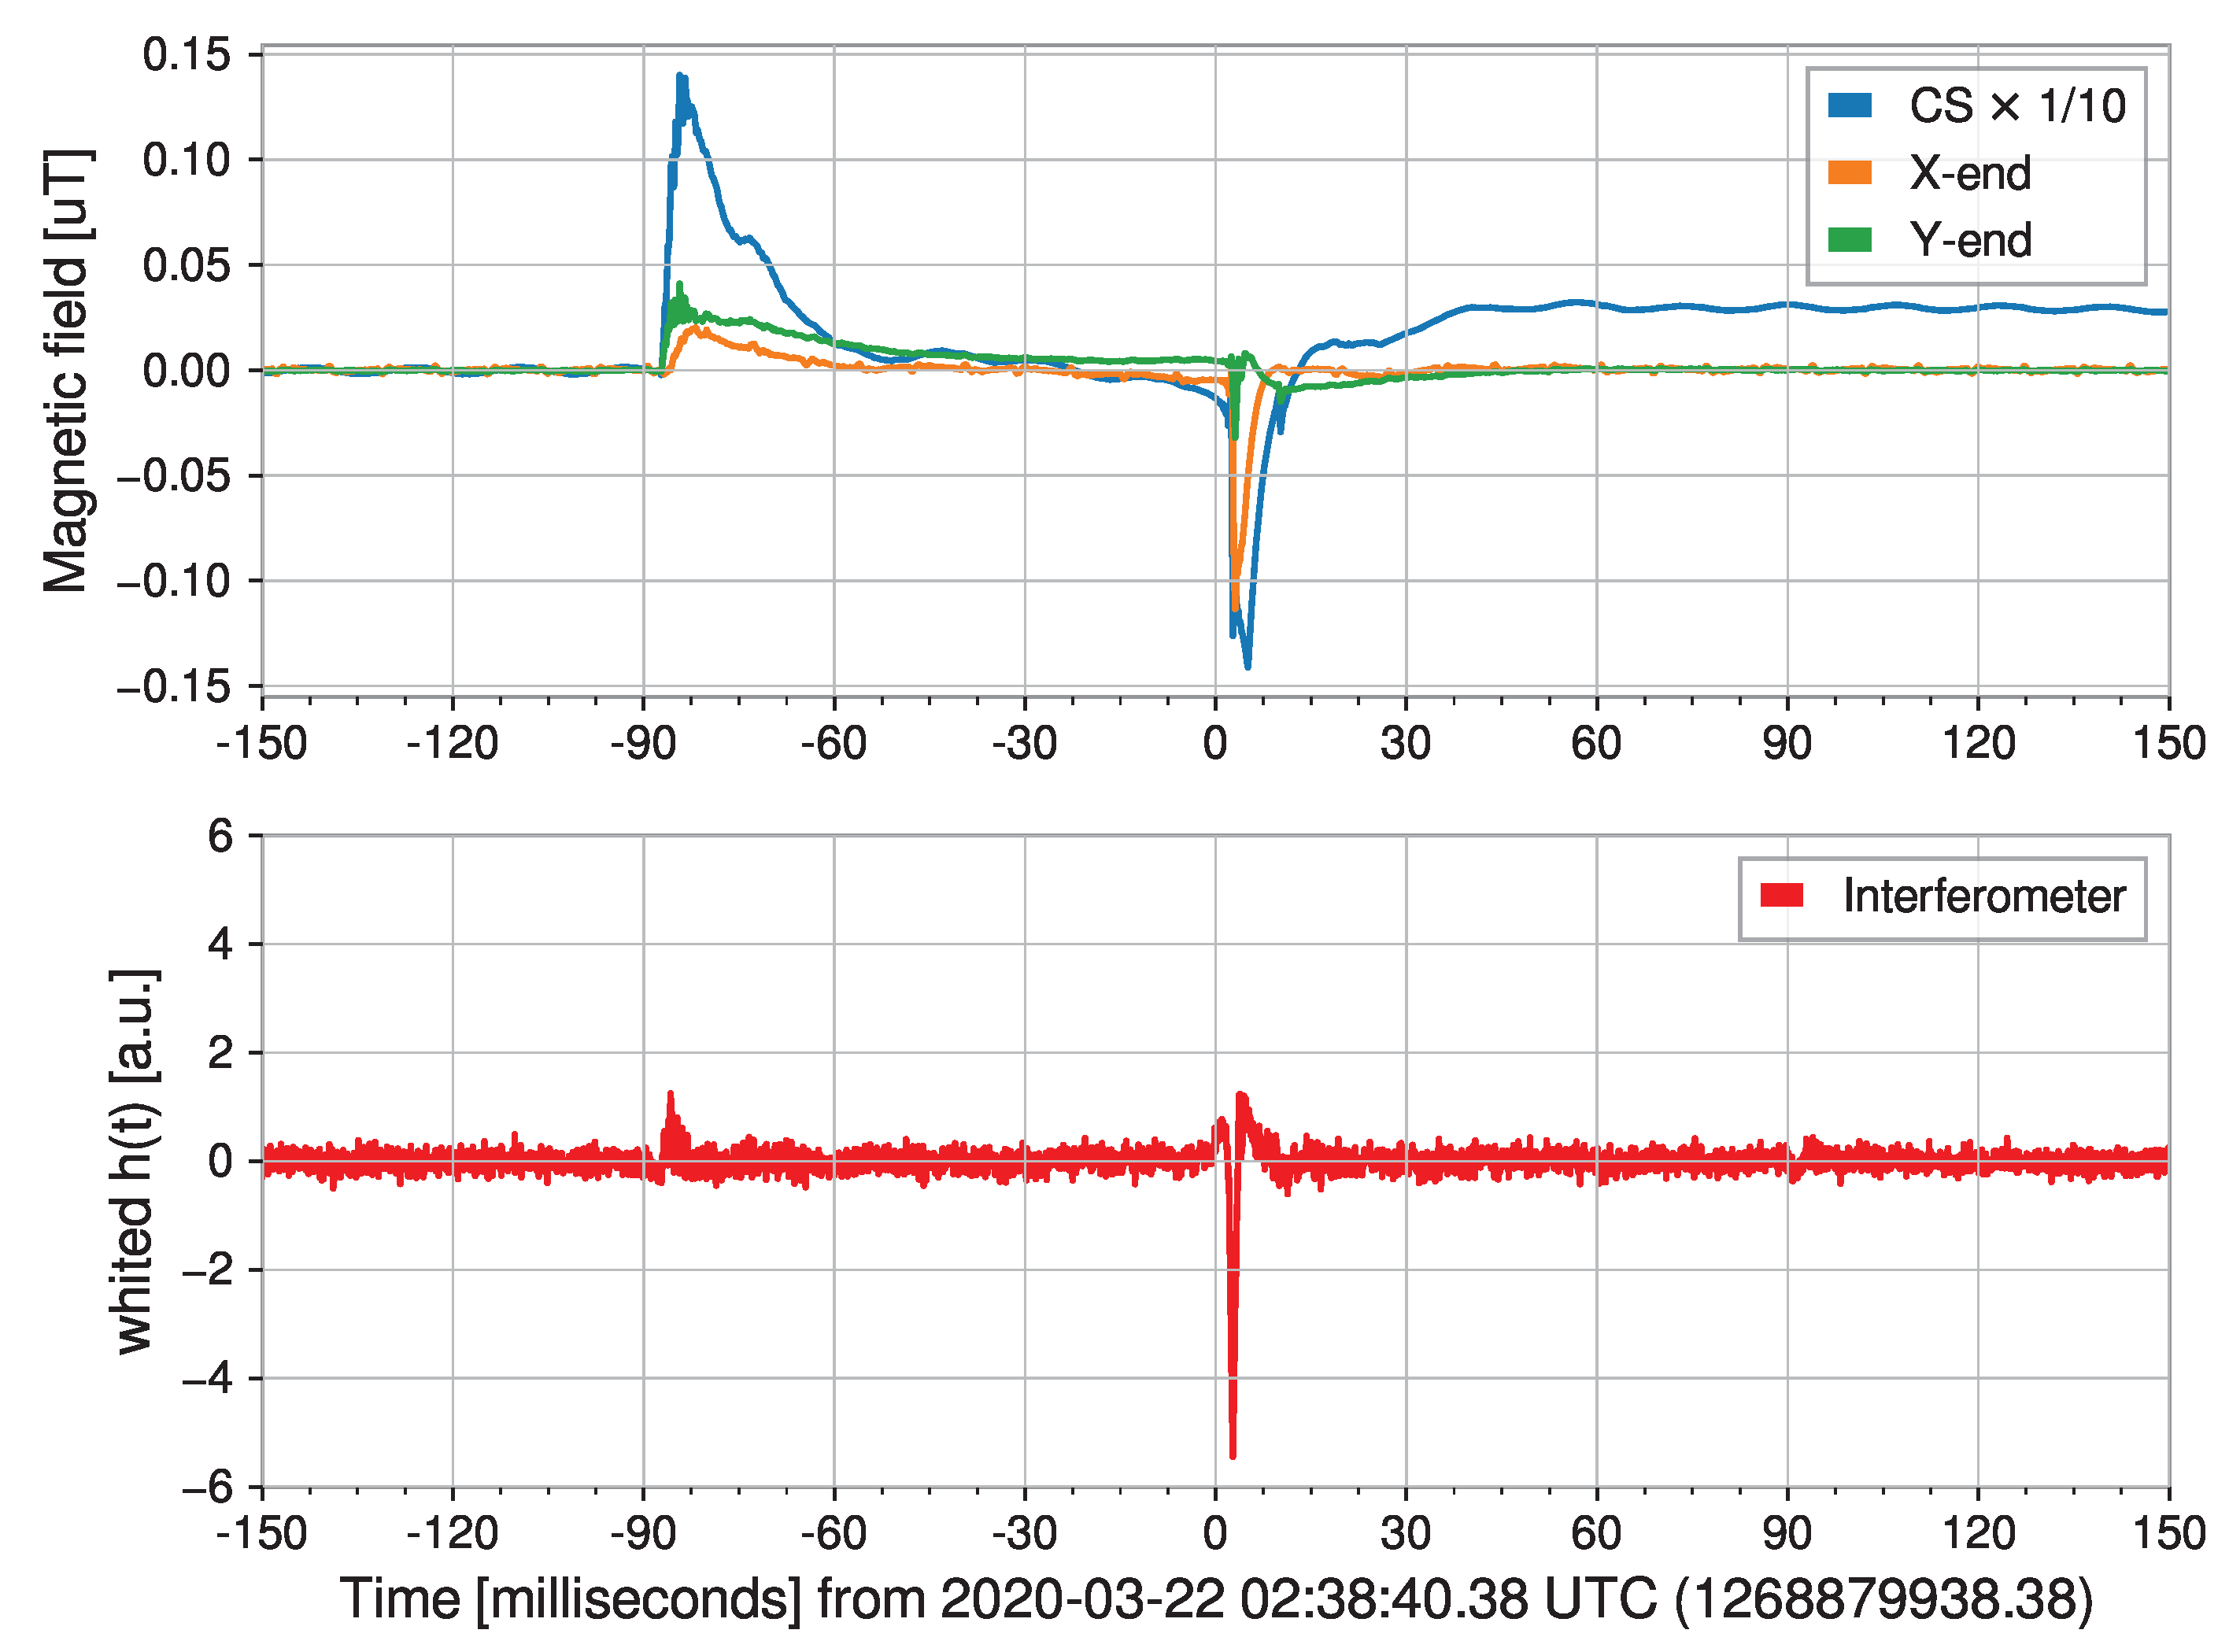
4.3.3. Transient Magnetic Noise from Lightning Strikes
4.4. Facility Issues
5. Future Plan
6. Conclusions
Author Contributions
Funding
Institutional Review Board Statement
Informed Consent Statement
Data Availability Statement
Acknowledgments
Conflicts of Interest
References
- The LIGO Scientific Collaboration. Advanced LIGO. Class. Quantum Gravity 2015, 32, 074001. [Google Scholar] [CrossRef]
- Acernese, F.; Agathos, M.; Agatsuma, K.; Aisa, D.; Allemandou, N.; Allocca, A.; Amarni, J.; Astone, P.; Balestri, G.; Ballardin, G.; et al. Advanced Virgo: A second-generation interferometric gravitational wave detector. Class. Quantum Gravity 2014, 32, 024001. [Google Scholar] [CrossRef] [Green Version]
- Dooley, K.; Leong, J.; Adams, T.; Affeldt, C.; Bisht, A.; Bogan, C.; Degallaix, J.; Gräf, C.; Hild, S.; Hough, J.; et al. GEO 600 and the GEO-HF upgrade program: Successes and challenges. Class. Quantum Gravity 2015, 33. [Google Scholar] [CrossRef] [Green Version]
- LIGO Scientific Collaboration; Virgo Collaboration. Observation of Gravitational Waves from a Binary Black Hole Merger. Phys. Rev. Lett. 2016, 116, 061102. [Google Scholar] [CrossRef] [PubMed]
- LIGO Scientific Collaboration; Virgo Collaboration. GWTC-1: A Gravitational-Wave Transient Catalog of Compact Binary Mergers Observed by LIGO and Virgo during the First and Second Observing Runs. Phys. Rev. X 2019, 9, 031040. [Google Scholar] [CrossRef] [Green Version]
- LIGO Scientific Collaboration; Virgo Collaboration. GWTC-2: Compact Binary Coalescences Observed by LIGO and Virgo during the First Half of the Third Observing Run. Phys. Rev. X 2021, 11, 021053. [Google Scholar] [CrossRef]
- LIGO Scientific Collaboration; Virgo Collaboration. GW170817: Observation of Gravitational Waves from a Binary Neutron Star Inspiral. Phys. Rev. Lett. 2017, 119, 161101. [Google Scholar] [CrossRef] [Green Version]
- KAGRA Collaboration. Overview of KAGRA: Detector design and construction history. Prog. Theor. Exp. Phys. 2020, 2021, 05A101. [Google Scholar] [CrossRef]
- Maggiore, M.; Broeck, C.V.D.; Bartolo, N.; Belgacem, E.; Bertacca, D.; Bizouard, M.A.; Branchesi, M.; Clesse, S.; Foffa, S.; García-Bellido, J.; et al. Science case for the Einstein telescope. J. Cosmol. Astropart. Phys. 2020, 2020, 050. [Google Scholar] [CrossRef] [Green Version]
- Reitze, D.; Adhikari, R.X.; Ballmer, S.; Barish, B.; Barsotti, L.; Billingsley, G.; Brown, D.A.; Chen, Y.; Coyne, D.; Eisenstein, R.; et al. Contribution to Gravitational-Wave Astronomy beyond LIGO. Bull. AAS 2019, 51, 1–12. Available online: https://baas.aas.org/pub/2020n7i035 (accessed on 17 April 2022).
- Fukuda, S.; Fukuda, Y.; Hayakawa, T.; Ichihara, E.; Ishitsuka, M.; Itow, Y.; Kajita, T.; Kameda, J.; Kaneyuki, K.; Kasuga, S.; et al. The Super-Kamiokande detector. Nucl. Instrum. Methods Phys. Res. Sect. A 2003, 501, 418–462. [Google Scholar] [CrossRef]
- Suekane, F. The 1000ton liquid scintillation detector project at Kamioka (Kam-LAND). AIP Conf. Proc. 1997, 412, 969–975. [Google Scholar] [CrossRef] [Green Version]
- Umehara, S.; Kishimoto, T.; Nomachi, M.; Ajimura, S.; Iida, T.; Takemoto, Y.; Matsuoka, K.; Trang, V.T.T.; Yoshida, S.; Wang, W.; et al. Search For Neutrino-less Double Beta Decay Of 48Ca- Candles. Proc. Sci. 2017, 281, 246. [Google Scholar] [CrossRef] [Green Version]
- Nakamura, K.; Miuchi, K.; Tanimori, T.; Kubo, H.; Nishimura, H.; Parker, J.D.; Takada, A.; Mizumoto, T.; Sawano, T.; Matsuoka, Y.; et al. NEWAGE—Direction-sensitive Dark Matter Search Experiment. Phys. Procedia 2015, 61, 737–741. [Google Scholar] [CrossRef] [Green Version]
- Fushimi, K.I.; Chernyak, D.; Ejiri, H.; Hata, K.; Hazama, R.; Hirata, S.; Iida, T.; Ikeda, H.; Inoue, K.; Imagawa, K.; et al. PICOLON dark matter search development of highly redio-pure NaI(Tl) scintilltor. J. Phys. Conf. Ser. 2020, 1468, 012057. [Google Scholar] [CrossRef]
- Abe, K.; Hieda, K.; Hiraide, K.; Hirano, S.; Kishimoto, Y.; Kobayashi, K.; Moriyama, S.; Nakagawa, K.; Nakahata, M.; Nishiie, H.; et al. XMASS detector. Nucl. Instrum. Methods Phys. Res. Sect. A 2013, 716, 78–85. [Google Scholar] [CrossRef] [Green Version]
- Uchiyama, T.; Miyoki, S.; Telada, S.; Yamamoto, K.; Ohashi, M.; Agatsuma, K.; Arai, K.; Fujimoto, M.; Haruyama, T.; Kawamura, S.; et al. Reduction of thermal fluctuations in a cryogenic laser interferometric gravitational wave detector. Phys. Rev. Lett. 2012, 108, 141101. [Google Scholar] [CrossRef] [Green Version]
- Katsumata, K. Seismic attenuation and low-velocity anomalies under the Hida mountain range. Chikyu Mon. 1996, 18, 109–115. (In Japanese) [Google Scholar]
- Gennai, N.; Hiramatsu, Y.; Kono, Y. Three-dimensional Distribution of an Extremely Low-Density Body Beneath the Hida Mountains, Central Japan, as Estimated from Gravity Anomalies. Kazan 2002, 47, 411–418. (In Japanese) [Google Scholar] [CrossRef]
- KAGARA Gallery. Available online: https://gwcenter.icrr.u-tokyo.ac.jp/kagra-gallery (accessed on 17 April 2022).
- Meers, B.J. Recycling in laser-interferometric gravitational-wave detectors. Phys. Rev. D 1988, 38, 2317–2326. [Google Scholar] [CrossRef] [Green Version]
- KAGRA Collaboration. The status of KAGRA underground cryogenic gravitational wave telescope. J. Phys. Conf. Ser. 2020, 1342, 012014. [Google Scholar] [CrossRef]
- Mizuno, J.; Strain, K.; Nelson, P.; Chen, J.; Schilling, R.; Rüdiger, A.; Winkler, W.; Danzmann, K. Resonant sideband extraction: A new configuration for interferometric gravitational wave detectors. Phys. Lett. A 1993, 175, 273–276. [Google Scholar] [CrossRef] [Green Version]
- Kawamura, S.; Nakano, M. Chapter 2: Interferometer configuration and response. In Advanced Interferometric Gravitational-Wave Detectors; World Scientific Publishing: Hackensack, NJ, USA, 2019; pp. 33–58. [Google Scholar] [CrossRef]
- KAGRA Official Sensitivity Limit. Available online: https://gwcenter.icrr.u-tokyo.ac.jp/en/researcher/parameter (accessed on 17 April 2022).
- Saulson, P.R. Thermal noise in mechanical experiments. Phys. Rev. D 1990, 42, 2437–2445. [Google Scholar] [CrossRef] [PubMed]
- KAGRA Collaboration. Construction of KAGRA: An underground gravitational-wave observatory. Prog. Theor. Exp. Phys. 2018, 2018, 013F01. [Google Scholar] [CrossRef]
- Sato, S.; Miyoki, S.; Telada, S.; Tatsumi, D.; Araya, A.; Ohashi, M.; Totsuka, Y.; Fukushima, M.; Fujimoto, M. Ultrastable performance of an underground-based laser interferometer observatory for gravitational waves. Phys. Rev. D 2004, 69, 102005. [Google Scholar] [CrossRef] [Green Version]
- Takahashi, R.; The TAMA Collaboration. Status of TAMA300. Class. Quantum Gravity 2004, 21, S403–S408. [Google Scholar] [CrossRef]
- Virgo Collaboration. Virgo: A laser interferometer to detect gravitational waves. J. Instrum. 2012, 7, P03012. [Google Scholar] [CrossRef]
- Uchiyama, T.; Tomaru, T.; Tobar, M.E.; Tatsumi, D.; Miyoki, S.; Ohashi, M.; Kuroda, K.; Suzuki, T.; Sato, N.; Haruyama, T.; et al. Mechanical quality factor of a cryogenic sapphire test mass for gravitational wave detectors. Phys. Lett. Sect. A 1999, 261, 5–11. [Google Scholar] [CrossRef]
- Khalaidovski, A.; Hofmann, G.; Chen, D.; Komma, J.; Schwarz, C.; Tokoku, C.; Kimura, N.; Suzuki, T.; Scheie, A.O.; Majorana, E.; et al. Evaluation of heat extraction through sapphire fibers for the GW observatory KAGRA. Class. Quantum Gravity 2014, 31, 105004. [Google Scholar] [CrossRef] [Green Version]
- Hirose, E.; Billingsley, G.; Zhang, L.; Yamamoto, H.; Pinard, L.; Michel, C.; Forest, D.; Reichman, B.; Gross, M. Characterization of Core Optics in Gravitational-Wave Detectors: Case Study of KAGRA Sapphire Mirrors. Phys. Rev. Appl. 2020, 14, 014021. [Google Scholar] [CrossRef]
- Yamada, T.; Tomaru, T.; Suzuki, T.; Ushiba, T.; Kimura, N.; Takada, S.; Inoue, Y.; Kajita, T. High performance thermal link with small spring constant for cryogenic applications. Cryogenics 2021, 116, 103280. [Google Scholar] [CrossRef]
- Ikushima, Y.; Li, R.; Tomaru, T.; Sato, N.; Suzuki, T.; Haruyama, T.; Shintomi, T.; Yamamoto, A. Ultra-low-vibration pulse-tube cryocooler system-cooling capacity and vibration. Cryogenics 2008, 48, 406–412. [Google Scholar] [CrossRef]
- Georgescu, I. O3 highlights. Nat. Rev. Phys. 2020, 2, 222–223. [Google Scholar] [CrossRef] [PubMed] [Green Version]
- KAGRA Collaboration. Performance of the KAGRA detector during the first joint observation with GEO 600 (O3GK). arXiv 2022, arXiv:2203.07011, arXiv:2203.07011. [Google Scholar]
- LIGO, Virgo and Kagra Observing Run Plans. Available online: https://www.ligo.caltech.edu/news/ligo20211115 (accessed on 17 April 2022).
- Ushiba, T.; Akutsu, T.; Araki, S.; Bajpai, R.; Chen, D.; Craig, K.; Enomoto, Y.; Hagiwara, A.; Haino, S.; Inoue, Y.; et al. Cryogenic suspension design for a kilometer-scale gravitational-wave detector. Class. Quantum Gravity 2021, 38, 085013. [Google Scholar] [CrossRef]
- Zeidler, S.; Length-Sensing OpLevs for KAGRA. Technical Report, JGW-T1605788-v11. Available online: https://gwdoc.icrr.u-tokyo.ac.jp/cgi-bin/DocDB/ShowDocument?docid=5788 (accessed on 17 April 2022).
- Hasegawa, K.; Akutsu, T.; Kimura, N.; Saito, Y.; Suzuki, T.; Tomaru, T.; Ueda, A.; Miyoki, S. Molecular adsorbed layer formation on cooled mirrors and its impacts on cryogenic gravitational wave telescopes. Phys. Rev. D 2019, 99, 22003. [Google Scholar] [CrossRef] [Green Version]
- KAGRA Collaboration. Overview of KAGRA: Calibration, detector characterization, physical environmental monitors, and the geophysics interferometer. Prog. Theor. Exp. Phys. 2021, 2021, 05A102. [Google Scholar] [CrossRef]
- Ports and Harbours Bureau, Ministry of Land, Infrastructure and Transport, Japan. NOWPHAS: Nationwide Ocean Wave information network for Ports and HArbourS. 2021. Available online: https://www.mlit.go.jp/kowan/nowphas/index_eng.html (accessed on 17 April 2022).
- Fujikawa, Y. Development of Cause Estimation System for Interferometer Lock Loss in Large-Scale Cryogenic Gravitational Waves Telescope, KAGRA. Master’s Thesis, Niigata University, Niigata, Japan, 2020. (In Japanese). [Google Scholar]
- Harms, J. Terrestrial gravity fluctuations. Living Rev. Relativ. 2019, 18, 3. [Google Scholar] [CrossRef]
- Badaracco, F.; Harms, J.; Rossi, C.D.; Fiori, I.; Miyo, K.; Tanaka, T.; Yokozawa, T.; Paoletti, F.; Washimi, T. KAGRA underground environment and lessons for the Einstein Telescope. Phys. Rev. D 2021, 104, 042006. [Google Scholar] [CrossRef]
- Washimi, T.; Yokozawa, T.; Tanaka, T.; Itoh, Y.; Kume, J.; Yokoyama, J. Method for environmental noise estimation via injection tests for ground-based gravitational wave detectors. Class. Quantum Gravity 2021, 38, 125005. [Google Scholar] [CrossRef]
- Washimi, T. Status of KAGRA physical environmental monitors toward the O3. In Proceedings of the 6th KAGRA International Workshop, Wuhan, China, 21 June 2019. [Google Scholar]
- Fenyvesi, E.; Molnár, J.; Czellár, S. Investigation of Infrasound Background Noise at Mátra Gravitational and Geophysical Laboratory (MGGL). Universe 2020, 6, 10. [Google Scholar] [CrossRef] [Green Version]
- Thrane, E.; Christensen, N.; Schofield, R.M.S.; Effler, A. Correlated noise in networks of gravitational-wave detectors: Subtraction and mitigation. Phys. Rev. D 2014, 90, 023013. [Google Scholar] [CrossRef] [Green Version]
- Cirone, A.; Fiori, I.; Paoletti, F.; Perez, M.M.; Rodríguez, A.R.; Swinkels, B.L.; Vazquez, A.M.; Gemme, G.; Chincarini, A. Investigation of magnetic noise in advanced Virgo. Class. Quantum Gravity 2019, 36, 225004. [Google Scholar] [CrossRef] [Green Version]
- Himemoto, Y.; Taruya, A. Impact of correlated magnetic noise on the detection of stochastic gravitational waves: Estimation based on a simple analytical model. Phys. Rev. D 2017, 96, 022004. [Google Scholar] [CrossRef] [Green Version]
- Himemoto, Y.; Taruya, A. Correlated magnetic noise from anisotropic lightning sources and the detection of stochastic gravitational waves. Phys. Rev. D 2019, 100, 082001. [Google Scholar] [CrossRef] [Green Version]
- Atsuta, S.; Ogawa, T.; Yamaguchi, S.; Hayama, K.; Araya, A.; Kanda, N.; Miyakawa, O.; Miyoki, S.; Nishizawa, A.; Ono, K.; et al. Measurement of Schumann Resonance at Kamioka. J. Phys. 2016, 716, 012020. [Google Scholar] [CrossRef]
- Coughlin, M.W.; Cirone, A.; Meyers, P.; Atsuta, S.; Bosch, V.; Chincarini, A.; Christensen, N.L.; Rosa, R.D.; Effler, A.; Fiori, I.; et al. Measurement and subtraction of Schumann resonances at gravitational-wave interferometers. Phys. Rev. D 2018, 97, 102007. [Google Scholar] [CrossRef] [Green Version]
- Washimi, T.; Yokozawa, T.; Nakano, M.; Tanaka, T.; Kaihotsu, K.; Mori, Y.; Narita, T. Effects of lightning strokes on underground gravitational waves observatories. J. Instrum. 2021, 16, P07033. [Google Scholar] [CrossRef]
- Babak, S.; Gair, J.; Sesana, A.; Barausse, E.; Sopuerta, C.F.; Berry, C.P.L.; Berti, E.; Amaro-Seoane, P.; Petiteau, A.; Klein, A. Science with the space-based interferometer LISA. V. Extreme mass-ratio inspirals. Phys. Rev. D 2017, 95, 103012. [Google Scholar] [CrossRef] [Green Version]
- Kawamura, S.; Ando, M.; Nakamura, T.; Tsubono, K.; Tanaka, T.; Funaki, I.; Seto, N.; Numata, K.; Sato, S.; Ioka, K.; et al. The Japanese space gravitational wave antenna—DECIGO. J. Phys. 2008, 122, 012006. [Google Scholar] [CrossRef]
- Luo, J.; Chen, L.S.; Duan, H.Z.; Gong, Y.G.; Hu, S.; Ji, J.; Liu, Q.; Mei, J.; Milyukov, V.; Sazhin, M.; et al. TianQin: A space-borne gravitational wave detector. Class. Quantum Gravity 2016, 33, 035010. [Google Scholar] [CrossRef] [Green Version]
- Abbott, B.P.; Abbott, R.; Abbott, T.D.; Abraham, S.; Acernese, F.; Ackley, K.; Adams, C.; Adya, V.B.; Affeldt, C.; Agathos, M.; et al. Prospects for observing and localizing gravitational-wave transients with Advanced LIGO, Advanced Virgo and KAGRA. Living Rev. Relativ. 2020, 23, 3. [Google Scholar] [CrossRef] [PubMed]
- Michimura, Y.; Komori, K.; Enomoto, Y.; Nagano, K.; Nishizawa, A.; Hirose, E.; Leonardi, M.; Capocasa, E.; Aritomi, N.; Zhao, Y.; et al. Prospects for improving the sensitivity of the cryogenic gravitational wave detector KAGRA. Phys. Rev. D 2020, 102, 022008. [Google Scholar] [CrossRef]
- Tse, M.; Yu, H.; Kijbunchoo, N.; Fernandez-Galiana, A.; Dupej, P.; Barsotti, L.; Blair, C.D.; Brown, D.D.; Dwyer, S.E.; Effler, A.; et al. Quantum-Enhanced Advanced LIGO Detectors in the Era of Gravitational-Wave Astronomy. Phys. Rev. Lett. 2019, 123, 231107. [Google Scholar] [CrossRef] [PubMed] [Green Version]
- Virgo Collaboration. Increasing the Astrophysical Reach of the Advanced Virgo Detector via the Application of Squeezed Vacuum States of Light. Phys. Rev. Lett. 2019, 123, 231108. [Google Scholar] [CrossRef] [Green Version]
- McCuller, L.; Whittle, C.; Ganapathy, D.; Komori, K.; Tse, M.; Fernandez-Galiana, A.; Barsotti, L.; Fritschel, P.; MacInnis, M.; Matichard, F.; et al. Frequency-Dependent Squeezing for Advanced LIGO. Phys. Rev. Lett. 2020, 124, 171102. [Google Scholar] [CrossRef]
- Zhao, Y.; Aritomi, N.; Capocasa, E.; Leonardi, M.; Eisenmann, M.; Guo, Y.; Polini, E.; Tomura, A.; Arai, K.; Aso, Y.; et al. Frequency-Dependent Squeezed Vacuum Source for Broadband Quantum Noise Reduction in Advanced Gravitational-Wave Detectors. Phys. Rev. Lett. 2020, 124, 171101. [Google Scholar] [CrossRef]
- Capocasa, E.; Barsuglia, M.; Degallaix, J.; Pinard, L.; Straniero, N.; Schnabel, R.; Somiya, K.; Aso, Y.; Tatsumi, D.; Flaminio, R. Estimation of losses in a 300 m filter cavity and quantum noise reduction in the KAGRA gravitational-wave detector. Phys. Rev. D 2016, 93, 082004. [Google Scholar] [CrossRef] [Green Version]
- Capocasa, E.; Guo, Y.; Eisenmann, M.; Zhao, Y.; Tomura, A.; Arai, K.; Aso, Y.; Marchiò, M.; Pinard, L.; Prat, P.; et al. Measurement of optical losses in a high-finesse 300 m filter cavity for broadband quantum noise reduction in gravitational-wave detectors. Phys. Rev. D 2018, 98, 022010. [Google Scholar] [CrossRef] [Green Version]


Publisher’s Note: MDPI stays neutral with regard to jurisdictional claims in published maps and institutional affiliations. |
© 2022 by the authors. Licensee MDPI, Basel, Switzerland. This article is an open access article distributed under the terms and conditions of the Creative Commons Attribution (CC BY) license (https://creativecommons.org/licenses/by/4.0/).
Share and Cite
Abe, H.; Akutsu, T.; Ando, M.; Araya, A.; Aritomi, N.; Asada, H.; Aso, Y.; Bae, S.; Bajpai, R.; Cannon, K.; et al. The Current Status and Future Prospects of KAGRA, the Large-Scale Cryogenic Gravitational Wave Telescope Built in the Kamioka Underground. Galaxies 2022, 10, 63. https://0-doi-org.brum.beds.ac.uk/10.3390/galaxies10030063
Abe H, Akutsu T, Ando M, Araya A, Aritomi N, Asada H, Aso Y, Bae S, Bajpai R, Cannon K, et al. The Current Status and Future Prospects of KAGRA, the Large-Scale Cryogenic Gravitational Wave Telescope Built in the Kamioka Underground. Galaxies. 2022; 10(3):63. https://0-doi-org.brum.beds.ac.uk/10.3390/galaxies10030063
Chicago/Turabian StyleAbe, Homare, Tomotada Akutsu, Masaki Ando, Akito Araya, Naoki Aritomi, Hideki Asada, Yoichi Aso, Sangwook Bae, Rishabh Bajpai, Kipp Cannon, and et al. 2022. "The Current Status and Future Prospects of KAGRA, the Large-Scale Cryogenic Gravitational Wave Telescope Built in the Kamioka Underground" Galaxies 10, no. 3: 63. https://0-doi-org.brum.beds.ac.uk/10.3390/galaxies10030063