
Study of Accretion Flow Dynamics of V404 Cygni during Its 2015 Outburst
by
 , , , and
Arghajit Jana
1,2,* ,
,
Jie-Rou Shang
3,
Dipak Debnath
2,
Sandip K. Chakrabarti
2,
Debjit Chatterjee
2,4 and
Hsiang-Kuang Chang
5 1
Physical Research Laboratory, Navrangpura, Ahmedabad 380009, India
2
Indian Centre for Space Physics, Garia Station Road, Kolkata 700084, India
3
Institute of Astronomy, National Tsing Hua University, Hsinchu 30013, Taiwan
4
Indian Institute of Astrophysics, Koramangala, Bangalore 560034, India
5
Department of Physics, National Tsing Hua University, Hsinchu 30013, Taiwan
*
Author to whom correspondence should be addressed.
Galaxies 2021, 9(2), 39; https://0-doi-org.brum.beds.ac.uk/10.3390/galaxies9020039
Submission received: 10 April 2021
/
Revised: 9 May 2021
/
Accepted: 21 May 2021
/
Published: 25 May 2021
(This article belongs to the Special Issue Global Understanding of Accretion and Ejection around Black Holes)
Abstract
:The 2015 Outburst of V404 Cygni is an unusual one with several X-ray and radio flares and rapid variation in the spectral and timing properties. The outburst occurred after 26 years of inactivity of the black hole. We study the accretion flow properties of the source during its initial phase of the outburst using Swift/XRT and Swift/BAT data in the energy range of 0.5–150 keV. We have done spectral analysis with the two component advective flow (TCAF) model fits file. Several flow parameters such as two types of accretion rates (Keplerian disk and sub-Keplerian halo), shock parameters (location and compression ratio) are extracted to understand the accretion flow dynamics. We calculated equipartition magnetic field for the outburst and found that the highest Gauss. Power density spectra (PDS) showed no break, which indicates no or very less contribution of the Keplerian disk component, which is also seen from the result of the spectral analysis. No signature of prominent quasi-periodic oscillations (QPOs) is observed in the PDS. This is due to the non-satisfaction of the condition for the resonance shock oscillation as we observed mismatch between the cooling timescale and infall timescale of the post-shock matter.
1. Introduction
Transient black hole candidates (BHCs) have two phases in their lives: the quiescence phase and the outbursting phase. They spend most of their lifetimes in the quiescence phase. A sudden rise in viscosity leads to an outburst when the X-ray intensity rises by a factor of thousands or more that of the quiescence phase. Matter from the companion star accretes to the central black hole, and in this process, gravitational potential energy is converted to heat and radiation. A black hole (BH) X-ray spectrum generally consists of two components: a multi-color blackbody and a hard power-law tail. The multi-color blackbody part is believed to originate from a Shakura-Sunyaev type standard thin disk [1]. The power-law tail is believed to originate from a Compton corona [2,3]. In the two-component advective flow (TCAF) solution, the CENBOL or CENtrifugal pressure supported BOundary Layer [4,5] replaces the Compton corona used in other models, such as disk-corona model [6,7] or evaporated disk in ADAF [8]. In this paper, we used the TCAF solution to study the accretion flow dynamics of V404 Cygni during its first outburst in 2015 after a long quiescent of ∼26 years.
V404 Cygni is one of the most studied black hole X-ray binary systems. It is also known as GS 2023+338. It was first identified as an optical nova in 1938. In 1956, another nova outburst was reported in this system [9]. In 1989, V404 Cygni went through another outburst. The 1989 outburst was discovered by the all sky monitor onboard Ginga. It is located at RA = and Dec = . After spending ∼26 years in the quiescent state, V404 Cygni went through a short but violent outburst on 15 June 2015. In December 2015, another short activity was observed [10]. The binary system V404 Cygni harbors a black hole of mass 9–12 at the center with a K-III type companion of mass ∼1 [11,12,13]. The inclination angle of the binary system is ∼ [12,13]. The orbital period of the system is days [11]. V404 Cygni is located at a distance of kpc, measured by parallax method [14]. V404 Cygni has a high spinning black hole with spin parameters [15].
The 2015 outburst of V404 Cygni was discovered on 15 June simultaneously by Swift/BAT [10] and MAXI/GSC [16]. This outburst of the source was extensively observed in multi-wavelength bands, such as in radio [17], optical [18] and X-ray [19,20]. INTEGRAL observation reported multiple X-ray flares during the outburst [19]. Several radio flares were also observed [17]. Extreme variable and rotating jet is observed during the outburst [21,22,23]. The source showed rapid changes in the spectral properties in a very short time [24]. INTEGRAL observation detected pair annihilation on 20 June 2015 [25]. FERMI/LAT detected high energy -ray jet in the source on 26 June 2015 [26]. King et al. [27] reported detection of emission lines with Chandra-HETG, indicating strong disc wind emission. Motta et al. [24] argued that a slim disk is formed at the inner accretion flow due to the super-Eddington accretion in the source.
In this paper, we study the timing and the spectral properties of V404 Cygni with combined Swift/XRT and Swift/BAT data in the broad energy range of 0.5–150 keV during the initial phase of the 2015 outburst. We have done spectral analysis with the TCAF model-based fits file to extract physical flow parameters. The nature of these model-fitted accretion flow parameters allowed us to investigate the physical reasons behind the origin of the several flares and their variability and turbulent features. We have also calculated the equipartition magnetic field and cooling time during the outburst of the source.
The paper is organized in the following way. In Section 2, we briefly discuss the disk structure prescribed by TCAF and the way flow parameters decide on the spectral shape. In Section 3, we discuss the observations and the data analysis procedure. In Section 4, we present the results of our analysis. In Section 5, we make a discussion based on our result, and finally, in Section 6, we summarize our findings.
2. TCAF Solution
TCAF configuration is based on the solution of a set of equations which govern viscous, transonic flows around a black hole [28]. In the TCAF solution, accreting flow consists of two components: ( high viscous, high angular momentum, optically thick and geometrically thin Keplerian disk flow (), ( low viscous, low angular momentum, optically thin sub-Keplerian halo flow (). The Keplerian disk accretes on the equatorial plane and is immersed within the sub-Keplerian flow. Centrifugal force rises as flow moves close to the black hole and becomes comparable with the gravitational force. Low viscous halo matter is fast-moving and forms an axisymmetric shock at the centrifugal barrier [29]. The post-shock region i.e., CENBOL ‘puffed-up’, and becomes ‘hot’. The Keplerian disk truncates at the shock location. The multi-color black body part of the observed spectrum that is formed by the soft photons is emitted from the Keplerian disk. A fraction of these soft photons are intercepted by the CENBOL. Depending on the temperature and size of the CENBOL, soft photons become hard photons through repeated inverse-Comptonization scattering at the CENBOL. Conversely, a fraction of Comptonized photons is reprocessed at the Keplerian disk and produces a reflection hump. Thus in the TCAF solution, the reflection component is self-consistently incorporated. However, a Gaussian line may be required to add if an iron emission line is present. CENBOL is also considered to be the base of the jets or outflows [30]. Toroidal magnetic flux tubes are responsible for the collimation of jet [31,32]. Oscillation of CENBOL can be triggered when the cooling and heating times inside CENBOL are similar, and the emerging photons produce the quasi-periodic oscillations (QPOs) [33,34,35] hereafter C15.
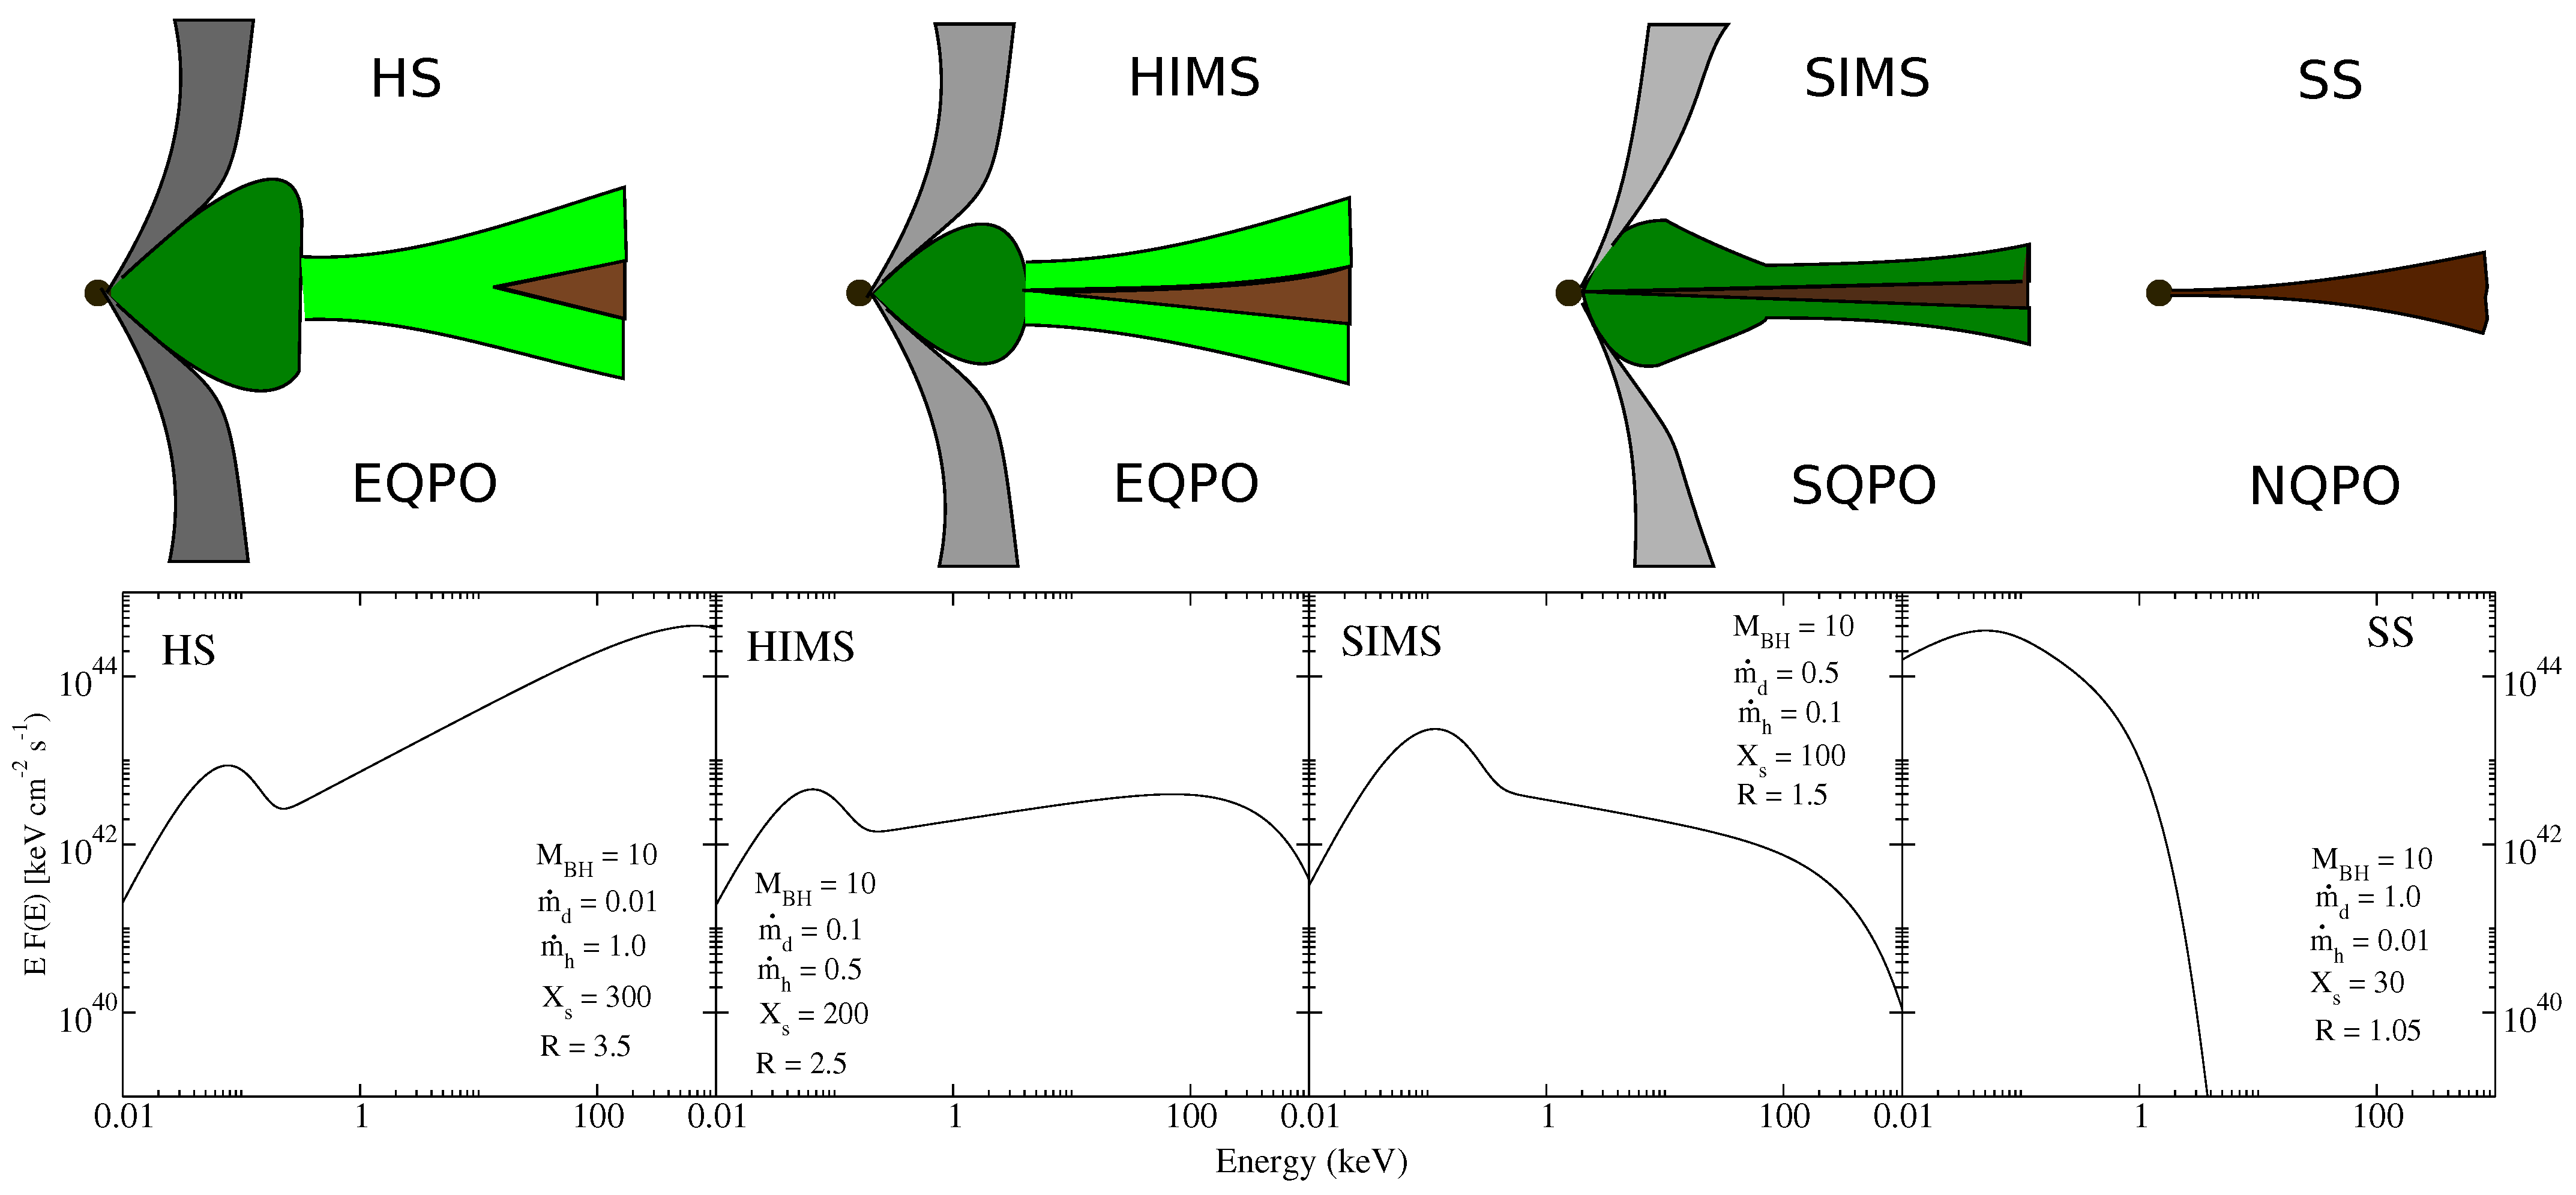
Transient BHCs generally show different spectral states during their outbursts. In TCAF, these observed spectral states are controlled by the flow parameters (two types of accretion rates and two shock parameters). A typical outbursting BHC generally goes through spectral state transitions to form a hysteresis loop as follows: hard state (HS) → hard-intermediate state (HIMS) → soft-intermediate state (SIMS) → soft state (SS) → soft-intermediate state (SIMS) → hard-intermediate state (HIMS) → hard state (HS) [36,37]. In the upper panel of Figure 1 (adopted from [38]), we show a cartoon diagram of the above four spectral states under the TCAF solution. In the lower panel, typical spectra of each spectral state correspond to the diagrams are shown. In the cartoon diagrams, brown, light green, dark green, and grey regions represent Keplerian disk, sub-Keplerian halo, CENBOL and jet, respectively. It is to be noted that the cartoon diagram and corresponding spectra are only for illustrative purposes. TCAF model fits file assumes the shock location as the truncation radius of the Keplerian disk ; however, it may not occur all the time. For example, in the HS, a disk may not be formed at all, or in the SS, the shock may not be formed with the negligible sub-Keplerian flow. However, these scenarios are the example of extreme cases. In general, both Keplerian disk and sub-Keplerian halo matters are present in the accretion flow, and the TCAF model fits file covers the most probable parameter space of the system.
When an outburst is triggered due to lower viscosity and angular momentum, the sub-Keplerian matter moves with free-fall velocity, whereas the Keplerian flow moves in viscous time. Thus, the sub-Keplerian flow dominates the accretion process since it moves faster than the flow in the Keplerian disk. The Keplerian disk is truncated very far away by a large CENBOL. A strong shock (higher R) is formed at hundreds of Schwarzschild radius () away from the BH. Thus, it is difficult to cool the CENBOL by the Keplerian component. Hard X-ray flux dominates, and a hard state is observed. Compact jet is launched in this state from the CENBOL [30]. Evolving type-C QPO is produced in this state due to the resonance oscillation of the shock [33].
The source enters the HIMS after HS. The Keplerian disk accretion rate continues to rise and becomes comparable with the sub-Keplerian halo accretion rate. As a result, accretion rate ratio (ARR = /) decreases. Due to the rise of the Keplerian disk accretion rate, CENBOL shrinks and becomes cool as the shock moves farther inward. Shock strength decreases as the Compton cooling reduces the post-shock thermal pressure. Further, in this intermediate state, in the presence of jets, mass outflow rate to inflow rate ratio becomes maximum. In this state, evolving type-C QPOs may also be observed.
In the SIMS, the Keplerian rate keeps on increasing, although the sub-Keplerian flow rate started to decrease. This is because more and more sub-Keplerian flow becomes Keplerian by viscous transport. The shock becomes weak in this state. The shock further moves in, and the CENBOL becomes small. The soft X-ray flux increases, and the hard X-ray flux decreases in this state due to rapid rise in and slow decrease in . Generally, type-A or type-B QPOs are observed sporadically in this state due to weak oscillation of the CENBOL (type-B) or due to oscillation of shock-less centrifugal barrier (type-A) [34,35]. The time (day) difference between and peaks gives us rough estimation of the viscous time scale of the source [39,40]. In the SS, the Keplerian disk dominates and completely cools down the CENBOL. The soft X-ray flux dominates over the hard X-ray flux. No shock is formed. As a result, the jet is completely quenched in this state [30,41]. No QPO is produced in the soft state.
The spectral states evolve in the reverse order during the declining phase of the outburst as flow parameters show opposite nature. Starting from the SS to the SIMS transition day, both the Keplerian disk accretion rate and the sub-Keplerian halo accretion rate decreases, although the Keplerian disk rate decreases faster. As a result, ARR increases. As in the SIMS of the rising phase, one may see sporadic type-B or A QPOs in the declining SIMS. In the declining HIMS and HS, evolving type-C QPOs could be seen. Similar to the rising phase, one could observe a compact jet in the HIMS and HS in the declining phase.
TCAF solution is implemented in XSPEC [42] as an additive table model to analyze the spectral properties around the black holes [43,44]. TCAF model has four input flow parameters (, , , R) other than mass of the black hole () and normalization (N). In the recent years, accretion flow dynamics around several black holes are studied quite successfully using TCAF model [45,46,47,48]. Frequencies of the dominating QPOs are predicted from the TCAF model fitted shock parameters [49]. Masses of the black holes are estimated quite successfully from spectral analysis with the TCAF model [49,50,51]. Jet contribution in the X-rays are also calculated using TCAF solution [52,53,54].
While fitting with the TCAF model, one must take care of degeneracy. Like any other spectral model, TCAF model is degenerate between different parameters. Thus, one must be very careful while fitting with TCAF model. One must always remember the physical condition of the system. For example, a single spectrum can be fitted with two different set of parameters: ( , , , , ) and ( , , , , ). Clearly, the second set of parameters is unphysical (the Xs can not be low while the the shock is strong and mh is higher than md). Also, one needs to find the parameters with the steppar command to avoid the degeneracy.
3. Observation and Data Analysis
We analyzed Swift data for 19 observations between 2015 June 15 (MJD 57,188.77) and 26 June (MJD 57,199.52). We studied the source in 0.5–150 keV energy band with combined XRT and BAT data for five observations (MJD 57,191.01, 57,194.54, 57,197.21, 57,197.33, and 57,198.02). The 15–150 keV BAT data was used for four observations (MJD 57,188.77, 57,193.56, 57,198.15 and 57,199.52) when only BAT observations were available. For the rest of the ten observations, we studied 0.5–10 keV using XRT data.
We used WT mode data for XRT observation. Cleaned event files were generated for XRT using xrtpipeline command. To reduce pile-up effects, we used grade-0 data. For pile-up correction, we chose an annular region around the source. We chose an outer radius of 30 pixels and a varying inner region, depending on the count rate. We extracted spectra for the different inner regions and tested for the pile-up. The piled-up spectra are harder than expected. When increasing the inner region did not alter the spectra, the pile-up had been excluded. A background region is chosen far away from the source at the same axis as the source with an annular of same radii as the source. Then, we obtained , and files using cleaned event files in XSELECT v2.4. A scaling factor was applied to the source and background with backscal task. For an annular of outer radius of and inner radius of , we used the scaling factor . The spectra were re-binned to 20 counts per bin using grppha command. The 0.5–10 keV s lightcurves were generated in XSELECT v2.4 using cleaned source and background event files. We followed standard procedures to generate BAT spectra and lightcurves. Detector plane images (dpi) were generated using the task batbinevt. For appropriate detector quality, we used batdetmask task. Noisy detectors were found, and a quality map was obtained using bathotpix. Then batmaskwtevt was run to apply mask weighting to the event mode data. A systematic error was applied to the BAT spectra using batphasyserr. Ray-tracing was corrected using batupdatephakw task. Then a response matrix for the spectral file was generated using batdetmask.
Here, we used the TCAF model-based fits file for the spectral analysis. We also used combined diskbb (DBB) and powerlaw (PL) models to get rough estimation about the thermal and the non-thermal fluxes where a reflection component is often required to find the best fits. TCAF model-based fits do not require any additional component for reflection since the reflection component is already incorporated in the model. We required a Gaussian model to incorporate Fe K emission line. We used phabs model for interstellar absorption and pcfabs model for partial absorption. With the TCAF, we extracted physical parameters such as the mass of the black hole () in solar mass (), the Keplerian disk rate () in Eddington rate (), the sub-Keplerian halo rate () in Eddington rate (), the shock location () (i.e., size of the Compton cloud) in Schwarzschild radius () and the shock compression ratio ( with and are post- and pre-shock density, respectively). In TCAF, N depends on the source’s distance and inclination angle and is just a constant factor between the emitted spectra and observed spectra by a given instrument. However, it can vary if any physical processes are present other than the accretion. Since the current version of the TCAF model fits file does not include jets, for instance, a variation of normalization is observed if they are present [52,54]. We first analyzed the spectra after keeping the mass of the black hole as a free parameter. We obtained the mass of the black hole in the range of 9.5–11.5 or the average value of . This measured mass range agrees very well with previously reported values by many authors [11,13]. Then, we refitted all the spectra after keeping the mass of the black hole frozen at . The result based on the later analysis is presented here.
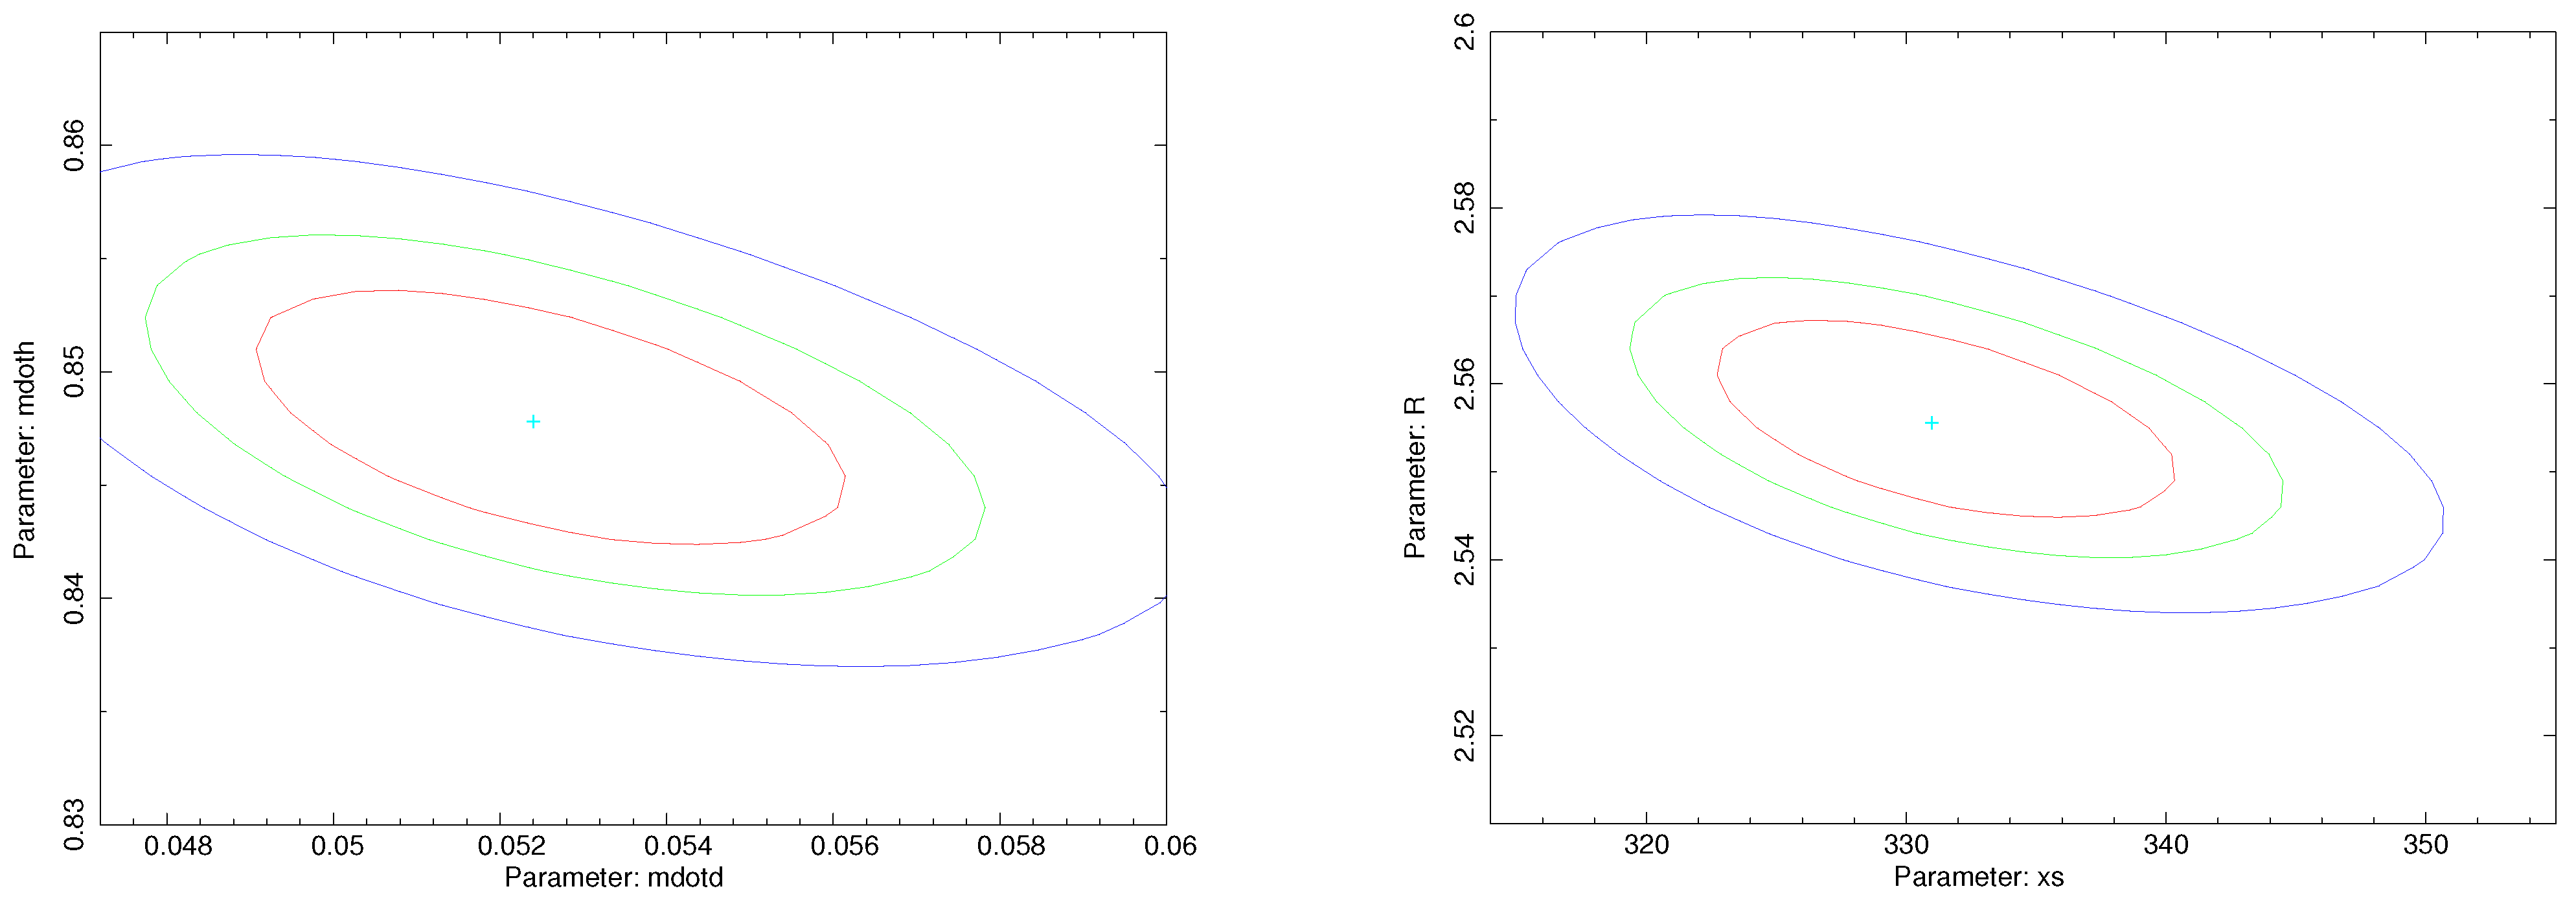
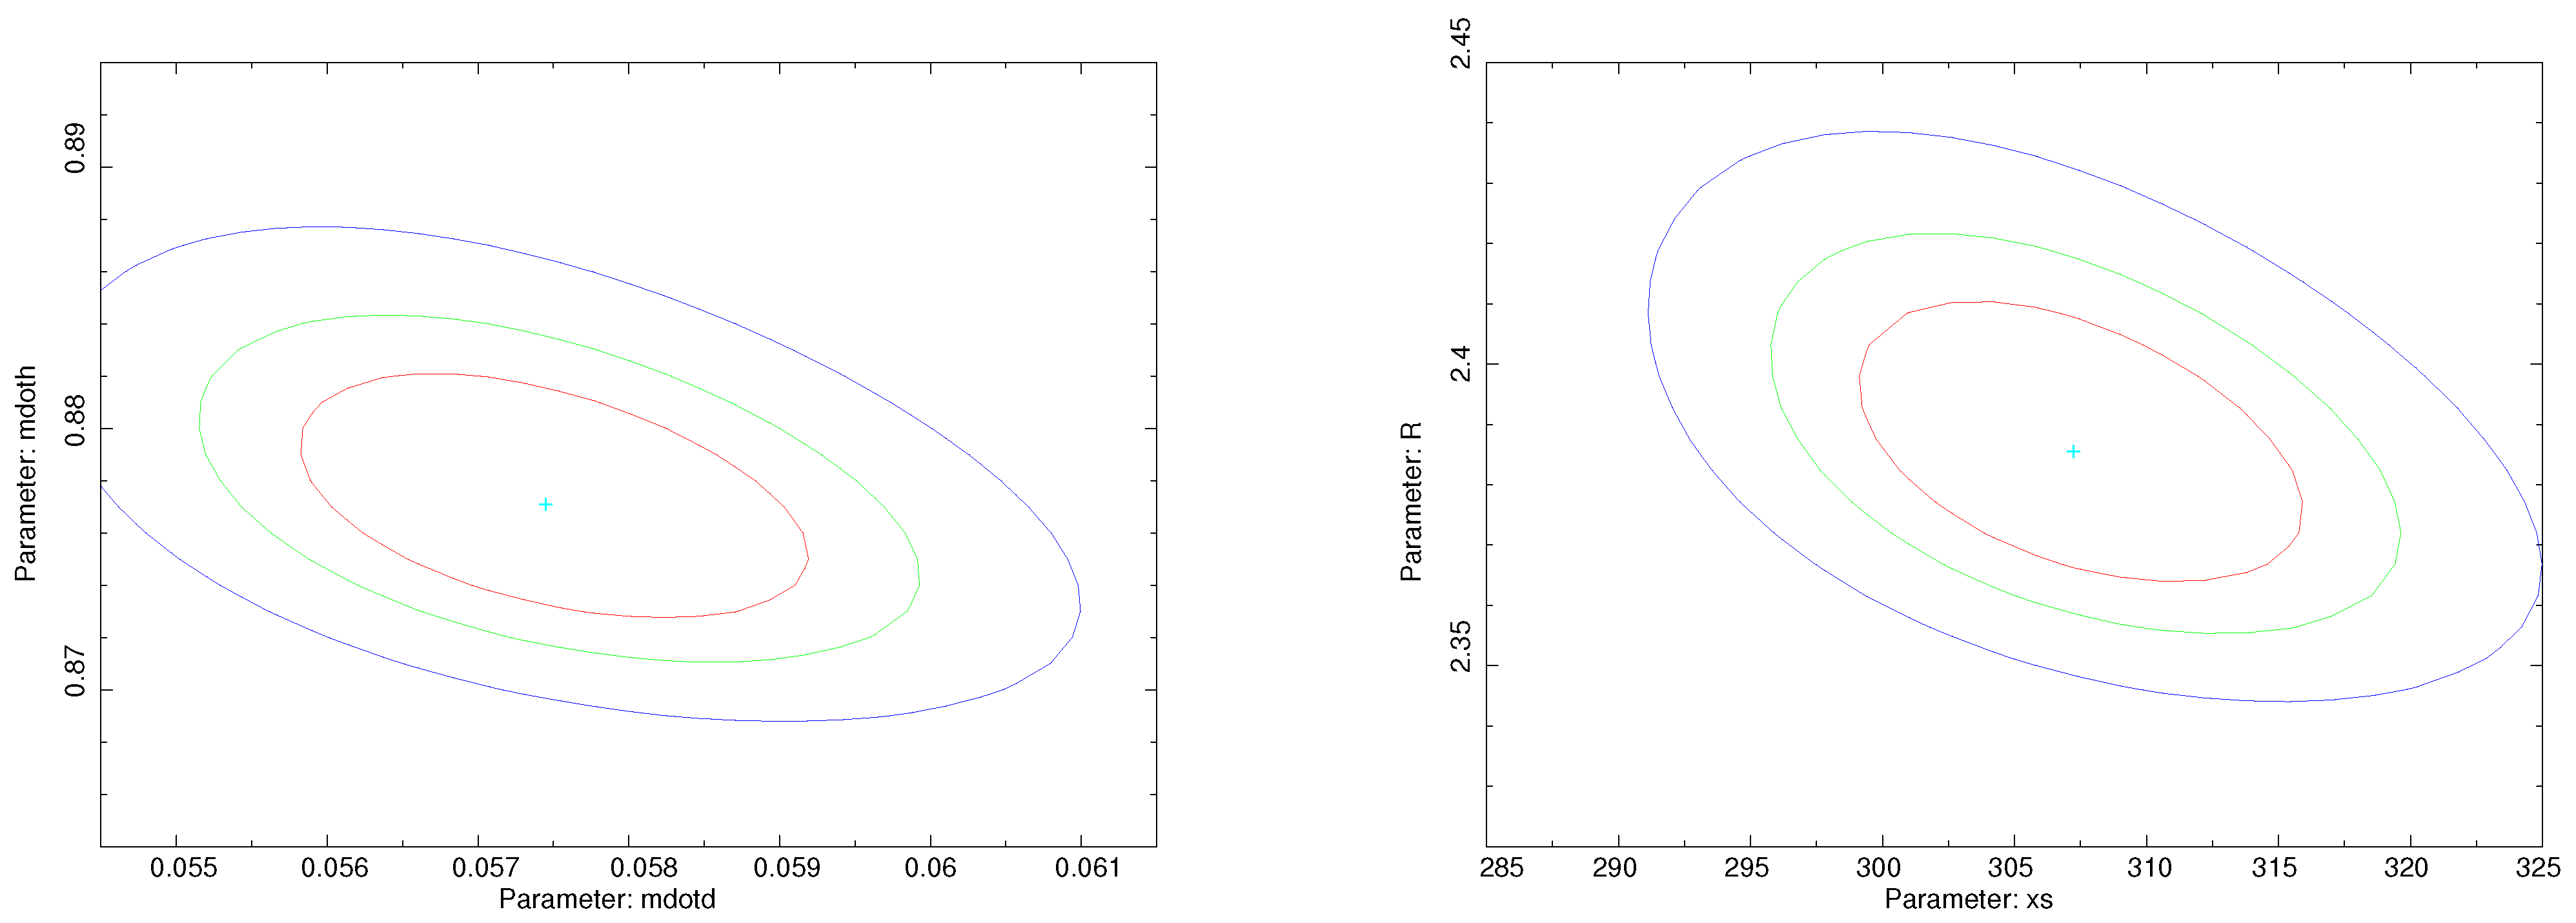
We achieved best-fittings using steppar command. After obtaining a best-fit based on 1) with TCAF, we ran steppar to verify fitted parameter values. The ‘steppar’ command ran for pair of parameters − and −R. We also calculated uncertainties with the steppar with 90% confidence. In Figure 2 and Figure 3, 2D-contour plots for two observations (MJD 57,188.77 and 57,189.62) are shown.
4. Results
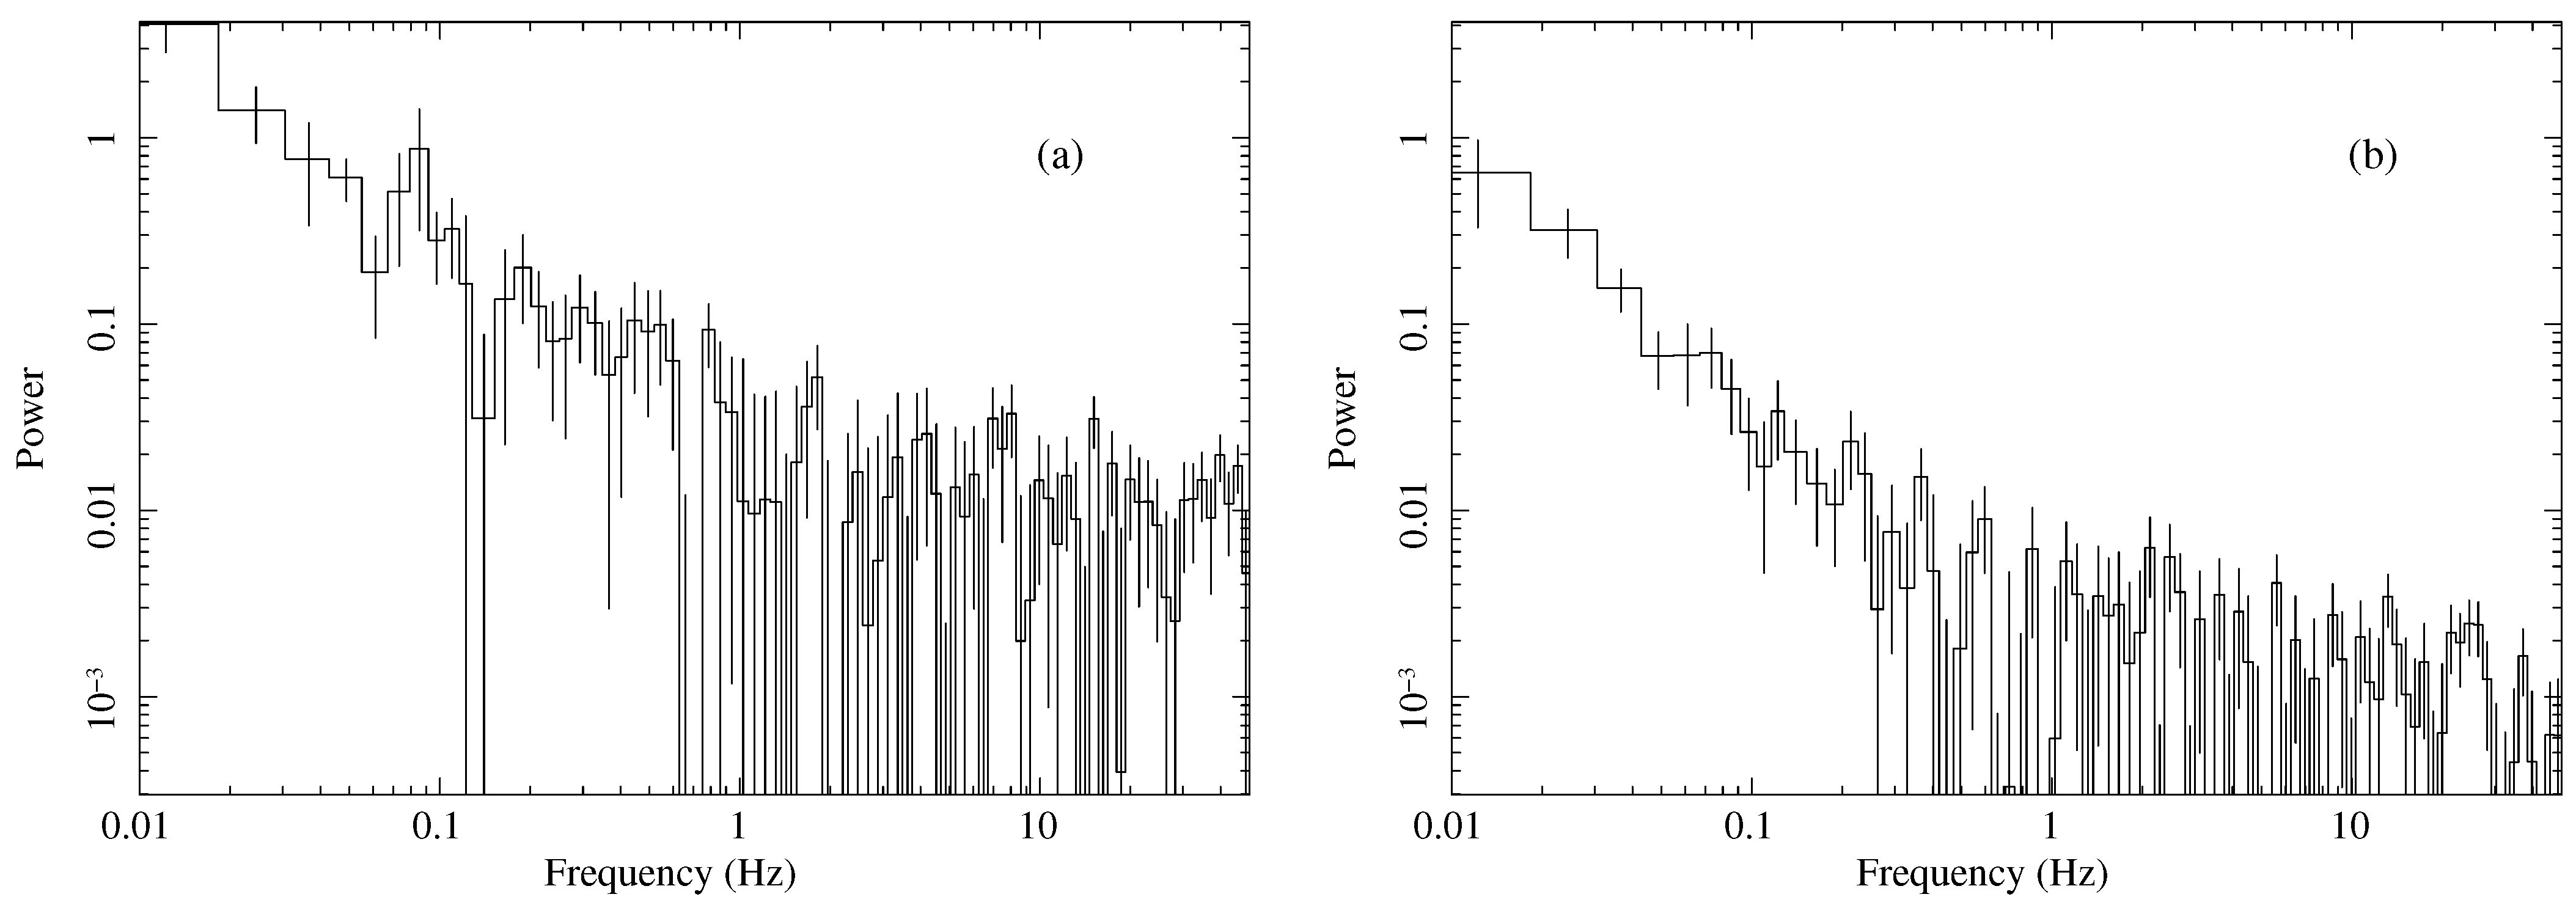
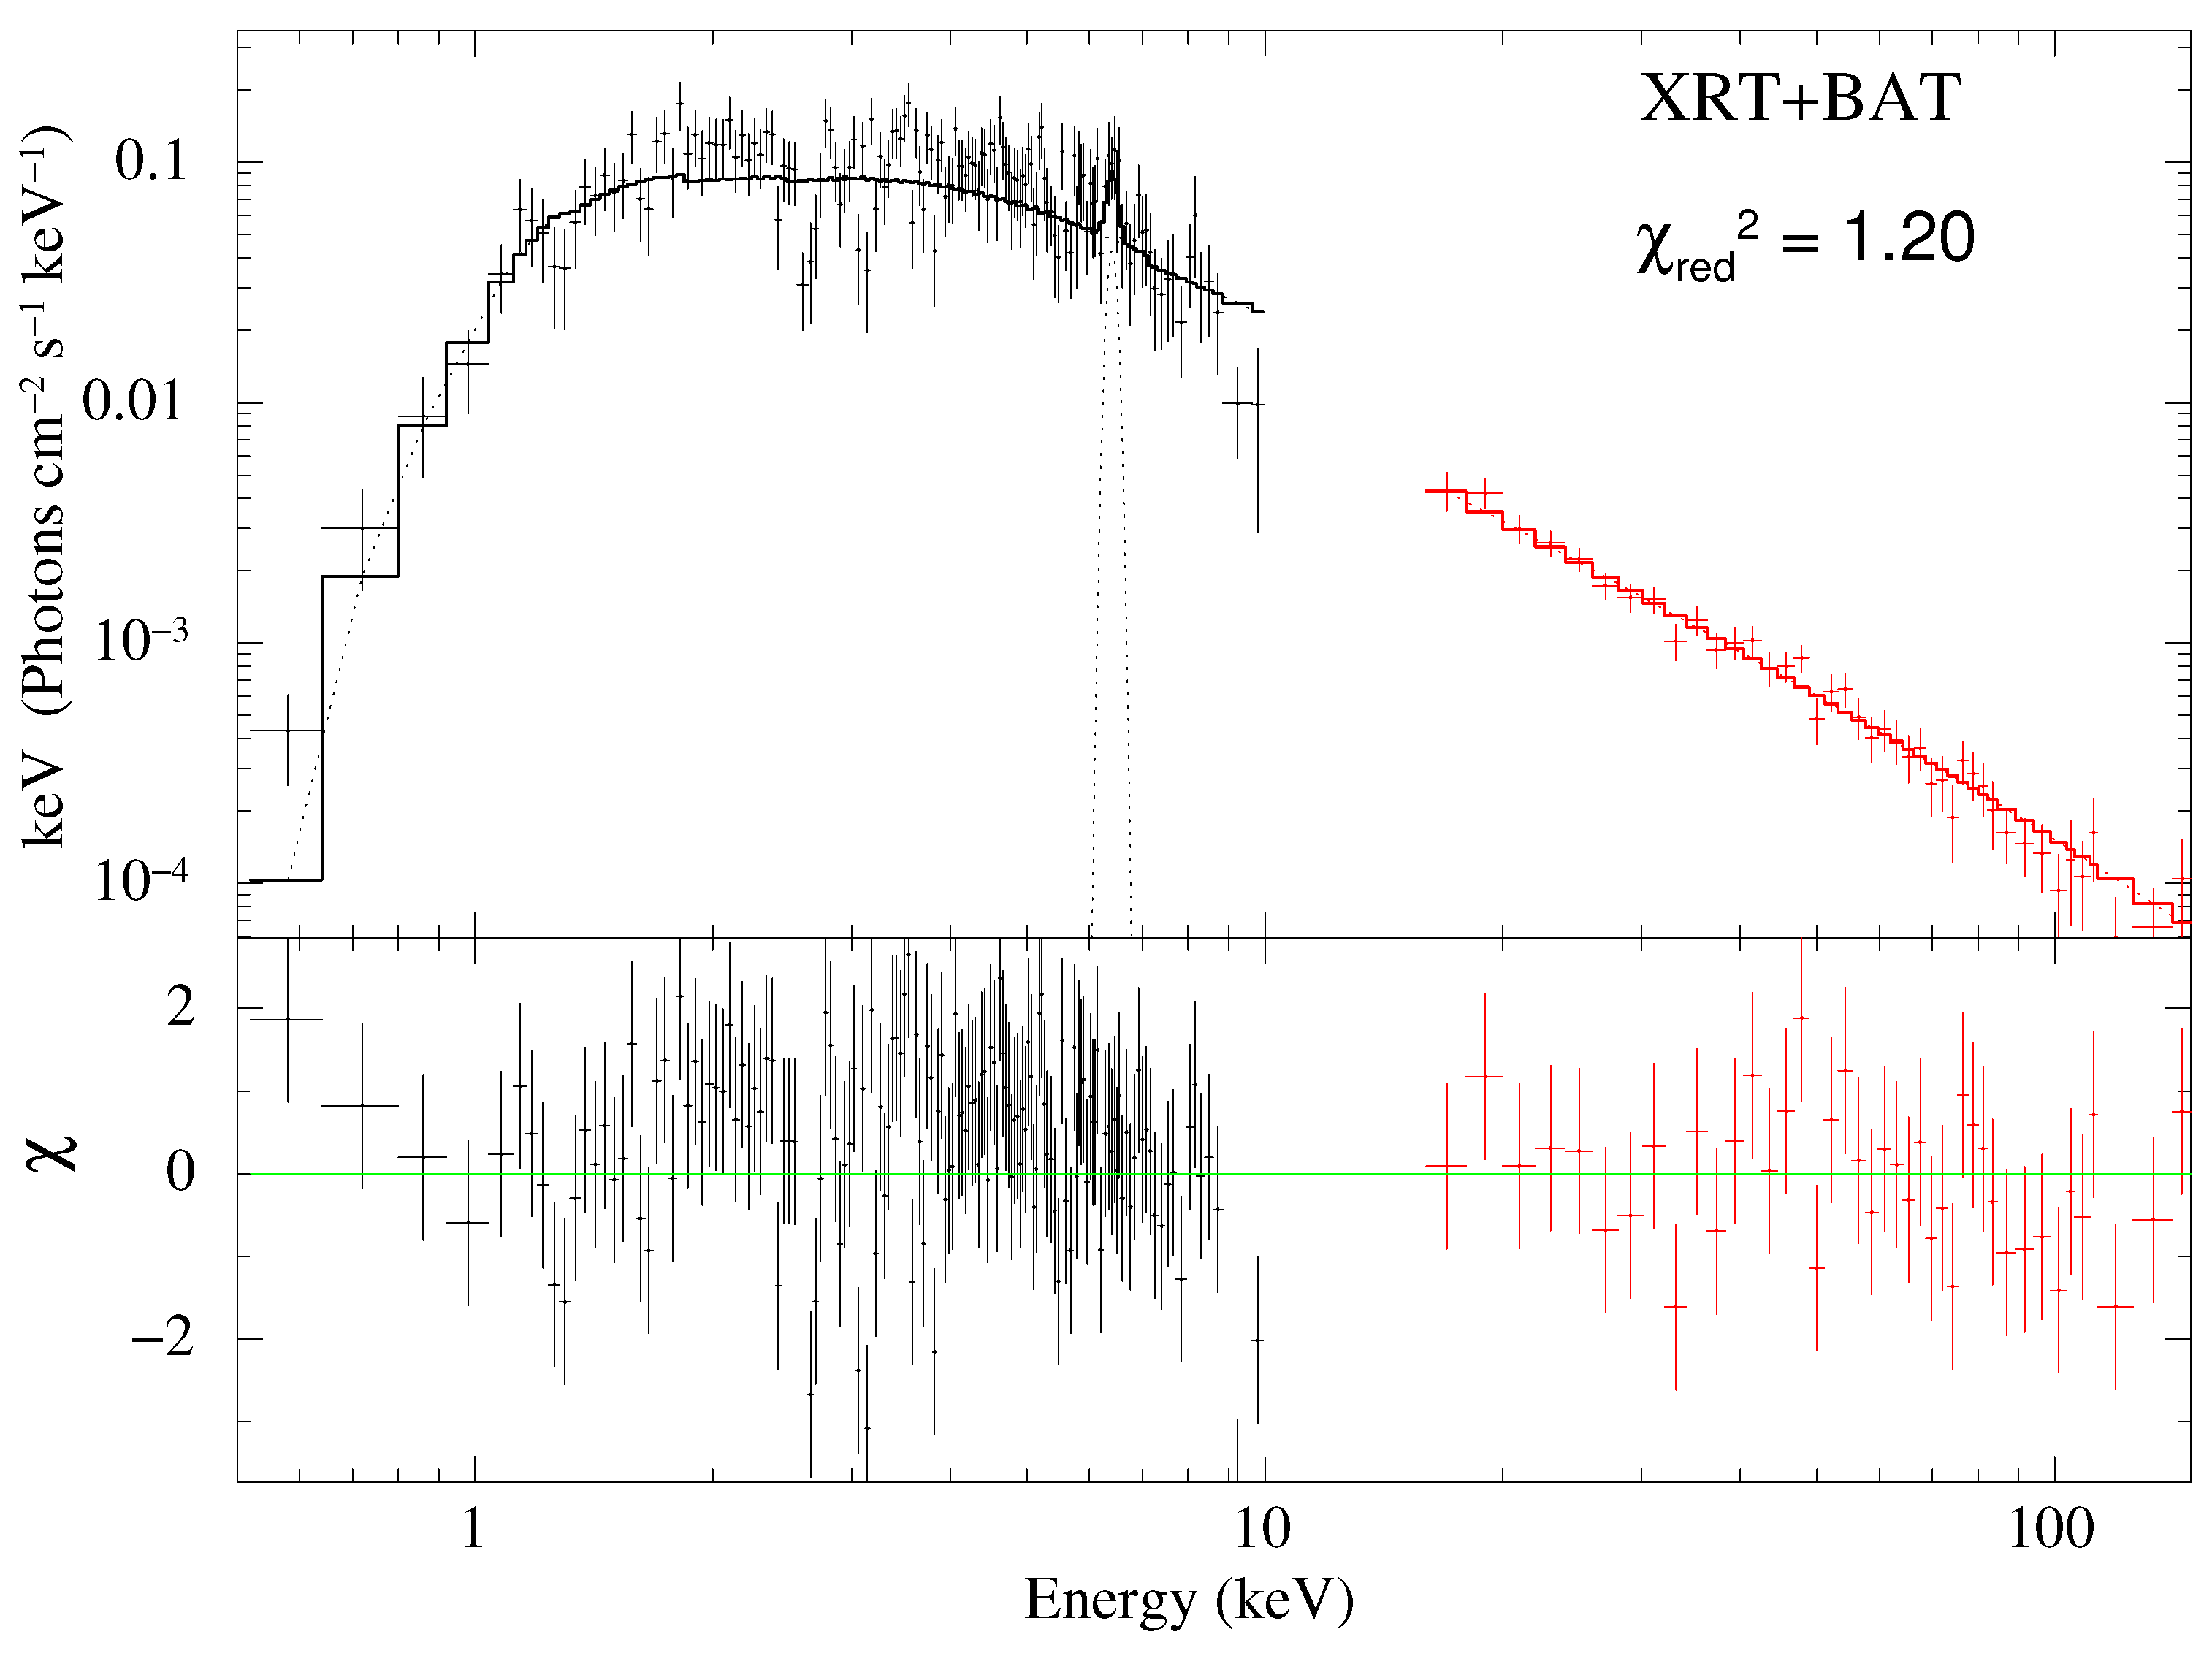
We present the results of spectral and temporal analysis of the source in 0.5–150 keV energy band using combined XRT+BAT or only BAT (in 15–150 keV) or only XRT (in 0.5–10 keV) data. In Figure 4, we show two XRT PDS for observations on MJD 57,191.01 (18 June 2015) and MJD 57,194.54 (21 June 2015). In Figure 5, TCAF model fitted spectrum of combined XRT plus BAT data in the broad energy range of 0.5–150 keV is shown for the observation on MJD 57,191.01.
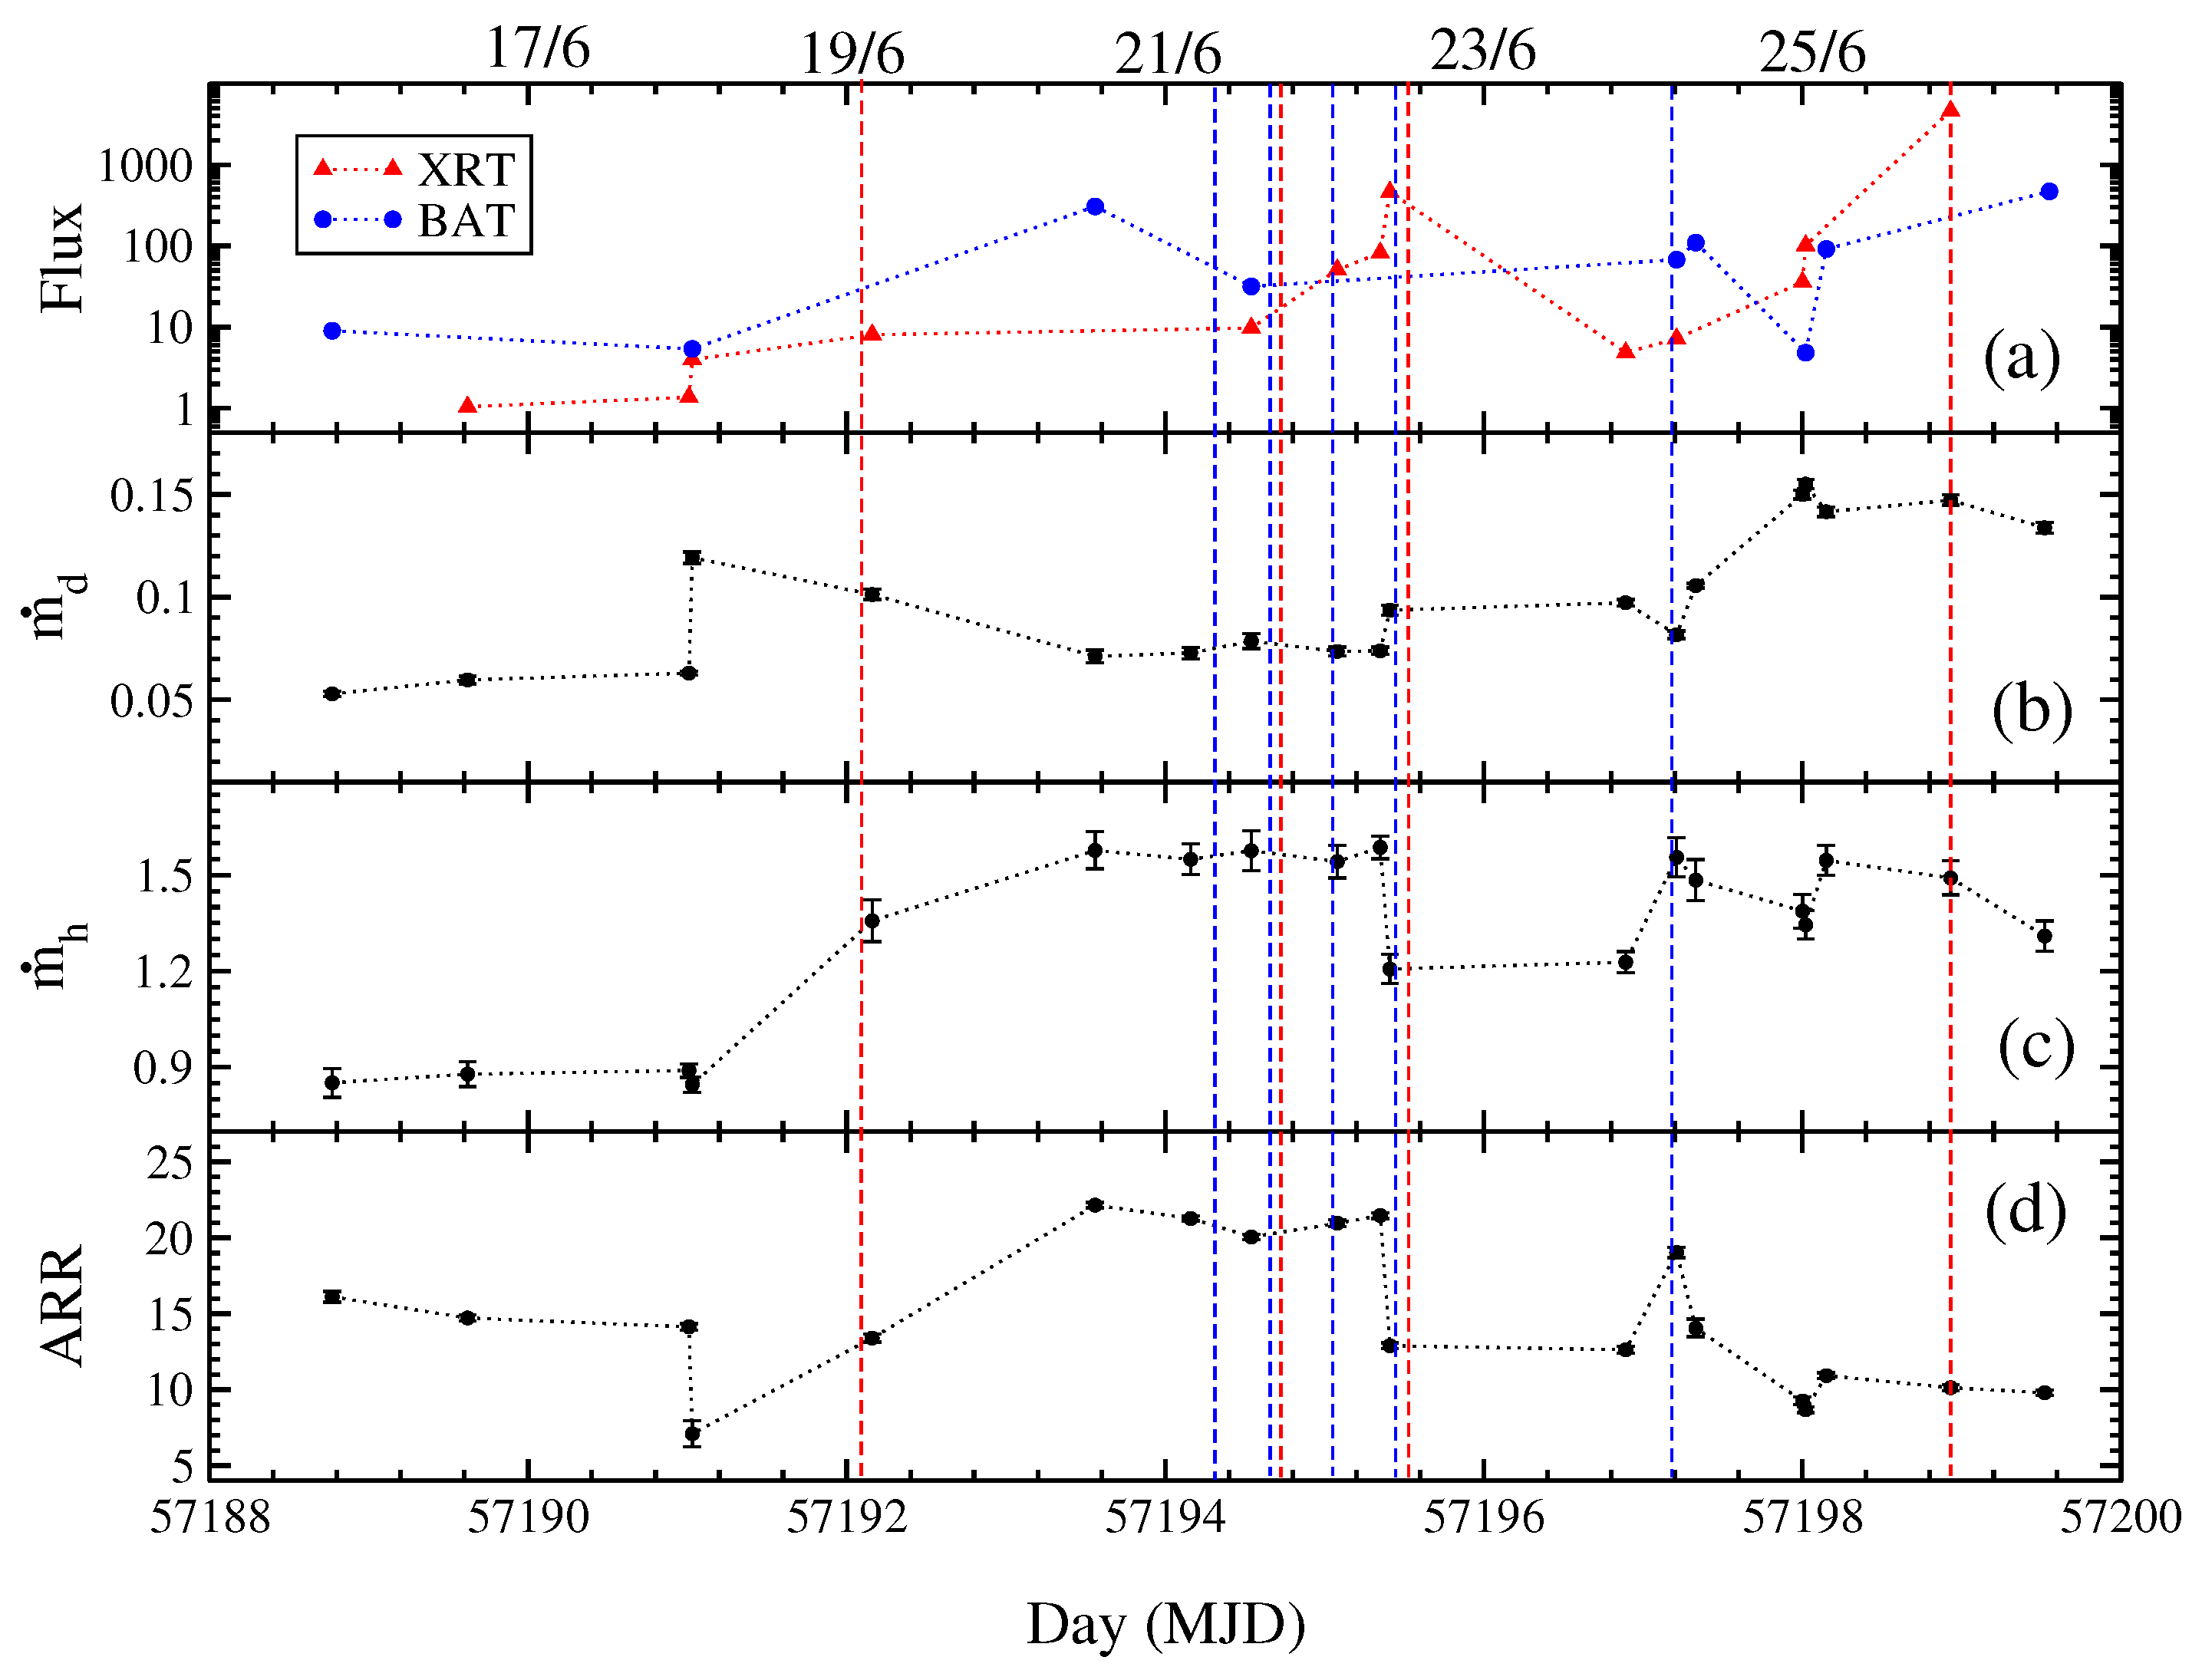
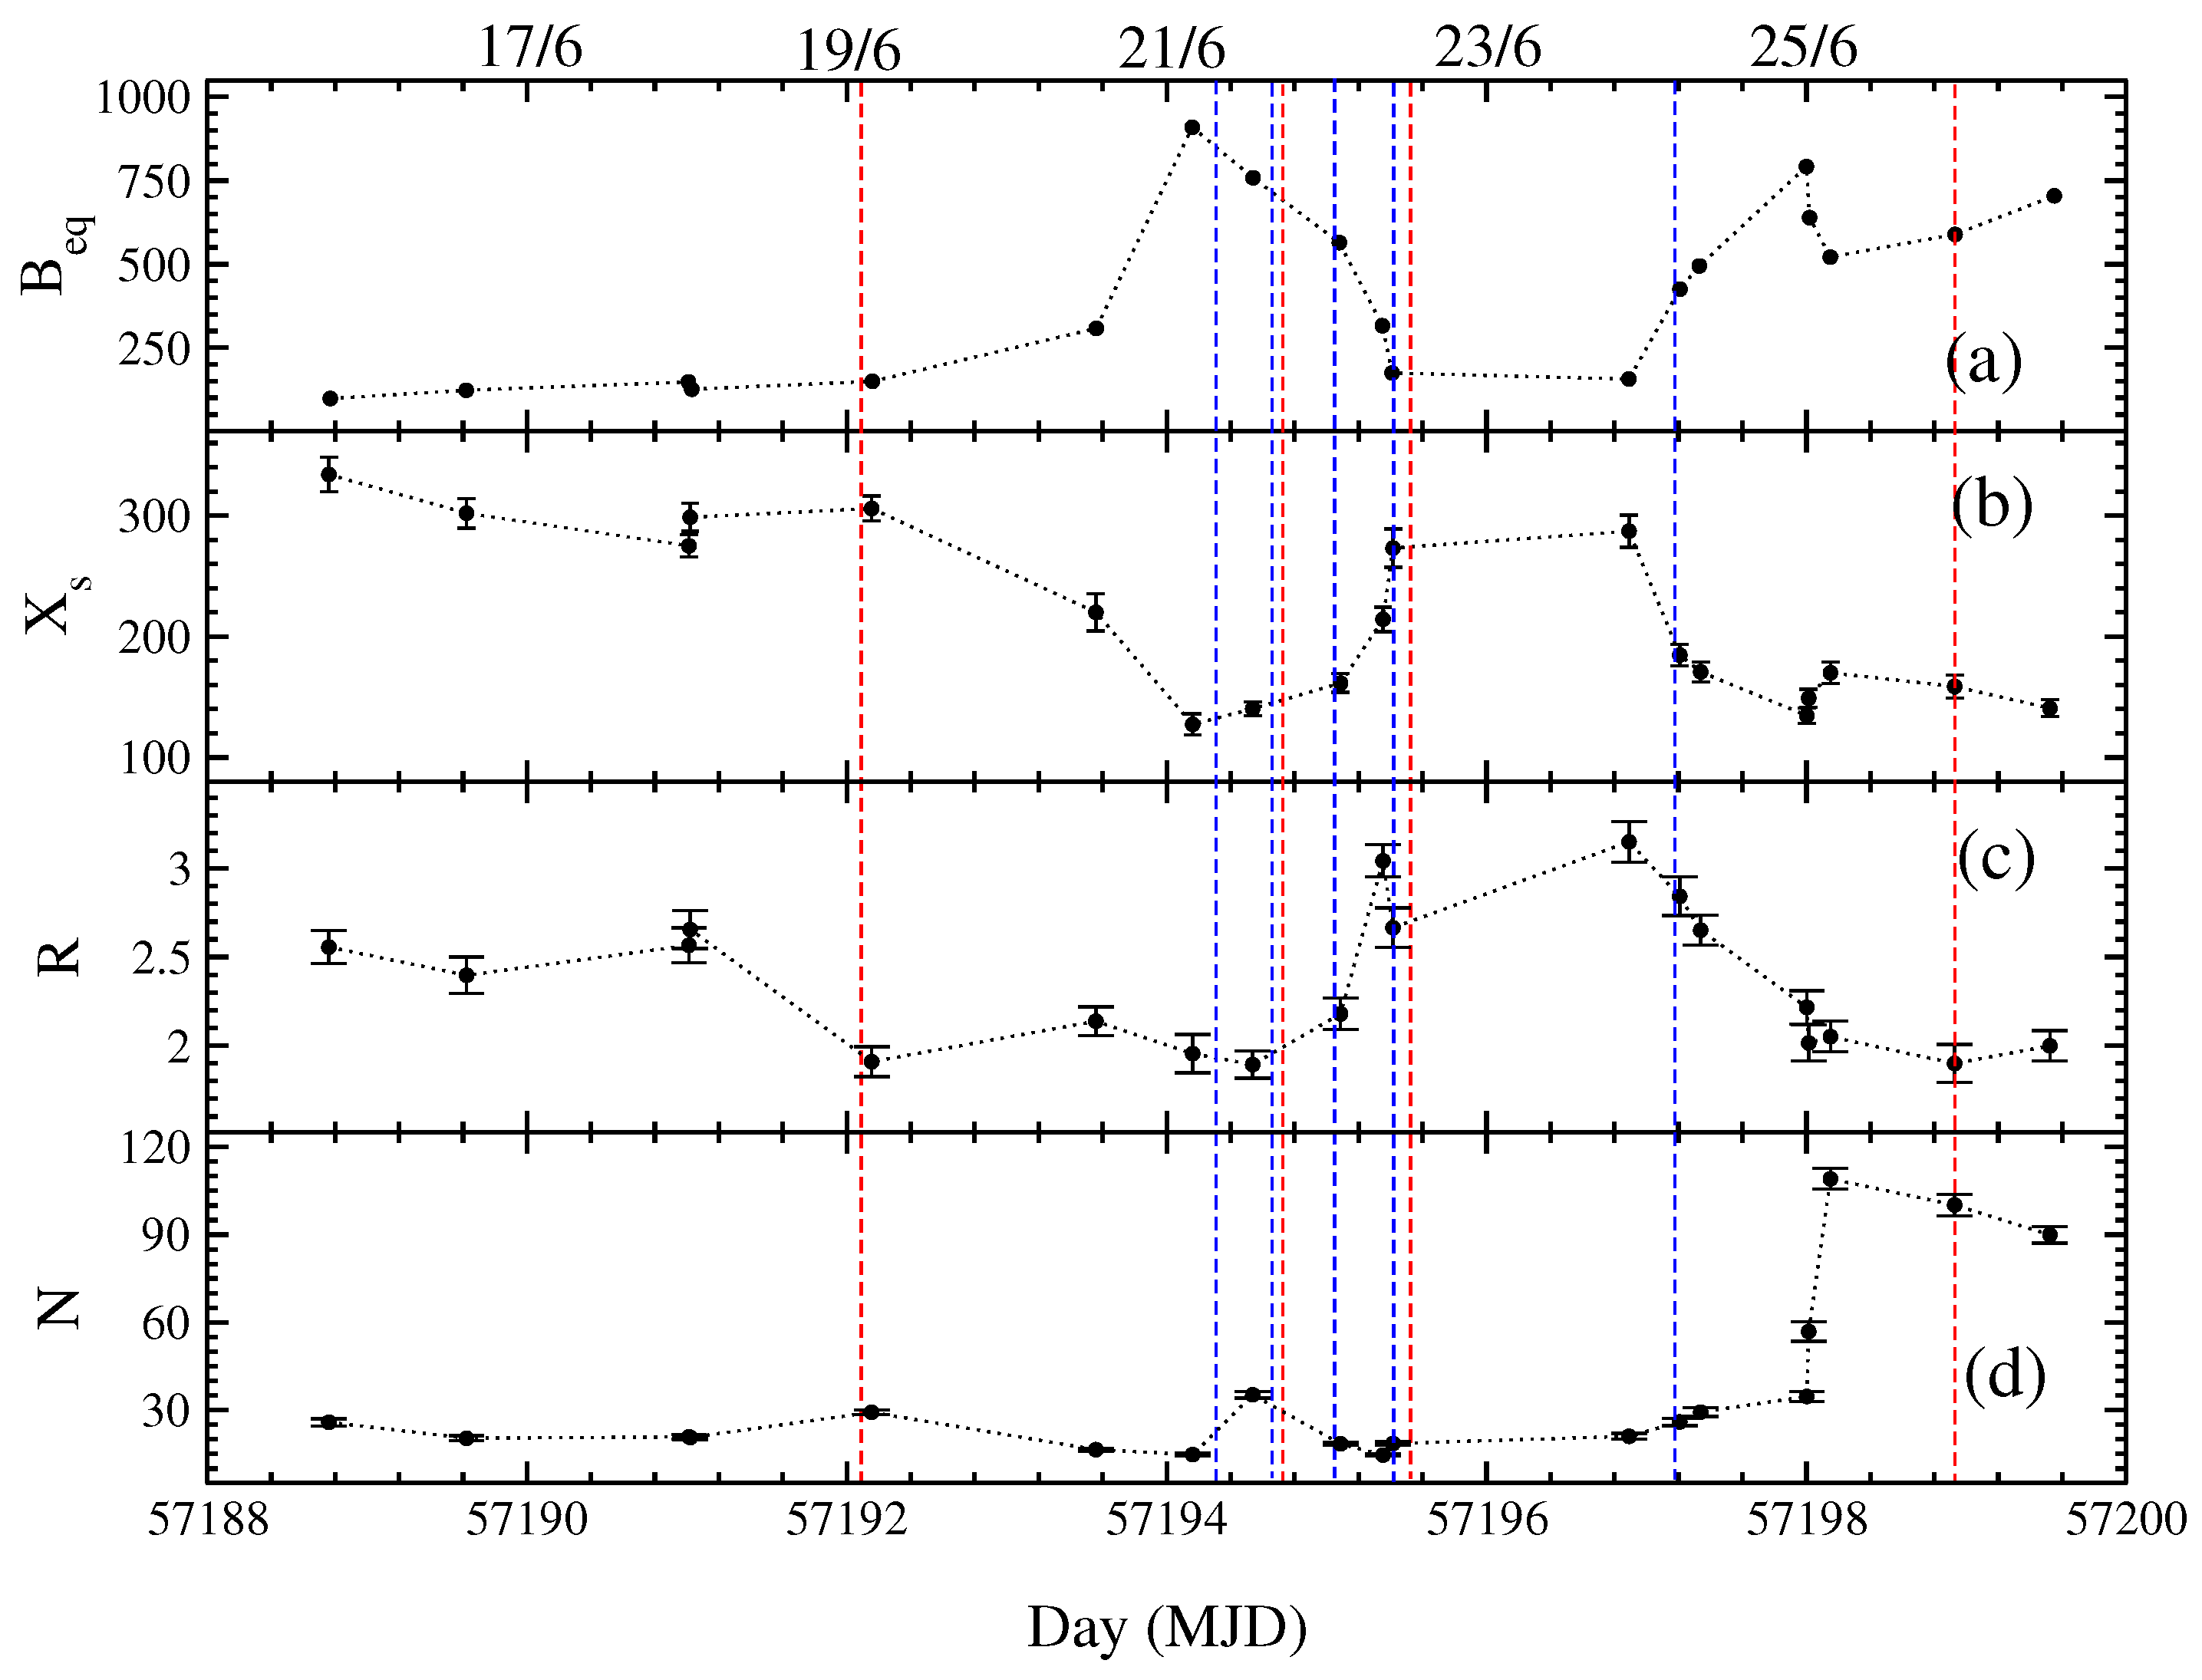
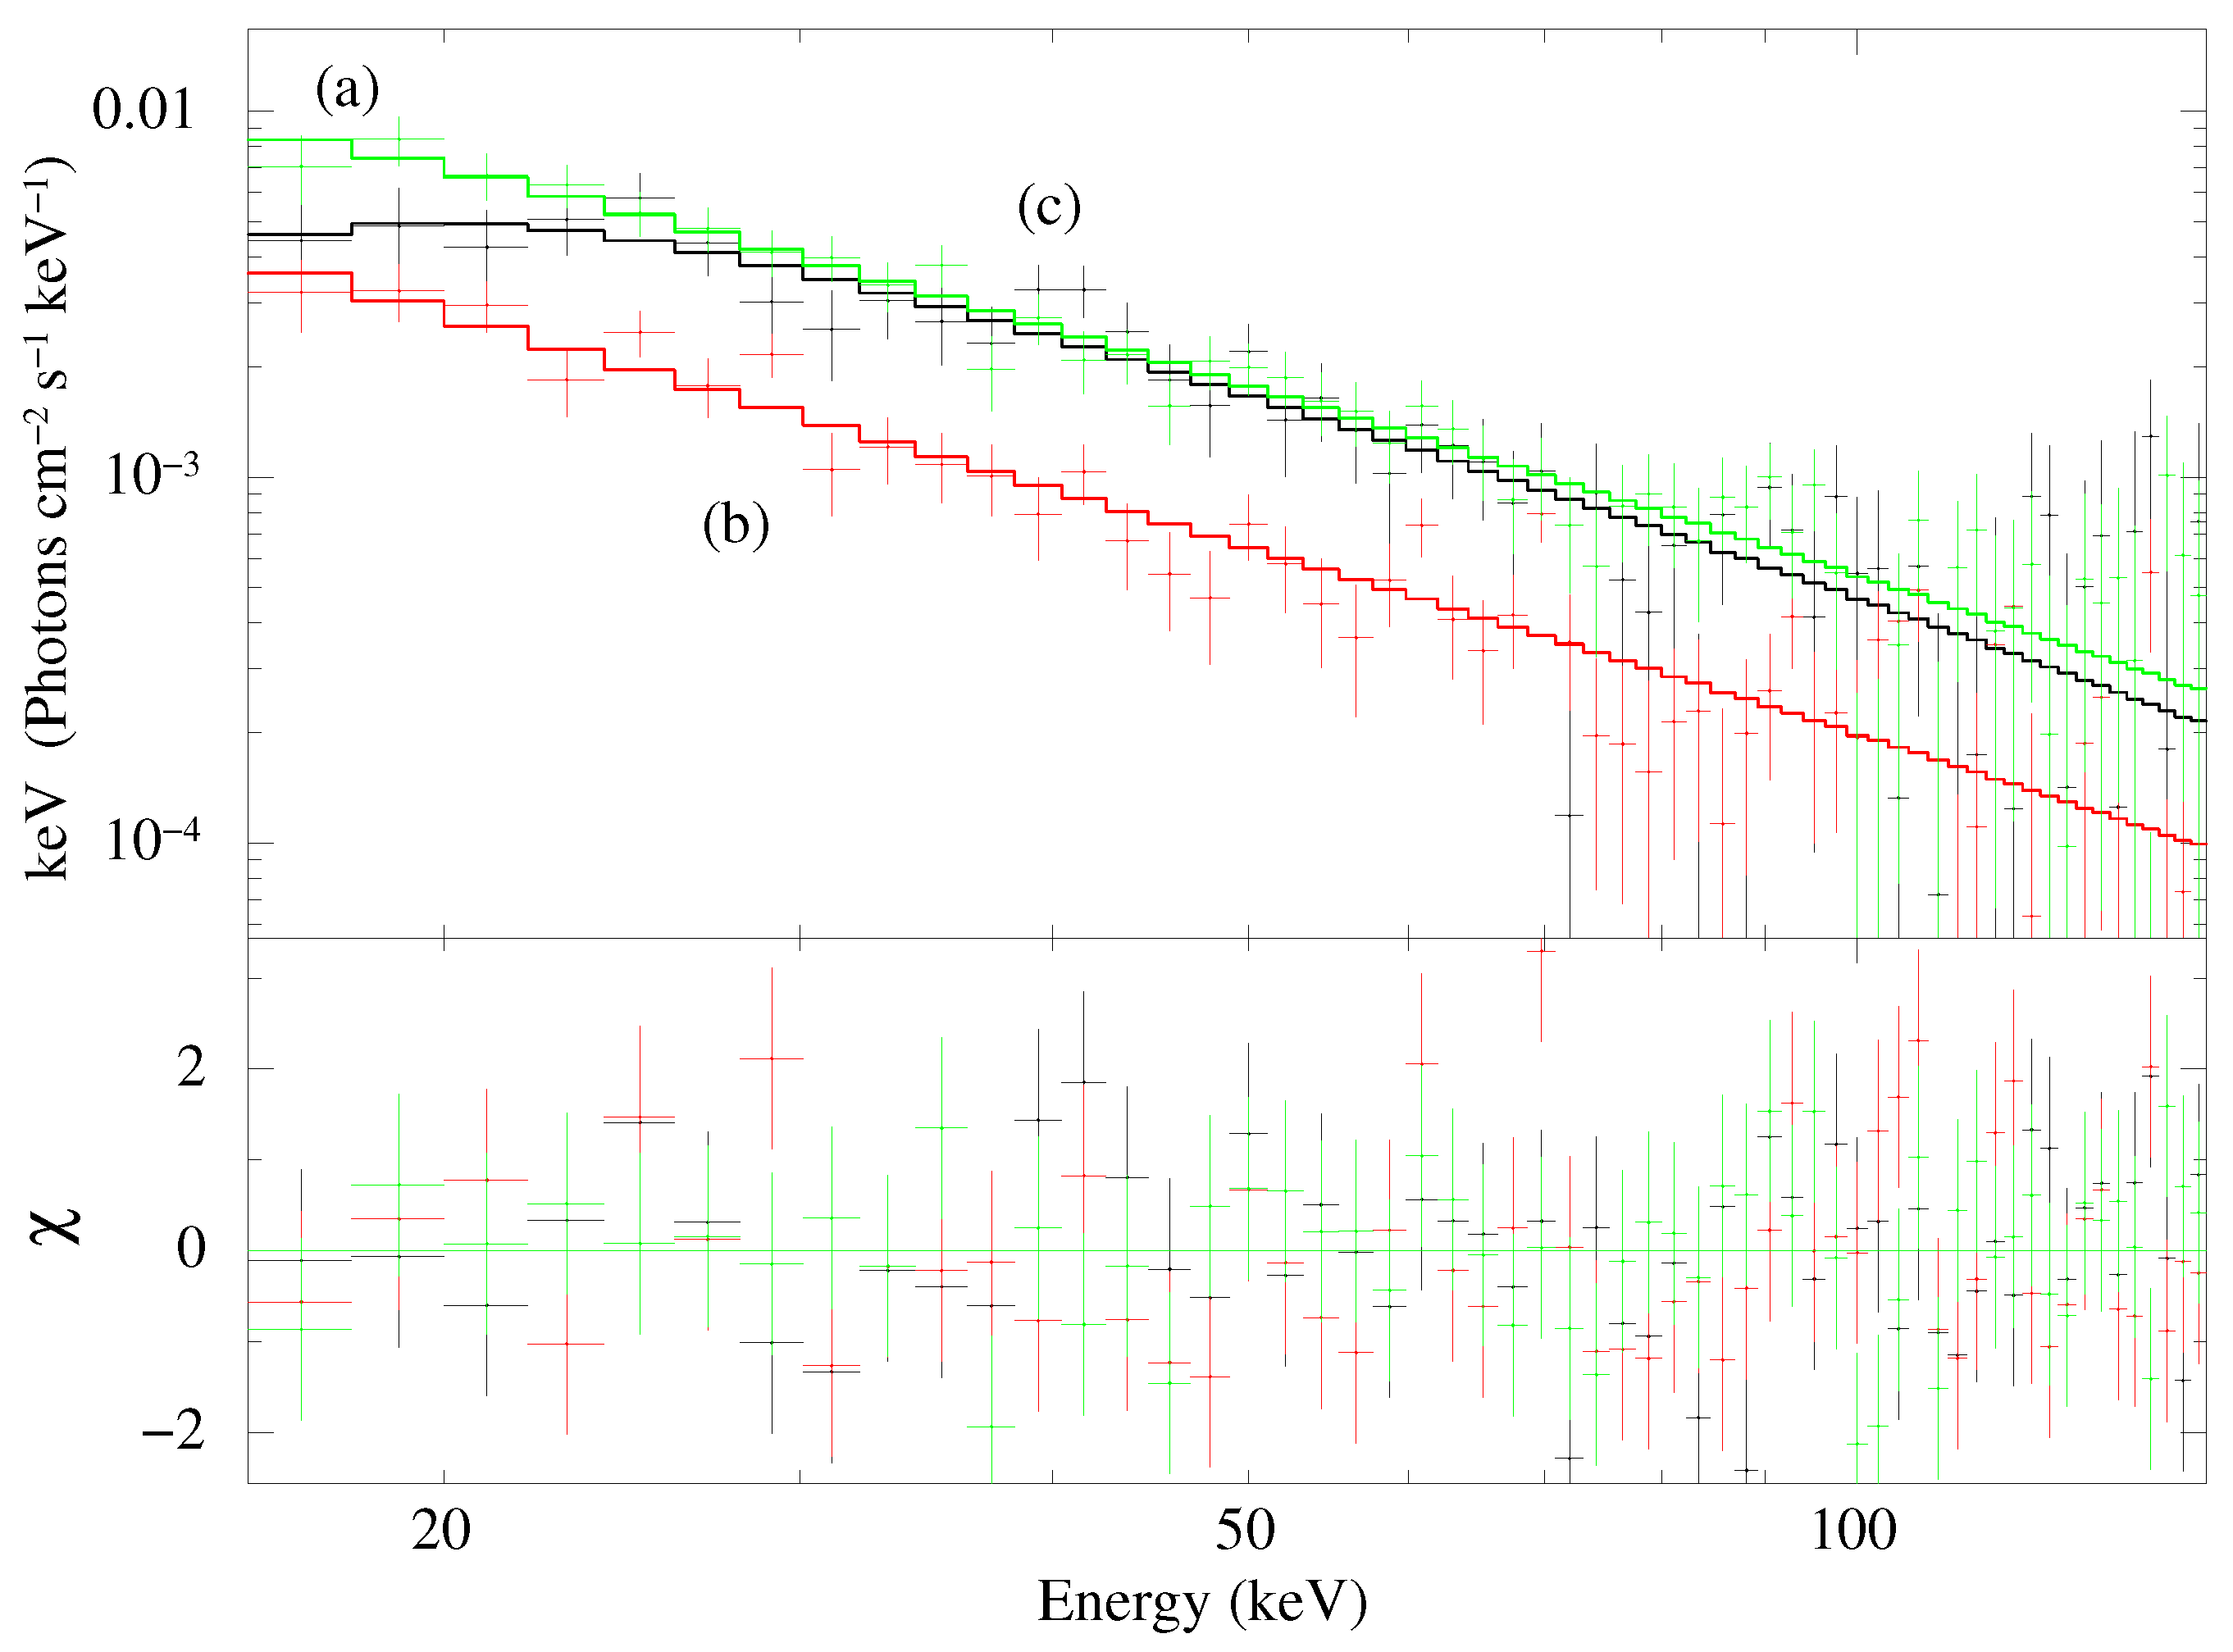
In Figure 6a, we show the evolution of BAT and XRT fluxes. In Figure 6b–c, we show the variation of the Keplerian disk rate (), the sub-Keplerian halo rate () with day (in MJD). In Figure 6d, we show the evolution of accretion rate ratio (ARR = /). In Figure 7a, we show the variation of the equipartition magnetic field () with the day. In Figure 7b–d, we show the variation of the shock location (), the shock compression ratio (R), and TCAF model normalization with the day. In Figure 8, the time-resolved Swift/BAT spectra in the energy range of 15–150 keV for the observation on 15 June 2015 (MJD 57,188.77) are shown. The three spectra are marked as (a) (online green), (b) (online black) and (c) (online red) with exposures of 220 s, 680 s and 160 s, respectively.
4.1. Temporal Evolution
The 2015 outburst of V404 Cygni is different from other regular outbursts of transient BHCs. It showed rapid changes in a very short timescale in both XRT and BAT count rates. The flux changed significantly in minutes to hours timescales. Several radio and X-ray flares were observed during this epoch. INTEGRAL observation revealed 18 X-ray flares during the outburst [19]. Radio flares were also reported during the outburst period [17]. We find that the luminosity was super-Eddington in some observations. On 22 June 2015 (MJD 57,195.41), the XRT flux increased rapidly to from of the previous observation. This corresponds to the source luminosity, . On 25 June 2015 (MJD 57,198.93), the XRT flux reached at which corresponds to the source luminosity, . BAT count rate also increased rapidly within our analysis period. It became maximum on 26 June 2015 (MJD 57,198.93) at , i.e., luminosity was .
We studied power density spectra (PDS) of s binned lightcurve of Swift/XRT. We did not find any clear evidence of QPOs during the initial phase of the outburst in Swift/XRT PDSs. A weak signature of QPO was observed in the PDS on 18 June 2015 (MJD 57,191.03) (see Figure 4a). The XRT PDS showed an almost flat spectral slope with broad-band noise. The noise decreased as the outburst progressed, during which we found two slopes in the PDS, a steep power-law slope in the lower frequency and a flat slope at a higher frequency. In some PDS, we observed that power diminished very rapidly. We did not find any break in the PDS.
4.2. Evolution of the Spectral Properties
We have done the spectral analysis using 0.5–150 keV combined Swift/XRT and Swift/BAT data between 15 and 26 June 2015. Radhika et al. (2016) analyzed the same data set using phenomenological diskbb and powerlaw models [20]. We analyzed the data with combined diskbb, and power-law models and have found similar results as in [20]. In general, we used phabs*pcf*(diskbb+powerlaw+gaussian) model to estimate thermal and non-thermal fluxes. While analyzing with phenomenological models, we did not require a diskbb component regularly. Diskbb component was required only in 9 observations out of a total of 19 observations. During the entire period, PL photon index varied between and , although the PL flux dominated over the DBB flux. We also required a Gaussian for Fe K line emission along with the diskbb+powerlaw model. Detailed results of the phenomenological model fitted spectra are given in Table 1.
In the present paper, our main goal is to study the accretion flow dynamics of the source from spectral analysis with the physical TCAF model. For this purpose, we used phabs*pcf*(TCAF+gaussian) model. Detailed results using this model is presented in Table 2. From the spectral analysis in the initial few observations, we obtained very low values of the Keplerian disk rate () while the sub-Keplerian halo rates () were found to be high (>). On 19 June 2015 (MJD 57,192.16), increased to from its previous day value of . After that, it varied within 1.24–1.58 until the end of our analysis period. On 25 June 2015 (MJD 57,198.02), we observed sudden rise in from its previous day, i.e., from to . Before that, varied in the range of 0.05–0.12 . After MJD 57,198.02, was obtained in a narrow range of 0.13–0.16 (see Figure 6b).
A strong shock () was found far away from the black hole () on the first day (MJD 57,188.77) of our observation (see Figure 7b,c). The shock remained strong for the next five days. After that, the shock was found to move closer to the black hole as the Keplerian disk rate increased. The shock was found at 126 on MJD 57,194.16 with . The shock did not move closer than this. After that, shock moved away from the black hole. Again we found that the shock was moving inward after MJD 57,197.21. On the last day of our observation, we found the shock to be located at 143 .
We added a Gaussian profile and the TCAF solution to incorporate the contribution of the emission line in XRT data. Fe-line varied within keV and keV. In some observations, we required the Fe line width of >1 keV. The source was reported to be partially obscured due to the disk wind and outflow [24,27,55]. We used phabs models for the absorption. We did not freeze at a particular value. Rather, we kept it free. In our analysis, we observed it to vary between to cm. The variable absorption is unlikely due to the interstellar medium, rather it is likely to be associated with the intrinsic absorption of the source. In 11 observations out of total of 19 observations, we required to use pcfabs model to incorporate partial absorption in the XRT data. In some observations, the covering required as high as 95%. In general, it varied between 50% and 95%. For covering absorption, varied between and cm.
4.3. Time Resolved BAT Spectra
To study the evolution of spectral nature in short time intervals, we analyzed the time-resolved BAT spectra. Rapid variation of the accretion rates and other physical flow parameters from observation to observation motivated us to make this study. Here, we analyzed time-resolved BAT spectra for four observations on 15 June 2015 (MJD 57,188.77), 18 June 2015 (MJD 57,191.03), 20 June 2015 (MJD 57,193.56) and 26 June 2015 (MJD 57,199.52). We found rapid variation in the BAT spectra within a very short time, even in one observation. In Table 3, TCAF model fitted parameters for time-resolved spectra are presented. For example, on 15 June 2015, within total BAT exposure of 1202 s (Figure 8), we observed the variations of between and , and between and . The shock was observed to vary in between ∼326–336 . Similar rapid variation of the flow parameters ( and ) were also observed for the remaining three observations.
4.4. Estimation of Magnetic Field
Observation of presence of high magnetic field on 25 June 2015 by [56] motivated us to estimate magnetic field strength at the ‘hot’ Compton cloud region (here CENBOL) for the BHC V404 Cygni during its 2015 outburst. We made some simple assumptions as mentioned below to calculate the equipartition value of the magnetic field. At the shock location, energy conservation leads to the following equation [28],
where, n is the polytropic index of the flow, a is sound speed, u is particle velocity. ‘+’ and ‘−’ signs indicate the values at post- and pre-shock region respectively. The electron number density () is given by,
For our calculation, we assume CENBOL shape as cylindrical. is the mass of the proton. is the shock height. The shock height could be calculated from the TCAF model fitted shock parameters [44] using standard vertical equilibrium [29],
Now, we can calculate pressure at CENBOL using the following equation,
We consider equipartition magnetic field () as,
where, is the radiation pressure. The radiation pressure is negligible compared to the gas pressure. Using this equation, we calculated the value of the equipartition magnetic field for this source (see Table 4). We show the variation of the equipartition magnetic field in Figure 7a. We find G on our first observation (MJD 57,188.77). Then we found that was increasing with the shock moving towards the black hole. was maximum on 2015 June 21 (MJD 57194.16) at G. On that day, the shock was closest to the black hole.
4.5. Cooling and Infall Times
V404 Cygni did not show any strong QPO during its 2015 outburst. Although there are numerous suggestions for the origin of low-frequency QPOs, we believe that these QPOs are generated due to the oscillation of the shock formed in the TCAF solution. This shock oscillates when the resonance condition between cooling and infall time scales is satisfied or when Rankine-Hugoniot conditions are not satisfied to form a stable shock [33,34,35]. Thus to check if the resonance condition is satisfied or not, we have calculated both cooling and infall time scales during the outburst. Generally, in low mass X-ray binaries, Compton cooling is the primary process of cooling. We also considered the synchrotron cooling since the magnetic field was present.
We calculated both cooling time scales (synchrotron and Compton) during the entire period of our observations and compared that with the infall times. If cooling and infall timescales are roughly comparable, then we may say that the resonance condition for oscillation of the shock is satisfied. For simplicity, here we assume that the matter is moving radially at the post-shock region with speed . This allowed us to calculate infall time using the following equation,
Similar to the magnetic field calculation, here we also assume CENBOL as a cylindrical in shape. Now the total thermal energy of electron content within the CENBOL of volume V is,
where is the Lorentz factor. It is given by, , where , being electron velocity and c is the velocity of light. The synchrotron cooling rate is [57],
where is Boltzman constant. is magnetic energy density and given by, . The synchrotron cooling time is given by,
We calculated cooling time due to synchrotron using Equation (9). Note, we use = 10 for our calculation. We also checked the Compton cooling timescale (). To calculate Compton cooling, we use the same method as described in C15. The Compton cooling timescale is given by Equation (6) of C15,
Here, is the Compton cooling rate (for more details, see, C15). Here we find that the Compton cooling is much faster than the synchrotron cooling (see Table 4). Thus, the inverse-Comptonization is the primary cooling process. Now if we compare with or with , in both cases, the ratio deviates largely from unity. It is clear that the resonance condition was not satisfied during the 2015 outburst of V404 Cygni. This indeed verifies the observational fact that there was no prominent signature of type-C low-frequency QPOs during the outburst. The detailed results of our calculation of the magnetic field and two types of cooling time scales are presented in Table 4.
5. Discussion
We study the 2015 outburst of V404 Cygni using Swift/XRT and BAT data in the energy band of 0.5–150 keV. We used a total of 19 observations between 15 June 2015 (MJD 57,188.77) and 26 June (MJD 57,199.52) for the timing and spectral analysis. The TCAF model fitted spectral analysis allowed us to understand the nature of this violent outburst from a physical perspective. In the following sub-sections, we discuss our findings from the combined spectral and timing analysis.
5.1. Magnetic Field
A magnetic field is brought in by the accretion flow. The shear, convection, and advection amplify the predominantly toroidal flux tubes. They are expelled from the CENBOL due to the magnetic buoyancy [31,32] in the direction towards the pressure gradient force. If the buoyancy timescale is larger than the shear amplification timescale, then the magnetic flux tubes are amplified within the dynamical timescale; until they reach equipartition where gas pressure matches with the magnetic pressure. In general, the magnetic field is not found to contribute significantly to the accretion disk spectra of black holes as TCAF alone fits the spectral data very well. However, its role is important for the acceleration and collimation of jets and outflow.
Here, we calculated the equipartition magnetic field by equating magnetic pressure with the local gas pressure at the shock location. We found G on the first observation day. After that, it increased gradually with the increase of the accretion rate. We found the maximum value of the magnetic field to be G on 21 June 2015 (MJD 57,194.16). Then, it decreased to 154 G on MJD 57,196.89. Then, we observed that it was varying between 414 and 820 G within our observation. Dallilar et al. calculated the equipartition magnetic field for this source at hot Compton corona to be G on 25 June 2015 (MJD 57,198.18) [56]. We found G on the same observation day (MJD 57,198.15), which is consistent with the finding of Dallilar et al. (2017).
5.2. Power Density Spectra
No prominent QPOs were observed in the PDS of the Fourier transformed c time binned XRT lightcurves in the 0.5–10 keV energy band. The presence of a significant magnetic field may cause turbulence in the accretion disk, which could be responsible for the white noise observed in the PDS. The PDSs were observed to have two slopes: a powerlaw component and a flat component. Powerlaw slope was observed in the lower frequency region while flat slope was observed in the higher frequency. The turbulence could be the reason behind the flat spectrum observed in the XRT PDS. Power in the PDS follows as, , where f is the frequency and is powerlaw index. In the most PDS, we found , i.e., flat spectra. It indicates the presence of turbulence in the Keplerian disk. No break was found in power density spectra. This also indicates no or minimal contribution of the Keplerian disk accretion. Precisely, this is found from the spectral analysis.
5.3. Absence of QPOs
We believe that the oscillation of shock is responsible for the QPOs [33]. Generally strong type-C QPOs are observed if the resonance condition is satisfied, i.e., when the infall time of the post-shock matter roughly matches with the cooling time inside the CENBOL. The cooling process could be via inverse-Compton scattering, bremsstrahlung, or synchrotron emission. If the magnetic field is high enough, one can expect the dominance of the synchrotron cooling.
We did not observe any prominent type-C QPOs during the 2015 outburst of V404 Cygni. Non-satisfaction of the resonance condition could be responsible for it. To verify this assertion, we calculated synchrotron and Compton cooling times for this source. We found that the Compton cooling rate is much faster than the synchrotron cooling rate. Thus, the Compton cooling process was the dominant cooling process. We compared Compton cooling time and synchrotron cooling time with the infall time. We found that the infall time and cooling times were not comparable at all (see Table 4). C15 showed that QPO would be generated if the ratio of the infall and the cooling time is between and , i.e., within 50% of unity either way. Since the resonance condition was not satisfied, type-C QPO was not produced.
Huppenkothen et al., 2017 reported of detection of mHz QPO with Chandra, Swift/XRT and Fermi observations [58]. They reported simultaneous detection of 18 mHz QPO with Swift/XRT and Fermi/GBM. They classified this QPO as a new type of low-frequency QPO. Chandra/ACIS observation revealed signatures of 73 mHz and Hz QPOs, as well as a QPO at 136 mHz in a single Swift/XRT. They argued that the QPO at 136 mHz is standard type-C QPO. However, they did not seem to be type-C QPOs. However, Radhika et al. also argued that they did not find any clear signature of this QPO [20]. Thus the resonance condition was not behind the origin of these QPOs. Non-satisfaction of the Rankine-Hugoniot conditions at the shock front could be the reason for this type of QPO [34].
5.4. Spectral and Temporal Evolution
V404 Cygni showed complex behavior during the 2015 outburst. We required two absorption models to fit the spectra: phabs model for interstellar absorption and pcfabs for the partial covering absorption. The later absorption may be due to disk wind emission or outflow emission [20,27]. We studied V404 Cygni till MJD 57198. After that, variable dust scattering rings were observed, and the dust halo started to dominate the field of view [59].
Some observations of V404 Cygni could not be fitted with simple disk blackbody and powerlaw models since a significant amount of reflection was present. In the first six observations, the DBB component was not required to fit the spectra (till MJD 57,193.56). After that, it was required occasionally. PL photon indices varied randomly between and . Overall, PL flux dominated over the thermal flux during the entire period of our observation. We often observed a ‘hump’ region after keV in the XRT data. This ‘reflection hump’ was extended up to ∼20 keV in the BAT data. Radhika et al. analyzed 0.5–150 keV combined XRT+BAT data using disk blackbody (diskbb) and PL models and found similar results [20]. Later, they used pexrav [60] model instead of ‘PL’ model for this reflection. In their analysis, the disk blackbody component was not required in a few observations. They found that photon indices varied randomly between and . Refs. [19,61,62] analyzed INTEGRAL/IBIS and INTEGRAL/SPI data with Comptonization model in the broad energy range of 20–650 keV. They required an additional cut-off in the energy range of 400–600 keV. They found that the Comptonization temperature was ∼40 keV with seed photon temperature ∼7 keV. This is very high for disk emission. They concluded that this emission could be of different origins, such as synchrotron emission from the jet.
We extracted the physical parameters of the accretion flows from each fit. We first fitted each spectrum by keeping all model input parameters free. We found a variation of in a narrow range of 9.5–11.5 with an average value of . This estimated mass of V404 Cygni agrees well with other reported values in the range of 9–12 [11,12,13]. We then re-fitted all the spectra by keeping frozen at mean value ( ) to extract values of other physical flow parameters during the outburst.
From the variation of the TCAF model fitted flow parameters (i.e., high dominance of over , and presence of strong shock () with a large CENBOL), we infer that the source was in the hard state at the beginning of the outburst. High ARR (∼14–22) also indicates this except in one observation made on 18 June 2015 (MJD 57,191.03). From the phenomenological model fittings, the dominance of powerlaw flux also indicates this. On 25 June 2015 (MJD 57,198), we observed that started to increase rapidly, although other parameters did not change much, leading to the softening of the spectra. At this last phase of our observation, we observed that ARR decreased with an increase in the Keplerian disk rate. During this phase, the source could be in the hard-intermediate state. In general, the spectral state classification is done based on the variation of ARR and the nature of QPO. Due to the absence of QPOs and the ARR’s complex behavior, we could not assert the exact state transition day, but the source likely entered in the hard-intermediate state on MJD 57,197.21 when was found to achieve its maximum rate. After this day, was found to increase rapidly. However, our classification may not be valid since the source showed rapid fluctuation in a very short timescale [24]. Motta et al. analyzed the time-resolved 0.5–10 keV Swift/XRT spectra and found that spectra shape changed in as short as ∼10 s [24].
The 2015 outburst is somewhat similar to the 2003 outburst of H 1743-322. Both outbursts occurred after long quiescence periods. Similar to the 2015 outburst of V404 Cygni, the 2003 outburst of H 1743-322, which also occurred after about 26 years, showed peculiar behavior with several flares and outflow activity. Thus it is possible that a huge amount of matter accumulated at a large pileup radius over a long period of the quiescence phase. With a sudden enhancement of viscosity, the outburst is triggered and leads to a violent and non-settling disk-jet activity [63].
5.5. Evolution of the Spectral Properties with Flares
The present outburst of V404 Cygni did not behave like any other typical outburst of a classical transient black hole. V404 Cygni showed a strong jet associated with several flares. The flares were observed in multi-wavebands, from X-ray, optical, IR to radio [19,64]. Eighteen X-ray flares were reported with the INTEGRAL and SWIFT/BAT observations between 20 June 2015 (MJD 57,193) and 25 June 2015 (MJD 57198). The magnetic field was the strongest during this phase of the outburst. The magnetic field could be responsible for this flaring activity.
In general, we see a decreasing ARR in an observation immediately after a flare, indicating softening of the spectra (see Figure 6). For example, an X-ray flare was observed on MJD 57,194.31 [19]. This could be due to the high magnetic field on MJD 57,194.16. Immediately after the flare, on MJD 57,194.54, we found that the ARR decreased slightly from its previous observation ( to ). On 18 June 2015 (MJD 57,191) we observed that the Keplerian disk rate suddenly rose to from within ∼30 mins. This could be associated with the radio flare observed on MJD 57,191.09 with AMI-LA observation [17]. This is expected since a large amount of mass was ejected from the CENBOL during a flare, and inflowing matter rapidly moved inward to fill the vacant space. This led to the softening of the spectrum as the CENBOL size was reduced. However, this was not observed after every flare. It is possible that those flares were not localized, and the disk was unstable. Around MJD 57,198, we found that decreased sharply, although N increased very rapidly. This could be due to the high magnetic field that produced flare and outflow. This flare and the outflow was responsible for the rapid rise of N. Additionally, flaring events could also contribute to the rapid variability. On 21 June 21 2015 (MJD 57,194), the was observed to be at an increasing N. On the same day, the rapid variation of the spectral properties was observed [65], although the mass accretion rates did not change.
The X-ray jet flux can be calculated based on the deviation of the constancy of the TCAF model normalization [52,53,54]. However, to calculate jet X-ray flux by this model, we must have at least one observation where the jet’s effects were negligible. In that observation, the entire observed X-ray should be contributed only from the inflowing matter of the accretion disk and CENBOL. However, for V404 Cygni, a strong jet was present in all the observations. Thus we were not able to separate the jet X-ray contribution from the total X-ray. Random variation in normalization may be due to a fluctuating magnetic field or unsettling disk, leading to the source’s flaring activity.
6. Summary
The first epoch of the 2015 outburst of the Galactic black hole V404 Cygni was unusual and violent. It did not behave like other typical outbursts of Galactic transient black hole candidates. Rapid variations were observed in both spectral and timing properties in very short time scales, ranging from a few minutes to hours. We have used 0.5–150 keV combined Swift/XRT and Swift/BAT data to study the accretion flow properties of the source. Spectral analysis was done using the TCAF model-based fits file in XSPEC. The model fitted/derived flow parameters allowed us to understand the evolution of this violent outburst’s accretion flow parameters. We have also calculated the equipartition magnetic field for the outburst. No break is found in the power density spectra, which indicates that the Keplerian disk rate was very low. This is also confirmed from the spectral analysis. The presence of white noise in higher frequencies in the power density spectra indicates a highly turbulent disk. The strong magnetic field could be the reason behind it. It is also responsible for the flares. We find that the Compton cooling process is much faster than the synchrotron cooling process. Since the resonance condition between cooling and infall time scales inside the CENBOL is not satisfied, we did not expect any sharp low-frequency QPO. Indeed the object did not show any signature of prominent type-C QPO.
Author Contributions
Conceptualization, S.K.C.; Data curation, A.J.; Formal analysis, A.J.; Methodology, A.J.; Software, D.D. and S.K.C.; Supervision, D.D., S.K.C. and H.-K.C.; Writing—original draft, Arghajit Jana; Writing—review & editing, J.-R.S., D.D., S.K.C., D.C. and H.-K.C. All authors have read and agreed to the published version of the manuscript.
Funding
This research received no external funding.
Institutional Review Board Statement
Not applicable.
Informed Consent Statement
Not applicable.
Data Availability Statement
All data used here, are publicly available.
Acknowledgments
This work made use of XRT and BAT data supplied by the UK Swift Science Data Centre at the University of Leicester. We acknowledge anonymous referee for his kind suggestion to improve the quality of the paper. A.J. and D.D. acknowledge support from DST/GITA sponsored India-Taiwan collaborative project (GITA/DST/TWN/P-76/2017) fund. Research of D.D. and S.K.C. is supported in part by the Higher Education Dept. of the Govt. of West Bengal, India. D.D. also acknowledges the ISRO sponsored RESPOND project (ISRO/RES/2/418/17-18) fund. D.C. and D.D. acknowledge support from DST/SERB sponsored Extra Mural Research project (EMR/2016/003918) fund. J.-R.S., and H.-K.C. are supported by MOST of Taiwan under grants MOST/106-2923-M-007-002-MY3 and MOST/107-2119-M-007-012.
Conflicts of Interest
The authors declare no conflict of interest.
Abbreviations
| TCAF | Two components advective flow |
| CENBOL | CENtrifugal pressure supported BOundary Layer |
| QPO | Quasi periodic oscillation |
| XRT | X-ray telescope |
| BAT | Burst alert telescope |
References
- Shakura, N.I.; Sunyaev, R.A. Black holes in binary systems: Observational appearance. Astron. Astrophys. 1973, 24, 337–355. [Google Scholar]
- Sunyaev, R.A.; Titarchuk, L.G. Comptonization of X-rays in plasma clouds. Typical radiation spectra. Astron. Astrophys. 1980, 86, 121–138. [Google Scholar]
- Sunyaev, R.A.; Titarchuk, L.G. Comptonization of low-frequency radiation in accretion disks Angular distribution and polarization of hard radiation. Astron. Astrophys. 1985, 143, 374–388. [Google Scholar] [CrossRef]
- Chakrabarti, S.K.; Titarchuk, L.G. Spectral Properties of Accretion Disks around Galactic and Extragalactic Black Holes. Astrophys. J. 1995, 455, 623. [Google Scholar] [CrossRef] [Green Version]
- Chakrabarti, S.K. Spectral Properties of Accretion Disks around Black Holes. II. Sub-Keplerian Flows with and without Shocks. Astrophys. J. 1997, 484, 313. [Google Scholar] [CrossRef] [Green Version]
- Zdziarski, A.A.; Zycki, P.T.; Svensson, R.; Boldt, E. On Compton Reflection in the Sources of the Cosmic X-Ray Background. Astrophys. J. 1993, 405, 125–129. [Google Scholar] [CrossRef]
- Haardt, F.; Maraschi, L. X-ray Spectra from Two-Phase Accretion Disks. Astrophys. J. 1993, 413, 507–517. [Google Scholar] [CrossRef]
- Esin, A.A.; McClintock, J.E.; Narayan, R. Advection-Dominated Accretion and the Spectral States of Black Hole X-Ray Binaries: Application to Nova Muscae 1991. Astrophys. J. 1997, 489, 865. [Google Scholar] [CrossRef] [Green Version]
- Ritcher, G.A. PG 0818+513—An Eclipsing Binary. Inf. Bul. Var. Stars 1989, 3362, 1. [Google Scholar]
- Barthelmy, S.D.; DÁi, A.; DÁvanzo, P.; Krimm, H.A.; Lien, A.Y.; Marshall, F.E.; Maselli, A.; Siegel, M.H. Swift trigger 643949 is V404 Cyg. GCN Circ. 2015, 17929. [Google Scholar]
- Casares, J.; Charles, P.A.; Naylor, T. A 6.5-day periodicity in the recurrent nova V404 Cygni implying the presence of a black hole. Nature 1992, 355, 614. [Google Scholar] [CrossRef]
- Shahbaz, T.; Ringwald, F.A.; Bunn, J.C.; Naylor, T.; Charles, P.A.; Casares, J. The mass of the black hole in V404 Cygni. MNRAS 1994, 271, L10. [Google Scholar] [CrossRef] [Green Version]
- Khargharia, J.; Froning, C.S.; Robinson, E.L. Near-infrared Spectroscopy of Low-mass X-ray Binaries: Accretion Disk Contamination and Compact Object Mass Determination in V404 Cyg and Cen X-4. Astrophys. J. 2010, 716, 1105. [Google Scholar] [CrossRef]
- Miller-Jones, J.C.A.; Jonker, P.G.; Dhawan, V.; Brisken, W.; Rupen, M.P.; Nelemans, G.; Gallo, E. The First Accurate Parallax Distance to a Black Hole. Astrophys. J. 2009, 706, L230. [Google Scholar] [CrossRef]
- Walton, D.J.; Mooley, K.; King, A.L.; Tomsick, J.A.; Miller, J.M.; Dauser, T.; García, J.A.; Bachetti, M.; Brightman, M.; Fabian, A.C.; et al. Living on a Flare: Relativistic Reflection in V404 Cyg Observed by NuSTAR during Its Summer 2015 Outburst. Astrophys. J. 2017, 839, 110. [Google Scholar] [CrossRef] [Green Version]
- Negoro, H.; Matsumitsu, T.; Mihara, T.; Serino, M.; Matsuoka, M.; Nakahira, S.; Ueno, S.; Tomida, H.; Kimura, M.; Ishikawa, M.; et al. MAXI/GSC detection of a new outburst from the Galactic black hole candidate GS 2023+338 (V* V404 Cyg). ATel 2015, 7646, 1. [Google Scholar]
- Mooley, K.; Fender, R.; Anderson, G.; Staley, T.; Kuulkers, E.; Rumsey, C. Bright radio flaring from V404 Cyg detected by AMI-LA. Astron. Telegr. 2015, 7658, 1. [Google Scholar]
- Gazeas, K.; Vasilopoulos, G.; Petropoulou, M.; Sapountzis, K. Optical follow-up of V404 Cyg during the current enhanced activity. Astron. Telegr. 2015, 7650, 1. [Google Scholar]
- Rodriguez, J.; Cadolle Bel, M.; Alfonso-Garzón, J.; Siegert, T.; Zhang, X.-L.; Grinberg, V.; Savchenko, V.; Tomsick, J.A.; Chenevez, J.; Clavel, M.; et al. Correlated optical, X-ray, and γ-ray flaring activity seen with INTEGRAL during the 2015 outburst of V404 Cygni. Astron. Astrophys. 2015, L581, 9. [Google Scholar] [CrossRef] [Green Version]
- Radhika, D.; Nandi, A.; Agrawal, V.K.; Mandal, S. SWIFT view of the 2015 outburst of GS 2023+338 (V404 Cyg): Complex evolution of spectral and temporal characteristics. Mon. Not. R. Astron. Soc. 2016, 462, 1834. [Google Scholar] [CrossRef] [Green Version]
- Tetarenko, A.J.; Sivakoff, G.R.; Miller-Jones, J.C.A.; Rosolowsky, E.W.; Petitpas, G.; Gurwell, M.; Wouterloot, J.; Fender, R.; Heinz, S.; Maitra, D.; et al. Extreme jet ejections from the black hole X-ray binary V404 Cygni. Mon. Not. R. Astron. Soc. 2017, 469, 3141–3162. [Google Scholar] [CrossRef] [Green Version]
- Tetarenko, A.J.; Sivakoff, G.R.; Miller-Jones, J.C.A.; Bremer, M.; Mooley, K.P.; Fender, R.P.; Rumsey, C.; Bahramian, A.; Altamirano, D.; Heinz, S.; et al. Tracking the variable jets of V404 Cygni during its 2015 outburst. Mon. Not. R. Astron. Soc. 2019, 482, 2950. [Google Scholar] [CrossRef] [Green Version]
- Miller-Jones, J.C.A.; Tetarenko, A.J.; Sivakoff, G.R. A rapidly changing jet orientation in the stellar-mass black-hole system V404 Cygni. Nature 2019, 569, 374. [Google Scholar] [CrossRef] [PubMed]
- Motta, S.E.; Kajava, J.J.E.; Sanchez-Fernandez, C.; Beardmore, A.P.; Sanna, A.; Page, K.L.; Fender, R.; Altamirano, D.; Charles, P.; Giustini, M.; et al. Swift observations of V404 Cyg during the 2015 outburst: X-ray outflows from super-Eddington accretion. Mon. Not. R. Astron. Soc. 2017, 471, 1797. [Google Scholar] [CrossRef] [Green Version]
- Siegert, T.; Diehl, R.; Greiner, J.; Krause, M.G.H.; Beloborodov, A.M.; Bel, M.C.; Guglielmetti, F.; Rodriguez, J.; Strong, A.W.; Zhang, X. Positron annihilation signatures associated with the outburst of the microquasar V404 Cygni. Nature 2016, 531, 341. [Google Scholar] [CrossRef] [Green Version]
- Loh, A.; Corbel, S.; Dubus, G.; Rodriguez, J.; Grenier, I.; Hovatta, T.; Pearson, T.; Readhead, A.; Fender, R.; Mooley, K. High-energy gamma-ray observations of the accreting black hole V404 Cygni during its 2015 June outburst. Mon. Not. R. Astron. Soc. 2016, 462, L111. [Google Scholar] [CrossRef] [Green Version]
- King, A.L.; Miller, J.M.; Raymond, J.; Reynolds, M.T.; Morningstar, W. High-resolution Chandra HETG Spectroscopy of V404 Cygni in Outburst. Astrophys. J. 2015, 813, L37. [Google Scholar] [CrossRef] [Green Version]
- Chakrabarti, S.K. Theory of Transonic Astrophysical Flows; World Scientific: Singapore, 1990. [Google Scholar]
- Chakrabarti, S.K. Standing shocks in isothermal rotating winds and accretion. Mon. Not. R. Astron. Soc. 1989, 240, 7–21. [Google Scholar] [CrossRef] [Green Version]
- Chakrabarti, S.K. Estimation and effects of the mass outflow from shock compressed flow around compact objects. Astron. Astrophys. 1999, 351, 185–191. [Google Scholar]
- Chakrabarti, S.K.; D’Silva, S. Magnetic Activity in Thick Accretion Disks and Associated Observable Phenomena. I. Flux Expulsion. Astrophys. J. 1994, 424, 138. [Google Scholar] [CrossRef]
- D’Silva, S.; Chakrabarti, S.K. Magnetic Activity in Thick Accretion Disks and Associated Observable Phenomena. II. Flux Storage. Astrophys. J. 1994, 424, 149. [Google Scholar] [CrossRef]
- Molteni, D.; Sponholz, H.; Chakrabarti, S.K. Resonance Oscillation of Radiative Shock Waves in Accretion Disks around Compact Objects. Astrophys. J. 1996, 457, 805. [Google Scholar] [CrossRef] [Green Version]
- Ryu, D.; Chakrabarti, S.K.; Molteni, D. Zero-Energy Rotating Accretion Flows near a Black Hole. Astrophys. J. 1997, 474, 378. [Google Scholar] [CrossRef] [Green Version]
- Chakrabarti, S.K.; Mondal, S.; Debnath, D. Resonance condition and low-frequency quasi-periodic oscillations of the outbursting source H1743-322. Mon. Not. R. Astron. Soc. 2015, 452, 3451–3456. [Google Scholar] [CrossRef] [Green Version]
- Remillard, R.A.; McClintock, J.E. X-ray Properties of Black-Hole Binaries. Annu. Rev. Astron. Astrophys 2006, 44, 49. [Google Scholar] [CrossRef] [Green Version]
- Jana, A.; Jaisawal, G.K.; Naik, S.; Kumari, N.; Chhotaray, B.; Altamirano, D.; Remillard, R.A.; Gendreau, K.C. NICER observations of the black hole candidate MAXI J0637–430 during the 2019–2020 Outburst. Mon. Not. R. Astron. Soc. 2021, 504, 4793–4805. [Google Scholar] [CrossRef]
- Chakrabarti, S.K. MG14 Conf. Pro.; Ruffini, R., Jantzen, R., Bianchi, M., Eds.; World Scientific Press: Singapore, 2018; p. 369. [Google Scholar]
- Jana, A.; Debnath, D.; Chakrabarti, S.K.; Mondal, S.; Molla, A.A. Accretion Flow Dynamics of MAXI J1836-194 During Its 2011 Outburst from TCAF Solution. Astrophys. J. 2016, 819, 107. [Google Scholar] [CrossRef] [Green Version]
- Mondal, S.; Chakrabarti, S.K.; Nagarkoti, S.; Arévalo, P. Possible Range of Viscosity Parameters to Trigger Black Hole Candidates to Exhibit Different States of Outbursts. Astrophys. J. 2017, 850, 47. [Google Scholar] [CrossRef] [Green Version]
- Garain, S.K.; Ghosh, H.; Chakrabarti, S.K. Effects of Compton Cooling on Outflow in a Two-component Accretion Flow around a Black Hole: Results of a Coupled Monte Carlo Total Variation Diminishing Simulation. Astrophys. J. 2012, 758, 114. [Google Scholar] [CrossRef] [Green Version]
- Arnaud, K.A. XSPEC: The First Ten Years. ASP Conf. Ser. Astron. Data Anal. Softw. Syst. V Ed. G.H. Jacoby J. Barnes 1996, 101, 17. [Google Scholar]
- Debnath, D.; Mondal, S.; Chakrabarti, S.K. Implementation of two-component advective flow solution XSPEC. Mon. Not. R. Astron. Soc. 2014, 440, L121. [Google Scholar] [CrossRef] [Green Version]
- Debnath, D.; Mondal, S.; Chakrabarti, S.K. Characterization of GX 339-4 outburst of 2010-11: Analysis by XSPEC using two component advective flow model. Mon. Not. R. Astron. Soc. 2015, 447, 1984–1995. [Google Scholar] [CrossRef] [Green Version]
- Debnath, D.; Jana, A.; Chakrabarti, S.K.; Chatterjee, D.; Mondal, S. Accretion Flow Properties of Swift J1753.5-0127 during Its 2005 Outburst. Astrophys. J. 2017, 850, 92. [Google Scholar] [CrossRef] [Green Version]
- Jana, A.; Debnath, D.; Chatterjee, D.; Chatterjee, K.; Chakrabarti, S.K.; Naik, S.; Bhowmick, R.; Kumari, N. Accretion Flow Evolution of a New Black Hole Candidate MAXI J1348-630 during the 2019 Outburst. Astrophys. J. 2020, 897, 3. [Google Scholar] [CrossRef]
- Shang, J.-R.; Debnath, D.; Chatterjee, D.; Jana, A.; Chakrabarti, S.K.; Chang, H.-K.; Yap, Y.-X.; Chiu, C.-L. Evolution of X-Ray Properties of MAXI J1535-571: Analysis with the TCAF Solution. Astrophys. J. 2019, 875, 4. [Google Scholar] [CrossRef]
- Chatterjee, K.; Debnath, D.; Chatterjee, D.; Jana, A.; Chakrabarti, S.K. Inference on accretion flow properties of XTE J1752-223 during its 2009-10 outburst. Mon. Not. R. Astron. Soc. 2020, 493, 2452–2462. [Google Scholar] [CrossRef]
- Chatterjee, D.; Debnath, D.; Chakrabarti, S.K.; Mondal, S.; Jana, A. Accretion Flow Properties of MAXI J1543-564 during 2011 Outburst from the TCAF Solution. Astrophys. J. 2016, 827, 88. [Google Scholar] [CrossRef] [Green Version]
- Molla, A.A.; Debnath, D.; Chakrabarti, S.K.; Monda, S. Estimation of the mass of the black hole candidate MAXI J1659-152 using TCAF and POS models. Mon. Not. R. Astron. Soc. 2016, 460, 3163–3169. [Google Scholar] [CrossRef] [Green Version]
- Jana, A.; Jaisawal, G.K.; Naik, S.; Kumari, N.; Chatterjee, D.; Chatterjee, K.; Bhowmick, R.; Chakrabarti, S.K.; Chang, H.-K.; Debnath, D. Accretion Properties of MAXI J1813-095 during its Failed Outburst in 2018. Res. Astron. Astrophys. 2021, 21, 125. [Google Scholar]
- Jana, A.; Chakrabarti, S.K.; Debnath, D. Properties of X-Ray Flux of Jets during the 2005 Outburst of Swift J1753.5-0127 Using the TCAF Solution. Astrophys. J. 2017, 850, 91. [Google Scholar] [CrossRef] [Green Version]
- Jana, A.; Debnath, D.; Chakrabarti, S.K.; Chatterjee, D. Inference on disk-jet connection of MAXI J1836-194 from spectral analysis with the TCAF solution. Res. Astron. Astrophys. 2020, 20, 28. [Google Scholar] [CrossRef]
- Chatterjee, D.; Debnath, D.; Jana, A.; Chakrabarti, S.K. Properties of the black hole candidate XTE J1118+480 with the TCAF solution during its jet activity induced 2000 outburst. Astrophys. Space Sci. 2019, 364, 14. [Google Scholar] [CrossRef] [Green Version]
- Koljonen, K.I.I.; Tomsick, J.A. The obscured X-ray binaries V404 Cyg, Cyg X–3, V4641 Sgr, and GRS 1915+105. Astron. Astrophys. 2020, 639, 13. [Google Scholar] [CrossRef]
- Dallilar, Y.; Eikenberry, S.S.; Garner, A.; Stelter, R.D.; Gottlieb, A.; Gandhi, P.; Casella, P.; Dhillon, V.S.; Marsh, T.R.; et al. A precise measurement of the magnetic field in the corona of the black hole binary V404 Cygni. Science 2017, 358, 1299–1302. [Google Scholar] [CrossRef] [Green Version]
- Rybicki, G.B.; Lightman, A.P. Radiative processes in Astrophysics; Wiley: New York, NY, USA, 1979. [Google Scholar]
- Huppenkothen, D.; Younes, G.; Ingram, A.; Kouveliotou, C.; Gogus, E.; Bachetti, M.; Sánchez-Fernández, C.; Chenevez, J.; Motta, S.; van der Klis, M.; et al. Detection of Very Low-frequency, Quasi-periodic Oscillations in the 2015 Outburst of V404 Cygni. Astrophys. J. 2017, 834, 90. [Google Scholar] [CrossRef] [Green Version]
- Vasilopoulos, G.; Petropoulou, M. The X-ray dust-scattered rings of the black hole low-mass binary V404 Cyg. Mon. Not. R. Astron. Soc. 2016, 455, 4426–4441. [Google Scholar] [CrossRef] [Green Version]
- Magdziarz, P.; Zdziarski, A.A. Angle-dependent Compton reflection of X-rays and gamma-rays. Mon. Not. R. Astron. Soc. 1995, 273, 837–848. [Google Scholar] [CrossRef] [Green Version]
- Natalucci, L.; Fiocchi, M.; Bazzano, A.; Ubertini, P.; Roques, J.-P.; Jourdain, E. High Energy Spectral Evolution of V404 Cygni during the 2015 June Outburst as Observed by INTEGRAL. Astrophys. J. 2015, 813, L21. [Google Scholar] [CrossRef] [Green Version]
- Roques, J.-P.; Jourdain, E.; Bazzano, A.; Fiocchi, M.; Natalucci, L.; Ubertini, P. First INTEGRAL Observations of V404 Cygni during the 2015 Outburst: Spectral Behavior in the 20–650 keV Energy Range. Astrophys. J. 2015, 813, L22. [Google Scholar] [CrossRef] [Green Version]
- Chakrabarti, S.K.; Nagarkoti, S.; Debnath, D. Delayed outburst of H 1743-322 in 2003 and relation with its other outbursts. Adv. Space Res. 2019, 63, 3749–3759. [Google Scholar] [CrossRef] [Green Version]
- Gandhi, P.; Littlefair, S.P.; Hardy, L.K.; Dhillon, V.S.; Marsh, T.R.; Shaw, A.W.; Altamirano, D.; Caballero-Garcia, M.D.; Casares, J.; Casella, P.; et al. Furiously fast and red: Sub-second optical flaring in V404 Cyg during the 2015 outburst peak. Mon. Not. R. Astron. Soc. 2016, 459, 554–572. [Google Scholar] [CrossRef] [Green Version]
- Kajava, J.J.E.; Sánchez-Fernández, C.; Alfonso-Garzón, J.; Motta, S.E.; Veledina, A. Rapid spectral transition of the black hole binary V404 Cygni. Astron. Astrophys. 2020, 634, 94. [Google Scholar] [CrossRef]
Figure 1.
In upper panel, cartoon diagrams of four commonly observed spectral states under TCAF solution are shown (adopted from [38]). Brown, light green, dark green and grey region represent Keplerian disk, sub-Keplerian halo, CENBOL and jet, respectively. An outbursting black hole evolves as HS → HIMS → SIMS → SS → SIMS → HIMS → HS. Generally both rising and declining HS and HIMS show monotonically evolving type-C (low frequency) QPOs, and SIMS shows sporadic type-B or type-A QPO. In soft sate these QPOs are absent. Here, EQPO means evolving QPO; SQPO means sporadic QPO; NQPO means no QPO. In the bottom panel, theoretical spectra corresponding to the top paneled spectral states are shown. These spectra are generated using five input parameters ( in ; in ; in ; in , R), whose values are marked inset. The cartoon diagram and corresponding spectra are only for illustrative purpose.

Figure 2.
2D confidence contour plot for MJD 57,188.77, for − in the left panel and −R in the right panel.
Figure 2.
2D confidence contour plot for MJD 57,188.77, for − in the left panel and −R in the right panel.

Figure 3.
2D confidence contour plot for MJD 57189.62, for − in the left panel and − R in the right panel.
Figure 3.
2D confidence contour plot for MJD 57189.62, for − in the left panel and − R in the right panel.

Figure 4.
Power density spectra (PDS) of 0.01 s time binned lightcurves of 0.5–10 keV XRT data. The observation date of these PDS are: (a) 18 June 2015 (MJD 57,191.01) and (b) 21 June 2015 (MJD 57,194.54).
Figure 4.
Power density spectra (PDS) of 0.01 s time binned lightcurves of 0.5–10 keV XRT data. The observation date of these PDS are: (a) 18 June 2015 (MJD 57,191.01) and (b) 21 June 2015 (MJD 57,194.54).

Figure 5.
TCAF model fitted combined XRT+BAT spectra in the energy range of 0.5–150 keV, observed on MJD 57,191.03.
Figure 5.
TCAF model fitted combined XRT+BAT spectra in the energy range of 0.5–150 keV, observed on MJD 57,191.03.

Figure 6.
Panel (a) shows variation of 0.5–10 keV XRT and 15–150 keV BAT flux with day (MJD). The red (online) triangle represents XRT flux while blue (online) circle represents BAT flux. The fluxes are in the unit of . The variation of (b) in and (c) in are shown with day (MJD). In panel (d) the variation of ARR (=) is shown. Blue and red dotted lines represent reported X-ray and Radio flaring activities, respectively.

Figure 7.
The variation (a) equipartition magnetic field () in , (b) shock location () in , (c) shock compression ratio (R) and (d) normalization (N) are shown with day (MJD).
Figure 7.
The variation (a) equipartition magnetic field () in , (b) shock location () in , (c) shock compression ratio (R) and (d) normalization (N) are shown with day (MJD).

Figure 8.
Time resolved BAT spectra for observation on MJD 57,188.77 is shown. The spectra correspond to exposures of (a) 220 s, (b) 680 s and (c) 160 s.
Figure 8.
Time resolved BAT spectra for observation on MJD 57,188.77 is shown. The spectra correspond to exposures of (a) 220 s, (b) 680 s and (c) 160 s.


Table 1.
DBB+PL Model Fitted Spectral Analysis Results.
| Obs ID | Day | XRT exp | BAT exp | XRT Flux* | BAT Flux* | DBB Flux* | PL Flux* | CF | Γ | ||||
|---|---|---|---|---|---|---|---|---|---|---|---|---|---|
| (MJD) | (sec) | (sec) | (keV) | ||||||||||
| (1) | (2) | (3) | (4) | (5) | (6) | (7) | (8) | (9) | (10) | (11) | (12) | (13) | (14) |
| 00643949000 | 57,188.77 | — | 1202 | — | 9.01 | — | — | — | — | 71/53 | |||
| 00031403035 | 57,189.62 | 1970 | — | — | — | — | 714/944 | ||||||
| 00031403038 | 57,191.01 | 610 | — | — | — | — | 1013/946 | ||||||
| 00644520000 | 57,191.03 | 217 | 1202 | — | — | 394/250 | |||||||
| 00031403042 | 57,192.16 | 1262 | — | — | — | — | 1339/931 | ||||||
| 00645176000 | 57,193.56 | — | 542 | — | — | — | — | — | 56/51 | ||||
| 00031403048 | 57,194.16 | 4208 | — | — | — | — | 970/889 | ||||||
| 00031403046 | 57,194.54 | 240 | 7 | — | — | — | — | 1437/882 | |||||
| 00031403045 | 57,195.08 | 930 | — | — | 1192/928 | ||||||||
| 00031403049 | 57,195.35 | 2977 | — | — | 1282/702 | ||||||||
| 00031403047 | 57,195.41 | 1903 | — | — | — | — | — | — | 975/713 | ||||
| 00031403052 | 57,196.89 | 275 | — | — | 1061/941 | ||||||||
| 00031403054 | 57,197.21 | 682 | 5 | 1409/979 | |||||||||
| 00031403053 | 57,197.33 | 1052 | 518 | — | — | — | — | 1107/998 | |||||
| 00031403055 | 57,198.00 | 1028 | — | — | 1250/926 | ||||||||
| 00031403056 | 57,198.02 | 818 | 713 | 1328/994 | |||||||||
| 00031403057 | 57,198.15 | — | 745 | — | — | — | — | — | 39/50 | ||||
| 00031403058 | 57,198.93 | 1312 | — | — | 1322/928 | ||||||||
| 00646721000 | 57,199.52 | — | 965 | — | — | — | — | 41/49 |
In Col. 2, UT dates of the year 2015 are mentioned in dd-mm format. In Cols. 4 & 5, XRT and exposures are mentioned. In Cols. 6 and 7, XRT (0.5–10 keV) and BAT (15–150 keV) fluxes are mentioned. In Cols. 8 and 9, model fitted disk blackbody (DBB) and powerlaw (PL) fluxes are mentioned. All fluxes are in the units of . and are in the unit of cm−2. is Hydrogen column density for interstellar absorption. is Hydrogen column density for partial covering absorption. The Fe emission line energy and are mentioned in Col. 15 and 16. Best fitted values of and degrees of freedom are mentioned in Col. 17 as .
Table 2.
TCAF Model Fitted Spectral Analysis Results.
| Obs ID | UT Date | Day | ARR | R | N | Fe.Line | LW | |||||||
|---|---|---|---|---|---|---|---|---|---|---|---|---|---|---|
| (DD-MM) | () | () | () | (/) | () | |||||||||
| (1) | (2) | (3) | (4) | (5) | (6) | (7) | (8) | (9) | (10) | (11) | (12) | (13) | (14) | (15) |
| 00643949000 | 15-06 | 57,188.77 | — | — | — | — | 69/51 | |||||||
| 00031403035 | 16-06 | 57,189.62 | — | — | 708/899 | |||||||||
| 00031403038 | 18-06 | 57,191.01 | 929/937 | |||||||||||
| 00644520000 | 18-06 | 57,191.03 | 338/281 | |||||||||||
| 00031403042 | 19-06 | 57,192.16 | 932/787 | |||||||||||
| 00645176000 | 20-06 | 57,193.56 | — | — | — | — | 54/49 | |||||||
| 00031403048 | 21-06 | 57,194.16 | — | — | 1086/899 | |||||||||
| 00031403046 | 21-06 | 57,194.54 | — | — | 1399/797 | |||||||||
| 00031403045 | 22-06 | 57,195.08 | 1117/928 | |||||||||||
| 00031403049 | 22-06 | 57,195.35 | 1067/707 | |||||||||||
| 00031403047 | 22-06 | 57,195.41 | — | — | 982/709 | |||||||||
| 00031403052 | 23-06 | 57,196.89 | 1001/937 | |||||||||||
| 00031403054 | 24-06 | 57,197.21 | 1405/981 | |||||||||||
| 00031403053 | 24-06 | 57,197.33 | — | — | 1213/991 | |||||||||
| 00031403055 | 25-06 | 57,198.00 | 937/727 | |||||||||||
| 00031403056 | 25-06 | 57,198.02 | 1303/994 | |||||||||||
| 00031403057 | 25-06 | 57,198.15 | — | — | — | — | 41/51 | |||||||
| 00031403058 | 25-06 | 57,198.93 | 1423/943 | |||||||||||
| 00646721000 | 26-06 | 57,199.52 | — | — | — | — | 36/51 |
In Col. 2, UT dates of the year 2015 are mentioned in dd-mm format. and are in the unit of cm−2. is Hydrogen column density for interstellar absorption. is Hydrogen column density for partial covering absorption. TCAF model fitted/derived parameters are mentioned in Cols. 7–12. The Fe emission line energy and are mentioned in Col. 13 and 14. Best fitted values of and degrees of freedom are mentioned in Col. 15 as . Note: Mass of the black hole was kept frozen at during spectral fitting with the TCAF model fits file. The average values of 90% confidence ± values obtained using steppar command in XSPEC, are placed as superscripts of fitted parameter values.
Table 3.
Time Resolved BAT Spectra.
| Obs ID | Day | Spectra | Exposures | ARR | R | N | ||||
|---|---|---|---|---|---|---|---|---|---|---|
| (MJD) | (sec) | () | () | () | ||||||
| (1) | (2) | (3) | (4) | (5) | (6) | (7) | (8) | (9) | (10) | (11) |
| 00643949000 | 57,188.77 | 1202 | 69/51 | |||||||
| 1 | 220 | 66/51 | ||||||||
| 2 | 680 | 72/51 | ||||||||
| 3 | 160 | 59/51 | ||||||||
| 00644520000 | 57,191.03 | 1202 | 338/281 | |||||||
| 1 | 200 | 56/51 | ||||||||
| 2 | 220 | 61/51 | ||||||||
| 3 | 50 | 71/51 | ||||||||
| 4 | 150 | 57/51 | ||||||||
| 00645176000 | 57,193.56 | 542 | 54/49 | |||||||
| 1 | 150 | 62/49 | ||||||||
| 2 | 260 | 65/49 | ||||||||
| 00646721000 | 57,199.52 | 965 | 35/51 | |||||||
| 1 | 530 | 37/51 | ||||||||
| 2 | 40 | 36/51 |
TCAF fitted extracted parameters for time resolved BAT spectra in the energy range of 15–150 keV. Note: First row in each spectra are TCAF model fitted spectral analysis results when entire data exposure including gaps are used. The mass of the BH is frozen at during the fitting.
Table 4.
Magnetic field and Resonance condition.
| Obs ID | Day | |||||||||
|---|---|---|---|---|---|---|---|---|---|---|
| (MJD) | (1016) | (Gauss) | (s) | (s) | ||||||
| (1) | (2) | (3) | (4) | (5) | (6) | (7) | (8) | (9) | (10) | (11) |
| 00643949000 | 57,188.77 | |||||||||
| 00031403035 | 57,189.62 | |||||||||
| 00031403038 | 57,191.01 | |||||||||
| 00644520000 | 57,191.03 | |||||||||
| 00031403042 | 57,192.16 | |||||||||
| 00645176000 | 57,193.56 | |||||||||
| 00031403048 | 57,194.16 | |||||||||
| 00031403046 | 57,194.54 | |||||||||
| 00031403045 | 57,195.08 | |||||||||
| 00031403049 | 57,195.35 | |||||||||
| 00031403047 | 57,195.41 | |||||||||
| 00031403052 | 57,196.89 | |||||||||
| 00031403054 | 57,197.21 | |||||||||
| 00031403053 | 57,197.33 | |||||||||
| 00031403055 | 57,198.00 | |||||||||
| 00031403056 | 57,198.02 | |||||||||
| 00031403057 | 57,198.15 | |||||||||
| 00031403058 | 57,198.93 | |||||||||
| 00646721000 | 57,199.55 |
Electron number density () is in the unit of cm3.
Publisher’s Note: MDPI stays neutral with regard to jurisdictional claims in published maps and institutional affiliations. |
© 2021 by the authors. Licensee MDPI, Basel, Switzerland. This article is an open access article distributed under the terms and conditions of the Creative Commons Attribution (CC BY) license (https://creativecommons.org/licenses/by/4.0/).
Share and Cite
MDPI and ACS Style
Jana, A.; Shang, J.-R.; Debnath, D.; Chakrabarti, S.K.; Chatterjee, D.; Chang, H.-K. Study of Accretion Flow Dynamics of V404 Cygni during Its 2015 Outburst. Galaxies 2021, 9, 39. https://0-doi-org.brum.beds.ac.uk/10.3390/galaxies9020039
AMA Style
Jana A, Shang J-R, Debnath D, Chakrabarti SK, Chatterjee D, Chang H-K. Study of Accretion Flow Dynamics of V404 Cygni during Its 2015 Outburst. Galaxies. 2021; 9(2):39. https://0-doi-org.brum.beds.ac.uk/10.3390/galaxies9020039
Chicago/Turabian StyleJana, Arghajit, Jie-Rou Shang, Dipak Debnath, Sandip K. Chakrabarti, Debjit Chatterjee, and Hsiang-Kuang Chang. 2021. "Study of Accretion Flow Dynamics of V404 Cygni during Its 2015 Outburst" Galaxies 9, no. 2: 39. https://0-doi-org.brum.beds.ac.uk/10.3390/galaxies9020039
Note that from the first issue of 2016, this journal uses article numbers instead of page numbers. See further details here.