Article

Expression Analysis of XTH in Stem Swelling of Stem Mustard and Selection of Reference Genes

1
College of Horticulture, Sichuan Agricultural University, Chengdu 611130, China
2
Institute of Pomology and Olericulture, Sichuan Agricultural University, Chengdu 611130, China
*
Author to whom correspondence should be addressed.
Submission received: 28 November 2019 / Revised: 8 January 2020 / Accepted: 15 January 2020 / Published: 20 January 2020
(This article belongs to the Section Plant Genetics and Genomics)

Abstract

:
Accurate analysis of gene expression requires selection of appropriate reference genes. In this study, we report analysis of eight candidate reference genes (ACTIN, UBQ, EF-1α, UBC, IF-4α, TUB, PP2A, and HIS), which were screened from the genome and transcriptome data in Brassica juncea. Four statistical analysis softwares geNorm, NormFinder, BestKeeper, and RefFinder were used to test the reliability and stability of gene expression of the reference genes. To further validate the stability of reference genes, the expression levels of two CYCD3 genes (BjuB045330 and BjuA003219) were studied. In addition, all genes in the xyloglucan endotransglucosylase/hydrolase (XTH) family were identified in B. juncea and their patterns at different periods of stem enlargement were analyzed. Results indicated that UBC and TUB genes showed stable levels of expression and are recommended for future research. In addition, XTH genes were involved in regulation of stem enlargement expression. These results provide new insights for future research aiming at exploring important functional genes, their expression patterns and regulatory mechanisms for mustard development.

1. Introduction

Quantitative real-time PCR (qPCR) is considered an important method for detection and analysis of levels of gene expression. It has many advantages such as high accuracy, specificity, low cost, and reproducibility [1]. However, the accuracy of qPCR results is influenced by the quality of RNA, efficiency of reverse transcription, primer specificity, sample volume, and amplification efficiency [2]. In order to improve this accuracy, it is important to introduce one or more reference genes for standard correction expression. Reference genes are those that are expressed at all times for maintenance of the basic life activities of a cell, and their expression levels are less affected by the environmental factors. In plants, a number of reference genes have been identified including ACTIN, PP2A, and TUB and are now commonly used in gene expression analyses [3]. These genes are mainly involved in maintaining basic cellular functions such as cell structure and primary metabolism.
In recent years, there have been many studies suggesting that stable expression of reference genes varies with experimental conditions [4]. For example, ACTIN exhibits different expression patterns in different plants, tissues, and experimental conditions [5]. Study in Cannabis showed that UBQ was the most stable gene in different leaf samples, while PP2A was the most stable reference gene in different organs [6]. In garlic, UBQ and ACTIN are the most reliable reference genes and therefore recommended for analysis of different developmental stages and abiotic stress management, respectively [7]. UBQ gene was the most stable reference gene in sugarcane leaves under drought stress, while PP2A was the best reference gene under sorghum Mosaic virus [8]. Moreover, in Sorghum, PP2A was found to be the most stable gene in analysis of abiotic stress, while UBC showed the least stability [9]. Since reference genes do not always show a complete stable expression in response to various conditions or across species, their reassessment under certain conditions is crucial to validating accuracy during the calculated results of gene expression studies.
Plant growth and development involves cell wall loosening and remodeling. Cell wall loosening is the basis for rapid cell enlargement while cellulose-hemicellulose networks play a leading role in cell wall remodeling. This process is regulated by xyloglucan endotransglucosylase/hydrolase (XTH), an enzyme involved in root growth [10], stem elongation [11], flower development [12], as well as promoting fruit ripening [13]. A study of XTH genes in B. juncea showed that BjXTH1 and BjXTH2 could function in cell expansion of the pith tissue [14]. In addition, XTH also plays an important role in response to stresses. Overexpressing a pepper XTH gene CaXTH3 in Arabidopsis and tomato plants was found to confer high resistance to drought and salt stress in transgenic plants [15,16]. A PeXTH gene from Populus euphratica was also observed to mediate plant responses to salt stress in transgenic tobacco [17].
Stem mustard (Brassica juncea var. Tumida Tsen et Lee) is a variety of mustard and one of the unique vegetable crops in China. It belongs to the Cruciferous family and its tumor stems are bulged and protruded. Currently, studies on stem mustard are mainly focused on breeding, cultivation, and nutrient quality. There is a need for studying regulatory networks and molecular mechanisms of stem swelling targeting appropriate reference genes in different development stages of stem mustard. This is because of the importance of this trait in yield determination. In this study, we selected eight relatively stable reference genes from genome and transcriptome databases, and evaluated their expression levels in all samples during the process of stem development. We used four statistical softwares geNorm, NormFinder, BestKeeper, and RefFinder with two target genes, BjuB045330 and BjuA003219, that encode CYCD3 proteins for verification of the constant levels of the selected reference genes. All XTH genes were identified and screened in the B. juncea genome to understand their roles in stem swelling. The findings of this study will facilitate to future studies in mechanisms of development of stem mustard.

2. Materials and Methods

2.1. Plant RNA Extraction and cDNA Synthesis

The stem mustard variety “Fuza No.2” was planted in the teaching base of Chongzhou, Sichuan Agricultural University. Four stages of stem in stem mustard were selected: the diameter of stem in the stage 1 was 2 cm (S1), the diameter of stem in stage 2 was 4 cm (S2), the diameter of stem in stage 3 was 6 cm (S3), and the diameter of stem in stage 4 was 8 cm (S4) (Figure 1). Three biological replicates were set for each sample.
Total RNA was extracted from plant materials using the TransGene kit (Beijing, China) according to the manufacturer’s instructions. Quality and purity of the RNA were determined using a NanoDrop ND 2000 spectrophotometer (ThermoFischer, Waltham, MA, USA) and agarose gel electrophoresis. DNA contamination was eliminated from the RNA by DNAseI treatment, followed by synthesis of complementary DNA (cDNA) using the TransGene reverse transcription kits (Beijing, China).

2.2. Selection of Reference Genes, Primer Design, and Cloning

Eight candidate reference genes (ACTIN, UBQ, EF-1α, UBC, IF-4α, TUB, PP2A, and HIS) were selected from the whole-genome and transcriptome data based on homologous similarity in other plant species. Primers were designed using Primer Premier 6.0 software and are outlined in Table S1. The normal amplification system as follows: template cDNA: 1 µL, 2 µL of each primer (0.2 μM), 2.5 mm dNTPs, 10 × EasyTaq buffer 5 µL, EasyTaq enzyme 0.5 µL, ddH2O 37.5 µL, total 50 µL. PCR was carried out then amplification products confirmed using a 1% agarose gel electrophoresis. The products were cloned into the pEASY-T1 vector, and sent to TransGene (Beijing, China) for sequencing.

2.3. Real-Time Quantitative PCR Amplification (qPCR)

The qPCR was performed on BIO-RAD CFX96 quantitative PCR instrument (BIO-RAD, Hercules, CA, USA) with SYBR Premix Ex Taq (TransGene, Beijing, China). The 18-fold dilution of cDNA was used as the template to conduct qPCR for each gene. The standard curve of qPCR was performed using a 10-fold dilution series (10×, 10, 10, 10, 10) of non-experimental treated cDNA as a template. Each sample was repeated three times. Each reaction system was 20 µL, including 10 µL SYBR Green I mix, 0.4 µL each primer, 2.0 µL of diluted cDNA, and 7.2 µL of ddH2O. The PCR conditions are as follows: at 95 °C for 30 s for pre-denaturation, 40 cycles of denaturation at 95 °C for 5 s, annealing at 60 °C and extension for 30 s. A melting curve was analyzed from 65 °C to 95 °C to verify the primer specificity. Each 96-well plate contained a standard curve system and a cDNA-free system. The primer amplification efficiency of each candidate reference gene is expressed by the slope of the linear regression model: E% = (−1 + 10 [−1/slope]) × 100%.

2.4. Data Analysis and Evaluation of Stability of Reference Genes

The Cq value of each sample was obtained following qPCR. Three analysis software geNorm [18], NormFinder [19] and BestKeeper [20] were used to evaluate the stability of the reference genes, while RefFinder [21] was used to calculate the comprehensive ranking. Based on these analyses, the most moderately and the least stably expressed genes were selected as the standardized factors.

2.5. Identification of XTH Family Genes in B. juncea

We used XTH sequences in Arabidopsis thaliana from TAIR (https://www.arabidopsis.org/) as queries in BLAST to identify and retrieve BjuXTH genes in whole-genome sequence of B. juncea from the Brassica database website (BRAD) (http://brassicadb.org/brad/). BLAST analysis was carried out using default parameters. Candidate XTH proteins were further submitted to the Pfam and NCBI databases for verification of the structural domains. A multiple sequence alignment of XTH proteins from B. juncea and Arabidopsis was performed using Clustal W (http://clustalw.ddbj.nig.ac.jp/), followed by phylogenetic analysis using MEGA 5.0 (https://www.mega.com/).

2.6. Expression Analysis and Validation of XTH Using qPCR

Analysis of the stem mustard variety “Fuza No.2” transcriptome at different development stages (S1, S2, S3, and S4, respectively) was carried out. The data obtained by sequencing has been submitted to NCBI website, and the accession number is SRP151320. FPKM values used to reveal expression abundance of XTH genes. Nine differentially expressed XTH genes were selected from three subgroups. A qPCR analysis was then performed to validate the observed expression profiles of several XTH genes, with the best reference genes selected for normalization of gene expression. A trend line with a fitting coefficient R2 value closer to 1 was selected for regression analysis. The relative expression levels were calculated with the 2−ΔΔCt method [22].

3. Results

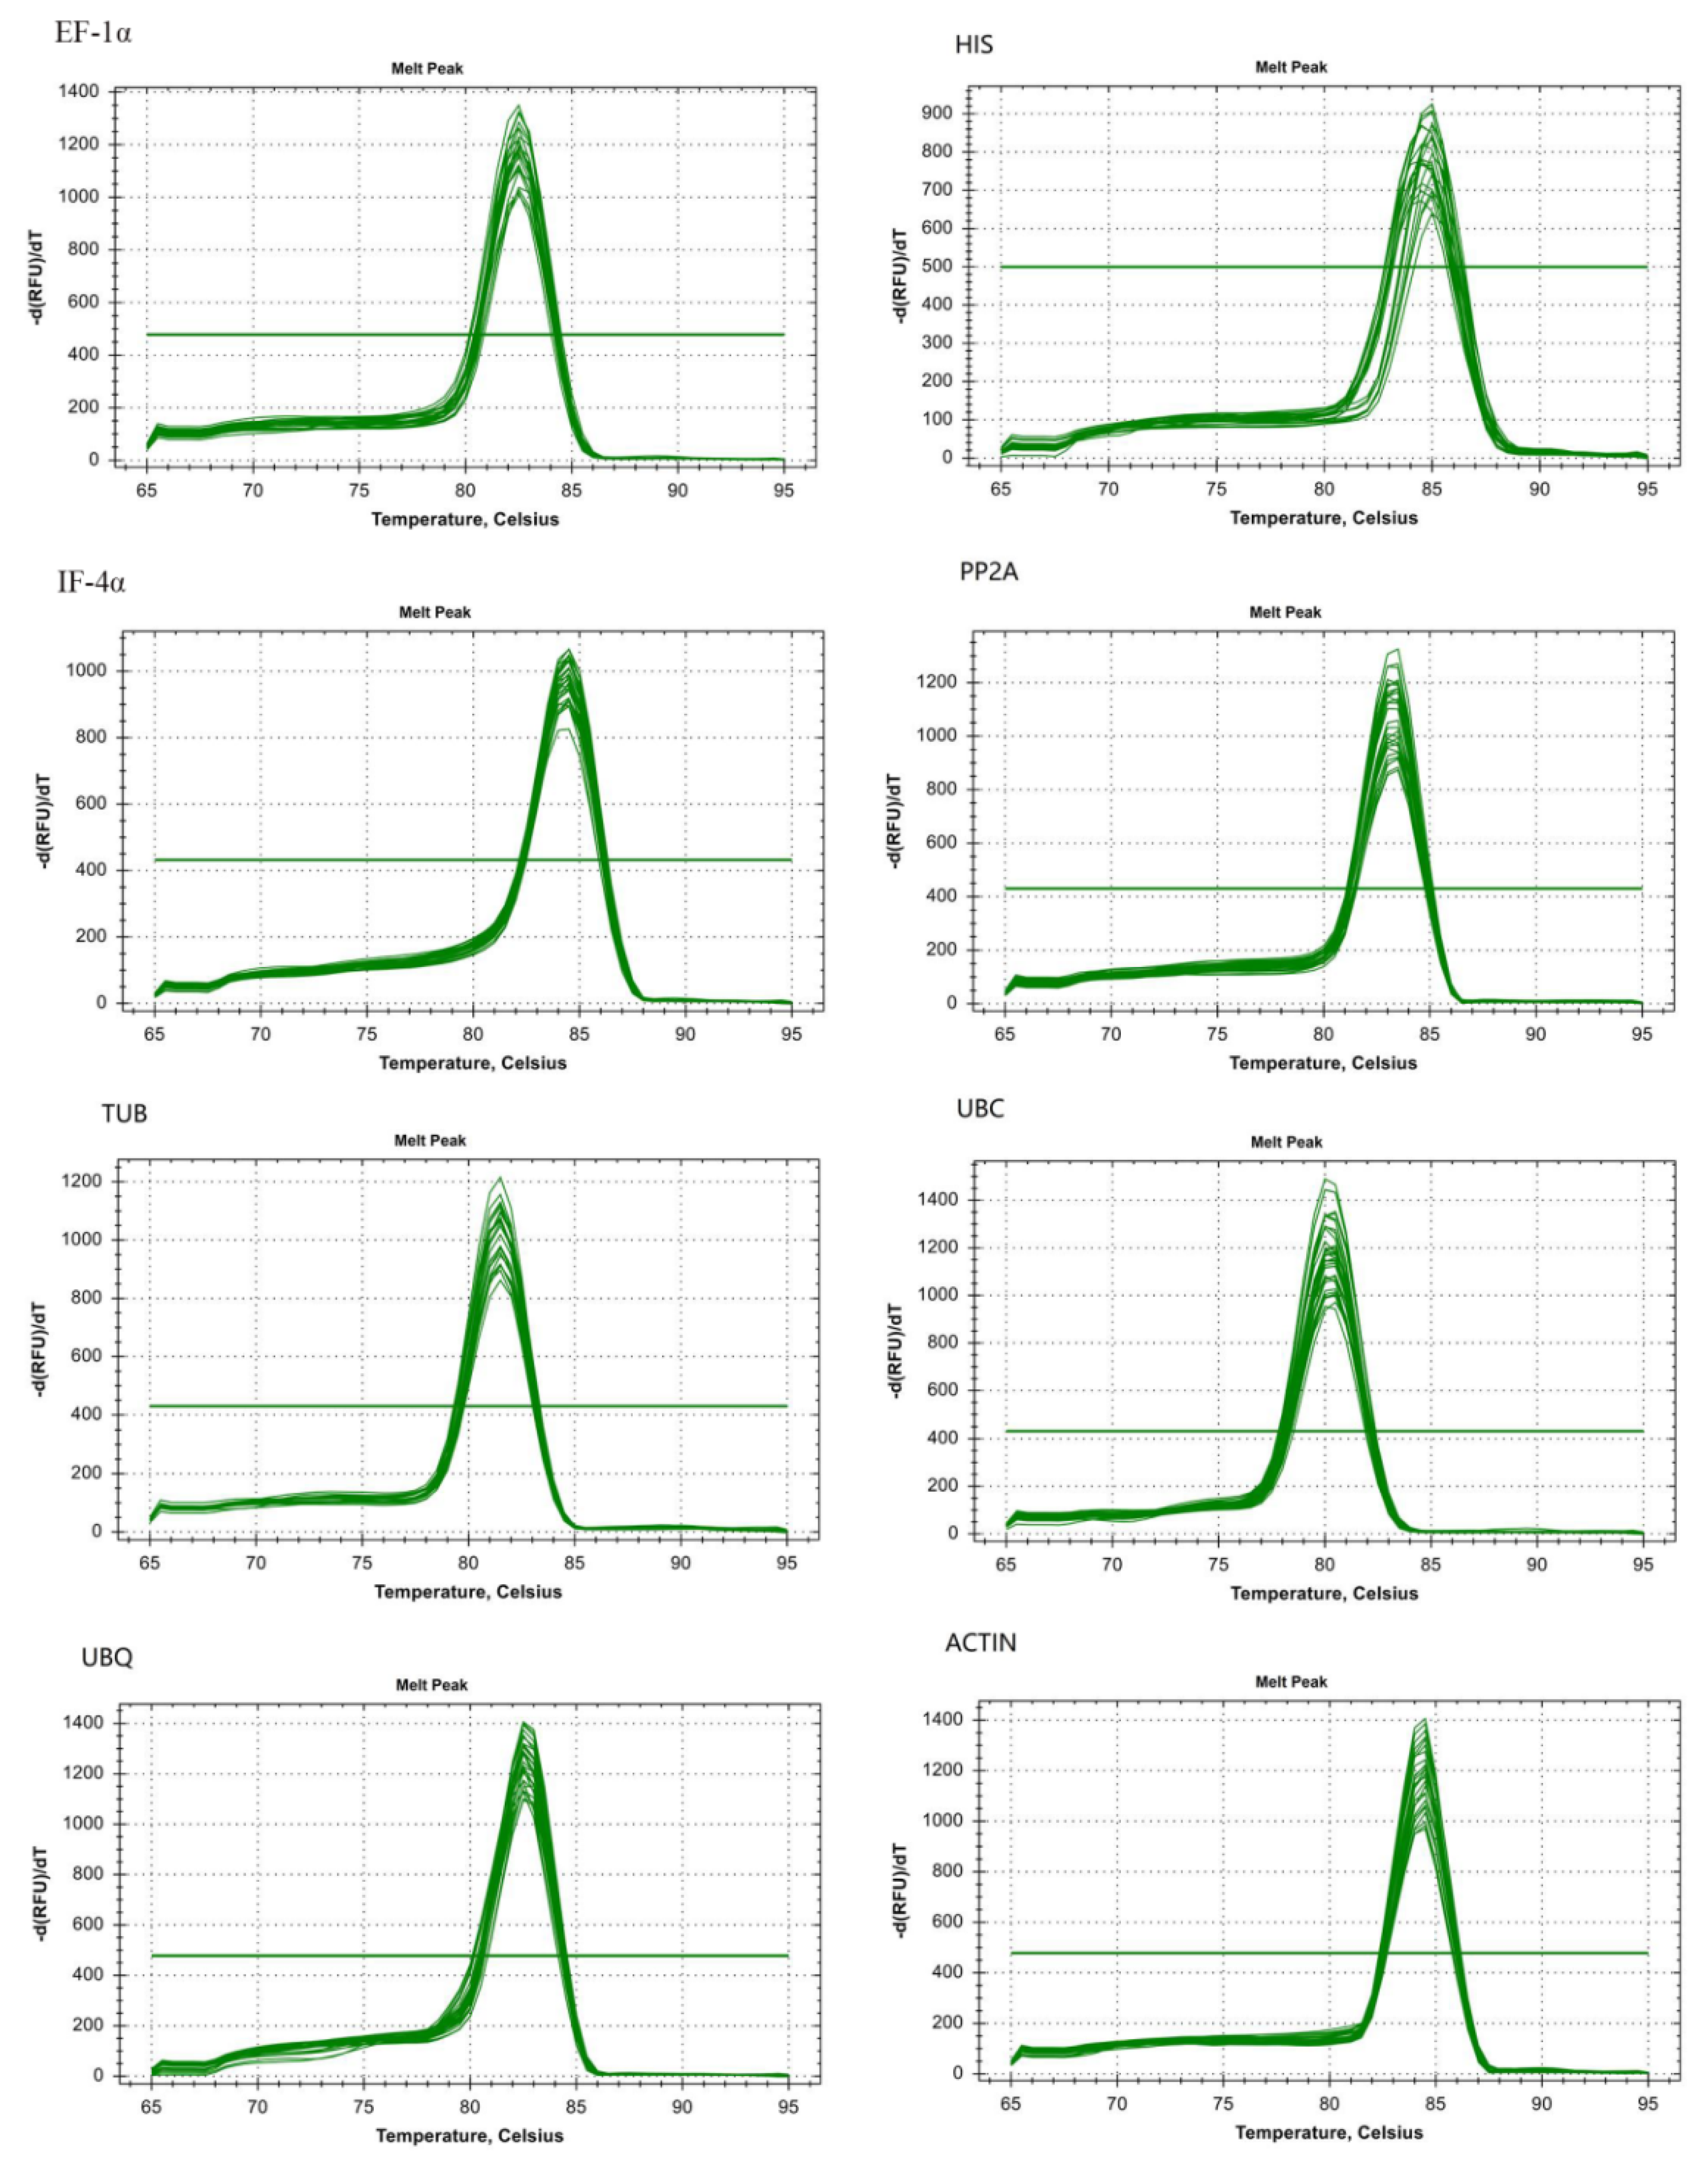
3.1. Specificity and Efficiency in Amplification of Candidate Reference Genes

The stem mustard cultivar “Fuza No.2” (Figure 1) was studied with specific primers of eight candidate reference genes (outlined Table S1) used for RT-PCR amplification. The candidate reference genes were cloned for use in subsequent experiments (Figure S1). Sequence information was submitted to NCBI website, with accession numbers from MN566462 to MN566469.
Eight genes were amplified by qPCR and resulted in products ranging from 100 to 267 bp (Table 1 and Figure S2). Analysis of melting curves for primer specificity resulted in a single peak with an expected amplification effect (Figure 2). A 10-fold cDNA dilution was used as the template for analysis of primer efficiency (E%) and coefficient of correlation (R2). We found the value of E% in the eight reference genes to be between 94.2 and 108.7%, and the R2 was above 0.99 (Table 1 and Figure S3). This showed that the result met the requirements of subsequent experimental analysis [23].

3.2. Evaluation of Expression Stability of Reference Genes

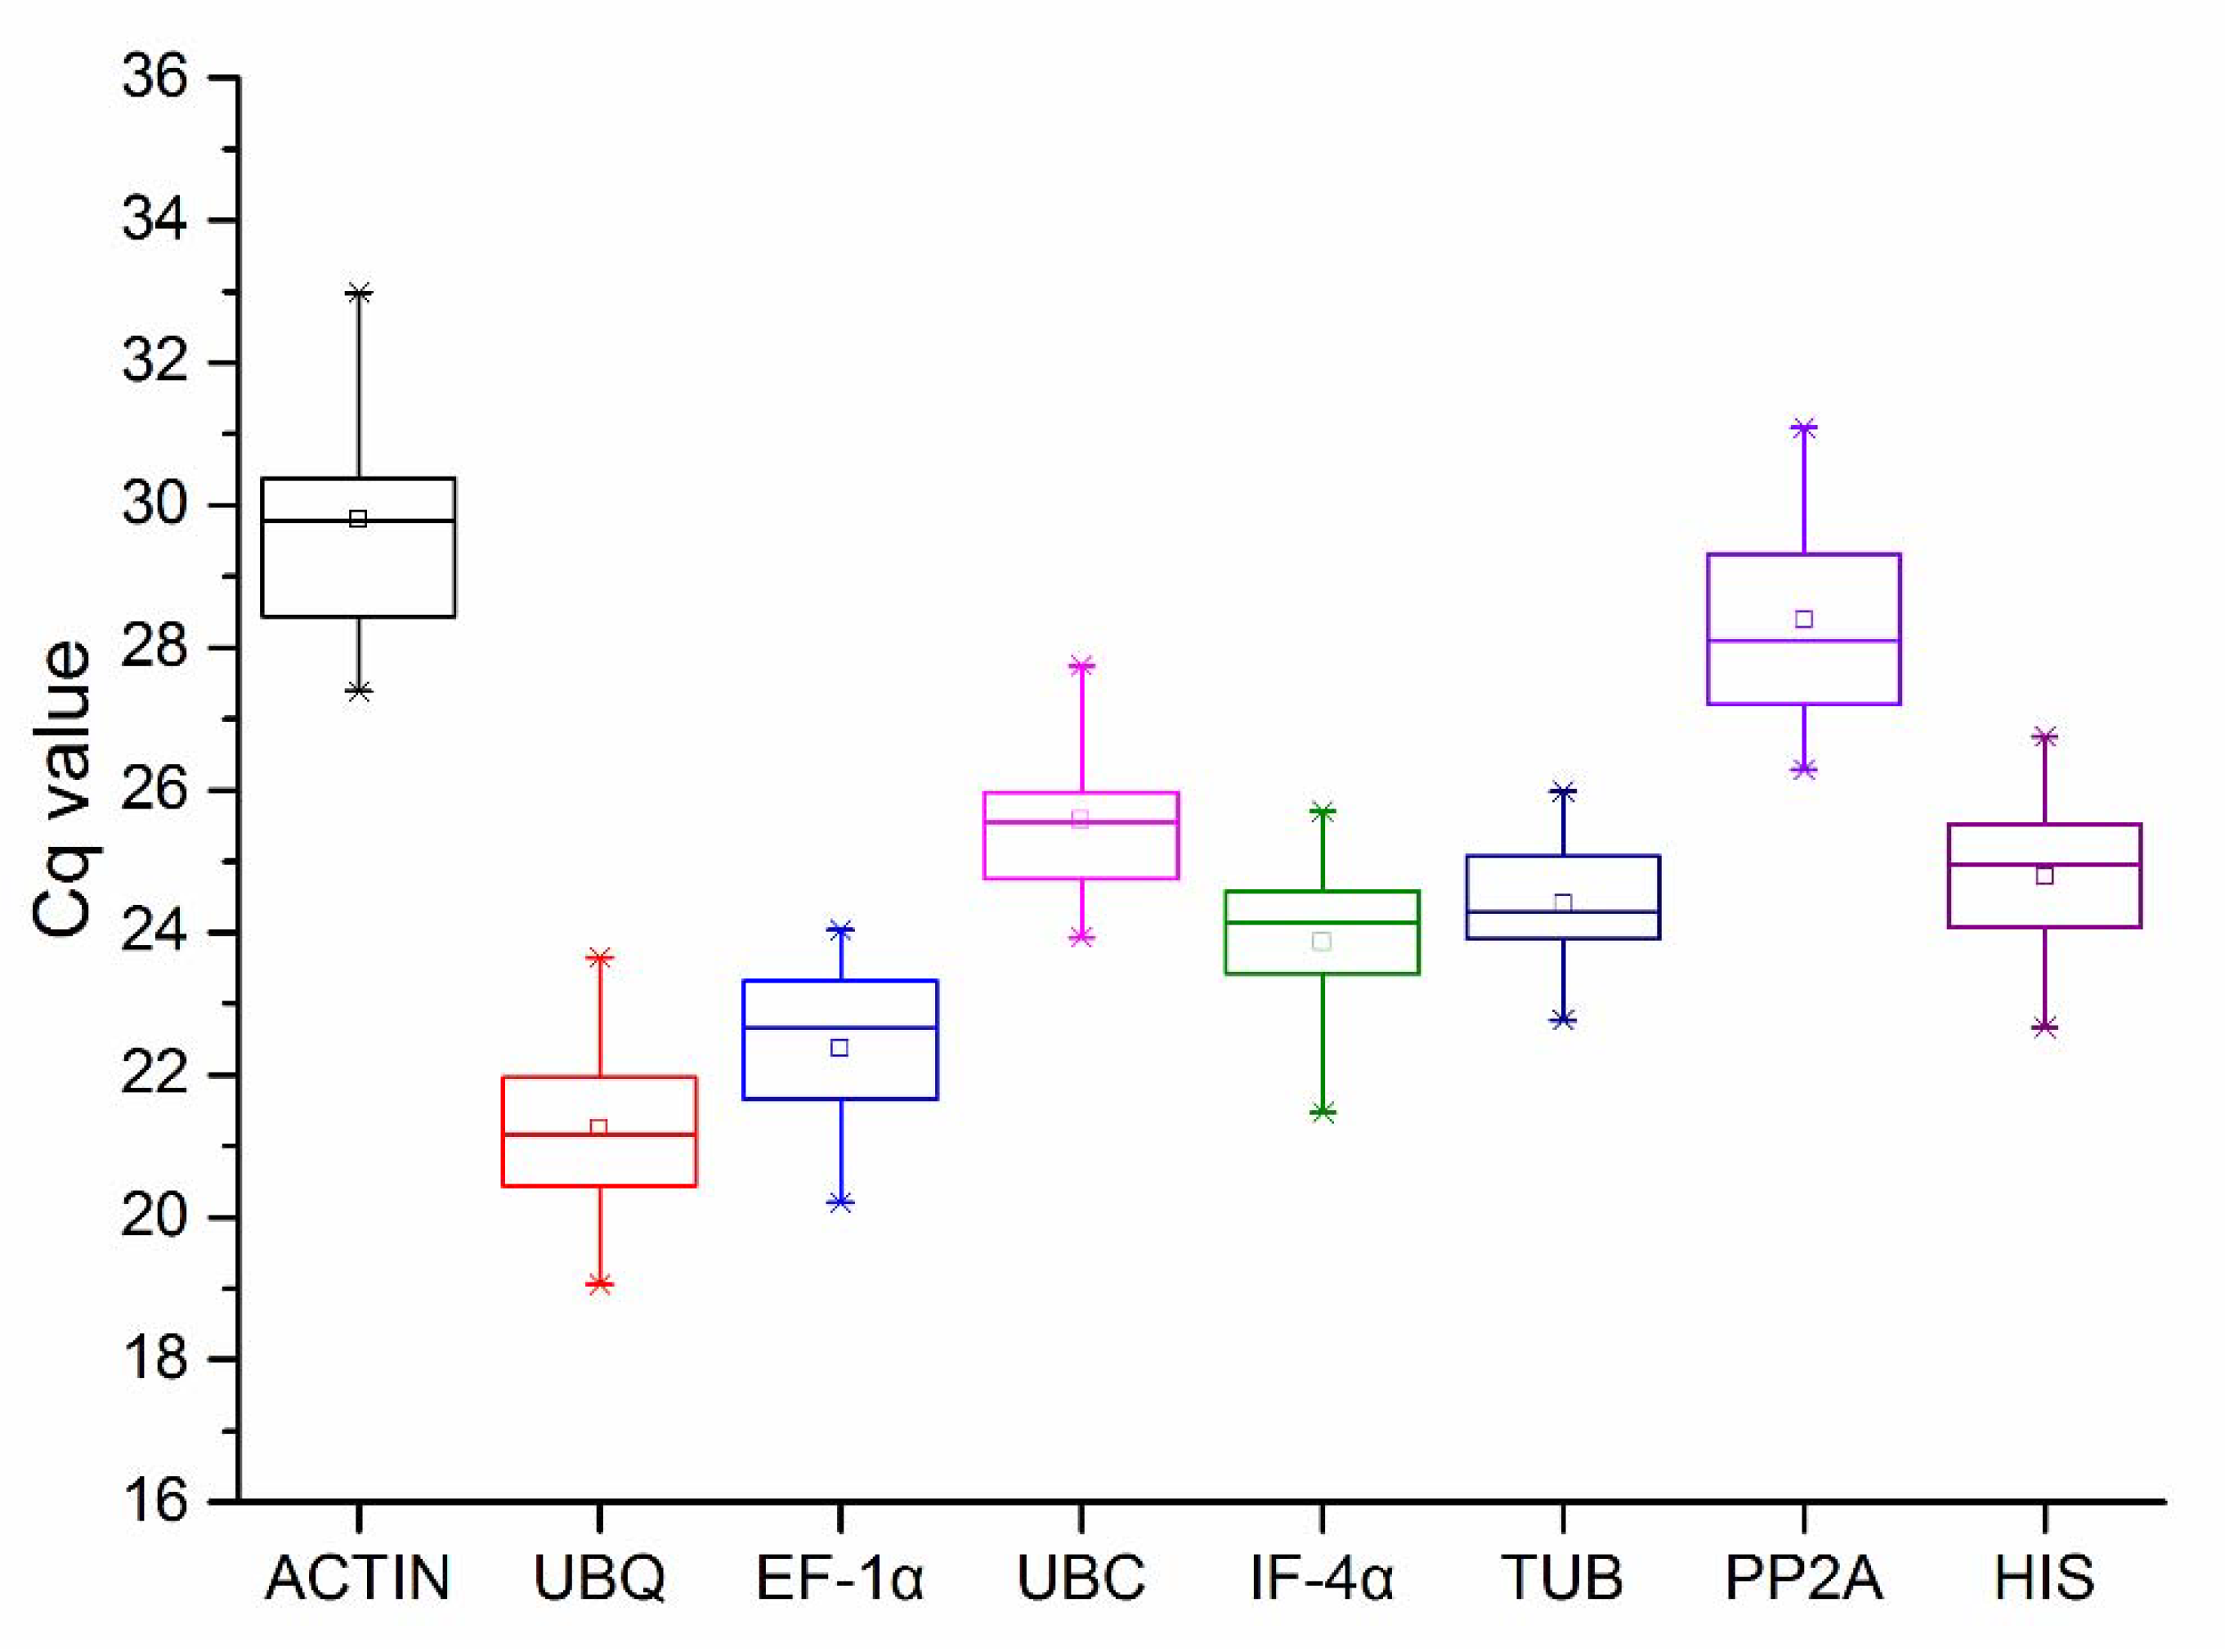
3.2.1. Cq Value of Candidate Reference Genes

The Cq value obtained after qPCR was used to represent gene expression levels. There were 36 Cq values for each reference gene across the four experimental treatments, three biological, and three technical replicates (Table S2). A wide range of Cq values was obtained across the eight genes. As shown in Figure 3 and Figure S4, all test samples were distributed between 19.05 (UBQ) and 32.98 (ACTIN), and the mean Cq values of all genes ranged from 21.30 (UBQ) to 29.53 (ACTIN). Distribution of Cq value for TUB was more concentrated than other genes, whereas that of ACTIN showed the biggest variation. Low Cq indicates high transcriptional expression level of the gene, while the converse is true for a high value. UBQ and EF-1α showed high transcriptional expression levels with low Cq, while ACTIN and PP2A resulted in low expression.

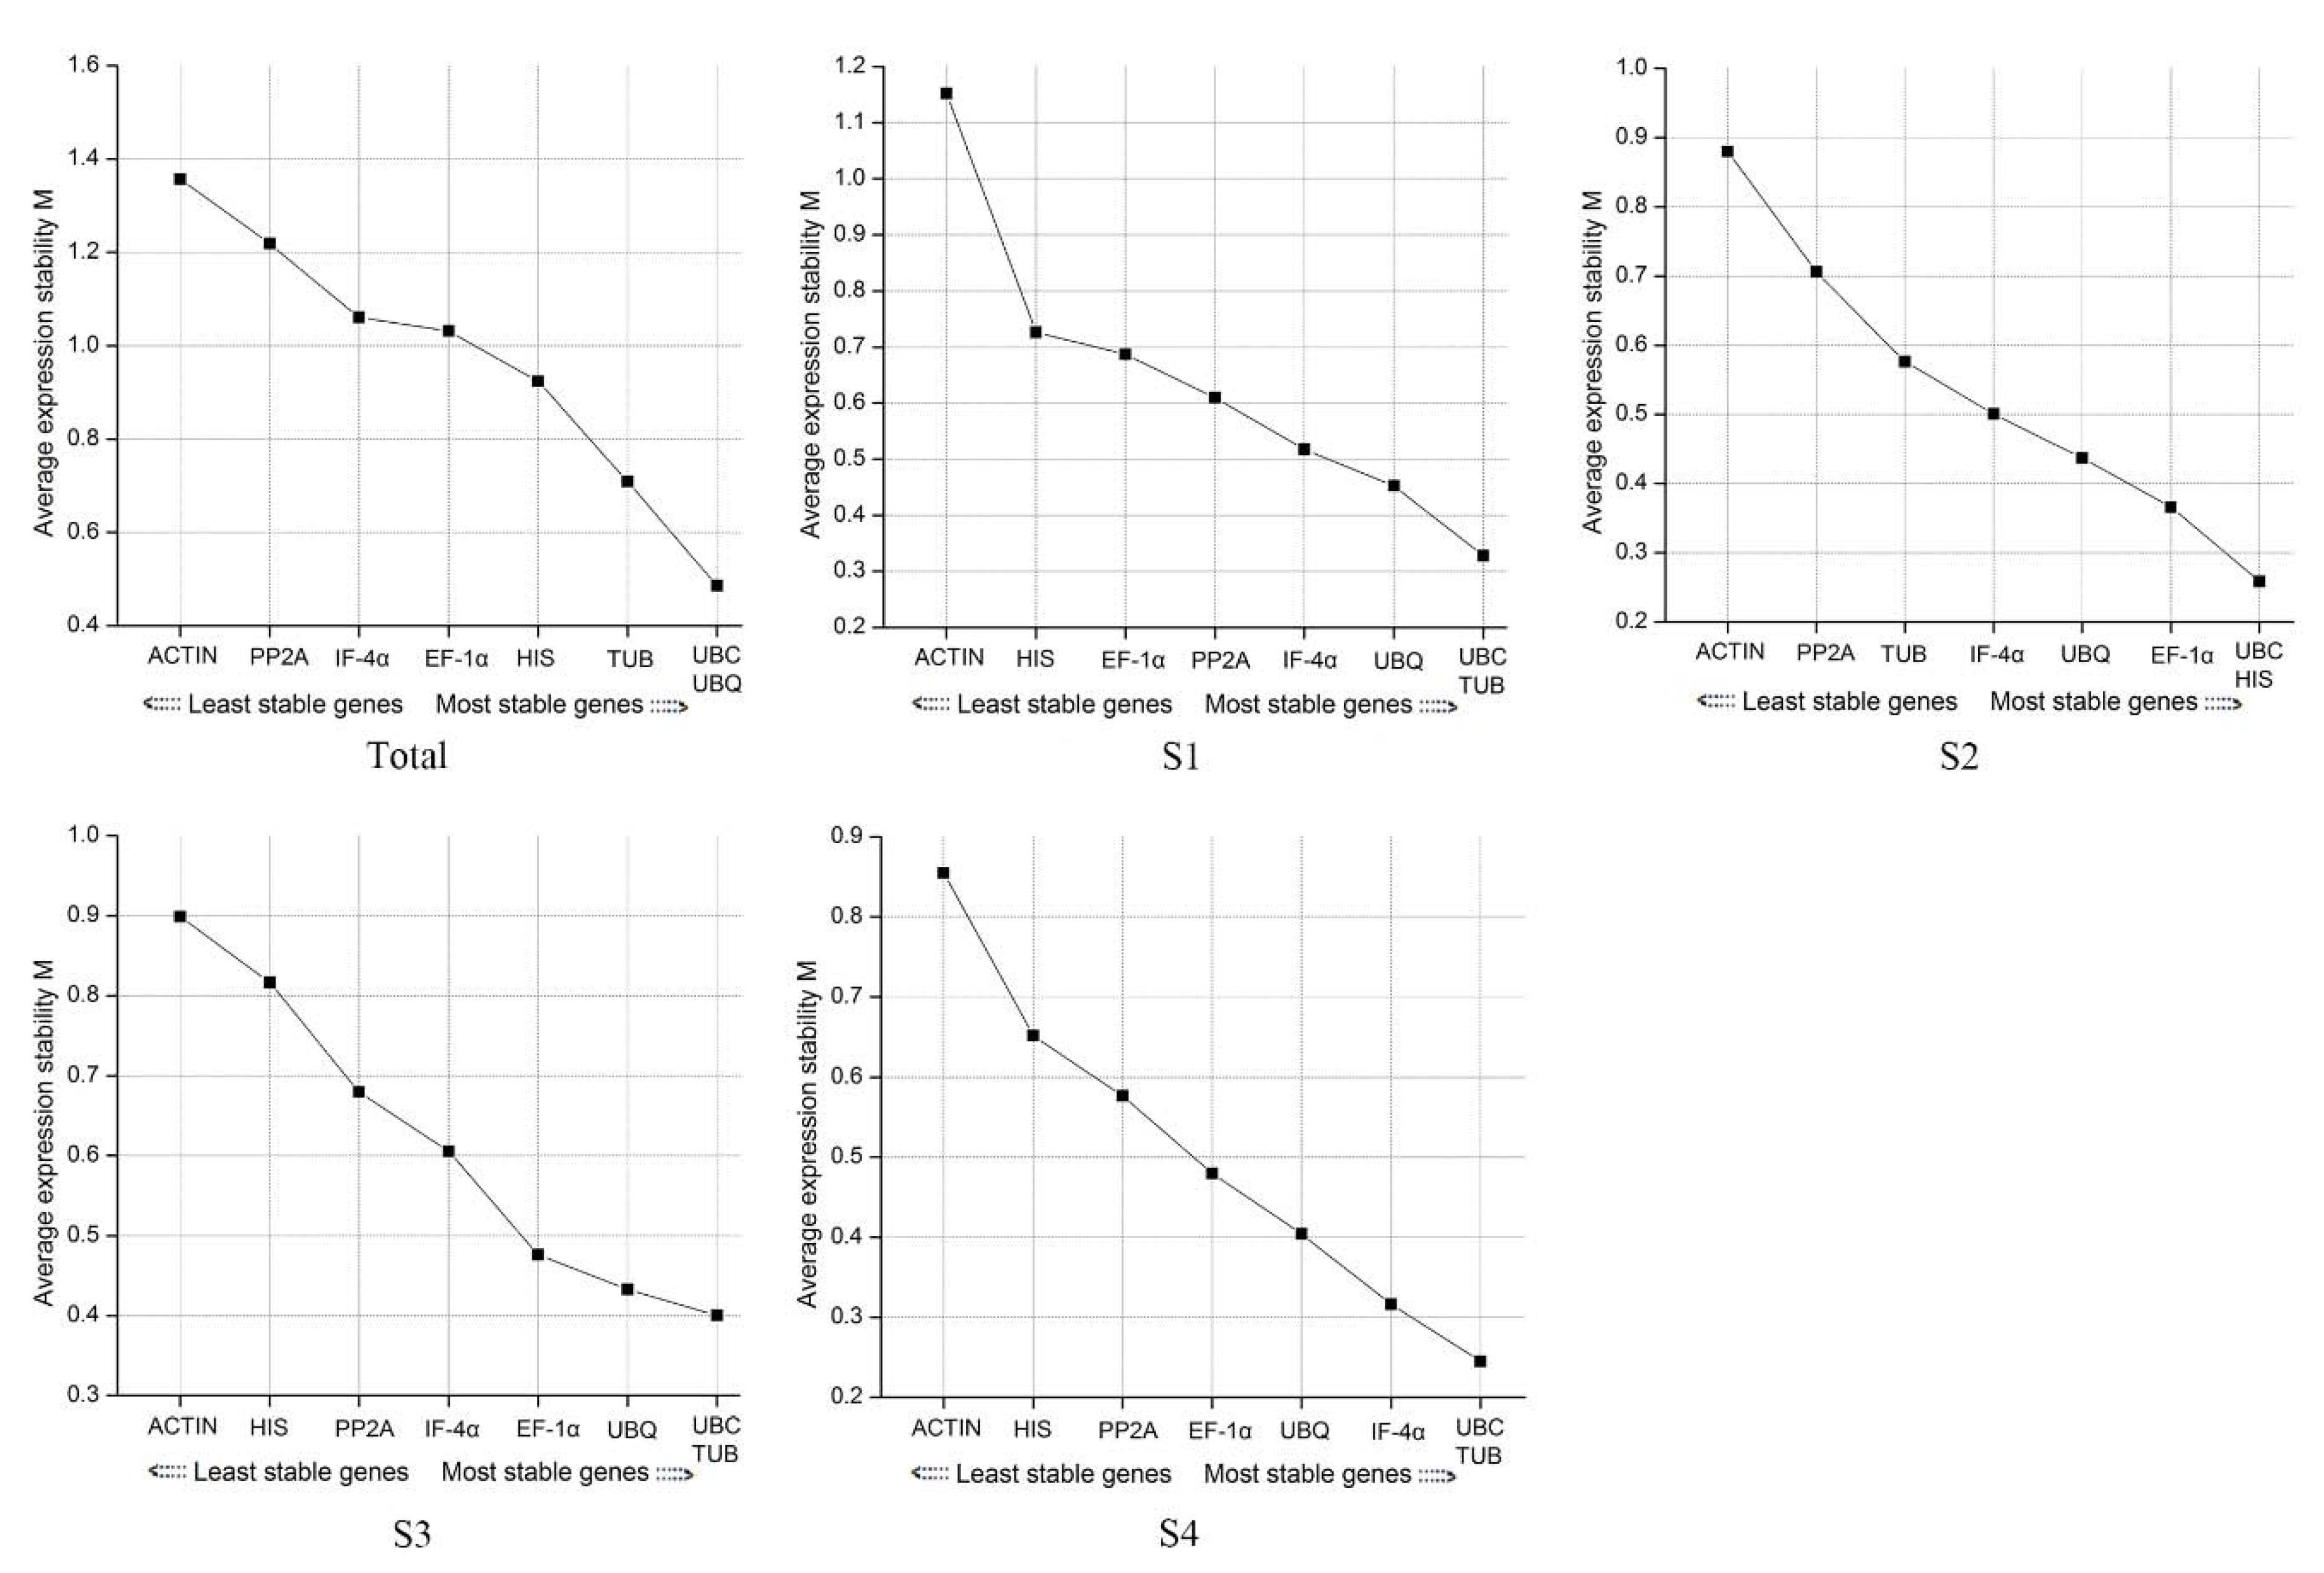
3.2.2. geNorm Software Analysis

geNorm compares constant levels of candidate reference genes by calculating the average stability index (M). A threshold value of M is set at 1.5, and serves as the criterion for determining whether gene expression is stable or not. Ideally, a stably expressed gene should have M-value below 1.5. The lower the value, the more stable the expression. M values of the eight genes at different development stages were all lower than 1.5, indicating that they were all stably expressed (Figure 4). However, the most stable genes at different stages were variable. In S1, S2, and S4, UBC and TUB were the most stable genes, while UBC and HIS were the most in S2. Overall analysis of the samples indicated that UBC and UBQ resulted in the most stable performance. The UBC had the lowest M-value across the four stages indicating that it was the best among all eight reference genes. ACTIN had the highest M-value in the four stages and was therefore the most unstable.

3.2.3. NormFinder Software Analysis

NormFinder converts a Ct value into relative expression levels (Q), and calculates the stability of reference genes according to the input program of Q value. This value was used to evaluate the stability of the reference genes followed by selection of the optimal reference gene. A small stability value indicates a more stable reference gene with a higher value pointing toward an unstable gene. UBC had the lowest stability value resulting in the most stable performance in S1 and S4, but it ranked second in S2 and S3. On the other hand, IF-4α and EF-1α ranked first in S2 and S3, but showed an unstable performance in the overall ranking (Table 2). UBC and TUB performed well in terms of stability during the four stages of development, while ACTIN was the lowest stability gene.

3.2.4. BestKeeper Software Analysis

For BestKeeper, standard deviation (SD) and the coefficient of variation (CV) of Cq values were calculated to reveal the level of gene expression. Here, genes with small SD and CV values are considered more stable genes. In the overall ranking, expression of TUB and UBC genes was the most stable. We observed that EF-1α had the lowest SD and CV values in S1, S3, and S4 but ranked sixth in S2, suggesting that this gene exhibited the most stable levels of expression (Table 2). UBC is second in S3 and fourth in S4. TUB showed the best performance in S2 but was less so in the other three periods. Notably, we also found that ACTIN showed the lowest stability in S1, S3, and S4. Among all the groups, TUB and EF-1α displayed good performance, while ACTIN was the least stable gene in most groups.

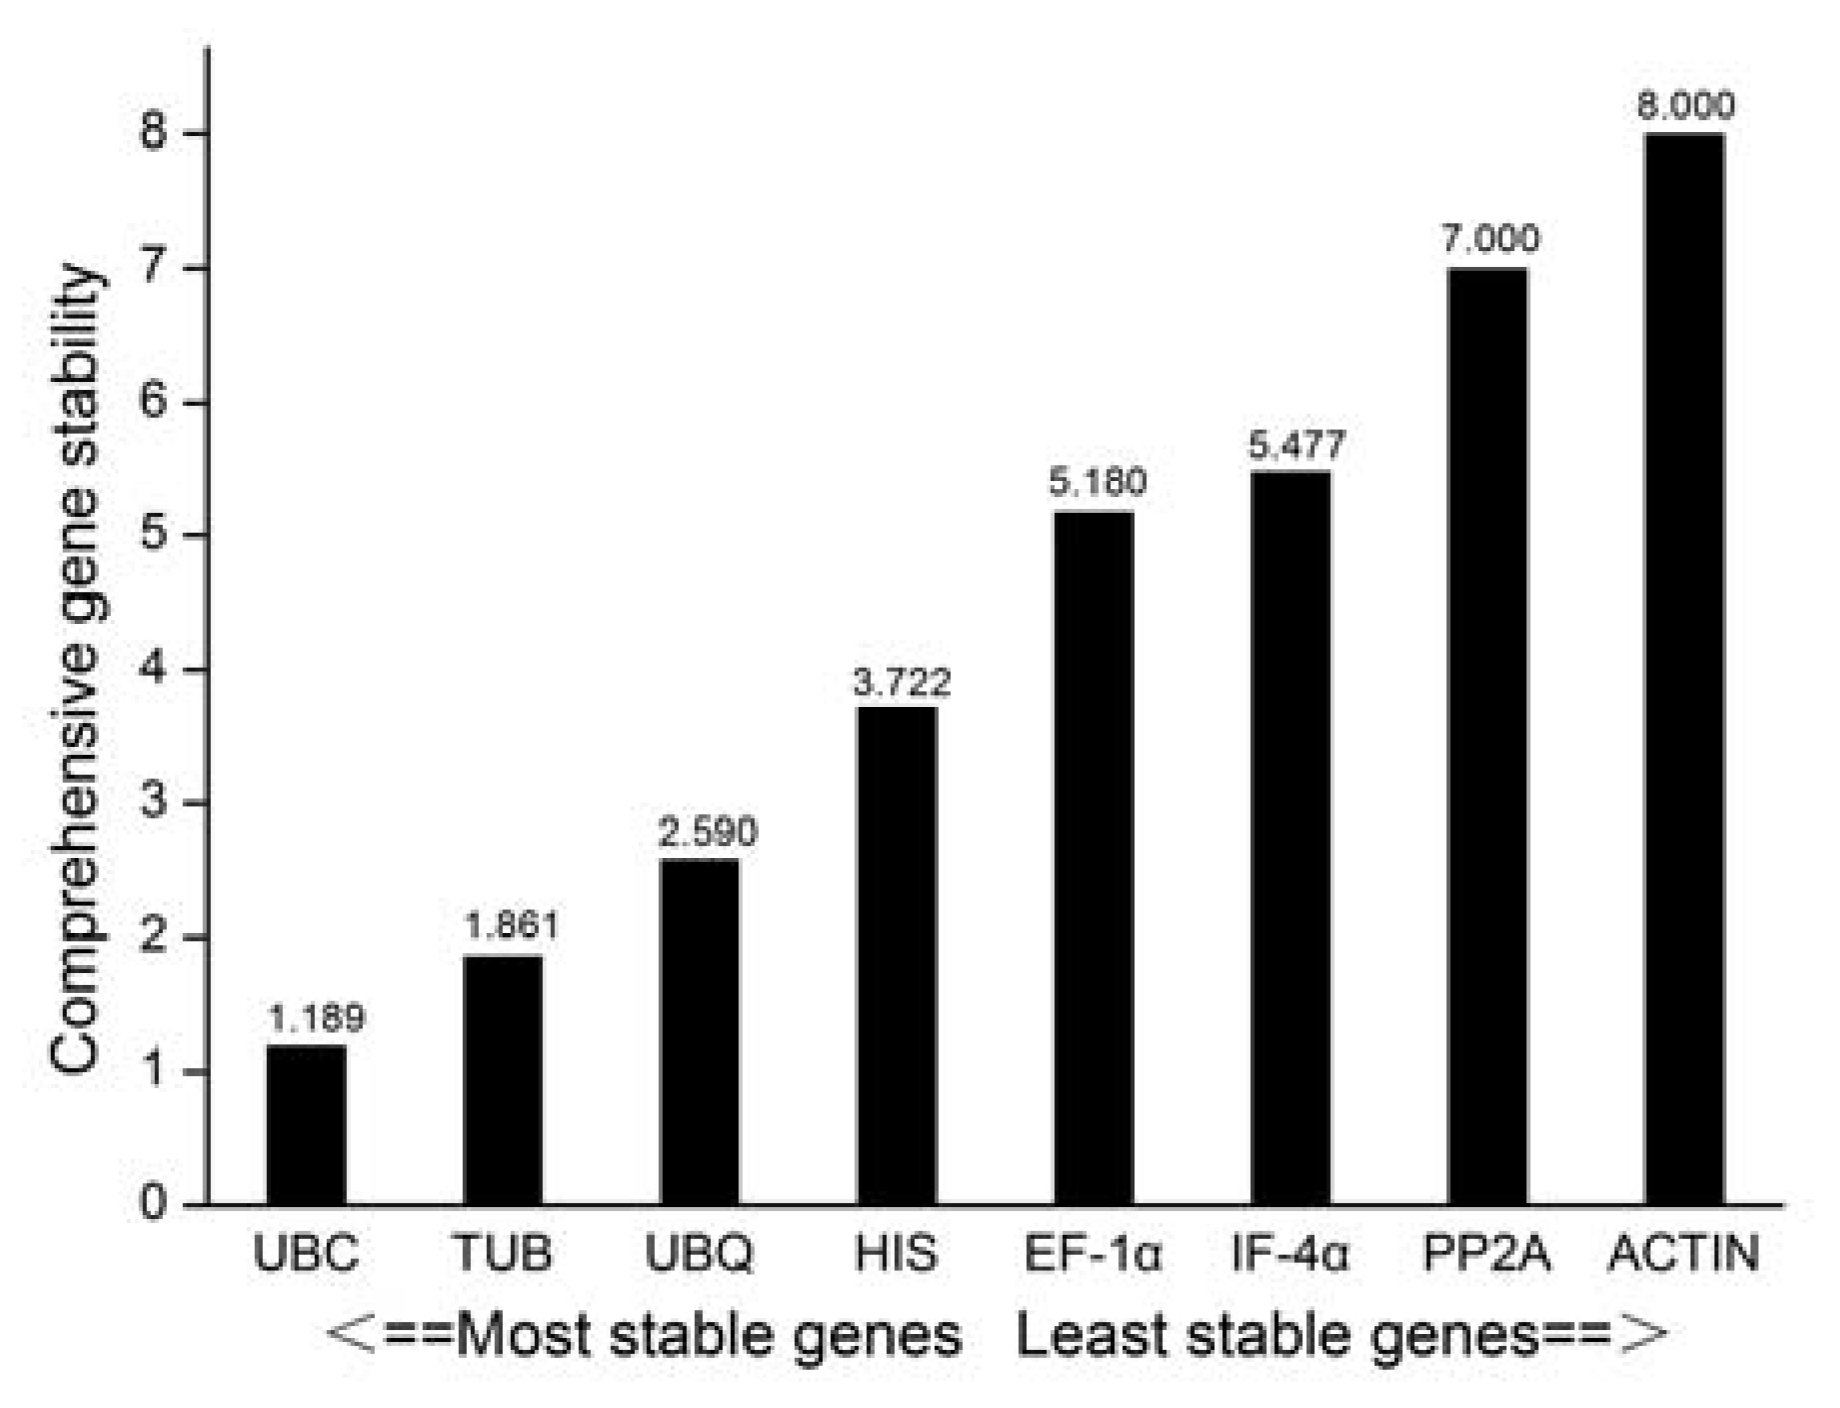
3.2.5. RefFinder Software Analysis

RefFinder calculates the geometric mean for each gene based on geNorm, NormFinder, BestKeeper, and ΔCt to obtain a composite index ranking. The smaller the value, the more stable the gene expression is. We observed that UBC ranked first as the most stable gene, while ACTIN was the least stable. In general, the stability ranking followed the pattern; UBC > TUB > UBQ > HIS > EF-1α > IF-4α > PP2A > ACTIN (Figure 5).

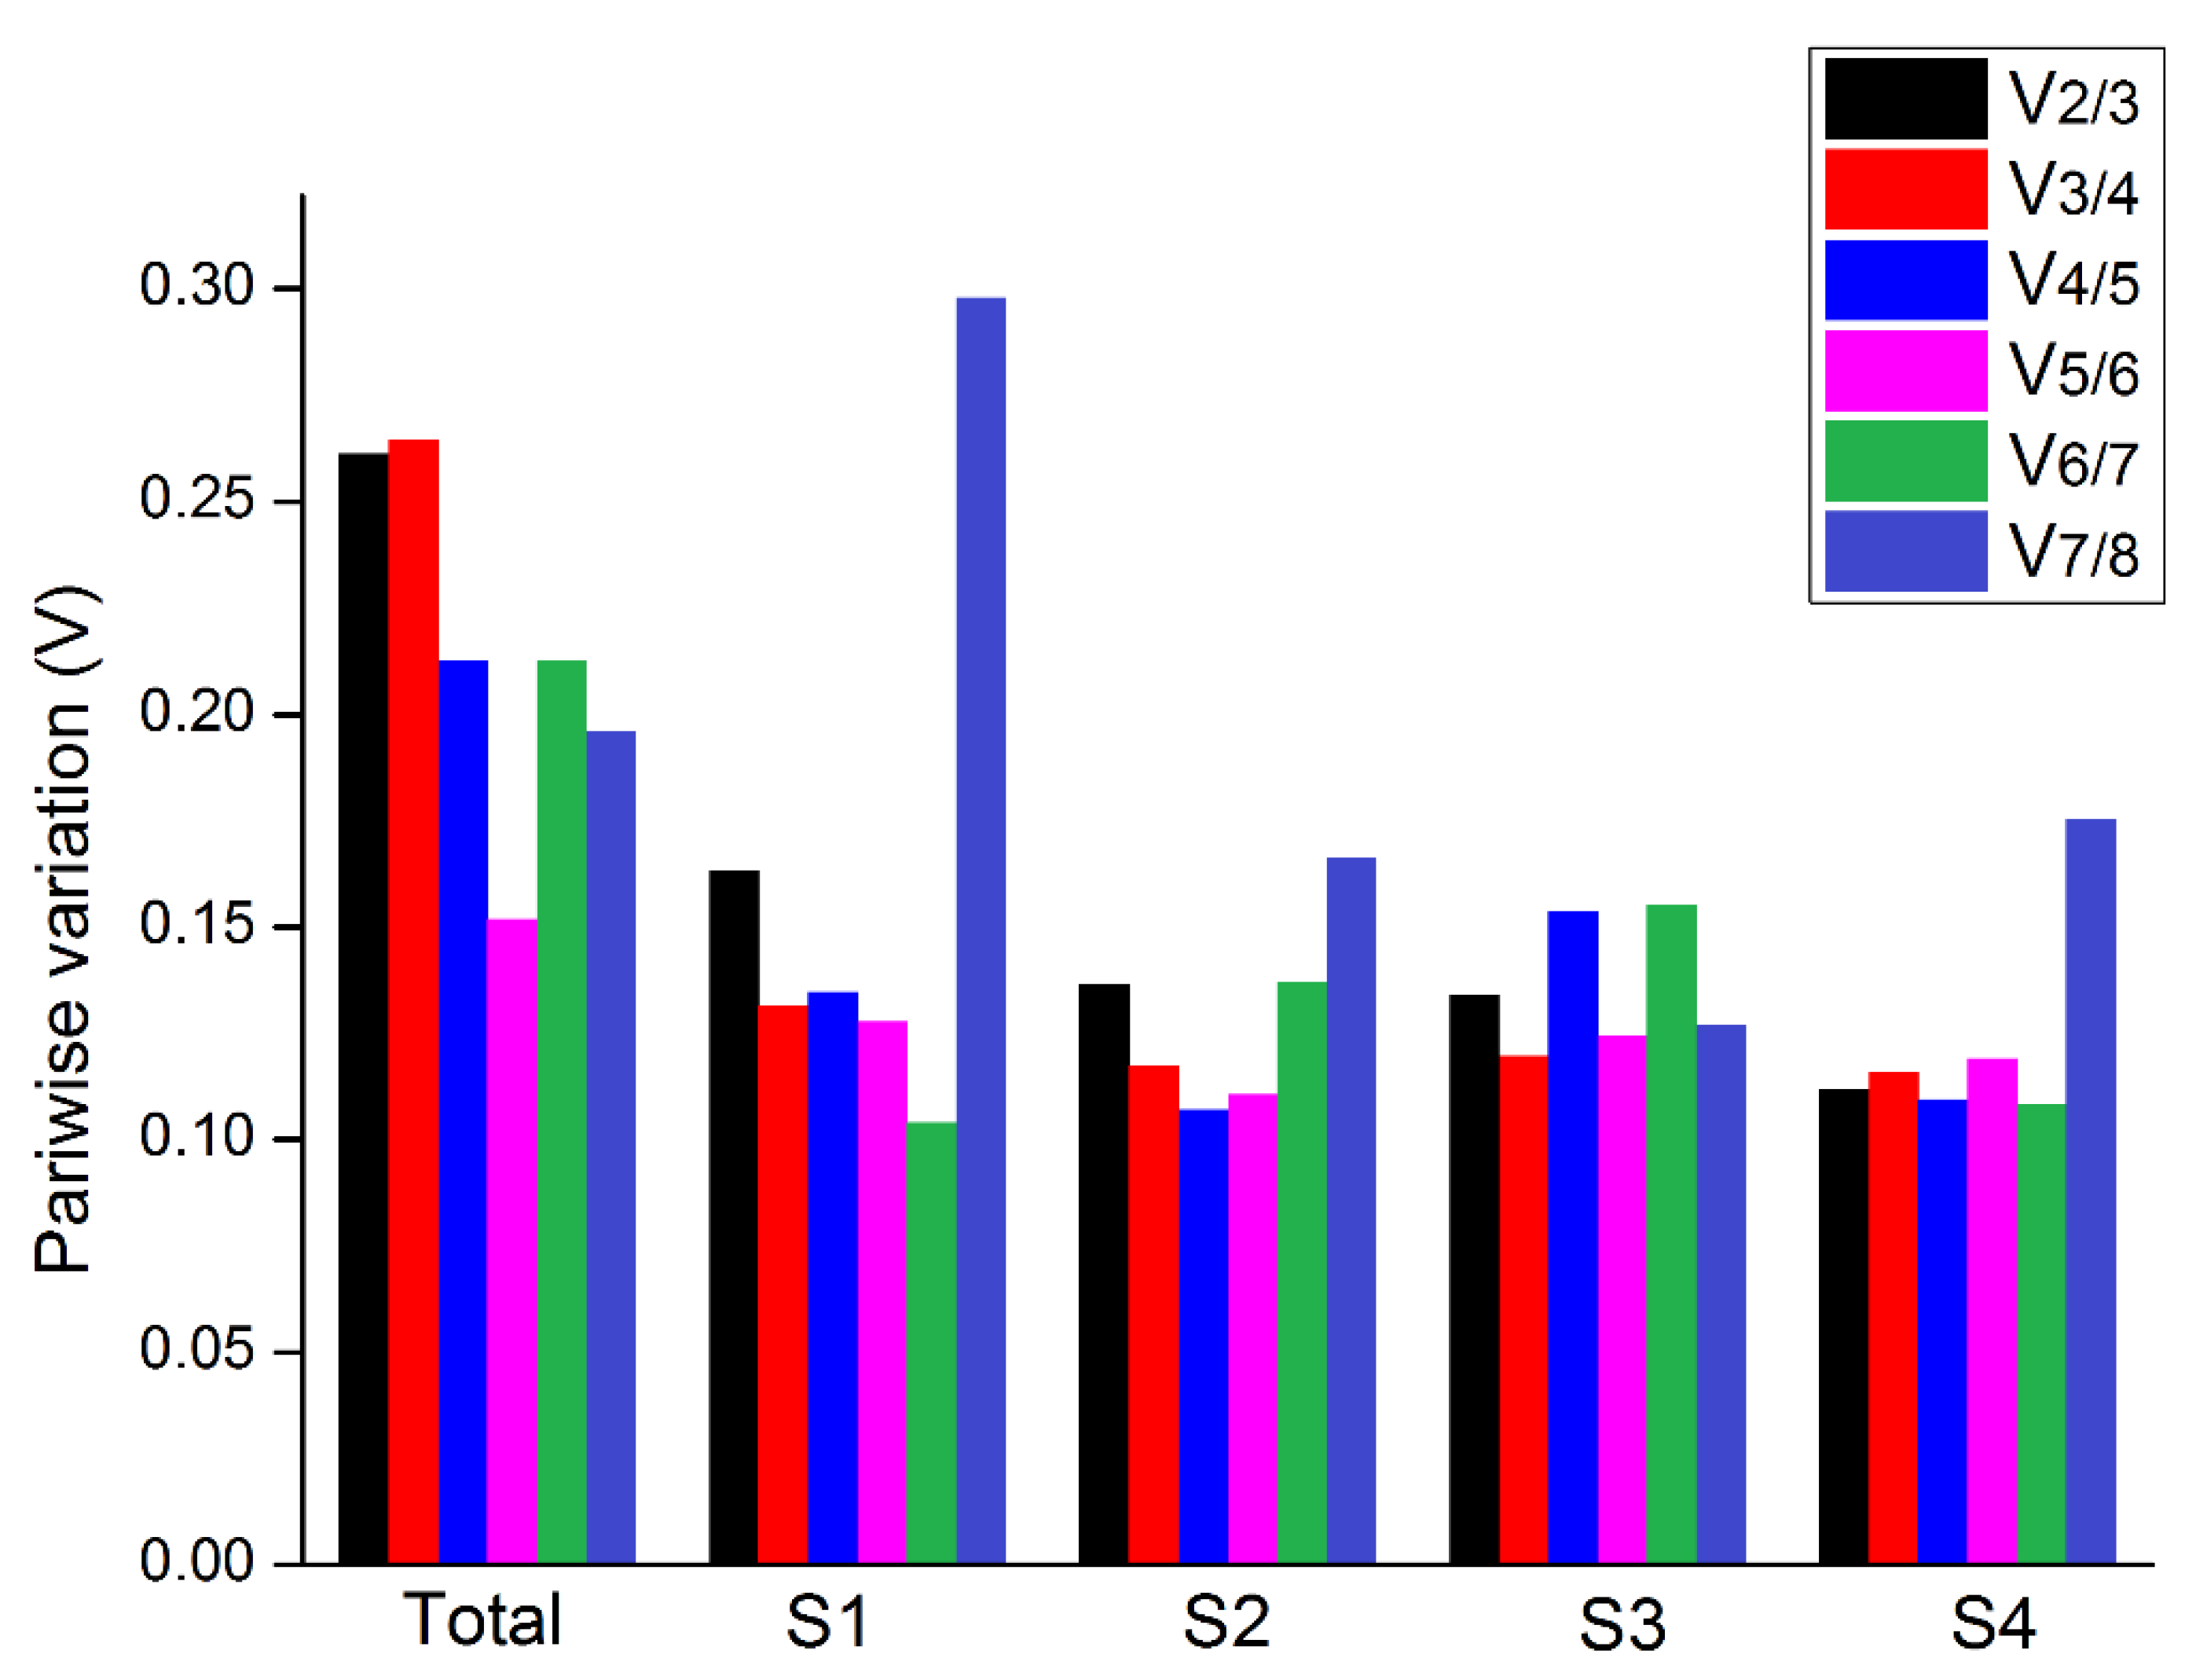
3.3. Determination of the Optimal Number of Reference Genes

We used geNorm to calculate the paired difference value Vn/n+1 and determine the optimal number of reference genes required in an experiment. When Vn/Vn+1 > 0.15, NFn gene is not stable, and the NFn+1 gene therefore needs to be introduced. When Vn/Vn+1 is less than 0.15, the optimal number of reference genes is NFn. On the other hand, when Vn/Vn+1>0.15, it is necessary to introduce the NFn+1 gene. Addition of the third gene relatively improved the combination stability in S1. For S2, S3, and S4, only two genes were sufficient with the value of V2/V3 < 0.15 (Figure 6 and Table S3). When all samples were evaluated together, all Vn/Vn+1 values were higher than 0.15. However, although using more number of reference genes may help in reducing system deviation, it is not a necessary criterion [18].

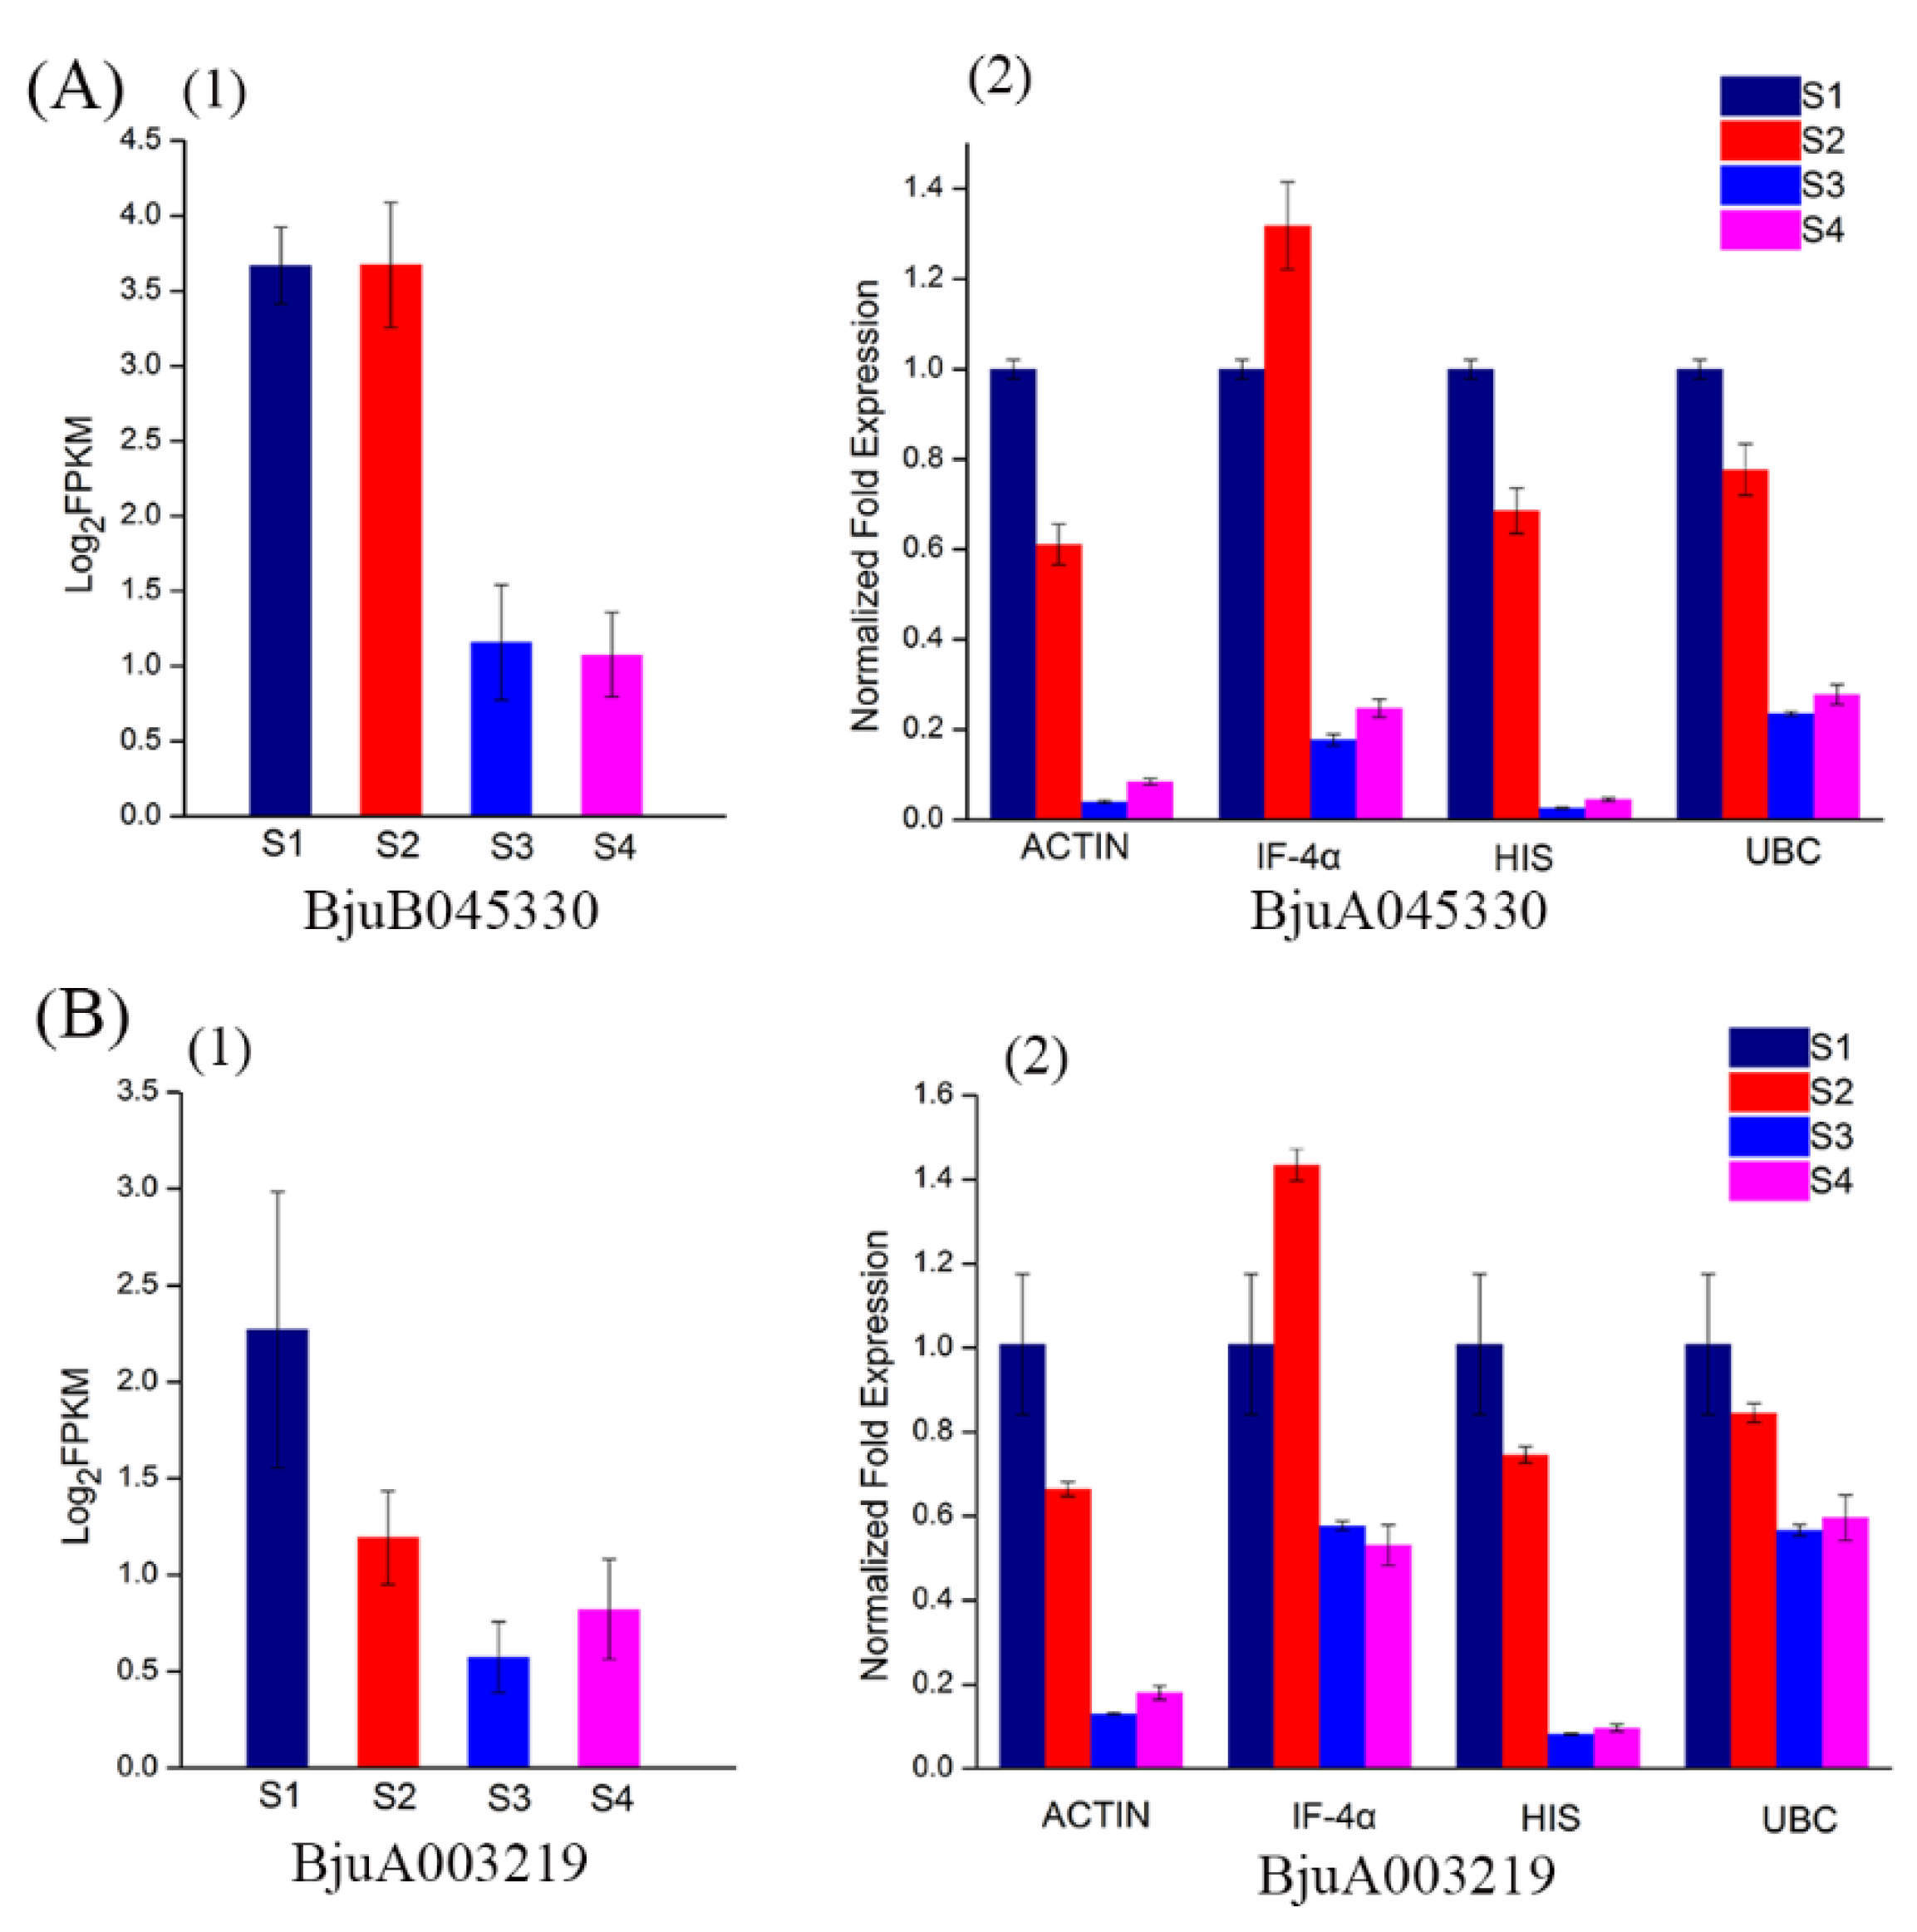
3.4. Validation of Reference Genes Using qPCR

In order to further validate gene expression, a qPCR was conducted on four reference genes including the most stable (UBC), moderately stable (HIS and IF-4α), and least stable (ACTIN) genes. CYCD is a gene family related to cyclin in type D plants. Studies have proved that CYCD3 is involved in cell division, differentiation, and development of roots and fruits [24,25]. Two CYCD3 genes cloned from the stem mustard, resulted in varied expression levels in different parts of a tuberous stem [17]. Based on the transcriptome data, we found that two CYCD3 genes, BjuB045330 and BjuA003219, showed high expression abundance at S1 and S2 and low abundance at S3 and S4 (Figure 7(A1,B1)).
In this study, expression of BjuB045330 and BjuA003219 were calculated using the selected reference genes. Expression levels across the genes were significantly different. When normalized using the most stable gene, UBC, expression patterns of BjuB045330 and BjuA003219 were downregulated from S2 to S3, and maintained at a low level in S3 and S4. Similar expression patterns were generated using HIS and ACTIN although the levels of BjuB045330 and BjuA003219 were significantly low in S3 and S4 (Figure 7(A2,B2)). When IF-4α was used, expression levels of BjuB045330 and BjuA003219 showed a strong bias compared with the other three reference genes. In addition, it was found that there was a good concordance between qPCR and transcriptome data when normalized with UBC, indicating the reliability of selection of reference gene. These results not only validated the accuracy of reference genes, but also demonstrated that appropriate reference genes are very important for accurate analysis of expression of a target gene.

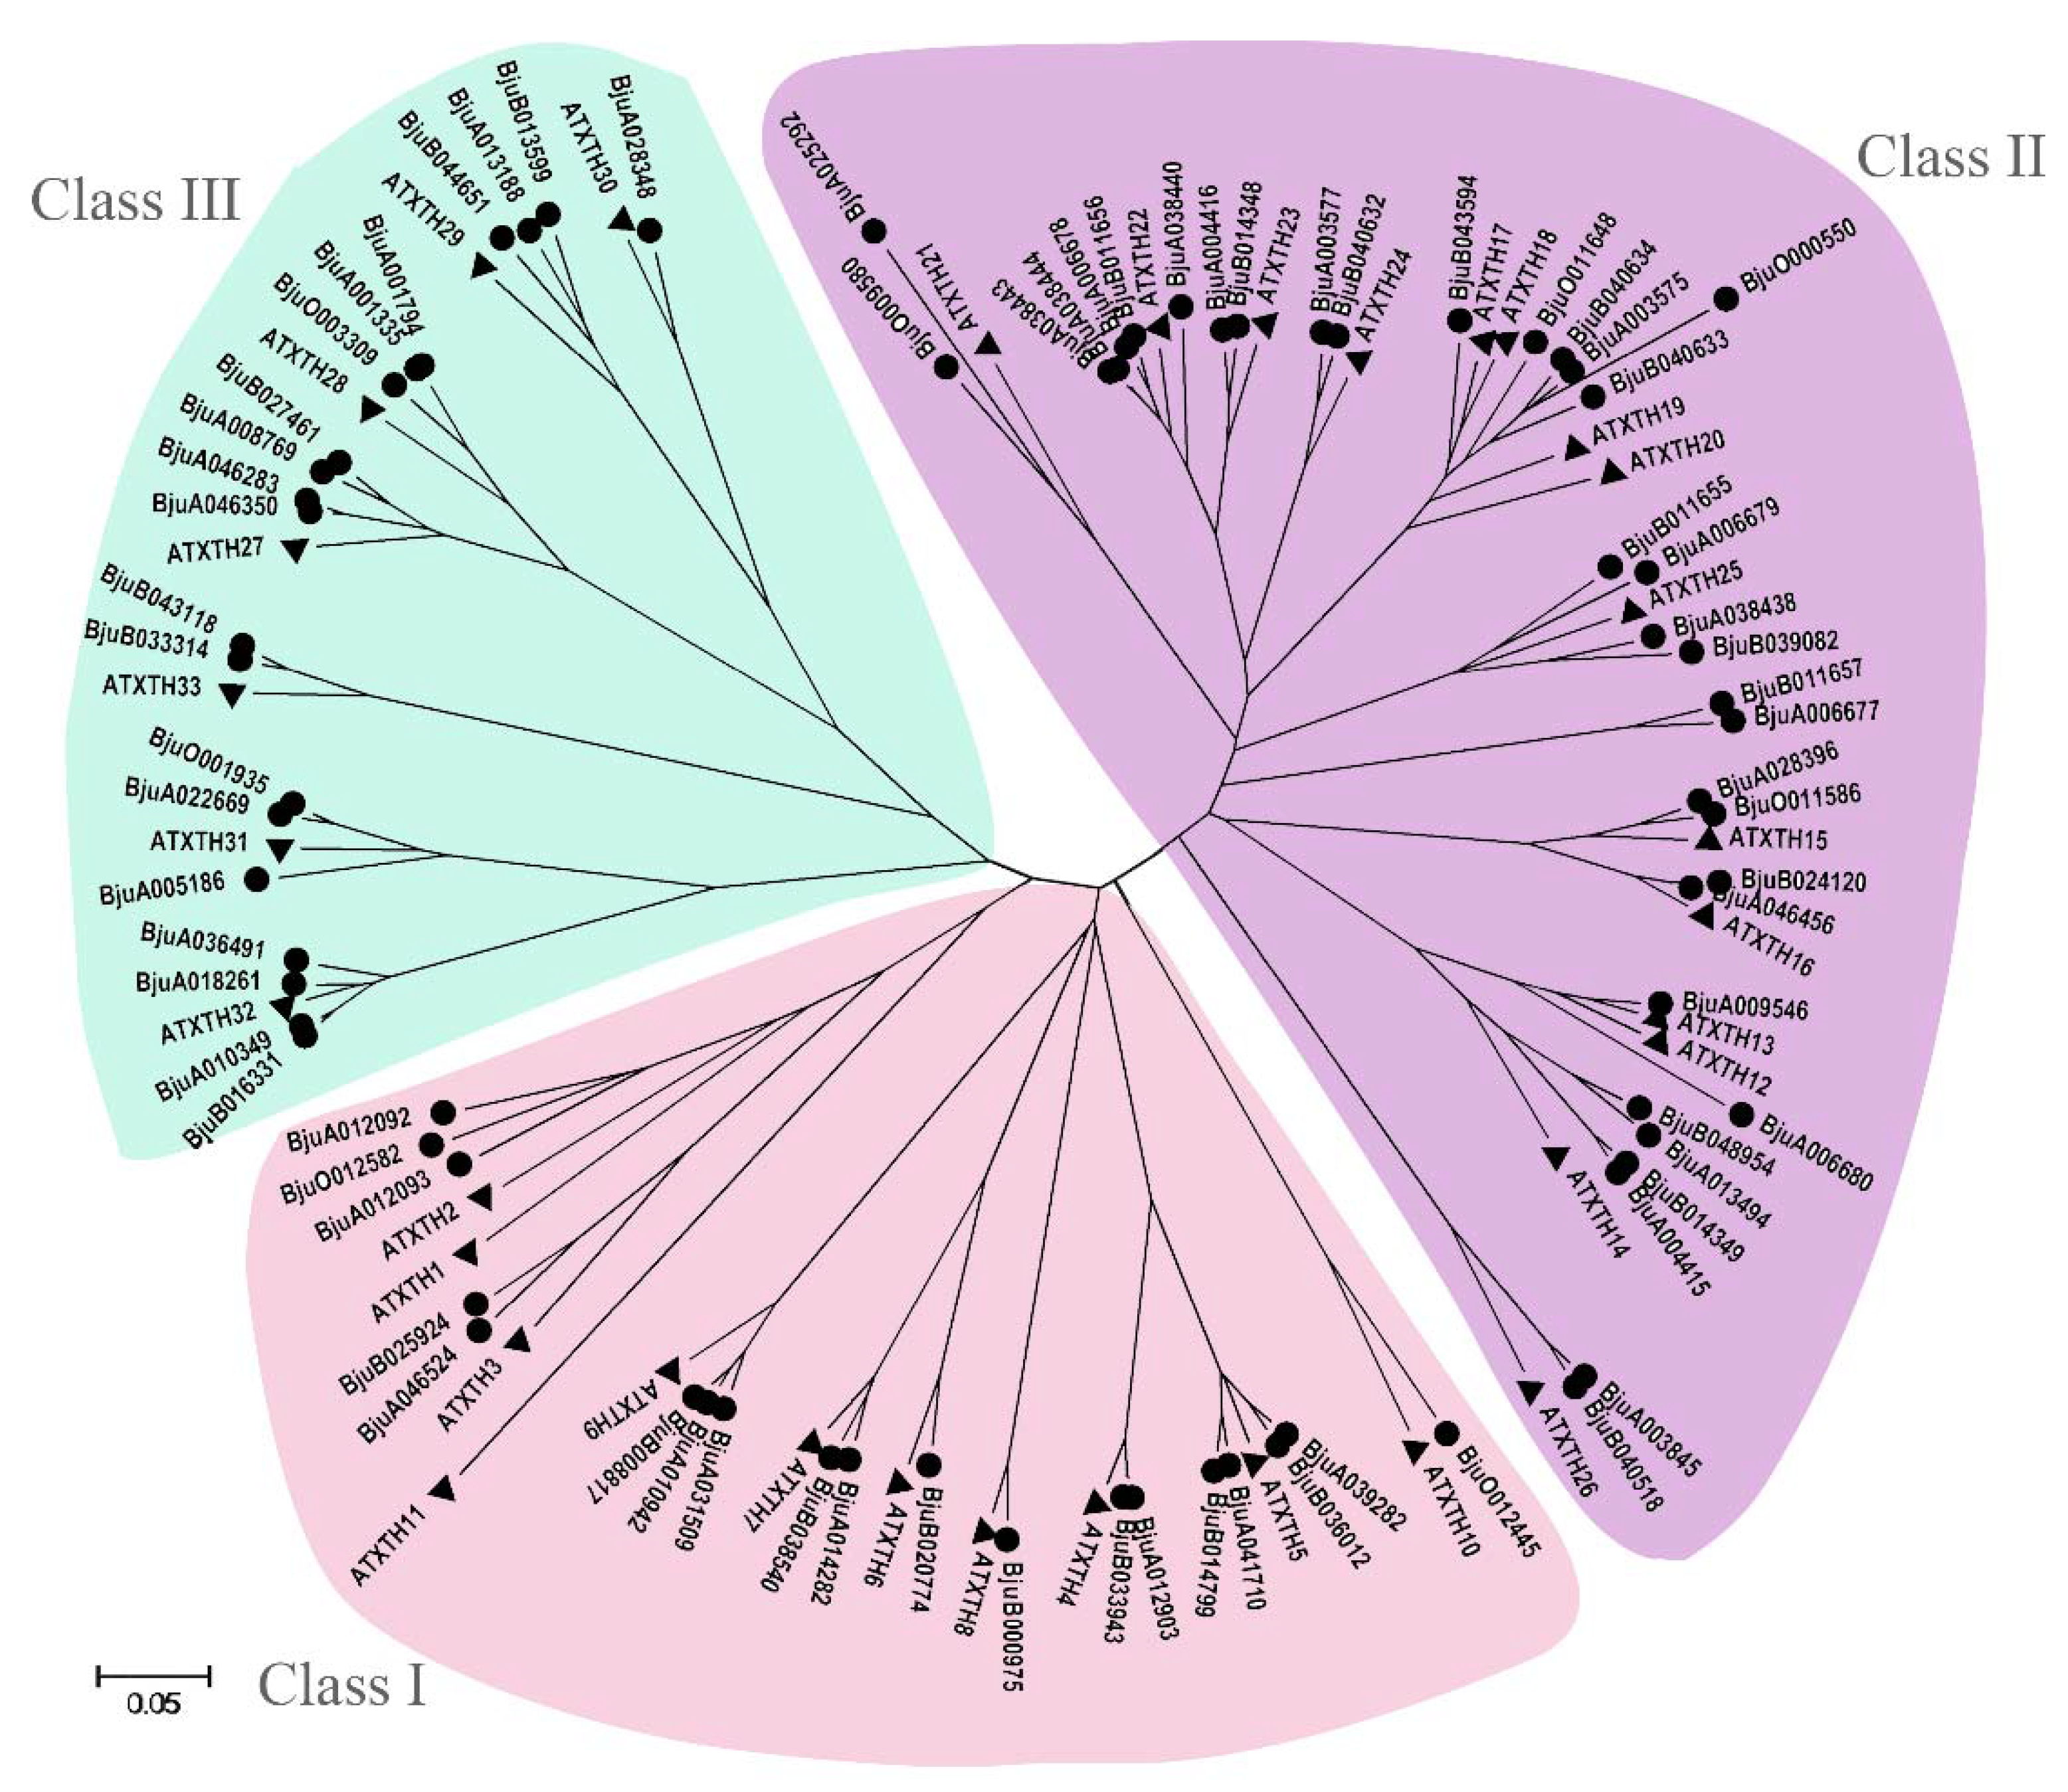
3.5. Identification and Phylogenetic Analysis of XTH Gene Family in B. juncea

To identify all the XTH genes in B. juncea genome, a basic local alignment search tool (BLAST) was performed using the AtXTH genes as queries and a total of 74 sequences of BjuXTH genes retrieved. To investigate the phylogenetic relationship of XTH members, 33 genes in Arabidopsis and the 74 from B. juncea were used to construct a phylogenetic tree (Figure 8). All the XTHs can be clearly divided into three subfamilies: Class I, Class II, and Class III. The largest class was Class II, having 35 members in B. juncea and 15 in Arabidopsis. Class I contained 19 XTH genes from B. juncea, whereas 11 were from Arabidopsis. Class III consisted of 20 and 7 XTH proteins in B. juncea and Arabidopsis, respectively.

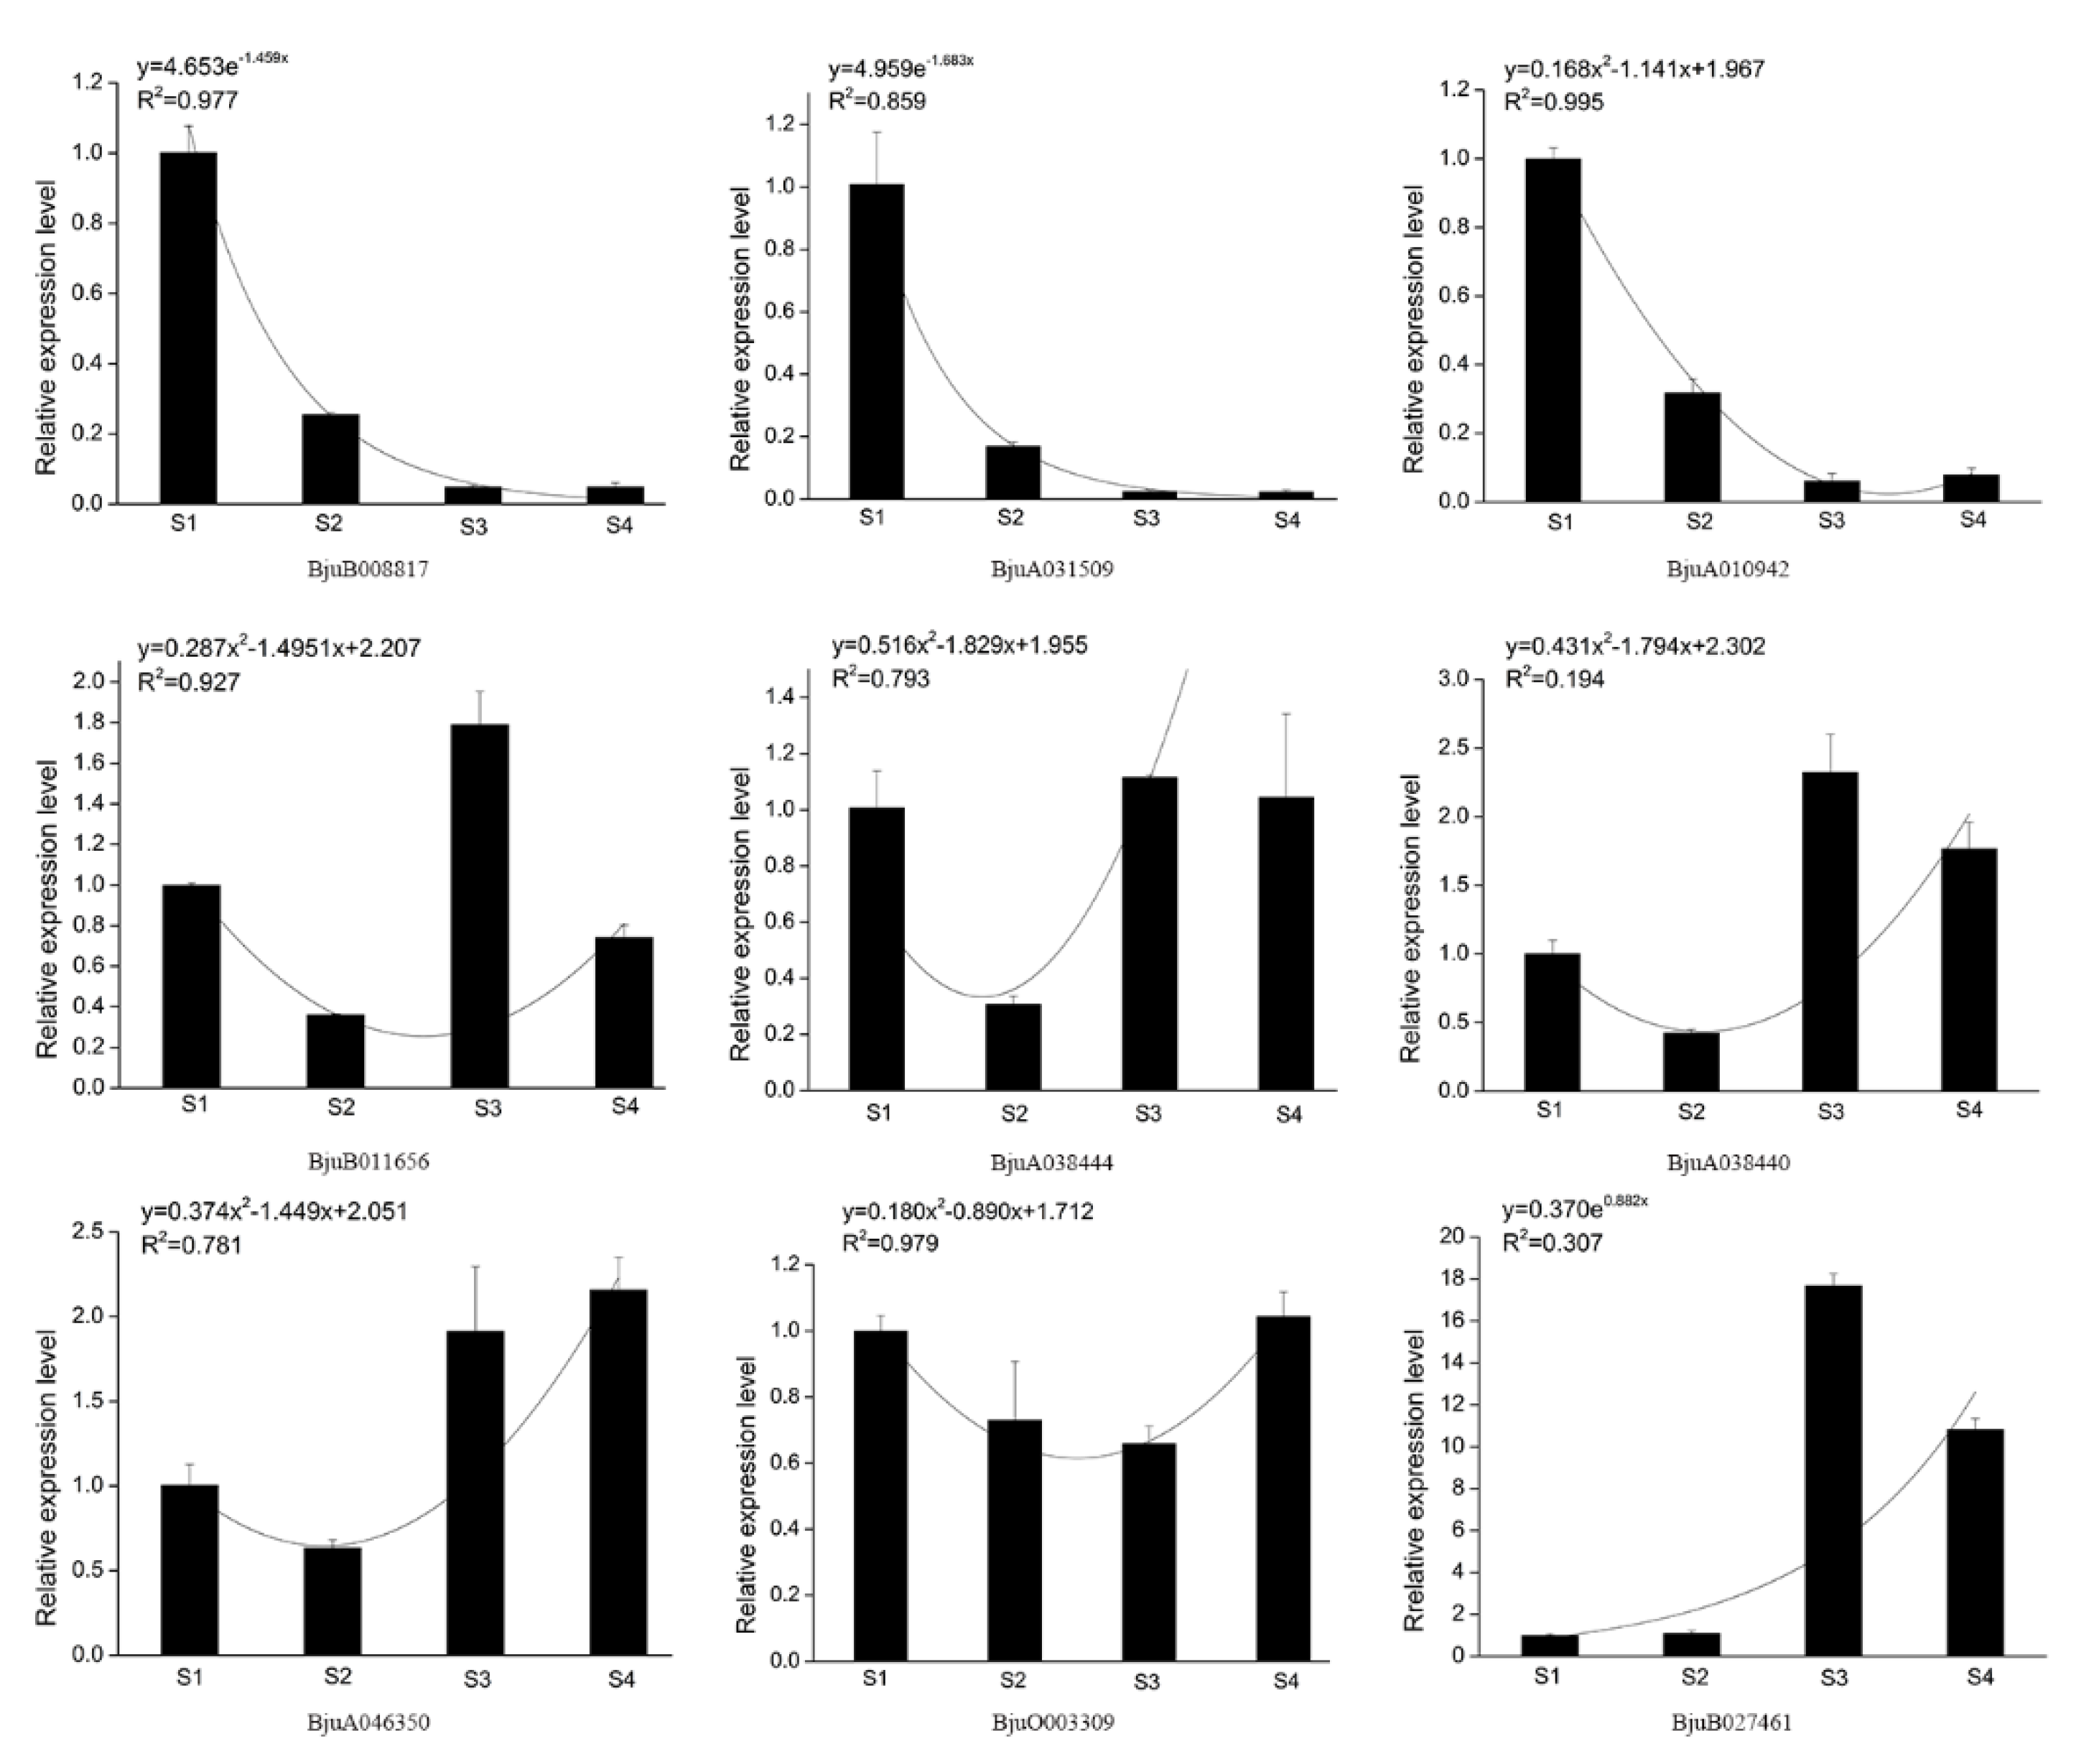
3.6. Gene Expression Analysis of Mustard XTH Family

The expression profiles of 74 XTH genes were further analyzed based on the transcriptome data of four stages of stem development in stem mustard. Results showed that 63 genes were expressed in at least one stage while 11 were not detected. XTH genes showed differential abundances at various development stages. Particularly, most genes in Class I showed a high expression in S1 and S2, while the highest in S3 and S4 was observed in Class II and III genes (Figure 9). In Class I, BjuB033943 and BjuA012903 had a relatively high abundance. With regards to the Class II subgroup, expressions levels of BjuA006678, BjuB040632, BjuB011656, and BjuA003577 were higher in S3 and S4 compared to S1 and S2. Most members of Class III especially BjuA046283, BjuA046350, BjuO003309, BjuB027461, and BjuA00876 showed higher expression levels and these were significantly higher in S3 and S4. A large number of XTH family genes were highly expressed during the period of stem development, suggesting that XTH genes might play important roles in the development product organs of stem mustard.
Based on the transcript abundance across different development stages of stem in stem mustard, several XTH genes were targeted via qPCR to evaluate their expression levels during stem swelling. UBC was used as the reference gene for standardization of expression. Three genes, BjuB008817, BjuA031509, and BjuA010942, that belonged to Class I, reduced expression levels during stem swelling (Figure 10). Class II genes (BjuB011656, BjuA038444, and BjuA038440) resulted in variable expression patterns, with higher levels in S3 and S4. In Class III, the expression levels of BjuA046350 and BjuB027461 were increased from S2 to S3 and keep higher expression in S3 and S4. Overall, qPCR results for most XTH genes corroborated with the transcriptome data.

4. Discussion

The study on expression profiles of many genes is commonly performed relying on techniques like RNA-seq, microarray, Northern blot to reveal an underlying expression dynamic. However, results of gene expression data must then be validated to obtain reliable data that will support working hypotheses directed at a better understanding of development or environmental responsiveness [26]. The qPCR technology is an important tool for validating gene expression in various biological systems. For a valid qPCR result, suitable reference genes are needed in order to normalize the experiments, and ensure accuracy of the results. An ideal reference gene should be stably expressed in different plant tissues or developmental stages as well as under varying processing conditions. Blind selection of unverified or unstable reference genes has been shown to lead to inaccurate experimental results [27].
In this study, UBC and TUB showed the most constant level of expression and were considered the most suitable reference genes, while ACTIN is not recommended. Previous studies have demonstrated that ACTIN is unstable in different species and experimental conditions, such as in potato and longan [28,29]. However, ACTIN has also been described as the most stable gene in carrot [30]. Our findings showed that UBC was the best reference gene at different stages of development, which is in line with other studies [31]. In addition, UBQ has been reported to be the most stable gene in tomato [32], but not in rice [33] and celery [34]. Our findings further revealed stable expression levels of TUB consistent with what has been reported in carrot [30]. Conversely, this gene is not stably expressed in tea [35]. From our findings, we noted that EF-1α is not suitable for mustard stem unlike previous reports that have recommended it in wheat [36]. The stability of reference genes varies between species, tissues, developmental stages, diseases and infections, stresses, etc. [26]. Taken together, these results indicate that selecting a suitable reference gene is a very critical part of the expression analysis and provide a basis for future research on the mining, expression pattern, and regulatory mechanism of development-related functional genes.
In plants, the XTH enzymes are widely found in various cells and tissues where they mainly catalyze cleavage and reconnection of xyloglucan molecules. Reports indicate that these genes relax cell wall in the process of cell growth and are therefore considered a key enzyme factor in the regulation of cell wall ductility [37]. So far, many XTH genes have been identified in plants, including 33 in Arabidopsis [38], 29 in rice [39], 61 in soybean [40], and 56 in tomato [41]. In the current study, we identified 74 XTH genes in B. juncea genome. Comparative genome studies have confirmed that the whole-genome triplication happened in evolution of Brassica species since its divergence from the Arabidopsis [42,43]. Based on the “U-triangle” model [44] and the hypothesis of Brassica triplication, the ratio between the number of XTH genes in B. juncea and Arabidopsis should be 6:1. In fact, the number of XTH genes in B. juncea was about 2.2 times than Arabidopsis. This may be due to the Brassica species have experienced a shrinking process featured by gene loss, fragmentation, and chromosomal rearrangement after polyploidy [43]. Several studies revealed that the orthologous numbers of some genes in Brassica crops and Arabidopsis were not completely conformed to triplication theory [45,46].
Various studies have analyzed the expression of XTH genes and reported their importance in a number of plant species. For instance, XTH9 is important in plant growth and development in Arabidopsis [12], and when engineered into onion epidermis, it led to a significant cell wall elongation [47]. XTH9 was also found to promote degradation of xyloglucan and increase ductility of hypocotyl cells in red beans [48]. Overexpressing FvXTH9 and FvXTH6 in strawberry accelerated fruit ripening [49], while in cotton, transgenic plants overexpressing GhXTH1 produced 15 to 20 percent longer mature cotton fibers than wild types [50]. AtXTH4 and AtXTH24 were expressed highly in the hypocotyl of Arabidopsis [51], while AtXTH9, AtXTH27, and AtXTH32 were responsible for stem elongation [52]. Genes with higher sequence homology seem to exhibit a similarity in function. BjuB033943 and BjuA012903, which clustered with AtXTH4 in Class I, maintained higher expression levels in stem development especially in the early stages. In Class II, high expression was observed in BjuB008817, BjuA010942, and BjuA031509, which clustered with AtXTH9 clustered in adjacent branches. In addition, BjuB040632 and BjuA003577 with the closest evolution to AtXTH24 were differentially expressed during development stages and maintained a high level of expression. Genes that showed the highest expression in Class III were BjuA046283, BjuA046350, BjuB027461, and BjuA008769. They also had relatively high homology compared with AtXTH27. The other four genes with high homology to AtXTH32, BjuA036491, BjuA018261, BjuA010349, and BjuB016331 showed high expression level in S1 and S2 while their expression in S3 and S4 was downregulated. Results from the transcriptome and qPCR analysis showed that XTH genes expressed differentially during the period of stem development, indicating that they were extensively involved in stem swelling.

Supplementary Materials

The following are available online at https://0-www-mdpi-com.brum.beds.ac.uk/2073-4425/11/1/113/s1. Figure S1: Amplification length of eight genes. Figure S2: Eight genes were amplified by qPCR using specific primers. Figure S3: Standard curve of eight candidate reference genes of B. juncea. Figure S4: The information of Cq values of the eight genes, Table S1: Candidate reference gene information and the primer sequences of cloning. Table S2: Cq value of candidate reference gene in four stem stages of stem mustard. Table S3: Determination of the optimal number of reference genes.

Author Contributions

Conceptualization, M.L., F.X., and H.T.; data curation, Q.H., Y.L., Y.Z., and Y.W.; formal analysis, J.L. (Jiali Liu) and R.G.; funding acquisition, M.L. and H.T.; investigation, F.X., J.L. (Jie Li), Q.C., and F.Z.; writing—original draft, M.L. and F.X.; writing—review and editing, B.S. and X.W. All authors have read and agreed to the published version of the manuscript.

Funding

This research was funded by the Shuangzhi project of Sichuan Agricultural University, grant number 03573134.

Conflicts of Interest

The authors declare no conflict of interest.

References

  1. Zhang, Y.; Han, X.; Chen, S.; Zheng, L.; He, X.; Liu, M.; Qiao, G.; Wang, Y.; Zhuo, R. Selection of suitable reference genes for quantitative real-time PCR gene expression analysis in Salix matsudana under different abiotic stresses. Sci. Rep. 2017, 7, 40290. [Google Scholar] [CrossRef] [PubMed] [Green Version]
  2. Liu, Q.; Qi, X.; Yan, H.; Huang, L.; Nie, G.; Zhang, X. Reference gene selection for quantitative real-time reverse-transcriptase PCR in annual ryegrass (Lolium multiflorum) subjected to various abiotic stresses. Molecules 2018, 23, 172. [Google Scholar] [CrossRef] [PubMed]
  3. Jiang, Q.; Wang, F.; Li, M.Y.; Ma, J.; Tan, G.F.; Xiong, A.S. Selection of suitable reference genes for qPCR normalization under abiotic stresses in Oenanthe javanica (BI.) DC. PLoS ONE 2014, 9, e92262. [Google Scholar] [CrossRef] [PubMed] [Green Version]
  4. Zhang, Y.; Peng, X.; Liu, Y.; Li, Y.; Luo, Y.; Wang, X.; Tang, H. Evaluation of suitable reference genes for qRT-PCR normalization in strawberry (Fragaria × ananassa) under different experimental conditions. BMC Mol. Biol. 2018, 19, 8. [Google Scholar] [CrossRef] [PubMed]
  5. Yperman, J.; Visscher, G.D.; Holvoet, P.; Flameng, W. Beta-actin cannot be used as a control for gene expression in ovine interstitial cells derived from heart valves. J. Heart Valve Dis. 2004, 13, 848–853. [Google Scholar] [CrossRef]
  6. Guo, R.; Guo, H.; Zhang, Q.; Guo, M.; Xu, Y.; Zeng, M.; Lv, P.; Chen, X.; Yang, M. Evaluation of reference genes for RT-qPCR analysis in wild and cultivated Cannabis. Biosci. Biotechnol. Biochem. 2018, 82, 1902–1910. [Google Scholar] [CrossRef] [PubMed]
  7. Liu, M.; Wu, Z.; Jiang, F. Selection and validation of garlic reference genes for quantitative real-time PCR normalization. Plant Cell Tiss. Organ Cult. 2015, 122, 435–444. [Google Scholar] [CrossRef]
  8. Andrade, L.M.; Brito, M.; Junior, R.P.; Marchiori, P.E.R.; Martins, P.M.; Ribeiro, R.V.; Creste, S. Reference genes for normalization of qPCR assays in sugarcane plants under water deficit. Plant Methods 2017, 13, 28. [Google Scholar] [CrossRef] [PubMed] [Green Version]
  9. Sudhakar Reddy, P.; Srinivas Reddy, D.; Sivasakthi, K.; Bhatnagar-Mathur, P.; Vadez, V.; Sharma, K.K. Evaluation of Sorghum [Sorghum bicolor (L.)] Reference genes in various tissues and under abiotic stress conditions for quantitative real-time PCR data normalization. Front. Plant Sci. 2016, 7, 529. [Google Scholar] [CrossRef]
  10. Vissenberg, K.; Oyama, M.; Osato, Y.; Yokoyama, R.; Verbelen, J.P.; Nishitani, K. Differential expression of AtXTH17, AtXTH18, AtXTH19 and AtXTH20 genes in Arabidopsis roots. Physiological roles in specification in cell wall construction. Plant Cell Physiol. 2005, 46, 192–200. [Google Scholar] [CrossRef]
  11. Catalá, C.; Rose, J.K.; Bennett, A.B. Auxin regulation and spatial localization of an endo-1,4-beta-D-glucanase and a xyloglucan endotransglycosylase in expanding tomato hypocotyls. Plant J. 1997, 12, 417–426. [Google Scholar] [CrossRef] [PubMed] [Green Version]
  12. Hyodo, H.; Yamakawa, S.; Takeda, Y.; Tsuduki, M.; Yokota, A.; Nishitani, K.; Kouchi, T. Active gene expression of a xyloglucan endotransglucosylase/hydrolase gene, XTH9, in inflorescence apices is related to cell elongation in Arabidopsis thaliana. Plant Mol. Biol. 2003, 54, 473–482. [Google Scholar] [CrossRef] [PubMed]
  13. Zhu, Q.; Zhang, Z.; Rao, J.; Huber, D.J.; Lv, J.; Hou, Y.; Song, K. Identification of xyloglucan endotransglucosylase/hydrolase genes (XTHs) and their expression in persimmon fruit as influenced by 1-methylcyclopropene and gibberellic acid during storage at ambient temperature. Food Chem. 2013, 138, 471–477. [Google Scholar] [CrossRef]
  14. Shi, H.; Wang, L.L.; Sun, L.T.; Dong, L.L.; Liu, B.; Chen, L.P. Cell division and endoreduplication play important roles in stem swelling of tuber mustard (Brassica juncea Coss. var. tumida Tsen et Lee). Plant Biol. 2012, 14, 956–963. [Google Scholar] [CrossRef] [PubMed]
  15. Cho, S.K.; Kim, J.E.; Park, J.A.; Eom, T.J.; Kim, W.T. Constitutive expression of abiotic stress-inducible hot pepper CaXTH3, which encodes a xyloglucan endotransglucosylase/hydrolase homolog, improves drought and salt tolerance in transgenic Arabidopsis plants. FEBS Lett. 2006, 580, 3136–3144. [Google Scholar] [CrossRef] [PubMed] [Green Version]
  16. Choi, J.Y.; Seo, Y.S.; Kim, S.J.; Kim, W.T.; Shin, J.S. Constitutive expression of CaXTH3, ahotpepperxyloglucan endotransglucosylase/hydrolase, enhanced tolerance to salt and drought stresses without phenotypic defects in tomato plants (Solanum lycopersicum cv. Dotaerang). Plant Cell Rep. 2011, 30, 867–877. [Google Scholar] [CrossRef]
  17. Han, Y.; Wang, W.; Sun, J.; Ding, M.; Zhao, R.; Deng, S.; Wang, F.; Hu, Y.; Wang, Y.; Lu, Y.; et al. Populus euphratica XTH overexpression enhances salinity tolerance by the development of leaf succulence in transgenic tobacco plants. J. Exp. Bot. 2013, 64, 4225–4238. [Google Scholar] [CrossRef] [Green Version]
  18. Vandesompele, J.; De Preter, K.; Pattyn, F.; Poppe, B.; Van Roy, N.; De Paepe, A.; Speleman, F. Accurate normalization of real-time quantitative RT-PCR data by geometric averaging of multiple internal control genes. Genome Biol. 2002, 15. [Google Scholar] [CrossRef] [Green Version]
  19. Andersen, C.L.; Jensen, J.L.; Orntoft, T.F. Normalization of real-time quantitative reverse transcription-PCR data: A model-based variance estimation approach to identify genes suited for normalization, applied to bladder and colon cancer data sets. Cancer Res. 2004, 64, 5245–5250. [Google Scholar] [CrossRef] [Green Version]
  20. Pfaff, M.W.; Tichopad, A.; Prgomet, C.; Neuvians, T.P. Determination of stable housekeeping genes, differentially regulated target genes and sample integrity, BestKeeper–Excel–based tool using pair-wise correlations. Biotechnol. Lett. 2004, 26, 509–515. [Google Scholar] [CrossRef]
  21. Xie, F.L.; Xiao, P.; Chen, D.; Xu, L.; Zhang, B. miRDeepFinder: A miRNA analysis tool for deep sequencing of plant small RNAs. Plant Mol. Biol. 2012, 80, 75–84. [Google Scholar] [CrossRef]
  22. Pfaffl, M.W. A new mathematical model for relative quantification in real-time RT-PCR. Nucleic Acids Res. 2001, 29, e45. [Google Scholar] [CrossRef] [PubMed]
  23. Ramakers, C.; Ruijter, J.M.; Deprez, R.H.; Moorman, A.F. Assumption-free analysis of quantitative real-time polymerase chain reaction (PCR) data. Neurosci. Lett. 2003, 339, 62–66. [Google Scholar] [CrossRef]
  24. Lutova, L.A.; Dolgikh, E.A.; Dodueva, I.E.; Osipova, M.A.; Il’ina, E.L. Investigation of systemic control of plant cell division and differentiation in the model of tumor growth in radish. Genetika 2012, 44, 1075–1083. [Google Scholar] [CrossRef]
  25. Li, Y.; Yu, J.Q.; Ye, Q.J.; Zhu, Z.J.; Guo, Z.J. Expression of CycD3 is transiently increased by pollination and N-(2-chloro-4-pyridyl)-N’-phenylurea in ovaries of Lagenaria leucantha. J. Exp. Bot. 2003, 54, 1245–1251. [Google Scholar] [CrossRef] [PubMed]
  26. Mallona, I.; Lischewski, S.; Weiss, J.; Hause, B.; Egea-Cortines, M. Validation of reference genes for quantitative real-time PCR during leaf and flower development in Petunia hybrida. BMC Plant Biol. 2010, 10, 4. [Google Scholar] [CrossRef] [Green Version]
  27. Kozera, B.; Rapacz, M. Reference genes in real-time PCR. J. Appl. Genet. 2013, 54, 391–406. [Google Scholar] [CrossRef] [Green Version]
  28. Nicot, N.; Hausman, J.F.; Hoffmann, L.; Evers, D. Housekeeping gene selection for real-time RT-PCR normalization in potato during biotic and abiotic. J. Exp. Bot. 2005, 56, 2907–2914. [Google Scholar] [CrossRef]
  29. Wu, J.; Zhang, H.; Liu, L.; Li, W.; Wei, Y.; Shi, S. Validation of reference genes for RT-qPCR studies of gene expression in preharvest and postharvest longan fruits under different experimental conditions. Front. Plant Sci. 2016, 7, 780. [Google Scholar] [CrossRef] [Green Version]
  30. Tian, C.; Jiang, Q.; Wang, F.; Wang, G.L.; Xu, Z.S.; Xiong, A.S. Selection of suitable reference genes for qPCR normalization under abiotic stresses and hormone stimuli in carrot leaves. PLoS ONE 2015, 10, e0117569. [Google Scholar] [CrossRef] [Green Version]
  31. Shivhare, R.; Lata, C. Selection of suitable reference genes for assessing gene expression in pearl millet under different abiotic stresses and their combinations. Sci. Rep. 2016, 6, 23036. [Google Scholar] [CrossRef] [PubMed] [Green Version]
  32. Løvdal, T.; Lillo, C. Reference gene selection for quantitative real-time PCR normalization in tomato subjected to nitrogen, cold, and light stress. Anal. Biochem. 2009, 387, 238–242. [Google Scholar] [CrossRef] [PubMed]
  33. Jain, M.; Nijhawan, A.; Tyagi, A.K.; Khurana, J.P. Validation of housekeeping genes as internal control for studying gene expression in rice by quantitative real-time PCR. Biochem. Biophys. Res. Commun. 2006, 345, 646–651. [Google Scholar] [CrossRef] [PubMed]
  34. Li, M.Y.; Wang, F.; Jiang, Q.; Wang, G.L.; Tian, C.; Xiong, A.S. Validation and comparison of reference genes for qPCR normalization of celery (Apium graveolens) at different development stages. Front. Plant Sci. 2016, 7, 313. [Google Scholar] [CrossRef] [PubMed] [Green Version]
  35. Wu, Z.J.; Tian, C.; Jiang, Q.; Li, X.H.; Zhuang, J. Selection of suitable reference genes for qRT-PCR normalization during leaf development and hormonal stimuli in tea plant (Camellia sinensis). Sci. Rep. 2016, 6, 19748. [Google Scholar] [CrossRef] [PubMed] [Green Version]
  36. Obrero, A.; Die, J.V.; Román, B.; Gómez, P.; Nadal, S.; González-Verdejo, C.I. Selection of reference genes for gene expression studies in zucchini (Cucurbita pepo) using qPCR. J. Agric. Food Chem. 2011, 59, 5402–5411. [Google Scholar] [CrossRef] [PubMed] [Green Version]
  37. Behar, H.; Graham, S.W.; Brumer, H. Comprehensive cross-genome survey and phylogeny of glycoside hydrolase family 16 members reveals the evolutionary origin of EG16 and XTH proteins in plant lineages. Plant J. 2018, 95, 1114–1128. [Google Scholar] [CrossRef] [PubMed] [Green Version]
  38. Rose, J.K.; Braam, J.; Fry, S.C.; Nishitani, K. The XTH family of enzymes involved in xyloglucan endotransglucosylation and endohydrolysis: Current perspectives and a new unifying nomenclature. Plant Cell Physiol. 2002, 43, 1421–1435. [Google Scholar] [CrossRef] [Green Version]
  39. Yokoyama, R.; Rose, J.K.; Nishitani, K. A surprising diversity and abundance of xyloglucan endotransglucosylase/hydrolases in rice. Classification and expression analysis. Plant Physiol. 2004, 134, 1088–1099. [Google Scholar] [CrossRef] [Green Version]
  40. Song, L.; Valliyodan, B.; Prince, S.; Wan, J.; Nguyen, H.T. Characterization of the XTH gene family: New insight to the roles in soybean flooding tolerance. Int. J. Mol. Sci. 2018, 19, 2705. [Google Scholar] [CrossRef] [Green Version]
  41. Wang, M.; Xu, Z.; Ding, A.; Kong, Y. Genome-wide identification and expression profiling analysis of the xyloglucan endotransglucosylase/hydrolase gene family in tobacco (Nicotiana tabacum L.). Genes 2018, 9, 273. [Google Scholar] [CrossRef] [PubMed] [Green Version]
  42. Lysak, M.A.; Koch, M.A.; Pecinka, A.; Schubert, I. Chromosome triplication found across the tribe Brassiceae. Genome Res. 2005, 15, 516–525. [Google Scholar] [CrossRef] [PubMed] [Green Version]
  43. Wang, X.; Wang, H.; Wang, J.; Sun, R.; Wu, J.; Liu, S.; Bai, Y.; Mun, J.H.; Bancroft, I.; Cheng, F.; et al. The genome of the mesopolyploid crop species Brassica rapa. Nat. Genet. 2011, 43, 1035–1039. [Google Scholar] [CrossRef] [PubMed] [Green Version]
  44. Nagaharu, U. Genome analysis in Brassica with special reference to the experimental formation of B. napus and peculiar mode of fertilization. Jpn. J. Bot. 1935, 7, 389–452. [Google Scholar]
  45. Chen, A.H.; Chai, Y.R.; Li, J.N.; Chen, L. Molecular cloning of two genes encoding cinnamate 4-hydroxylase (C4H) from oilseed rape (Brassica napus). J. Biochem. Mol. Biol. 2007, 40, 247–260. [Google Scholar] [CrossRef] [PubMed]
  46. Shopan, J.; Mou, H.; Zhang, L.; Zhang, C.; Ma, W.; Walsh, J.A.; Hu, Z.; Yang, J.; Zhang, M. Eukaryotic translation initiation factor 2B-beta (eIF2Bβ), a new class of plant virus resistance gene. Plant J. 2017, 90, 929–940. [Google Scholar] [CrossRef] [PubMed] [Green Version]
  47. Van Sandt, V.S.; Suslov, D.; Verbelen, J.P.; Vissenberg, K. Xyloglucan endotransglucosylase activity loosens a plant cell wall. Ann. Bot. 2007, 100, 1467–1473. [Google Scholar] [CrossRef] [Green Version]
  48. Kaku, T.; Tabuchi, A.; Wakabayashi, K.; Hoson, T. Xyloglucan oligosaccharides cause cell wall loosening by enhancing xyloglucan endotransglucosylase/hydrolase activity in azuki bean epicotyls. Plant Cell Physiol. 2004, 45, 77–82. [Google Scholar] [CrossRef] [Green Version]
  49. Witasari, L.D.; Huang, F.C.; Hoffmann, T.; Rozhon, W.; Fry, S.C.; Schwab, W. Higher expression of the strawberry xyloglucan endotransglucosylase/hydrolase genes FvXTH9 and FvXTH6 accelerates fruit ripening. Plant J. 2019, 100, 1237–1253. [Google Scholar] [CrossRef] [Green Version]
  50. Lee, J.; Burns, T.H.; Light, G.; Sun, Y.; Fokar, M.; Kasukabe, Y.; Fujisawa, K.; Maekawa, Y.; Allen, R.D. Xyloglucan endotransglycosylase/hydrolase genes in cotton and their role in fiber elongation. Planta 2010, 232, 1191–1205. [Google Scholar] [CrossRef]
  51. Miedes, E.; Suslov, D.; Vandenbussche, F.; Kenobi, K.; Ivakov, A.; Van Der Straeten, D.; Lorences, E.P.; Mellerowicz, E.J.; Verbelen, J.P.; Vissenberg, K. Xyloglucan endotransglucosylase/hydrolase (XTH) overexpression affects growth and cell wall mechanics in etiolated Arabidopsis hypocotyls. J. Exp. Bot. 2013, 64, 2481–2497. [Google Scholar] [CrossRef] [PubMed] [Green Version]
  52. Becnel, J.; Natarajan, M.; Kipp, A.; Braam, J. Developmental expression patterns of Arabidopsis XTH genes reported by transgenes and genevestigator. Plant Mol. Biol. 2006, 61, 451–467. [Google Scholar] [CrossRef] [PubMed]
Figure 1. Growth state of stem mustard in four different development stages.
Genes 11 00113 g001
Figure 2. Melting curve analysis of eight candidate reference genes of stem mustard.
Genes 11 00113 g002
Figure 3. The Cq values of eight genes in all samples. The asterisk in the figure represents outliers, the line across the box represents median, the box represents a range of 25 to 75% in the value of Cq, and the extension lines at the top and bottom represent a range of 5 to 95%, with different levels of abundance for each reference gene transcript. Cq: quantification cycle.
Genes 11 00113 g003
Figure 4. The M-values of the eight genes in different development stages. M: Average stability index.
Genes 11 00113 g004
Figure 5. RefFinder comprehensively analyzed the expression stable level of eight candidate reference genes during different development stages of B. juncea.
Genes 11 00113 g005
Figure 6. Pairwise comparative analysis of eight reference genes in B. juncea.
Genes 11 00113 g006
Figure 7. Transcript abundance and qPCR analysis of BjuB045330 and BjuA003219 at different stages of development. (A) Transcript abundance (1) and relative expression level (2) of BjuB045330. (B) Transcript abundance (1) and relative expression level (2) of BjuA003219. FPKM values were log2-based.
Genes 11 00113 g007
Figure 8. Phylogenetic tree of xyloglucan endotransglucosylase/hydrolase (XTHs) from B. juncea and Arabidopsis. The phylogenetic tree was constructed by the Neighbor-joining method with 1000 bootstrap replications. The three groups are represented with different colors.
Genes 11 00113 g008
Figure 9. Expression levels of BjuXTH genes at different developmental stages in stem swelling. Fragments per kilobase per million (FPKM) values of BjuXTH genes were transformed by log2, and the heatmap was constructed with Multiexperiment Viewer software.
Genes 11 00113 g009
Figure 10. Gene expression and regression analysis of BjuXTH family genes.
Genes 11 00113 g010
Table 1. Information of candidate reference gene and qPCR amplification characteristics.
Gene SymbolGene NamePrimer Sequence (5’-3’)Amplicon Size (bp)Correlation Coefficient
EF-1αElongation factor -1α geneCGTCTGCTTAGTGAACCTGCTC/
GAAGGAGCGAATGTCACAACCA
1120.996
HISHistoneAGGGAAAGCCGCTCCACTTC/
TCGTAACCCTCTTGGCGTGAAT
1520.996
IF-4αEukaryotic initiation factor 4 alphaCAAGCCGAGCCTGCGATCAT/
TCGTGTTCTGGTCCATGTCTCC
1210.996
PP2AProtein phosphatase 2AAAGCCGAGCCTTCCATCATAGC/
ACCACCACCACCACTCATTGC
1970.992
TUBTubulin geneGCGTCTTGTCCGTGAGATTGC/
GCCGAGATGAGGTGGTTAAGGT
1090.994
UBCUbiquitin C geneGCCATCACTCAGAGCGTCATCT/
AAGGAGACTGTGTAGGACCAAGAA
1000.999
UBQPolyubiquitin 10 geneTGCGTCTACCACTTCAGGATGT/
TCTGCTGGTCTGGAGGAATGC
1450.992
ACTINActin geneATCGTCTGTGACAACGGTAC/
ATGGAGGGTGATGAGATTCAGC
2670.992
Table 2. Gene expression stability ranking of geNorm, NormFinder and BestKeeper.
GroupRankgeNorm NormFinder BestKeeper
GeneStabilityGene NameStability ValueGeneSD [±Cq]CV [%Cq]
Total1UBC0.49UBC0.31TUB0.672.73
2UBQ0.49TUB0.39UBC0.773.02
3TUB0.71UBQ0.48UBQ0.83.74
4HIS0.92HIS0.59ACTIN0.862.91
5EF-1α1.03IF-4α0.68HIS0.873.51
6IF-4α1.06EF-1α0.7EF-1α0.94.01
7PP2A1.22PP2A0.97IF-4α0.923.83
8ACTIN1.36ACTIN1.06PP2A13.53
S11UBC0.33UBC0.11EF-1α0.281.26
2TUB0.33IF-4α0.17IF-4α0.391.61
3UBQ0.45TUB0.26HIS0.532.13
4IF-4α0.52UBQ0.45PP2A0.662.26
5PP2A0.61EF-1α0.45UBC0.712.67
6EF-1α0.69PP2A0.45TUB0.813.29
7HIS0.73HIS0.56UBQ0.94.01
8ACTIN1.15ACTIN1.65ACTIN1.836.05
S21UBC0.26IF-4α0.19TUB0.251.02
2HIS0.26UBC0.23IF-4α0.622.78
3EF-1α0.37UBQ0.25ACTIN0.72.39
4UBQ0.44EF-1α0.35UBQ0.864.09
5IF-4α0.5TUB0.39UBC0.933.75
6TUB0.58HIS0.42EF-1α1.054.9
7PP2A0.71PP2A0.62HIS1.054.37
8ACTIN0.88ACTIN0.93PP2A1.143.89
S31UBC0.4EF-1α0.11EF-1α0.230.96
2TUB0.4UBC0.27UBC0.361.4
3UBQ0.43PP2A0.33PP2A0.51.85
4EF-1α0.48IF-4α0.38UBQ0.512.39
5IF-4α0.61UBQ0.46TUB0.62.37
6PP2A0.68TUB0.55IF-4α0.622.54
7HIS0.82HIS0.68HIS0.732.84
8ACTIN0.9ACTIN0.68ACTIN0.842.84
S41UBC0.25UBC0.08EF-1α0.381.68
2TUB0.25TUB0.23PP2A0.572.09
3IF-4α0.32EF-1α0.27IF-4α0.582.35
4UBQ0.4IF-4α0.32UBC0.62.39
5EF-1α0.48PP2A0.37TUB0.682.81
6PP2A0.58UBQ0.37UBQ0.833.99
7HIS0.65HIS0.55HIS0.943.83
8ACTIN0.86ACTIN0.96ACTIN1.053.61

