Article

Effect of Phenotype Selection on Genome Size Variation in Two Species of Diptera

by
Carl E. Hjelmen
1,2,*,
Jonathan J. Parrott
1,3,
Satyam P. Srivastav
1,4,
Alexander S. McGuane
1,5,
Lisa L. Ellis
1,6,
Andrew D. Stewart
7,
J. Spencer Johnston
1 and
Aaron M. Tarone
1
1
Department of Entomology, Texas A&M University, College Station, TX 77843, USA
2
Department of Biology, Texas A&M University, College Station, TX 77843, USA
3
School of Mathematical and Natural Sciences, Arizona State University, Glendale, AZ 85306, USA
4
Department of Molecular Biology and Genetics, Cornell University, Ithaca, NY 14853, USA
5
Harris County Institute of Forensic Sciences, 1861 Old Spanish Trail, Houston, TX 77054, USA
6
Department of Biology, Houston Baptist University, Houston, TX 77074, USA
7
Department of Biology, Canisius College, Buffalo, NY 14208, USA
*
Author to whom correspondence should be addressed.
Submission received: 30 January 2020 / Revised: 11 February 2020 / Accepted: 15 February 2020 / Published: 19 February 2020
(This article belongs to the Special Issue Genetic Basis of Phenotypic Variation in Drosophila and Other Insects)

Abstract

:
Genome size varies widely across organisms yet has not been found to be related to organismal complexity in eukaryotes. While there is no evidence for a relationship with complexity, there is evidence to suggest that other phenotypic characteristics, such as nucleus size and cell-cycle time, are associated with genome size, body size, and development rate. However, what is unknown is how the selection for divergent phenotypic traits may indirectly affect genome size. Drosophila melanogaster were selected for small and large body size for up to 220 generations, while Cochliomyia macellaria were selected for 32 generations for fast and slow development. Size in D. melanogaster significantly changed in terms of both cell-count and genome size in isolines, but only the cell-count changed in lines which were maintained at larger effective population sizes. Larger genome sizes only occurred in a subset of D. melanogaster isolines originated from flies selected for their large body size. Selection for development time did not change average genome size yet decreased the within-population variation in genome size with increasing generations of selection. This decrease in variation and convergence on a similar mean genome size was not in correspondence with phenotypic variation and suggests stabilizing selection on genome size in laboratory conditions.

1. Introduction

Genome size is considered to be at the intersection of genotype and phenotype, as it has the full complement of DNA sequence, but is a physical measure of the amount of DNA, often recorded in mass (pg) [1,2]. Interspecific variation in genome size is commonly measured, which has revealed a 7000-fold variation in genome size between different animal species [3]. Less, however, is known about intraspecific genome size variation. Genome size is generally considered heritable and maintained for a species [2]. At a finer scale, though, that viewpoint is changing. With increased resolution in estimation techniques, there is now information on levels of intraspecific variation that show measurable differences in genome sizes between inbred strains [4,5], within populations [6], and between populations [7]. There, it is of great interest that the differences between these strains and populations are quantitative, can be visualized when co-prepared, and have been found to be related to fitness parameters [4,5,7,8].
While genome size is not related to organismal complexity, it has been found to have phenotypic and physiological correlates, which selection may act upon [1,9,10]. An increase in genome size can lead to an increase in overall cell size, through an increase in the physical volume of the nucleus and the cell in order to hold the larger quantity of genetic material [11,12]. This pattern has been found in both plants and animals [13,14,15,16]. While there are cellular correlations with genome size, the relationship may decrease with increases in scale of the phenotype [17]. For example, body size variation in Drosophila species is commonly related to cell-counts, but may be related to cell size [18] as a correlate of genome size. In the cases of flatworms and copepod crustaceans, where there is a significant relationship between genome size and body size, an increase in cell volume is accompanied by increase in cell number, suggesting that body size may be an interaction between cell size and count [19,20]. If this is the case, then genome size increases that affect cell size may be considered as one possible mechanism by which an organism can evolve a larger body size.
Increased genome size may also lead to increased cell-cycle time, replication times, and, in some cases, an increased development time [12,21,22,23,24,25,26]. There have also been multiple examples of where genome size is related to development rate in copepod crustaceans [27,28]. Additionally, genome size was found to be positively associated with body size in aphids, although their overall small genome size may be related to their rapid development times [29]. In passerine birds, genome size is not only positively correlated to cell/nucleus size, but is also positively related to wing loading index, defined as the amount of mass carried by unit wing area [13]. These associations suggest to some that genome size change may be in response to life history and ecological conditions [30,31,32]. It remains possible, however, that there is no direct, or general phenotypic consequences of variation in genome size, or that significant associations are mitigated through some other third factor [17]. The generality of a phenotypic correlation with genome size remains to be established.
Given the relationships explained in the above paragraphs, we expect that if there is a phenotypic or fitness correlation between a selectable trait and genome size, then differential selection on that trait may result in an indirect selection for a change in genome size; either as an increase or a decrease in the amount of DNA. Alternatively, if genome size is not correlated or indirectly selected, any genome size change that occurs (if any), including direction (increase/decrease), should be independent of the change in the selected trait. Furthermore, the variation in genome size should not be tied to variation in the selected trait. Finally, genome size may be related to fitness, where that fitness is associated with body size or development rate, yet it is constrained by multiple other pleiotropic fitness effects related to genome size variation. In this last case, we might see evidence for stabilizing selection, and we may see genome size change only when the effects of antagonistic selection are limited by a small effective population size, as proposed by Lynch and Conery [33].
Here we use long-running selection experiments for development time in the blow fly Cochliomyia macellaria and a longer running selection experiment for differential body size in Drosophila melanogaster to investigate the effects of developmental and phenotypic selection on genome size. If there is a strong relationship between genome size and development time in C. macellaria, we expect to see a decrease in genome size with faster development times and an increase in genome size with longer development times. Similarly, if a strong relationship exists between genome size and body size, we expect to see larger genome sizes in D. melanogaster that are selected for large body size, and the opposite for those selected for small body size. Any other change in genome size will argue for either (1) genetic drift and neutral genome size evolution, or (2) constraints on genome size evolution imposed by antagonistic selection, due to multiple pleiotropic fitness effects.

2. Materials and Methods

2.1. C. macellaria Colony Development

Wild type Cochliomyia macellaria were collected from three locations in Texas in order to replicate selection regimes: College Station, Longview, and San Marcos. Colonies were established at the Forensic Laboratory for Investigative Entomological Sciences (FLIES) at Texas A&M University. As part of a larger experiment, three selection treatments were established for each origin: slow development, fast development, and a selection control. Specimens from this selection experiment were vouchered at the Texas A&M University Insect Collection (Voucher #728).
C. macellaria eggs (N = ~1200) were collected for each location and reared in one-quart mason jars with sand and beef liver. Time from egg laying to adult emergence was measured in hours for each generation of selection. Rearing took place in a Percival incubator at 25 °C and 14:10 Light-Dark Cycle at 40% relative humidity. The first 200 of the 1200 flies in generation one were used to establish fast developing colonies. The last 200 flies to emerge were used to establish slow developing colonies. From this point, fast flies were selected as the first 200 to emerge, whereas slow flies were the last 200 to emerge. Control flies were reared the same as selected flies, but no selection on development time was imposed between generations. Selection of flies for fast, slow and controls were carried out each generation for 32 generations and development times were recorded each generation. This resulted in nine different populations: Slow, Fast, and Control development time for populations from three different cities. Adult flies from each generation were frozen at −20 °C for further genetic analyses, a subset of which were used for this study.

2.2. Drosophila Body Size Selection

Selection lines, or outbred populations, were derived from the same populations evaluated in Turner et al. [34] and subsequently in Stewart and Rice [35], where full details of selection protocols and the selection response can be found. For these purposes, we utilized three of the lines described in these papers, specifically the “Large” (both males and females experienced strong artificial selection for increased body size), “Small” (both males and females experienced strong artificial selection for decreased body size), and “Control” (no artificial selection on body size in either sex) lines. Within each treatment, two independent replicates lines (1 and 2) were maintained, resulting in six lines (L1, L2, S1, S2, C1, C2). For the purpose of this manuscript, flies were taken for genome size and cell-count measurement after 220 generations of selection, henceforth referred to as the outbred selection lines. Additionally, for this study, after 130 generations of size selection, inbred lines were formed from the size selected lines (L1, L2, S1, S2) through 10 generations of sibling mating. The control population (C1, C2) were included in the analysis of genome size of outbred selection lines but did not have subsequent isolines developed. A critical distinction between the Drosophila and the blow fly experiment is that the census size, and therefore the effective population size, was carefully maintained in the body size selection experiment—specifically each generation, was cultured with 320 breeding individuals at a 50:50 sex ratio. Previous studies have found this to only have modest effects on the effective population sizes of these flies [36]. In the case of the C. macellaria experiment, we expect a greater decrease of the effective population size each generation due to the process of artificial selection in a closed population and eventual inbreeding effects.

2.3. Species Genome Size Estimation and Calculation of Cell-Count Ratio

Individual C. macellaria or D. melanogaster were co-prepared with a standard female Drosophila virilis (1C/Haploid genome size = 328 Mbp) for flow cytometric analysis of genome size [37]. Briefly, neural tissue was dissected for both the sample and the standard, placed into 1 mL of Galbraith buffer within a 2 mL Kontes dounce tube and ground with 15 strokes of a Kontes B pestle. The sample was then filtered through 43 µm nylon mesh and stained for at least 20 min using 25 µL of 1 mg/mL concentrated propidium iodide solution. Genome size of the sample was estimated by comparing the position and mean of the fluorescent peak between the sample and the standard. Samples that were degraded when frozen, as evidenced by low nuclei counts, were discarded. In C. macellaria, genome size was measured in multiple individual frozen samples collected for each location (College Station, Longview, San Marcos) at three generational time points (1, 10, 32). Results from individual male and female C. macellaria values were pooled for post-estimation analyses, as there is not a statistical difference in genome size between the sexes and a small effect size of sex on development time, with only about five-hour difference in development time between males and females in control lines [38]. Only female D. melanogaster were used for estimation for the outbred S1, S2, C1, C2, L1, and L2 selection populations. Male and female genome sizes were estimated separately for the large and small isolines.
The cell-count ratio for D. melanogaster was estimated by taking the ratio of the number of counts in the D. melanogaster 2C (diploid) peak to the number of counts in the standard D. virilis 2C peak. The cell-counts were taken from the same flow cytometric peaks used for genome size estimation. Samples were taken from whole heads of both species; thus, the cell-count ratios reflect numbers of cells in D. melanogaster heads compared to the reference D. virilis strain heads.

2.4. Statistical Analysis

2.4.1. C. macellaria

Genome size was compared for each location (College Station, Longview, San Marcos) among treatments (Fast, Slow, Control) at three generational time points (1, 10, 32) using ANOVA in R 3.3.0 [39]. Tukey’s HSD was utilized in cases where significant ANOVA values were found. Genome size and development time data was also investigated with a variance component analysis using the anovaVCA function in the package VCA in R to determine the amount of variation at each generation [40]. The variance component analyses were completed using the model: Trait = City + Selection + City*Selection + Error.

2.4.2. D. melanogaster

Genome size and cell-counts were compared for isolines from different selection treatments and for the larger selection populations utilizing ANOVA in R 3.3.0 [39]. Tukey’s HSD was calculated and plotted onto boxplots with the confidence level set to 0.95. A two-dimensional Kolmogorov-Smirnov test was performed to determine if significant differences existed between distributions of large and small isolines separated by cell-count ratio and genome size using the function peacock2() in the package ‘Peacock.test’ in R [41].

3. Results

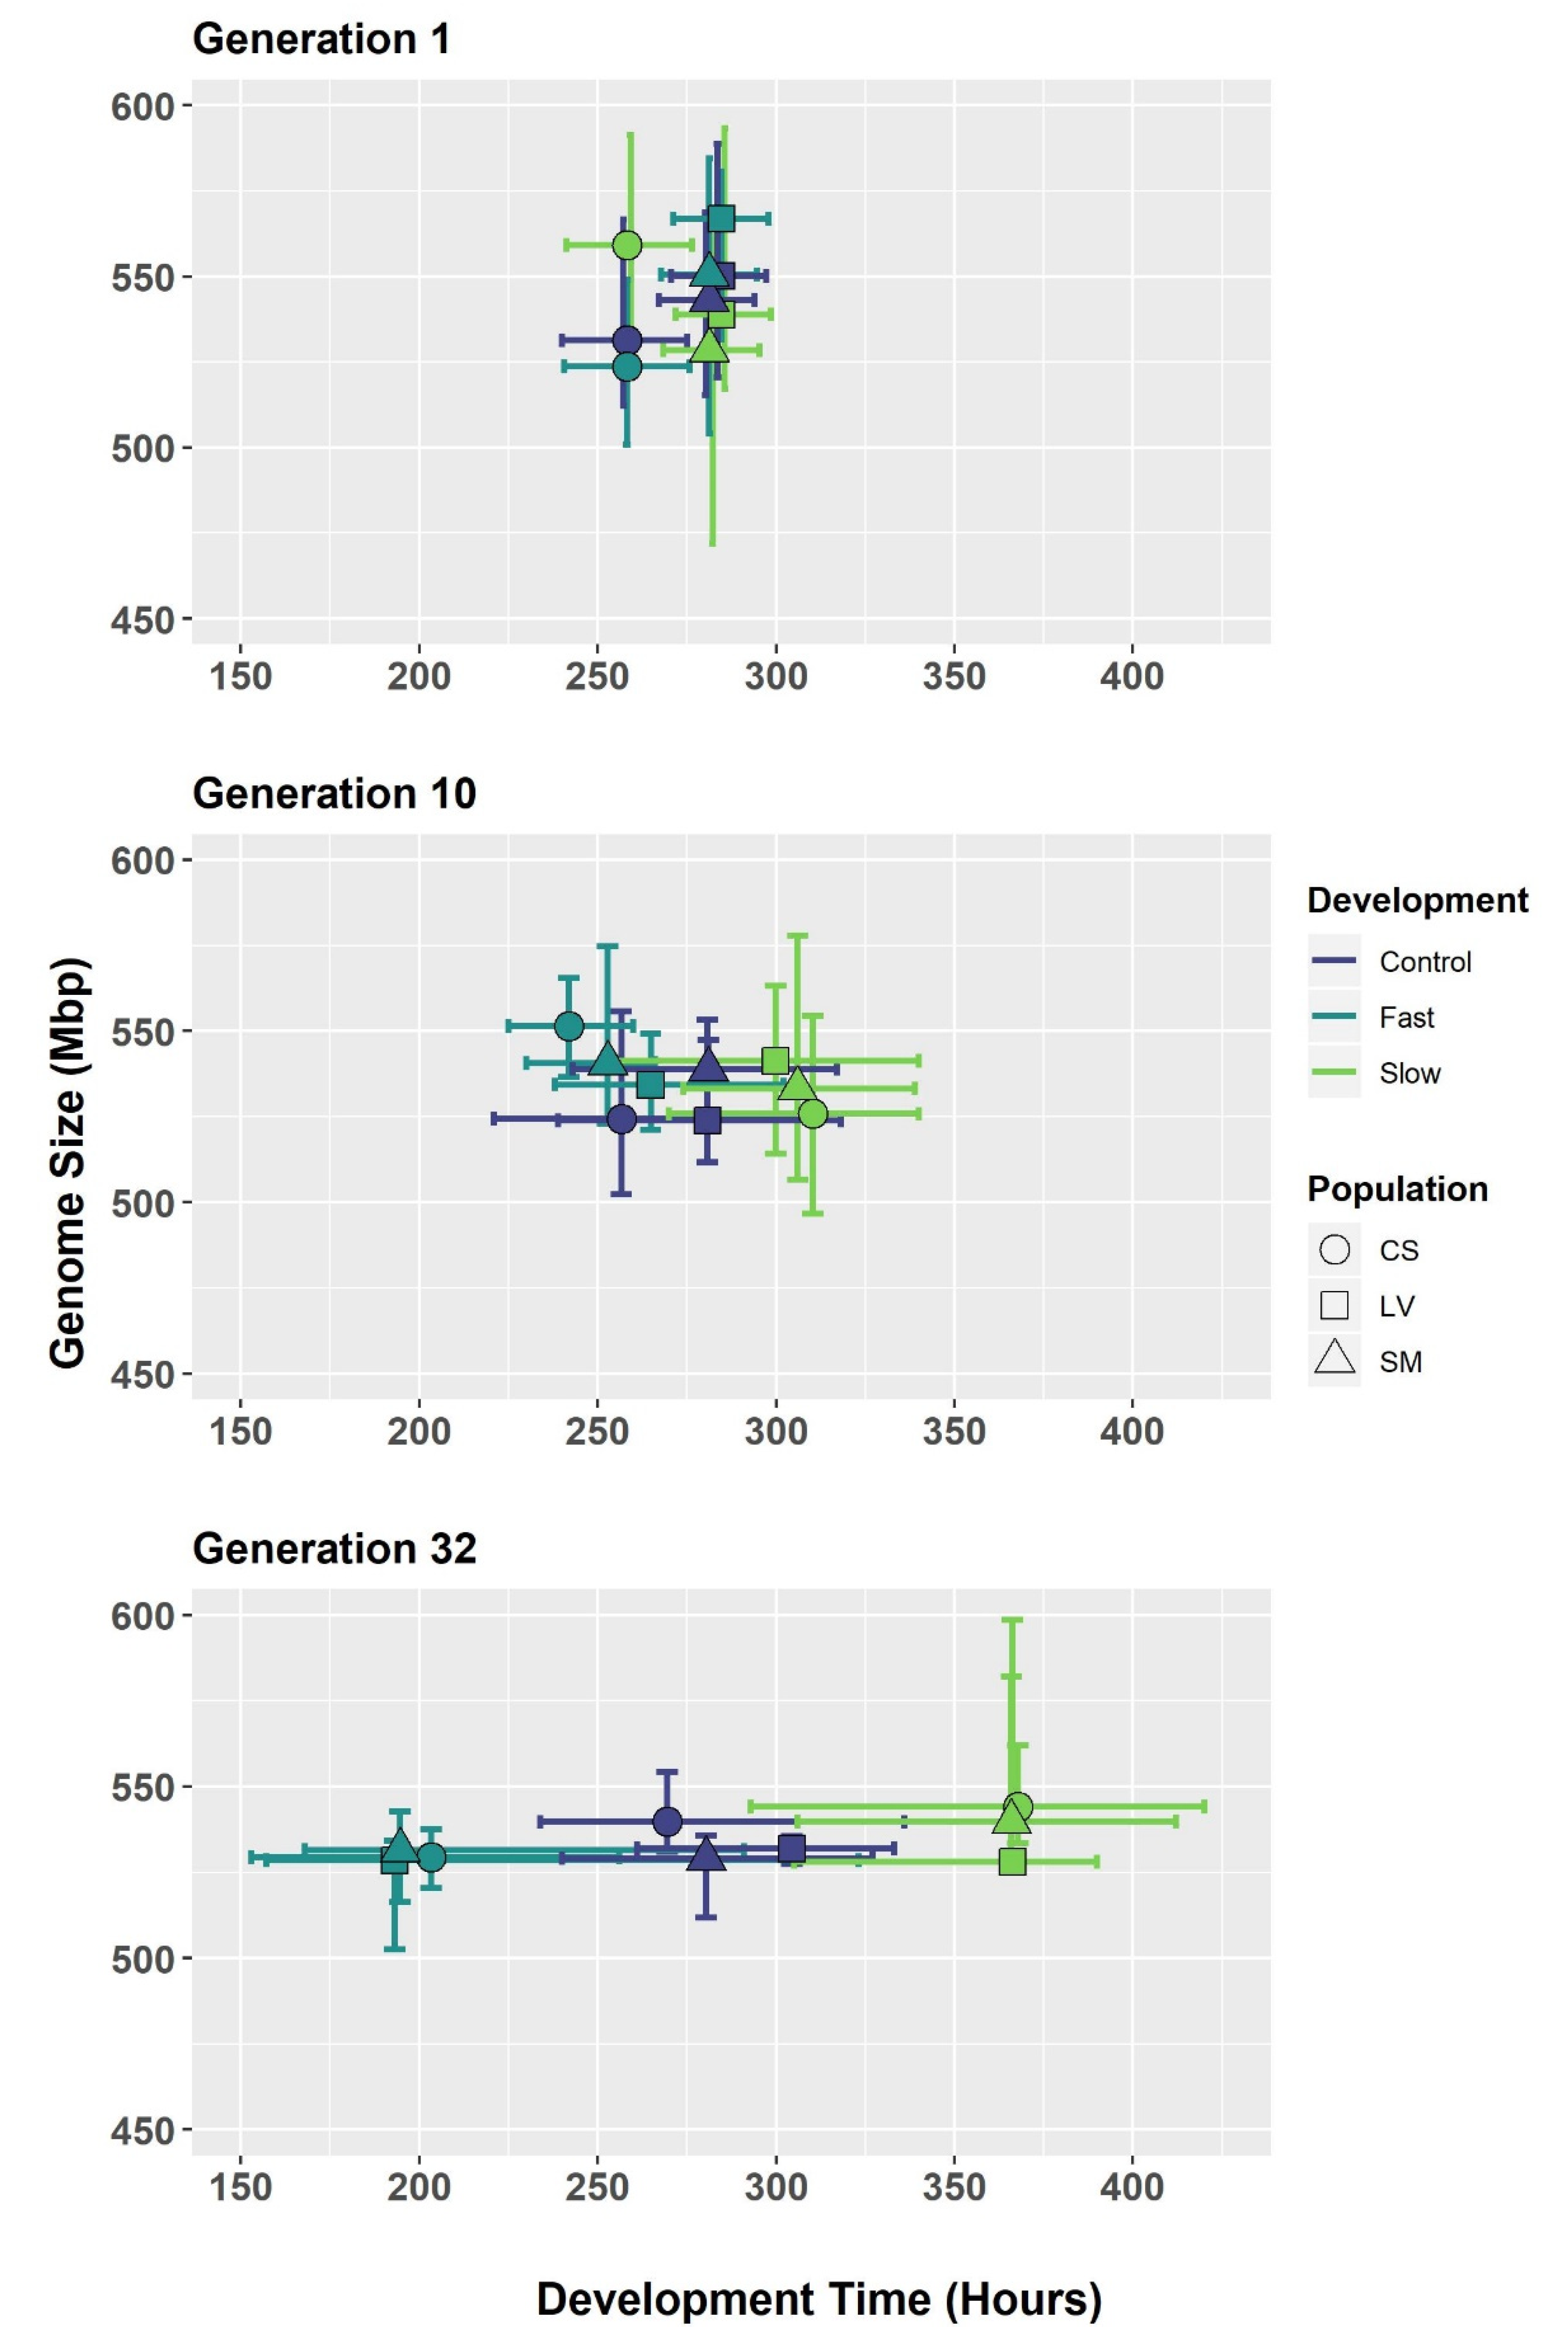
3.1. C. macellaria after 32 Generations of Selection

C. macellaria populations showed differential responses to selection, showing that populations selected for fast selection time resulted in faster development times and those selected for slower generation times developed slower (Figure 1 and Figure S1). According to the variance component analysis, an increase in variance for selection treatment was seen by generation for development time, verifying this divergence in phenotype (Table 1). Variance did not decrease in development time for the City*Selection interaction by generation (Table 1). Variance at generation 1 is zero due to development times being equal in starting populations (Table 1 and Table 2).
Average genome size measurements for each location, selection treatment, and generation is given in Table 2. After 32 generations of selection for fast and slow development, genome size change was observed in only four groups: College Station Slow, College Station Fast, Longview Control, and Longview Fast (Figure 1 and Figure S2, Table 2). In the College Station group, generation 10 differed significantly from the others (Tukey HSD, confidence level = 0.95, Figure 1 and Figure S2). Since Generation 1 and 32 were not significantly different in College Station groups, there was no directional change in genome size after selection. In the Longview groups, Generation 1 was different from the others (Tukey HSD, configuration level = 0.95, Figure 1 and Figure S2). Both control and fast groups changed in a downward trajectory (Figure 1). However, Generation 1 in Longview fast may be inflated due to a few individuals with larger genomes. Significant differences in genome size by generation were not found in any other group or at any other level.
While no directional change was seen in genome size after 32 generations of selection in any of the investigated strains, there was a decrease in the amount of variation for the City*Selection interaction with increasing generations (Table 1 and Table 2). This pattern of reduced variation in genome size in later generations is evident in the individual treatments (Figure 1) and when the genome sizes are pooled by generation (Figure S3). A reduction in variation of the selected trait, development time, in the City*Selection interaction by generation was not seen, however (Table 1).

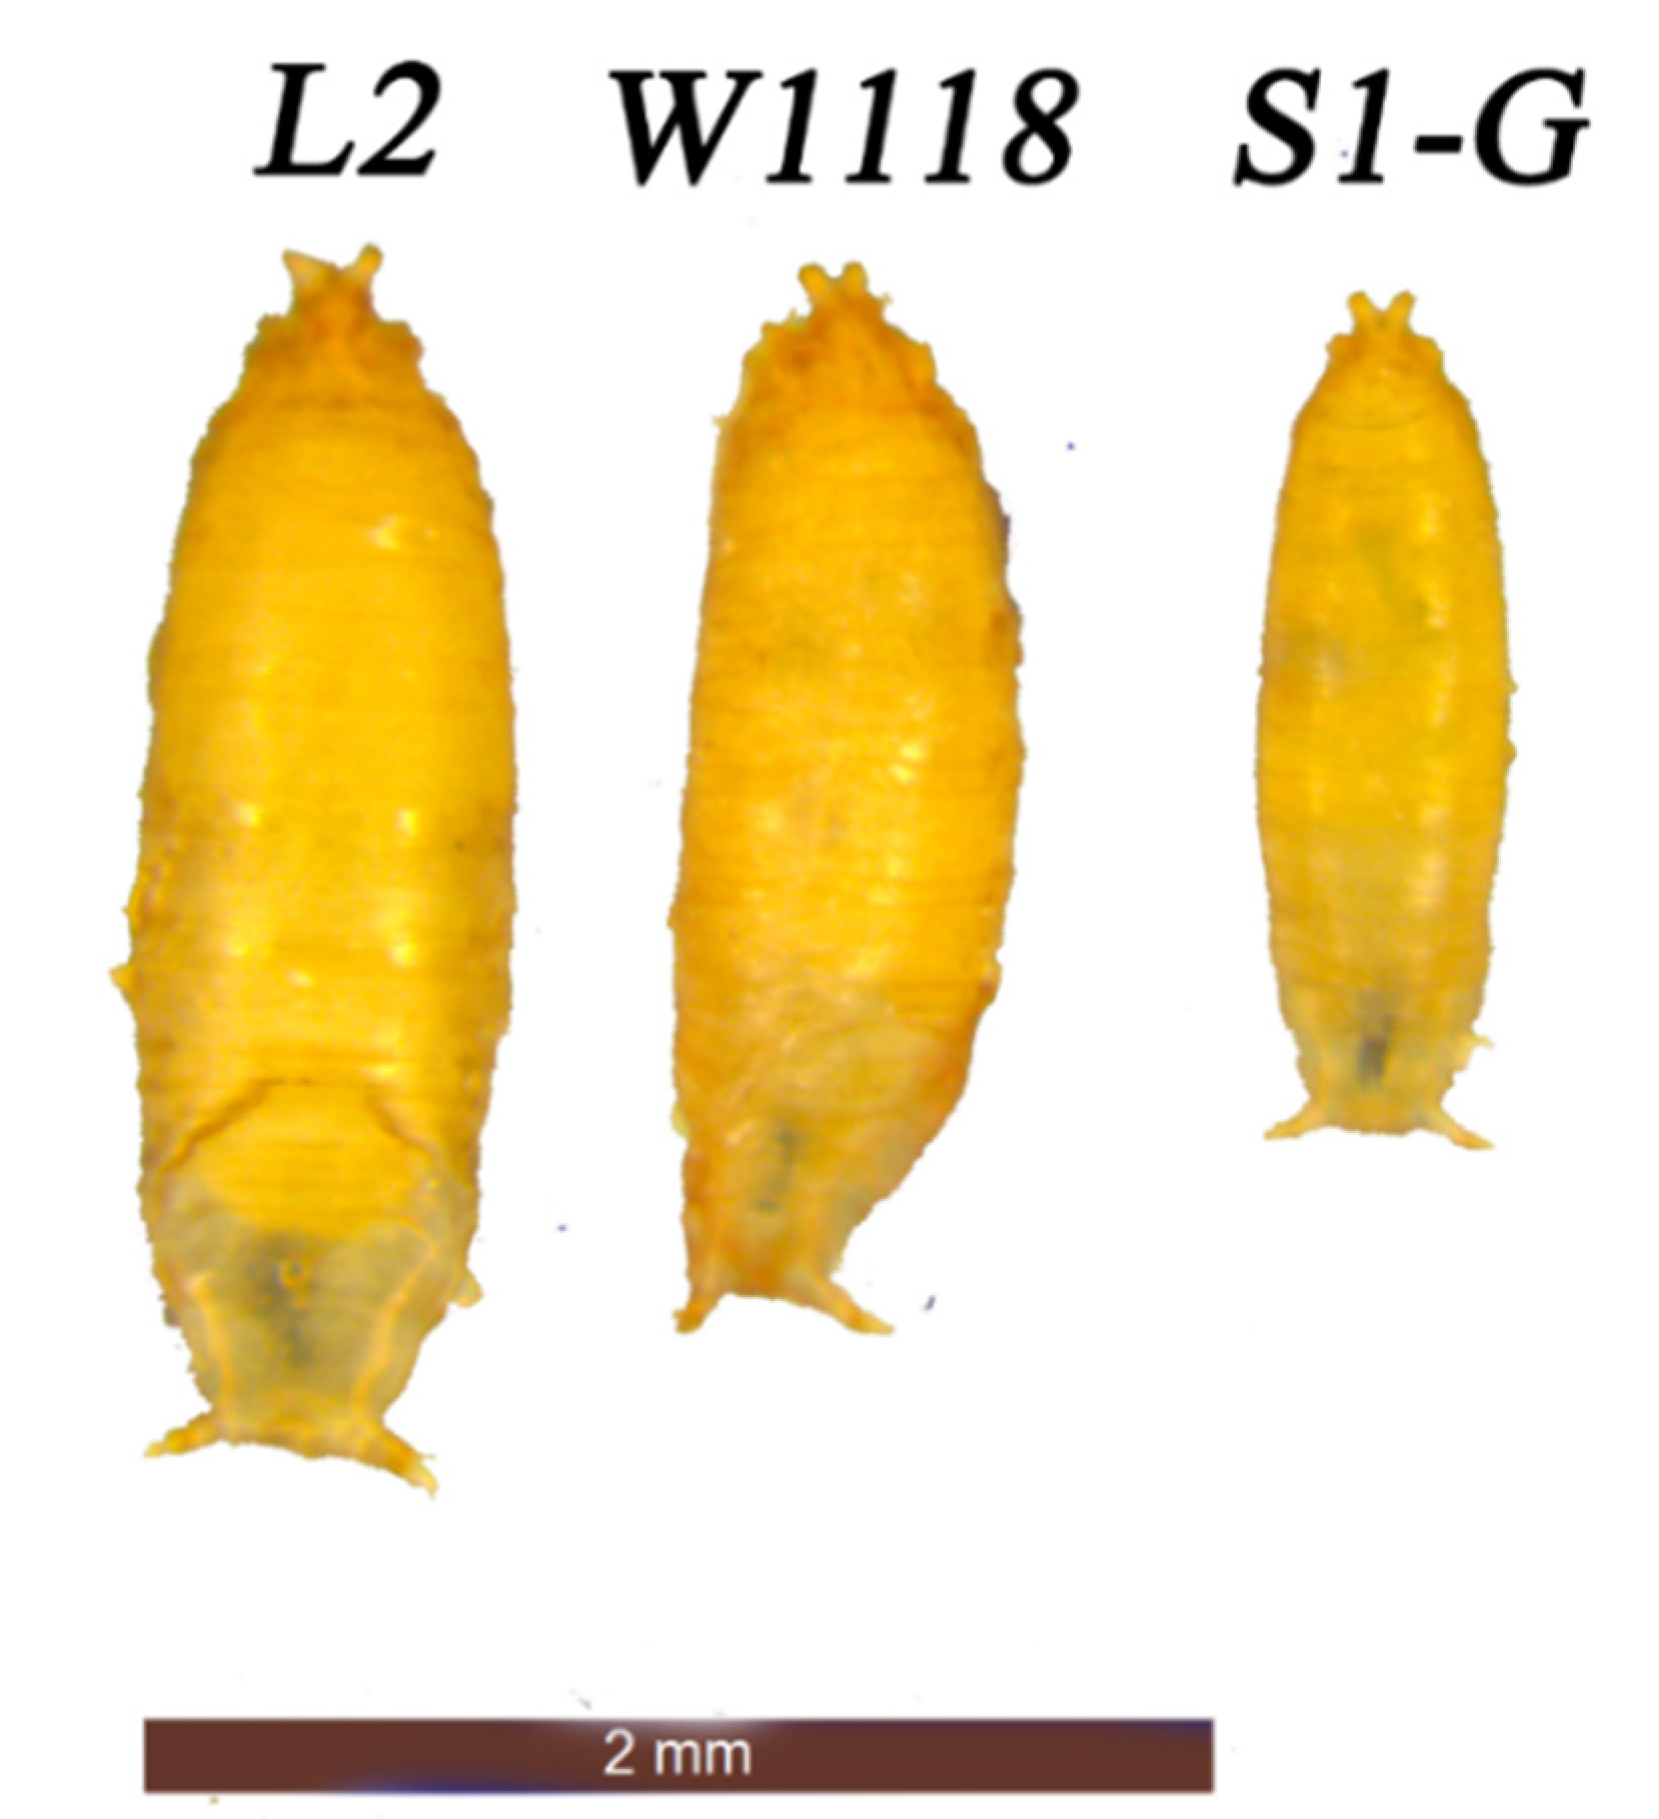
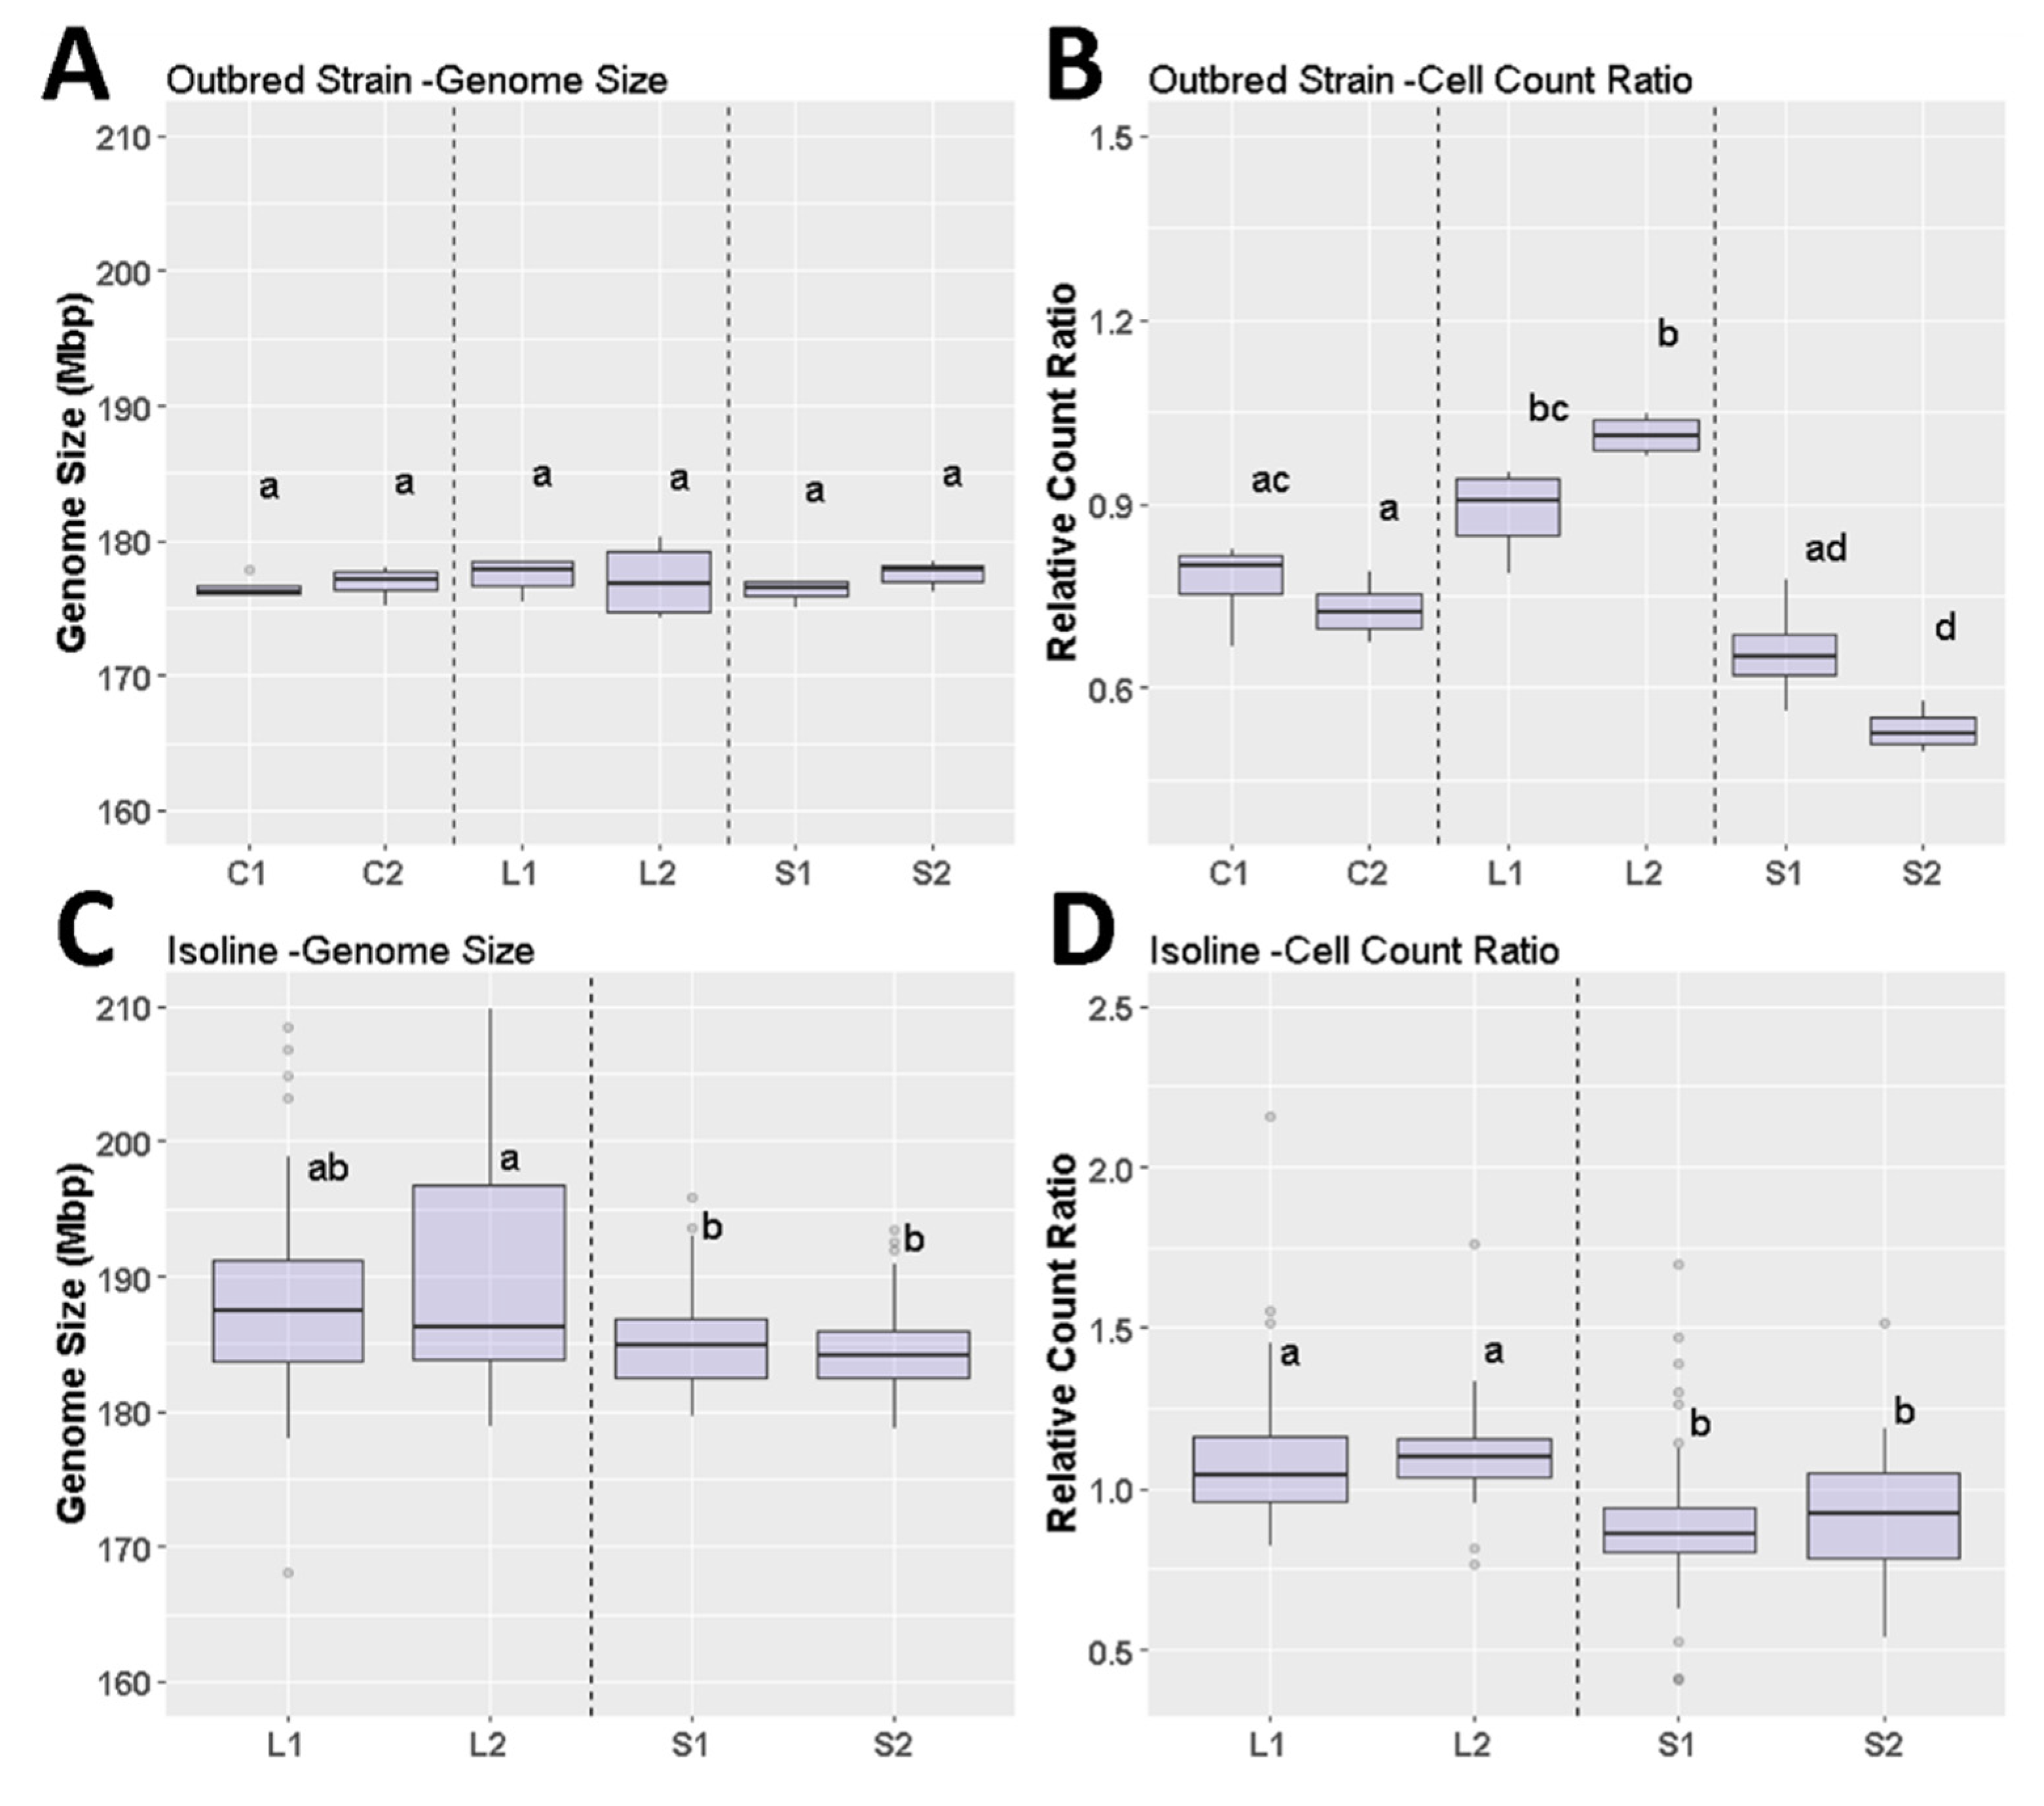
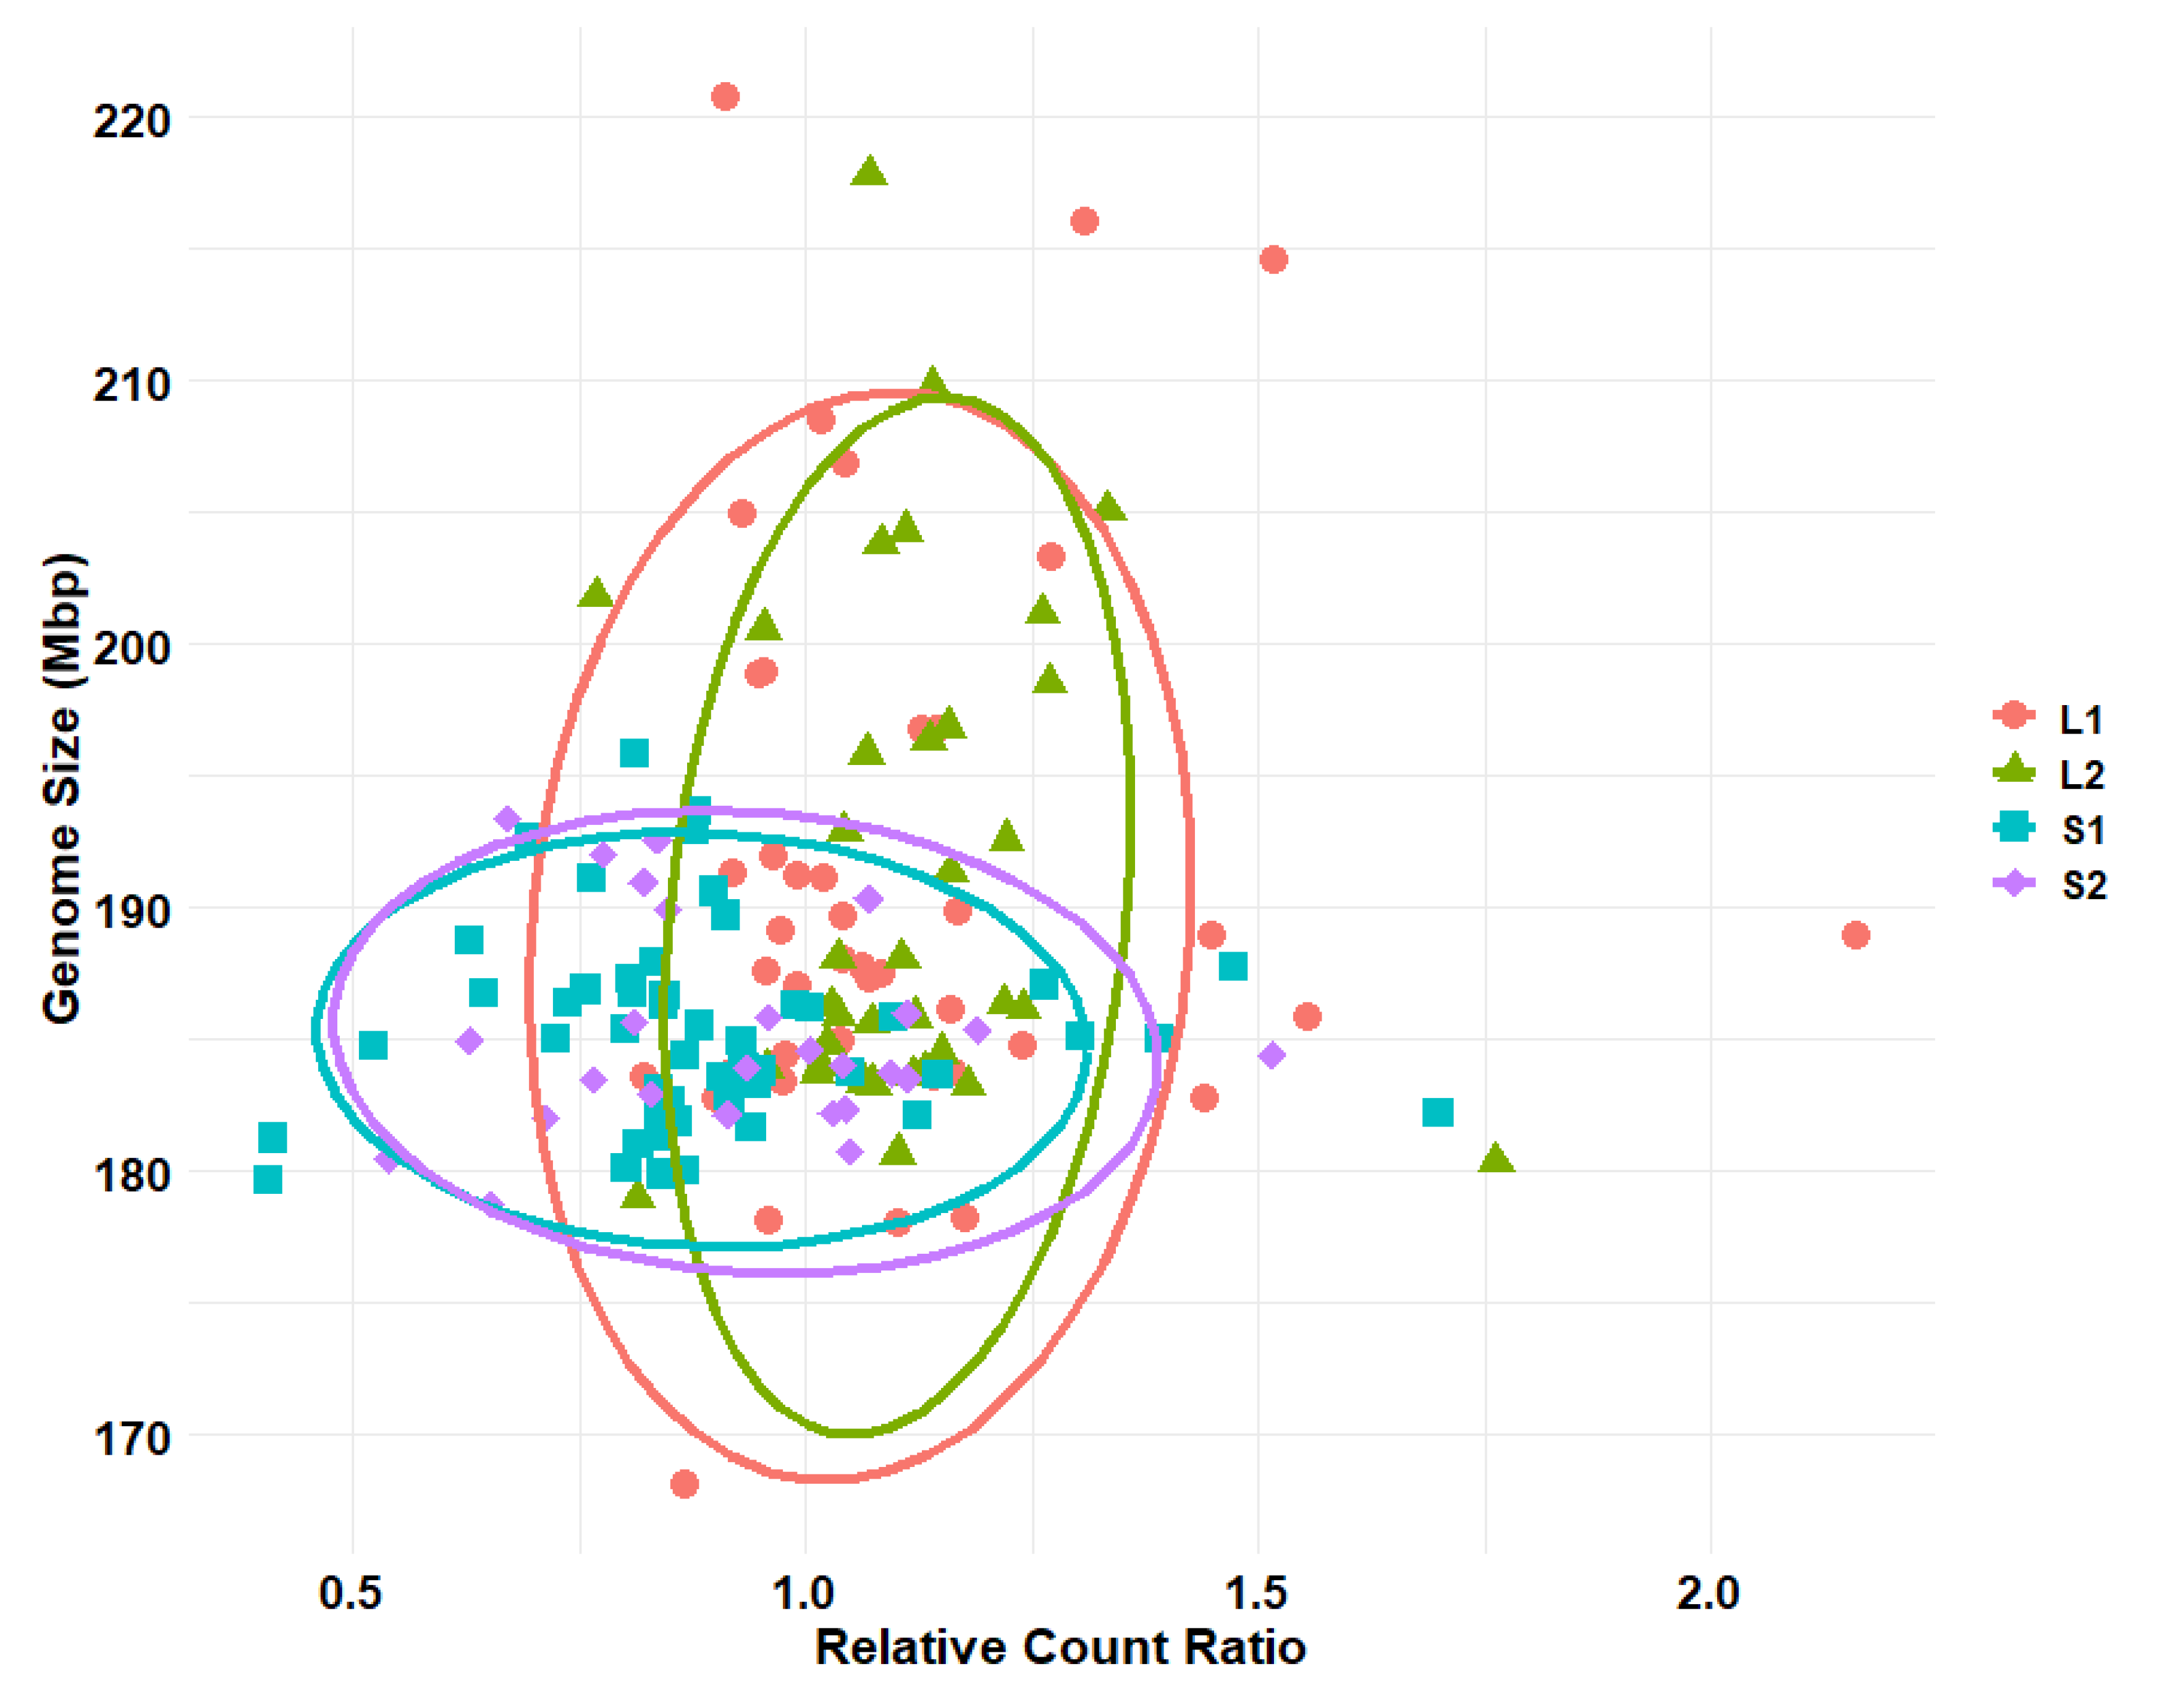
3.2. Drosophila Genome Size after Size Selection

D. melanogaster selected for more than 130 generations for body size show dramatic differences in body size when compared to a control w1118 D. melanogaster stock, demonstrating success of selection (Figure 2). See Turner, Stewart, Fields, Rice and Tarone [34] and Stewart and Rice [35] for details of responses.
Selection for body size in D. melanogaster produces large and small individuals that differ significantly from unselected control lines [35] (Figure 2). Genome size estimates for each body size selected isoline of D. melanogaster and for the outbred population of each line is given in Table S1. When comparing genome sizes for males and females of each isoline, no significant differences were found with ANOVA and Tukey HSD. For lines maintained at larger population sizes, there was no statistical difference in genome size between Drosophila selected 220 generations for large or small body size according to an ANOVA (Figure 3). When comparing mean genome size among large and small body isolines, large body size selected D. melanogaster were found to have, on average, significantly larger genomes than those selected for small body size (ANOVA, p < 0.01, Table S1, Figure 3 and Figure 4).
No significant differences were found in genome size among outbred populations of body size selected D. melanogaster lines (ANOVA, p = 0.897), yet there were significant differences in cell-count ratios (ANOVA, p < 0.0001). There were significant differences in genome size between isolines of large and small body size selected D. melanogaster (p < 0.01). There were, however, no significant differences between sexes of each isoline, so sex was not included in further analyses. In general, isolines experienced a bloating of genome size compared to outbred parental strains (~188 Mbp for females in the isolines compared to ~177 Mbp for females from the outbred lines). There were also highly significant differences in cell-count ratios between isolines selected for large and small body size (p < 0.0001). When the population is selected for large body size, there is an increase in the cell number (scored as cell-count ratio), whereas selection for a smaller body size decreases the cell-count. The distribution of genome sizes versus relative cell-count differences is shown in Figure 4, showing that a subset of large selected D. melanogaster also exhibited elevated genome sizes, while most exhibited increased cell-counts. A two-dimensional Kolmogorov-Smirnov test of these distributions found significant differences between large and small isolines when distributed by genome size and cell-count ratio (p > 0.001, Figure 4).

4. Discussion

Genome size has been found to be positively correlated to development time in some organisms, with increased development time with increased genome size [21,22,23]. However, to date, this relationship has not been explicitly demonstrated in higher Diptera. If there is a strong relationship between genome size and development time in Diptera, it would be expected that genome size would increase in flies selected for slower development and decrease in flies selected for faster development. After 32 generations of selection for fast and slow development in the blow fly C. macellaria, we find significant differences in development time as a phenotype. We find no change in mean genome size in any of the three populations selected for development time. It is hypothesized that species with slower development times have higher tolerances for increases in noncoding DNA [42]. Given this hypothesis, the selected slower development time may reduce the constraint on genome size, which may allow an increased genome size through time, but the resolution and the time of this study may not be high enough or long enough to detect this potential change.
While mean genome size was not found to be significantly impacted by selection for development time, the amount of variation in genome size decreased after selection regimes in each population of C. macellaria. A reduction in variation of a trait in a closed selection experiment of this size is not surprising—and is in fact expected [43]. The reduced effective population size at each selection event, each generation, acts as a bottleneck which reduces the genetic diversity and variation in each subsequent generation. This is demonstrated here with decreasing variance and error seen for genome size (Table 1). However, this pattern of losing variance was not seen when investigating the variance components for the development time phenotype of these same populations (Table 1). What is unknown, is how the amount of genetic variation in these populations has been maintained or decreased throughout time. In order to address this, individuals from each treatment and a generation of interest must be sequenced and compared, something which is currently out of the scope of this study.
Interestingly, with decreasing variation in genome size, the genome size of all selection treatments and populations converged on the same mean, approximately 530 Mbp (Figure 1, Figures S2 and S4). If the change in genome size was due to drift from low effective population sizes and bottleneck events, a reduction in genome size variation in each population would be expected and it would be expected that each population and treatment would result in random genome sizes from the original distribution of genome sizes. However, even though each of the three founding locations (College Station, Longview, and San Marcos) were subjected to three different selection treatments (Slow, Fast, and Control), and initially exhibited differences in genome sizes; all nine populations converged on the same genome size. This convergence on one genome size suggests that lab maintenance or inbreeding may be indirectly imposing stabilizing selection on genome size, resulting in a convergence on a non-extreme genome size, rather than random genome sizes as expected by processes such as genetic drift. The impact of lab maintenance or inbreeding may therefore obscure our ability to detect an effect of genome size change in this selection process.
Genome size is known to have effects at the cellular level, which affect cell size and volume. However, there is limited evidence that this change in cell size and volume scales to higher phenotypic levels. Increases in cell size have been found to be a factor in increased body size in some populations of Drosophila subobscura; however, differences in size are attributed to cell-count in other populations [18]. Here, selection for body size in D. melanogaster has resulted in significantly different body sizes and other phenotypic differences between these populations [34,35]. However, no significant differences in genome size were found between the replicated populations selected for large and small body sizes (Figure 3). However, there was a significant difference in relative cell-count ratio between these populations, with higher cell-counts in the large body size selected flies. Therefore, cell-count, and not genome size, is a significant contributor to body size change in this experiment with D. melanogaster. The relationship between body size and cell-count is common among many other organisms [44], and this suggests that changes in body size, while being heritable, is more easily dictated through variation in cell-counts than by large structural changes in the genome.
Genome size and cell-count ratios were also compared in isolines developed from the large and small body size selected D. melanogaster. As expected, and supportive of the above results, significant differences in cell-counts were found between large and small body isolines. In contrast, significant differences were found in genome sizes between these isolines, which all exhibited larger genome sizes than their parent strains (Figure 3). Genome sizes in the large body size isolines were not only larger on average than small body size populations, but they also exhibited a wider variation (Figure 3 and Figure 4). Therefore, large bodied individuals may actually have an increased genome size, yet others may only increase through increased cell-counts. The above suggests an idiosyncratic pattern for body size change. Body size change may, in fact, be a complicated interaction of cell-count and cell size, as suggested by Drosophila populations in Calboli, Gilchrist, Partridge and Fry [18].
It is likely that we see this pattern of increased variation in isolines and not the larger populations due to a reduction in selection efficacy attributed to lower effective population size and increased instances of genetic drift [33,45,46]. Increased selection efficacy in larger populations suggests that large changes in genomic structure can be detrimental and may provide a poor route to rapidly evolving a larger body size. Changes in genome size can dramatically influence the overall structure and architecture of the genome through insertion of new elements [47,48,49,50,51], introduction of heterochromatic regions [52], or even introduction of entire chromosomes [53,54]. Even small genome size changes can have significant effects on hybrid incompatibility. For example, insertion of inactive elements, such as pseudogenes, may be a factor leading to hybrid incompatibility between species [55]. These changes permitted by drift may result in genome instability within lines, as well as other impacts on the fitness of an organism. This thought is supported by the results of the Drosophila Genome Research Panel (DGRP), in which lines with larger genome sizes sometimes had larger variation in genome size than those with smaller genomes, suggesting higher instances of genome instability [4]. Additional work with these DGRP lines found significant relationships with genome size and fitness components when reared at different temperatures [5]. The lower variation in genome sizes we see here in small versus large body size selected isolines suggests that a small body size may constrain genome size. Small body size has been shown to reduce fitness by reducing fecundity [56,57,58]. Therefore, further constraint on fitness associated with genome size may not be tolerated. This constraint may be lifted in the case of large bodied populations, resulting in a potential, but not a guarantee, for change in genome size. This pattern of change in genome size where effective population size is low has been suggested previously [33]. Therefore, future studies should address this question of genome size change when selecting for body size in terms of controlled low and high effective population sizes.
While this work does not show a remarkable change in genome size as the result of selection, it does provide some limited insight to the effects of selection experiments and effective population sizes on genome size change. Effective population size may play an important role in the ability of genome size to change in these experiments. Higher instances of genetic drift from low effective population sizes in the D. melanogaster isolines may explain the only directional change in genome size we find. In this case, there was some evidence for weak directional selection, in which large-bodied flies increased in genome size, suggesting relaxation of the constraint on genome size change seen in the small-bodied flies. It is important to note, however, that size of an organism is more complicated than just investigating factors that may influence cell size or cell-count [59]. While there are known relationships between body size and development time, this relationship has been controlled in the Drosophila study. Small and large body size flies were cultured on the same day and generations were allowed to synchronize, controlling for this known contributor to body size. In the case of selection for development time, a reduction in genome size variation by generation was seen, with convergence on a mean genome size across treatments, suggesting stabilizing selection on genome size that is unconnected to development time. While a reduction in variation in a selection experiment is expected, lower variation by generation in development time was not documented in the City*Selection interaction. It is possible the scale of this study does not have enough resolution to show the changes happening at the genomic level. Genome size estimation, while accurate, is at the mega base pair level, only accounting for relatively large changes in size. It is possible, that change is occurring at a much slower and gradual rate, as observed between Drosophila species [60,61,62,63]. Large changes in size are more likely to occur with activation of transposable elements and other mechanisms, which are less predictable [49,64,65,66,67].

Supplementary Materials

The following are available online at https://0-www-mdpi-com.brum.beds.ac.uk/2073-4425/11/2/218/s1, Figure S1: Effect of selection for development time in different populations of the blow fly Cochliomyia macellaria, Figure S2: Genome size change after selection for development time, Figure S3: Genome size variation decreases with increasing number of generations of selection in C. macellaria.

Author Contributions

Conceptualization, C.E.H., J.S.J., and A.M.T.; methodology, C.E.H., J.S.J., A.M.T., A.D.S., and L.L.E.; validation, C.E.H., A.S.M. and S.P.S.; formal analysis, C.E.H., J.S.J., A.S.M., S.P.S., J.J.P.; investigation, C.E.H., J.S.J., S.P.S., A.S.M., L.L.E., J.J.P., and A.D.S.; resources, A.D.S., A.M.T., and J.S.J.; data curation, C.E.H., J.S.J., J.J.P., A.M.T., A.D.S.; writing—original draft preparation, C.E.H.; writing—review and editing, C.E.H., J.S.J., A.M.T., A.S.M., L.L.E., J.J.P., and S.P.S.; visualization, C.E.H., A.S.M.; supervision, A.M.T., J.S.J.; project administration, C.E.H., J.S.J., and A.M.T.; Funding acquisition, A.M.T. All authors have read and agreed to the published version of the manuscript.

Funding

National Institute of Justice Grant #’s 2012-DN-BX-K024 and 2015-DN-BX-K020 supported the development and analysis of the blow fly component of the research and the purchase of a flow cytometer.

Acknowledgments

We would like to thank Amely Bauer and Terrence P. Sylvester for their comments on the manuscript during preparation.

Conflicts of Interest

The authors declare no conflict of interest.

References

  1. Oliver, M.J.; Petrov, D.; Ackerly, D.; Falkowski, P.; Schofield, O.M. The mode and tempo of genome size evolution in eukaryotes. Genome Res. 2007, 17, 594–601. [Google Scholar] [CrossRef] [Green Version]
  2. Gregory, T.R. The Evolution of the Genome; Elsevier: Amsterdam, The Netherlands, 2005. [Google Scholar] [CrossRef]
  3. Palazzo, A.F.; Gregory, T.R. The case for junk DNA. PLoS Genet 2014, 10, e1004351. [Google Scholar] [CrossRef] [Green Version]
  4. Huang, W.; Massouras, A.; Inoue, Y.; Peiffer, J.; Ramia, M.; Tarone, A.M.; Turlapati, L.; Zichner, T.; Zhu, D.; Lyman, R.F.; et al. Natural variation in genome architecture among 205 Drosophila melanogaster Genetic Reference Panel lines. Genome Res. 2014, 24, 1193–1208. [Google Scholar] [CrossRef] [Green Version]
  5. Ellis, L.L.; Huang, W.; Quinn, A.M.; Ahuja, A.; Alfrejd, B.; Gomez, F.E.; Hjelmen, C.E.; Moore, K.L.; Mackay, T.F.C.; Johnston, J.S.; et al. Intrapopulation genome size in D. melanogaster reflects life history variation and plasticity. PLoS Genet. 2014, 10, e1004522. [Google Scholar] [CrossRef] [Green Version]
  6. Long, Q.; Rabanal, F.A.; Meng, D.; Huber, C.D.; Farlow, A.; Platzer, A.; Zhang, Q.; Vilhjálmsson, B.J.; Korte, A.; Nizhynska, V. Massive genomic variation and strong selection in Arabidopsis thaliana lines from Sweden. Nat. Genet. 2013, 45, 884. [Google Scholar] [CrossRef] [PubMed] [Green Version]
  7. Arnqvist, G.; Sayadi, A.; Immonen, E.; Hotzy, C.; Rankin, D.; Tuda, M.; Hjelmen, C.E.; Johnston, J.S. Genome size correlates with reproductive fitness in seed beetles. Proc. R. Soc. B 2015, 282, 20151421. [Google Scholar] [CrossRef] [PubMed] [Green Version]
  8. Schielzeth, H.; Streitner, C.; Lampe, U.; Franzke, A.; Reinhold, K. Genome size variation affects song attractiveness in grasshoppers: Evidence for sexual selection against large genomes. Evolution 2014, 68, 3629–3635. [Google Scholar] [CrossRef] [PubMed]
  9. Wright, S.I. Evolution of Genome Size. In eLS; John Wiley & Sons: Hoboken, NJ, USA, 2017. [Google Scholar] [CrossRef]
  10. Gregory, T.R. Coincidence, coevolution, or causation? DNA content, cell size, and the C-value enigma. Biol. Rev. 2001, 76, 65–101. [Google Scholar] [CrossRef]
  11. Cavalier-Smith, T. Skeletal DNA and the evolution of genome size. Annu. Rev. Biophys. Bioeng. 1982, 11, 273–302. [Google Scholar] [CrossRef] [PubMed]
  12. Cavalier-Smith, T. Economy, Speed and Size Matter: Evolutionary Forces Driving Nuclear Genome Miniaturization and Expansion. Ann. Bot. 2005, 95, 147–175. [Google Scholar] [CrossRef] [Green Version]
  13. Andrews, C.B.; Mackenzie, S.A.; Gregory, T.R. Genome size and wing parameters in passerine birds. Proc. R. Soc. B Biol. Sci. 2009, 276, 55–61. [Google Scholar] [CrossRef] [PubMed] [Green Version]
  14. Beaulieu, J.M.; Leitch, I.J.; Patel, S.; Pendharkar, A.; Knight, C.A. Genome size is a strong predictor of cell size and stomatal density in angiosperms. New Phytol. 2008, 179, 975–986. [Google Scholar] [CrossRef] [PubMed] [Green Version]
  15. Gregory, T.R. The Bigger the C-Value, the Larger the Cell: Genome Size and Red Blood Cell Size in Vertebrates. Blood Cells Mol. Dis. 2001, 27, 830–843. [Google Scholar] [CrossRef] [PubMed] [Green Version]
  16. Gregory, T.R. A bird’s-eye view of the c-value enigma: Genome size, cell size, and metabolic rate in teh class Aves. Evolution 2002, 56, 121–130. [Google Scholar] [CrossRef]
  17. Knight, C.A.; Beaulieu, J.M. Genome Size Scaling through Phenotype Space. Ann. Bot. 2008, 101, 759–766. [Google Scholar] [CrossRef] [Green Version]
  18. Calboli, F.C.; Gilchrist, G.W.; Partridge, L.; Fry, J. Different cell size and cell number contribution in two newly established and one ancient body size cline of Drosophila subobscura. Evolution 2003, 57, 566–573. [Google Scholar] [CrossRef]
  19. Gregory, T.R.; Hebert, P.D.; Kolasa, J. Evolutionary implications of the relationship between genome size and body size in flatworms and copepods. Heredity 2000, 84, 201. [Google Scholar] [CrossRef]
  20. Jeffery, N.W.; Yampolsky, L.; Gregory, T.R. Nuclear DNA content correlates with depth, body size, and diversification rate in amphipod crustaceans from ancient Lake Baikal, Russia. Genome 2016, 60, 303–309. [Google Scholar] [CrossRef] [Green Version]
  21. Van’t Hof, J.; Sparrow, A.H. A relationship between DNA content, nuclear volume, and minimum mitotic cycle time. Proc. Natl. Acad. Sci. USA 1963, 49, 897. [Google Scholar] [CrossRef] [Green Version]
  22. Bennett, M.D. The Duration of Meiosis. Proc. R. Soc. Lond. B 1971, 178, 277–299. [Google Scholar] [CrossRef]
  23. Bennett, M.D. Nuclear DNA content and minimum generation time in herbaceous plants. Proc. R. Soc. Lond. B Biol. Sci. 1972, 181, 109–135. [Google Scholar] [CrossRef] [PubMed]
  24. Grosset, L.; Odartchenko, N. Duration of mitosis and separate mitotic phases compared to nuclear DNA content in erythroblasts of four vertebrates. Cell Prolif. 1975, 8, 91–96. [Google Scholar] [CrossRef] [PubMed]
  25. Ryan Gregory, T. Genome size and developmental complexity. Genetica 2002, 115, 131–146. [Google Scholar] [CrossRef]
  26. Hoang, P.T.N.; Schubert, V.; Meister, A.; Fuchs, J.; Schubert, I. Variation in genome size, cell and nucleus volume, chromosome number and rDNA loci among duckweeds. Sci. Rep. 2019, 9, 3234. [Google Scholar] [CrossRef]
  27. Wyngaard, G.A.; Rasch, E.M.; Manning, N.M.; Gasser, K.; Domangue, R. The relationship between genome size, development rate, and body size in copepods. Hydrobiologia 2005, 532, 123–137. [Google Scholar] [CrossRef]
  28. McLaren, I.; Sevigny, J.-M.; Corkett, C. Body sizes, development rates, and genome sizes among Calanus species. In Biology of Copepods; Springer: Berlin, Germany, 1988; pp. 275–284. [Google Scholar] [CrossRef]
  29. Finston, T.L.; Hebert, P.D.N.; Foottit, R.B. Genome size variation in aphids. Insect Biochem. Mol. Biol. 1995, 25, 189–196. [Google Scholar] [CrossRef]
  30. Powell, J.R. Progress and Prospects in Evolutionary Biology: The Drosophila Model (Oxford Series in Ecology & Evolution); Oxford University Press: Oxford, UK, 1997. [Google Scholar]
  31. Gregory, T.R. Genome size evolution in animals. In The Evolution of the Genome; Gregory, T.R., Ed.; Elsevier: San Diego, CA, USA, 2005; pp. 3–87. [Google Scholar] [CrossRef]
  32. Gregory, T.R.; Johnston, J.S. Genome size diversity in the family Drosophilidae. Heredity 2008, 101, 228–238. [Google Scholar] [CrossRef] [Green Version]
  33. Lynch, M.; Conery, J.S. The origins of genome complexity. Science 2003, 302, 1401–1404. [Google Scholar] [CrossRef] [Green Version]
  34. Turner, T.L.; Stewart, A.D.; Fields, A.T.; Rice, W.R.; Tarone, A.M. Population-based resequencing of experimentally evolved populations reveals the genetic basis of body size variation in Drosophila melanogaster. PLoS Genet. 2011, 7, e1001336. [Google Scholar] [CrossRef] [Green Version]
  35. Stewart, A.D.; Rice, W.R. Arrest of sex-specific adaptation during the evolution of sexual dimorphism in Drosophila. Nat. Ecol. Evol. 2018, 2, 1507–1513. [Google Scholar] [CrossRef]
  36. Pischedda, A.; Friberg, U.; Stewart, A.D.; Miller, P.M.; Rice, W.R. Sexual selection has minimal impact on effective population sizes in species with high rates of random offspring mortality: An empirical demonstration using fitness distributions. Evolution 2015, 69, 2638–2647. [Google Scholar] [CrossRef] [Green Version]
  37. Johnston, J.S.; Bernardini, A.; Hjelmen, C.E. Genome Size Estimation and Quantitative Cytogenetics in Insects. In Insect Genomics; Springer: Berlin, Germany, 2019; pp. 15–26. [Google Scholar] [CrossRef]
  38. Picard, C.; Johnston, J.; Tarone, A. Genome sizes of forensically relevant Diptera. J. Med Entomol. 2012, 49, 192–197. [Google Scholar] [CrossRef]
  39. Team, R.C. R: A Language and Environment for Statistical Computing; R Foundation for Statistical Computing: Vienna, Austria, 2015; Available online: https://www.R-project.org (accessed on 1 September 2017).
  40. Schuetzenmeister, A.; Dufey, F. VCA-Package: Variance Component Analysis. R Package Version 1.4.2. 2019. Available online: https://CRAN.R-project.org/package=VCA (accessed on 10 January 2020).
  41. Xiao, Y. Peacock.test: Two and Three Dimensional Kolmogorov-Smirnov Two-Sample Tests. R Package Version. 1.0. 2016. Available online: https://CRAN.R-project.org/package=Peacock.test (accessed on 6 February 2020).
  42. Charlesworth, B.; Sniegowski, P.; Stephan, L. The evolutionary dynamics of repetitive DNA in eukaryotes. Nature 1994, 371, 215–220. [Google Scholar] [CrossRef]
  43. Athrey, N.; Leberg, P.L.; Klerks, P.L. Laboratory culturing and selection for increased resistance to cadmium reduce genetic variation in the least killifish, Heterandria formosa. Environ. Toxicol. Chem. 2009, 26, 1916–1921. [Google Scholar] [CrossRef]
  44. Cheng, G.W.; Breen, P.J. Cell-count and size in relation to fruit size among strawberry cultivars. J. Am. Soc. Hortic. Sci. 1992, 117, 946–950. [Google Scholar] [CrossRef] [Green Version]
  45. Charlesworth, B.; Barton, N. Genome size: Does bigger mean worse? Curr. Biol. 2004, 14, R233–R235. [Google Scholar] [CrossRef] [Green Version]
  46. Gregory, T.R.; Witt, J.D.S. Population size and genome size in fishes: A closer look. Genome 2008, 51, 309–313. [Google Scholar] [CrossRef]
  47. Black, W.C.T.; Rai, K.S. Genome evolution in mosquitoes: Intraspecific and interspecific variation in repetitive DNA amounts and organization. Genet. Res. 1988, 51, 185–196. [Google Scholar] [CrossRef]
  48. Bennetzen, J.L.; Kellogg, E.A. Do plants have a one-way ticket to genomic obesity? Plant Cell 1997, 9, 1509. [Google Scholar] [CrossRef]
  49. Ågren, J.A.; Wright, S.I. Co-evolution between transposable elements and their hosts: A major factor in genome size evolution? Chromosome Res. 2011, 19, 777–786. [Google Scholar] [CrossRef]
  50. Śliwińska, E.B.; Martyka, R.; Tryjanowski, P. Evolutionary interaction between W/Y chromosome and transposable elements. Genetica 2016, 144, 267–278. [Google Scholar] [CrossRef] [Green Version]
  51. Lower, S.S.; Spencer Johnston, J.; Stanger-Hall, K.; Hjelmen, C.E.; Hanrahan, S.J.; Korunes, K.; Hall, D. Genome size in North American fireflies: Substantial variation likely driven by neutral processes. Genome Biol. Evol. 2017, 9, 1499–1512. [Google Scholar] [CrossRef]
  52. Bosco, G.; Campbell, P.; Leiva-Neto, J.T.; Markow, T.A. Analysis of Drosophila species genome size and satellite DNA content reveals significant differences among strains as well as between species. Genetics 2007, 177, 1277–1290. [Google Scholar] [CrossRef] [Green Version]
  53. Trivers, R.; Burt, A.; Palestis, B.G. B chromosomes and genome size in flowering plants. Genome 2004, 47, 1–8. [Google Scholar] [CrossRef]
  54. Otto, S.P. The Evolutionary Consequences of Polyploidy. Cell 2007, 131, 452–462. [Google Scholar] [CrossRef] [Green Version]
  55. Lynch, M.; Force, A.G. The Origin of Interspecific Genomic Incompatibility via Gene Duplication. Am. Nat. 2000, 156, 590–605. [Google Scholar] [CrossRef]
  56. Tantawy, A.; Vetukhiv, M. Effects of size on fecundity, longevity and viability in populations of Drosophila pseudoobscura. Am. Nat. 1960, 94, 395–403. [Google Scholar] [CrossRef]
  57. Lefranc, A.; Bundgaard, J. The influence of male and female body size on copulation duration and fecundity in Drosophila melanogaster. Hereditas 2000, 132, 243–247. [Google Scholar] [CrossRef]
  58. Long, T.A.; Pischedda, A.; Stewart, A.D.; Rice, W.R. A cost of sexual attractiveness to high-fitness females. PLoS Biol. 2009, 7, e1000254. [Google Scholar] [CrossRef] [Green Version]
  59. Nijhout, H.F. The control of body size in insects. Dev. Biol. 2003, 261, 1–9. [Google Scholar] [CrossRef] [Green Version]
  60. Petrov, D.A. DNA loss and evolution of genome size in Drosophila. Genetica 2002, 115, 81–91. [Google Scholar] [CrossRef]
  61. Petrov, D.A. Evolution of genome size: New approaches to an old problem. Trends Genet. 2001, 17, 23–28. [Google Scholar] [CrossRef]
  62. Petrov, D.A.; Hartl, D.L. High rate of DNA loss in the Drosophila melanogaster and Drosophila virilis species groups. Mol. Biol. Evol. 1998, 15, 293–302. [Google Scholar] [CrossRef] [Green Version]
  63. Petrov, D.A.; Sangster, T.A.; Johnston, J.S.; Hartl, D.L.; Shaw, K.L. Evidence for DNA loss as a determinant of genome size. Science 2000, 287, 1060–1062. [Google Scholar] [CrossRef] [Green Version]
  64. Kapusta, A.; Suh, A.; Feschotte, C. Dynamics of genome size evolution in birds and mammals. Proc. Natl. Acad. Sci. USA 2017, 114, E1460–E1469. [Google Scholar] [CrossRef] [Green Version]
  65. Kidwell, M.G. Transposable elements and the evolution of genome size in eukaryotes. Genetica 2002, 115, 49–63. [Google Scholar] [CrossRef]
  66. Sessegolo, C.; Burlet, N.; Haudry, A. Strong phylogenetic inertia on genome size and transposable element content among 26 species of flies. Biol. Lett. 2016, 12, 20160407. [Google Scholar] [CrossRef] [Green Version]
  67. Vieira, C.; Biemont, C. Transposable element dynamics in two sibling species: Drosophila melanogaster and Drosophila simulans. Genetica 2004, 120, 115–123. [Google Scholar] [CrossRef]
Figure 1. Range of development time and genome size for generations 1, 10, and 32 for different populations of the blow fly Cochliomyia macellaria. Hours of development time are plotted on the X-axis and genome size (Mbp) is plotted on the Y-axis. Points represent mean of the phenotype and lines represent the range of each trait. Colors represent development and shapes represent origin city. No change in development time by generation was seen in control lines, increases in development time was seen in slow selected lines, and decrease in development time was seen in fast selected lines. Variation in genome size reduced with generation and converged on a mean size of approximately 530 Mbp. Variation in development time increased from generation one and was maintained.
Genes 11 00218 g001
Figure 2. Pupal cases for D. melanogaster selected for large and small body size. All strains from this picture were maintained together, fed from the same batch of medium and the vials established for this image were started on the same day.
Genes 11 00218 g002
Figure 3. Boxplot comparisons of genome size and cell-counts between D. melanogaster differentially selected for body size. Genome size and cell-counts plotted by strain for outbred strains and isolines. Different letters above each box represent values significantly different according to Tukey HSD at the p < 0.05 level. (A) Genome size variation for outbred populations in control lines (C1, C2), large selected lines (L1, L2), and small selected lines (S1, S2). (B) Variation in cell-count ratio for outbred populations in control lines (C1, C2), large selected lines (L1, L2), and small selected lines (S1, S2). (C) Genome size variation for isolines developed from outbred populations for large-body size selected lines (L1, L2) and small-body size selected lines (S1, S2). (D) Variation in cell-count ratio for isolines developed from outbred populations for large-body size selected lines (L1, L2) and small-body size selected lines (S1, S2).
Genes 11 00218 g003
Figure 4. Distribution of genome sizes and relative cell-count ratio for large and small body size selected lines of D. melanogaster. Relative cell-count ratio (X-axis) plotted against genome size in Mbp (Y-axis) for large and small body size selected isolines. Large body size selected lines are represented in red circles (L1) and green triangles (L2), small body size lines represented in blue squares (S1) and purple diamonds (S2). Ellipses represent 95% confidence ellipses determined using the stat_ellipse() function in the ggplot2 package of R. Only a subset of large body size selected D. melanogaster isolines showed an increase in genome size. A two-dimensional Kolmogorov-Smirnov test using the function peacock2() in the package ‘Peacock.test’ found the distributions of large and small body size flies to be significantly different (p < 0.001) [41].
Genes 11 00218 g004
Table 1. Variance component analysis results of genome size and development time in C. macellaria populations. As no differences were found among genome sizes, all strains were merged for the variance analysis of genome size. Variance decreases by generation for City*Selection in genome size. Contrastingly, variance in development time for City*Selection was maintained. Variance increases in selection by generation, verifying successful divergence in phenotypes.
TraitGen.CitySelectionCity*SelectionError
Genome Size100272.1467.6
1009.331.7291.9
328.65.717.483.5
Dev. Time1211.700258.7
100.4684.8114.7169.7
3206929.8152.8482.3
Table 2. Average genome size estimates (Mbp) and development time with standard deviations (St. Dev) of C. macellaria under developmental selection. ‘N’ represents number of individuals measured. Development time information for Fast and Slow lines from each location at Generation 1 are the same as Generation 1 in Control.
College Station
Genome SizeDevelopment Time
SelectionGen.NMbpSt. DevNHoursSt. Dev
Control111531.2618.331209258.2318.42
108524.2918.91038256.6213.59
3210539.727.031161269.5315.85
Fast111523.7114.261209--
103551.3514.421100241.888.26
3210529.375.44988203.2927.52
Slow19559.1124.841209--
1010525.7618.261125310.3310.79
3210544.089.38996367.7520.97
Longview
Genome SizeDevelopment Time
SelectionGen.NMbpSt. DevNHoursSt. Dev
Control110550.120.51003284.6114.61
109523.912.45986280.7317.55
329531.913.031068304.414.62
Fast15566.7720.521003--
105534.3211.61015264.8515.28
3210528.539.631044193.0832.67
Slow16538.9227.411003--
109541.2119.31974299.8613.06
3210527.9911.271151366.3313.57
San Marcos
Genome SizeDevelopment Time
SelectionGen.NMbpSt. DevNHoursSt. Dev
Control19543.1518.371176281.2614.68
103538.837.49990281.0418.13
3210529.057.021032280.3924.54
Fast110550.5823.281176--
107540.516.641026252.866.32
3210531.498.03847194.6720.86
Slow112528.4526.061176--
1010533.21201013306.0310.03
3210539.8715.29958365.9521.35

