Article

Computational and Transcriptomic Analysis Unraveled OsMATE34 as a Putative Anthocyanin Transporter in Black Rice (Oryza sativa L.) Caryopsis

State Key Laboratory of Conservation and Utilization of Subtropical Agro-Bioresources, College of Agriculture, Guangxi University, Nanning 530005, China
*
Author to whom correspondence should be addressed.
Submission received: 11 March 2021 / Revised: 11 April 2021 / Accepted: 13 April 2021 / Published: 16 April 2021
(This article belongs to the Special Issue Advances in Rice Genetics and Breeding)

Abstract

:
Anthocyanin is a flavonoid compound with potential antioxidant properties beneficial to human health and sustains plant growth and development under different environmental stresses. In black rice, anthocyanin can be found in the stems, leaves, stigmas, and caryopsis. Although the anthocyanin biosynthesis in rice has been extensively studied, limited knowledge underlying the storage mechanism and transporters is available. This study undertook the complementation of computational and transcriptome analysis to decipher a potential multidrug and toxic compound extrusion (MATE) gene candidate for anthocyanin transportation in black rice caryopsis. The phylogenetic analysis showed that OsMATE34 has the same evolutionary history and high similarities with VvAM1, VvAM3, MtMATE2, SlMATE/MTP77, RsMATE8, AtFFT, and AtTT12 involved in anthocyanin transportation. RNA sequencing analysis in black caryopsis (Bc; Bc11, Bc18, Bc25) and white caryopsis (Wc; Wc11, Wc18, Wc25), respectively, at 11 days after flowering (DAF), 18 DAF, and 25 DAF revealed a total of 36,079 expressed genes, including 33,157 known genes and 2922 new genes. The differentially expressed genes (DEGs) showed 15,573 genes commonly expressed, with 1804 and 1412 genes uniquely expressed in Bc and Wc, respectively. Pairwise comparisons showed 821 uniquely expressed genes out of 15,272 DEGs for Wc11 vs. Bc11, 201 uniquely expressed genes out of 16,240 DEGs for Wc18 vs. Bc18, and 2263 uniquely expressed genes out of 16,240 DEGs for Wc25 vs. Bc25. Along with anthocyanin biosynthesis genes (OsPAL, OsCHS, OsCHI, OsF3H, OsDFR, OsANS, and OsUFGT/Os3GT), OsMATE34 expression was significantly upregulated in all Bc but not in Wc. OsMATE34 expression was similar to OsGSTU34, a transporter of anthocyanin in rice leaves. Taken together, our results highlighted OsMATE34 (Os08g0562800) as a candidate anthocyanin transporter in rice caryopsis. This study provides a new finding and a clue to enhance the accumulation of anthocyanin in rice caryopsis.

1. Introduction

Rice (Oryza sativa L.) is the main staple food consumed by half of the world population and almost 60% of China’s population [1]. The world’s population is expected to reach 9.7 billion by 2050; food and energy demands should be a great challenge [2]. To ensure food and nutritional security, new strategies should be adopted to increase food production and nutritional values [3]. Increasing interest in health-promoting food has significantly generated a substantial market for potential nutritionally valuable rice [4]. Pigmented or colored rice has received growing interest from many research programs due to the anthocyanin properties, particularly its potent antioxidants [5,6,7] and health benefits [3,8]. Anthocyanin is a flavonoid compound that plays a fundamental role in preventing several human diseases. Some studies suggested that anthocyanins effectively treat cardiovascular diseases, diabetes [9,10], and cancer [11,12]. Having these medicinal properties, anthocyanins are often used as alternatives for food colorants and bioactive components in nutraceutical and traditional medicine [13,14].
In black rice, anthocyanin is present in various tissues and organs such as stems, leaves, leaves sheath, ligules, apiculus, stigmas, pericarp, and endosperm in some transgenic rice. More than 18 anthocyanins and derivatives have been reported in black rice. Cyanidin-3-O-glucoside (C3G) and peonidin-3-O-glycoside (P3G) with, respectively, 65–90% and 5–28% of total anthocyanin content (TAC) are the most dominant [15]. Although anthocyanin acts as a bio-protectant molecule against reactive oxygen species (ROS) formed during respiration and photosynthesis activities [16], the antioxidant capacity of colored rice originates mainly from the seed capsule. Some studies revealed that more pigments are in the rice bran irrespective of whether the rice color is red, purple, or black [17,18]. Generally, as the rice caryopsis develops, anthocyanin accumulates mainly inside the pericarp at 7 days after flowering (DAF), thereafter inside the testa and aleurone, but not in the endosperm cells [6,19]. Therefore, some pigmented rice does not have black caryopsis or black seeds.
Anthocyanin in black rice has been extensively studied, and it is reported that its biosynthesis follows a branch of the general pathway of flavonoid compounds that begins with phenylalanine as a substrate [20,21,22]. This biosynthesis pathway is elucidated and involves structural genes (OsPAL, OsCHS, OsCHI, OsF3H, OsDFR, OsANS/LDOX, OsUFGT/Os3GT, etc.) and MYB-bHLH-WD40 transcription factors [23]. However, there is still a gap in the storage mechanism to make the complete puzzle. In plants, including black rice, anthocyanin is synthesized on the cell surface of the endoplasmic reticulum (ER) and stored in the vacuole via vacuolar sequestration in high concentration, which gives the intensely colored chemical structure [24,25]. The mechanism by which anthocyanin moves from the ER to the central vacuole is not clear yet. However, two models attempt to explain these mechanisms [26]. The first model is the ligandin transportations (LT), which involves ligandins that escort anthocyanin products to the vacuole and sequestrate into anthocyanic vacuolar intrusion (AVI), mostly when the concentration of anthocyanin in the cytoplasm is too high. This model believes that anthocyanin first binds to a suitable transporter (ligandin) and then diffuses through active transport until it reaches the tonoplast. The suitable transporter is glutathione-s-transferase (GST), located in the cytoplasm and associated with the ER. It acts like a binding protein that escorts anthocyanins from ER to tonoplast [27,28]. Once the anthocyanin reaches the tonoplast, it penetrates the vacuolar membrane mainly via multidrug resistance-associated proteins (MRP), representing a class of ATP-Binding Cassette (ABC) transporters [29,30]. The second model is the vesicular transport (VT) involving pre-vacuolar compartment (PVC) vesicles which drop their cargo transported to the vacuole. In this model, it is revealed that the main transporter is the multidrug and toxic compound extrusion (MATE), also called anthoMATE (AM), which accompanies PVC to the tonoplast and discard to the vacuole lumen [31]. In the VT model, AVI in vacuoles occurs as an autophagy mechanism of intact vesicles [26]. In black rice, these mechanisms are still incomplete because of the lack of information about transporters involved. Although some recent studies highlighted the implication of GST (OsGSTU34) and ABC (OsMRP15) transporters in black rice leaves [32,33], there is no supporting evidence that these transporters are involved in anthocyanin transportation in rice caryopsis. The MATE protein is a newly characterized transporter family in plants [34]. Some studies demonstrated that the MATE transporter family plays a central role in the trafficking of anthocyanin [26,28,31]. In rice, about 55 MATE genes evenly distributed throughout the 12 chromosomes in the rice genome have been deciphered. The function of MATE is very diverse and some may be involved in anthocyanin transportation [34]. However, no study has been conducted to highlight the implication of MATE transporters in rice. In the present study, we systematically investigated the MATE transporters in rice caryopsis through the combination of computational and transcriptomic analysis. Our results revealed a putative OsMATE34 (Os08g0562800), a potential anthocyanin transporter gene in rice caryopsis. As new findings, these results provide a scientific foundation for understanding the anthocyanin storage mechanism in rice caryopsis. Besides, the information generated will be useful for further research to promote the high production of anthocyanin in rice improving its nutraceutical and pharmaceutical properties.

2. Materials and Methods

2.1. Plant Material

In this study, two Indica rice cultivars with different characteristics were used: black rice cultivar “18BLN6321” with black caryopsis (Bc) and “ZiS” with white caryopsis (Wc). Rice plants were cultivated in the experimental field at Guangxi University, Nanning City, Guangxi Province (latitude: 22°49′0.01″ N, Longitude: 108°19′0.01″ E), China. This site encompasses a warm, monsoon-influenced humid semitropical climate with an annual average temperature of 21.83 °C (71.3 °F) with an average annual precipitation of 1190 mm. Rice plants were grown in the paddy field from August to November 2020. At the flowering stage, about 100 experimental plants were selected randomly and each plant carried an identification number. Samples were collected at different developmental stages; 11 DAF, 18 DAF, and 25 DAF, which represent successively milk grain, dough grain, and mature grain (Figure 1). Entire plants from both cultivars were removed from the soil and immediately transferred in the pot with soil and water, then carried to the laboratory. Rice grains were collected from about three plants, dehulled, and immediately frozen in the liquid nitrogen and stored at −80 °C until further required. At each developmental stage, two biological replicates were prepared from each cultivar named Wc11, Wc18, and Wc25 for white caryopsis, and Bc11, Bc18, and Bc25 for black caryopsis.

2.2. Anthocyanin Measurement

The anthocyanins were quantified between black and white caryopsis at different developmental stages using the HPLC method and three types of anthocyanin glucoside standard, namely, cyanidin-3-O-glucoside chloride, peonidin-3-O-glucoside chloride, and petunidin-3-O-glucoside chloride. Briefly, 1 g of sample was pretreated by adding 50% ethanol–water (containing 1% formic acid), then mixed using a vortex mixer for 30 s and ultrasonic for 30 min. Samples were centrifuged at 13,000 r.p.m for 30 min; the supernatants were combined and filtered using a 0.45 mm nylon filter. A 30 μL aliquot of sample was subsequently injected through the membrane of the HPLC system. The compound separations were achieved on 250 mm × 4.6 mm i.d., 5 μm reversed-phase waters XBridge C18 with 1% formic acid and acetonitrile used as mobile phase. Elution with solvent A, 1% formic acid–water, and solvent B, 1% formic acid–acetonitrile. The gradient profile for the separation of anthocyanin was 92% A–8% B (0 min). The gradient profile was subsequently changed linearly to 20%A–80%B for 20 min which was maintained for 2 min, and returned to 92% A–8% B which was maintained for 8 min. The column temperature was kept at 35 ℃; the flow rate was 0.8 mL.min−1 and chromatograms were recorded at 530 nm. Anthocyanins were quantified by comparing the chromatograms to external standards and the experiment was repeated three times.

2.3. In Silico Analysis of OsMATE in Rice

2.3.1. Identification of Putative MATE Genes in Rice and other Plant and Their Sequence-Structure Analysis

A basic local alignment sequence tool for protein (BLASTP) search using the default parameters of Phytozome database (https://phy-tozome.jgi.doe.gov/pz/portal.html; accessed on 9 July 2020) and rice genome annotation project database RGAP V6.1 (http://rice.plantbiology.msu.edu/analyses_search_locus.shtml; accessed on 14 July 2020) were used to identify Arabidopsis thaliana MATE transporters AtFFT, At4g25640; AtFRD3, At3g08040; AtTT12, At4g25640, and 16 Oryza sativa MATE genes. The nomenclature O. sativa MATE (OsMATE) OsMATE7, OsMATE34, OsMATE33, OsMATE3, OsMATE39, OsMATE16, OsMATE55, etc. was used following Huang and co-authors. [34]. The sequences of other MATE proteins used were retrieved and can be found in the Gen-Bank/EMBL database with the following accession numbers: Medicago truncatula MtMATE1, ACX37118; MtMATE2, ADV04045.1; Solanum lycopersicum SlMATE/MTP77, AAQ55183; Vitis vinifera VvMATE1, XP_002282907; VvMATE2, XP_002282932; VvAM1, ACN91542; VvAM3, ACN88706; Brassica rapa BrTT12, ACJ36213; Malus domestica MdMATE1, ADO22709; MdMATE2, ADO22711; Fragaria ananassa, FaTT12: AUA60209.1; Raphanus sativus RsMATE2, AWK67851; RsMATE3, AWK67852; RsMATE7, AWK67856; RsMATE8, AWK67857;
The physicochemical properties of MATE proteins were submitted and computed to identify the molecular weight (MW), the number of amino acids (A.A), the isoelectric point (PI), the aliphatic index (AI), the instability index (I.I), and the grand average of hydropathicity index (GRAVY) using the ExPASy Compute pI/Mw tool (http://https://web.expasy.org/cgi-bin/protparam; accessed on 30 August 2021).

2.3.2. Phylogenetic Analysis and Gene Structure

ClustalW (http://clustalw.ddbj.nig.ac.jp/top-e.html; accessed on 26 July 2020) was used to align the 38 full-length MATE proteins. Subsequently, the rooted and unrooted phylogenetic trees were constructed using MEGA X_10.1.8 with the maximum likelihood (ML) algorithm and 1000 bootstraps to infer the evolutionary history based on the Jones–Taylor–Thornton (JTT) matrix-based model. By applying Neighbor-Join and BioNJalgorithms to a matrix of pairwise distances using a JTT model, we automatically obtained the initial tree(s) for heuristic search. The result was viewed and then edited using evolview [35]. The percentage of trees in which the associated taxa clustered together is shown next to the branches. The sequence homology, similarity, and identity were analyzed through a multiple sequence alignment using Clustal Omega multiple sequence analysis (https://www.ebi.ac.uk/Tools/msa/clustalo/; accessed on 21 August 2020). The structure of gene transcripts with the exons and introns was retrieved through different plant’s online databases and mapped. The conserved protein motifs of MATEs were analyzed using the multiple expectation maximization for motif elicitation (MEME) online program (http://meme-suite.org/; accessed on 14 August 2020) [36] with default settings and a maximum of 12 motifs. Three-dimensional protein structure for various MATE protein (OsMATE34, OsMATE7, VvAM1, VvAM3, AtFFT, SlMATE77, MtMATE2, RsMATE8) was constructed by using Phyre2 software (http://www.sbg.bio.ic.uk/phyre2; accessed on 25 January 2021) with fold recognition end homology modeling for the identification of secondary structure attributes. The numbers of transmembrane helices and subcellular localization of the MATE proteins were predicted by transmembrane helices hidden Markov model (TMHMM) server (www.cbs.dtu.dk/services/TMHMM2.0/; accessed on 30 August 2021) and WoLF PSORT (http://www.genscript.com/wolf-psort.html; accessed on 8 September 2021), respectively, with default parameters.

2.4. Transcriptome Analysis

2.4.1. RNA Isolation, Library Preparation, and Illumina Hiseq Xten/Nova seq 6000 Sequencing for Transcriptome Analysis

Total RNA was isolated from each sample representing the white and black caryopsis separately using the TRIzol® Reagent kit (Invitrogen, Carlsbad, CA, USA) according to the manufacturer’s instructions. The concentration and purity were analyzed using NanoDrop2000 spectrophotometer and RNA integrity was detected by agarose gel electrophoresis, the Agilent 2100 measured the RIN value. The cDNA library was generated using the TruSeqTM RNA sample preparation kit (San Diego, IL, CA). Briefly, the polyA selection method by oligo (dT)-attached magnetic beads was used to isolate and enrich mRNA from total RNA. Then, the fragmentation of mRNA into a small sequence of ~300 bp length was carried out by adding fragmentation buffer. Fragmented mRNA templates were transcribed into the first-strand cDNA followed by the synthesis of second-stranded cDNA by using reverse transcriptase (Invitrogen, CA, USA) and random hexamer primers (Illumina) to form a stable double-stranded structure. The cDNA structure sticky end was end-repaired followed by adenylation of the 3′ end poly (A) tail and ligation of index adaptors to prepare for hybridization. After that, the amplification of purified cDNA (using Phusion DNA polymerase by NEB) was performed by polymerase chain reactions (PCR) for 15 cycles. PCR products were separated on 2% low-range ultra-agarose (Certified Low Range Ultra Agarose, Bio-Rad) and quantified by TBS380 Picogreen, Invitrogen. Amplified fragments were subjected to deep sequencing by Illumina Hiseq Xten/NovaSeq 6000 sequencer platform, performed by Shanghai Majorbio Bio-pharm Technology Corporation (Shanghai, China).

2.4.2. Data Filtering and Mapping of Reads

Before data analysis, a quality control of raw data was carried out and the raw reads were filtered to obtain high-quality reads (clean data) to ensure the smooth progress of subsequent analysis. High-quality reads were assembled using SeqPrep (http://github.com/jstjohn/SeqPrep; accessed on 28 November 2020) and Sickle (http://github.com/najoshi/sickle; accessed on 28 November 2020) software with default parameters. This included removing of reads linker sequence, trimming the base with low quality (less than 30) at the end of the 3′ end sequence, reads having more than 10% N ratio, and discarding the adaptor and sequence with final length less than 50 bp after quality trimming. Afterward, clean reads were separately aligned to the O. sativa japonica ref genome IRGSP-1.0 ref_genome (http://plants.ensembl.org/Oryza_sativa/Info/Index; accessed on 5 December 2020) to obtain mapped data (reads) using HISAT2 (http://0-ccb-jhu-edu.brum.beds.ac.uk/software/hisat2/index.shtml; accessed on 10 December 2020) or TopHat2 (http://tophat.cbcb.umd.edu/; accessed on 10 December 2020) [37] software and assembled by StringTie (https://0-ccb-jhu-edu.brum.beds.ac.uk/software/stringtie/index.shtml?t=example; accessed on 16 December 2020) in a reference-based approach [38].

2.4.3. Differential Expression Functional Enrichment Analysis

For the analysis of RNA-Seq data, differentially expressed genes sequencing (DEGSeq) was performed to identify the differentially expressed genes (DEGs) in rice caryopsis affected by the accumulation of anthocyanin between different samples. Gene abundances were quantified by RNA sequence by expectation maximization (RSEM) (http://deweylab.biostat.wisc.edu/rsem/; accessed on 20 December 2020) [39]. The TPM referring to transcripts per million reads methods was used to normalize the expression value of reads for all 12 samples. The analysis of differential expression between samples was performed using the DESeq2 [40], and pairwise comparison was applied. Our testing criterion for screening DEGs was based on multiples hypotheses with the p-value threshold, false discovery rate (FDR) (≤0.05), and (log 2 FoldChange ≥ 1) considered as significantly different. Gene function was annotated based on database non-redundant databases, Swiss-Prot, cluster of orthologous groups databases, gene ontology, and the Kyoto Encyclopedia of Genes and Genomes Pathway database to get functional annotation of DEGs e-value cut-off E < 1 × 10⁻⁵. GO enrichment analysis of transcript in the gene set was performed using the software Goatools 0.6.5 (https://github.com/tanghaibao/GOatools; accessed on 5 January 2021) [41] and considered significantly enriched when p-value (FDR) ≤ 0.05.

2.5. Expression Analysis of Putative Anthocyanin OsMATE Genes by Reverse Transcription Quantitative PCR (RT-qPCR)

To evaluate the gene expression, we performed RT-qPCR. The total RNA was isolated from rice caryopsis using the TRIzol® Reagent kit (Invitrogen, Carlsbad, CA, USA) according to the manufacturer’s instructions. We chose four candidate genes differentially expressed in black and white rice caryopsis including two OsMATEs (OsMATE34 and OsMATE3), one GST (OsGSTU34), and one MRP (OsMRP15). Rice OsActin1 was used as an internal reference gene to normalize the gene expression level. The primer sequences listed in Table S1 were retrieved from https://biodb.swu.edu.cn/qprimerdb/best-primers-ss; accessed on 4 February 2021. First-strand full-length cDNAs were synthesized from 2 µg of total RNA using the primeScriptTM RT reagent kit with gDNA eraser (RR047A, Takara, Japan) according to the manufacturer’s instruction. RT-qPCR was carried out using the ChamQTM SYBR qPCR Master Mix (Q311-01, Vazyme, China) on the LightCycler 480II (Roche) according to the manufacturer’s instructions. Three biological repeats were used for each treatment (Bc11, Bc18, and Bc25) and control (Wc11, Wc18, and Wc25) for gene expression profiles. The reaction was adjusted following the thermal cycling conditions as initial denaturing temperature, 95 °C for 30 s, followed by 40 cycles and each cycle consisted of 95 °C for 5 s and 60 °C for 20 s. The gene expression level was calculated by the 2ΔΔCt calculation method.

3. Results

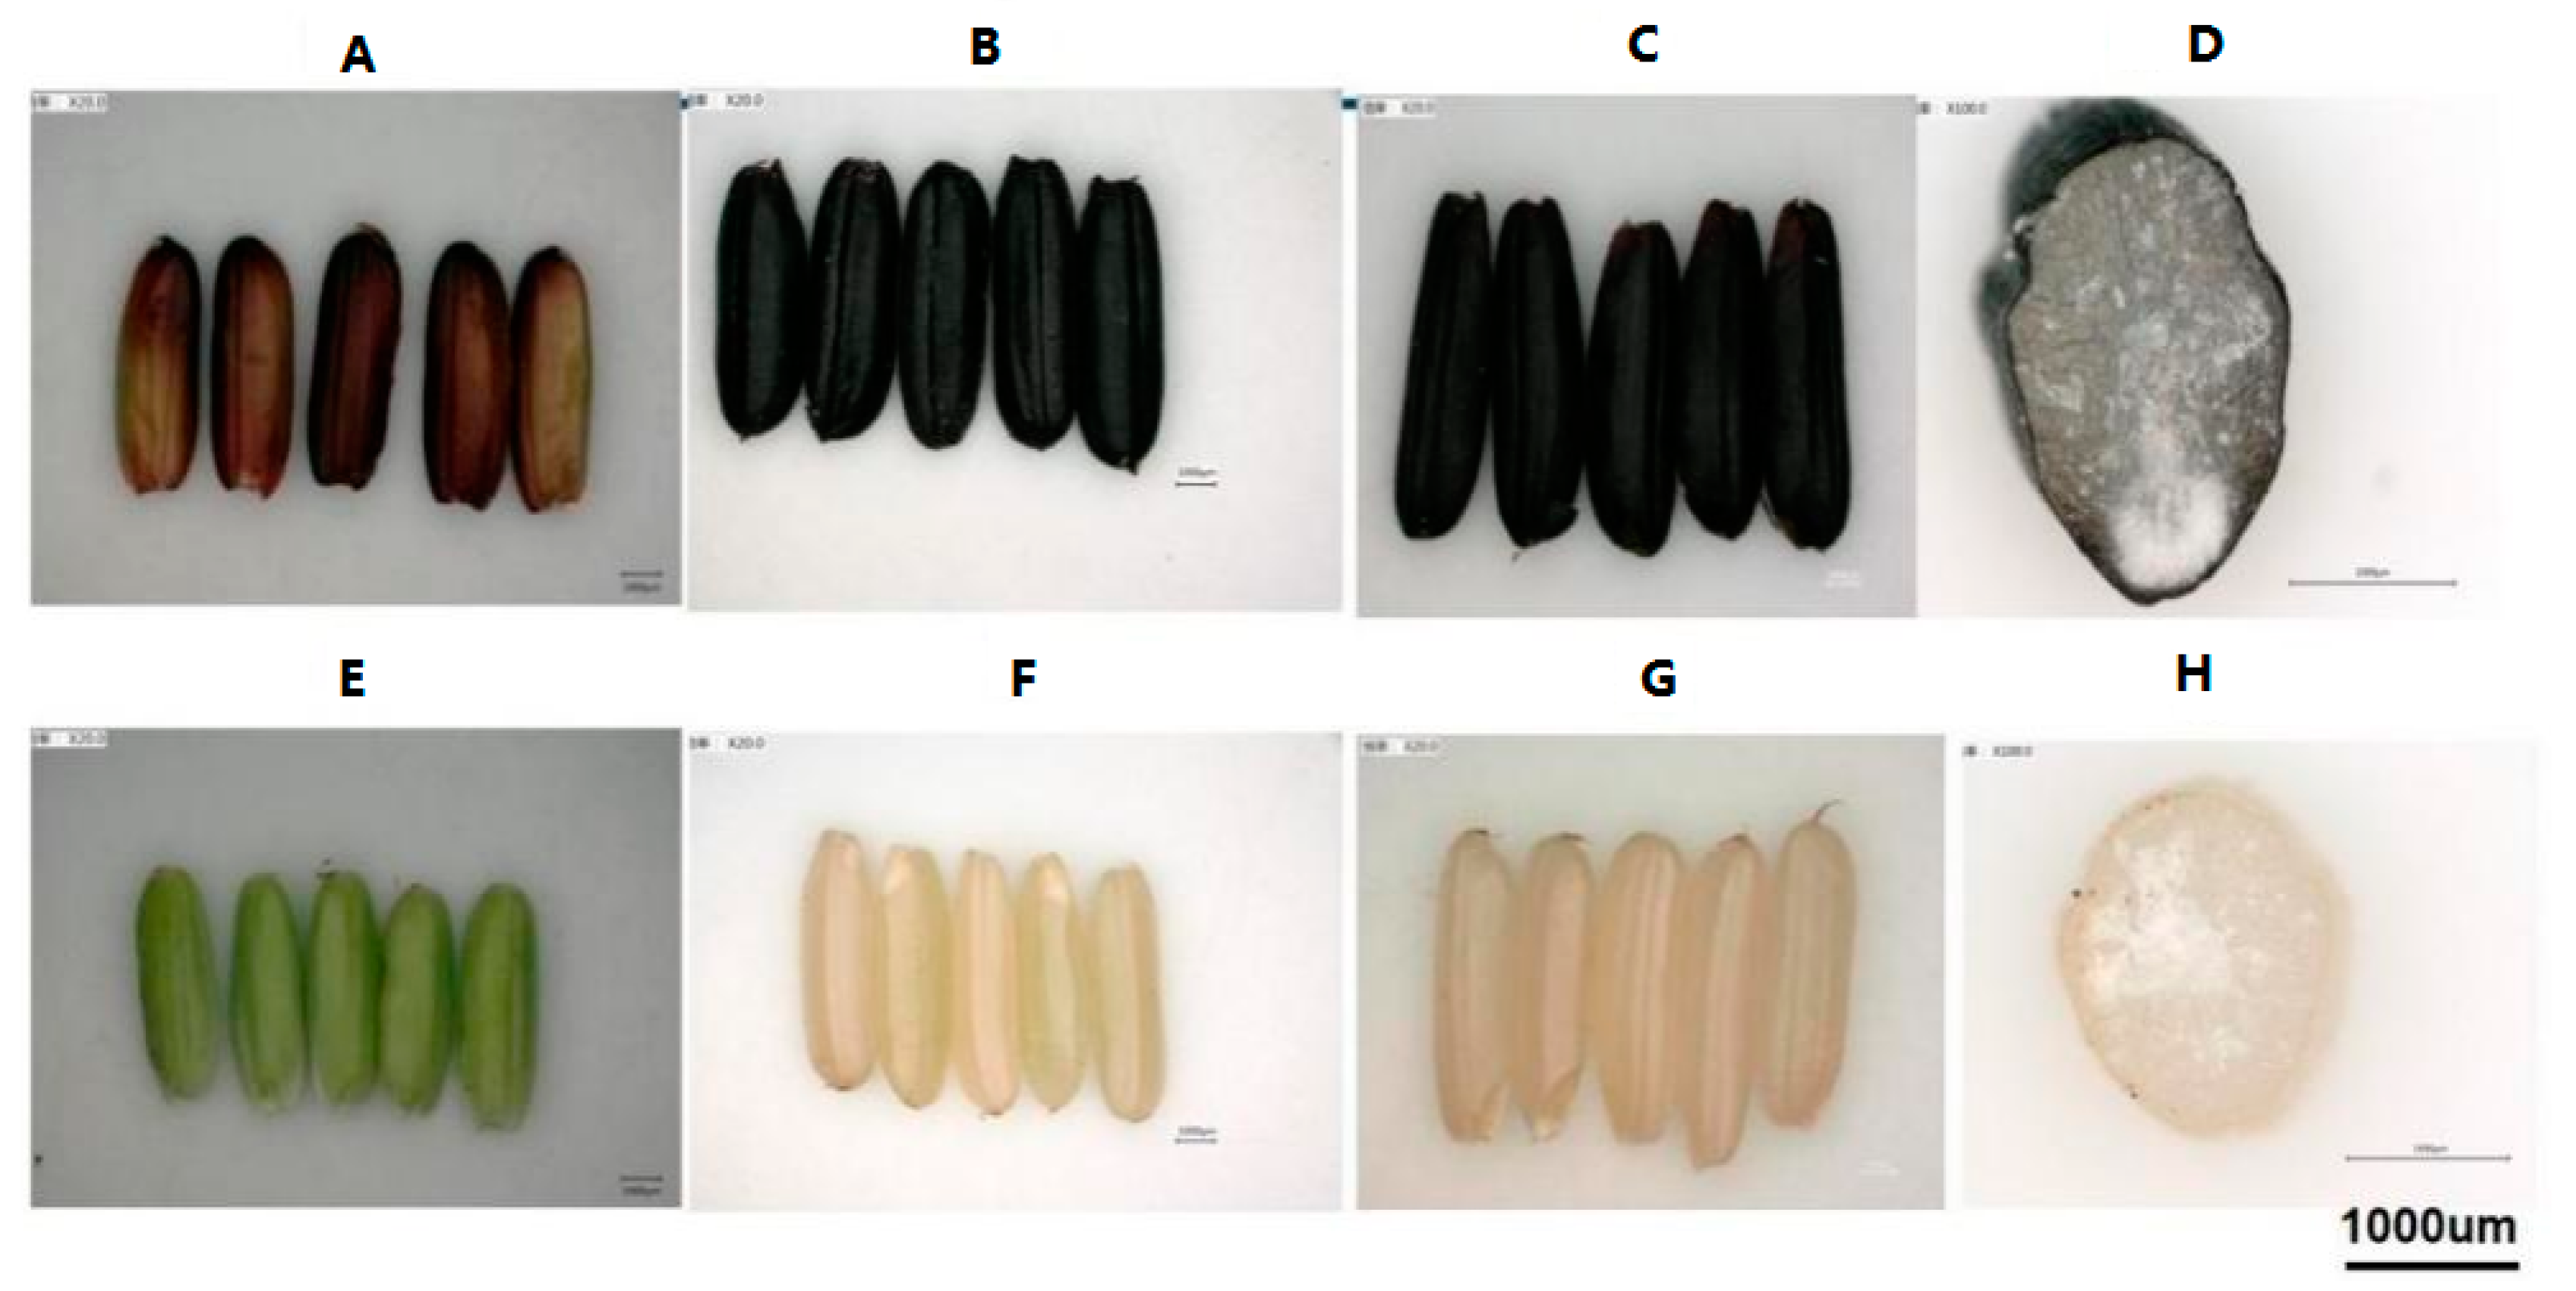
3.1. Anthocyanin Quantification at Different Developmental Stages

We performed high-performance liquid chromatography (HPLC) to analyze the two major rice anthocyanins (C3G and P3G) and one minor anthocyanin (Petunidin-3-O-glucoside, Pt3G) in black and white caryopsis. Our results showed that Pt3G was not detected in both black and white caryopsis, while C3G and P3G were detected only in black caryopsis (Table 1). The amount of anthocyanin varied at different developmental stages. The peak was attained at 18 DAF in sample Bc18. At this stage, the concentration of C3G and P3G was 4206.91 ± 18 µg/g of fresh weight (FW) and 295.33 ± 4 µg/g FW, respectively. The concentration of C3G varies between 91 and 93% of TAC while P3G was approximately 7–9% of TAC (Figure S1).

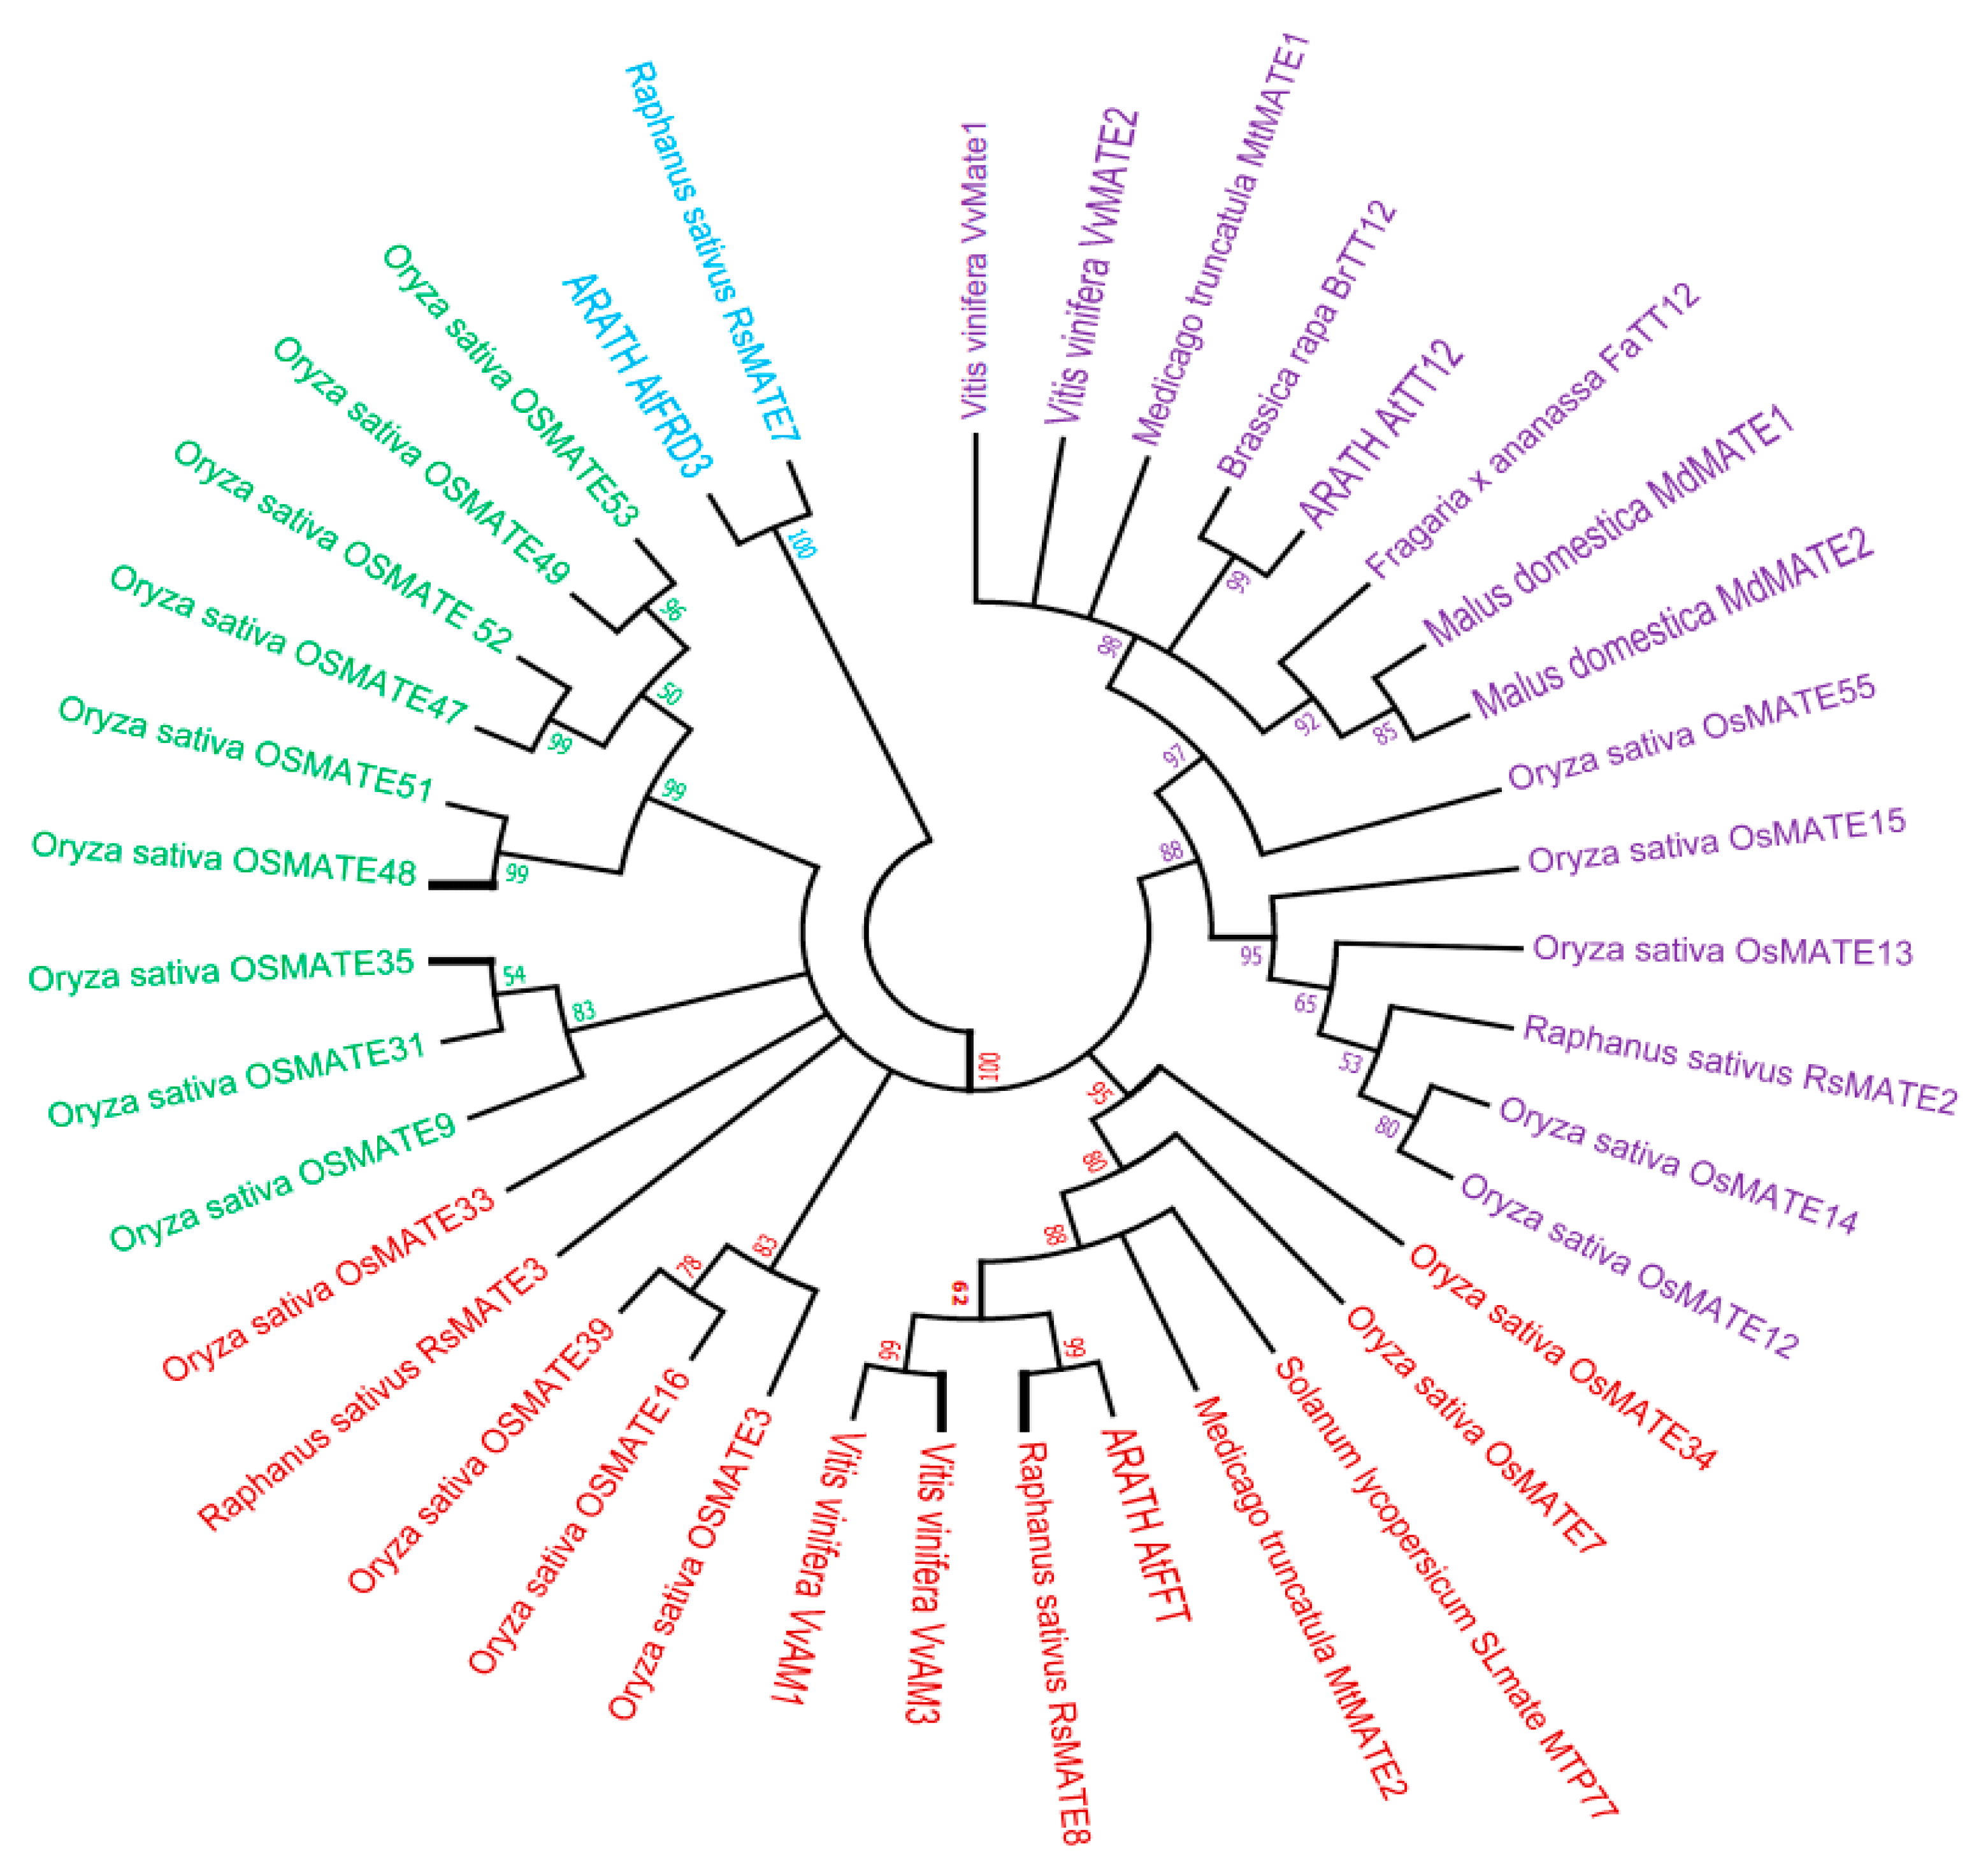
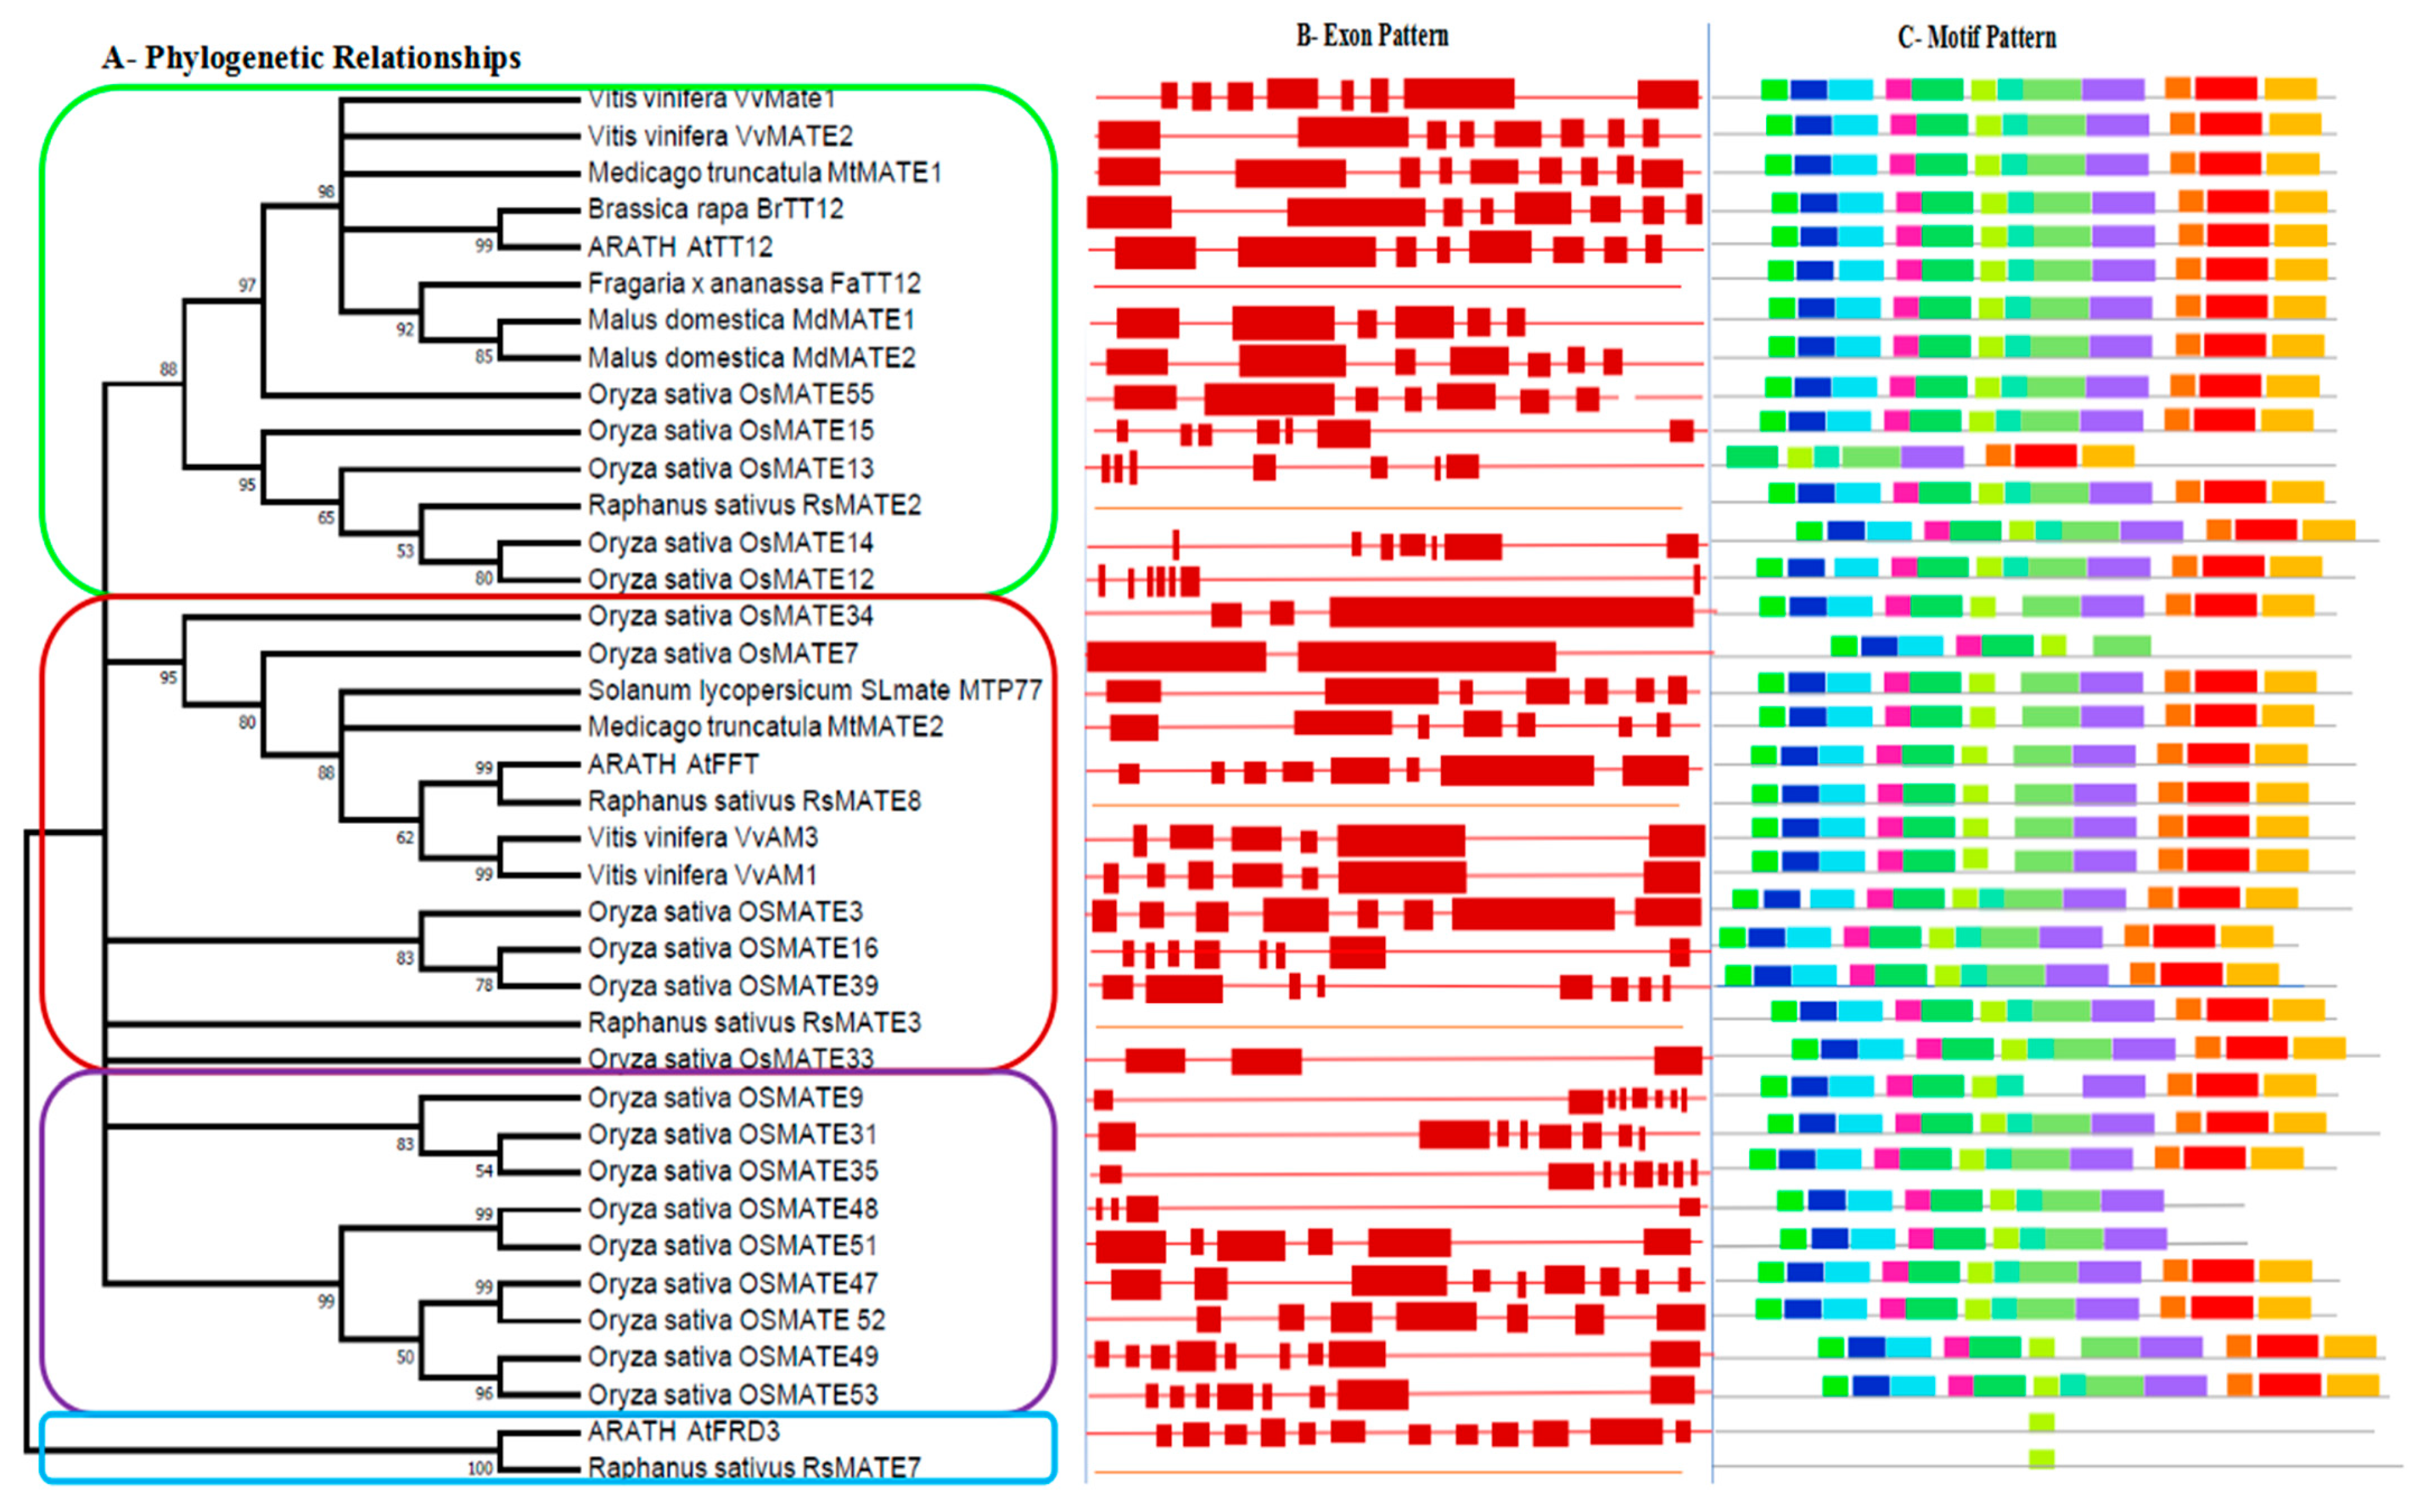
3.2. Phylogenetic Tree Analysis of MATE Proteins and Deduction of Putative OsMATE Gene for Anthocyanin Transportation

From 55 MATE proteins identified in O. sativa, we selected 20 MATE transporters [34] and 18 other MATE transporters with well-known functions. The phylogeny relationships suggested that the function of MATE proteins in rice could be deduced based on the known function of MATE transporters in other plants. Homologous sequences having similar structures were found to have similar functions as well [42]. To establish the evolutionary relationships between selected OsMATEs and other MATE-like proteins, the phylogenetic trees were generated after the alignment of all 38 full-length amino acid sequences. Overall, the tree showed four different clades (CL) named CL1, CL2, CL3, and CL4 (Figure 2). Remarkably, the proteins known as anthocyanin transporters were separated from others having different functions. The CL1 did not contain rice MATE transporters and consisted of MATE proteins previously identified in R. sativus (RsMATE7) and A. thaliana (AtFRD3); AtFRD3 is involved in iron homeostasis [43]. In terms of evolution, CL1 appears as the root ancestor of all MATE transporters of the tree. The CL2 consisted of two sub-groups, CL2-1 and CL2-2, all found in rice. The function of these MATEs has been inferred from the function of OsMATE9 [34] previously identified as OsMATE1 and involved in the development of rice, especially fertility, disease, and stress tolerance [44]. The CL3 split into two sub-groups: CL3-1 and CL3-2. The CL3-1 comprised four rice MATE proteins—OsMATE33, OsMATE39, OsMATE16, OsMATE3—and one radish MATE transporter protein (RsMATE3) previously presumed to transport anthocyanin in radish [45]. The sub-group CL3-2 comprised two rice MATE proteins (OsMATE7 and OsMATE34) and six characterized transporters of various anthocyanin types such as acylated anthocyanin VvAM1 and VvAM3 from V. vinifera [31,46]; flavone glycoside or malonylated anthocyanin MtMATE2 from M. truncatula [47]; and three others were not specific including SlMATE or MTP77 from S. lycopersicum [48], RsMATE8 from R. sativus [45], and AtFFT from A. thaliana [49] associated with the transport and accumulation of glycosylated anthocyanin inside the vacuole. CL4 consisted of two sub-groups: CL4-1 and CL4-2. CL4-1 is composed of five rice MATE genes previously assumed to be related to vacuolar transport and flavonoid or alkaloid accumulation in the plant [34]. The subgroup CL4-2 was constituted oby one rice MATE OsMATE55 clustered with eight well-identified proanthocyanidin MATE-like transporters in several plants including AtTT12 from A. thaliana [50], BrTT12 from Brassica rapa [51], VvMATE1 and VvMATE2 from V. vinifera [52], MtMATE1 from M. truncatula [53], MdMATE1 and MdMATE2 from Malus domestica [54], and FaTT12 from F. ananassa [55]. These MATEs were involved in mediating the transport of proanthocyanidins and the transport of flavonoids and epicatechin-3’-O-glucoside into the vacuole. The phylogenetic scrutiny is one of the fastest, simplest, and relatively most precise ways to predict gene function that can be subsequently prioritized for further practical confirmation [56]. Previous studies have provided strong evidence for function prediction of gene families based on phylogenetic analysis, including MATE transporters [34,56,57,58]. This analysis suggested that OsMATE33, OsMATE39, OsMATE16, OsMATE3, OsMATE7, and OsMATE34 could be associated with anthocyanin transportation and were selected as candidate proteins, while OsMATE55 could be involved in transporting proanthocyanidin in rice and warrant further analysis.

3.3. Molecular Characteristics and Structure of Putative Anthocyanin MATE Protein

The putative OsMATE proteins are composed of 363–522 residues with predicted molar masses of approximately 38.74–56.17 kDa and theoretical PI of 4.72–9.58, aliphatic indices from 110.08–119.94, and grand average hydropathicity index of 0.528–0.806. Compared to other MATE-like proteins, these values are similar (Table S2). However, high similarities were particularly identified between some OsMATE and other anthocyanin MATE proteins studied such as OsMATE34 with MtMATE2 and VvAM1, OsMATE33, and VvAM3. OsMATE7 had the lowest values for these indices, meaning that its structure might be different from other MATE. The instability index of all OsMATE proteins and other known anthocyanin MATE proteins was found to be less than 40, predicting that these proteins are stable. The prediction of the secondary structure of OsMATE by the self-optimized prediction method from alignment (SOPMA) showed that these O. sativa MATEs were mainly made of α-helices (59.20–64.46%), distributed with random coils (17.46–22.31%), extended strands (13.84–16.56%), and β turns (3.31–4.02%) (Figure S2). Transmembrane domains predicted by hidden Markov model topology (HMMTOP) revealed that OsMATEs have variant putative transmembrane (TM) segments ranging from 6 (OsMATE7), 10 (OsMATE39), 11 (OsMATE3), and 12 (OsMATE16, OsMATE33, OsMATE34) (Figure S3). The TM structure of OsMATE33 and OsMATE34 was similar to MtMATE2 and AtFFT; that of OsMATE16 was similar to RsMATE8 and VvAM3, and OsMATE3 was similar to VvAM1 and SlMATE. Reportedly, the MATE family consists of a unique topology predicted to have 10–12 TM helices with long, cytoplasmatic C and N termini [59].
The exon–intron pattern of the coding sequence was explored and plotted with the phylogenetic tree (Figure 3A) to provide some insight into the evolution of gene structure (Figure 3B). The result revealed some variation of exons and introns number and length in different branches of MATE precisely in clade CL3, which harbored anthocyanin MATE-like transporter proteins. In this clade, the number of exons and introns range from 2–8 and 1–7, respectively, and all had untranslated regions. OsMATE33, OsMATE34, and OsMATE7 had 3,3,2 exons and 2,2,1 introns, respectively, which were fewer compared to others. They were also connected with the same common direct ancestor. The number of exons and introns gradually increases with the increase of nod, and in subclade CL3-1, OsMATE3, OsMATE16, and OsMATE39 had eight exons and even introns with untranslated region similar to AtFFT and relatively the same to SlMATE, MtMATE2, VvAM1, and VvAM1.
To confirm the similarities between sequences observed, the protein motifs patterns were analyzed by MEME (Figure 3C). The result showed that the sequences and types of protein motifs were similar within the same clade. The motif structure is highly similar in the CL3 clade except for OsMATE7 with only eight protein motifs. Furthermore, the subclade CL3-2 compared to CL3-1 showed the loss of the protein motif 7 during evolution. Thus, CL3-1 had 12 protein motifs while CL3-2 had 11, and the MATE proteins OsMATE7 were significantly different from other proteins with few motifs. This remarkable difference in MATE protein structures might be due to functional diversities that occurred during the evolution.
Homology sequences were analyzed through a multiple sequence alignment of six putative OsMATE amino acid sequences and selected MATE-like proteins associated with anthocyanin transportation in other plants. The result showed that OsMATE shared 31–55% and 40–60% similarity and identity, respectively, in their amino acid sequence with other MATEs. OsMATE34 and OsMATE7 had the highest identity with MTP77/SlMATE, MtMATE2, AtFFT, RsMATE8, VvAM1, and VvAM3 ranging between 52.66 and 61% whereas OsMATE3, OsMATE16 and OsMATE33, OsMATE39 showed high identity with RsMATE3 ranging from 47.08 to 51.58% (Table S4). Strikingly, OsMATE33 and OsMATE7 exhibited, respectively, 57% and 61.39% identity with AtFFT amino sequence associated with anthocyanin transportation in Arabidopsis thaliana [49].
The subcellular localization of OsMATEs predicted that these proteins were localized in different organelles such as plasma membrane, vacuole, endoplasmic reticulum, Golgi apparatus, chloroplast, and mitochondria. However, the result showed some differences in the localization pattern. Like SlMATE and MtMATE2, OsMATE34 and OsMATE39 were mainly found in the plasma membrane and vacuole; OsMATE3 and OsMATE33 in the plasma membrane similar to AtFFT and VvAM1; OsMATE16 was found inside the vacuole and OsMATE7 in the plasma membrane, endoplasmic reticulum, and cytoplasm (Table S5). Signal peptides often guided proteins to their target membranes; however, these proteins seemed to have no signal peptides in the N-terminal according to signal. Sometimes peptides are difficult to identify because there is some possibility that they do not have strictly conserved amino acid sequences; thus, the first transmembrane domain which biochemically resembles a signal sequence can play a signal function for translocation.

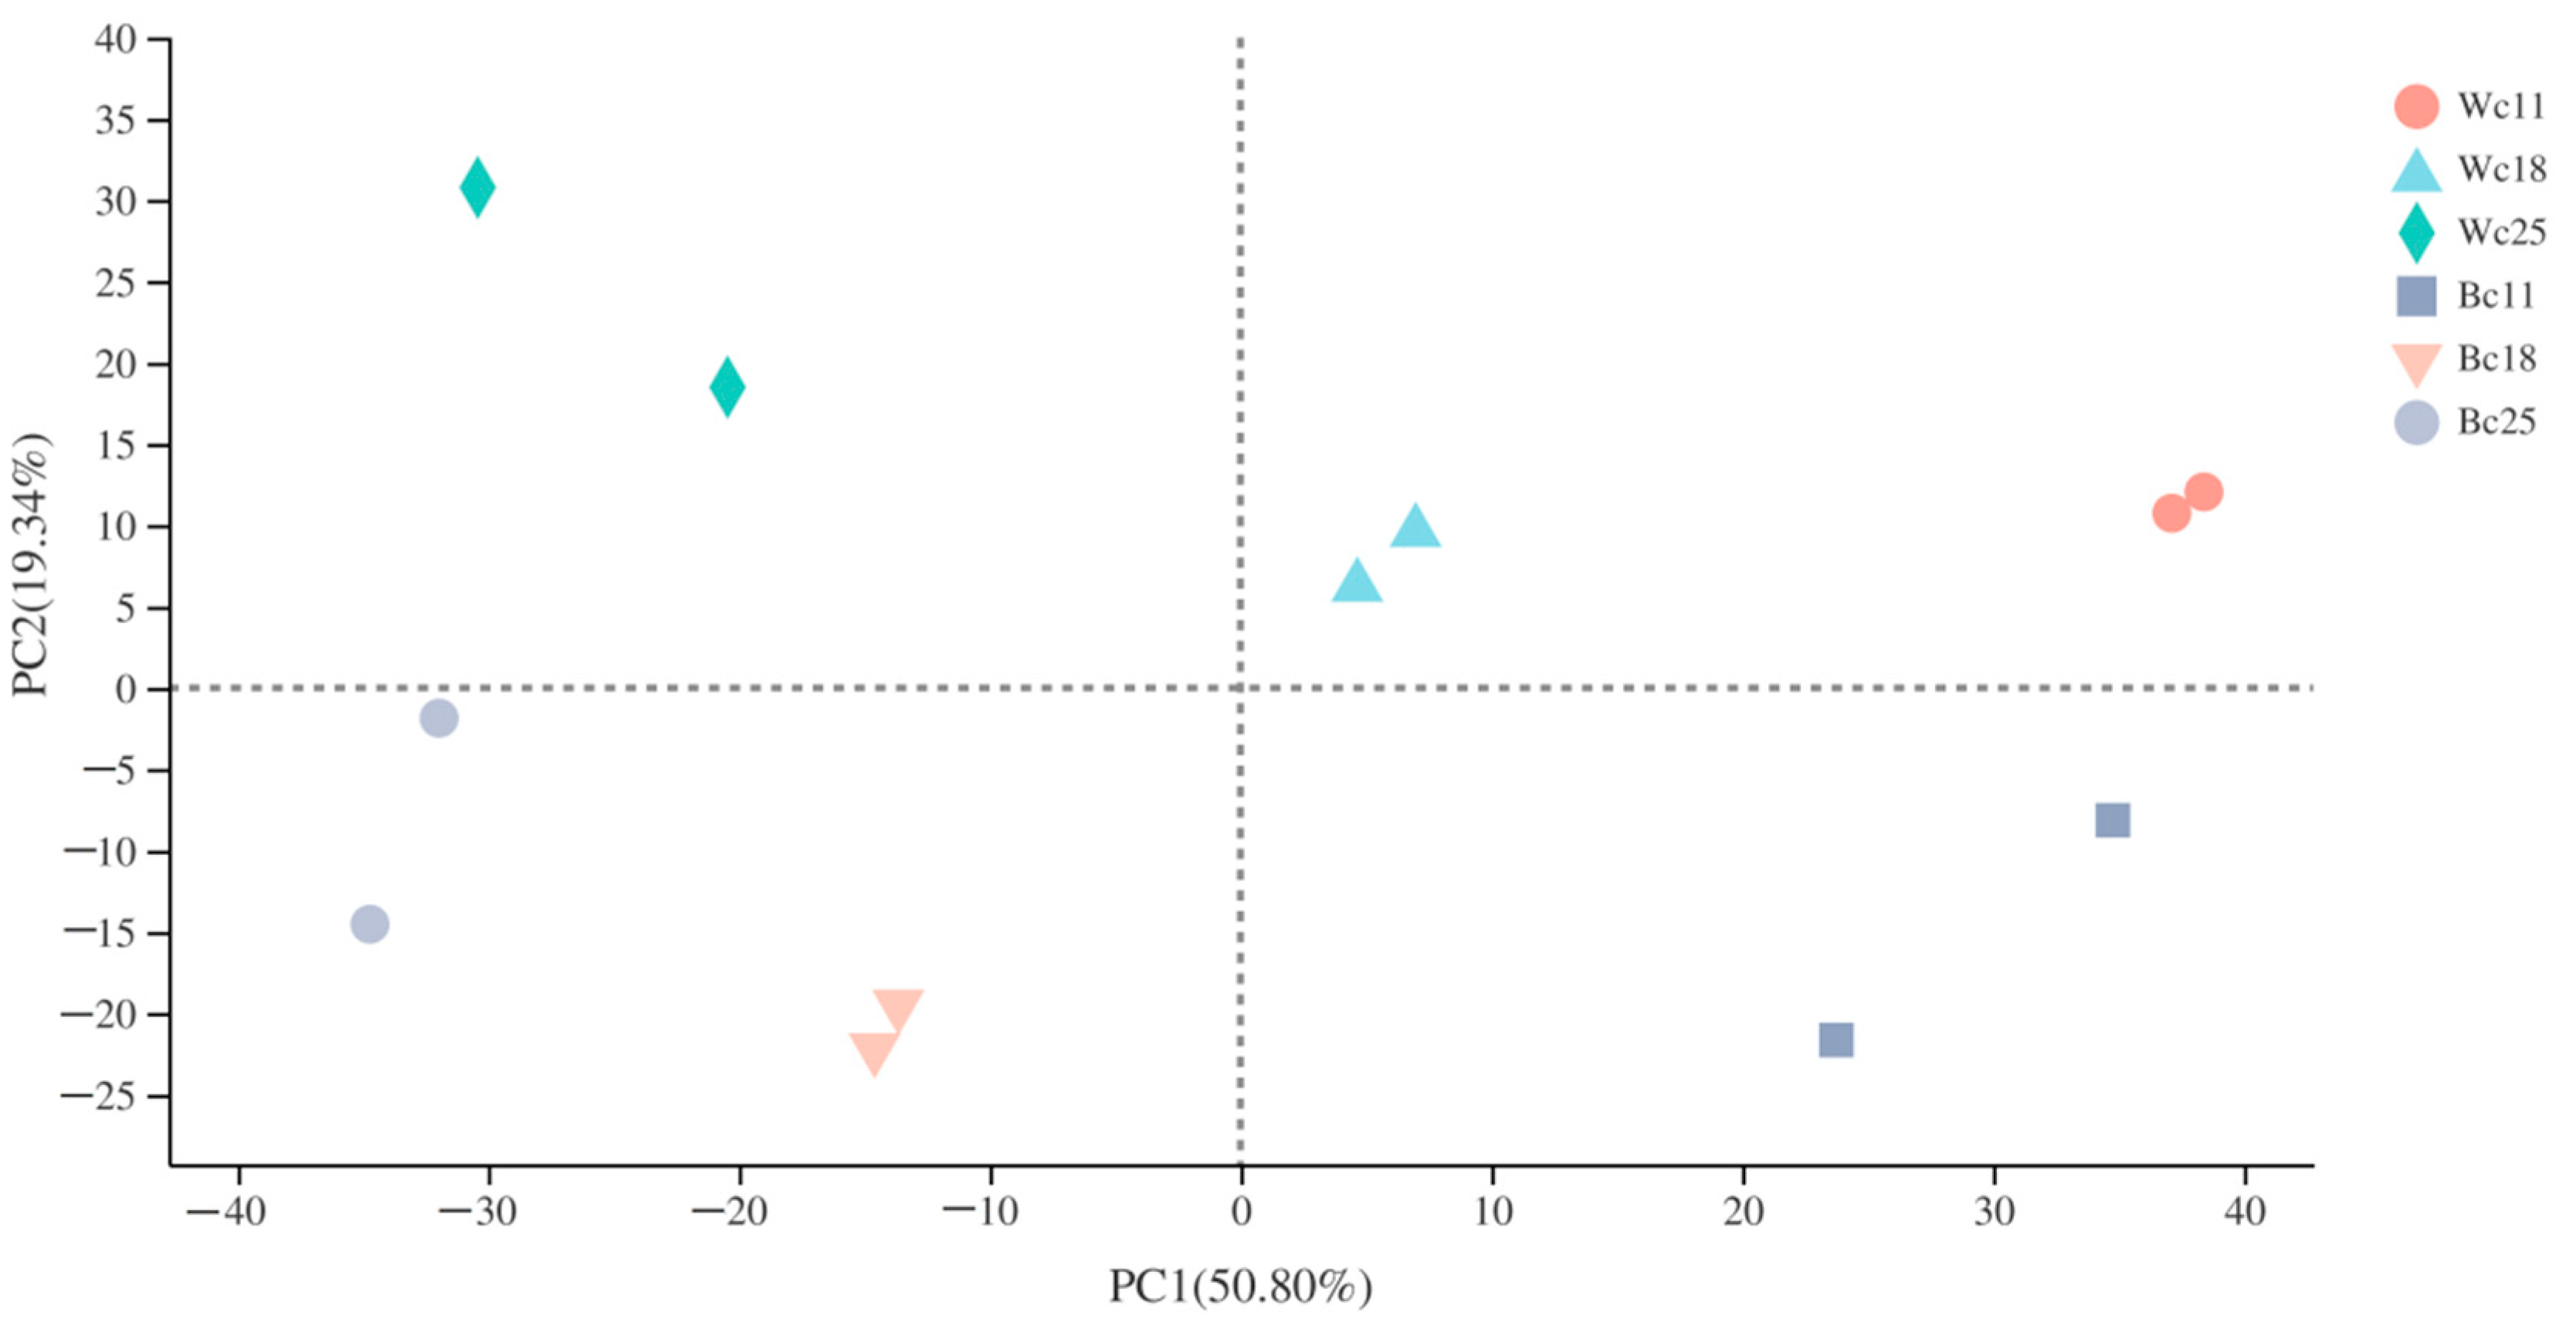
3.4. Transcriptome Sequencing and De Novo Assembly

We constructed a total of 12 cDNA libraries from twelve samples (six for black caryopsis and six for white caryopsis) collected at three different rice developmental stages—11 DAF, 18 DAF, and 25 DAF—for sequencing using the high-throughput Illumina Hiseq Xten/Nova sequencing for transcriptome analysis. After sequencing, 44.23–57.72 million (M) items of raw data were obtained. Data filtration further generated 43.81–57.13 million (M) paired-end clean reads from each sample with Q30 percentage > 95.8%, GC percentage > 51%, and additional analysis showed a Pearson correlation coefficient of each of two replicates sample greater than 0.96. These data indicated a great similarity between the two biological replicated samples and the good quality of the sequencing result. The percentages of mapped reads generated after mapping the clean data of each sample to the rice reference genome were comprised between 92–95% (Table 2). Subsequently, the principal component analysis showed that replicated samples were relatively close, while the distance between different cultivars was relatively high (Figure 4). This result highlighted the genetic similarity and difference between samples and cultivars respectively at different stages.

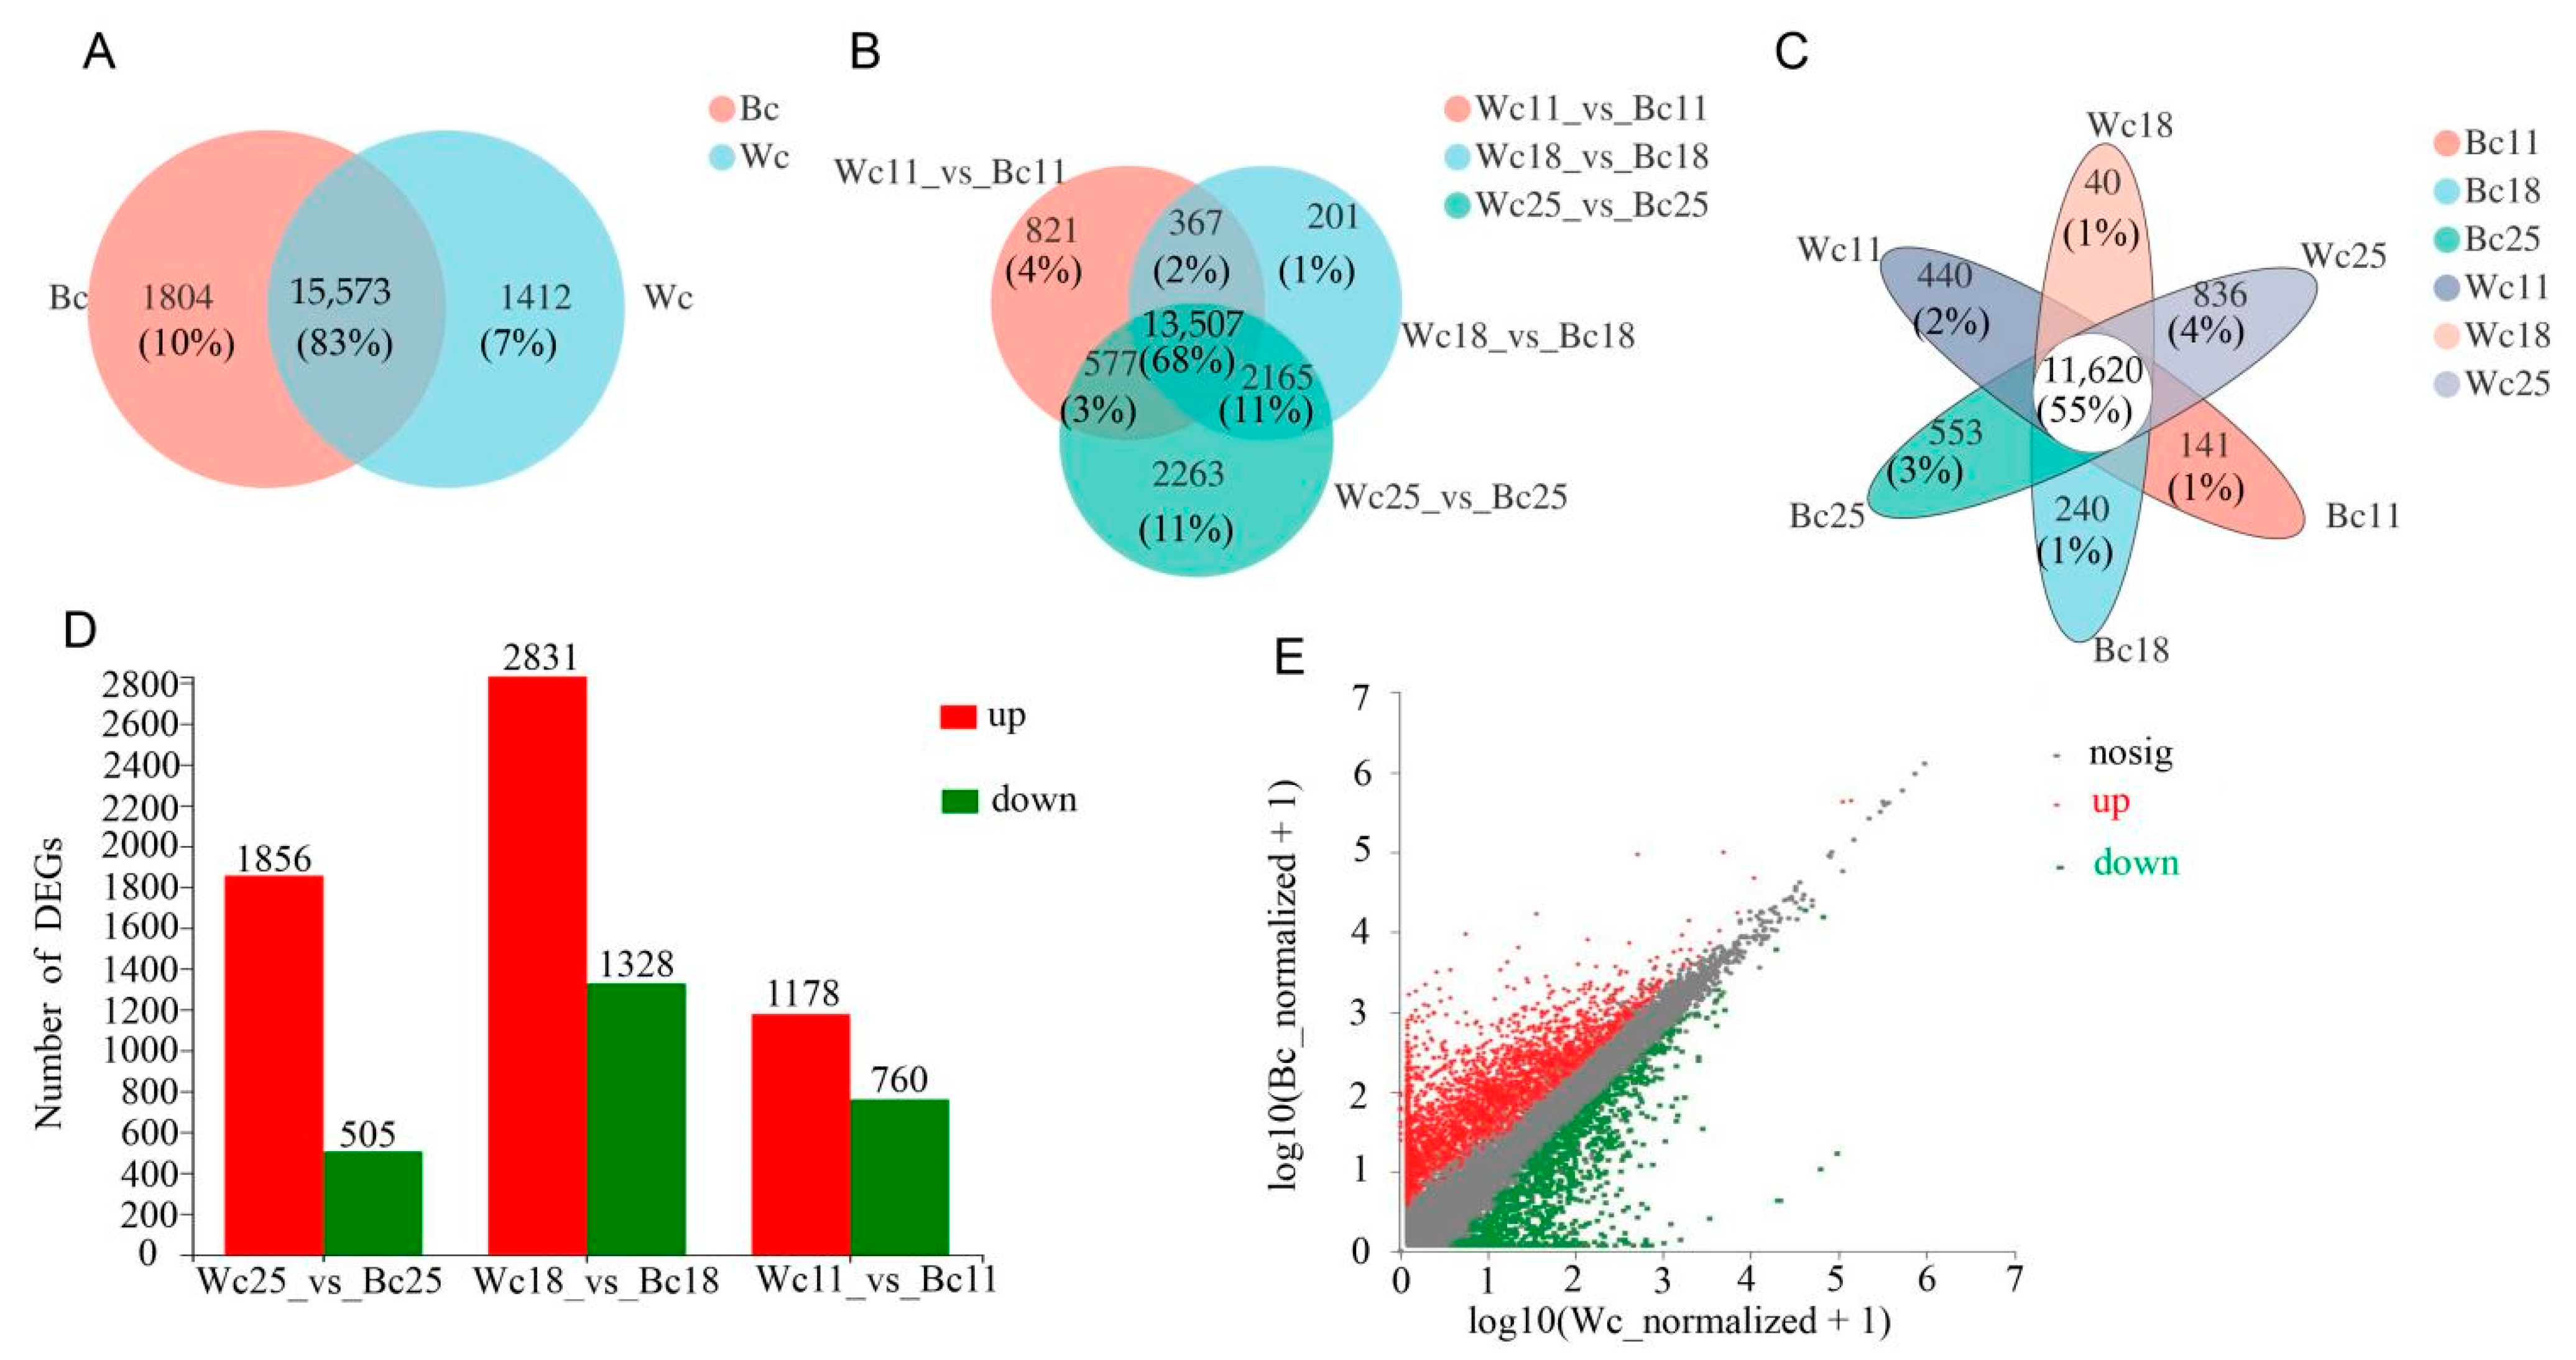
3.5. Identification of Differentially Expressed Genes (DEGs)

Gene abundances were quantified by RSEM (http://deweylab.biostat.wisc.edu/rsem/), and a total of 36,079 expressed genes were detected from the twelve samples in this analysis, including 33,157 known genes and 2922 new genes; 59,966 expressed transcripts, including 38,802 known transcripts and 21,164 new transcripts were identified. DEGs were essentially analyzed using Deseq2 log2FoldChange ≥ 1 and the p-value cut-off (FDR ≤ 0.05). Further pairwise comparison of the number of the expressed gene between the caryopsis of two cultivars at different developmental stages showed that 15,573 genes were commonly expressed in both black and white caryopsis, while 1804 and 1412 genes were uniquely expressed in black and white caryopsis, respectively (Figure 5A). We conducted three comparisons across rice caryopsis at different developmental stages, the result showed that 821 uniquely expressed genes out of 15,272 DEGs for Wc11 vs. Bc11, 201 uniquely expressed genes out of 16,240 DEGs for Wc18 vs. Bc18, and 2263 uniquely expressed genes out of 16,240 DEGs for Wc25 vs. Bc25 (Figure 5B). Subsequent analysis showed that in both caryopsis types, uniquely expressed genes were higher at 25 DAF with 836 and 553 genes in Wc25 and Bc25, respectively (Figure 5C). The further comparison made based on two rice cultivars Wc vs. Bc showed that upregulated genes were higher than downregulated genes at all stages (Figure 5D) and the number of up-regulated genes was higher in black caryopsis (Figure 5E).

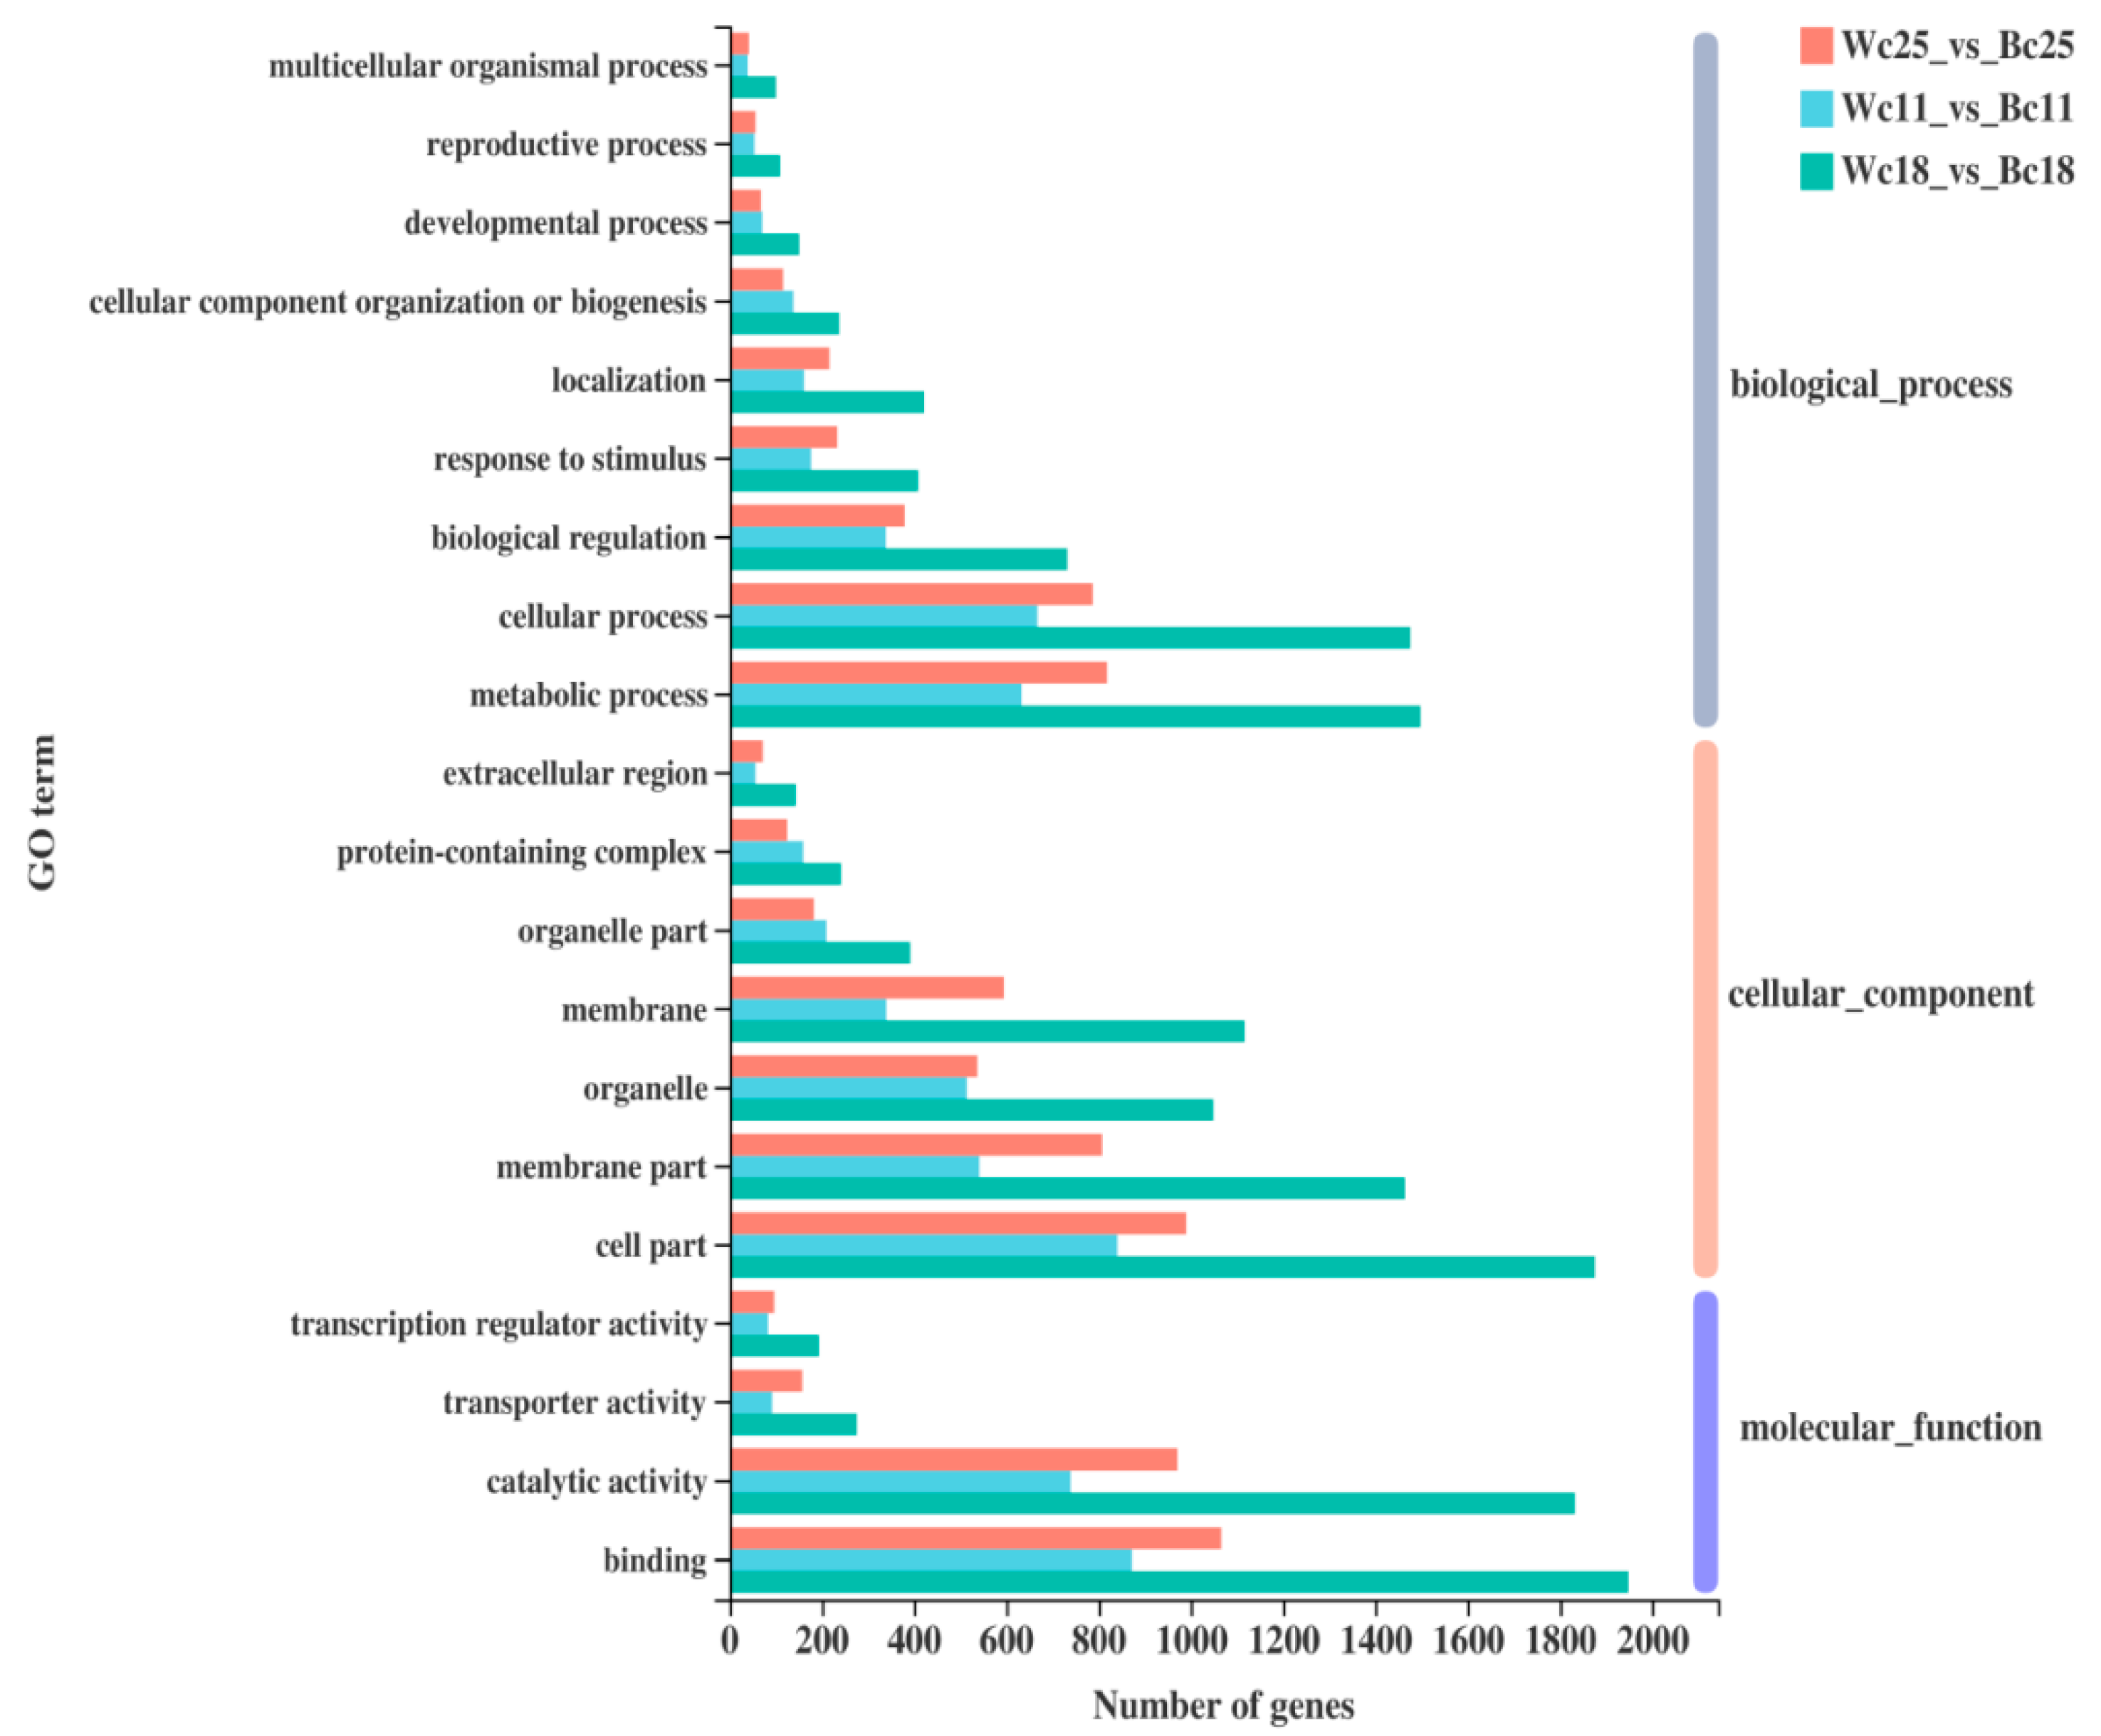
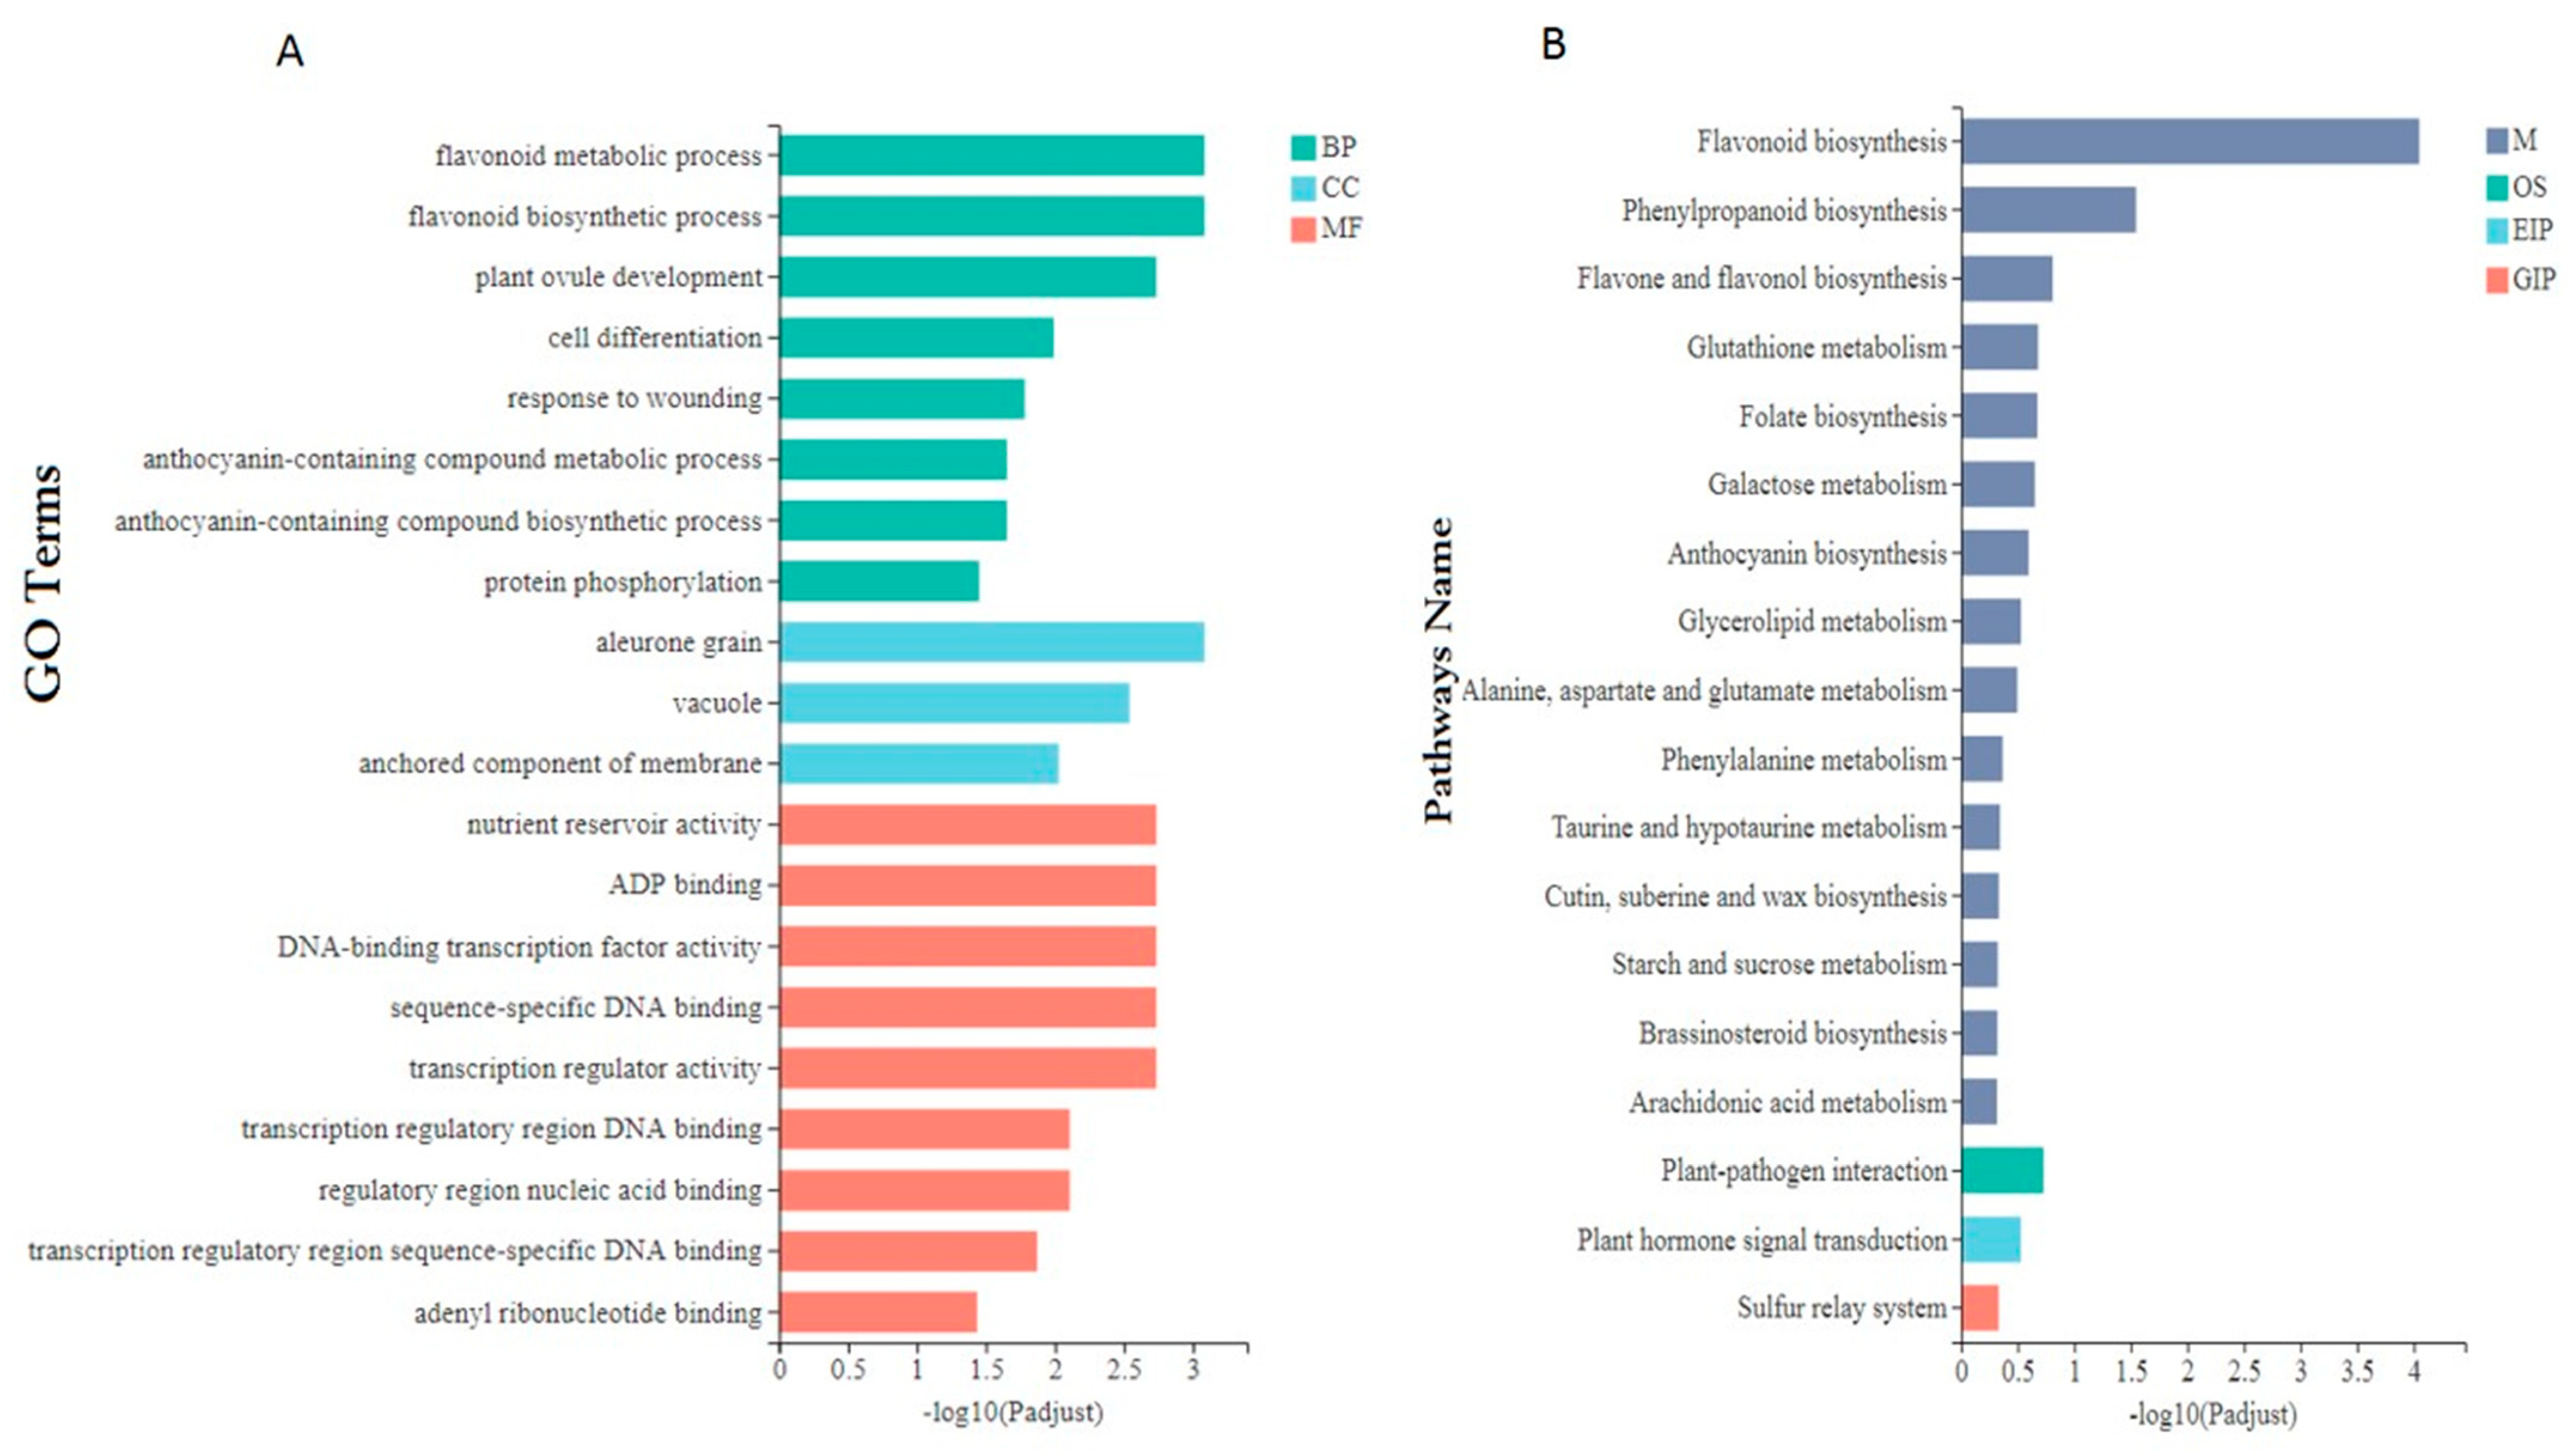
3.6. Functional Annotation and Enrichment Analysis of DEGs

To characterize the main biological functions of DEGs, we carried out gene function annotation of all transcripts and expressed genes in rice caryopsis. These transcripts were annotated by non-redundant (Nr) databases, Swiss-Prot, the cluster of orthologous groups databases (COG), gene ontology (GO), and the Kyoto Encyclopedia of Genes and Genomes pathway database (KEGG). We further performed GO level 2 on three sets of DEGs (Wc11 vs. Bc11, Wc18 vs. Bc18, and Wc25 vs. Bc25) and three GO categories, namely, biological process, cellular component, and molecular function, were revealed (Figure 6). In the category biological process, metabolic process, cellular process, and biological regulation were particularly high. In the category cellular component, cell part, membrane part, and organelle were highest, and in the category molecular function high level of the gene showed for binding and catalytic activity.
To predict the biological function of different DEG sets, we investigated the GO enrichment in Wc vs. Bc. The results indicated that in the category biological process, flavonoid metabolic (GO:0009812) and biosynthesis (GO:0009813) processes were particularly enriched, while in the category cellular component, aleurone grain (GO:0033095) and vacuole (GO:0005773) were enriched. In metabolic function, the sub-categories nutrient reservoir activity (GO:0045735), ADP binding (GO:0003677), DNA binding transcription regulator activity (GO:0003700), transcription regulator activity (GO:0140110), and a sequence-specific DNA activity (GO:0043565) were enriched (Figure 7A). Meanwhile, all DEGs were suggested to KEGG analysis and the result showed that carbohydrate metabolism (62 genes over 854) and biosynthesis of secondary metabolite process (66 genes) were high in all groups of comparison and mainly Wc vs. Bc (Supplementary file 1). The KEGG enrichment indicated that metabolism pathways were predominant and subsequent analysis revealed that flavonoid biosynthesis pathways (KEGG: map 00941) and phenylpropanoid pathway (KEGG: map 00940) were particularly enriched (Figure 7B).

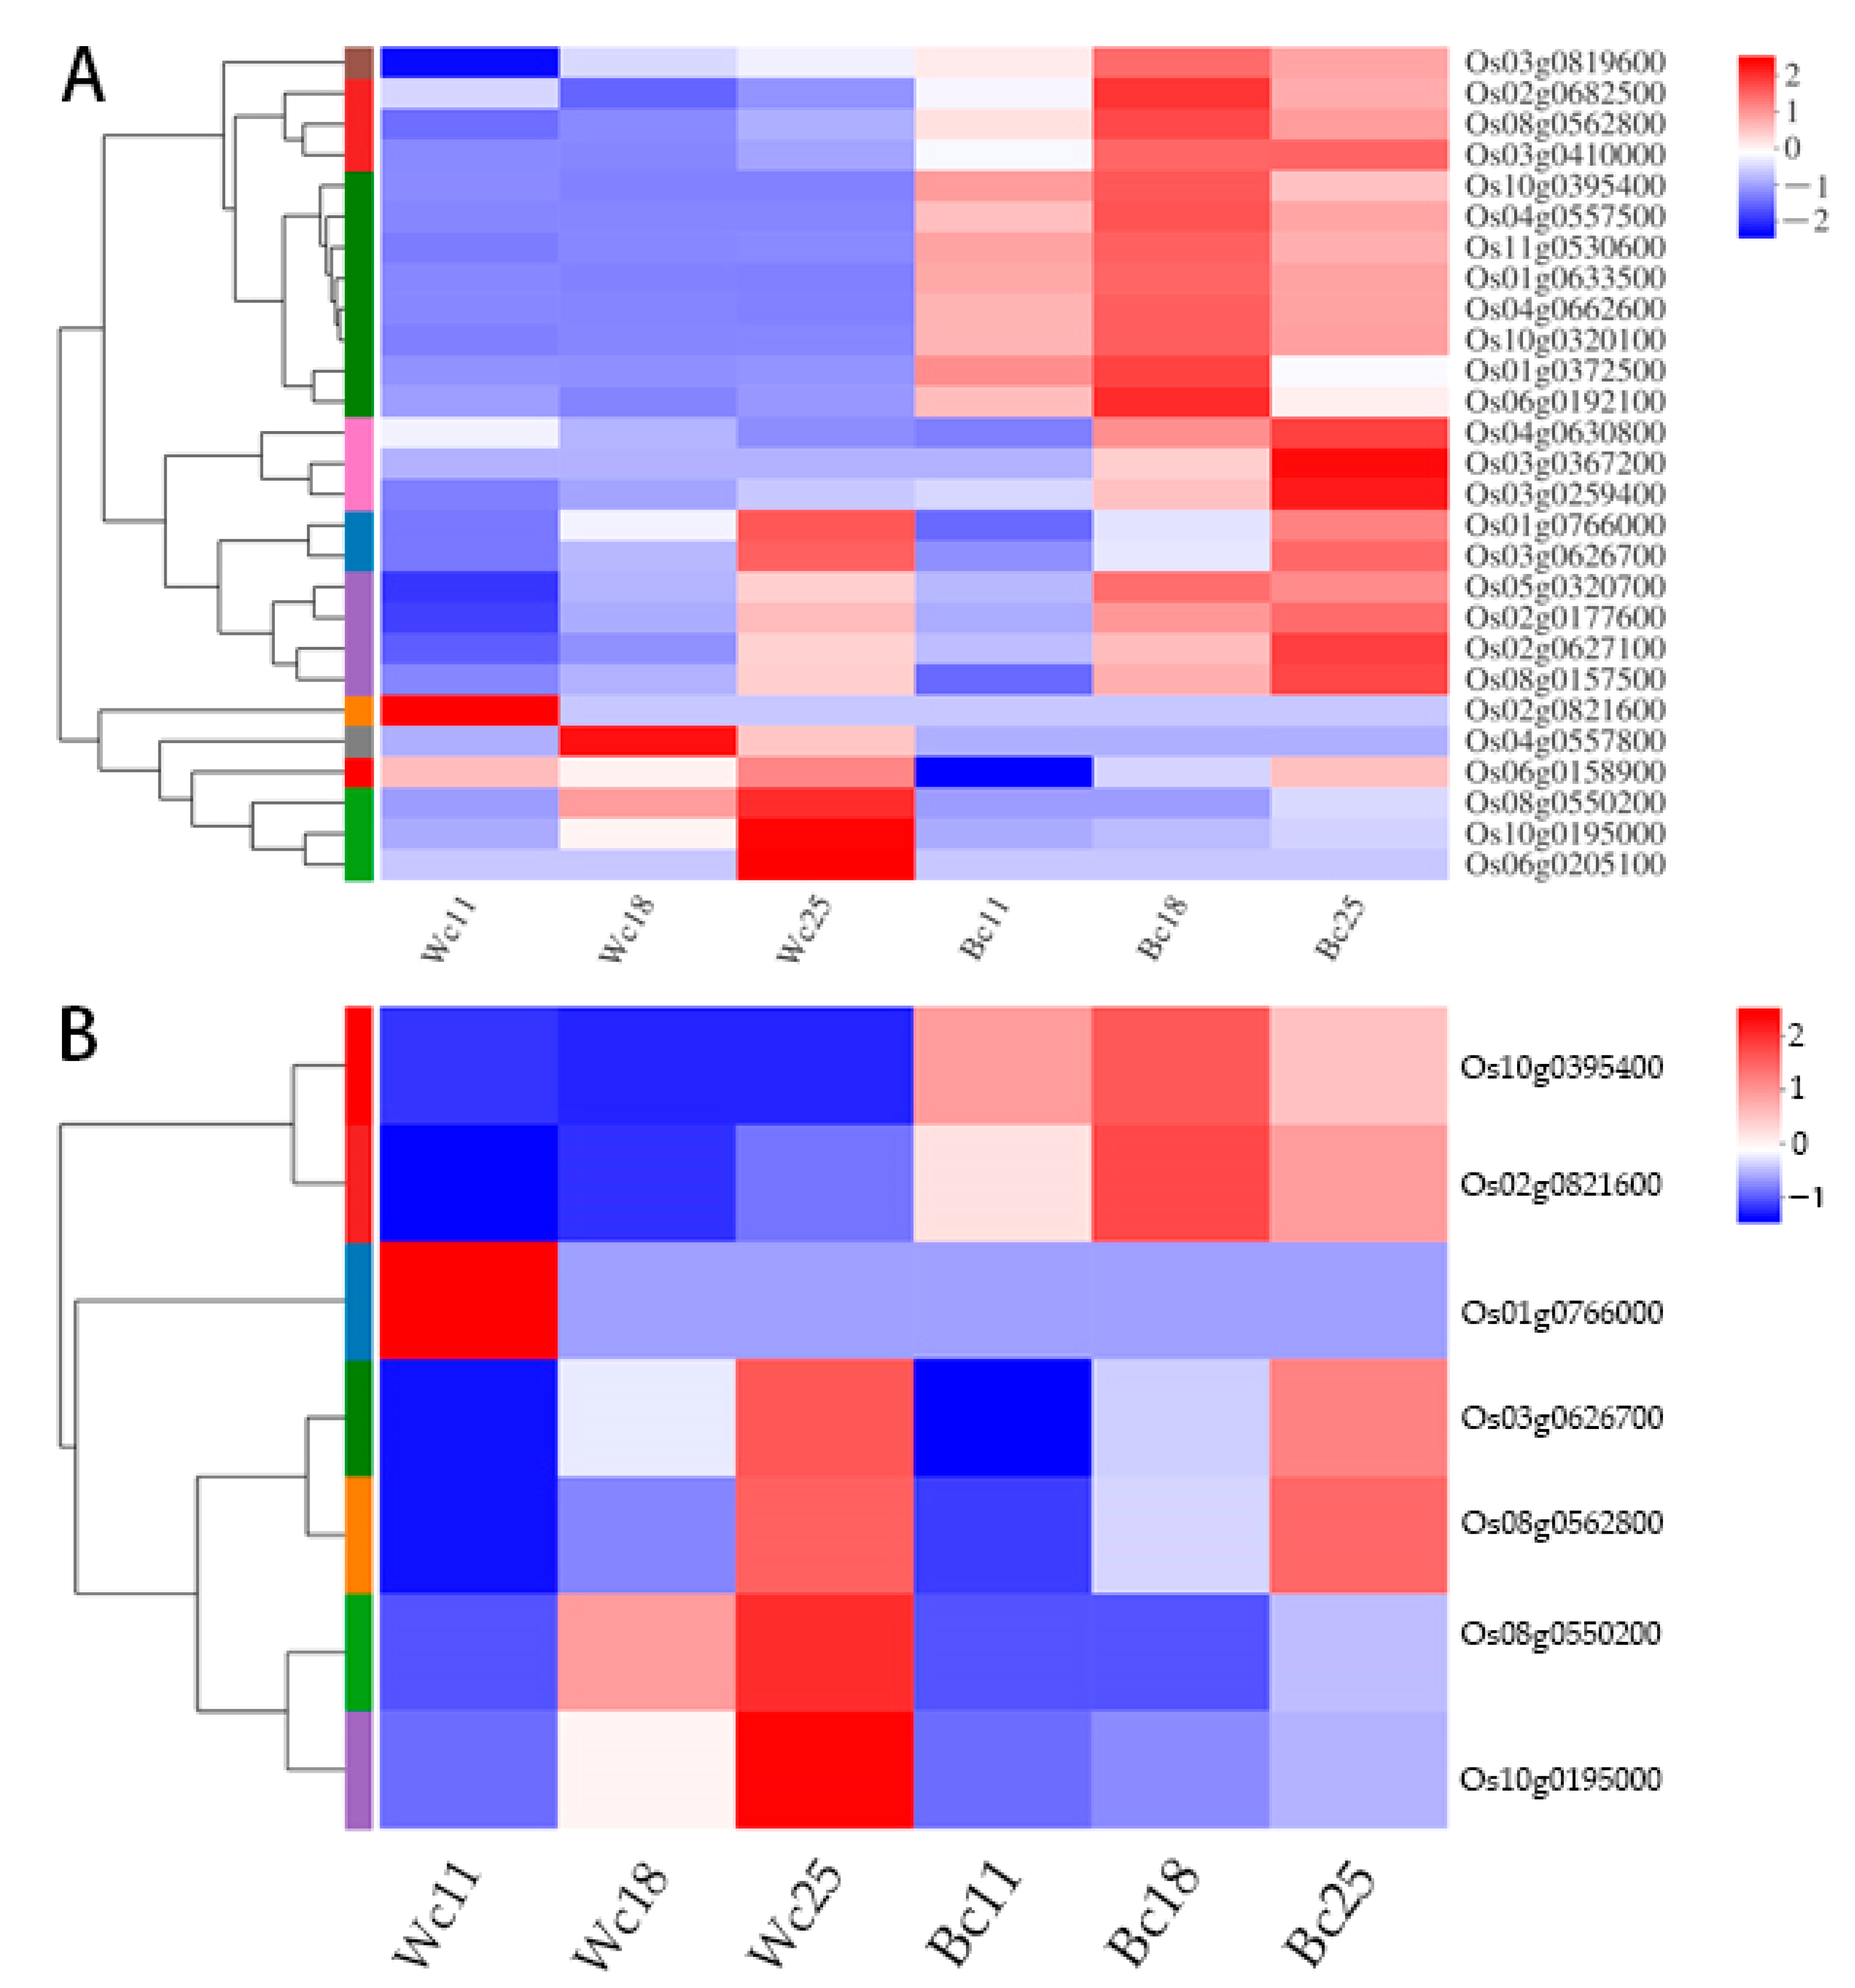
3.7. Expression of Anthocyanin Biosynthesis Genes and Transporters Genes in Rice Caryopsis

To further understand the implication of anthocyanin biosynthesis genes, and mainly transporter genes, in rice caryopsis, we carried out different pairwise comparison analysis Wc11 vs. Bc11, Wc18 vs. Bc18, and Wc25 vs. Bc25 of twenty-seven rice genes including fourteen anthocyanin structural genes, five regulatory genes, two well-known transporter genes, and six unknown genes putative transporters. The expression pattern was different. All fourteen structural genes were upregulated, three out of five structural genes were upregulated in Wc11 vs. Bc11, Wc18 vs. Bc18, and Wc25 vs. Bc25 with most of them highly significant (Supplementary file 2). These genes have been previously identified as key genes in anthocyanin biosynthesis pathways. The heatmap showed that most of these genes are mainly upregulated in black caryopsis and downregulated in white caryopsis (Figure 8A). The analysis of transporters’ genes indicated that among two known transporters (OsGSTU34 and OsABCC15/MRP15), OsGSTU34 was upregulated in Wc11 vs. Bc11, Wc18 vs. Bc18, and Wc25 vs. Bc25 with a significant difference, while OsABCC15 was downregulated. For the other six putative transporters (OsMATE33, OsMATE39, OsMATE16, OsMATE3, OsMATE7, and OsMATE34), OsMATE34 (Os08g0562800) was upregulated at all levels of comparison, Wc11 vs. Bc11, Wc18 vs. Bc18, and Wc25 vs. Bc25, with a significant difference. OsMATE3 (Os01g0766000), OsMATE7 (Os02g0821600), OsMATE33 (Os08g0550200), OsMATE39 (Os10g0195000) were downregulated, and the expressions did not show a significant difference. OsMATE16 (Os03g0626700) was upregulated in all comparisons but did not show a significant difference.
We performed the heatmap for these transporters and found that OsGSTU34 (Os10g0395400) and OsMATE34 (Os08g0562800) were significantly upregulated in black caryopsis and downregulated in white caryopsis whereas OsMATE3 (Os01g0766000) and OsMATE16 (Os03g0626700) were highly upregulated in black caryopsis 25 DAF but not in other developmental stages. Moreover, these four genes belonged to the same cluster with two different subclusters, subcluster 1 (OsGSTU34 and OsMATE34) and subcluster 2 (OsMATE3 and OsMATE16) (Figure 8B).

3.8. Validation of Transcriptome Data

We selected four genes—OsGSTU34, OsMRP15, OsMATE34, and OsMATE3—to analyze their expression pattern in all samples to validate the transcriptome experiment results (Figure 9). The RT-qPCR results indicated that the selected genes’ expression pattern was consistent with the RNA-seq data having similar expression trends despite the quantitative difference in expression level.

4. Discussion

During the last decade, advances in molecular science have greatly contributed to understanding the function of anthocyanin in the human body [60,61,62] and the plant itself [62,63,64], and the biosynthesis mechanism. Previous studies highlighted that anthocyanins produced on the surface of ER are stored in the tonoplast through two main mechanisms involving different transporters [26,65,66]. These transport mechanisms, compared to xenobiotic transport, ensure the detoxification of cells while playing ecological and physiological benefits and the main molecular actors involved in the transport are GST and tonoplast transporters [31,46,66]. MATE proteins play a noticeable role in rice for detoxification and may be implicated in increasing tolerance of pigmented and some non-pigmented rice against abiotic stress through a metabolite, alkaloid sequestration, hormone, and organic acid transport [67]. In the current study, we combined computational and transcriptome analysis to identify a putative MATE gene involved in anthocyanin transportation in rice caryopsis. The phylogenetic scrutiny is one of the fastest, simplest, and relatively most precise ways to predict gene function. It was reported that in rice and Arabidopsis the substrate specificity of most transporter proteins relates to phylogeny [68] and strong evidence has been provided previously in function prediction through phylogenetic analysis. Molecular phylogenetic analysis of MATE proteins was investigated by using the ML algorithm and 1000 bootstraps consensus to represent the evolutionary history. Two MATE proteins—OsMATE7 and OsMATE34—out of 16 selected from the previous study [34] were clustered in the same group with other six well-characterized anthocyanin MATE family including acylated anthocyanin VvAM1 and VvAM3 from V. vinifera [31,46], flavone glycoside or malonylated anthocyanin MtMATE2 from M. truncatula [47] SlMATE or MTP77 from S. lycopersicum [48], RsMATE8 from R. sativus [45], and AtFFT from A. thaliana [49] associated with glycosylated anthocyanin transportation. Sequence homology showed that OsMATE34 and OsMATE7 had the highest identity with MTP77/SlMATE, MtMATE2, AtFFT, RsMATE8, VvAM1, and VvAM3 ranging between 52.66 and 61%. Strikingly, OsMATE33 and OsMATE7 exhibited, respectively, 57% and 61.39% identity with AtFFT amino sequence associated with anthocyanin transportation in Arabidopsis thaliana. This result suggested that OsMATE7 and OsMATE34 may have the same function as previously identified AM.
The molecular characterization and structure of OsMATE7 and OsMATE34 revealed that the structures of these proteins were different. They were composed of 363 and 489 amino acid residues with a molecular weight of 38.74 and 51.6 kDa, respectively. The three-dimensional protein configuration showed a difference with OsMATE7 but a remarkably high similarity between OsMATE34 and the anthocyanin MATE-like proteins from homolog plants (Figure S4). The prediction of the transmembrane domain showed that unlike most AM including OsMATE34 that had 10–12 segments, OsMATE7 had only six segments. A previous study reported that the MATE family consisted of a unique topology predicted to have 10–12 TM helices with long, cytoplasmatic C and N termini [59]. Protein motif structure showed a complete difference between OsMATE7 with only eight motifs compared to other AM of the same clade including OsMATE34 that were 11 motifs. The physicochemical properties revealed that isoelectric point, aliphatic index, instability index, and GRAVY of VvAM1, VvAM3, MtMATE2, SlMATE/MTP77, RsMATE8, and AtFFT were similar and the values were very close to OsMATE34 relatively high compared to OsMATE7 with a lower value. This noticeable difference in MATE protein structures and properties, particularly OsMATE7 to OsMATE34 and other anthoMATEs, might be due to functional diversities that occurred during the evolution and suggested that OsMATE34 and OsMATE7 may have slightly different functions and expression pattern. Although VvAM1, VvAM3, MtMATE2, SlMATE/MTP77, RsMATE8, AtFFT, OsMATE7, and OsMATE34 belong to the same cluster, OsMATE34 was very close to AM from other plants regarding the molecular and structural analysis. Thus, it can be inferred that OsMATE34 is a putative anthocyanin transporter in rice and may have the same function as the other well-characterized AM reported in different plants.
To confirm the role of OsMATE34, we carried out transcriptome analysis of black and white rice caryopsis at different developmental stages. The result revealed differential expression of anthocyanin biosynthesis genes. Although the two cultivars were black rice, the difference between them relied on the caryopsis color mainly their pericarp color. Caryopsis is the most important part of rice as a staple food. The pairwise comparison showed that the number of DEGs was higher in black caryopsis than white caryopsis and the anthocyanin biosynthesis genes were upregulated in black rice with high expression observed 18 DAF. Meanwhile, the quantification of anthocyanin in black rice caryopsis revealed that the concentration of the two majors rice anthocyanin C3G and P3G attained their peaks at 18 DAF (Figure S1) and started to decrease after this period. This result demonstrated a positive correlation between gene expression peculiarly OsMATE34 and the accumulation of anthocyanin in the rice caryopsis. Our results were consistent with the previous studies reporting that in black rice caryopsis, anthocyanin was found in the bran in high amounts and accumulates progressively mainly inside the pericarp from 7 DAF, then inside the testa and aleurone layer after 15–30 DAF [7,15]. Likewise, the expression of all anthocyanin related-genes was upregulated and attained their peak after about 13 DAF [69]. In the current experiment, most of these genes and transcriptome factors mainly Kala4 coding for bHLH transcriptome factors, Kala3 and OsC1 coding for Myb transcriptome factor, and WD40 were upregulated and the log2FC of Bc vs. Wc showed that the difference was greatly significant during these three periods (Table S6). This result is in line with other studies showing that the structural genes for anthocyanin accumulation in black rice (OsPAL, OsCHS, OsCHI, OsF3H, OsDFR, OsANS/LDOX, and ANS OsUFGT/Os3GT) and OsADR function as a single unit activated by a transcription factor complex MYB-bHLH-WD40 (MBW) [69,70,71,72]. GO and KEGG enrichment indicated that the flavonoid metabolic process (GO:0009812) was the predominant biological process, and most of these activities were expressed in the vacuole and aleurone grain, suggesting that most processes at these stages of development occurred inside the vacuole and in the aleurone layer. These results corroborated with some previous studies showing that anthocyanin accumulated in the aleurone layer of caryopsis [15,73] and the vacuole of the cells [65,66]. The metabolism pathways and flavonoid biosynthesis pathways (KEGG: map 00941) were particularly enriched. It was reported that anthocyanin and proanthocyanins are synthesized through the flavonoid biosynthesis pathway [74,75], suggesting that anthocyanin biosynthesis was the most predominant physiological activity at these growing and developmental periods. We reasonably speculated that these various physiological activities and the flavonoid biosynthesis genes governed the metabolic differences that have been observed and would have influenced DEGs.
The eight transporter genes (OsMRP15, OsGSTU34, OsMATE33, OsMATE39, OsMATE16, OsMATE3, OsMATE7, and OsMATE34) investigated in this transcriptome analysis showed different expression pattern. OsGSTU34 and OsMATE34 were significantly upregulated at all stages (11 DAF, 18 DAF, and 25 DAF) and the result indicated that the difference in their expression was significant between black caryopsis and white caryopsis. For both genes, the highest expressions were observed 18 DAF in black caryopsis and decreasing at 25 DAF. This result was consistent with the RT-qPCR (Figure 9). The differential expression clusters analysis showed that OsGSTU34 and OsMATE34 had the same expression pattern and cluster with nine main anthocyanin biosynthesis genes that were also upregulated in this study (Figure 8B). In a previous study, Ma and colleagues [32] elucidated the role of OsGSTU34 genes encoding glutathione-s-transferase and OsMRP15 in anthocyanin accumulation through CRISPR/Cas 9 genome targeting, an induced mutation of OsGSTU34 and OsMRP15 results in the loss of function of purple leaves coloration. This result indicated the role of OsGSTU34 and MRP15 in anthocyanin biosynthesis. As reported by Martinoia and co-authors [76,77], ABC-type transporters recognized and sequestered the glutathione conjugates to the vacuoles or exported them to the cell wall. However, our results indicated that the expression of both OsGSTU34 and OsMRP15 was completely different and OsGSTU34 was upregulated in black caryopsis but not in white caryopsis. Unlike OsGSTU34, OsMRP15 was downregulated in black and white caryopsis, suggesting that the OsMRP15 gene may not be expressed in the caryopsis as it does in purple leaves and that the functions of both genes are not strictly linked. The function of OsMRP15 in the transport of anthocyanin in rice leaves would be taken over by OsMATE34 in rice caryopsis as the MATE transporters possess a membrane transport function. Moreover, OsGSTU34 and OsMATE34 had the same expression pattern at all developmental stages. Taken together, it is obvious to say that OsMATE34 may have the same function as OsGSTU34 and plays the central role in the sequestration of anthocyanin inside the vacuole. Consequently, it could be involved in the anthocyanin transportation in rice, mainly in rice caryopsis.
OsMATE34 is a gene consisting of three exons and two introns. Its protein sequence is a long chain of 489 amino acids with a molecular weight of 51.6 kDa; 12 TM was topologically revealed, and the secondary structure predicted α-helix, extended strand, β-turn, and random coil, helices that were identified with a functional opening to achieve the function of transport of molecule. This conforms with Yazaki and co-workers [78] reporting on the primary feature of the MATE family. The function and properties of proteins essentially rely on their physiochemical properties and proteins with good properties can sustain unfavorable conditions and function properly. OsMATE34 has the same characteristics as anthocyanin Mate-like proteins. In silico analysis showed that the computing value of the PI was 5.6 similar to MtMATE2 suggesting that this protein is acidic. Likewise, AI was very close to that of VvAM3 with, respectively, 116.93 and 116.06. This value is greater than the reference value revealed that OsMATE34 is highly thermostable. It was reported that AI of a globular protein determines their thermostability; values greater than 65 are considered thermostable, and the higher the AI, the more stable the proteins are [79]. Moreover, the I.I range to 32.98 similar to that of AtFFT (33.84). This suggested that it can chaperone plants, maintaining the physiological function, and protecting against specific cellular stress that can lead to protein denaturation. The solubility of OsMATE34 was analyzed through the GRAVY.to predict water and protein interaction, also qualified and quantified the hydrophobic and hydrophilic property of the protein. A positive value indicates hydrophobic protein. Our results indicated that this protein is hydrophobic, similar to other anthocyanin transporters of MATE type, and the score ranges to 0.746, the same as with AtTT12. These similarities found between OsMATE34 and the previous AM can presume similar substrates, thus the same function can be inferred. From the current study, it can be seen that AM proteins are acidic, highly stable, and hydrophobic.
The basic information about MATE protein localization predicted that OsMATE34 is localized to the plasma membrane and in the tonoplast. This result corroborated with the previous studies showing that VvAM1, VvAM2, and VvMATE1, responsible for anthocyanin transportation in grapevines, were localized in the tonoplast [31,52]. Besides, the function of the transporter gene is determined by its subcellular localization [57]. It was reported that the MATE proteins are mainly localized on either the plasma membrane or vacuolar membrane. When located to the plasma membrane, it participates to exit the substrate out of the cell in exchange for H+, while when located to the vacuolar membrane, it enhances the uptake of the substrate due to the pH gradient which is basic in the cytoplasm (7–7.4) and acid in the vacuole (5.5) [80]. The MATE proteins are a component of flavonoid biosynthetic pathway transporters that combine the transport of intended molecules across an H+ or Na+ electrochemical gradient of ions [78]. The possible localization of OsMATE34 to the vacuolar membrane suggested its implication in the transportation of anthocyanin inside the vacuolar lumen. OsMATE34 was reported as a homolog of AtTT12 found across vacuolar membrane mediating the membrane transport of C3G and C3G derivatives [81], which generally occupied approximately 65–90% of anthocyanin found in rice and 90% in the cultivar used in this study. Similarly, MTP77, a homolog of AtTT12, was identified in the vacuole as a putative anthocyanin transporter in tomato [48]. Like most secondary metabolites, it is necessary for anthocyanins produced in the cytoplasm to be delivered into the vacuole because they may be toxic to the plant. Therefore, to avoid harmful effects and improve the efficiency of their production, they need to be sequestrated in the vacuolar lumen [82,83]. The MATE protein family, peculiarly OsMATE34 along with OsGSTU34, may play a central role for anthocyanin sequestration in the vacuole of rice caryopsis cells.

5. Conclusions

This study aimed to identify and characterize the MATE transporter involved in anthocyanin transportation in rice, mainly in rice caryopsis. Based on the computational and transcriptome results, we suggested that OsMATE34 (Os08g0562800) along with OsGSTU34 (Os10g0395400) were involved in anthocyanin transportation in black rice caryopsis. OsMATE34 was reported as a homolog of AtTT12 and AtFFT found across the vacuolar membrane mediating the membrane transport of C3G, which is the main anthocyanin found in rice caryopsis. Protein localization predicted that OsMATE34 was localized in the plasma membrane and vacuole. Thus, it can be reasonably inferred that OsMATE34 plays a central role in the anthocyanin sequestration in the vacuole of rice caryopsis cells. As transporters are the major players in the trafficking of anthocyanins, this finding is a clue to enhance the accumulation of anthocyanin in rice caryopsis and the endosperm. This study is the first to highlight MATE-type transporters in the accumulation of anthocyanins in rice caryopsis. However, a further study is currently being carried out to thoroughly understand by which transport mechanism OsMATE34 is involved in anthocyanin transportation and the possible interaction with GST transporters.

Supplementary Materials

The following are available online at https://0-www-mdpi-com.brum.beds.ac.uk/article/10.3390/genes12040583/s1. Table S1: Primers used for RT-qPCR analysis; Table S2: Physiochemical property of MATE proteins; Table S3: The differentially conserved motif of MATE gene family; Table S4: Similarity index and identity; Table S5: The basic information about MATE protein localization; Table S6: Expression pattern of anthocyanin biosynthesis and transporter genes based on fold-change levels in Bc and Wc; Figure S1: Anthocyanin quantification in black rice caryopsis at different developmental stages; Figure S2: Secondary structures of the 6 rice MATEs proteins and 7 anthocyanin MATEs-like proteins predicted by SOPMA; Figure S3: Topological analysis of OsMATEs; Figure S4: Comparison of the three-dimensional configuration of two putative OsMATEs and six anthoMATEs. File S1: GO and KEGG pathway analysis; File S2: Differentially expressed genes of anthocyanin biosynthesis pathway analysis and function; File S3: Quality control protocol of RNA-sequencing analysis.

Author Contributions

Conceptualization, E.M. and P.L.; Data curation, E.M., Y.M., Y.Z., and, B.U.; Formal analysis, E.M., Y.M., Y.Z., and, G.C.J.D.E.M.; Funding acquisition, P.L.; Investigation, E.M., G.C.J.D.E.M., Y.M., Q.L., and Y.Z.; Methodology, E.M., Y.M., G.C.J.D.E.M., and, B.U.; Project administration, P.L.; Resources, P.L.; Software, E.M. and Y.M.; Supervision, P.L.; Validation, E.M., Y.M., and P.L.; Visualization, P.L.; Writing—original draft, E.M.; Writing—review and editing, E.M., Y.M., G.C.J.D.E.M., B.U., Q.L., Y.Z., and P.L. All authors have read and agreed to the published version of the manuscript.

Funding

This work and APC were funded by the national R&D Priority Program-Breeding New Rice Varieties for Southern China Area (2017YFD0100100).

Institutional Review Board Statement

Not applicable.

Informed Consent Statement

Not applicable.

Data Availability Statement

Raw data can be provided to researchers on request to the corresponding or first author.

Acknowledgments

We are thankful to Saif Ur Rehman for his guidance in computational analysis and Moses Elleason for the proofreading.

Conflicts of Interest

The authors declare no conflict of interest.

Abbreviations

AIAliphatic Index
ABCATP-Binding Cassette
AMAnthoMATE
AVIAnthocyanic Vacuolar Inclusion
bHLHBasic helix-loop-helix
BcBlack Caryopsis
C3GCyanidin-3-O-Glucoside
DEGsDifferentially Expressed Genes
DAFDays After Flowering
EREndoplasmic Reticulum
FDRFalse Discovery Rate
FWFresh Weight
GSTGlutathione-S-Transferase
GOGene Ontology
GRAVYGRAND Average of Hydropathicity Index
HMMTOPHidden Markov Model Topology
HPLCHigh-Performance Liquid Chromatography
I.IInstability Index
JTTJones–Taylor–Thornton
KALAKey Activator Loci for Anthocyanin
KEGGKyoto Encyclopedia of Genes and Genomes
LTLigandin Transportations
MATEMultidrug and Toxic Compound Extrusion
MEMEMultiple Expectation Maximization for Motif Elicitation
MLMaximum Likelihood
MRPMultidrug Resistance-associated Proteins
MWMolecular Weight
P3GPeonidin-3-O-Glucoside
PVCPre-vacuolar Compartment
RSEMRNA sequence by expectation maximization
ROSReactive Oxygen Species
SOPMASelf-Optimized Prediction Method from Alignment
TACTotal Anthocyanin Content
TMHMMTransmembrane Helices Hidden Markov Model
TPMTranscripts Per Million
VTVesicular Transport
WcWhite Caryopsis

References

  1. Ali, I.; He, L.; Ullah, S.; Quan, Z.; Wei, S.; Iqbal, A.; Munsif, F.; Shah, T.; Xuan, Y.; Luo, Y.; et al. Biochar addition coupled with nitrogen fertilization impacts on soil quality, crop productivity, and nitrogen uptake under double-cropping system. Food Energy Secur. 2020, 9, e208. [Google Scholar] [CrossRef]
  2. Ranganathan, J.; Waite, R.; Searchinger, T.; Hanson, C. How to Sustainably Feed 10 Billion People by 2050, in 21 Charts. World Res. Ins. 2018. Available online: https://www.wri.org/blog/2018/12/how-sustainably-feed-10-billion-people-2050-21-.charts (accessed on 10 April 2020).
  3. Mbanjo, E.G.N.; Kretzschmar, T.; Jones, H.; Ereful, N.; Blanchard, C.; Boyd, L.A.; Sreenivasulu, N. The Genetic Basis and Nutritional Benefits of Pigmented Rice Grain. Front. Genet. 2020, 11, 229. [Google Scholar] [CrossRef] [Green Version]
  4. Terungwa, T.I.; Yuguda, M. The impact of rice production, consumption and importation in Nigeria: The political economy perspectives. Int. J. Sustain. Dev. World Policy 2014, 3, 90–99. [Google Scholar]
  5. Hao, J.; Zhu, H.; Zhang, Z.; Yang, S.; Li, H. Identification of anthocyanins in black rice (Oryza sativa L.) by UPLC/Q-TOF-MS and their in-vitro and in-vivo antioxidant activities. J. Cereal Sci. 2015, 64, 92–99. [Google Scholar] [CrossRef]
  6. Das, A.B.; Goud, V.; Das, C. Extraction of phenolic compounds and anthocyanin from black and purple rice bran (Oryza sativa L.) using ultrasound: A comparative analysis and phytochemical profiling. Ind. Crops Prod. 2017, 95, 332–341. [Google Scholar] [CrossRef]
  7. Jiamyangyuen, S.; Nuengchamnong, N.; Ngamdee, P. Bioactivity and chemical components of Thai rice in five stages of grain development. J. Cereal Sci. 2017, 74, 136–144. [Google Scholar] [CrossRef]
  8. Hemamalini, S.; Umamaheswari, D.S.; Lavanya, D.R.; Umamaheswara, R.D.C. Exploring the therapeutic potential and nutritional properties of’KaruppuKavuni’variety rice of Tamil Nadu. Int. J. Pharma Bio Sci. 2018, 9, 88–96. [Google Scholar] [CrossRef]
  9. Konczak, I.; Zhang, W. Anthocyanins—more than nature’s colours. J. Biomed. Biotechnol. 2004, 239–240. [Google Scholar] [CrossRef] [PubMed] [Green Version]
  10. Yazhen, S.; Wenju, W.; Panpan, Z.; Yuanyuan, Y.; Panpan, D.; Wusen, Z.; Yanling, W. Anthocyanins: Novel Antioxidants in Diseases Prevention and Human Health. In Flavonoids—A Coloring Model for Cheering up Life; IntechOpen: London, UK, 2019. [Google Scholar] [CrossRef] [Green Version]
  11. Chen, P.-N.; Chu, S.-C.; Chiou, H.-L.; Chiang, C.-L.; Yang, S.-F.; Hsieh, Y. Cancer, Cyanidin 3-glucoside and peonidin 3-glucoside inhibit tumor cell growth and induce apoptosis in vitro and suppress tumor growth in vivo. J. Nutr. 2005, 53, 232–243. [Google Scholar] [CrossRef]
  12. Luo, L.-P.; Han, B.; Yu, X.-P.; Chen, X.-Y.; Zhou, J.; Chen, W.; Zhu, Y.-F.; Peng, X.-L.; Zou, Q.; Li, S.-Y. Anti-metastasis activity of black rice anthocyanins against breast cancer: Analyses using an ErbB2 positive breast cancer cell line and tumoral xenograft model. Asian Pac. J. Cancer Prev. 2014, 15, 6219–6225. [Google Scholar] [CrossRef] [Green Version]
  13. Pojer, E.; Mattivi, F.; Johnson, D.; Stockley, C. The case for anthocyanin consumption to promote human health: A review. Compr. Rev. Food Sci. Food Saf. 2013, 12, 483–508. [Google Scholar] [CrossRef] [PubMed]
  14. Turturică, M.; Oancea, A.; Râpeanu, G.; Bahrim, G. Anthocyanins: Naturally occuring fruit pigments with functional properties. Ann. Univ. Dunarea Jos Galati Fascicle VI-Food Technol. 2015, 39, 100513018. [Google Scholar]
  15. Goufo, P.; Trindade, H. Rice antioxidants: Phenolic acids, flavonoids, anthocyanins, proanthocyanidins, tocopherols, tocotrienols, γ-oryzanol, and phytic acid. Food Sci. Nutr. 2014, 2, 75–104. [Google Scholar] [CrossRef] [PubMed]
  16. Gould, K. Nature’s Swiss army knife: The diverse protective roles of anthocyanins in leaves. J. Biomed. Biotechnol. 2004, 2004, 314–320. [Google Scholar] [CrossRef] [PubMed] [Green Version]
  17. Lamberts, L.; De Bie, E.; Vandeputte, G.E.; Veraverbeke, W.S.; Derycke, V.; De Man, W.; Delcour, J.A. Effect of milling on colour and nutritional properties of rice. Food Chem. 2007, 100, 1496–1503. [Google Scholar] [CrossRef]
  18. Reddy, C.K.; Kimi, L.; Haripriya, S.; Kang, N. Effects of polishing on proximate composition, physico-chemical characteristics, mineral composition and antioxidant properties of pigmented rice. Rice Sci. 2017, 24, 241–252. [Google Scholar] [CrossRef]
  19. Chen, M.-H.; McClung, A.M.; Bergman, C.J. Phenolic content, anthocyanins and antiradical capacity of diverse purple bran rice genotypes as compared to other bran colors. J. Cereal Sci. 2017, 77, 110–119. [Google Scholar] [CrossRef]
  20. Koes, R.; Verweij, W.; Quattrocchio, F. Flavonoids: A colorful model for the regulation and evolution of biochemical pathways. Trends Plant Sci. 2005, 10, 236–242. [Google Scholar] [CrossRef] [PubMed]
  21. Mackon, E.; Mackon, G.J.D.E.; Ma, Y.; Kashif, M.H.; Ali, N.; Usman, B.; Liu, P. Recent insights into Anthocyanin Pigmentation, Synthesis, Trafficking, and Regulatory Mechanisms in Rice (Oryza sativa L.) Caryopsis. Biomolecules 2021, 11, 394. [Google Scholar] [CrossRef] [PubMed]
  22. Winkel-Shirley, B. Flavonoid biosynthesis. A colorful model for genetics, biochemistry, cell biology, and biotechnology. J. Plant Physiol. 2001, 126, 485–493. [Google Scholar] [CrossRef] [Green Version]
  23. Zhu, Q.; Yu, S.; Zeng, D.; Liu, H.; Wang, H.; Yang, Z.; Xie, X.; Shen, R.; Tan, J.; Li, H. Development of “purple endosperm rice” by engineering anthocyanin biosynthesis in the endosperm with a high-efficiency transgene stacking system. Mol. Plant 2017, 10, 918–929. [Google Scholar] [CrossRef] [Green Version]
  24. Kitamura, S. Transport of flavonoids: From cytosolic synthesis to vacuolar accumulation. In The Science of Flavonoids; Springer: New York, NY, USA, 2006; pp. 123–146. [Google Scholar] [CrossRef]
  25. Grotewold, E. The genetics and biochemistry of floral pigments. Annu. Rev. Plant Biol. 2006, 57, 761–780. [Google Scholar] [CrossRef]
  26. Grotewold, E.; Davies, K. Trafficking and sequestration of anthocyanins. Nat. Prod. Commun. 2008, 3. [Google Scholar] [CrossRef] [Green Version]
  27. Mueller, L.A.; Goodman, C.D.; Silady, R.A.; Walbot, V. AN9, a petunia glutathione S-transferase required for anthocyanin sequestration, is a flavonoid-binding protein. J. Plant Physiol. 2000, 123, 1561–1570. [Google Scholar] [CrossRef] [Green Version]
  28. Sun, Y.; Li, H.; Huang, J.-R. Arabidopsis TT19 functions as a carrier to transport anthocyanin from the cytosol to tonoplasts. Mol. Plant 2012, 5, 387–400. [Google Scholar] [CrossRef]
  29. Jasinski, M.; Ducos, E.; Martinoia, E.; Boutry, M. The ATP-Binding Cassette Transporters: Structure, Function, and Gene Family Comparison between Rice and Arabidopsis. J. Plant Physiol. 2003, 131, 1169–1177. [Google Scholar] [CrossRef] [Green Version]
  30. Goodman, C.D.; Casati, P.; Walbot, V. A multidrug resistance–associated protein involved in anthocyanin transport in Zea mays. Plant Cell 2004, 16, 1812–1826. [Google Scholar] [CrossRef] [PubMed] [Green Version]
  31. Gomez, C.; Conejero, G.; Torregrosa, L.; Cheynier, V.; Terrier, N.; Ageorges, A. In vivo grapevine anthocyanin transport involves vesicle-mediated trafficking and the contribution of anthoMATE transporters and GST. Plant J. 2011, 67, 960–970. [Google Scholar] [CrossRef] [PubMed]
  32. Ma, X.; Zhang, Q.; Zhu, Q.; Liu, W.; Chen, Y.; Qiu, R.; Wang, B.; Yang, Z.; Li, H.; Lin, Y. A robust CRISPR/Cas9 system for convenient, high-efficiency multiplex genome editing in monocot and dicot plants. J. Mol. Plant 2015, 8, 1274–1284. [Google Scholar] [CrossRef] [PubMed]
  33. Zhu, Q.-L.; Xie, X.-R.; Zhang, J.; Xiang, G.; Li, Y.; Wu, H.-B. In Silico Analysis of a MRP Transporter Gene Reveals Its Possible Role in Anthocyanins or Flavonoids Transport in Oryza sativa. Am. J. Plant Sci. 2013, 4. [Google Scholar] [CrossRef] [Green Version]
  34. Huang, J.; An, W.; Wang, K.; Jiang, T.; Ren, Q.; Liang, W.; Wang, H. Expression profile analysis of MATE gene family in rice. Biol. Plant 2019, 63, 556–564. [Google Scholar] [CrossRef] [Green Version]
  35. He, Z.; Zhang, H.; Gao, S.; Lercher, M.J.; Chen, W.H.; Hu, S. Evolview v2: An online visualization and management tool for customized and annotated phylogenetic trees. Nucleic Acids Res. 2016, 44, W236–W241. [Google Scholar] [CrossRef] [PubMed]
  36. The MEME Continued. Available online: http://meme-suite.org/ (accessed on 14 August 2020).
  37. HISAT: A Fast Spliced Aligner with Low Memory Requirements. Available online: http://0-ccb-jhu-edu.brum.beds.ac.uk/software/hisat2/index.shtml (accessed on 10 December 2020).
  38. StringTie Enables Improved Reconstruction of a Transcriptome from RNA-Seq Reads. Available online: https://0-ccb-jhu-edu.brum.beds.ac.uk/software/stringtie/index.shtml?t=example (accessed on 16 December 2020).
  39. RSEM: Accurate Transcript Quantification from RNA-Seq Data with or without a Reference Genome. Available online: http://deweylab.biostat.wisc.edu/rsem/ (accessed on 20 December 2020).
  40. Love, M.I.; Huber, W.; Anders, S. Moderated estimation of fold change and dispersion for RNA-seq data with DESeq2. Genome Biol. 2014, 15, 550. [Google Scholar] [CrossRef] [PubMed] [Green Version]
  41. GOATOOLS: Tools for Gene Ontology (version v0.6.5). Available online: https://github.com/tanghaibao/GOatools (accessed on 5 January 2021).
  42. Pearson, W.R. An introduction to sequence similarity (“homology”) searching. Curr. Protoc. Bioinform. 2013, 42, 3.1.1–3.1.8. [Google Scholar] [CrossRef] [PubMed]
  43. Rogers, E.E.; Guerinot, M.L. FRD3, a member of the multidrug and toxin efflux family, controls iron deficiency responses in Arabidopsis. Plant Cell 2002, 14, 1787–1799. [Google Scholar] [CrossRef] [PubMed] [Green Version]
  44. Tiwari, M.; Sharma, D.; Singh, M.; Tripathi, R.D.; Trivedi, P.K. Expression of OsMATE1 and OsMATE2 alters development, stress responses and pathogen susceptibility in Arabidopsis. Sci. Rep. 2002, 4, 3964. [Google Scholar] [CrossRef] [Green Version]
  45. M’mbone, M.E.; Cheng, W.; Xu, L.; Wang, Y.; Karanja, B.K.; Zhu, X.; Liu, L. Identification and transcript analysis of MATE genes involved in anthocyanin transport in radish (Raphanus sativus L). Sci. Hortic. 2018, 238, 195–203. [Google Scholar] [CrossRef]
  46. Gomez, C.; Terrier, N.; Torregrosa, L.; Vialet, S.; Fournier-Level, A.; Verries, C.; Souquet, J.-M.; Mazauric, J.-P.; Klein, M.; Cheynier, V. Grapevine MATE-type proteins act as vacuolar H+-dependent acylated anthocyanin transporters. J. Plant Physiol. 2009, 150, 402–415. [Google Scholar] [CrossRef] [Green Version]
  47. Zhao, J.; Huhman, D.; Shadle, G.; He, X.-Z.; Sumner, L.W.; Tang, Y.; Dixon, R.A. MATE2 mediates vacuolar sequestration of flavonoid glycosides and glycoside malonates in Medicago truncatula. Plant Cell 2011, 23, 1536–1555. [Google Scholar] [CrossRef] [Green Version]
  48. Mathews, H.; Clendennen, S.K.; Caldwell, C.G.; Liu, X.L.; Connors, K.; Matheis, N.; Wagner, D.R. Activation tagging in tomato identifies a transcriptional regulator of anthocyanin biosynthesis, modification, and transport. Plant Cell 2003, 15, 1689–1703. [Google Scholar] [CrossRef] [PubMed] [Green Version]
  49. Thompson, E.P.; Wilkins, C.; Demidchik, V.; Davies, J.M.; Glover, B.J. An Arabidopsis flavonoid transporter is required for anther dehiscence and pollen development. J. Exp. Bot. 2010, 61, 439–451. [Google Scholar] [CrossRef] [PubMed] [Green Version]
  50. Debeaujon, I.; Peeters, A.J.; Léon-Kloosterziel, K.M.; Koornneef, M. The TRANSPARENT TESTA12 gene of Arabidopsis encodes a multidrug secondary transporter-like protein required for flavonoid sequestration in vacuoles of the seed coat endothelium. Plant Cell 2001, 13, 853–871. [Google Scholar] [CrossRef] [PubMed] [Green Version]
  51. Chai, Y.; Lei, B.; Huang, H.L.; Li, J.N.; Yin, J.M.; Tang, Z.L.; Wang, R.; Chen, L. TRANSPARENT TESTA 12 genes from Brassica napus and parental species: Cloning, evolution, and differential involvement in yellow seed trait. Mol. Genet. Genom. 2009, 281, 109–123. [Google Scholar] [CrossRef] [PubMed]
  52. Perez-Diaz, R.; Ryngajllo, M.; Perez-Diaz, J.; Peña-Cortés, H.; Casaretto, J.A.; González-Villanueva, E.; Ruiz-Lara, S. VvMATE1 and VvMATE2 encode putative proanthocyanidin transporters expressed during berry development in Vitis vinifera L. Plant Cell Rep. 2014, 33, 1147–1159. [Google Scholar] [CrossRef]
  53. Zhao, J.; Dixon, R.A. MATE transporters facilitate vacuolar uptake of epicatechin 3′-O-glucoside for proanthocyanidin biosynthesis in Medicago truncatula and Arabidopsis. Plant Cell 2009, 21, 2323–2340. [Google Scholar] [CrossRef] [PubMed] [Green Version]
  54. Frank, S.; Keck, M.; Sagasser, M.; Niehaus, K.; Weisshaar, B.; Stracke, R. Two differentially expressed MATE factor genes from apple complement the Arabidopsis transparent testa12 mutant. Plant Biol. 2011, 13, 42–50. [Google Scholar] [CrossRef] [PubMed]
  55. Chen, S.-Y.; Tang, Y.-M.; Hu, Y.-Y.; Wang, Y.; Sun, B.; Wang, X.-R.; Tang, H.-R.; Chen, Q. FaTT12-1, a multidrug and toxin extrusion (MATE) member involved in proanthocyanidin transport in strawberry fruits. Sci. Hortic. 2018, 231, 158–165. [Google Scholar] [CrossRef]
  56. Min, X.; Jin, X.; Liu, W.; Wei, X.; Zhang, Z.; Ndayambaza, B.; Wang, Y. Transcriptome-wide characterization and functional analysis of MATE transporters in response to aluminum toxicity in Medicago sativa L. PeerJ 2019, 7, e6302. [Google Scholar] [CrossRef] [Green Version]
  57. Chen, L.; Liu, Y.; Liu, H.; Kang, L.; Geng, J.; Gai, Y.; Ding, Y.; Sun, H.; Li, Y. Identification andexpression analysis of MATE genes involved in flavonoid transport in blueberry plants. PLoS ONE 2015, 10, e0118578. [Google Scholar] [CrossRef] [Green Version]
  58. Liu, J.; Li, Y.; Wang, W.; Gai, J.; Li, Y. Genome-wide analysis of MATE transporters and expression patterns of a subgroup of MATE genes in response to aluminum toxicity in soybean. BMC Genom. 2016, 17, 1–15. [Google Scholar] [CrossRef] [Green Version]
  59. Darbani, B.; Motawia, M.S.; Olsen, C.E.; Nour-Eldin, H.H.; Møller, B.L.; Rook, F. The biosynthetic gene cluster for the cyanogenic glucoside dhurrin in Sorghum bicolor contains its co-expressed vacuolar MATE transporter. Sci. Rep. 2016, 6, 37079. [Google Scholar] [CrossRef] [PubMed] [Green Version]
  60. Smeriglio, A.; Barreca, D.; Bellocco, E.; Trombetta, D. Chemistry, pharmacology and health benefits of anthocyanins. Phytother. Res. 2016, 30, 1265–1286. [Google Scholar] [CrossRef] [PubMed]
  61. Khoo, H.E.; Azlan, A.; Tang, S.T.; Lim, S.M. Anthocyanidins and anthocyanins: Colored pigments as food, pharmaceutical ingredients, and the potential health benefits. Food Nutr. Res. 2017, 61, 1361779. [Google Scholar] [CrossRef] [PubMed] [Green Version]
  62. Landi, M.; Tattini, M.; Gould, K.S. Multiple functional roles of anthocyanins in plant-environment interactions. Environ. Exp. Bot. 2015, 119, 4–17. [Google Scholar] [CrossRef]
  63. Chunthaburee, S.; Sakuanrungsirikul, S.; Wongwarat, T.; Sanitchon, J.; Pattanagul, W.; Theerakulpisut, P. Changes in anthocyanin content and expression of anthocyanin synthesis genes in seedlings of black glutinous rice in response to salt stress. Asian. J. Plant Sci. 2016, 15, 56–65. [Google Scholar] [CrossRef]
  64. Zhang, S.; Zhang, A.; Wu, X.; Zhu, Z.; Yang, Z.; Zhu, Y.; Zha, D. Transcriptome analysis revealed expression of genes related to anthocyanin biosynthesis in eggplant (Solanum melongena L.) under high-temperature stress. BMC Plant Biol. 2019, 19, 1–13. [Google Scholar] [CrossRef] [PubMed] [Green Version]
  65. Poustka, F.; Irani, N.G.; Feller, A.; Lu, Y.; Pourcel, L.; Frame, K.; Grotewold, E. A trafficking pathway for anthocyanins overlaps with the endoplasmic reticulum-to-vacuole protein-sorting route in Arabidopsis and contributes to the formation of vacuolar inclusions. Plant Physiol. 2007, 145, 1323–1335. [Google Scholar] [CrossRef] [PubMed] [Green Version]
  66. Coleman, J.O.D.; Randall, R.; BlakeKalff, M.M.A. Detoxification of xenobiotics in plant cells by glutathione conjugation and vacuolar compartmentalization: A fluorescent assay using monochlorobimane. Plant Cell Environ. 1997, 20, 449–460. [Google Scholar] [CrossRef] [Green Version]
  67. Das, N.; Bhattacharya, S.; Bhattacharyya, S.; Maiti, M.K. Expression of rice MATE family transporter OsMATE2 modulates arsenic accumulation in tobacco and rice. Plant Mol. Biol. 2018, 98, 101–120. [Google Scholar] [CrossRef] [PubMed]
  68. Wang, L.; Bei, X.; Gao, J.; Li, Y.; Yan, Y.; Hu, Y. The similar and different evolutionary trends of MATE family occurred between rice and Arabidopsis thaliana. BMC Plant Biol. 2016, 16, 1–19. [Google Scholar] [CrossRef] [Green Version]
  69. Kim, B.G.; Kim, J.H.; Min, S.Y.; Shin, K.-H.; Kim, J.H.; Kim, H.Y.; Ryu, S.N. Anthocyanin content in rice is related to expression levels of anthocyanin biosynthetic genes. J. Plant Biol. 2007, 50, 156–160. [Google Scholar] [CrossRef]
  70. Li, X.; Duan, X.; Jiang, H.; Sun, Y.; Tang, Y.; Yuan, Z.; Zhang, D. Genome-wide analysis of basic/helix-loop-helix transcription factor family in rice and Arabidopsis. Plant Physiol. 2006, 141, 1167–1184. [Google Scholar] [CrossRef] [PubMed] [Green Version]
  71. Oikawa, T.; Maeda, H.; Oguchi, T.; Yamaguchi, T.; Tanabe, N.; Ebana, K.; Yano, M.; Ebitani, T.; Izawa, T. The birth of a black rice gene and its local spread by introgression. Plant Cell 2015, 27, 2401–2414. [Google Scholar] [CrossRef] [Green Version]
  72. Sun, X.; Zhang, Z.; Chen, C.; Wu, W.; Ren, N.; Jiang, C.; Yu, J.; Zhao, Y.; Zheng, X.; Yang, Q. The C–S–A gene system regulates hull pigmentation and reveals evolution of anthocyanin biosynthesis pathway in rice. J. Exp. Bot. 2018, 69, 1485–1498. [Google Scholar] [CrossRef] [PubMed] [Green Version]
  73. Shao, Y.; Xu, F.; Sun, X.; Bao, J.; Beta, T. Identification and quantification of phenolic acids and anthocyanins as antioxidants in bran, embryo and endosperm of white, red and black rice kernels (Oryza sativa L.). J. Cereal Sci. 2014, 59, 211–218. [Google Scholar] [CrossRef]
  74. Druka, A.; Kudrna, D.; Rostoks, N.; Brueggeman, R.; Von Wettstein, D.; Kleinhofs, A. Chalcone isomerase gene from rice (Oryza sativa) and barley (Hordeum vulgare): Physical, genetic and mutation mapping. Gene 2003, 302, 171–178. [Google Scholar] [CrossRef]
  75. Reddy, A.R.; Scheffler, B.; Madhuri, G.; Srivastava, M.N.; Kumar, A.; Sathyanarayanan, P.V.; Mohan, M. Chalcone synthase in rice (Oryza sativa L.): Detection of the CHS protein in seedlings and molecular mapping of the chs locus. Plant Mol. Biol. 1996, 32, 735–743. [Google Scholar] [CrossRef] [PubMed]
  76. Martinoia, E.; Grill, E.; Tommasini, R.; Kreuz, K.; Amrhein, N. ATP-dependent glutathione S-conjugate’export’pump in the vacuolar membrane of plants. Nature 1993, 364, 247–249. [Google Scholar] [CrossRef]
  77. Martinoia, E.; Maeshima, M.; Neuhaus, H.E. Vacuolar transporters and their essential role in plant metabolism. J. Exp. Bot. 2007, 58, 83–102. [Google Scholar] [CrossRef] [PubMed]
  78. Yazaki, K.; Sugiyama, A.; Morita, M.; Shitan, N. Secondary transport as an efficient membrane transport mechanism for plant secondary metabolites. Phytochem. Rev. 2008, 7, 513–524. [Google Scholar] [CrossRef] [Green Version]
  79. Ikai, A. Thermostability and aliphatic index of globular proteins. J. Biochem. 1980, 88, 1895–1898. [Google Scholar] [CrossRef] [PubMed]
  80. Morita, M.; Shitan, N.; Sawada, K.; Van Montagu, M.C.; Inzé, D.; Rischer, H.; Yazaki, K. Vacuolar transport of nicotine is mediated by a multidrug and toxic compound extrusion (MATE) transporter in Nicotiana tabacum. Proc. Nat. Acad. Sci. USA 2009, 106, 2447–2452. [Google Scholar] [CrossRef] [PubMed] [Green Version]
  81. Marinova, K.; Pourcel, L.; Weder, B.; Schwarz, M.; Barron, D.; Routaboul, J.M.; Klein, M. The Arabidopsis MATE transporter TT12 acts as a vacuolar flavonoid/H+-antiporter active in proanthocyanidin-accumulating cells of the seed coat. Plant Cell 2007, 19, 2023–2038. [Google Scholar] [CrossRef] [Green Version]
  82. Roytrakul, S.; Verpoorte, R. Role of vacuolar transporter proteins in plant secondary metabolism: Catharanthus roseus cell culture. Phytochem. Rev. 2007, 6, 383–396. [Google Scholar] [CrossRef] [Green Version]
  83. Mackon, E.; Ma, Y.; Jeazet Dongho Epse Mackon, G.C.; Li, Q.; Zhou, Q.; Liu, P. Subcellular Localization and Vesicular Structures of Anthocyanin Pigmentation by Fluorescence Imaging of Black Rice (Oryza sativa L.) Stigma Protoplast. Plants 2021, 10, 685. [Google Scholar] [CrossRef]
Figure 1. Developmental stages of black and white caryopsis; (A) black rice caryopsis at milk stage 11 days after flowering (Bc11); (B) black rice caryopsis at dough stage 18 days after flowering (Bc18); (C) black rice caryopsis at mature stage 25 days after flowering (Bc25); (D) a cross section of black caryopsis 20 days after flowering; (E) white rice caryopsis at milk stage 11 days after flowering (Wc11); (F) white rice caryopsis at dough stage 18 days after flowering (Wc18); (G) white rice caryopsis at mature stage 25 days after flowering (Wc25); (H) a cross section of white rice caryopsis 20 days after flowering.
Genes 12 00583 g001
Figure 2. Molecular phylogenetic tree of OsMATEs proteins. Each color represents one cluster (CL): cluster1 (CL1), blue color; cluster2 (CL2), green color; cluster3 (CL3), red color; cluster4 (CL4), violet color.
Genes 12 00583 g002
Figure 3. Phylogenetic relationships and domain compositions of the MATE proteins. (A) The unrooted phylogenetic tree was constructed with 1000 bootstrap replicates based on multiple alignments of 38 MATE amino acid sequences. The four major subgroups are marked with a different colored line. Each color represents one cluster (CL): cluster1 (CL1), blue color; cluster2 (CL2), green color; cluster3 (CL3), red color; cluster4 (CL4), violet color. (B) Exon pattern, red boxes represent exons while lines represent introns. (C) The conserved motifs in the MATE proteins were identified using MEME, gray lines represent the non-conserved sequences. Each motif is indicated by a colored box numbered at the bottom. The length of the motifs in each protein is exhibited proportionally. Twelve motifs are illustrated using different colored boxes to get more information about the motif sequence, refer to Table S3.
Genes 12 00583 g003
Figure 4. Principal component analysis of replicates samples at different developmental stages. Wc11 = White caryopsis, 11 days after flowering; Wc18 = White caryopsis, 18 days after flowering; Wc25 = White caryopsis, 25 days after flowering; Bc11 = Black caryopsis, 11 days after flowering; Bc18 = Black caryopsis, 18 days after flowering; Bc25 = Black caryopsis, 25 days after flowering. The distance of each sample point represents the distance of the sample. The closer the distance, the higher the similarity between the samples. The horizontal axis represents the contribution of principal component 1 (PC1) to the distinguished sample in the two-dimensional graph, and the vertical axis represents the contribution of principal component 2 (PC2) to the distinguished sample in the two-dimensional graphs.
Genes 12 00583 g004
Figure 5. Comparison of transcript and gene abundance in black and white caryopsis. (A) Venn diagram of commonly expressed and unique genes in black and white rice caryopsis. (B) Venn diagram of the differentially expressed genes (DEGs) in the black and white caryopsis at different developmental stages. (C) Venn diagram of commonly expressed and uniquely expressed genes in a different sample at different stages. (D) The number of DEGs between black and white caryopsis at 25 DAF, 18 DAF, and 11 DAF. The red bars denote the upregulated genes and the green indicate the downregulated genes. (E) Scatter diagram with the abscissa and ordinate, respectively, represents the expression levels of genes in white and black caryopsis where the value of the abscissa and the ordinate were logarithmicized and each point represents a specific gene. Red dots show significantly upregulated, green dots represent genes that were significantly downregulated, and gray dots non-significantly different genes. The closer the point is to 0, the lower the expression level; the greater the deviation from the diagonal line, the greater the difference in expression of a gene between the two samples.
Genes 12 00583 g005
Figure 6. Gene ontology analysis of DEGs; results are shown in three categories: Biological Process (gray), Cellular Component (orange), and Molecular Function (violet); the left axis represents the number of genes of each term, while the Y-axis represents the GO term; different colored bars represent different comparisons.
Genes 12 00583 g006
Figure 7. GO and KEGG enrichment: (A) Bar diagram showing GO enrichment in Bc vs. Wc; MF indicates the category molecular function; CC, the category cellular component; BP, the category biological process. (B) Histogram showing KEGG enrichment in Bc vs. Wc; the ordinate represents the KEGG pathway and the abscissa represents the significance level of enrichment under p-adjust < 0.5, which corresponds to the height of the column. The smaller the FDR and the greater the −log10 (FDR) value, the more significantly enriched the KEGG pathway. Different colors indicate 4 enriched branches of the KEGG metabolic pathway: genetic information processing (GIP), environmental information processing (EIP), biological systems (OS), and metabolism (M).
Genes 12 00583 g007
Figure 8. Heatmap showing expression profile and cluster analysis of DEGs in different samples: (A) Expression profile of twenty-seven anthocyanin biosynthesis DEGs including putative transporters. (B) Heatmap representation and hierarchical clustering of the transporters genes of various samples in black and white caryopsis. The transcript data of six samples from rice caryopsis were used to reconstruct the expression patterns of genes. The clear boxes indicate that the transcript abundance is zero. The bar at the right side of the heat map represents the relative expression values; values below 0 represent downregulated expression and values above 0 represent upregulated expression.
Genes 12 00583 g008
Figure 9. Real-time quantitative PCR validation of transcriptome data for four selected DEGs in all samples. The data were obtained from three independent repeats.
Genes 12 00583 g009
Table 1. Anthocyanin content (µg. g −1 FW) in black and white caryopsis during the development stages.
Type of AnthocyaninRice Developmental Stages
Milk (11 DAF)Dough (18 DAF)Mature (25 DAF)Fully Ripe (35 DAF)
Wc11Bc11Wc18Bc18Wc25Bc25Wc35Bc35
Pt3GNDNDNDNDNDNDNDND
P3GND163.75 ± 5ND295.33 ± 4ND97.52 ± 10ND35.98 ± 7
C3GND1600.96 ± 15ND4206.91 ± 18ND1212.87 ± 10ND814.59 ± 5.5
Anthocyanin content is represented as value ± SD of three biological replicates; ND, Not detected; Pt3G, petunidin-3-O-glucoside; P3G, peonidin-3-O-glucoside; C3G, cyanidin-3-O-glucoside; DAF, days after flowering.
Table 2. Summary of RNA seq data and reads mapping.
Sample IDRaw ReadsClean ReadsTotal Mapped ReadsQ20 (%)Q30 (%)GC (%)
Wc11-rep1462347884571676442690828 (93.38%)98.8196.3151.99
Wc11-rep2477961904712047043973125 (93.32%)98.7496.1251.79
Wc18-rep1536021445314152648976170 (92.16%)98.6995.8952.4
Wc18-rep2512533985085502647207849 (92.83%)98.8396.2852.22
Wc25-rep1530622265256111848421904 (92.12%)98.7496.1654.88
Wc25-rep2562030985579229251481571 (92.27%)98.8796.453.63
Bc11-rep1444874444381481441492963 (94.7%)98.7996.2751.4
Bc11-rep2475277124692557044457493 (94.74%)98.7896.1751.67
Bc18-rep1544826245408993651460136 (95.14%)98.896.2152.01
Bc18-rep2544308185388087251159662 (94.95%)98.7195.9952.25
Bc25-rep1577261565713595654078567 (94.65%)98.7896.2354.57
Bc25-rep2499757584949756446688293 (94.32%)98.7896.2154.56
Rep1 and Rep2 indicate respectively replication 1 and replication 2. Wc11 = White caryopsis, 11 days after flowering; Wc18 = White caryopsis, 18 days after flowering; Wc25 = White caryopsis, 25 days after flowering; Bc11 = Black caryopsis, 11 days after flowering; Bc18 = Black caryopsis, 18 days after flowering; Bc25 = Black caryopsis, 25 days after flowering; GC%, represents Guanine-Cytosine content which is often rich in the coding region and calculated as count(G + C)/count(A + T + G + C) * 100%; Q20 indicates the probability of an incorrect base call is 1 in 100; Q30, 1 in 1000 and their value refer respectively to the percentage of bases with sequencing quality above 99% and 99.9%.
Publisher’s Note: MDPI stays neutral with regard to jurisdictional claims in published maps and institutional affiliations.

