
miR-542-3p Contributes to the HK2-Mediated High Glycolytic Phenotype in Human Glioma Cells

 and
and 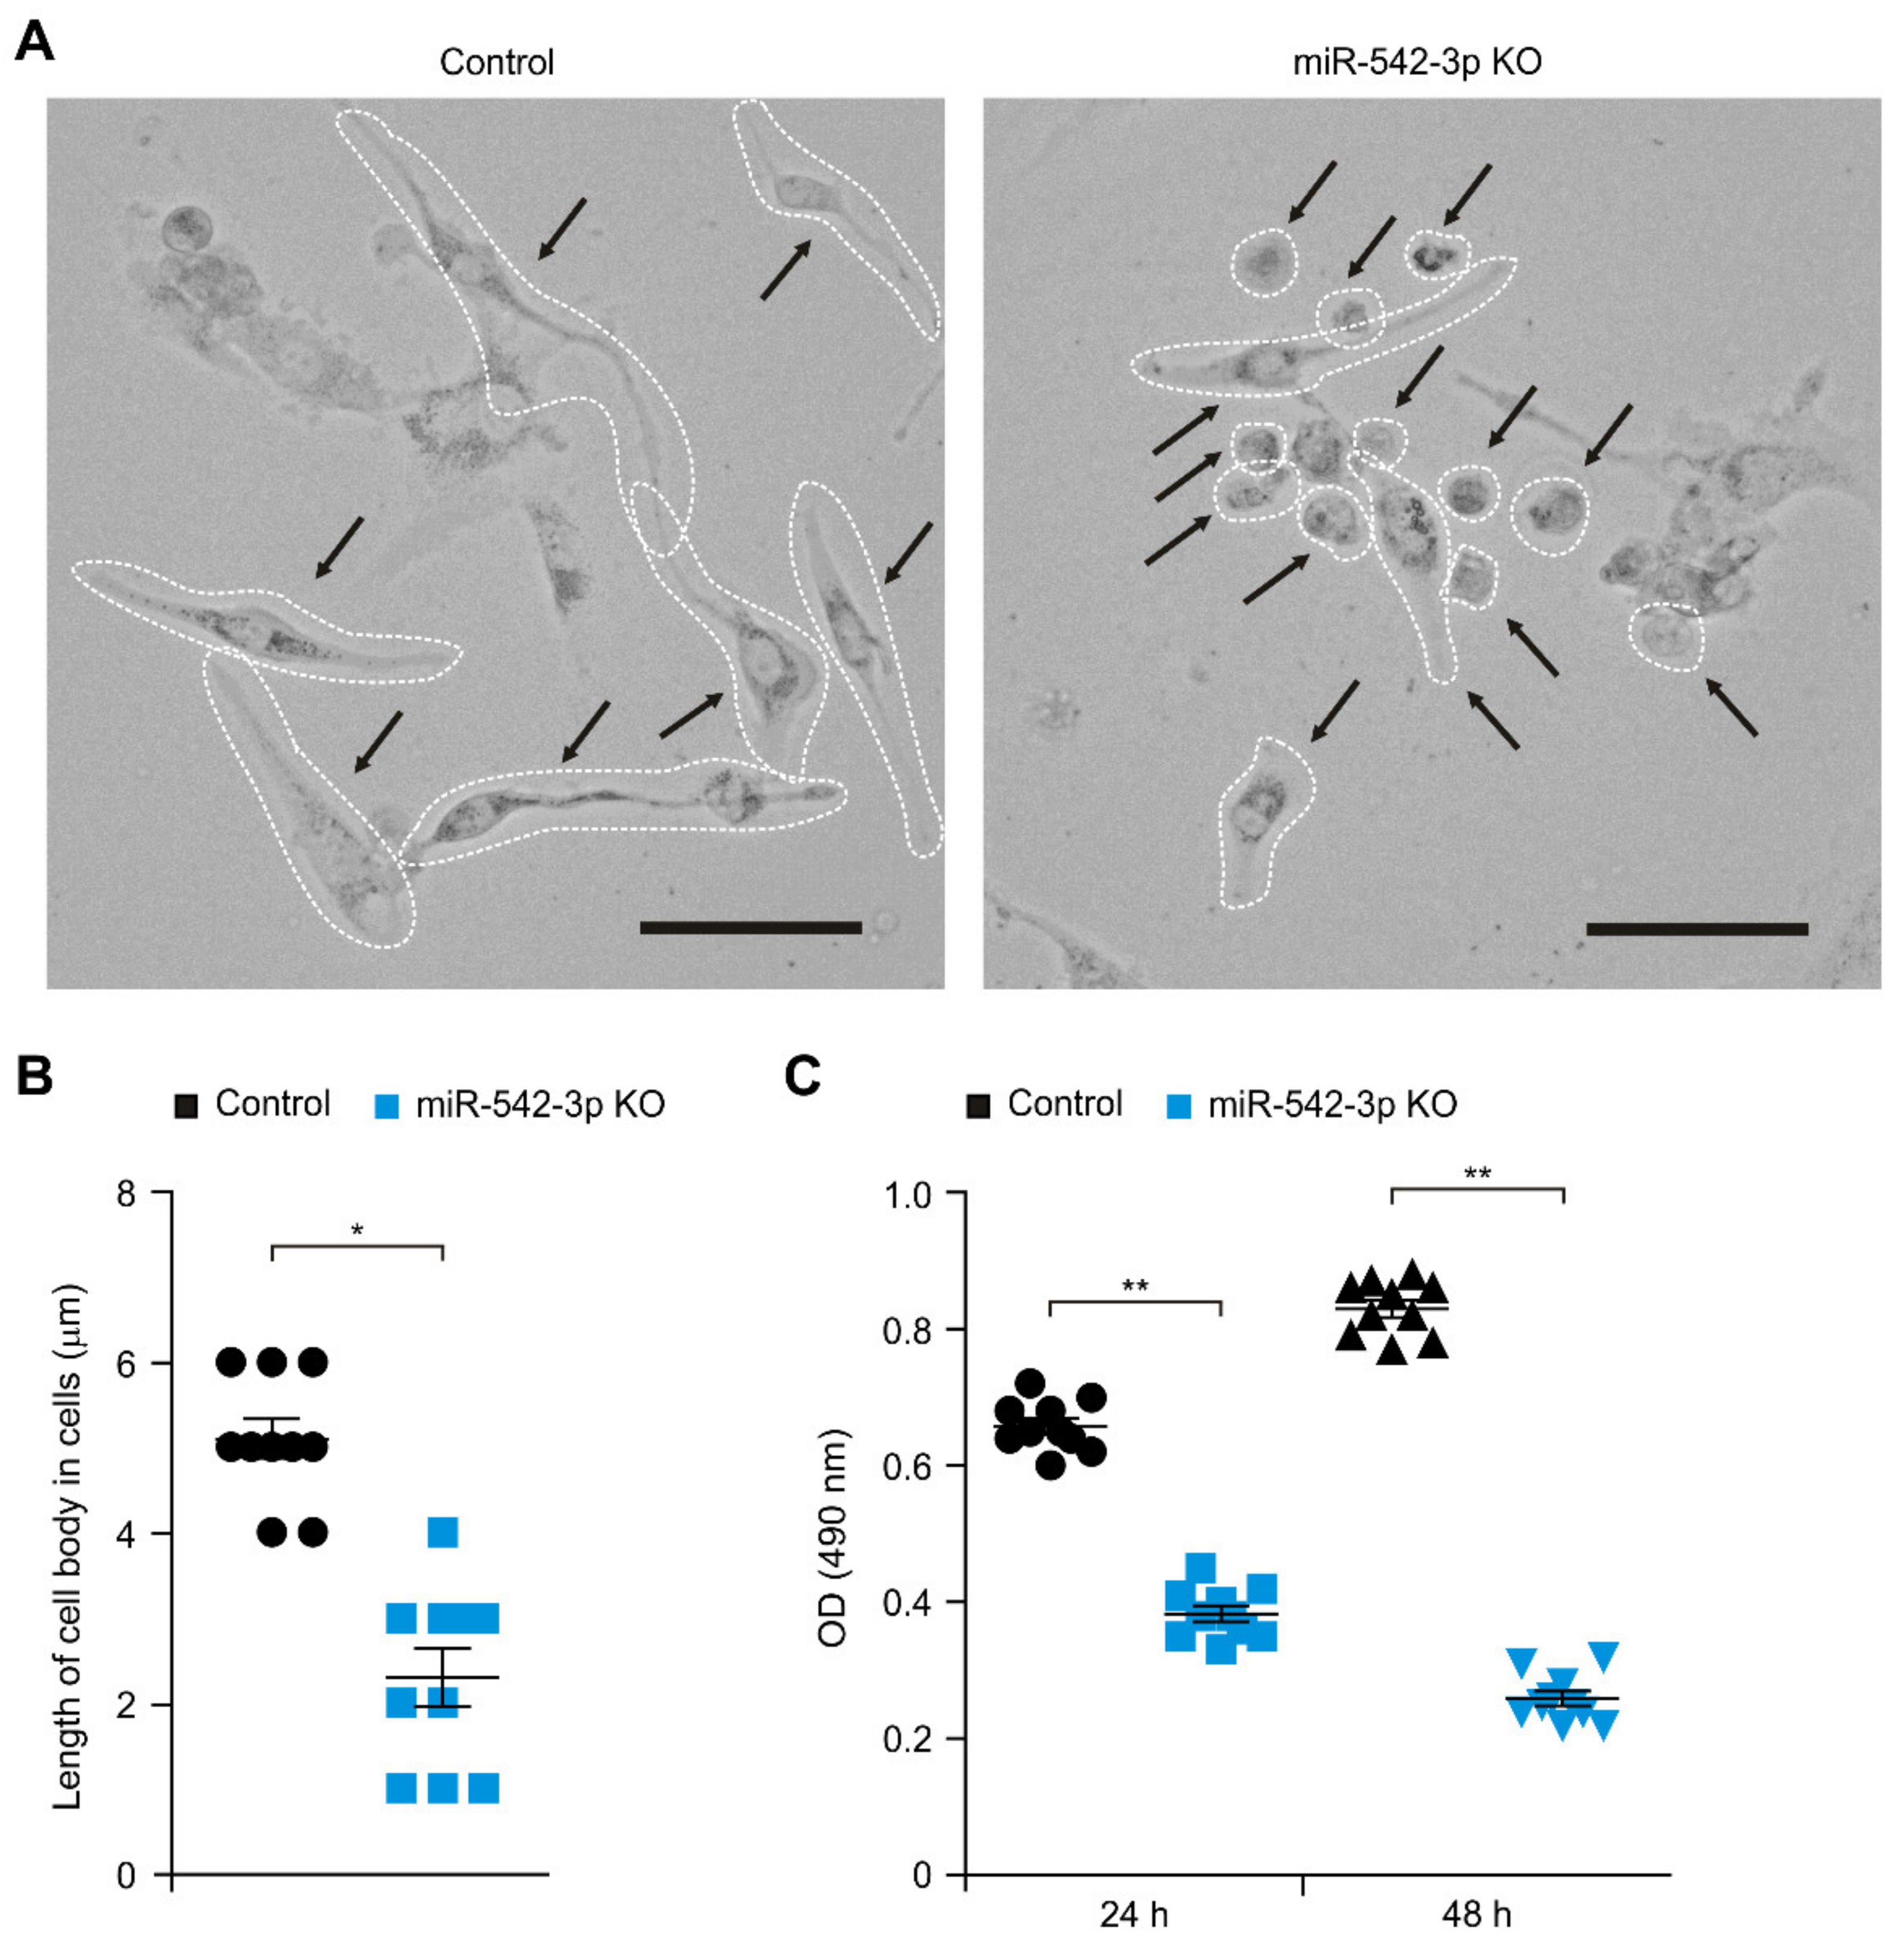
Abstract
:1. Introduction
2. Materials and Methods
2.1. Human Study
2.2. Reagents
2.3. Human Glioma Cells
2.4. 2 D and 3D Immunofluorescence and Morphology Analysis
2.5. In Situ Hybridization for Human miR-542-3p
2.6. Immunoblot Analysis
2.7. Glycolysis Activity Assay
2.8. Cell Proliferation Assay
2.9. Analysis of the TCGA Dataset
2.10. Statistical Analysis
3. Results
3.1. Knockdown of miR-542-3p Suppresses Cellular Proliferation in Human Glioma Cells
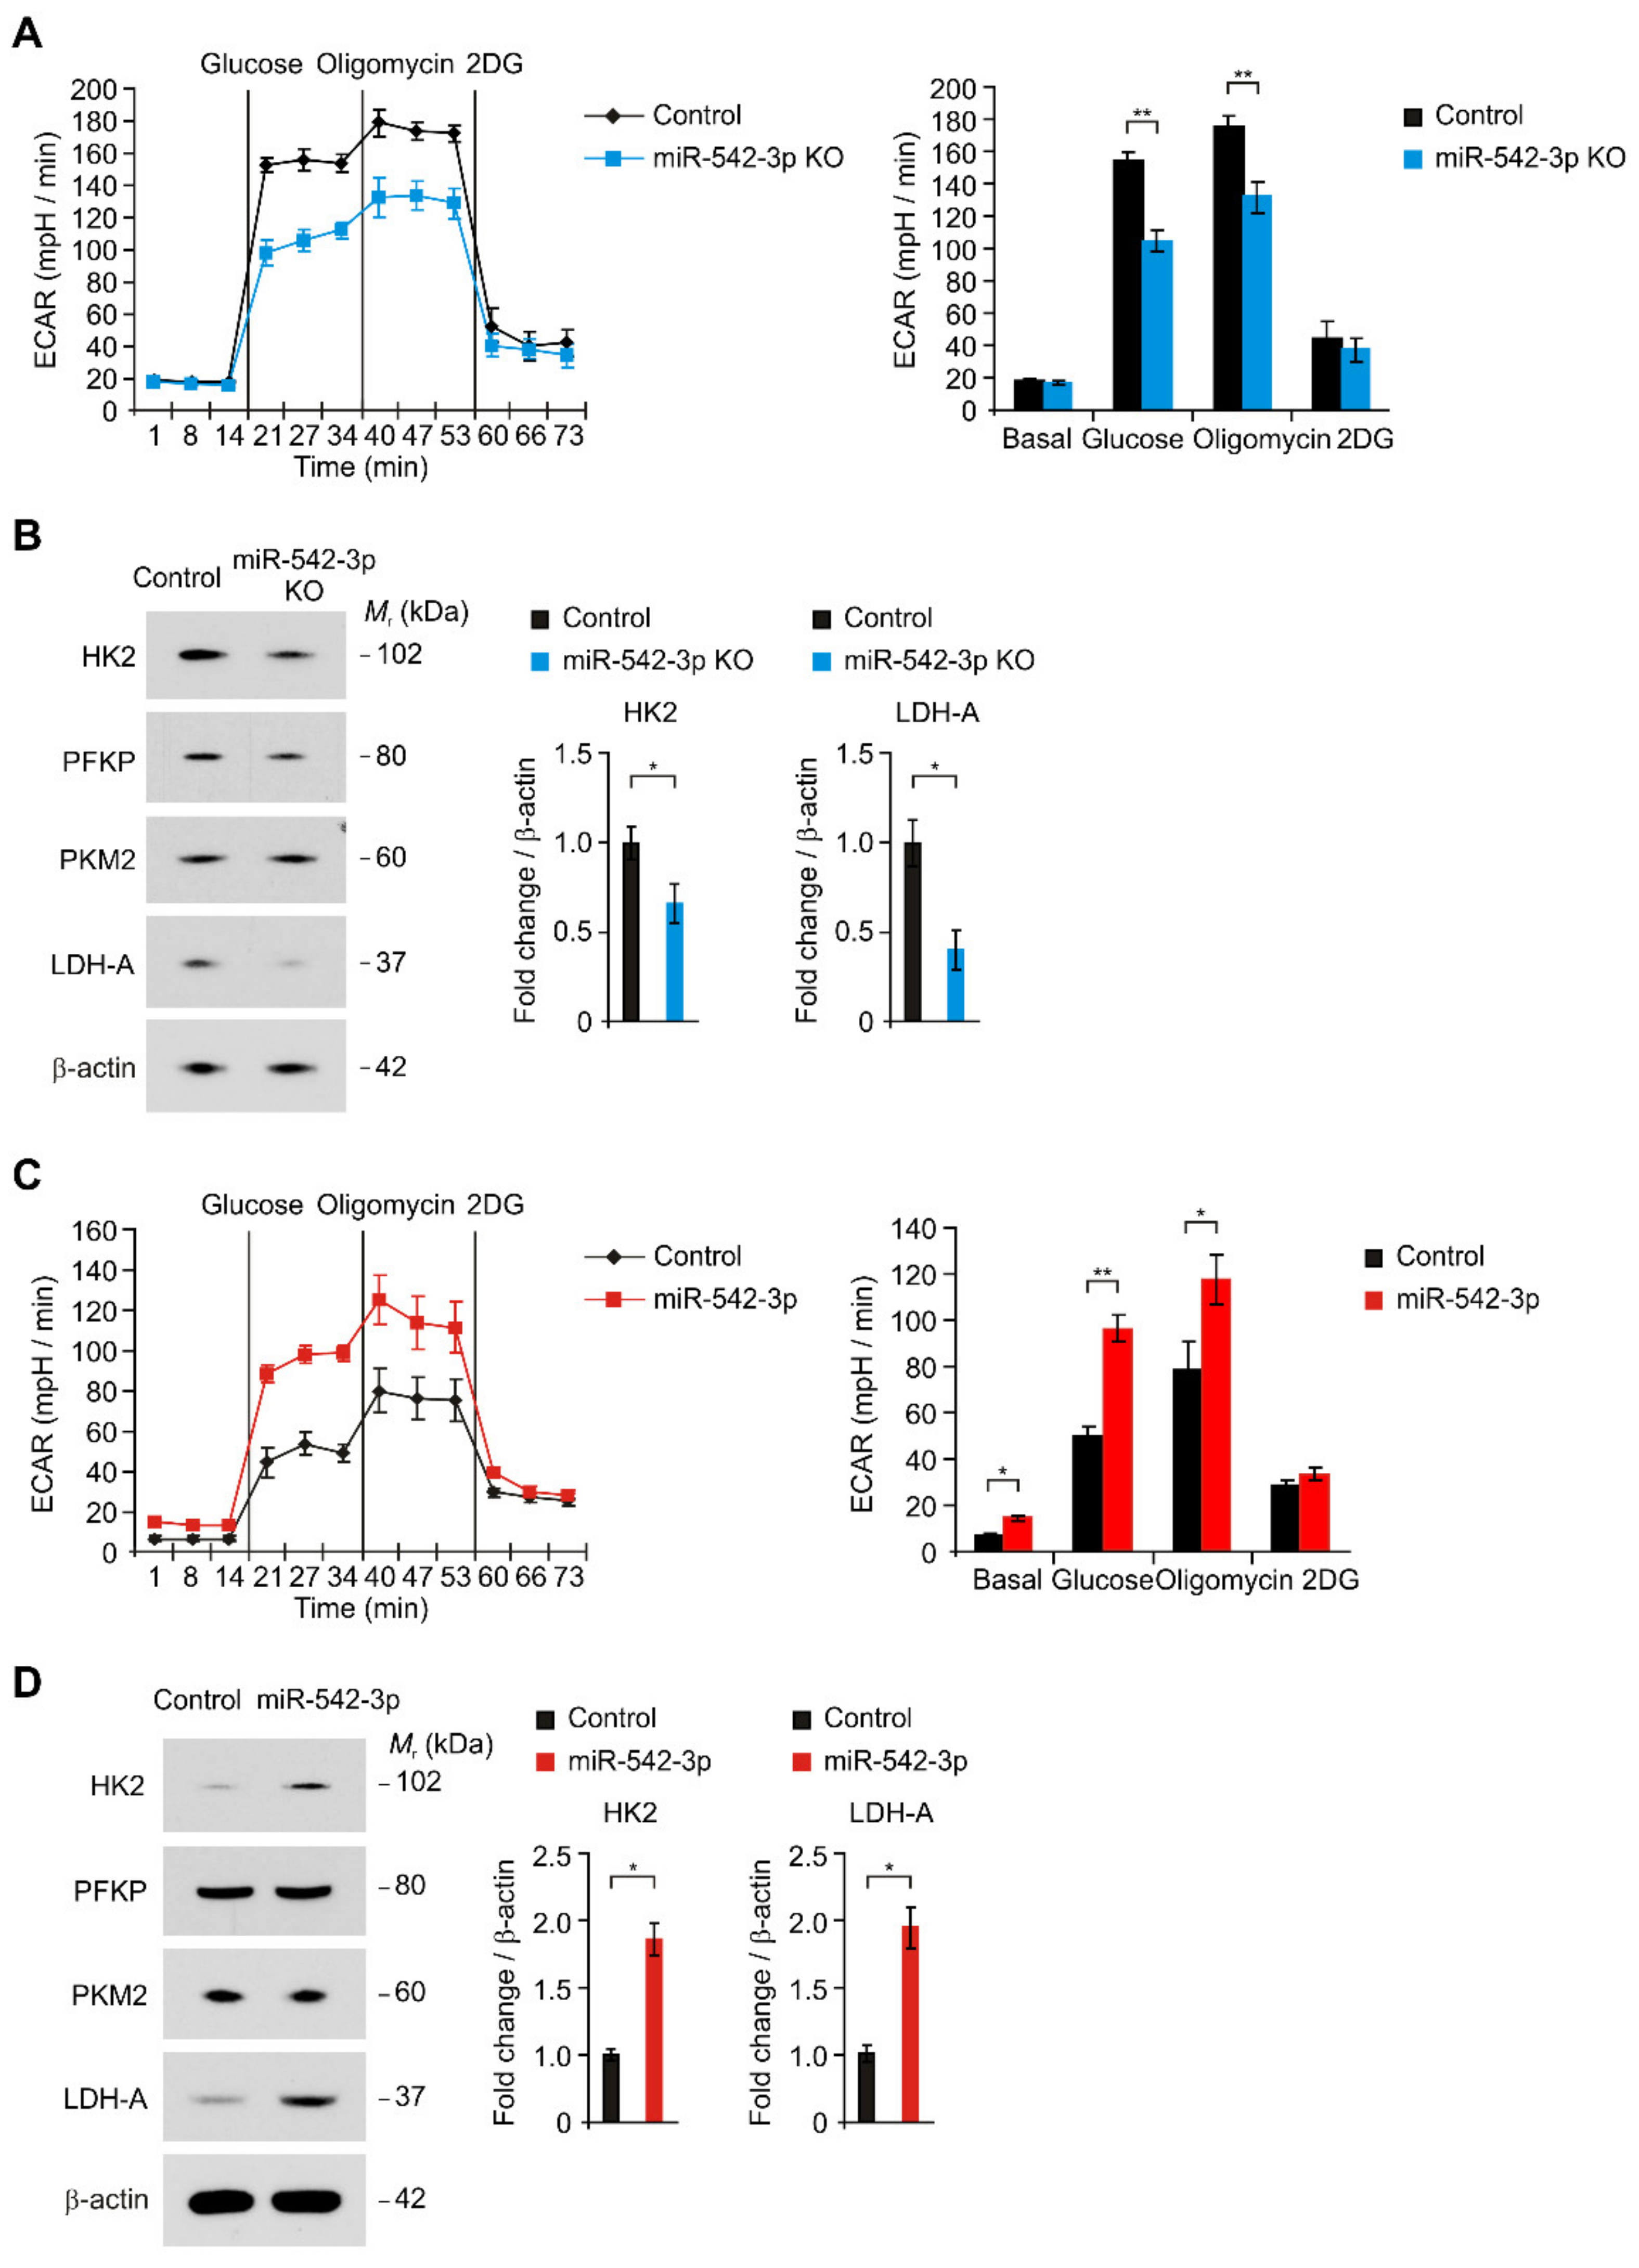
3.2. miR-542-3p Regulates the HK2-Mediated High Glycolytic Phenotype in Human Glioma Cells
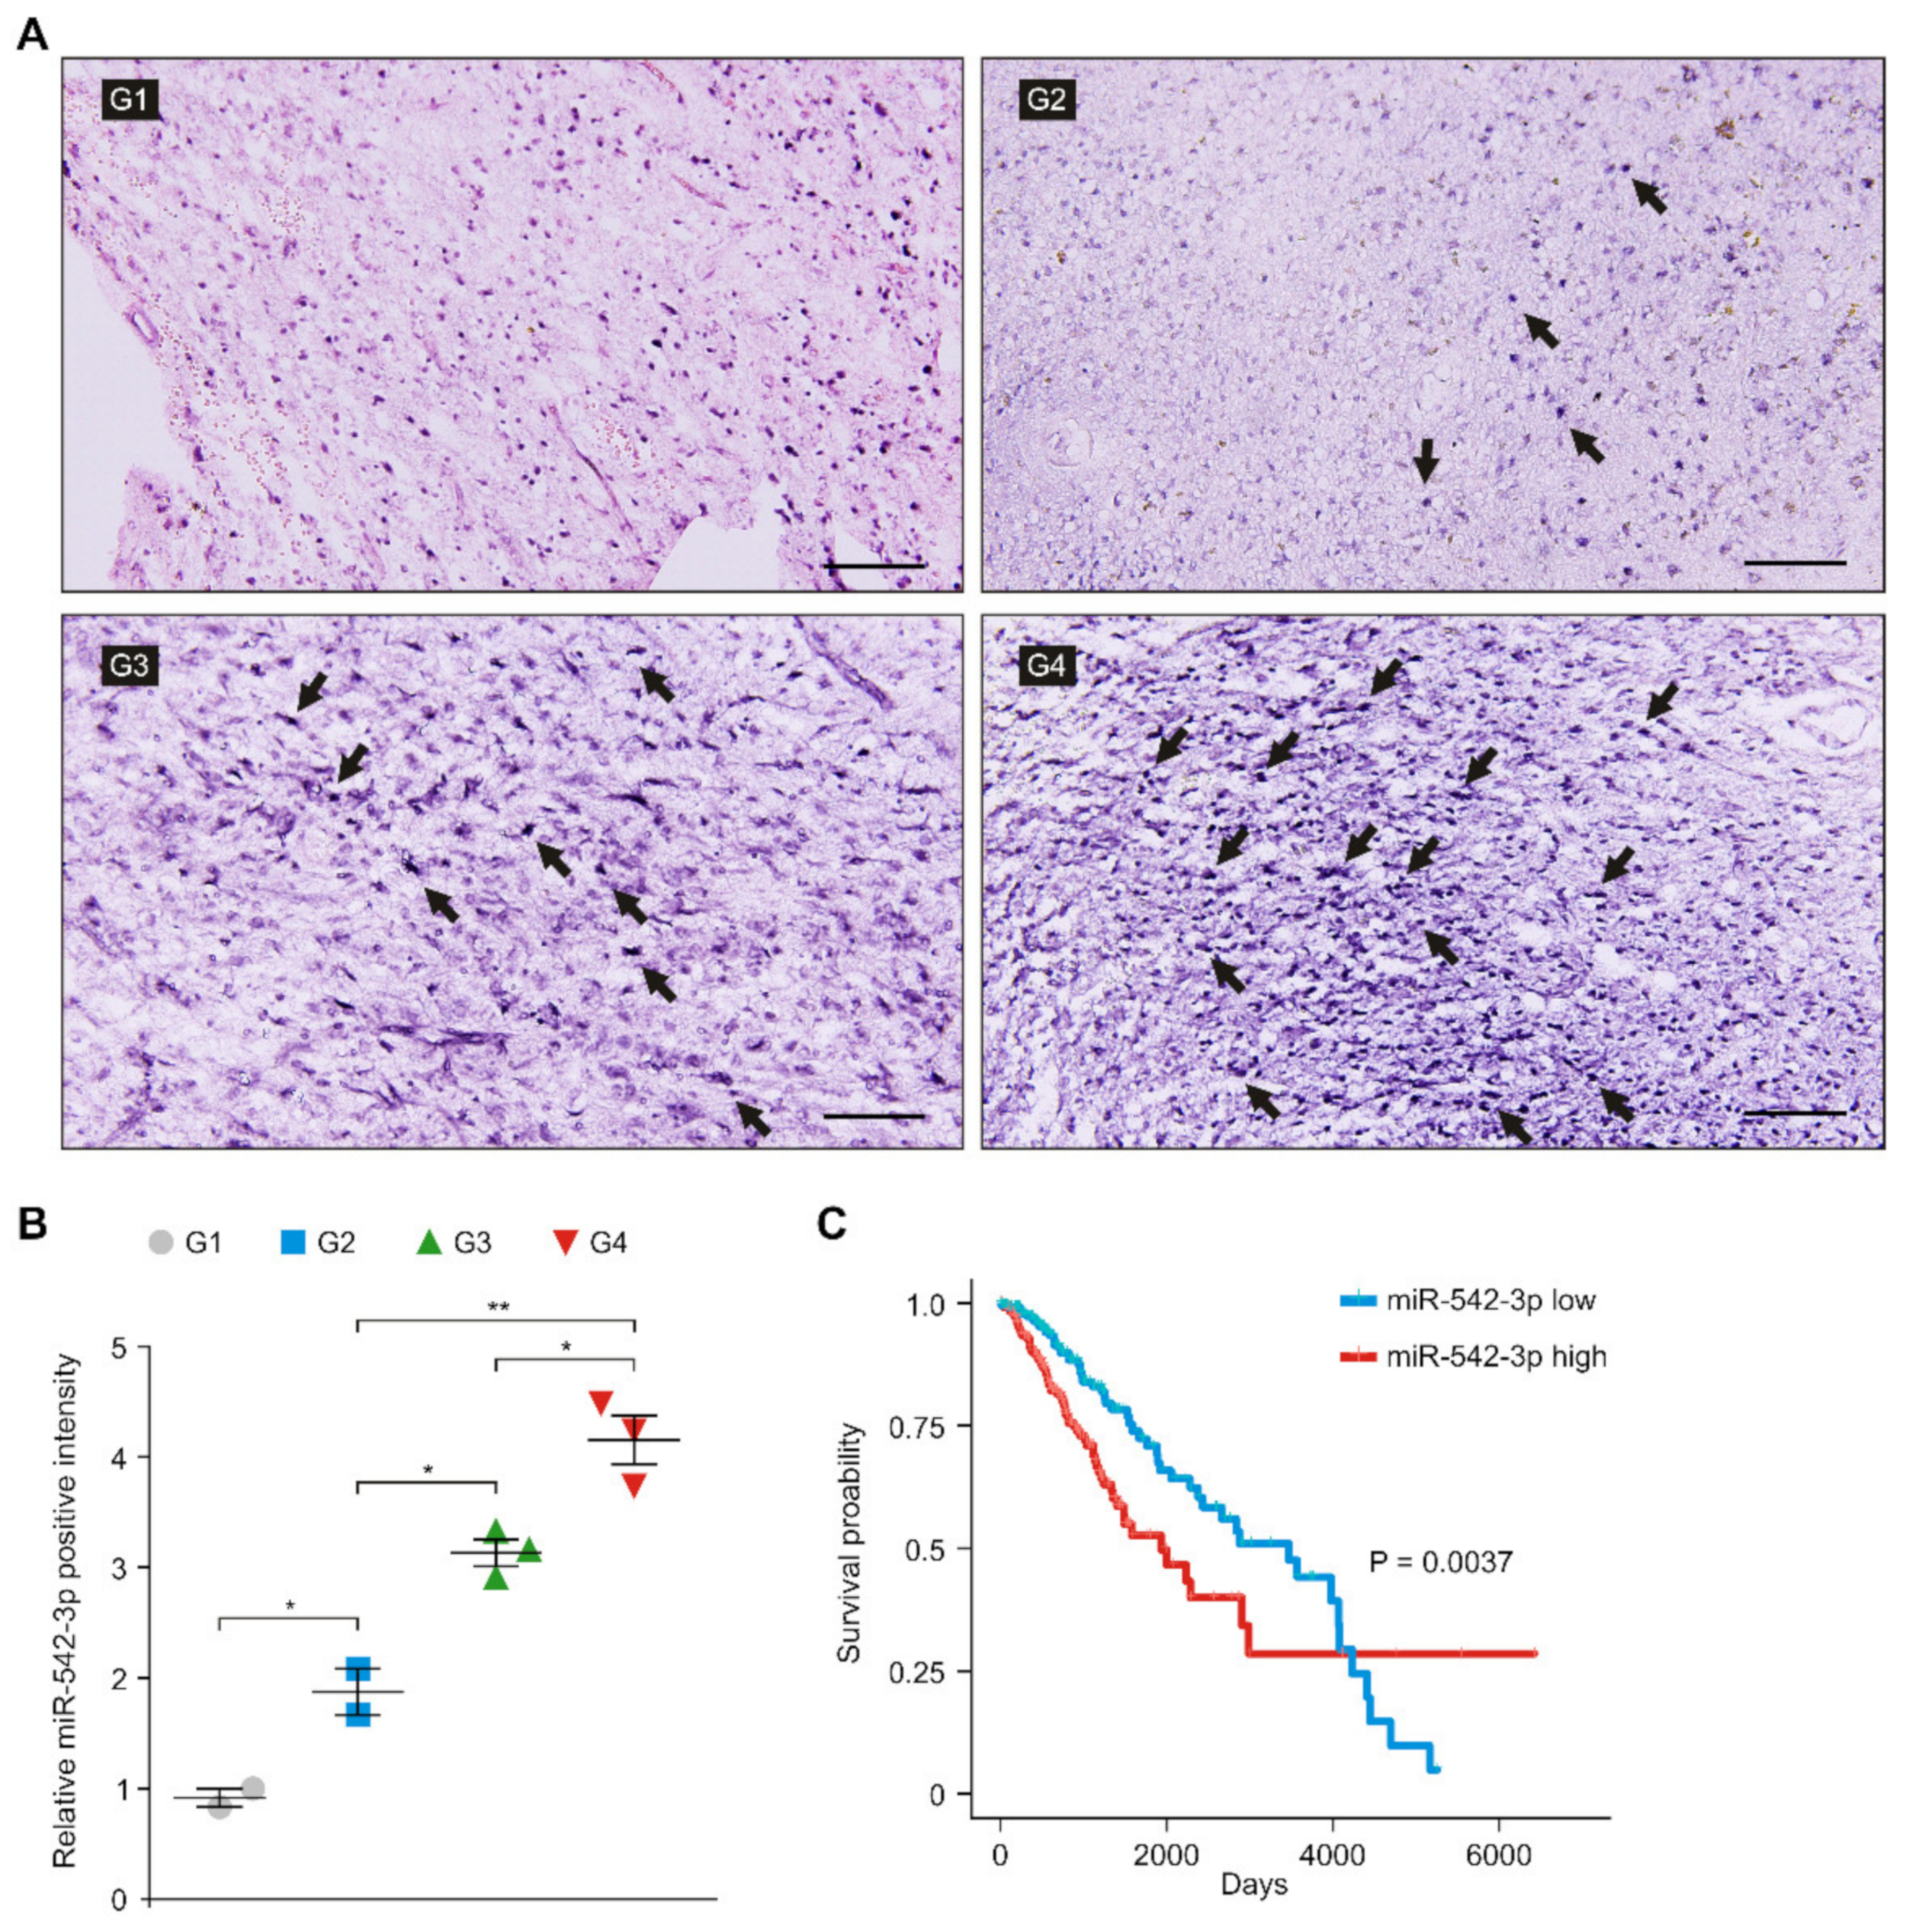
3.3. The Levels of miR-542-3p Were Elevated in Patients with High-Grade Gliomas
3.4. The Levels of HK2 Were Elevated and Positively Correlated with the Levels of miR-542-3p in Patients with Glioma
4. Discussion
5. Conclusions
Supplementary Materials
Author Contributions
Funding
Institutional Review Board Statement
Informed Consent Statement
Data Availability Statement
Acknowledgments
Conflicts of Interest
References
- Ilkhanizadeh, S.; Lau, J.; Huang, M.; Foster, D.J.; Wong, R.; Frantz, A.; Wang, S.; Weiss, W.A.; Persson, A.I. Glial progenitors as targets for transformation in glioma. Adv. Cancer Res. 2014, 121, 1–65. [Google Scholar] [CrossRef] [PubMed] [Green Version]
- Weller, M.; Wick, W.; Aldape, K.; Brada, M.; Berger, M.; Pfister, S.M.; Nishikawa, R.; Rosenthal, M.; Wen, P.Y.; Stupp, R.; et al. Glioma. Nat. Rev. Dis. Primers 2015, 1, 15017. [Google Scholar] [CrossRef] [PubMed]
- Wang, Y.; Jiang, T. Understanding high grade glioma: Molecular mechanism, therapy and comprehensive management. Cancer Lett. 2013, 331, 139–146. [Google Scholar] [CrossRef] [PubMed]
- Bleeker, F.E.; Molenaar, R.J.; Leenstra, S. Recent advances in the molecular understanding of glioblastoma. J. Neurooncol. 2012, 108, 11–27. [Google Scholar] [CrossRef] [Green Version]
- Hanif, F.; Muzaffar, K.; Perveen, K.; Malhi, S.M.; Simjee Sh, U. Glioblastoma Multiforme: A Review of its Epidemiology and Pathogenesis through Clinical Presentation and Treatment. Asian Pac. J. Cancer Prev. 2017, 18, 3–9. [Google Scholar] [CrossRef]
- Warburg, O. On the origin of cancer cells. Science 1956, 123, 309–314. [Google Scholar] [CrossRef]
- Jang, M.; Kim, S.S.; Lee, J. Cancer cell metabolism: Implications for therapeutic targets. Exp. Mol. Med. 2013, 45, e45. [Google Scholar] [CrossRef] [Green Version]
- Wolf, A.; Agnihotri, S.; Micallef, J.; Mukherjee, J.; Sabha, N.; Cairns, R.; Hawkins, C.; Guha, A. Hexokinase 2 is a key mediator of aerobic glycolysis and promotes tumor growth in human glioblastoma multiforme. J. Exp. Med. 2011, 208, 313–326. [Google Scholar] [CrossRef] [Green Version]
- Oudard, S.; Arvelo, F.; Miccoli, L.; Apiou, F.; Dutrillaux, A.M.; Poisson, M.; Dutrillaux, B.; Poupon, M.F. High glycolysis in gliomas despite low hexokinase transcription and activity correlated to chromosome 10 loss. Br. J. Cancer 1996, 74, 839–845. [Google Scholar] [CrossRef] [Green Version]
- Tabatabaei, P.; Bergstrom, P.; Henriksson, R.; Bergenheim, A.T. Glucose metabolites, glutamate and glycerol in malignant glioma tumours during radiotherapy. J. Neurooncol. 2008, 90, 35–39. [Google Scholar] [CrossRef]
- Mathupala, S.P.; Ko, Y.H.; Pedersen, P.L. Hexokinase II: Cancer’s double-edged sword acting as both facilitator and gatekeeper of malignancy when bound to mitochondria. Oncogene 2006, 25, 4777–4786. [Google Scholar] [CrossRef] [PubMed] [Green Version]
- Patra, K.C.; Wang, Q.; Bhaskar, P.T.; Miller, L.; Wang, Z.; Wheaton, W.; Chandel, N.; Laakso, M.; Muller, W.J.; Allen, E.L.; et al. Hexokinase 2 is required for tumor initiation and maintenance and its systemic deletion is therapeutic in mouse models of cancer. Cancer Cell 2013, 24, 213–228. [Google Scholar] [CrossRef] [PubMed] [Green Version]
- Robey, R.B.; Hay, N. Mitochondrial hexokinases, novel mediators of the antiapoptotic effects of growth factors and Akt. Oncogene 2006, 25, 4683–4696. [Google Scholar] [CrossRef] [PubMed] [Green Version]
- Allison, S.J.; Knight, J.R.; Granchi, C.; Rani, R.; Minutolo, F.; Milner, J.; Phillips, R.M. Identification of LDH-A as a therapeutic target for cancer cell killing via (i) p53/NAD(H)-dependent and (ii) p53-independent pathways. Oncogenesis 2014, 3, e102. [Google Scholar] [CrossRef] [PubMed]
- Arseneault, R.; Chien, A.; Newington, J.T.; Rappon, T.; Harris, R.; Cumming, R.C. Attenuation of LDHA expression in cancer cells leads to redox-dependent alterations in cytoskeletal structure and cell migration. Cancer Lett. 2013, 338, 255–266. [Google Scholar] [CrossRef]
- Valvona, C.J.; Fillmore, H.L.; Nunn, P.B.; Pilkington, G.J. The Regulation and Function of Lactate Dehydrogenase A: Therapeutic Potential in Brain Tumor. Brain Pathol. 2016, 26, 3–17. [Google Scholar] [CrossRef] [Green Version]
- Read, J.A.; Winter, V.J.; Eszes, C.M.; Sessions, R.B.; Brady, R.L. Structural basis for altered activity of M- and H-isozyme forms of human lactate dehydrogenase. Proteins 2001, 43, 175–185. [Google Scholar] [CrossRef]
- Kureel, J.; Dixit, M.; Tyagi, A.M.; Mansoori, M.N.; Srivastava, K.; Raghuvanshi, A.; Maurya, R.; Trivedi, R.; Goel, A.; Singh, D. miR-542-3p suppresses osteoblast cell proliferation and differentiation, targets BMP-7 signaling and inhibits bone formation. Cell Death Dis. 2014, 5, e1050. [Google Scholar] [CrossRef]
- Bartel, D.P. Metazoan MicroRNAs. Cell 2018, 173, 20–51. [Google Scholar] [CrossRef] [Green Version]
- Bartel, D.P.; Chen, C.Z. Micromanagers of gene expression: The potentially widespread influence of metazoan microRNAs. Nat. Rev. Genet. 2004, 5, 396–400. [Google Scholar] [CrossRef]
- Lu, J.; Getz, G.; Miska, E.A.; Alvarez-Saavedra, E.; Lamb, J.; Peck, D.; Sweet-Cordero, A.; Ebert, B.L.; Mak, R.H.; Ferrando, A.A.; et al. MicroRNA expression profiles classify human cancers. Nature 2005, 435, 834–838. [Google Scholar] [CrossRef]
- Cai, J.; Zhao, J.; Zhang, N.; Xu, X.; Li, R.; Yi, Y.; Fang, L.; Zhang, L.; Li, M.; Wu, J.; et al. MicroRNA-542-3p Suppresses Tumor Cell Invasion via Targeting AKT Pathway in Human Astrocytoma. J. Biol. Chem. 2015, 290, 24678–24688. [Google Scholar] [CrossRef] [PubMed] [Green Version]
- Althoff, K.; Lindner, S.; Odersky, A.; Mestdagh, P.; Beckers, A.; Karczewski, S.; Molenaar, J.J.; Bohrer, A.; Knauer, S.; Speleman, F.; et al. miR-542-3p exerts tumor suppressive functions in neuroblastoma by downregulating Survivin. Int. J. Cancer 2015, 136, 1308–1320. [Google Scholar] [CrossRef]
- Wu, H.X.; Wang, G.M.; Lu, X.; Zhang, L. miR-542-3p targets sphingosine-1-phosphate receptor 1 and regulates cell proliferation and invasion of breast cancer cells. Eur. Rev. Med. Pharmacol. Sci. 2017, 21, 108–114. [Google Scholar] [PubMed]
- Long, H.C.; Gao, X.; Lei, C.J.; Zhu, B.; Li, L.; Zeng, C.; Huang, J.B.; Feng, J.R. miR-542-3p inhibits the growth and invasion of colorectal cancer cells through targeted regulation of cortactin. Int. J. Mol. Med. 2016, 37, 1112–1118. [Google Scholar] [CrossRef] [PubMed]
- Oneyama, C.; Morii, E.; Okuzaki, D.; Takahashi, Y.; Ikeda, J.; Wakabayashi, N.; Akamatsu, H.; Tsujimoto, M.; Nishida, T.; Aozasa, K.; et al. MicroRNA-mediated upregulation of integrin-linked kinase promotes Src-induced tumor progression. Oncogene 2012, 31, 1623–1635. [Google Scholar] [CrossRef] [Green Version]
- Padma, M.V.; Said, S.; Jacobs, M.; Hwang, D.R.; Dunigan, K.; Satter, M.; Christian, B.; Ruppert, J.; Bernstein, T.; Kraus, G.; et al. Prediction of pathology and survival by FDG PET in gliomas. J. Neurooncol. 2003, 64, 227–237. [Google Scholar] [CrossRef] [PubMed]
- Di Chiro, G.; DeLaPaz, R.L.; Brooks, R.A.; Sokoloff, L.; Kornblith, P.L.; Smith, B.H.; Patronas, N.J.; Kufta, C.V.; Kessler, R.M.; Johnston, G.S.; et al. Glucose utilization of cerebral gliomas measured by [18F] fluorodeoxyglucose and positron emission tomography. Neurology 1982, 32, 1323–1329. [Google Scholar] [CrossRef]
- Bi, J.; Chowdhry, S.; Wu, S.; Zhang, W.; Masui, K.; Mischel, P.S. Altered cellular metabolism in gliomas—An emerging landscape of actionable co-dependency targets. Nat. Rev. Cancer 2020, 20, 57–70. [Google Scholar] [CrossRef]
- Sanzey, M.; Abdul Rahim, S.A.; Oudin, A.; Dirkse, A.; Kaoma, T.; Vallar, L.; Herold-Mende, C.; Bjerkvig, R.; Golebiewska, A.; Niclou, S.P. Comprehensive analysis of glycolytic enzymes as therapeutic targets in the treatment of glioblastoma. PLoS ONE 2015, 10, e0123544. [Google Scholar] [CrossRef]
- Liu, Y.; Wu, K.; Shi, L.; Xiang, F.; Tao, K.; Wang, G. Prognostic Significance of the Metabolic Marker Hexokinase-2 in Various Solid Tumors: A Meta-Analysis. PLoS ONE 2016, 11, e0166230. [Google Scholar] [CrossRef] [PubMed] [Green Version]
- Jones, W.; Bianchi, K. Aerobic glycolysis: Beyond proliferation. Front. Immunol. 2015, 6, 227. [Google Scholar] [CrossRef] [PubMed] [Green Version]
- Vander Heiden, M.G.; Cantley, L.C.; Thompson, C.B. Understanding the Warburg effect: The metabolic requirements of cell proliferation. Science 2009, 324, 1029–1033. [Google Scholar] [CrossRef] [PubMed] [Green Version]
- Mathupala, S.P.; Ko, Y.H.; Pedersen, P.L. Hexokinase-2 bound to mitochondria: Cancer’s stygian link to the “Warburg Effect” and a pivotal target for effective therapy. Semin. Cancer Biol. 2009, 19, 17–24. [Google Scholar] [CrossRef] [PubMed] [Green Version]
- Jiang, S.; Zhang, L.F.; Zhang, H.W.; Hu, S.; Lu, M.H.; Liang, S.; Li, B.; Li, Y.; Li, D.; Wang, E.D.; et al. A novel miR-155/miR-143 cascade controls glycolysis by regulating hexokinase 2 in breast cancer cells. EMBO J. 2012, 31, 1985–1998. [Google Scholar] [CrossRef] [Green Version]
- Riddle, S.R.; Ahmad, A.; Ahmad, S.; Deeb, S.S.; Malkki, M.; Schneider, B.K.; Allen, C.B.; White, C.W. Hypoxia induces hexokinase II gene expression in human lung cell line A549. Am. J. Physiol. Lung Cell Mol. Physiol. 2000, 278, L407–L416. [Google Scholar] [CrossRef] [PubMed] [Green Version]
- Mathupala, S.P.; Rempel, A.; Pedersen, P.L. Glucose catabolism in cancer cells: Identification and characterization of a marked activation response of the type II hexokinase gene to hypoxic conditions. J. Biol. Chem. 2001, 276, 43407–43412. [Google Scholar] [CrossRef] [PubMed] [Green Version]
- Roberts, D.J.; Miyamoto, S. Hexokinase II integrates energy metabolism and cellular protection: Akting on mitochondria and TORCing to autophagy. Cell Death Differ. 2015, 22, 248–257. [Google Scholar] [CrossRef] [Green Version]
- Gurel, E.; Ustunova, S.; Kapucu, A.; Yilmazer, N.; Eerbeek, O.; Nederlof, R.; Hollmann, M.W.; Demirci-Tansel, C.; Zuurbier, C.J. Hexokinase cellular trafficking in ischemia-reperfusion and ischemic preconditioning is altered in type I diabetic heart. Mol. Biol. Rep. 2013, 40, 4153–4160. [Google Scholar] [CrossRef] [PubMed]
- Chehtane, M.; Khaled, A.R. Interleukin-7 mediates glucose utilization in lymphocytes through transcriptional regulation of the hexokinase II gene. Am. J. Physiol. Cell Physiol. 2010, 298, C1560–C1571. [Google Scholar] [CrossRef] [Green Version]
- Culbert, A.A.; Tavare, J.M. Multiple signalling pathways mediate insulin-stimulated gene expression in 3T3-L1 adipocytes. Biochim. Biophys. Acta 2002, 1578, 43–50. [Google Scholar] [CrossRef]
- Lee, A.W.; States, D.J. Colony-stimulating factor-1 requires PI3-kinase-mediated metabolism for proliferation and survival in myeloid cells. Cell Death Differ. 2006, 13, 1900–1914. [Google Scholar] [CrossRef] [PubMed] [Green Version]
- Osawa, H.; Sutherland, C.; Robey, R.B.; Printz, R.L.; Granner, D.K. Analysis of the signaling pathway involved in the regulation of hexokinase II gene transcription by insulin. J. Biol. Chem. 1996, 271, 16690–16694. [Google Scholar] [CrossRef] [Green Version]
- Duarte, A.I.; Santos, P.; Oliveira, C.R.; Santos, M.S.; Rego, A.C. Insulin neuroprotection against oxidative stress is mediated by Akt and GSK-3beta signaling pathways and changes in protein expression. Biochim. Biophys. Acta 2008, 1783, 994–1002. [Google Scholar] [CrossRef] [PubMed] [Green Version]
- Vogt, C.; Ardehali, H.; Iozzo, P.; Yki-Jarvinen, H.; Koval, J.; Maezono, K.; Pendergrass, M.; Printz, R.; Granner, D.; DeFronzo, R.; et al. Regulation of hexokinase II expression in human skeletal muscle in vivo. Metabolism 2000, 49, 814–818. [Google Scholar] [CrossRef]
- Jin, F.; Wang, Y.; Zhu, Y.; Li, S.; Liu, Y.; Chen, C.; Wang, X.; Zen, K.; Li, L. The miR-125a/HK2 axis regulates cancer cell energy metabolism reprogramming in hepatocellular carcinoma. Sci. Rep. 2017, 7, 3089. [Google Scholar] [CrossRef] [Green Version]
- Kim, T.M.; Huang, W.; Park, R.; Park, P.J.; Johnson, M.D. A developmental taxonomy of glioblastoma defined and maintained by MicroRNAs. Cancer Res. 2011, 71, 3387–3399. [Google Scholar] [CrossRef] [PubMed] [Green Version]
- Parker, N.R.; Correia, N.; Crossley, B.; Buckland, M.E.; Howell, V.M.; Wheeler, H.R. Correlation of MicroRNA 132 Up-regulation with an Unfavorable Clinical Outcome in Patients with Primary Glioblastoma Multiforme Treated with Radiotherapy Plus Concomitant and Adjuvant Temozolomide Chemotherapy. Transl. Oncol. 2013, 6, 742–748. [Google Scholar] [CrossRef] [Green Version]
- Henriksen, M.; Johnsen, K.B.; Olesen, P.; Pilgaard, L.; Duroux, M. MicroRNA expression signatures and their correlation with clinicopathological features in glioblastoma multiforme. Neuromol. Med. 2014, 16, 565–577. [Google Scholar] [CrossRef]
- Malzkorn, B.; Wolter, M.; Liesenberg, F.; Grzendowski, M.; Stuhler, K.; Meyer, H.E.; Reifenberger, G. Identification and functional characterization of microRNAs involved in the malignant progression of gliomas. Brain Pathol. 2010, 20, 539–550. [Google Scholar] [CrossRef]
- Low, S.Y.; Ho, Y.K.; Too, H.P.; Yap, C.T.; Ng, W.H. MicroRNA as potential modulators in chemoresistant high-grade gliomas. J. Clin. Neurosci. 2014, 21, 395–400. [Google Scholar] [CrossRef] [PubMed]
- Huang, S.W.; Ali, N.D.; Zhong, L.; Shi, J. MicroRNAs as biomarkers for human glioblastoma: Progress and potential. Acta Pharmacol. Sin. 2018, 39, 1405–1413. [Google Scholar] [CrossRef] [PubMed] [Green Version]


Publisher’s Note: MDPI stays neutral with regard to jurisdictional claims in published maps and institutional affiliations. |
© 2021 by the authors. Licensee MDPI, Basel, Switzerland. This article is an open access article distributed under the terms and conditions of the Creative Commons Attribution (CC BY) license (https://creativecommons.org/licenses/by/4.0/).
Share and Cite
Kim, J.; Park, M.W.; Park, Y.J.; Ahn, J.W.; Sim, J.M.; Kim, S.; Heo, J.; Jeong, J.H.; Lee, M.; Lim, J.; et al. miR-542-3p Contributes to the HK2-Mediated High Glycolytic Phenotype in Human Glioma Cells. Genes 2021, 12, 633. https://0-doi-org.brum.beds.ac.uk/10.3390/genes12050633
Kim J, Park MW, Park YJ, Ahn JW, Sim JM, Kim S, Heo J, Jeong JH, Lee M, Lim J, et al. miR-542-3p Contributes to the HK2-Mediated High Glycolytic Phenotype in Human Glioma Cells. Genes. 2021; 12(5):633. https://0-doi-org.brum.beds.ac.uk/10.3390/genes12050633
Chicago/Turabian StyleKim, Junhyung, Min Woo Park, Young Joon Park, Ju Won Ahn, Jeong Min Sim, Suwan Kim, Jinhyung Heo, Ji Hun Jeong, Mihye Lee, Jaejoon Lim, and et al. 2021. "miR-542-3p Contributes to the HK2-Mediated High Glycolytic Phenotype in Human Glioma Cells" Genes 12, no. 5: 633. https://0-doi-org.brum.beds.ac.uk/10.3390/genes12050633