
How Depressing Is Inbreeding? A Meta-Analysis of 30 Years of Research on the Effects of Inbreeding in Livestock


1
Animal Breeding and Genomics, Wageningen University & Research, 6700 AH Wageningen, The Netherlands
2
Centre for Genetic Resources the Netherlands, Wageningen University & Research, 6700 AA Wageningen, The Netherlands
*
Author to whom correspondence should be addressed.
Genes 2021, 12(6), 926; https://0-doi-org.brum.beds.ac.uk/10.3390/genes12060926
Submission received: 22 May 2021
/
Revised: 12 June 2021
/
Accepted: 15 June 2021
/
Published: 18 June 2021
(This article belongs to the Special Issue Inbreeding)
Abstract
:Inbreeding depression has been widely documented for livestock and other animal and plant populations. Inbreeding is generally expected to have a stronger unfavorable effect on fitness traits than on other traits. Traditionally, the degree of inbreeding depression in livestock has been estimated as the slope of the linear regression of phenotypic values on pedigree-based inbreeding coefficients. With the increasing availability of SNP-data, pedigree inbreeding can now be replaced by SNP-based measures. We performed a meta-analysis of 154 studies, published from 1990 to 2020 on seven livestock species, and compared the degree of inbreeding depression (1) across different trait groups, and (2) across different pedigree-based and SNP-based measures of inbreeding. Across all studies and traits, a 1% increase in pedigree inbreeding was associated with a median decrease in phenotypic value of 0.13% of a trait’s mean, or 0.59% of a trait’s standard deviation. Inbreeding had an unfavorable effect on all sorts of traits and there was no evidence for a stronger effect on primary fitness traits (e.g., reproduction/survival traits) than on other traits (e.g., production traits or morphological traits). p-values of inbreeding depression estimates were smaller for SNP-based inbreeding measures than for pedigree inbreeding, suggesting more power for SNP-based measures. There were no consistent differences in p-values for percentage of homozygous SNPs, inbreeding based on runs of homozygosity (ROH) or inbreeding based on a genomic relationship matrix. The number of studies that directly compares these different measures, however, is limited and comparisons are furthermore complicated by differences in scale and arbitrary definitions of particularly ROH-based inbreeding. To facilitate comparisons across studies in future, we provide the dataset with inbreeding depression estimates of 154 studies and stress the importance of always reporting detailed information (on traits, inbreeding coefficients, and models used) along with inbreeding depression estimates.
1. Introduction
Inbreeding depression refers to the decrease in mean phenotypic value with increased levels of inbreeding [1,2]. The phenomenon of inbreeding depression was already documented in the 19th century by Charles Darwin, who studied 57 plant species and observed that the offspring of self-fertilized plants were shorter, weighed less, flowered later, and produced fewer seeds than the offspring of unrelated plants [3,4]. Since Darwin’s time, inbreeding depression has been documented for a wide range of plant and animal species and for both wild and domestic populations [5,6,7,8,9,10].
Inbreeding depression is caused by an increase in homozygosity associated with inbreeding, which reduces the expression of dominance effects [1,2]. When dominance effects are on average favorable (i.e., when there is directional dominance in the favorable direction), the reduced expression of dominance effects results in a decrease in mean phenotypic value. In the absence of epistasis, the expected decrease in mean phenotypic value is linear and equals , where is the genome-wide inbreeding coefficient, is the dominance effect at locus , and and are the allelic frequencies at locus [1,2]. In the presence of epistasis, the relationship between mean phenotypic value and inbreeding may be nonlinear. Although deviations from linearity have been observed in some livestock populations (e.g., [11,12,13,14]), it is difficult to determine whether such deviations are truly the result of epistasis or are due to statistical artifacts [2]. Hence, a linear relationship between mean phenotypic value and inbreeding is commonly assumed.
The degree of inbreeding depression may differ across traits. Differences across traits may exist due to variation in the (relative) size of dominance effects, in the extent to which dominance effects act in the same direction or not, and in the role of epistasis. Meta-analyses among wild, zoo, and laboratory animal populations have suggested stronger inbreeding depression for primary fitness traits (e.g., fecundity, survival and development) than for morphometric traits (e.g., adult body size) and physiological traits (e.g., metabolic markers and parasite resistance) [2,6,7]. More recent analyses in wild and livestock populations, however, do not necessarily support this hypothesis [8,10].
Traditionally, the degree of inbreeding depression is quantified as the slope of the linear regression of phenotypes on pedigree-based inbreeding coefficients. With the increasing availability of genomic information, in particular single nucleotide polymorphism (SNP) data, pedigree inbreeding can be replaced by SNP-based inbreeding measures [15,16,17]. SNP-based measures include the percentage of homozygous SNPs [18], inbreeding derived from the diagonal of a genomic-relationship matrix (GRM) [19,20], and inbreeding based on runs of homozygosity (ROH) [21]. SNP-based measures may better predict homozygosity across the genome and, consequently, may better capture the negative consequences of homozygosity than pedigree inbreeding [22,23]. Among SNP-based measures, some may better estimate inbreeding depression than others. Various simulation studies have compared the use of different SNP-based measures for estimating inbreeding depression, with somewhat mixed results [22,24,25,26,27,28]. It would be valuable to summarize the findings from empirical studies comparing inbreeding depression estimates obtained from different pedigree-based and SNP-based measures of inbreeding.
In this study, we performed a meta-analysis of inbreeding depression estimates in livestock, based on 154 studies published from 1990 to 2020. Thereby, we extend the meta-analysis of Leroy [10], who evaluated 57 studies. Our objective was to assess and compare inbreeding depression estimates (1) across different trait groups, and (2) across different pedigree-based and SNP-based measures of inbreeding. In addition, we stress the importance of reporting detailed information (on traits, inbreeding measures, and models) along with inbreeding depression estimates to facilitate meta-analyses in future.
2. Materials and Methods
2.1. Literature Search
A literature search was performed in Web of Science [29] and Scopus [30] on December 29, 2020. Species included were cattle, pig, chicken, sheep, goat, horse, and rabbit (as in Leroy [10]). The search phrase was (“inbreeding depression” OR “effect* of inbreeding”) AND (cattle OR cow* OR bull* OR pig* OR chicken* OR sheep* OR goat* OR horse* OR rabbit*). In total, 696 hits from Web of Science and 532 hits from Scopus were obtained. After merging these hits and removing duplicates, 766 unique studies remained.
Further filtering was performed with the aim to identify studies that reported inbreeding depression as linear regression coefficients (-values). Studies were discarded when (i) they were published before 1990; (ii) they were about non-target species (e.g., guinea pigs, horseshoe bats, or rabbiteye blueberries); (iii) they were about non-livestock populations (e.g., wild or zoo populations); (iv) they did not report trait means nor standard deviations; (v) they did not report -values, but effects of inbreeding classes; (vi) they used quadratic or exponential regression models, in which the quadratic/exponential effects were significant; (vii) it was unclear if the effects were reported per 1%, 10%, or 100% increase in inbreeding; or (viii) when the full article was not available through the library services of Wageningen University & Research. After filtering using these criteria, a total of 143 studies remained. An additional eight studies, which were included in the meta-analyses of Leroy [10] or Bezdíček [31] and were not found with the above search strategy, were added to the dataset. Another three studies that were published at the beginning of 2021 were also added. The final dataset included 154 studies [11,12,32,33,34,35,36,37,38,39,40,41,42,43,44,45,46,47,48,49,50,51,52,53,54,55,56,57,58,59,60,61,62,63,64,65,66,67,68,69,70,71,72,73,74,75,76,77,78,79,80,81,82,83,84,85,86,87,88,89,90,91,92,93,94,95,96,97,98,99,100,101,102,103,104,105,106,107,108,109,110,111,112,113,114,115,116,117,118,119,120,121,122,123,124,125,126,127,128,129,130,131,132,133,134,135,136,137,138,139,140,141,142,143,144,145,146,147,148,149,150,151,152,153,154,155,156,157,158,159,160,161,162,163,164,165,166,167,168,169,170,171,172,173,174,175,176,177,178,179,180,181,182,183].
2.2. Inbreeding Depression Estimates and Trait Classification
A total of 2321 inbreeding depression estimates were retrieved from the 154 studies. Studies typically reported multiple estimates for different traits, for different breeds, for direct and parental inbreeding effects and/or for different inbreeding measures. The number of estimates per study ranged from 1 to 436, with a mean of 15.2 and a median of 6. The complete dataset is available in the Supplementary Materials (Table S1).
To reduce the number of unique traits in the analyses, similar traits were combined into a single trait. For example, traits like calving interval, days open, and the interval between calving and insemination were combined into a single trait “fertility interval”. Traits were classified into six trait groups: reproduction/survival, weight/growth, production, conformation, health, and other traits. Classification into trait groups was similar as in Leroy [10], plus an extra group of health traits, which included somatic cell score (SCS), disease traits, and locomotion.
For each trait, the favorable phenotypic direction was determined. For traits where the favorable direction was an increase in mean phenotypic value (e.g., milk yield or body size), the -values were used with their original sign. For traits where the favorable direction was a decrease (e.g., SCS or mortality), the sign of -values was changed. Traits with an optimum or an unclear favorable direction (e.g., foot angle or meat pH) were excluded from the analyses (n = 197 estimates, so that 2124 estimates remained).
2.3. Comparison across Traits and Trait Groups
To enable comparison across traits and trait groups, -values were scaled by dividing them by the trait mean (to obtain ) or trait standard deviation (SD; to obtain ). Not every study reported trait means and SDs. Consequently, the number of available estimates for and equaled 2094 and 1519, respectively. For the comparison across traits and trait groups, SNP-based estimates were excluded (n = 257 for and n = 255 for ). In addition, outliers that were more than 3 SDs away from the mean were excluded (n = 19 for and n = 5 for ). After these edits, 1818 and 1259 pedigree-based estimates remained for and , respectively. Descriptive statistics for and were calculated in R [184]. Skewness and kurtosis were determined with the package “moments” [185]. The following model was then applied:
where was the inbreeding depression estimate (either or ); was the effect of the ith population; was the effect of the jth trait group; and was the error term. Population was defined as the combination of study and breed. Study and breed were combined into a single effect, because many studies focused on a single breed, and breeds were often investigated in a single study. The model was run with the “glm” function in R [184]. Estimated marginal means (EMMs), also known as least square means, were obtained for the different trait groups with the function “emmeans” from the package “emmeans” [186]. Pairwise comparisons between EMMs were performed with the function “pwpm” in emmeans [186], which applies Tukey–Kramer’s procedure to account for multiple testing [187,188]. To study potential differences between individual traits, the same model as above was used, but with instead of . In the latter analysis, traits with less than 10 records were excluded.
2.4. Comparison across Inbreeding Measures
For the comparison across inbreeding measures, the following measures were considered: pedigree inbreeding (), inbreeding based on ROH (), inbreeding derived from the diagonal of a GRM (), inbreeding derived from the diagonal of a GRM computed with allele frequencies of 0.5 (), and the percentage of homozygous SNPs (). Note that and are equivalent, except for a difference in scale, with (Appendix A). Measures based on GRMs were combined into , no matter which GRM was used. Measures based on ROH were considered as , regardless of the criteria used to identify ROH (which can vary substantially, e.g., [189]).
Comparisons were made within studies and within traits. There were 12 studies that reported -values for at least two of the above-mentioned inbreeding measures [129,134,138,146,155,157,160,168,173,177,181,183]. These studies all reported trait means and SDs, which were used to calculate and . The dataset used for the comparisons is provided in the Supplementary Materials (Table S2). A direct comparison of and is inappropriate, because of scale differences between , , , , and [26]. For example, measures the probability of alleles being “identical by state” (IBS) and typically has a mean of 60 to 70% and a SD of 1 to 2%, whereas measures the probability of alleles being “identical by descent” (IBD) with reference to the founder generation and typically has a lower mean and larger SD than (Table S2). To account for such differences, and were standardized by multiplying them by the SD of the inbreeding measure in the corresponding population, so that they were expressed per 1 SD increase in inbreeding (rather than per 1%). For one of the twelve studies [134], scaling was not possible because SDs of inbreeding measures were not reported. This study was therefore excluded from the comparison across inbreeding measures.
Significance of -values was also compared across inbreeding measures. Test statistics were calculated as and these test-statistics were compared to a chi-square distribution with one degree of freedom to obtain approximate p-values (following the Wald test). Smaller p-values indicate a more significant association between inbreeding and phenotypic value and suggest more predictive power to detect inbreeding depression.
3. Results
3.1. Inbreeding Depression Estimates for Different Traits and Trait Groups
Across all studies and traits, the median (mean) pedigree-based and equaled −0.13 (−0.22) and −0.59 (−0.71), respectively. In other words, a 1% increase in was associated with a median decrease in phenotypic value of 0.13% of a trait’s mean, or 0.59% of a trait’s SD. The distributions of and showed substantial kurtosis (i.e., were heavily tailed) and were somewhat negatively skewed (Figure 1).
For each trait group, except for the group “other traits”, the mean and median and were negative (Figure 2). After correcting for the effect of population, the EMMs of and for all groups, except “other traits”, were all negative and most were significantly below zero (Table 1). The EMMs for and for “other traits” were positive but not significantly different from zero (P > 0.05). When ignoring the “other traits” and comparing groups based on , production traits and reproduction/survival traits showed the most depression (EMMs of −0.308 and −0.302, respectively) and conformation traits showed the least depression (EMM of −0.142). The difference between production and reproduction/survival traits on one hand, and conformation traits on the other hand, was also significant (P < 0.05), whereas other pairwise comparisons were not (Table S3). When comparing trait groups based on , weight/growth traits showed the most depression (EMM of −1.071) and reproduction/survival traits showed the least depression (EMM of −0.410). For , there were no significant pairwise comparisons between EMMs of trait groups (except with the group “other traits”; Table S4).
When running a model with individual traits instead of trait groups, the EMMs for individual traits showed substantial variation (Table S5). For , the EMMs ranged from −0.938 to 0.321, with the vast majority below zero (39 out of 44, of which 19 with P < 0.05). The EMMs above zero were not significant (P > 0.05). For , the EMMs ranged from −1.938 to 1.522, with the majority being below zero (26 out of 29, of which there were eight with P < 0.05) and only one EMM was significantly larger than zero (P < 0.05).
3.2. Inbreeding Depression Estimates for Pedigree-Based and SNP-Based Measures of Inbreeding
Standardized and generally correlated well across different inbreeding measures (Figure 3 and Figure 4). The highest correlations were found between and (0.97 for and 0.94 for ). Correlations between and , and correlations between and , were also high (i.e., ≥0.9). The lowest correlations were found between and (0.27 for and 0.52 for ) and between and (0.24 for and 0.47 for ), although it should be noted that these correlations were low due to a single study (shown in purple in Figure 3 and Figure 4).
When comparing the significance of inbreeding depression estimates, SNP-based inbreeding measures generally had lower p-values than pedigree inbreeding (Table 2). For example, had a lower p-value than in 30 out of 38 comparisons (79%). In these comparisons, the median p-value was 0.026 for and 0.131 for . Similarly, the p-values for , and were lower than those for in the majority of comparisons (7 out of 7 for , 21 out of 26 for , and 15 out of 18 for ).
Among the SNP-based measures, no consistent differences in p-values were observed (Table 2). For example, the percentage of comparisons in which the second measure had a lower p-value than the first measure was 57% for the comparisons between and , 56% between and , and 50% between and . The latter was expected because of the equivalence of and (Appendix A). In the comparison between and , had a lower p-value in 25 out of 40 comparisons (62%), but the median p-value was very similar for the two measures (0.037 vs. 0.036). In the comparison between and , had a lower p-value in 10 out of 14 comparisons (71%), whereas the median p-value was smaller for than for (0.009 vs. 0.071). In the comparison between and , had a lower p-value in 100% of the comparisons, but this was based on only three comparisons in a single study.
4. Discussion
In this meta-analysis, 154 studies were evaluated. The objective was to assess and compare the degree of inbreeding depression across different trait groups and across different pedigree-based and SNP-based measures of inbreeding.
Across all studies and traits, a 1% increase in pedigree inbreeding was associated with a median (mean) decrease in phenotypic value of 0.13% (0.22%) of a trait’s mean, or 0.59% (0.71%) of a trait’s standard deviation. These effects are similar to the mean of 0.14% and mean of 0.56% reported by Leroy [10]. Distributions of and showed substantial kurtosis and were negatively skewed (Figure 1). The observed kurtosis might be the result of the final distribution being a mixture of underlying distributions with the same mean, but different SD (where studies with small sample size have a larger SD of estimates). Such a mixture can have a higher kurtosis than the separate distributions, as illustrated in Figure 5. The observed negative skewness could be due to publication bias [7,8,190]. Multiple studies explicitly stated that non-significant estimates were not reported (e.g., [93,130,147,178]). Omitting non-significant results does not necessarily introduce bias, as long as results in both directions are equally likely to be omitted. To further investigate the presence of publication bias, we retrieved the number of records per study (when reported) and made a funnel plot with on the x-axis and the number of records on the y-axis (Figure 6). As expected, the funnel plot showed more variation in -estimates for studies with few records compared to studies with many records. In addition, for studies with relatively few records, positive inbreeding effects were relatively scarce compared to negative outliers, suggesting indeed some degree of publication bias.
Across trait groups, there were some differences in mean and (Table 1, Tables S3 and S4). These differences, however, were not consistent for and and did not support the hypothesis that primary fitness traits such as survival and reproduction exhibit more inbreeding depression than other traits. In fact, when comparing the EMMs of across trait groups, reproduction/survival traits showed the least inbreeding depression (except for the group “other traits”). This is similar to Leroy [10], who reported EMMs for and of −0.222 and −0.336 for reproduction/survival, of −0.092 and −0.473 for conformation, of −0.24 and −0.563 for weight/growth, of −0.351 and −0.817 for production, and of −0.093 and −0.488 for other traits. The relatively mild EMM of for reproduction/survival traits could be the result of such traits generally showing more phenotypic variation due to environmental sources, which is in analogy with the observation that reproduction/survival traits generally have lower heritabilities than other traits, whereas coefficients of genetic variation (also known as “evolvabilities”) tend to be more similar across trait groups [191].
The hypothesis that fitness traits exhibit more inbreeding depression is largely based on results from wildlife and laboratory populations. In a survey among laboratory populations of Drosophila melanogaster, Lynch and Walsh [2] observed a high degree of inbreeding depression for primary fitness traits such as viability, fertility and egg production, and a low degree of inbreeding depression for morphological traits. In a meta-analysis of non-domestic animal populations, DeRose and Roff [6] also reported more inbreeding depression for life history traits (fecundity, survival and development) than for morphological traits (adult body size). They reported a median and of −0.47 and −1.45 for life history traits and of −0.09 and −0.59 for morphological traits. Coltman and Slate [7] performed a meta-analysis on correlations between phenotypes and two measures of genetic variation at microsatellite loci, multilocus heterozygosity (MLH), and mean squared allele size differences (). Using data from domestic and non-domestic populations, they found significant correlations for life history traits (0.0856 for MLH and 0.0479 for ) and smaller non-significant correlations for morphometric traits (0.0052 for MLH and 0.0038 for ) and physiological traits (0.0075 for MLH and 0.0055 for ). It should be noted that these estimates were obtained while not accounting for dependence between estimates from the same studies and the same populations within studies. When they analyzed the average per trait group within study units (“study unit average” approach), the difference between correlations for the different trait groups decreased and confidence intervals overlapped [7]. Chapman et al. [8] found similar results. In their meta-analysis of heterozygosity-fitness correlations, they also found that the study unit average approach resulted in smaller differences in correlations across trait groups than when they treated all records independently. They additionally used a linear mixed model to account for a population effect, which resulted in even more similar correlations across trait groups than the study unit average approach, with confidence intervals that strongly overlapped. With the mixed model, they found a mean correlation (and confidence interval) between phenotype and MLH of 0.098 (0.0674–0.1293) for life history traits, of 0.0611 (0.0302‒0.0919) for morphometric traits, and of 0.0809 (0.0048–0.1560) for physiological traits [8]. Thus, although the empirical results are equivocal, there are indications from wild and laboratory populations that fitness traits might exhibit more inbreeding depression.
There are also theoretical arguments why primary fitness traits would show more inbreeding depression than traits less related to fitness. Inbreeding depression depends on directional dominance, as indicated by the expected inbreeding depression that (in absence of epistasis) equals [1,2]. To exhibit inbreeding depression, a trait should be influenced by dominance effects (resulting in dominance variance) and, more importantly, these dominance effects should be favorable on average. For traits strongly under directional selection such as a primary fitness trait like survival, the average dominance effect is expected to be favorable, because fixation occurs more quickly for loci with an unfavorable dominance effect [2]. For a trait that is less related to fitness as well as for traits under stabilizing selection, directional dominance is expected to be less pronounced because of the lower directional selection pressure.
Given that directional dominance is a function of how much a trait has been selected upon, the results of this meta-analysis (and that of Leroy [10]) are in line with expectation. Livestock populations are typically under directional selection for a combination of production, conformation, growth, reproduction, survival, behavioral and health traits (in addition to natural selection on primary fitness traits). Hence, all of these trait groups may show a similar degree of directional dominance and, consequently, a similar degree of inbreeding depression. This is also in line with the relative dominance variance (i.e., the proportion of dominance variance over phenotypic variance), which appears to be similar across trait groups in livestock. For example, Doekes et al. [192] compared estimates of relative dominance variance across five studies in cattle and found no clear differences between yield, fertility, and health traits. Thus, any breeding goal trait in livestock can be considered under selection just as a fitness trait and may exhibit considerable inbreeding depression.
The efficiency of selection against (partially) deleterious alleles is increased by inbreeding, a process called purging [193,194]. Since livestock populations typically have relatively small effective population sizes (although they may have very large census sizes), purging can be efficient to reduce the inbreeding load in these populations [194]. Since purging acts on all traits under selection, it is not expected to cause differences in the degree of inbreeding depression between traits under selection. Nevertheless, the effective population size influences purging [193,194] and it would be interesting to study the association between effective population size and observed inbreeding depression.
In this meta-analysis, we compared inbreeding depression estimates across different pedigree-based and SNP-based measures by standardizing and (expressing them per 1 SD increase in the inbreeding measure) and by comparing p-values based on reported -values and corresponding standard errors. Alternatively, it has been suggested to compare correlations between inbreeding measures and phenotype [26]. The use of correlations, however, was unfeasible in this meta-analysis, because most livestock studies report inbreeding depression as -values obtained from animal models.
Standardized - and -estimates correlated well across the different pedigree-based and SNP-based inbreeding measures (Figure 3 and Figure 4). These correlations are expected to be largely driven by the correlations between the underlying inbreeding estimators and, with that in mind, they also followed expectation. For example, the high correlations between inbreeding depression estimates for and (0.96 for and 0.92 for ) are in line with the high reported correlations between the coefficients of and in the underlying studies (e.g., 0.81 [129], 0.94 [157], and 0.86 [181]). Similarly, the moderate correlations between inbreeding depression estimates for and (0.52 for and 0.65 for ) are in line with the moderate reported correlations between the coefficients of and in the underlying studies (of e.g., 0.66 [168], 0.63 [177], and 0.60 [181]). p-values of inbreeding depression estimates were smaller for SNP-based inbreeding measures than for pedigree inbreeding (Table 2). SNP-based measures may be more accurate than pedigree inbreeding because the former account for Mendelian sampling (e.g., [195]) and do not depend on pedigree completeness and quality (e.g., [196]). Since measurement errors in the independent variable lead to downward bias in the estimated slope (a statistical phenomenon called “regression dilution”), regression on less accurate pedigree-based coefficients may result in smaller -values than regression on more accurate SNP-based coefficients. The benefit of using SNP-based measures will, among others, depend on the number of SNPs in relation to the genome length and effective population size (e.g., [23]). Having more SNPs available is expected to allow for a better estimation of the realized inbreeding and, therefore, of the realized inbreeding depression. In addition, when SNP-based measures depend on allele frequencies in the population (e.g., ), a sufficient number of individuals is required to accurately estimate allele frequencies.
Since the scale of inbreeding measures strongly influences -values, only pedigree-based estimates were used for the comparison between trait groups. One may argue that the pedigree-based comparison of -values across studies is also inappropriate because the scale of differs across populations (due to differences in pedigree depth). To account for differences in scale of , we initially considered the SD of as an explanatory variable in our model. However, since this SD was available for less than a third of the estimates, and since its effect was not significant in the preliminary analyses, it was removed from the final model (as presented in the Materials and Methods). A population effect, defined as breed within study, was included in the model, which indirectly may have accounted for the population-specific SD of inbreeding coefficients.
No clear differences in effect sizes and p-values were found between inbreeding depression estimates for , , and (Figure 3 and Figure 4 and Table 2). However, it is difficult to draw firm conclusions, because of (1) the limited number of empirical studies directly comparing the different measures; (2) the arbitrary definitions of especially , with many different criteria that are often not fully reported [189]; and (3) not knowing the true inbreeding depression. These limitations can be partly overcome in simulation studies. Various simulations studies have been performed to investigate which SNP-based measure might be most appropriate to estimate inbreeding depression. Keller et al. [22] investigated the correlation between different inbreeding measures and the homozygous mutation load (HML), which they defined as the number of homozygous loci for rare alleles (with MAF < 0.5) in an individual. They found that had more power to detect HML than or excess of SNP-by-SNP homozygosity. Kardos et al. [24] found that SNP-based measures (using 35k SNPs) better explained the variation in realized genomic IBD than (with 20 generations known). They also found that and the excess of SNP-by-SNP homozygosity explained very similar amounts of variation in realized IBD. Yengo et al. [25] used the SNP data of humans and simulated inbreeding depression by assigning phenotypic effects to samples of SNPs. They reported that from Yang’s method [20] performed best. This is a SNP-by-SNP measure with high weight on rare alleles that is also known as (“inbreeding based on the correlation of uniting gametes”). In their study, resulted in the overestimation of inbreeding depression. In the study of Nietlisbach et al. [27], in contrast, provided unbiased results, whereas from Yang’s method [20] resulted in upwardly biased inbreeding depression estimates. Recently, Caballero et al. [28] showed that these (seemingly) contradictory results might be explained by population characteristics. They found that inbreeding depression estimates obtained from were appropriate for populations with small effective sizes (e.g., = 100), but were downwardly biased for populations with large effective sizes (e.g., = 5000), unless sufficiently long ROHs (>5 Mb) were used. Inbreeding depression estimates based on from Yang’s method [20], on the other hand, were upwardly biased for populations with small effective sizes, but were nearly unbiased for populations with large effective sizes. They also studied from VanRaden’s method 2 [19] and , the latter being a measure of the deviation from Hardy–Weinberg frequencies that has a correlation of 1 with and when base allele frequencies are known. These measures always underestimated inbreeding depression. Overall, Caballero et al. [28] concluded that it depends on the population as to which SNP-based inbreeding measure is most appropriate to estimate inbreeding depression.
Aside from providing more powerful measures to detect inbreeding depression, genomic data offer additional opportunities to study the genetic background of inbreeding depression. First, the length of ROHs can be used to study the effect of the age of inbreeding on inbreeding depression, in addition to already existing pedigree-based methods [168,177]. Recent inbreeding may be more harmful than ancient inbreeding, as a result of purging. Using genomic time series, the process of purging could also be studied in more detail. Second, SNP-data can be used to search for genomic regions associated with inbreeding depression (e.g., through ROH scans [192,197,198]). It should be noted, however, that such methods are prone to statistical issues such as multiple testing and tend to go against the infinitesimal model (i.e., the idea that inbreeding depression is predominantly caused through many loci with small effects). Third, with genomic data, it has become possible to study the role of regulatory mechanisms such as methylation, in explaining inbreeding depression [199]. Last, genomic data may help to shed more light on the role of partial dominance, overdominance, and epistasis in explaining inbreeding depression.
Various studies were excluded from this meta-analysis, because they lacked detailed information on the inbreeding depression estimates. Here, we therefore list recommendations on how to report inbreeding depression estimates. First, it is important to report descriptive statistics of the traits that are investigated (number of animals, mean, SD, etc.). This allows future studies, among others, to scale -values (e.g., to and ) and to investigate the effect of population size on the results (as e.g., in Figure 6). The descriptive statistics should be provided for the individuals used in the analysis and, when multiple populations or subgroups (e.g., breeds, sexes, or age classes) are studied, statistics should be reported for each population separately. Second, it is important to provide details on how inbreeding measures were calculated. For , for example, this includes information on pedigree completeness such as the complete generation equivalent or number of complete generations. Again, such statistics should be reported for the individuals used in the analysis and not (only) for the entire pedigree. For , the criteria and approach to identify ROHs should be fully explained. Third, descriptive statistics on the inbreeding measures (distribution, mean, SD) should be provided to enable scaling (as e.g., in Figure 3 and Figure 4). Fourth, when estimating -values, it is important to correct for appropriate fixed effects as well as for additive genetic effects [200] (e.g., with an animal model). Fifth, it should be clearly stated whether -values are expressed per 1%, 10%, or 100% increase in inbreeding. Sixth, for traits such as litter size, calving ease, and success of insemination, it should be clearly stated whether -values correspond to a regression of phenotypes on inbreeding of the offspring/litter, on inbreeding of the dam (‘maternal’), or on inbreeding of the sire (‘paternal’). Seventh, -values should be reported with standard errors and sufficient decimal places to facilitate calculation of test statistics. Eighth, it is important to also report non-significant and/or favorable effects to prevent publication bias. Last, it would be valuable to provide estimates of the effective population size, when available, because the effective population size influences the amount of genetic purging in the population and, thus, the degree of inbreeding depression. Overall, these recommendations should contribute to enable comparisons of inbreeding depression estimates across studies and facilitate meta-analyses in future.
5. Conclusions
Inbreeding has an unfavorable effect on livestock traits. Based on this meta-analysis, a 1% increase in pedigree inbreeding is associated with a median decrease in phenotypic value of 0.13% of a trait’s mean, and 0.59% of a trait’s SD. Various trait groups (i.e., reproduction/survival, weight/growth, conformation, production, and health) show a similar degree of inbreeding depression. p-values of inbreeding depression estimates for SNP-based inbreeding measures were smaller than those for pedigree inbreeding, suggesting more power for SNP-based measures. There were no consistent differences in p-values for percentage of homozygous SNPs, inbreeding based on ROH or inbreeding based on a genomic relationship matrix. Comparisons between measures, however, are difficult because of the limited number of studies that directly compares them, the different scales of measures, and arbitrary definitions for particularly ROH-based inbreeding. To facilitate comparisons across studies in future, we highly recommend always reporting detailed information about inbreeding depression estimates (on traits, inbreeding coefficients, and models used).
Supplementary Materials
The following are available online at https://0-www-mdpi-com.brum.beds.ac.uk/article/10.3390/genes12060926/s1, Table S1: Dataset with inbreeding depression estimates of 154 studies, Table S2: Dataset with inbreeding depression estimates for pedigree-based and SNP-based inbreeding measures of 12 studies, Table S3: Pairwise comparisons of estimated marginal means of between trait groups, Table S4: Pairwise comparisons of estimated marginal means of between trait groups, Table S5: Estimated marginal means of inbreeding depression estimates per trait, with standard errors.
Author Contributions
Conceptualization, H.P.D., P.B. and J.J.W.; Methodology, H.P.D., P.B. and J.J.W.; Formal analysis, H.P.D.; Investigation, H.P.D.; Data curation, H.P.D.; Writing—original draft preparation, H.P.D.; Writing—review and editing, H.P.D., P.B. and J.J.W.; Visualization, H.P.D. All authors have read and agreed to the published version of the manuscript.
Funding
The study was co-funded by the Dutch Ministry of Agriculture, Nature, and Food Quality (KB-34-013-002).
Institutional Review Board Statement
Not applicable.
Informed Consent Statement
Not applicable.
Data Availability Statement
All data and results supporting this study are provided in the main text, Appendix A and Supplementary Materials.
Conflicts of Interest
The authors declare no conflict of interest.
Appendix A
In this appendix, it is explained why inbreeding based on the diagonal of a GRM computed with allele frequencies of 0.5 () is equivalent to the percentage of homozygous SNPs (), except for a difference in scale, with .
When using a GRM, inbreeding for animal j is typically calculated as the diagonal element of the GRM for animal j minus one (i.e., ). For VanRaden’s method 1 [19], the diagonal element of the GRM for animal j is:
where, at the SNP, is the count of allele A (coded as 0, 1 or 2) in animal ; is the allele frequency of allele A and is the allele frequency of allele B; and is the number of SNPs. When allele frequencies of 0.5 are used, this simplifies to:
Since equals 1 when a SNP is homozygous ( or ), or 0 if a SNP is heterozygous (), the numerator is the number of homozygous SNPs ():
and, thus, equals two times the fraction of homozygous SNPs.
For VanRaden’s method 2 [19], which was initially proposed by Leutenegger et al. [201] and Amin et al. [202], the diagonal element of the GRM for animal j is:
which is the same as VanRaden’s method 1, except that the scaling occurs per SNP. When allele frequencies of 0.5 are used, this equation simplifies to:
Since equals 2 when a SNP is homozygous ( or ), or 0 if a SNP is heterozygous (), this equation becomes:
and, thus, again equals two times the fraction of homozygous SNPs.
When allele frequencies of 0.5 are used, this equation simplifies to:
Since equals 1 when a SNP is homozygous ( or ), or −1 if a SNP is heterozygous (), this equation becomes:
where is the number of heterozygous SNPs. Thus, again, equals two times the fraction of homozygous SNPs.
Since inbreeding for animal j is calculated as , and is two times the fraction of homozygous SNPs, , for all three GRMs considered above.
References
- Crow, J.F.; Kimura, M. Inbreeding. In An Introduction to Population Genetics Theory; Harper and Row: New York, NY, USA, 1970. [Google Scholar]
- Lynch, M.; Walsh, B. Inbreeding depression. In Genetics and Analysis of Quantitative Traits, 1st ed.; Sinauer: Sunderland, MA, USA, 1998. [Google Scholar]
- Darwin, C.R. The Variation of Animals and Plants under Domestication, 1st ed.; John Murray: London, UK, 1868. [Google Scholar]
- Darwin, C.R. The Effects of Cross and Self Fertilization in the Vegetable Kingdom, 1st ed.; John Murray: London, UK, 1876. [Google Scholar]
- Crnokrak, P.; Roff, D. Inbreeding depression in the wild. Heredity 1999, 83, 260–270. [Google Scholar] [CrossRef] [Green Version]
- DeRose, M.A.; Roff, D.A. A comparison of inbreeding depression in life-history and morphological traits in animals. Evolution 1999, 53, 288–1292. [Google Scholar] [CrossRef]
- Coltman, D.W.; Slate, J. Microsatellite measures of inbreeding: A meta-analysis. Evolution 2003, 57, 971–983. [Google Scholar] [CrossRef]
- Chapman, J.; Nakagawa, S.; Coltman, D.; Slate, J.; Sheldon, B. A quantitative review of heterozygosity–fitness correlations in animal populations. Mol. Ecol. 2009, 18, 2746–2765. [Google Scholar] [CrossRef]
- Angeloni, F.; Ouborg, N.J.; Leimu, R. Meta-analysis on the association of population size and life history with inbreeding depression in plants. Biol. Conserv. 2011, 144, 35–43. [Google Scholar] [CrossRef]
- Leroy, G. Inbreeding depression in livestock species: Review and meta-analysis. Anim. Genet. 2014, 45, 618–628. [Google Scholar] [CrossRef] [PubMed]
- Croquet, C.; Mayeres, P.; Gillon, A.; Hammami, H.; Soyeurt, H.; Vanderick, S.; Gengler, N. Linear and curvilinear effects of inbreeding on production traits for Walloon Holstein cows. J. Dairy Sci. 2007, 90, 465–471. [Google Scholar] [CrossRef] [Green Version]
- Gulisija, D.; Gianola, D.; Weigel, K.A. Nonparametric analysis of the impact of inbreeding on production in Jersey cows. J. Dairy Sci. 2007, 90, 493–500. [Google Scholar] [CrossRef]
- Thompson, J.R.; Everett, R.W.; Hammerschmidt, N.L. Effects of inbreeding on production and survival in holsteins. J. Dairy Sci. 2000, 83, 1856–1864. [Google Scholar] [CrossRef]
- Casellas, J.; Vidal-Roqueta, D.; Flores, E.; Casellas-Vidal, D.; Llach-Vila, M.; Salgas-Fina, R.; Casellas-Molas, P. Epistasis for founder-specific inbreeding depression in rabbits. J. Hered. 2011, 102, 157–164. [Google Scholar] [CrossRef]
- Howard, J.T.; Pryce, J.E.; Baes, C.; Maltecca, C. Invited review: Inbreeding in the genomics era: Inbreeding, inbreeding depression, and management of genomic variability. J. Dairy Sci. 2017, 100, 6009–6024. [Google Scholar] [CrossRef]
- Baes, C.F.; Makanjuola, B.O.; Miglior, F.; Marras, G.; Howard, J.T.; Fleming, A.; Maltecca, C. Symposium review: The genomic architecture of inbreeding: How homozygosity affects health and performance. J. Dairy Sci. 2019, 102, 2807–2817. [Google Scholar] [CrossRef] [PubMed]
- Maltecca, C.; Tiezzi, F.; Cole, J.B.; Baes, C. Symposium review: Exploiting homozygosity in the era of genomics—Selection, inbreeding, and mating programs. J. Dairy Sci. 2020, 103, 5302–5313. [Google Scholar] [CrossRef] [PubMed]
- Malécot, G. Mathématiques de l’Hérédité; Masson & Cie: Paris, France, 1948. (In French) [Google Scholar]
- VanRaden, P.M. Efficient methods to compute genomic predictions. J. Dairy Sci. 2008, 91, 4414–4423. [Google Scholar] [CrossRef] [PubMed] [Green Version]
- Yang, J.; Benyamin, B.; McEvoy, B.P.; Gordon, S.; Henders, A.K.; Nyholt, D.R.; Madden, P.A.; Heath, A.C.; Martin, N.G.; Montgomery, G.W. SNPs explain a large proportion of the heritability for human height. Nat. Genet. 2010, 42, 565–569. [Google Scholar] [CrossRef] [PubMed] [Green Version]
- McQuillan, R.; Leutenegger, A.L.; Abdel–Rahman, R.; Franklin, C.S.; Pericic, M.; Barac-Lauc, L.; Smolej-Narancic, N.; Janicijevic, B.; Polasek, O.; Tenesa, A. Runs of homozygosity in European populations. Am. J. Hum. Genet. 2008, 83, 359–372. [Google Scholar] [CrossRef] [PubMed] [Green Version]
- Keller, M.C.; Visscher, P.M.; Goddard, M.E. Quantification of inbreeding due to distant ancestors and its detection using dense single nucleotide polymorphism data. Genetics 2011, 189, 237–249. [Google Scholar] [CrossRef] [Green Version]
- Wang, J. Pedigrees or markers: Which are better in estimating relatedness and inbreeding coefficient? Theor. Popul. Biol. 2016, 107, 4–13. [Google Scholar] [CrossRef]
- Kardos, M.; Luikart, G.; Allendorf, F.W. Measuring individual inbreeding in the age of genomics: Marker-based measures are better than pedigrees. Heredity 2015, 115, 63–72. [Google Scholar] [CrossRef]
- Yengo, L.; Zhu, Z.; Wray, N.R.; Weir, B.S.; Yang, J.; Robinson, M.R.; Visscher, P.M. Detection and quantification of inbreeding depression for complex traits from SNP data. Proc. Natl. Acad. Sci. USA 2017, 114, 8602–8607. [Google Scholar] [CrossRef] [Green Version]
- Kardos, M.; Nietlisbach, P.; Hedrick, P.W. How should we compare different genomic estimates of the strength of inbreeding depression? Proc. Natl. Acad. Sci. USA 2018, 115, E2492–E2493. [Google Scholar] [CrossRef] [PubMed] [Green Version]
- Nietlisbach, P.; Muff, S.; Reid, J.M.; Whitlock, M.C.; Keller, L.F. Nonequivalent lethal equivalents: Models and inbreeding metrics for unbiased estimation of inbreeding load. Evol. Appl. 2019, 12, 266–279. [Google Scholar] [CrossRef] [PubMed]
- Caballero, A.; Villanueva, B.; Druet, T. On the estimation of inbreeding depression using different measures of inbreeding from molecular markers. Evol. Appl. 2021, 14, 416–428. [Google Scholar] [CrossRef]
- Clarivate Analytics. Web of Science. 2020. Available online: Login.webofknowledge.com (accessed on 29 December 2020).
- Elsevier. Scopus. 2020. Available online: www.scopus.com (accessed on 29 December 2020).
- Bezdícek, J. Effects of inbreeding on milk production, reproduction and type traits in dairy cattle. Züchtungskunde 2017, 89, 475–491. [Google Scholar]
- Ercanbrack, S.K.; Knight, A.D. Effects of inbreeding on reproduction and wool production of Rambouillet, Targhee, and Columbia ewes. J. Anim. Sci. 1991, 69, 4734–4744. [Google Scholar] [CrossRef]
- Flock, D.K.; Ameli, H.; Glodek, P. Inbreeding and heterosis effects on quantitative traits in a White Leghorn population under long-term reciprocal recurrent selection. Br. Poult. Sci. 1991, 32, 451–462. [Google Scholar] [CrossRef] [PubMed]
- Hoeschele, I. Additive and nonadditive genetic variance in female fertility of Holsteins. J. Dairy Sci. 1991, 74, 1743–1752. [Google Scholar] [CrossRef]
- Casanova, L.; Hagger, C.; Kuenzi, N.; Schneeberger, M. Inbreeding in Swiss Braunvieh and its influence on breeding values predicted from a repeatability animal model. J. Dairy Sci. 1992, 75, 1119–1126. [Google Scholar] [CrossRef]
- Gandini, G.C.; Bagnato, A.; Miglior, F.; Pagnacco, G. Inbreeding in the Italian Haflinger horse. J. Anim. Breed. Genet. 1992, 109, 433–443. [Google Scholar] [CrossRef]
- Wiener, G.; Lee, G.J.; Woolliams, J.A. Effects of rapid inbreeding and of crossing of inbred lines on conception rate, prolificacy and ewe survival in sheep. Anim. Sci. 1992, 55, 115–121. [Google Scholar] [CrossRef]
- Wiener, G.; Lee, G.J.; Woolliams, J.A. Effects of rapid inbreeding and of crossing inbred lines on the growth of linear body dimensions of sheep. Anim. Sci. 1992, 55, 101–114. [Google Scholar] [CrossRef]
- Wiener, G.; Lee, G.J.; Woolliams, J.A. Effects of rapid inbreeding and of crossing of inbred lines on the body weight growth of sheep. Anim. Sci. 1992, 55, 89–99. [Google Scholar] [CrossRef]
- Erasmus, G.J.; Van Wyk, J.B.; Konstantinov, K.V. Inbreeding in the Elsenburg Dormer sheep stud. S. Afr. J. Anim. Sci. 1993, 23, 77–80. [Google Scholar]
- Christensen, K.; Jensen, P.; Jørgensen, J.N. A note on effect of inbreeding on production traits in pigs. Anim. Prod. 1994, 58, 298–300. [Google Scholar] [CrossRef]
- Fuerst, C.; Sölkner, J. Additive and nonadditive genetic variances for milk yield, fertility, and lifetime performance traits of dairy cattle. J. Dairy Sci. 1994, 77, 1114–1125. [Google Scholar] [CrossRef]
- Miglior, F.; Burnside, E.B.; Hohenboken, W.D. Heterogeneity among families of Holstein cattle in inbreeding depression for production traits. In Proceedings of the 5th World Congress on Genetics Applied to Livestock Production, Guelph, ON, Canada, 7–12 August 1994; pp. 479–482. [Google Scholar]
- Rodriguez, C.; Rodriganez, J.; Silio, L. Genetic analysis of maternal ability in Iberian pigs. J. Anim. Breed. Genet. 1994, 111, 220–227. [Google Scholar] [CrossRef] [PubMed]
- Miglior, F.; Burnside, E.B.; Dekkers, J.C. Nonadditive genetic effects and inbreeding depression for somatic cell counts of Holstein cattle. J. Dairy Sci. 1995, 78, 1168–1173. [Google Scholar] [CrossRef]
- Miglior, F.; Burnside, E.B.; Kennedy, B.W. Production traits of Holstein cattle: Estimation of nonadditive genetic variance components and inbreeding depression. J. Dairy Sci. 1995, 78, 1174–1180. [Google Scholar] [CrossRef]
- Sigurdsson, A.; Jonmundsson, J.V. Inbreeding and its impact in the closed population of Icelandic dairy cattle. Acta Agric. Scand. Anim. Sci. 1995, 45, 11–16. [Google Scholar] [CrossRef]
- Bergmann, J.A.G.; Costa, M.D.; Mourao, G.B. Inbreeding effects on morphological traits of Brasileira pony breed. Arq. Bras. Med. Vet. 1997, 49, 103–111. [Google Scholar]
- Boujenane, I.; Chami, A. Effects of inbreeding on reproduction, weights and survival of Sardi and Beni Guil sheep. J. Anim. Breed. Genet. 1997, 114, 23–31. [Google Scholar] [CrossRef]
- Kaygisiz, A. Effect of inbreeding on reproductive traits of Brown Swiss cattle. Indian J. Anim. Sci. 1997, 67, 67–69. [Google Scholar]
- Misztal, I.; Lawlor, T.J.; Gengler, N. Relationships among estimates of inbreeding depression, dominance and additive variance for linear traits in Holsteins. Genet. Sel. Evol. 1997, 29, 319–326. [Google Scholar] [CrossRef]
- Analla, M.; Montilla, J.M.; Serradilla, J.M. Analyses of lamb weight and ewe litter size in various lines of Spanish Merino sheep. Small Rumin. Res. 1998, 29, 255–259. [Google Scholar] [CrossRef]
- Burrow, H.M. The effects of inbreeding on productive and adaptive traits and temperament of tropical beef cattle. Livest. Prod. Sci. 1998, 55, 227–243. [Google Scholar] [CrossRef]
- Culbertson, M.S.; Mabry, J.W.; Misztal, I.; Gengler, N.; Bertrand, J.K.; Varona, L. Estimation of dominance variance in purebred Yorkshire swine. J. Anim. Sci. 1998, 76, 448–451. [Google Scholar] [CrossRef] [PubMed]
- Deb, S.M. Performance of pashmina (cashmere) goats on Kumaon Himalayas. Indian J. Anim. Sci. 1998, 68, 954–956. [Google Scholar]
- Gengler, N.; Misztal, I.; Bertrand, J.K.; Culbertson, M.S. Estimation of the dominance variance for postweaning gain in the US Limousin population. J. Anim. Sci. 1998, 76, 2515–2520. [Google Scholar] [CrossRef] [PubMed]
- Pariacote, F.; Van Vleck, L.D.; MacNeil, M.D. Effects of inbreeding and heterozygosity on preweaning traits in a closed population of Herefords under selection. J. Anim. Sci. 1998, 76, 1303–1310. [Google Scholar] [CrossRef] [PubMed] [Green Version]
- Rodrigáñez, J.; Toro, M.A.; Rodriguez, M.C.; Silió, L. Effect of founder allele survival and inbreeding depression on litter size in a closed line of Large White pigs. Anim. Sci. 1998, 67, 573–582. [Google Scholar] [CrossRef]
- Smith, L.A.; Cassell, B.G.; Pearson, R.E. The effects of inbreeding on the lifetime performance of dairy cattle. J. Dairy Sci. 1998, 81, 2729–2737. [Google Scholar] [CrossRef]
- Analla, B.M.; Montilla, J.M.; Serradilla, J.M. Study of the variability of the response to inbreeding for meat production in Merino sheep. J. Anim. Breed. Genet. 1999, 116, 481–488. [Google Scholar] [CrossRef]
- Patiabadi, Z.; Varkoohi, S.; Savar-Sofla, S. Inbreeding and inbreeding depression on body weight in Iranian Shal sheep. Iran. J. Appl. Anim. Sci. 1999, 6, 887–893. [Google Scholar]
- Savas, T.; Preisinger, R.; Roehe, R.; Kalm, E.; Flock, D.K. Effect of inbreeding on production traits and their genetic parameters in laying hens. Arch. Geflügelk. 1999, 63, 246–251. [Google Scholar]
- Sewalem, A.; Johansson, K.; Wilhelmson, M.; Lillpers, K. Inbreeding and inbreeding depression on reproduction and production traits of White Leghorn lines selected for egg production traits. Br. Poult. Sci. 1999, 40, 203–208. [Google Scholar] [CrossRef] [PubMed]
- Farghaly, H.M. Influence of inbreeding level on economic traits of imported rabbit populations in Egypt. Indian J. Anim. Sci. 2000, 70, 1077–1080. [Google Scholar]
- Moura, A.S.A.; Polastre, R.; Wechsler, F.S. Dam and litter inbreeding and environmental effects on litter performance in Botucatu rabbits. World Rabbit Sci. 2000, 8, 151–157. [Google Scholar]
- Duangjinda, M.; Bertrand, J.K.; Misztal, I.; Druet, T. Estimation of additive and nonadditive genetic variances in Hereford, Gelbvieh, and Charolais by Method R. J. Anim. Sci. 2001, 79, 2997–3001. [Google Scholar] [CrossRef] [PubMed] [Green Version]
- Falcão, A.J.D.S.; Martins-Filho, R.; Magnabosco, C.D.U.; Bozzi, R.; Lima, F.D.A.M. Effects of inbreeding on reproductive and growth traits, and breeding values in a closed Brown Swiss herd. Rev. Bras. Zootec. 2001, 30, 83–92. [Google Scholar] [CrossRef] [Green Version]
- Biffani, S.; Samoré, A.B.; Canavesi, F. Inbreeding depression for production, reproduction and functional traits in Italian Holstein cattle. In Proceedings of the 7th World Congress on Genetics Applied to Livestock Production, Montpellier, France, 19–23 August 2002; pp. 19–23. [Google Scholar]
- Fernández, A.; Rodrigáñez, J.; Toro, M.A.; Rodríguez, M.C.; Silió, L. Inbreeding effects on the parameters of the growth function in three strains of Iberian pigs. J. Anim. Sci. 2002, 80, 2267–2275. [Google Scholar] [CrossRef]
- Fioretti, M.; Rosati, A.; Pieramati, C.; VanVleck, L.D. Effect of including inbreeding coefficients for animal and dam on estimates of genetic parameters and prediction of breeding values for reproductive and growth traits of Piedmontese cattle. Livest. Prod. Sci. 2002, 74, 137–145. [Google Scholar] [CrossRef]
- Negussie, E.; Abegaz, S.; Rege, J.O.E. Genetic trend and effects of inbreeding on growth performance of tropical fat-tailed sheep. In Proceedings of the 7th World Congress on Genetics Applied to Livestock Production, Montpellier, France, 19–23 August 2002; p. 4. [Google Scholar]
- Cassell, B.G.; Adamec, V.; Pearson, R.E. Effect of incomplete pedigrees on estimates of inbreeding and inbreeding depression for days to first service and summit milk yield in Holsteins and Jerseys. J. Dairy Sci. 2003, 86, 2967–2976. [Google Scholar] [CrossRef]
- Cassell, B.G.; Adamec, V.; Pearson, R.E. Maternal and fetal inbreeding depression for 70-day nonreturn and calving rate in Holsteins and Jerseys. J. Dairy Sci. 2003, 86, 2977–2983. [Google Scholar] [CrossRef]
- Curik, I.; Zechner, P.; Sölkner, J.; Achmann, R.; Bodo, I.; Dovc, P.; Kavar, T.; Marti, E.; Brem, G. Inbreeding, microsatellite heterozygosity, and morphological traits in Lipizzan horses. J. Hered. 2003, 94, 125–132. [Google Scholar] [CrossRef] [Green Version]
- Szwaczkowski, T.; Cywa-Benko, K.; Wezyk, S. A note on inbreeding effect on productive and reproductive traits in laying hens. Anim. Sci. Pap. Rep. 2003, 21, 121–129. [Google Scholar]
- Uzmay, C.; Akbaş, Y. The Level of Inbreeding and Its Effects on Milk Yield, Age at First Calving and Calf Mortality in Holstein Cattle Reared on the Agricultural Faculty Farm of Ege University. Turk. J. Vet. Anim. Sci. 2003, 27, 935–941. [Google Scholar]
- Mandal, A.; Pant, K.P.; Rout, P.K.; Roy, R. Effects of inbreeding on lamb survival in a flock of Muzaffarnagari sheep. Asian Aust. J. Anim. Sci. 2004, 17, 594–597. [Google Scholar] [CrossRef]
- Sevinga, M.; Vrijenhoek, T.; Hesselink, J.W.; Barkema, H.W.; Groen, A.F. Effect of inbreeding on the incidence of retained placenta in Friesian horses. J. Anim. Sci. 2004, 82, 982–986. [Google Scholar] [CrossRef] [PubMed]
- Singh, M.K.; Gurnani, M. Trend and effect of inbreeding on survivability and performance traits in closed herd of Karan Swiss and Karan Fries cattle. Indian J. Anim. Sci. 2004, 74, 640–643. [Google Scholar]
- Kumari, B.P.; Rao, C.H.; Reddy, K.K. Effect of inbreeding on some economic traits of indigenous pigs. Indian J. Anim. Sci. 2005, 75, 949–952. [Google Scholar]
- Mandal, A.; Pant, K.P.; Notter, D.R.; Rout, P.K.; Roy, R.; Sinha, N.K.; Sharma, N. Studies on inbreeding and its effects on growth and fleece traits of Muzaffarnagari sheep. Asian Aust. J. Anim. Sci. 2005, 18, 1363–1367. [Google Scholar] [CrossRef]
- Sierszchulski, J.; Helak, M.; Wolc, A.; Szwaczkowski, T.; Schlote, W. Inbreeding rate and its effect on three body conformation traits in Arab mares. Anim. Sci. Pap. Rep. 2005, 23, 51–59. [Google Scholar]
- Wall, E.; Brotherstone, S.; Kearney, J.F.; Woolliams, J.A.; Coffey, M.P. Impact of nonadditive genetic effects in the estimation of breeding values for fertility and correlated traits. J. Dairy Sci. 2005, 88, 376–385. [Google Scholar] [CrossRef] [Green Version]
- Adamec, V.; Cassell, B.G.; Smith, E.P.; Pearson, R.E. Effects of inbreeding in the dam on dystocia and stillbirths in US Holsteins. J. Dairy Sci. 2006, 89, 307–314. [Google Scholar] [CrossRef]
- Croquet, C.; Mayeres, P.; Gillon, A.; Vanderick, S.; Gengler, N. Inbreeding depression for global and partial economic indexes, production, type, and functional traits. J. Dairy Sci. 2006, 89, 2257–2267. [Google Scholar] [CrossRef] [Green Version]
- Kawahara, T.; Gotoh, Y.; Yamaguchi, S.; Suzuki, M. Variance component estimates with dominance models for milk production in Holsteins of Japan using method R. Asian Aust. J. Anim. Sci. 2006, 19, 769–774. [Google Scholar] [CrossRef]
- Ruiz-Flores, A.; Nunez-Dominguez, R.; Ramirez-Valverde, R.; Dominguez-Viveros, J.; Mendoza-Dominguez, M.; Martinez-Cuevas, E. Levels and effects of inbreeding on growth and reproductive traits in Tropicarne and Brown Swiss cattle. Agrociencia 2006, 40, 289–301. [Google Scholar]
- Sørensen, A.C.; Madsen, P.; Sørensen, M.K.; Berg, P. Udder health shows inbreeding depression in Danish Holsteins. J. Dairy Sci. 2006, 89, 4077–4082. [Google Scholar] [CrossRef]
- VanRaden, P.M.; Miller, R.H. Effects of nonadditive genetic interactions, inbreeding, and recessive defects on embryo and fetal loss by seventy days. J. Dairy Sci. 2006, 89, 2716–2721. [Google Scholar] [CrossRef]
- Farkas, J.; Curik, I.; Csató, L.; Csörnyei, Z.; Baumung, R.; Nagy, I. Bayesian inference of inbreeding effects on litter size and gestation length in Hungarian Landrace and Hungarian Large White pigs. Livest. Sci. 2007, 112, 109–114. [Google Scholar] [CrossRef]
- Khan, M.S.; Ali, A.; Hyder, A.U. Effect of inbreeding on growth and reproduction traits of Beetal goats. Arch. Anim. Breed. 2007, 50, 197–203. [Google Scholar] [CrossRef] [Green Version]
- Mc Parland, S.; Kearney, J.F.; Rath, M.; Berry, D.P. Inbreeding effects on milk production, calving performance, fertility, and conformation in Irish Holstein-Friesians. J. Dairy Sci. 2007, 90, 4411–4419. [Google Scholar] [CrossRef]
- Norberg, E.; Sørensen, A.C. Inbreeding trend and inbreeding depression in the Danish populations of Texel, Shropshire, and Oxford Down. J. Anim. Sci. 2007, 85, 299–304. [Google Scholar] [CrossRef]
- Vígh, Z.; Gyovai, P.; Csató, L.; Bokor, Á.; Farkas, J.; Nagy, I. Effect of inbreeding on loin and fat depth in Hungarian Landrace pigs. Poljoprivreda 2007, 13, 41–45. [Google Scholar]
- Carolino, N.; Gama, L.T. Inbreeding depression on beef cattle traits: Estimates, linearity of effects and heterogeneity among sire-families. Genet. Sel. Evol. 2008, 40, 1–17. [Google Scholar]
- Maiwashe, A.; Nephawe, K.A.; Theron, H.E. Estimates of genetic parameters and effect of inbreeding on milk yield and composition in South African Jersey cows. S. Afr. J. Anim. Sci. 2008, 38, 119–125. [Google Scholar]
- Mc Parland, S.; Kearney, J.F.; MacHugh, D.E.; Berry, D.P. Inbreeding effects on postweaning production traits, conformation, and calving performance in Irish beef cattle. J. Anim. Sci. 2008, 86, 3338–3347. [Google Scholar] [CrossRef] [PubMed] [Green Version]
- Miglior, F.; Van Doormaal, B.J.; Kistemaker, G. Phenotypic analysis of inbreeding depression for traits measured in Canadian dairy cattle breeds. Can. J. Anim. Sci. 2008, 89, 128. [Google Scholar]
- Vigh, Z.; Gyovai, P.; Csato, L.; Bokor, Á.; Farkas, J.; Radnoczi, L.; Komlosi, I.; Nagy, I. Effect of inbreeding on lean meat percentage and average daily gain in Hungarian Landrace pigs. Arch. Anim. Breed. 2008, 51, 541–548. [Google Scholar] [CrossRef]
- Arora, A.L.; Mishra, A.K.; Gowane, G.R.; Prince, L.L.L. Effect of inbreeding on lamb growth in a closed flock of Malpura sheep. Indian Vet. J. 2009, 86, 1034–1036. [Google Scholar]
- Barczak, E.; Wolc, A.; Wójtowski, J.; Slosarz, P.; Szwaczkowski, T. Inbreeding and inbreeding depression on body weight in sheep. J. Anim. Feed Sci. 2009, 18, 42–50. [Google Scholar] [CrossRef]
- Casellas, J.; Piedrafita, J.; Caja, G.; Varona, L. Analysis of founder-specific inbreeding depression on birth weight in Ripollesa lambs. J. Anim. Sci. 2009, 87, 72–79. [Google Scholar] [CrossRef] [PubMed]
- Dezfuli, B.T.; Mashayekhi, M.R. Genetic study of birth weight and weaning weight in Najdi calves. J. Anim. Vet. Adv. 2009, 8, 276–280. [Google Scholar]
- Gómez, M.D.; Valera, M.; Molina, A.; Gutiérrez, J.P.; Goyache, F. Assessment of inbreeding depression for body measurements in Spanish Purebred (Andalusian) horses. Livest. Sci. 2009, 122, 149–155. [Google Scholar] [CrossRef]
- Gomez-Raya, L.; Amoss, M.S.; Da, Y.; Beattie, C.W.; Ash, O.; Rauw, W.M. Role of selection and inbreeding on the incidence of cutaneous malignant melanoma in Sinclair swine. J. Anim. Breed. Genet. 2009, 126, 242–249. [Google Scholar] [CrossRef] [PubMed]
- Koeck, A.; Fuerst-Waltl, B.; Baumung, R. Effects of inbreeding on number of piglets born total, born alive and weaned in Austrian Large White and Landrace pigs. Arch. Anim. Breed. 2009, 52, 51–64. [Google Scholar] [CrossRef] [Green Version]
- Mc Parland, S.; Kearney, F.; Berry, D.P. Purging of inbreeding depression within the Irish Holstein-Friesian population. Genet. Sel. Evol. 2009, 41, 1–8. [Google Scholar] [CrossRef] [Green Version]
- Savaș, T. Effect of birth type × gender interactions and inbreeding on birth weight in goats. Tarim. Bilim. Derg. 2009, 15, 96–104. [Google Scholar]
- Van Wyk, J.B.; Fair, M.D.; Cloete, S.W.P. Case study: The effect of inbreeding on the production and reproduction traits in the Elsenburg Dormer sheep stud. Livest. Sci. 2009, 120, 218–224. [Google Scholar] [CrossRef]
- Carrillo, J.A.; Siewerdt, F. Consequences of long-term inbreeding accumulation on preweaning traits in a closed nucleus Angus herd. J. Anim. Sci. 2010, 88, 87–95. [Google Scholar] [CrossRef] [PubMed]
- Davis, M.E.; Simmen, R.C.M. Estimates of inbreeding depression for serum insulin-like growth factor I concentrations, body weights, and body weight gains in Angus beef cattle divergently selected for serum insulin-like growth factor I concentration. J. Anim. Sci. 2010, 88, 552–561. [Google Scholar] [CrossRef] [Green Version]
- Gowane, G.R.; Prince, L.L.L.; Arora, A.L. Effect of inbreeding on lamb growth traits in a closed flock of Bharat Merino sheep. Indian Vet. J. 2010, 87, 42–44. [Google Scholar]
- Panetto, J.C.C.; Gutiérrez, J.P.; Ferraz, J.B.S.; Cunha, D.G.; Golden, B.L. Assessment of inbreeding depression in a Guzerat dairy herd: Effects of individual increase in inbreeding coefficients on production and reproduction. J. Dairy Sci. 2010, 93, 4902–4912. [Google Scholar] [CrossRef] [PubMed] [Green Version]
- Pedrosa, V.B.; Santana, M.L., Jr.; Oliveira, P.S.; Eler, J.P.; Ferraz, J.B.S. Population structure and inbreeding effects on growth traits of Santa Inês sheep in Brazil. Small Rumin. Res. 2010, 93, 135–139. [Google Scholar] [CrossRef]
- Rokouei, M.; Torshizi, R.V.; Shahrbabak, M.M.; Sargolzaei, M.; Sørensen, A.C. Monitoring inbreeding trends and inbreeding depression for economically important traits of Holstein cattle in Iran. J. Dairy Sci. 2010, 93, 3294–3302. [Google Scholar] [CrossRef]
- Santana, M.L., Jr.; Oliveira, P.S.; Pedrosa, V.B.; Eler, J.P.; Groeneveld, E.; Ferraz, J.B.S. Effect of inbreeding on growth and reproductive traits of Nellore cattle in Brazil. Livest. Sci. 2010, 131, 212–217. [Google Scholar] [CrossRef]
- Wolc, A.; Balińska, K. Inbreeding effects on exterior traits in Polish konik horses. Arch. Anim. Breed. 2010, 53, 1–8. [Google Scholar] [CrossRef] [Green Version]
- Corrales, R.; Näsholm, A.; Malmfors, B.; Philipsson, J. Birth weight, reproduction traits and effects of inbreeding in Nicaraguan Reyna Creole cattle. Trop. Anim. Health Prod. 2011, 43, 1137–1143. [Google Scholar] [CrossRef]
- Hinrichs, D.; Thaller, G. Pedigree analysis and inbreeding effects on calving traits in large dairy herds in Germany. J. Dairy Sci. 2011, 94, 4726–4733. [Google Scholar] [CrossRef]
- Nagy, I.; Farkas, J.; Onika-Szvath, S.; Radnai, I.; Szendrő, Z. Genetic Parameters and Inbreeding Depression of Litter Weight in Pannon White Rabbits. Agric. Conspec. Sci. 2011, 76, 231–233. [Google Scholar]
- Sujit, S.; Joshi, B.K.; Avtar, S. Incidence and consequences of inbreeding in Karan Swiss cattle. Indian J. Anim. Sci. 2011, 81, 73–76. [Google Scholar]
- Vostrý, L.; Čapková, Z.; Přibyl, J.; Mach, K. Analysis of Czech cold-blooded horses: Genetic parameters, breeding value and the influence of inbreeding depression on linear description of conformation and type characters. Czech J. Anim. Sci. 2011, 56, 217–230. [Google Scholar] [CrossRef] [Green Version]
- Dorostkar, M.; Shodja, J.; Rafat, S.A.; Rokouei, M.; Esfandyari, H. Inbreeding and inbreeding depression in Iranian Moghani sheep breed. J. Agric. Sci. Technol. 2012, 14, 549–556. [Google Scholar]
- Du Toit, J.; VanWyk, J.B.; Maiwashe, A. Assessment of inbreeding depression for functional herd life in the South African Jersey breed based on level and rate of inbreeding. S. Afr. J. Anim. Sci. 2012, 42, 55–62. [Google Scholar] [CrossRef]
- Fuerst-Waltl, B.; Fuerst, C. Effect of inbreeding depression on survival of Austrian Brown Swiss calves and heifers. J. Dairy Sci. 2012, 95, 6086–6092. [Google Scholar] [CrossRef]
- Gipson, T.A. Preliminary observations: Inbreeding in dairy goats and its effects on milk production. In Proceedings of the 17th Annual Goat Field Day, Kuala Lumpur, Malaysia, 9–12 April 2012; pp. 26–27. [Google Scholar]
- Hossein-Zadeh, N.G. Inbreeding effects on body weight traits of Iranian Moghani sheep. Arch. Anim. Breed. 2012, 55, 171–178. [Google Scholar] [CrossRef] [Green Version]
- Santana, M.L., Jr.; Oliveira, P.S.; Eler, J.P.; Gutiérrez, J.P.; Ferraz, J.B.S. Pedigree analysis and inbreeding depression on growth traits in Brazilian Marchigiana and Bonsmara breeds. J. Anim. Sci. 2012, 90, 99–108. [Google Scholar] [CrossRef]
- Bjelland, D.W.; Weigel, K.A.; Vukasinovic, N.; Nkrumah, J.D. Evaluation of inbreeding depression in Holstein cattle using whole-genome SNP markers and alternative measures of genomic inbreeding. J. Dairy Sci. 2013, 96, 4697–4706. [Google Scholar] [CrossRef] [PubMed]
- Gowane, G.R.; Prakash, V.; Chopra, A.; Prince, L.L.L. Population structure and effect of inbreeding on lamb growth in Bharat Merino sheep. Small Rumin. Res. 2013, 114, 72–79. [Google Scholar] [CrossRef]
- Nagy, I.; Gorjanc, G.; Curik, I.; Farkas, J.; Kiszlinger, H.; Szendrő, Z. The contribution of dominance and inbreeding depression in estimating variance components for litter size in Pannon White rabbits. J. Anim. Breed. Genet. 2013, 130, 303–311. [Google Scholar] [CrossRef] [PubMed]
- Nagy, I.; Gyovai, P.; Radnai, I.; Nagyné Kiszlinger, H.; Farkas, J.; Szendrő, Z. Genetic parameters, genetic trends and inbreeding depression of growth and carcass traits in Pannon terminal line rabbits. Arch. Anim. Breed. 2013, 56, 191–199. [Google Scholar] [CrossRef] [Green Version]
- Rodríguez, C.; Casco, J.M.G.; Silió, L. Measuring effects of new and fast inbreeding on the litter size of Iberian pigs. Acta Agric. Slov. Suppl. 2013, 4, 21–23. [Google Scholar]
- Silió, L.; Rodríguez, M.C.; Fernández, A.; Barragán, C.; Benítez, R.; Óvilo, C.; Fernández, A.I. Measuring inbreeding and inbreeding depression on pig growth from pedigree or SNP-derived metrics. J. Anim. Breed. Genet. 2013, 130, 349–360. [Google Scholar] [CrossRef] [PubMed]
- Domínguez-Viveros, J.; Rodríguez-Almeida, F.A.; Ortega-Gutiérrez, J.Á. Inbreeding and estimation of genetic parameters for morphology characters in the Lusitano horse breed of Mexico. Arch. Zootec. 2014, 63, 37–44. [Google Scholar] [CrossRef] [Green Version]
- Eteqadi, B.; Hossein-Zadeh, N.G.; Shadparvar, A.A. Population structure and inbreeding effects on body weight traits of Guilan sheep in Iran. Small Rumin. Res. 2014, 119, 45–51. [Google Scholar] [CrossRef]
- Mokhtari, M.S.; Shahrbabak, M.M.; Esmailizadeh, A.K.; Shahrbabak, H.M.; Gutierrez, J.P. Pedigree analysis of Iran-Black sheep and inbreeding effects on growth and reproduction traits. Small Rumin. Res. 2014, 116, 14–20. [Google Scholar] [CrossRef]
- Pryce, J.E.; Haile-Mariam, M.; Goddard, M.E.; Hayes, B.J. Identification of genomic regions associated with inbreeding depression in Holstein and Jersey dairy cattle. Genet. Sel. Evol. 2014, 46, 1–14. [Google Scholar] [CrossRef] [PubMed] [Green Version]
- VanRaden, P.M.; Tooker, M.E.; Wright, J.R.; Sun, C.; Hutchison, J.L. Comparison of single-trait to multi-trait national evaluations for yield, health, and fertility. J. Dairy Sci. 2014, 97, 7952–7962. [Google Scholar] [CrossRef] [PubMed]
- Vicente, A.A.; Carolino, N.; Ralão-Duarte, J.; Gama, L.T. Selection for morphology, gaits and functional traits in Lusitano horses: II. Fixed effects, genetic trends and selection in retrospect. Livest. Sci. 2014, 164, 13–25. [Google Scholar] [CrossRef] [Green Version]
- Dai, S.; Wang, C.; Wang, Z.; Wang, Z.; Zhang, Y.; Na, Q.; Li, J.; Wang, R. Inbreeding and its effects on fleece traits of Inner Mongolia cashmere goats. Small Rumin. Res. 2015, 128, 50–53. [Google Scholar] [CrossRef]
- Dezetter, C.; Leclerc, H.; Mattalia, S.; Barbat, A.; Boichard, D.; Ducrocq, V. Inbreeding and crossbreeding parameters for production and fertility traits in Holstein, Montbéliarde, and Normande cows. J. Dairy Sci. 2015, 98, 4904–4913. [Google Scholar] [CrossRef] [Green Version]
- Eteqadi, B.; Hossein-Zadeh, N.G.; Shadparvar, A.A. Inbreeding effects on reproductive traits in Iranian Guilan sheep. Trop. Anim. Health Prod. 2015, 47, 533–539. [Google Scholar] [CrossRef] [PubMed]
- Kjöllerström, H.J.; Gama, L.T.; Oom, M.M. Impact of inbreeding on fitness-related traits in the highly threatened Sorraia horse breed. Livest. Sci. 2015, 180, 84–89. [Google Scholar] [CrossRef]
- Rahmanian, A.; Hafezian, H.; Rahimi, G.H.; Farhadi, A.; Baneh, H. Inbreeding depression for economically important traits of Mazandaran native fowls. Br. Poult. Sci. 2015, 56, 22–29. [Google Scholar] [CrossRef] [PubMed]
- Saura, M.; Fernández, A.; Varona, L.; Fernández, A.I.; de Cara, M.Á.R.; Barragán, C.; Villanueva, B. Detecting inbreeding depression for reproductive traits in Iberian pigs using genome-wide data. Genet. Sel. Evol. 2015, 47, 1–9. [Google Scholar] [CrossRef] [Green Version]
- Bernardes, P.A.; Grossi, D.A.; Savegnago, R.P.; Buzanskas, M.E.; Ramos, S.B.; Romanzini, E.P.; Guidolin, D.G.F.; Bezerra, L.A.F.; Lôbo, R.B.; Munari, D.P. Population structure of Tabapuã beef cattle using pedigree analysis. Livest. Sci. 2016, 187, 96–101. [Google Scholar] [CrossRef] [Green Version]
- Drobik, W.; Martyniuk, E. Inbreeding and its impact on the prolific Polish Olkuska sheep population. Small Rumin. Res. 2016, 137, 28–33. [Google Scholar] [CrossRef]
- Hofmanová, B.; Vostrá-vydrová, H.; Majzlík, I.; Vostrý, L. The effect of inbreeding on melanoma and vitiligo occurrence in Old Kladruber grey horses. Acta Agric. Solv. 2016, 5, 179–182. [Google Scholar]
- Pereira, R.J.; Santana, M.L., Jr.; Ayres, D.R.; Bignardi, A.B.; Menezes, G.D.O.; Silva, L.O.C.; Machado, C.H.C.; Josahkian, L.A.; Albuquerque, L.G. Inbreeding depression in Zebu cattle traits. J. Anim. Breed. Genet. 2016, 133, 523–533. [Google Scholar] [CrossRef] [PubMed]
- Silió, L.; Barragán, C.; Fernández, A.I.; García-Casco, J.; Rodríguez, M.C. Assessing effective population size, coancestry and inbreeding effects on litter size using the pedigree and SNP data in closed lines of the Iberian pig breed. J. Anim. Breed. Genet. 2016, 133, 145–154. [Google Scholar] [CrossRef] [PubMed]
- Yavarifard, R.; Ghavi Hossein-Zadeh, N.; Shadparvar, A.A. Inbreeding Effects on Reproductive Traits of Mehraban Sheep. Agric. Conspec. Sci. 2016, 81, 43–48. [Google Scholar]
- Yeganehpur, Z.; Roshanfekr, H.; Fayazi, J.; Beyranvand, M.H. Inbreeding depression on growth traits of Iranian Lori sheep. Rev. Colomb. Cienc. Pecu. 2016, 29, 264–273. [Google Scholar] [CrossRef] [Green Version]
- Aliloo, H.; Pryce, J.E.; González-Recio, O.; Cocks, B.G.; Goddard, M.E.; Hayes, B.J. Including nonadditive genetic effects in mating programs to maximize dairy farm profitability. J. Dairy Sci. 2017, 100, 1203–1222. [Google Scholar] [CrossRef] [Green Version]
- Ferenčaković, M.; Sölkner, J.; Kapš, M.; Curik, I. Genome–wide mapping and estimation of inbreeding depression of semen quality traits in a cattle population. J. Dairy Sci. 2017, 100, 4721–4730. [Google Scholar] [CrossRef]
- Fernández, E.N.; Sánchez, J.P.; Martínez, R.; Legarra, A.; Baselga, M. Role of inbreeding depression, non-inbred dominance deviations and random year-season effect in genetic trends for prolificacy in closed rabbit lines. J. Anim. Breed. Genet. 2017, 134, 441–452. [Google Scholar] [CrossRef] [PubMed] [Green Version]
- Martikainen, K.; Tyrisevä, A.M.; Matilainen, K.; Pösö, J.; Uimari, P. Estimation of inbreeding depression on female fertility in the Finnish Ayrshire population. J. Anim. Breed. Genet. 2017, 134, 383–392. [Google Scholar] [CrossRef] [PubMed] [Green Version]
- Müller-Unterberg, M.; Wallmann, S.; Distl, O. Effects of inbreeding and other systematic effects on fertility of Black Forest Draught horses in Germany. Acta Veter. Scand. 2017, 59, 1–6. [Google Scholar] [CrossRef] [PubMed] [Green Version]
- Perez, B.C.; Balieiro, J.C.C.; Ventura, R.V.; Bruneli, F.A.T.; Peixoto, M.G.C.D. Inbreeding effects on in vitro embryo production traits in Guzerá cattle. Animal 2017, 11, 1983–1990. [Google Scholar] [CrossRef] [PubMed]
- Reverter, A.; Porto-Neto, L.R.; Fortes, M.R.S.; Kasarapu, P.; De Cara, M.A.R.; Burrow, H.M.; Lehnert, S.A. Genomic inbreeding depression for climatic adaptation of tropical beef cattle. J. Anim. Sci. 2017, 95, 3809–3821. [Google Scholar] [CrossRef]
- Bussiman, F.D.O.; Perez, B.C.; Ventura, R.V.; Peixoto, M.G.C.D.; Curi, R.A.; Balieiro, J.D.C. Pedigree analysis and inbreeding effects over morphological traits in Campolina horse population. Animal 2018, 12, 2246–2255. [Google Scholar] [CrossRef] [Green Version]
- Mahmoudi, P.; Rashidi, A.; Razmkabir, M. Inbreeding effects on some reproductive traits in Markhoz goats. Anim. Prod. Sci. 2018, 58, 2178–2183. [Google Scholar] [CrossRef]
- Todd, E.T.; Ho, S.Y.; Thomson, P.C.; Ang, R.A.; Velie, B.D.; Hamilton, N.A. Founder-specific inbreeding depression affects racing performance in Thoroughbred horses. Sci. Rep. 2018, 8, 1–10. [Google Scholar] [CrossRef] [Green Version]
- Varona, L.; Legarra, A.; Herring, W.; Vitezica, Z.G. Genomic selection models for directional dominance: An example for litter size in pigs. Genet. Sel. Evol. 2018, 50, 1–13. [Google Scholar] [CrossRef] [Green Version]
- Vitezica, Z.G.; Reverter, A.; Herring, W.; Legarra, A. Dominance and epistatic genetic variances for litter size in pigs using genomic models. Genet. Sel. Evol. 2018, 50, 1–8. [Google Scholar] [CrossRef] [Green Version]
- Amaral, R.; Malhado, C.H.M.; Martins-Filho, R.; Malhado, A.C.M.; Rezende, M.P.G.; Ambrosini, D.P.; Carneiro, P.L.S. Inbreeding depression and genetic variability in Nellore breed. Arch. Vet. Sci. 2019, 24, 68–78. [Google Scholar] [CrossRef]
- Baneh, H.; Ahmadpanah, J.; Mandal, A. Studies on inbreeding and its effects on growth traits of Iran-Black sheep. Songklanakarin J. Sci. Technol. 2019, 41, 1219–1225. [Google Scholar]
- Doekes, H.P.; Veerkamp, R.F.; Bijma, P.; de Jong, G.; Hiemstra, S.J.; Windig, J.J. Inbreeding depression due to recent and ancient inbreeding in Dutch Holstein–Friesian dairy cattle. Genet. Sel. Evol. 2019, 51, 1–16. [Google Scholar]
- Dota, J. Population structure and inbreeding depression on growth traits in Nellore cattle reared in the Amazon Biome. Livest. Res. Rural Dev. 2019, 31, 1–12. [Google Scholar]
- Gowrimanokari, K.V.; Thiagarajan, R.; Venkataramanan, R.; Gopi, H. Effect of inbreeding on pre-weaning and sow performance traits in Large White Yorkshire pigs. Indian J. Anim. Res. 2019, 53, 997–1001. [Google Scholar]
- Iversen, M.W.; Nordbø, Ø.; Gjerlaug-Enger, E.; Grindflek, E.; Lopes, M.S.; Meuwissen, T. Effects of heterozygosity on performance of purebred and crossbred pigs. Genet. Sel. Evol. 2019, 51, 1–13. [Google Scholar] [CrossRef] [Green Version]
- Silva, M.H.M.A.; Malhado, C.H.M.; Kern, E.L.; Daltro, D.D.S.; Cobuci, J.A.; Carneiro, P.L.S. Inbreeding depression in Holstein cattle in Brazil. R. Bras. Zootec. 2019, 48. [Google Scholar] [CrossRef] [Green Version]
- Sumreddee, P.; Toghiani, S.; Hay, E.H.; Roberts, A.; Agrrey, S.E.; Rekaya, R. Inbreeding depression in line 1 Hereford cattle population using pedigree and genomic information. J. Anim. Sci. 2019, 97, 1–18. [Google Scholar] [CrossRef] [PubMed]
- Tongsiri, S.; Jeyaruban, G.M.; Hermesch, S.; van der Werf, J.H.; Li, L.; Chormai, T. Genetic parameters and inbreeding effects for production traits of Thai native chickens. Asian Aust. J. Anim. Sci. 2019, 32, 930. [Google Scholar] [CrossRef] [PubMed]
- Barbosa, A.C.B.; Romano, G.D.S.; Velarde, J.M.D.S.; Ferraz, J.B.S.; Pedrosa, V.B.; Pinto, L.F.B. Pedigree analysis of Santa Inês sheep and inbreeding effects on performance traits. Rev. Mex. Cienc. Pecu. 2020, 11, 590–604. [Google Scholar] [CrossRef]
- Kasap, A.; Mioč, B.; Barać, Z.; Špehar, M. The effect of inbreeding on birth weight of Saanen goat kids. J. Centr. Eur. Agric. 2020, 21, 1–6. [Google Scholar] [CrossRef]
- Makanjuola, B.O.; Maltecca, C.; Miglior, F.; Schenkel, F.S.; Baes, C.F. Effect of recent and ancient inbreeding on production and fertility traits in Canadian Holsteins. BMC Genom. 2020, 21, 1–15. [Google Scholar] [CrossRef]
- Paiva, R.D.M.; de Sousa, J.E.R.; Ferreira, J.; Cunha, E.E.; Gouveia, A.M.G.; Facó, O. Population structure and effect of inbreeding on milk yield of Saanen goats in Brazilian production systems. Small Rumin. Res. 2020, 192, 106194. [Google Scholar] [CrossRef]
- Sheikhlou, M.; Badereh, S.; Binabaj, F.B. Assessment of between-founder heterogeneity in inbreeding depression for reproductive traits in Baluchi sheep. Anim. Reprod. Sci. 2020, 221, 106593. [Google Scholar] [CrossRef]
- Sumreddee, P.; Toghiani, S.; Hay, E.H.; Roberts, A.; Aggrey, S.E.; Rekaya, R. Runs of homozygosity and analysis of inbreeding depression. J. Anim. Sci. 2020, 98, 1–11. [Google Scholar] [CrossRef]
- Antonios, S.; Rodríguez-Ramilo, S.T.; Aguilar, I.; Astruc, J.M.; Legarra, A.; Vitezica, Z.G. Genomic and pedigree estimation of inbreeding depression for semen traits in the Basco-Béarnaise dairy sheep breed. J. Dairy Sci. 2021, 104, 3221–3230. [Google Scholar] [CrossRef]
- Hidalgo, J.; Cesarani, A.; Garcia, A.; Sumreddee, P.; Larios, N.; Mancin, E.; García, J.G.; Núñez, R.; Ramírez, R. Genetic Background and Inbreeding Depression in Romosinuano Cattle Breed in Mexico. Animals 2021, 11, 321. [Google Scholar] [CrossRef] [PubMed]
- Tao, L.; He, X.; Wang, X.; Di, R.; Chu, M. Litter Size of Sheep (Ovis aries): Inbreeding Depression and Homozygous Regions. Genes 2021, 12, 109. [Google Scholar] [CrossRef]
- R Core Team. R: A Language and Environment for Statistical Computing; R Foundation for Statistical Computing: Vienna, Austria, 2019; Available online: https://www.R-project.org/ (accessed on 17 June 2021).
- Komsta, L. Moments: Moments, Cumulants, Skewness, Kurtosis and Related Tests. R Package Version 0.14. 2015. Available online: https://cran.r-project.org/web/packages/moments/moments.pdf (accessed on 25 February 2021).
- Lenth, R.V. Emmeans: Estimated Marginal Means, aka Least-Squares Means. R Package Version 1.5.4. 2021. Available online: https://CRAN.R-project.org/package=emmeans (accessed on 25 February 2021).
- Tukey, J. Comparing individual means in the analysis of variance. Biometrics 1949, 5, 99–114. [Google Scholar] [CrossRef] [PubMed]
- Kramer, C.Y. Extension of multiple range tests to group means with unequal numbers of replications. Biometrics 1956, 12, 307–310. [Google Scholar] [CrossRef]
- Meyermans, R.; Gorssen, W.; Buys, N.; Janssens, S. How to study runs of homozygosity using PLINK? A guide for analyzing medium density SNP data in livestock and pet species. BMC Genom. 2020, 21, 1–14. [Google Scholar] [CrossRef] [PubMed]
- Lin, L.; Chu, H. Quantifying publication bias in meta-analysis. Biometrics 2018, 74, 785–794. [Google Scholar] [CrossRef]
- Hoffmann, A.A.; Merilä, J.; Kristensen, T.N. Heritability and evolvability of fitness and nonfitness traits: Lessons from livestock. Evolution 2016, 70, 1770–1779. [Google Scholar] [CrossRef]
- Doekes, H.P.; Bijma, P.; Veerkamp, R.F.; de Jong, G.; Wientjes, Y.C.; Windig, J.J. Inbreeding depression across the genome of Dutch Holstein Friesian dairy cattle. Genet. Sel. Evol. 2020, 52, 1–18. [Google Scholar] [CrossRef] [PubMed]
- Hedrick, P.W.; Garcia-Dorado, A. Understanding inbreeding depression, purging, and genetic rescue. Trends Ecol. Evol. 2016, 31, 940–952. [Google Scholar] [CrossRef]
- López-Cortegano, E.; Vilas, A.; Caballero, A.; García-Dorado, A. Estimation of genetic purging under competitive conditions. Evolution 2016, 70, 1856–1870. [Google Scholar] [CrossRef]
- Hill, W.G.; Weir, B.S. Variation in actual relationship as a consequence of Mendelian sampling and linkage. Genet. Res. 2011, 93, 47–64. [Google Scholar] [CrossRef] [PubMed] [Green Version]
- Oliehoek, P.A.; Bijma, P. Effects of pedigree errors on the efficiency of conservation decisions. Genet. Sel. Evol. 2009, 41, 9. [Google Scholar] [CrossRef] [PubMed] [Green Version]
- Howard, J.T.; Tiezzi, F.; Huang, Y.; Gray, K.A.; Maltecca, C. A heuristic method to identify runs of homozygosity associated with reduced performance in livestock. J. Anim. Sci. 2017, 95, 4318–4332. [Google Scholar] [CrossRef] [Green Version]
- Martikainen, K.; Koivula, M.; Uimari, P. Identification of runs of homozygosity affecting female fertility and milk production traits in Finnish Ayrshire cattle. Sci. Rep. 2020, 10, 1–9. [Google Scholar]
- Han, W.; Xue, Q.; Li, G.; Yin, J.; Zhang, H.; Zhu, Y.; Xing, W.; Cao, Y.; Su, Y.; Wang, K. Genome-wide analysis of the role of DNA methylation in inbreeding depression of reproduction in Langshan chicken. Genomics 2020, 112, 2677–2687. [Google Scholar] [CrossRef]
- Becker, P.J.; Hegelbach, J.; Keller, L.F.; Postma, E. Phenotype-associated inbreeding biases estimates of inbreeding depression in a wild bird population. J. Evol. Biol. 2016, 29, 35–46. [Google Scholar] [CrossRef] [Green Version]
- Leutenegger, A.L.; Prum, B.; Génin, E.; Verny, C.; Lemainque, A.; Clerget-Darpoux, F.; Thompson, E.A. Estimation of the inbreeding coefficient through use of genomic data. Am. J. Hum. Genet. 2003, 73, 516–523. [Google Scholar] [CrossRef] [Green Version]
- Amin, N.; Van Duijn, C.M.; Aulchenko, Y.S. A genomic background based method for association analysis in related individuals. PLoS ONE 2007, 2, e1274. [Google Scholar] [CrossRef] [Green Version]
Figure 1.
Histograms of estimates of (n = 1818) and (n = 1259) across all studies and traits, after removal of extreme outliers. Descriptive statistics and a normal distribution (dashed red lines; based on mean and standard deviation (SD)) are also shown.
Figure 1.
Histograms of estimates of (n = 1818) and (n = 1259) across all studies and traits, after removal of extreme outliers. Descriptive statistics and a normal distribution (dashed red lines; based on mean and standard deviation (SD)) are also shown.

Figure 2.
Violin plots of inbreeding depression estimates per trait group. Estimates are expressed as a percentage of a trait’s mean () or as a percentage of a trait’s SD (). Boxplots are also shown, indicating the median, 25th and 75th quantiles and the mean () for each group. For and , there were respectively 40 and 39 extreme estimates outside the range of this figure.

Figure 3.
Relationship between inbreeding depression estimates expressed as percentage of a trait’s mean per 1 standard deviation increase in inbreeding ( * SD(F)) across different measures of inbreeding. The data points (colored per study) and linear trendline are shown (lower triangle) as well as the density curve for each inbreeding measure (diagonal) and the correlation and regression equation (upper triangle). Note that slopes of the linear trendline differ from 1, which is also expected when correlations between inbreeding measures themselves are not equal to 1. = pedigree inbreeding; = inbreeding based on runs of homozygosity; = inbreeding from genomic relationship matrix (studies in pink and purple used VanRaden’s method 2, and light blue Yang’s method); = inbreeding from genomic relationship matrix with allele frequencies fixed to 0.5; = percentage of homozygous SNPs.

Figure 4.
Relationship between inbreeding depression estimates expressed as percentage of a trait’s standard deviation per 1 standard deviation increase in inbreeding ( * SD(F)) across different measures of inbreeding. The data points (colored per study) and linear trendline are shown (lower triangle), as well as the density curve for each inbreeding measure (diagonal) and the correlation and regression equation (upper triangle). Note that slopes of the linear trendline differ from 1, which is also expected when correlations between inbreeding measures themselves are not equal to 1. = pedigree inbreeding; = inbreeding based on runs of homozygosity; = inbreeding from genomic relationship matrix (studies in pink and purple used VanRaden’s method 2, and light blue used Yang’s method); = inbreeding from genomic relationship matrix with allele frequencies fixed to 0.5; = percentage of homozygous SNPs.

Figure 5.
Example with three normal distributions (left; each with a mean of −0.22 and a SD of 0.2, 0.6 or 1) and the resulting mixture of these three normal distributions (right), showing an increase in kurtosis.
Figure 5.
Example with three normal distributions (left; each with a mean of −0.22 and a SD of 0.2, 0.6 or 1) and the resulting mixture of these three normal distributions (right), showing an increase in kurtosis.

Figure 6.
Funnel plot to assess publication bias. The plot shows the relationship between inbreeding depression estimates, expressed as a percentage of the trait mean (), and the number of records used to estimate them (N = 1283). The orange vertical line represents the median. To ease interpretation, estimates based on >400,000 records are not shown (N = 82).


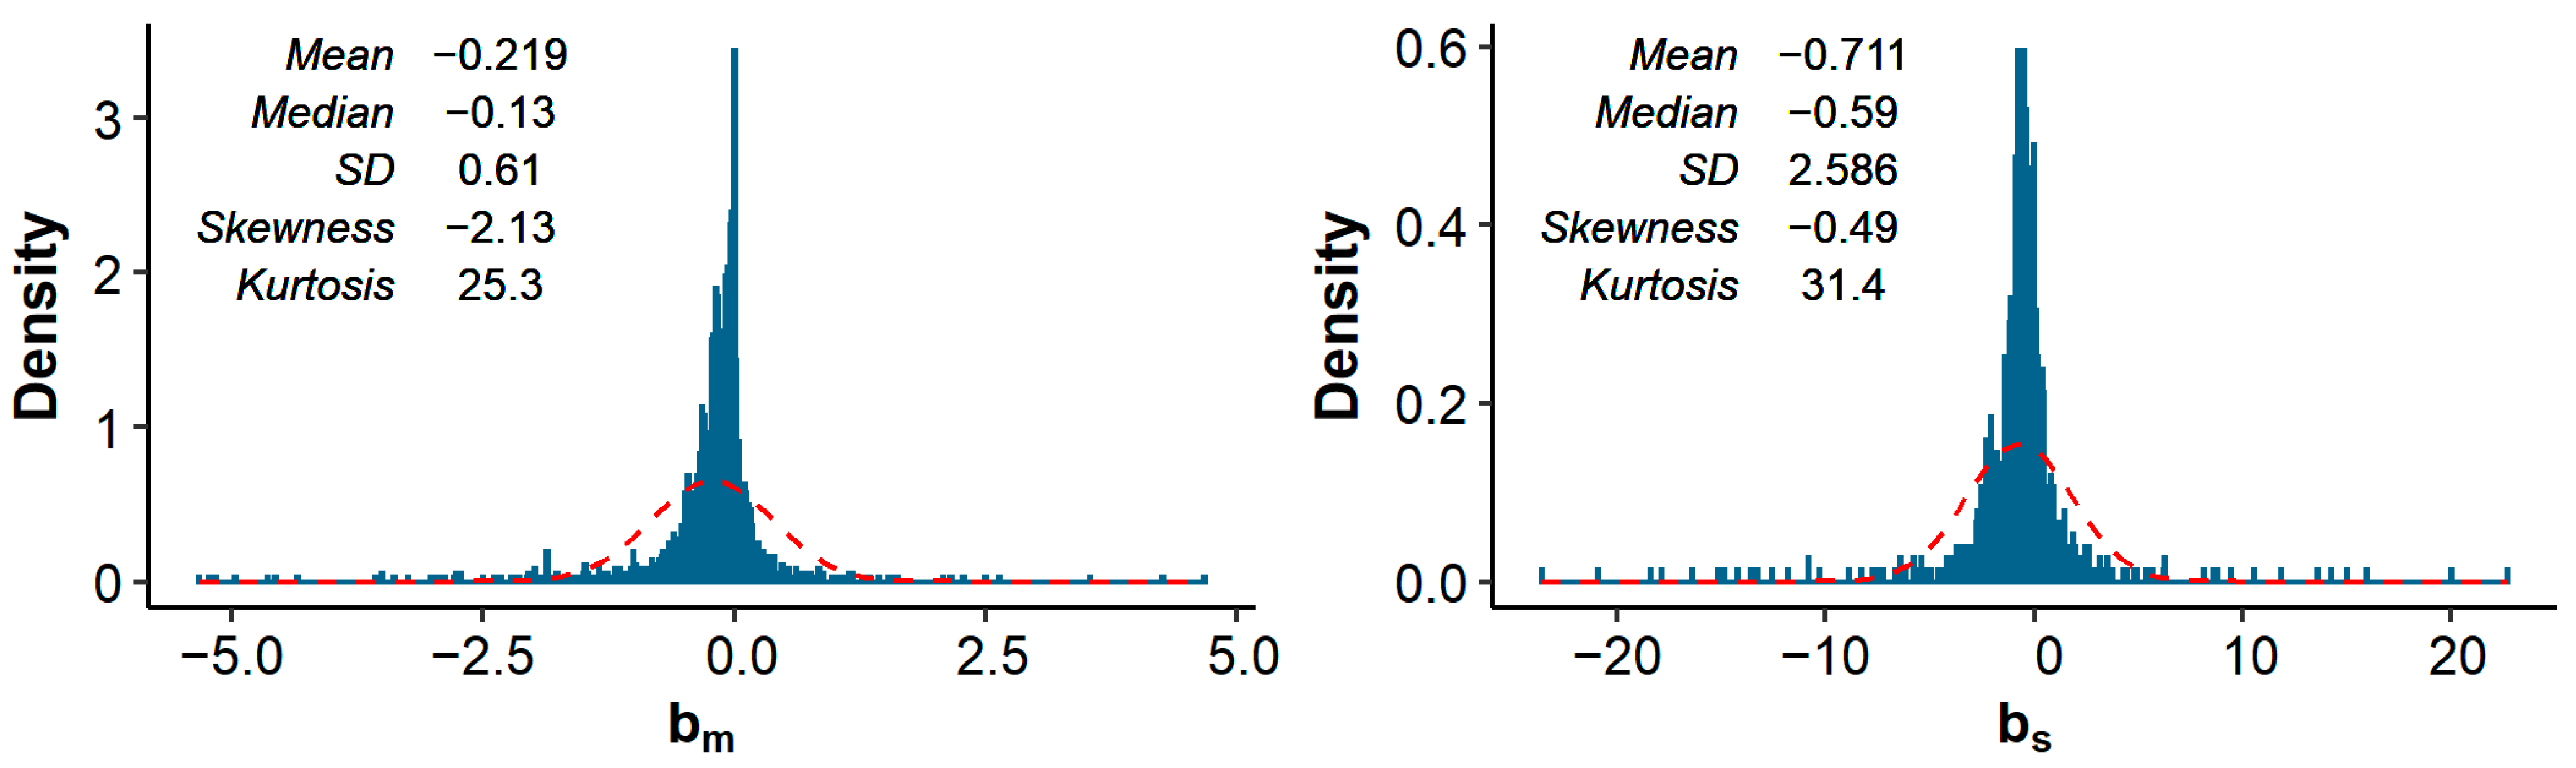
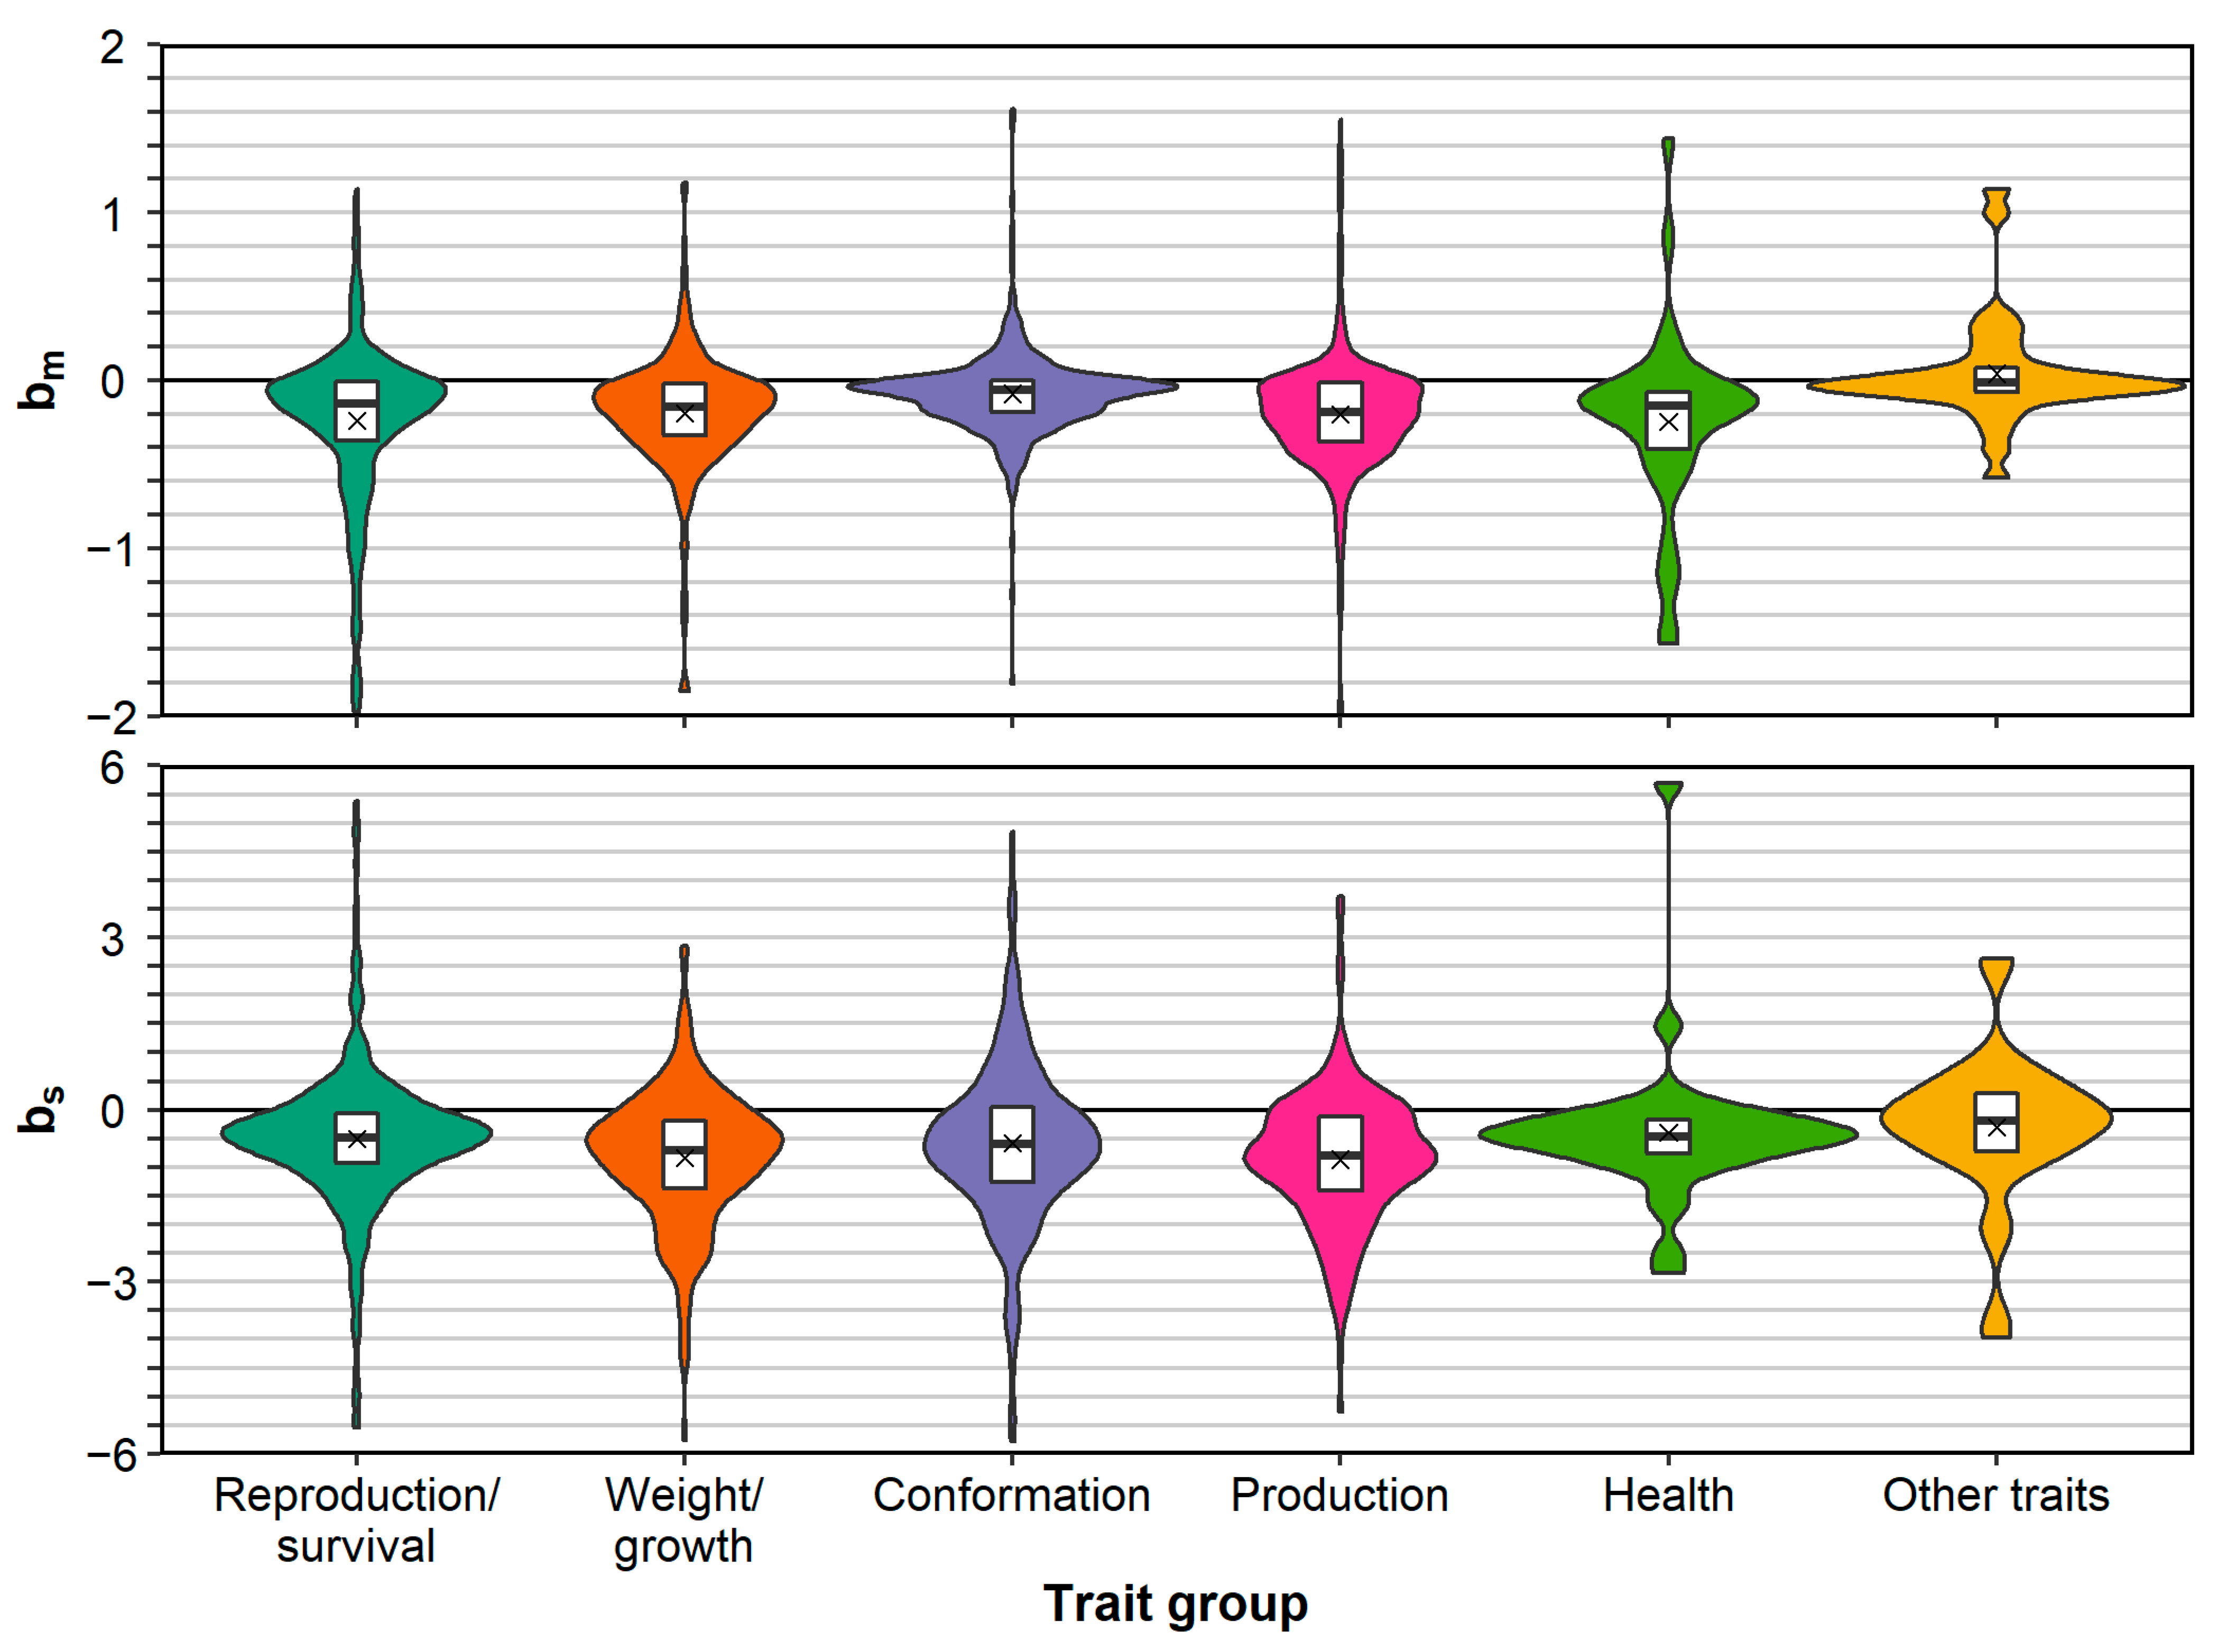
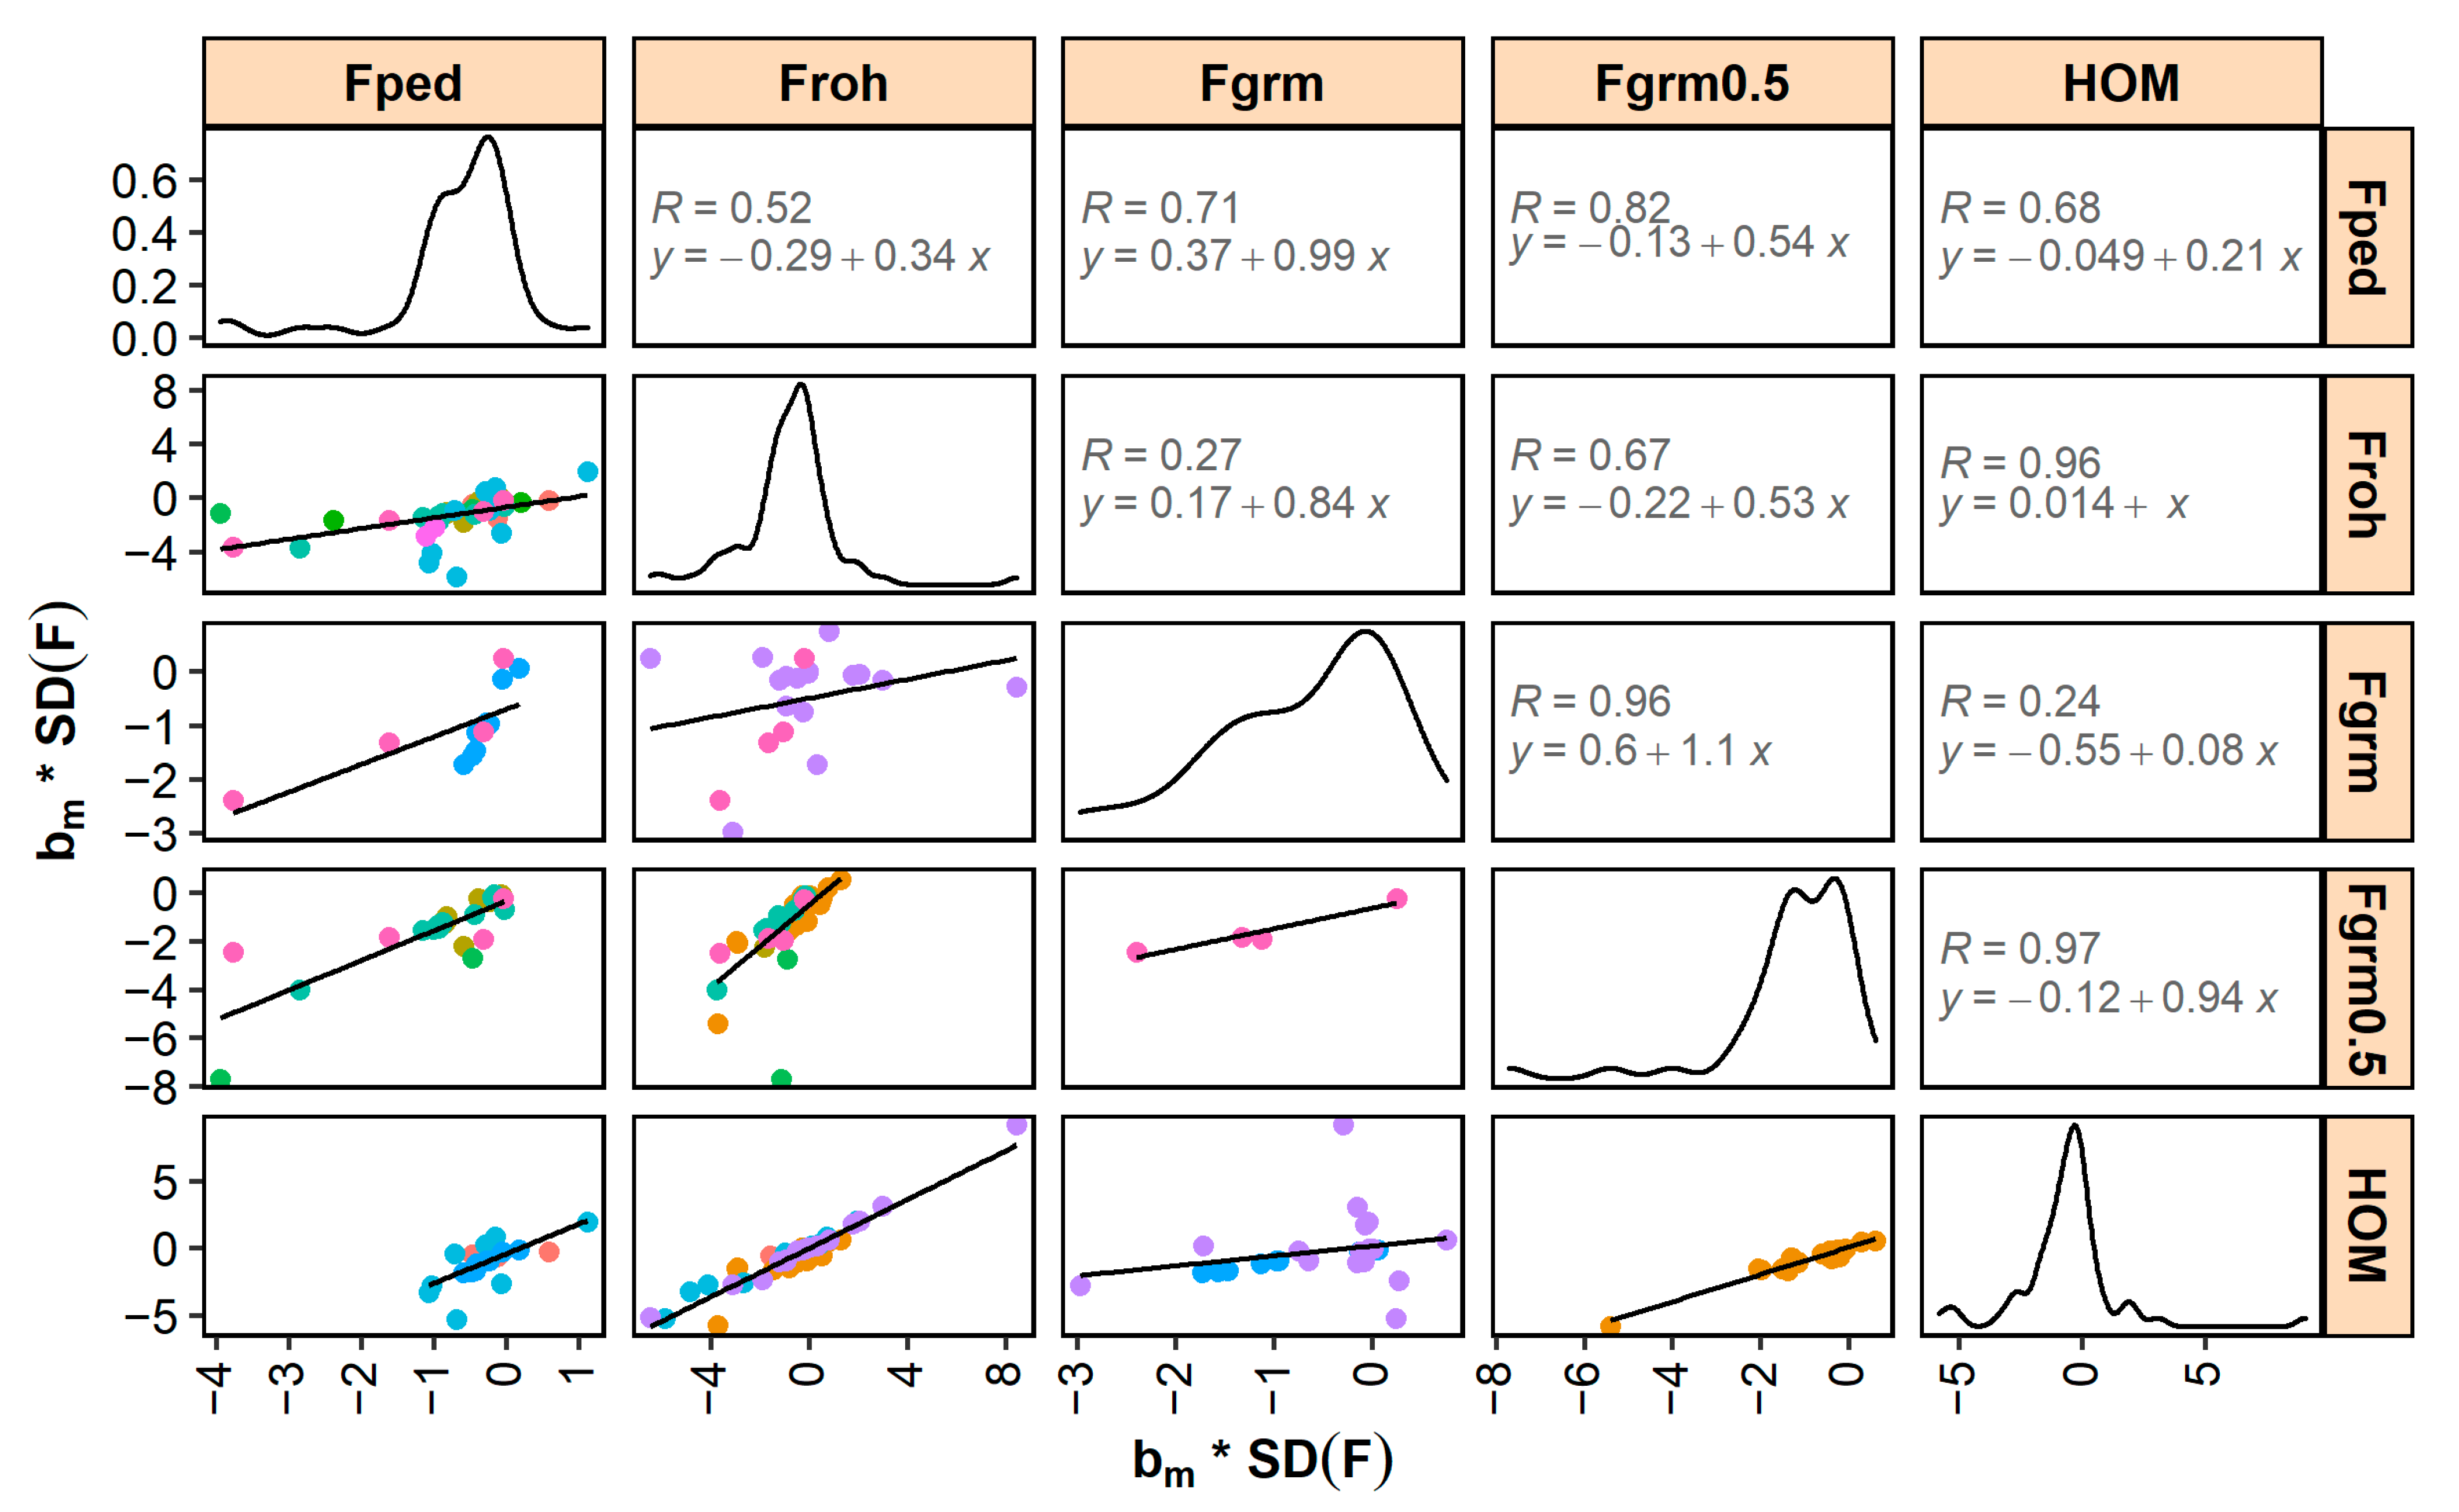
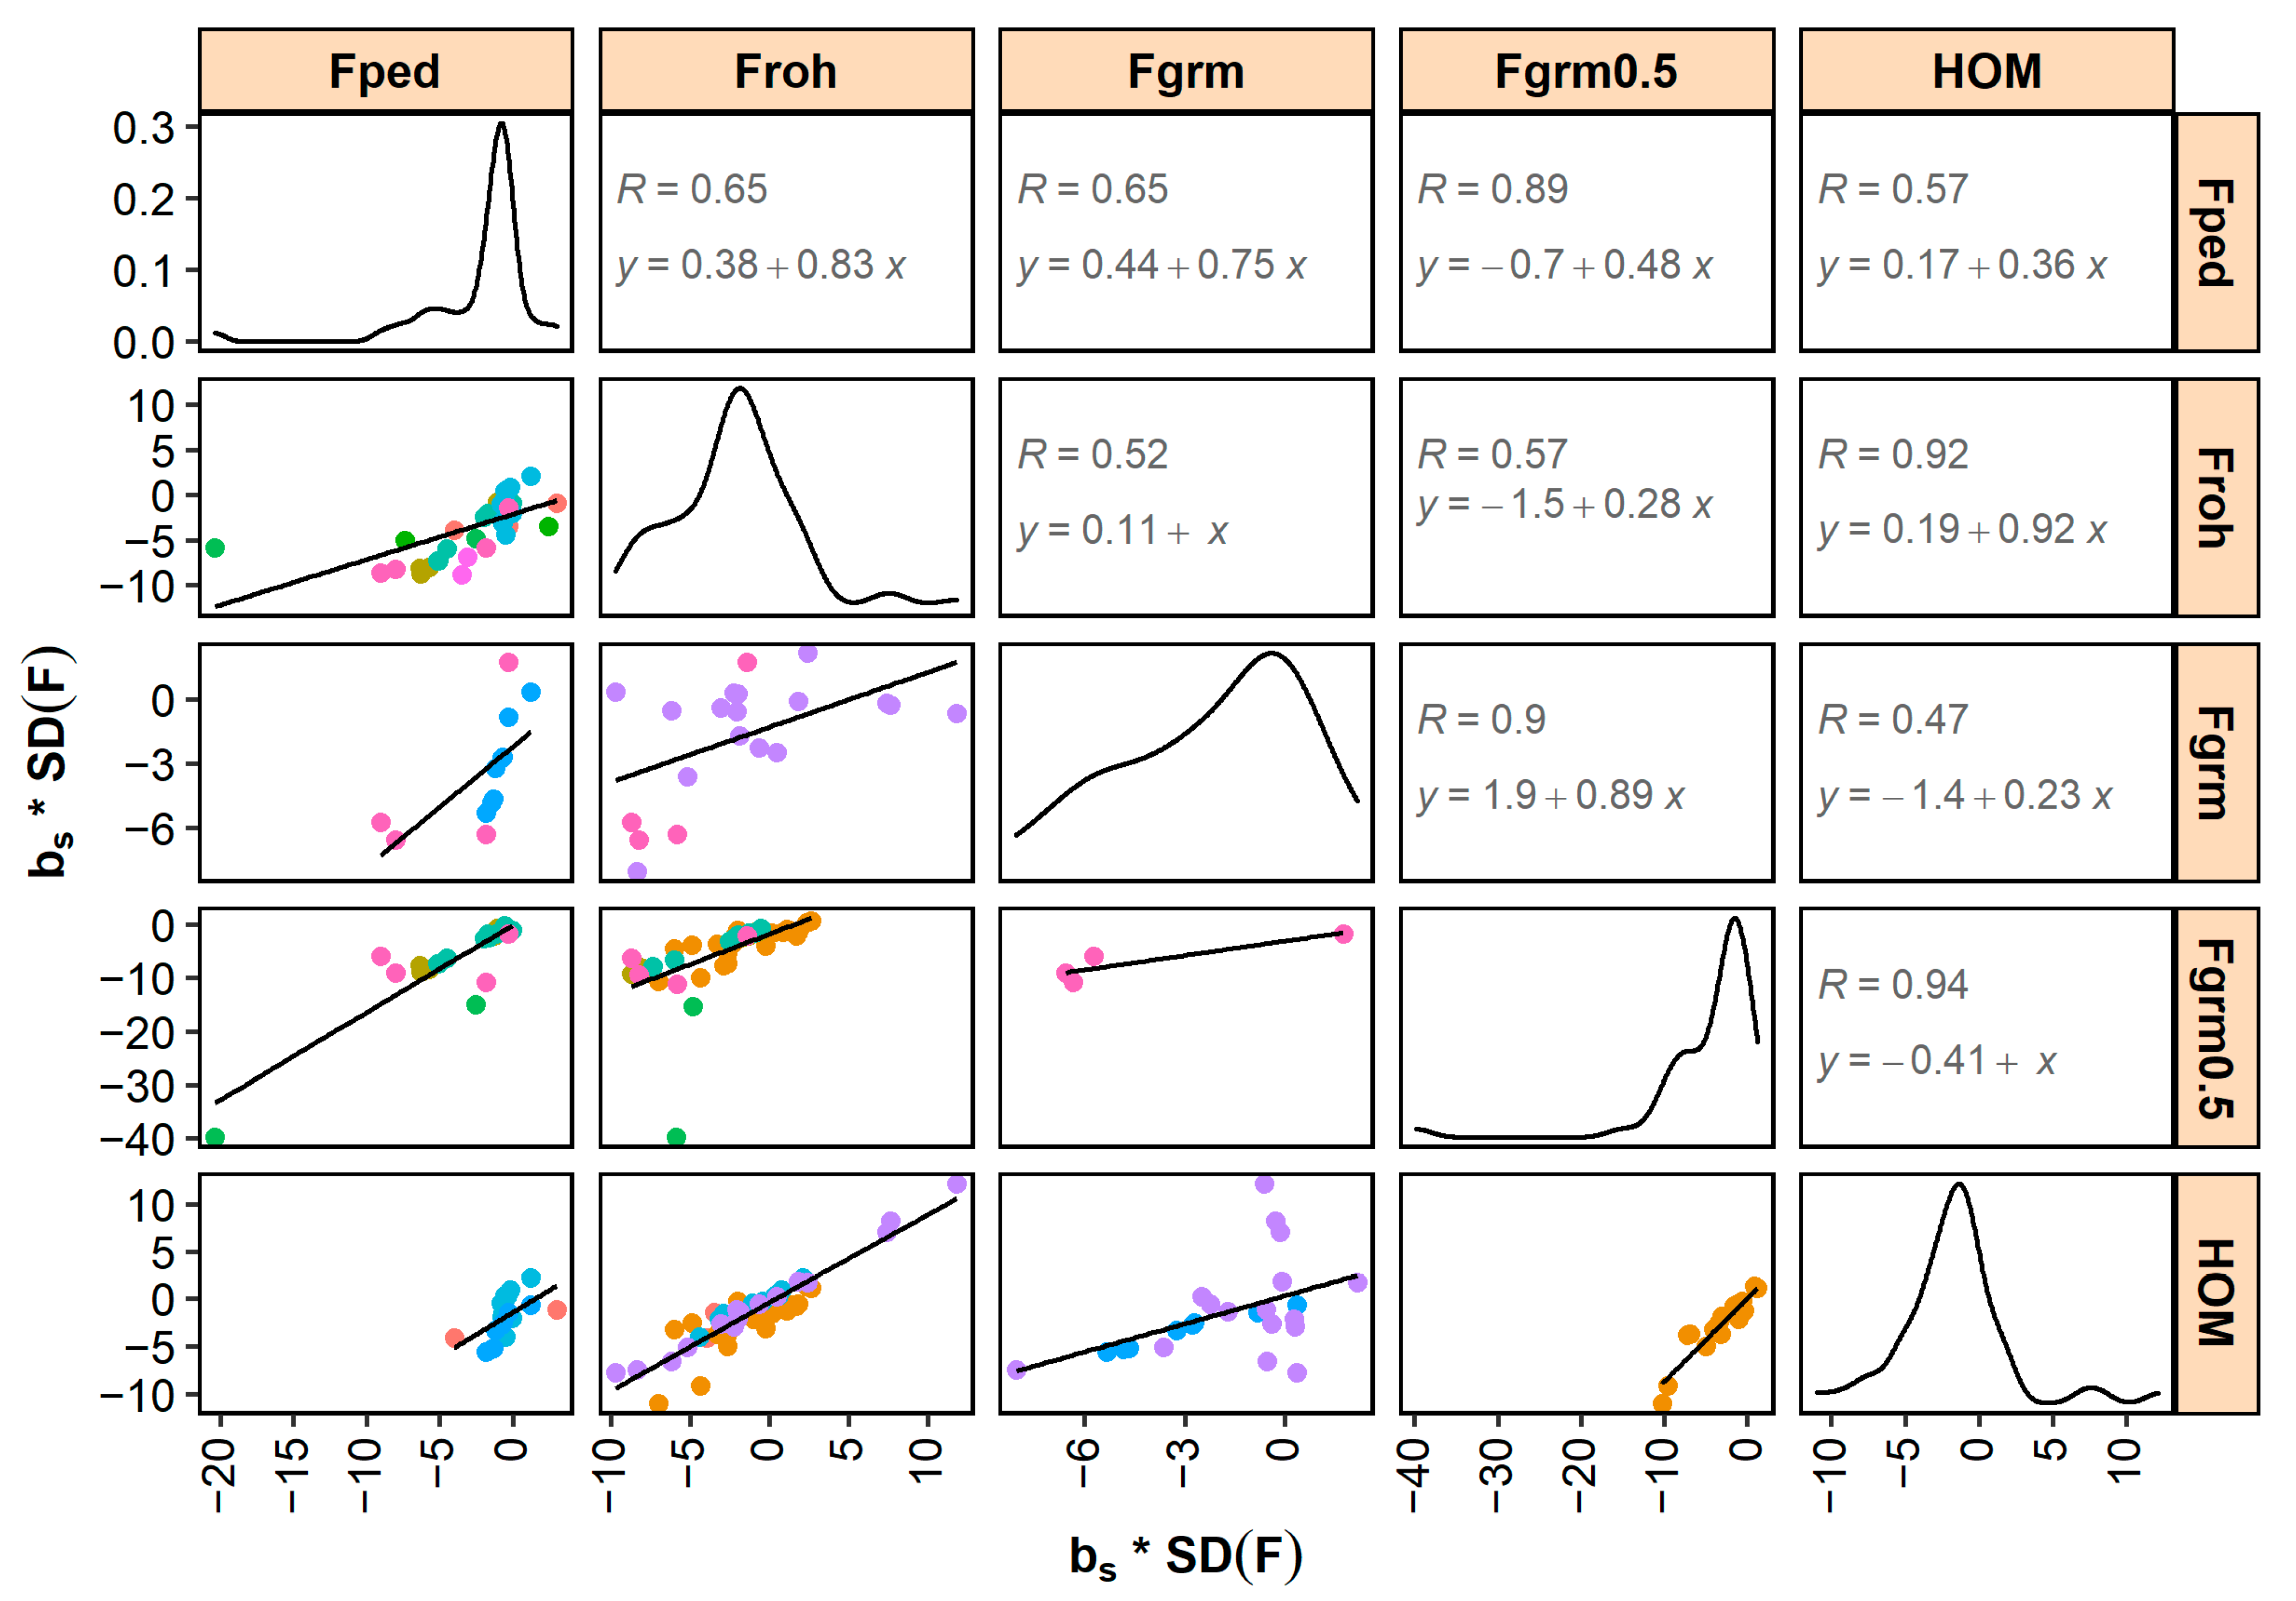
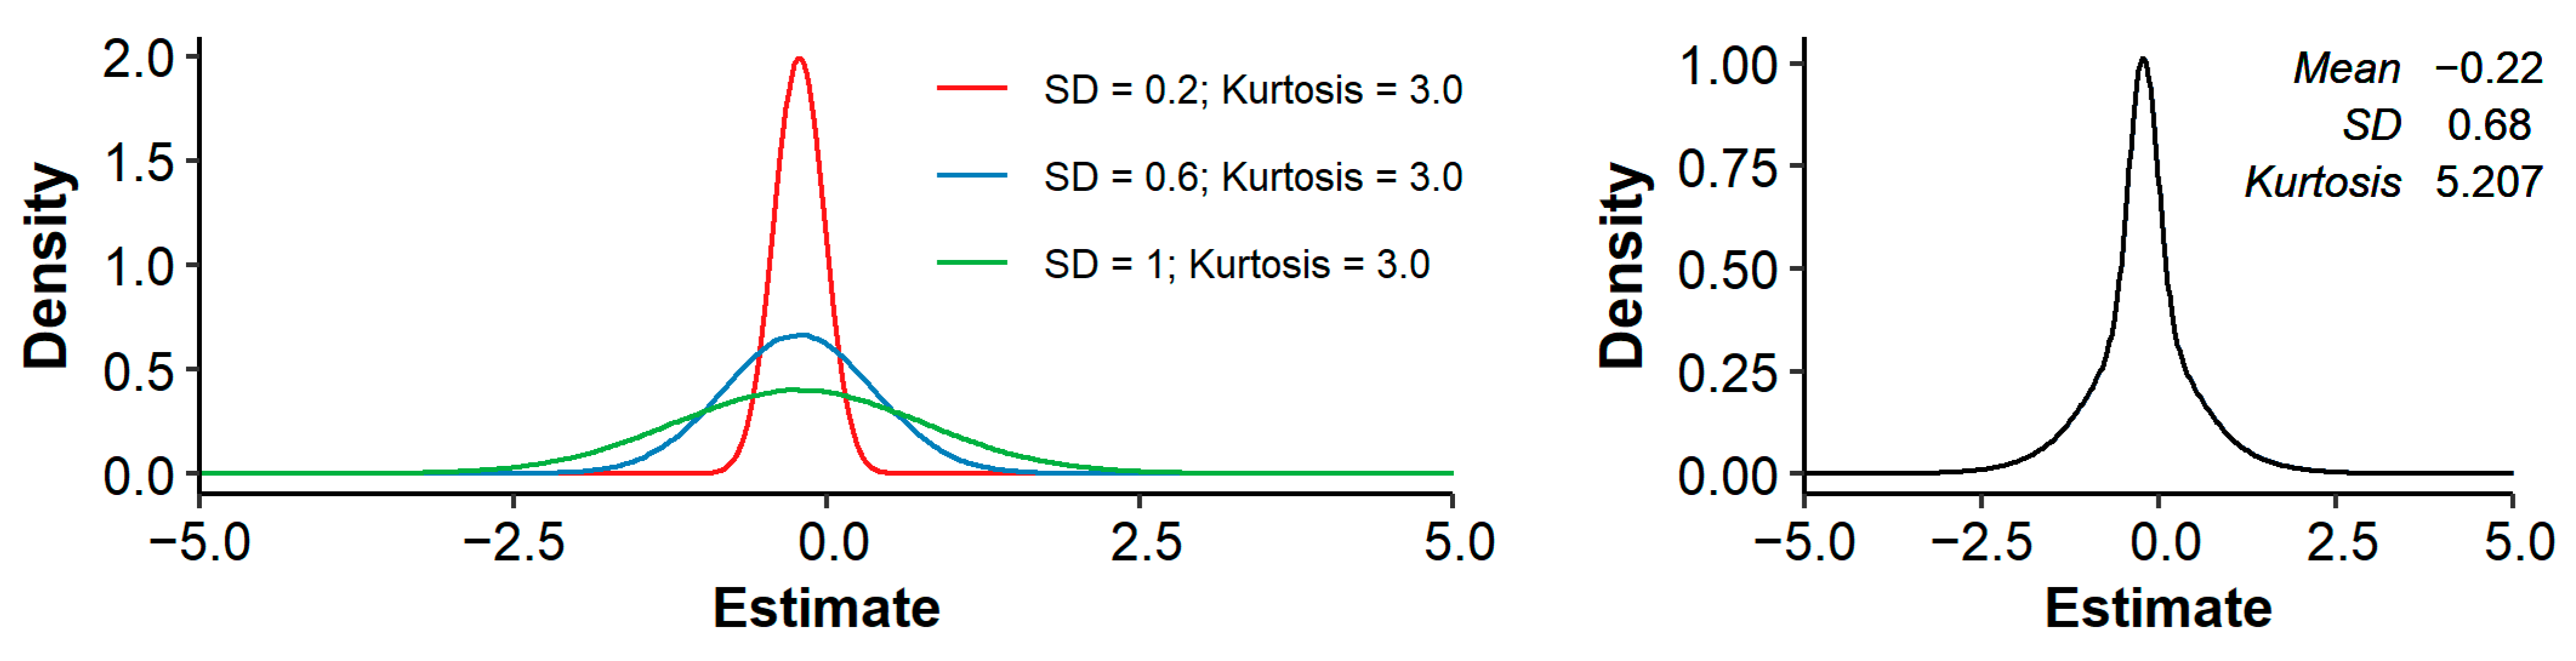
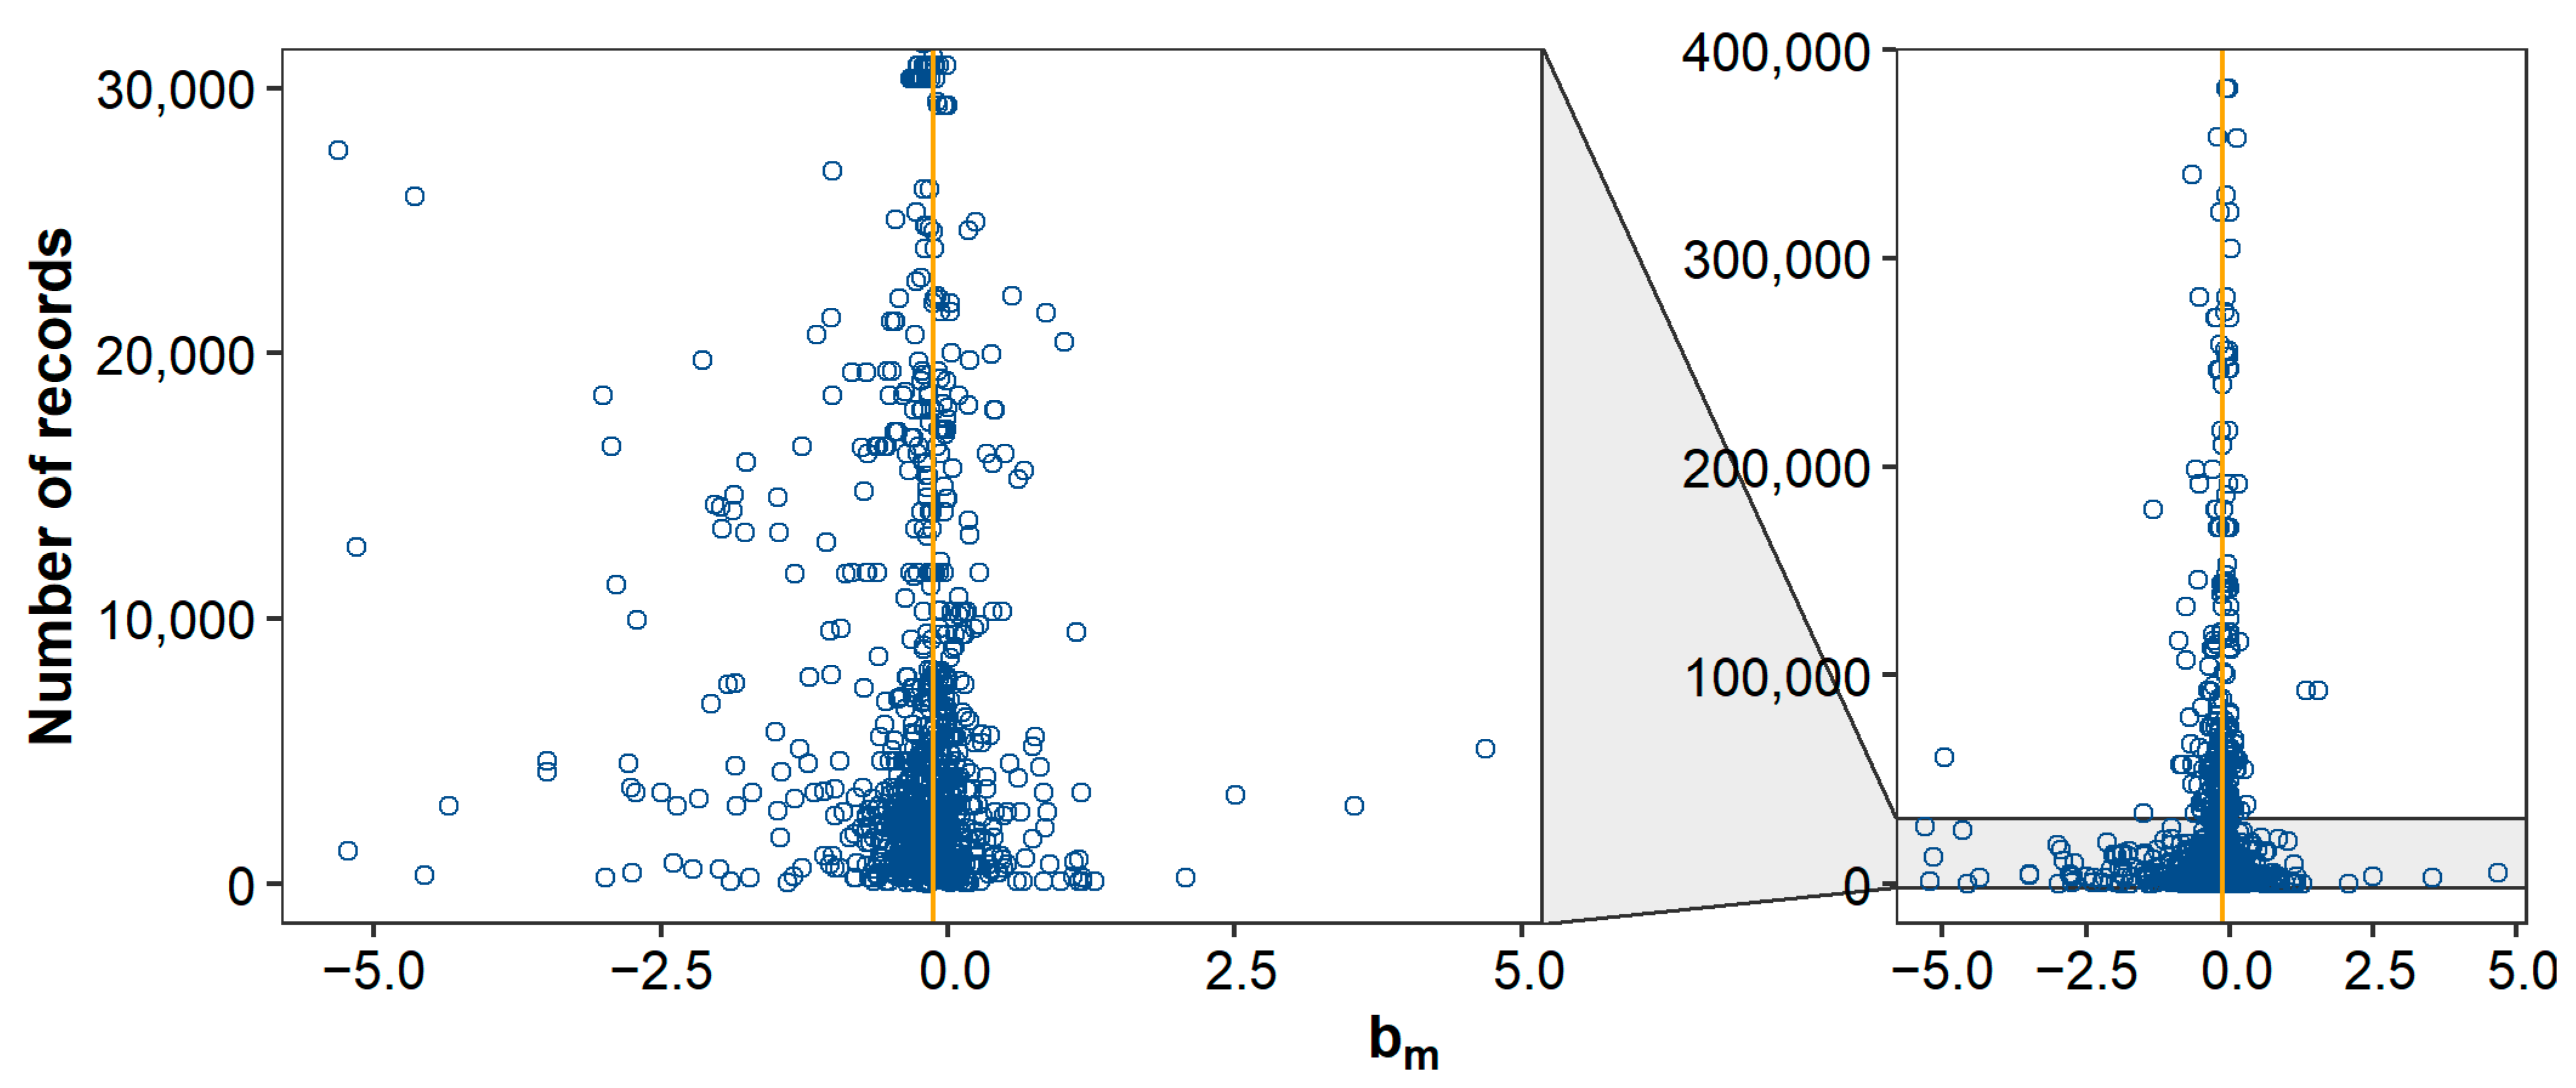
Table 1.
Estimated marginal means of inbreeding depression estimates per trait group with standard errors (SEs). Inbreeding depression estimates are expressed as percentage of a trait’s mean () or as percentage of a trait’s SD (). The number of estimates (N) and the p-value for testing the mean against zero are also shown.
| Trait Group | N | Estimate (SE) | p-Value | N | Estimate (SE) | p-Value |
|---|---|---|---|---|---|---|
| Reproduction/survival | 590 | −0.302 (0.032) | <0.001 | 349 | −0.410 (0.182) | 0.024 |
| Weight/growth | 417 | −0.227 (0.039) | <0.001 | 231 | −1.071 (0.244) | <0.001 |
| Conformation | 419 | −0.142 (0.046) | 0.002 | 396 | −0.487 (0.210) | 0.020 |
| Production | 319 | −0.308 (0.040) | <0.001 | 216 | −0.753 (0.215) | <0.001 |
| Health | 39 | −0.268 (0.099) | 0.007 | 35 | −0.891 (0.464) | 0.055 |
| Other traits | 34 | 0.129 (0.103) | 0.213 | 32 | 0.826 (0.471) | 0.079 |
Table 2.
Comparison of p-values of inbreeding depression estimates based on different pedigree-based and SNP-based inbreeding measures. Comparisons were made within studies and for each combination of two inbreeding measures, where both inbreeding measures had an unfavorable effect on the phenotype.
| Comparisons P2 < P1 | |||||||
|---|---|---|---|---|---|---|---|
| Measure 1 | Measure 2 | N Studies | N Comparisons | Median P1 | Median P2 | N | % of Total |
| 8 | 38 | 0.131 | 0.026 | 30 | 79 | ||
| 1 | 7 | 0.186 | <0.001 | 7 | 100 | ||
| 4 | 26 | 0.046 | 0.005 | 21 | 81 | ||
| 4 | 18 | 0.238 | 0.029 | 15 | 83 | ||
| 1 | 7 | 0.307 | 0.238 | 4 | 57 | ||
| 5 | 40 | 0.037 | 0.036 | 15 | 38 | ||
| 4 | 34 | 0.158 | 0.170 | 19 | 56 | ||
| 1 | 3 | 0.046 | 0.002 | 3 | 100 | ||
| 2 | 14 | 0.071 | 0.009 | 4 | 29 | ||
| 1 | 20 | 0.280 | 0.170 | 10 | 50 | ||
P1 = p-value of measure 1; P2 = p-value of measure 2.
Publisher’s Note: MDPI stays neutral with regard to jurisdictional claims in published maps and institutional affiliations. |
© 2021 by the authors. Licensee MDPI, Basel, Switzerland. This article is an open access article distributed under the terms and conditions of the Creative Commons Attribution (CC BY) license (https://creativecommons.org/licenses/by/4.0/).
Share and Cite
MDPI and ACS Style
Doekes, H.P.; Bijma, P.; Windig, J.J. How Depressing Is Inbreeding? A Meta-Analysis of 30 Years of Research on the Effects of Inbreeding in Livestock. Genes 2021, 12, 926. https://0-doi-org.brum.beds.ac.uk/10.3390/genes12060926
AMA Style
Doekes HP, Bijma P, Windig JJ. How Depressing Is Inbreeding? A Meta-Analysis of 30 Years of Research on the Effects of Inbreeding in Livestock. Genes. 2021; 12(6):926. https://0-doi-org.brum.beds.ac.uk/10.3390/genes12060926
Chicago/Turabian StyleDoekes, Harmen P., Piter Bijma, and Jack J. Windig. 2021. "How Depressing Is Inbreeding? A Meta-Analysis of 30 Years of Research on the Effects of Inbreeding in Livestock" Genes 12, no. 6: 926. https://0-doi-org.brum.beds.ac.uk/10.3390/genes12060926
Note that from the first issue of 2016, this journal uses article numbers instead of page numbers. See further details here.