
NAPRT Expression Regulation Mechanisms: Novel Functions Predicted by a Bioinformatics Approach

 , , ,
, , ,
Abstract
:
1. Introduction
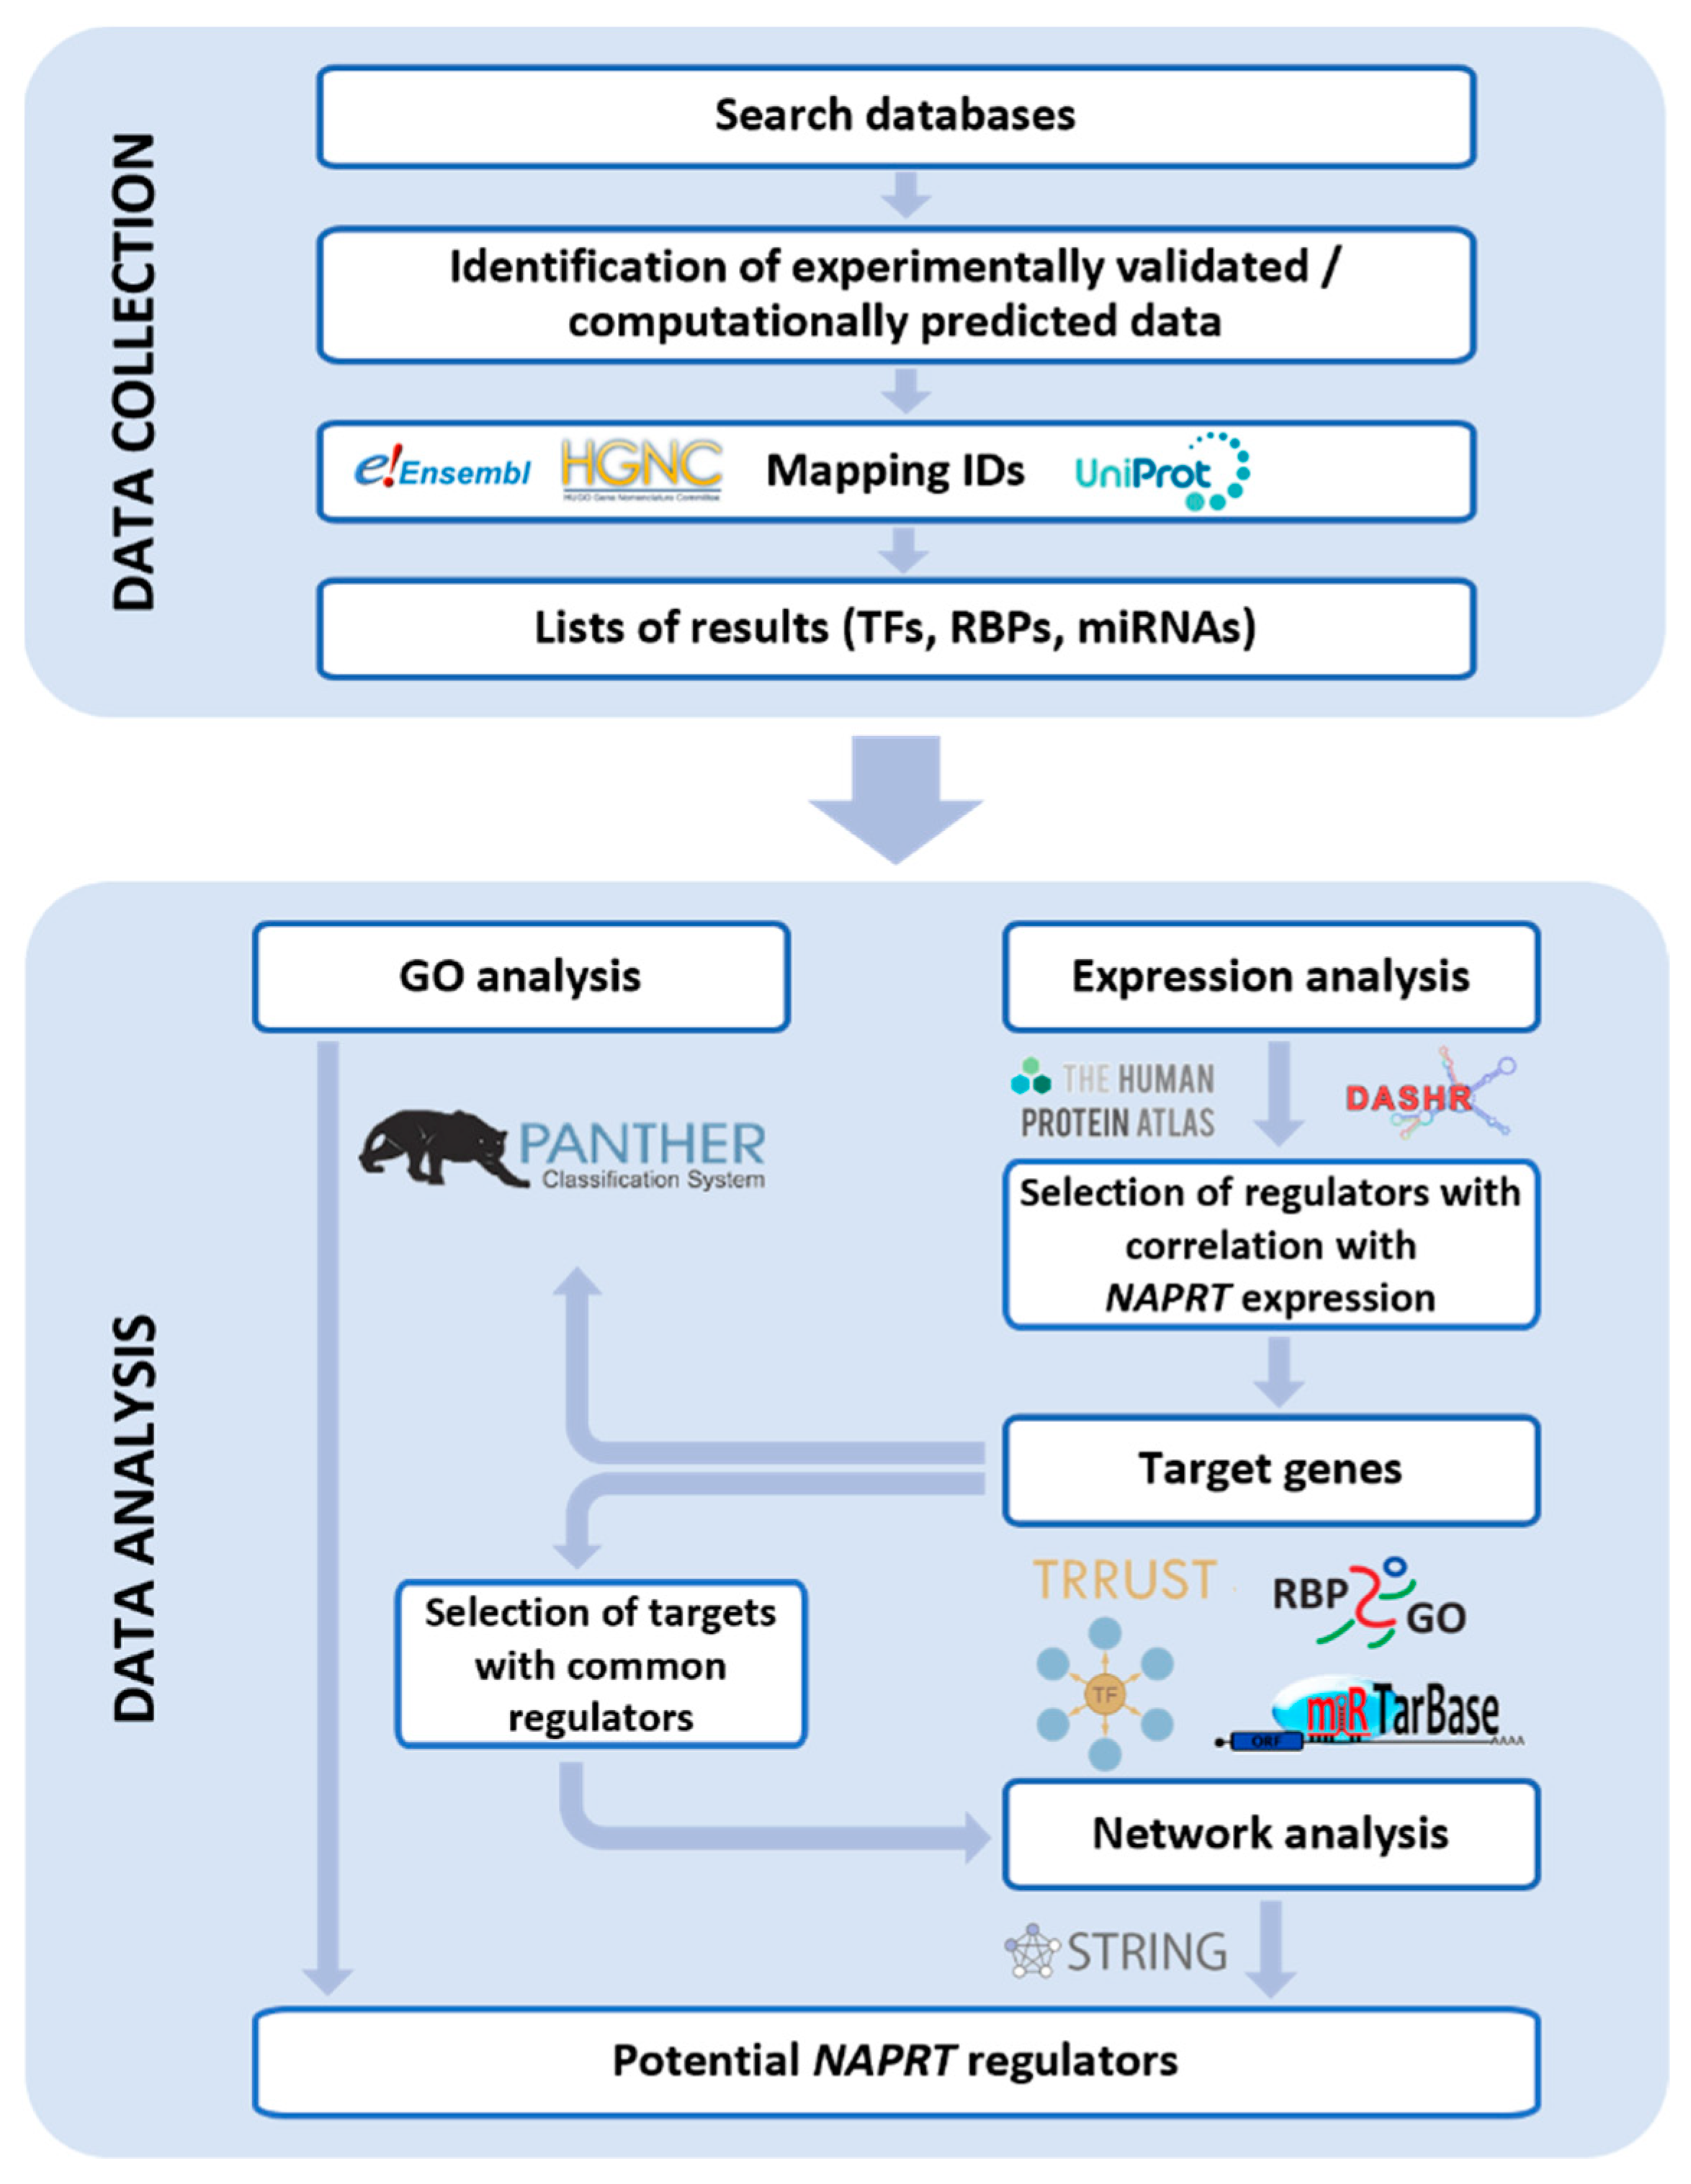
2. Methods
2.1. Collection of NAPRT Potential Regulators
2.1.1. Transcription Factors
2.1.2. RNA Binding Proteins
2.1.3. microRNAs
2.2. Data Analysis
2.2.1. Correlation with NAPRT Gene Expression
2.2.2. Target Genes
2.2.3. Functional Analysis
3. Results
3.1. Potential Regulators of NAPRT Gene Expression
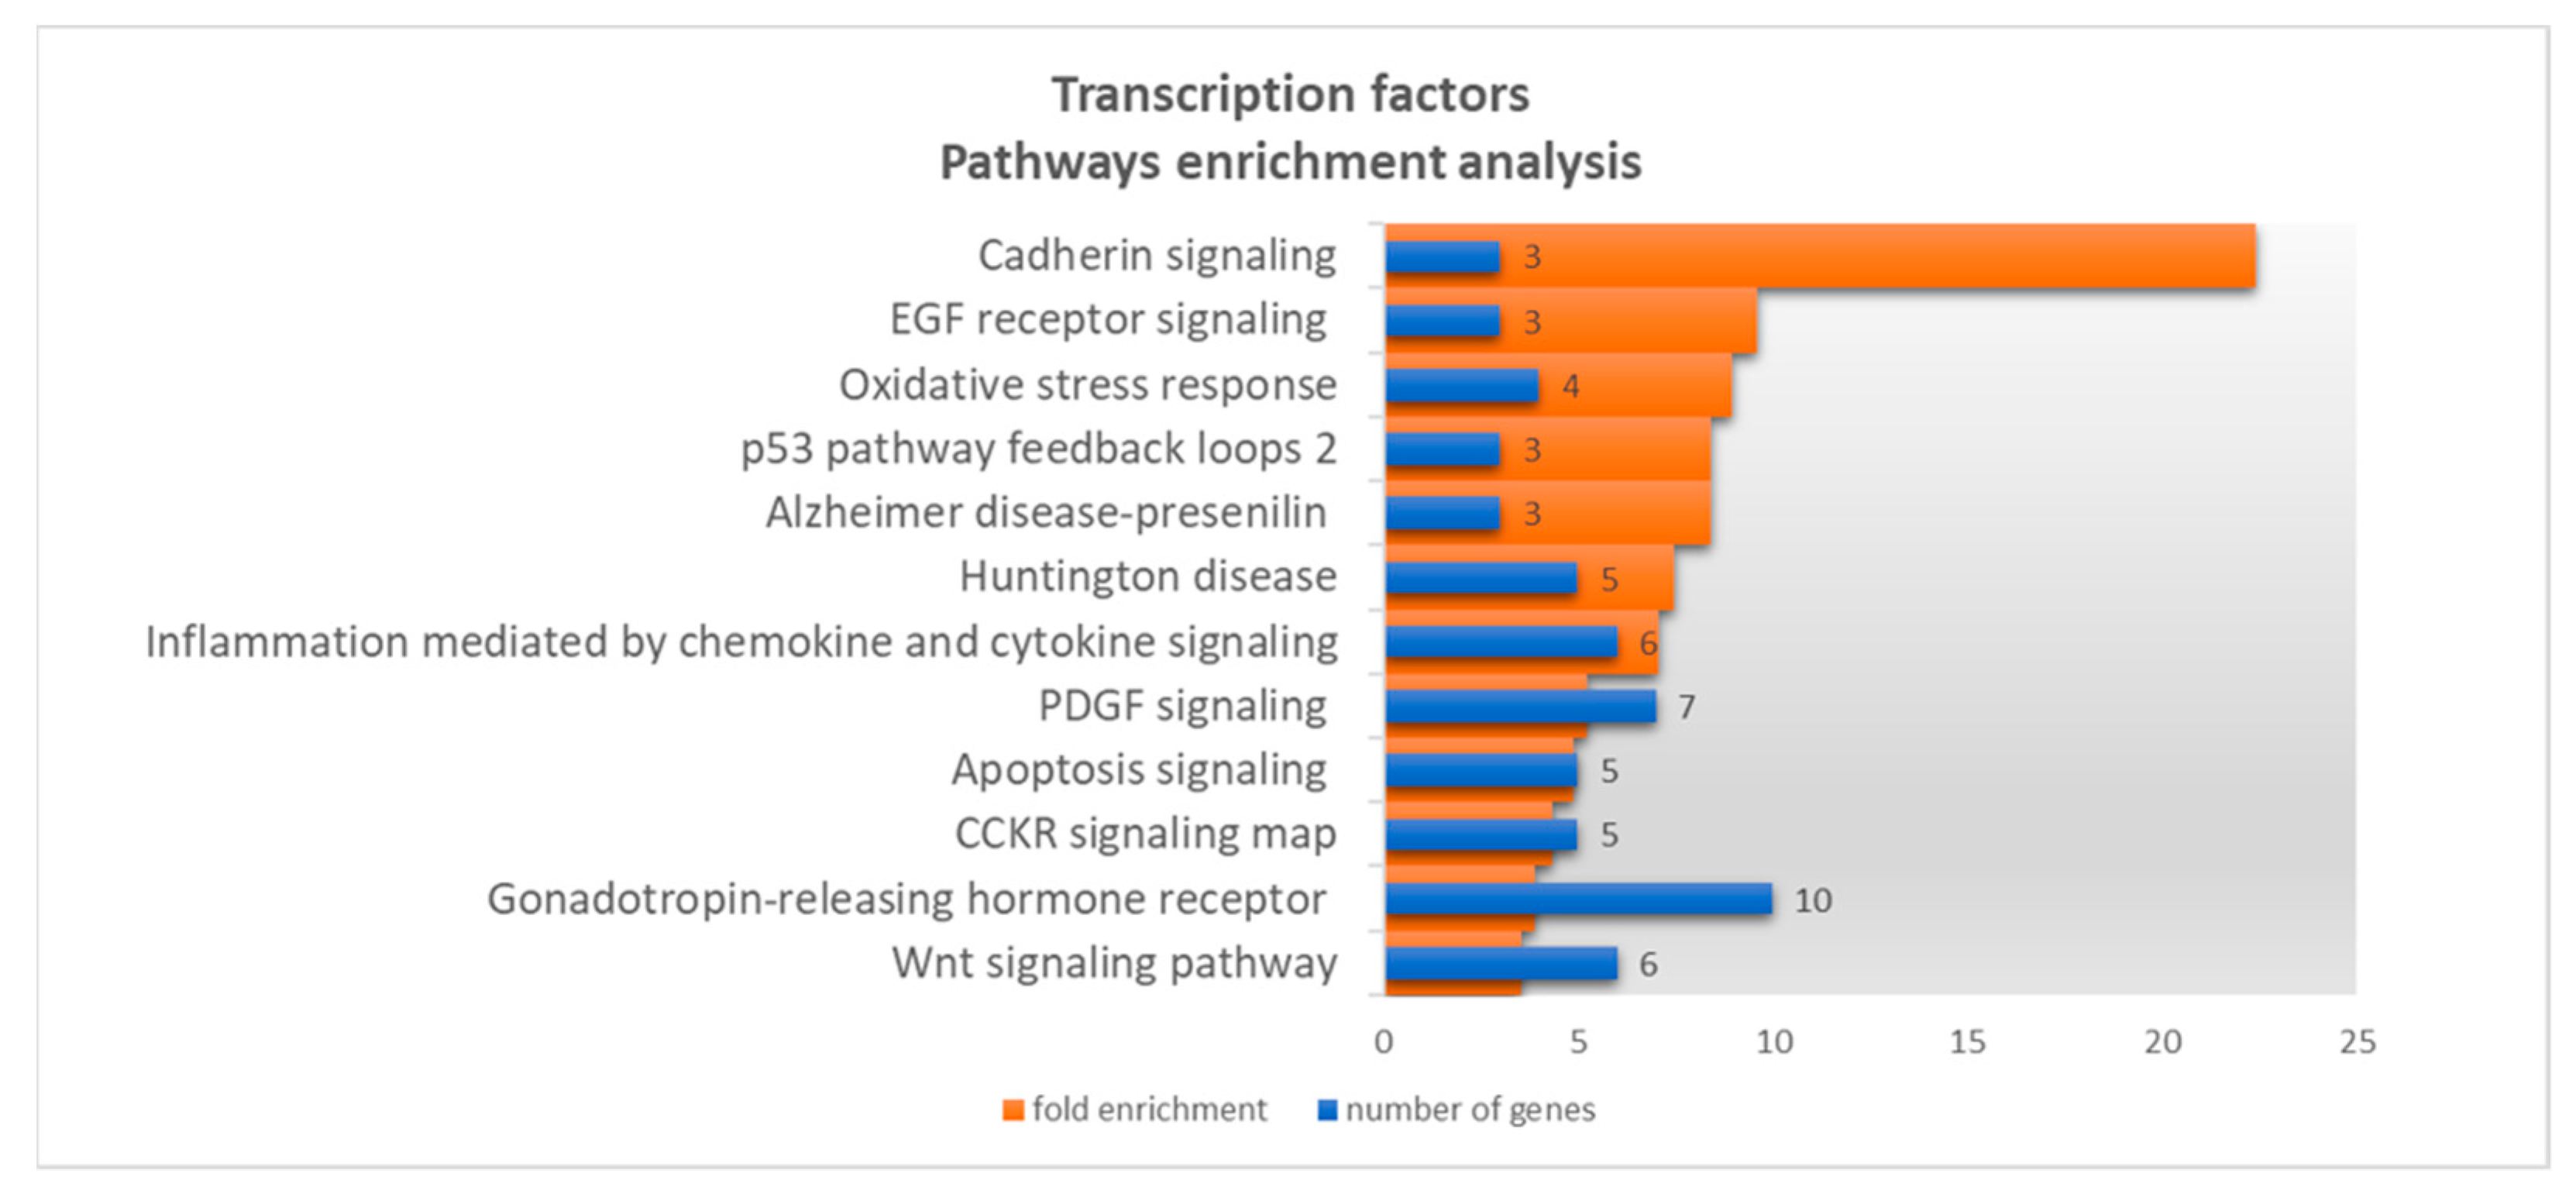
3.1.1. Transcription Factors
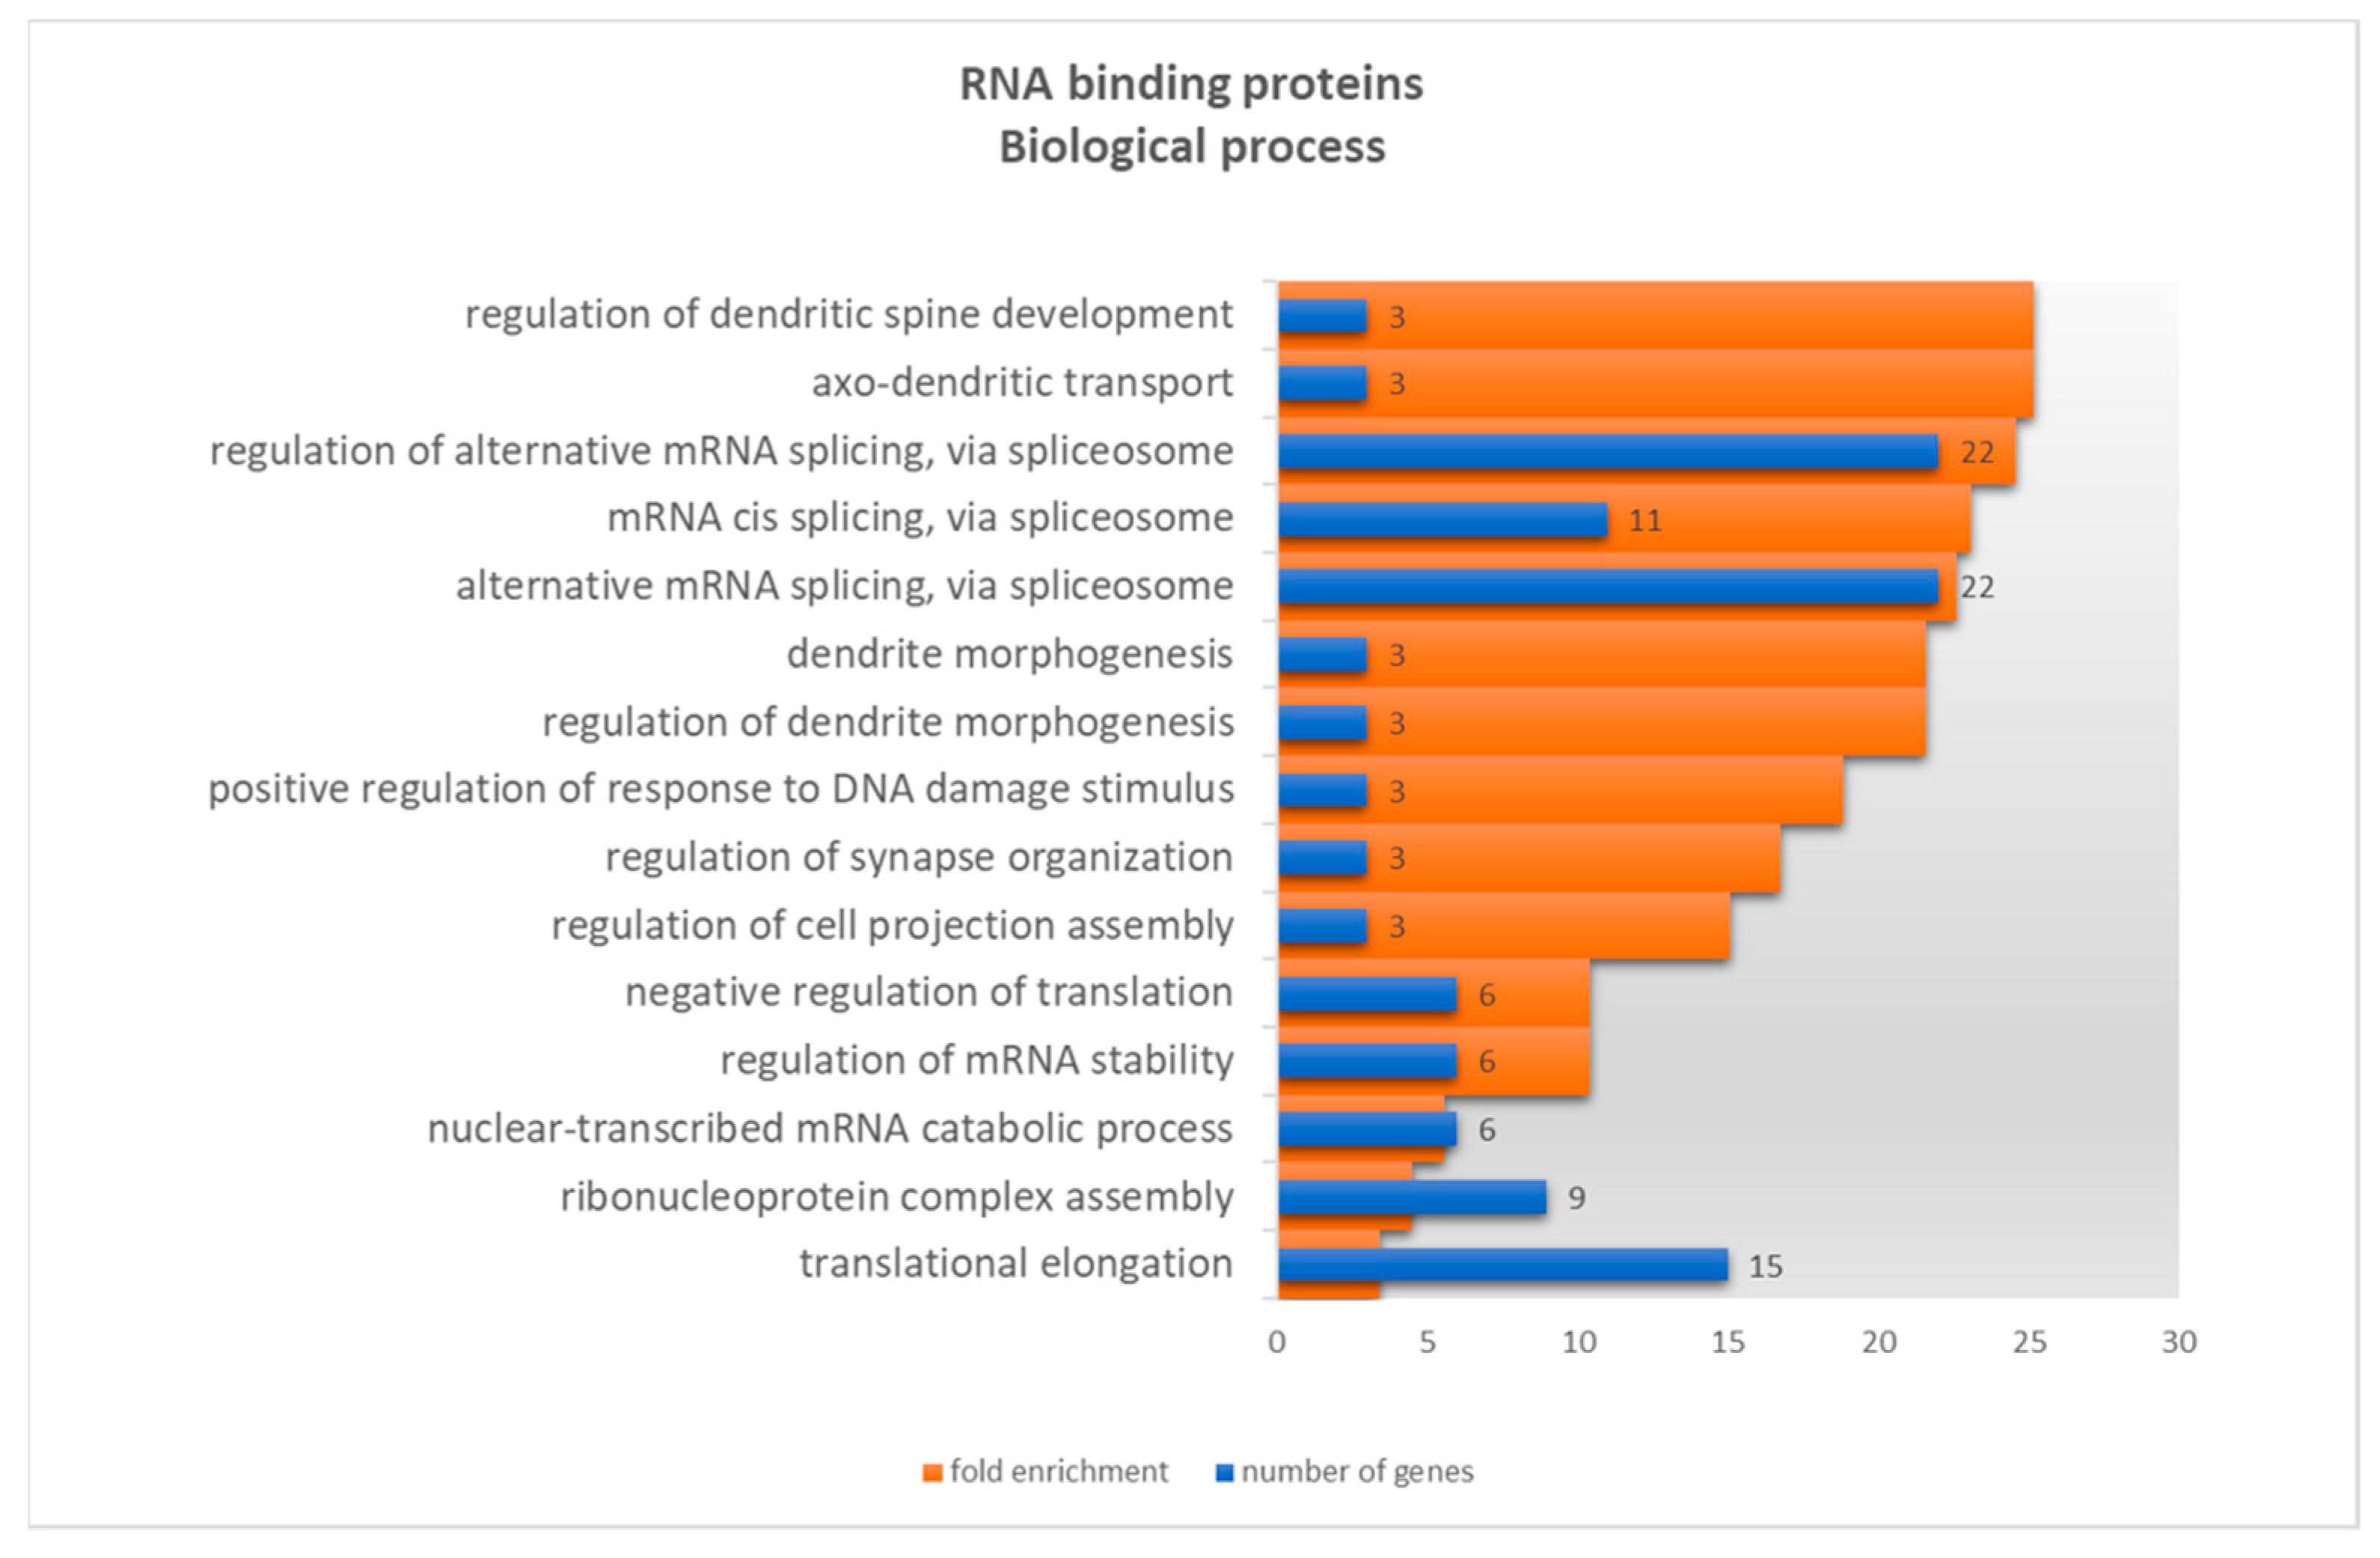
3.1.2. RNA Binding Proteins
3.1.3. microRNAs
3.2. Expression Correlation between TFs, RBPs, miRNAs and the NAPRT Gene
3.3. Analysis of Target Genes
3.3.1. Gene Ontology
3.3.2. Targets Co-Regulated
4. Discussion
5. Conclusions
Supplementary Materials
Author Contributions
Funding
Institutional Review Board Statement
Informed Consent Statement
Data Availability Statement
Acknowledgments
Conflicts of Interest
References
- Watson, M.; Roulston, A.; Bélec, L.; Billot, X.; Marcellus, R.; Bédard, D.; Bernier, C.; Branchaud, S.; Chan, H.; Dairi, K.; et al. The small molecule GMX1778 is a potent inhibitor of NAD+ biosynthesis: Strategy for enhanced therapy in nicotinic acid phosphoribosyltransferase 1-deficient tumors. Mol. Cell Biol. 2009, 29, 5872–5888. [Google Scholar] [CrossRef] [PubMed] [Green Version]
- Tarrant, J.M.; Dhawan, P.; Singh, J.; Zabka, T.S.; Clarke, E.; DosSantos, G.; Dragovich, P.S.; Sampath, D.; Lin, T.; McCray, B.; et al. Preclinical models of nicotinamide phosphoribosyltransferase inhibitor-mediated hematotoxicity and mitigation by co-treatment with nicotinic acid. Toxicol. Mech. Methods 2015, 25, 201–211. [Google Scholar] [CrossRef]
- Cole, J.; Guiot, M.C.; Gravel, M.; Bernier, C.; Shore, G.C.; Roulston, A. Novel NAPRT specific antibody identifies small cell lung cancer and neuronal cancers as promising clinical indications for a NAMPT inhibitor/niacin co-administration strategy. Oncotarget 2017, 8, 77846–77859. [Google Scholar] [CrossRef] [Green Version]
- Zhao, G.; Green, C.F.; Hui, Y.H.; Prieto, L.; Shepard, R.; Dong, S.; Wang, T.; Tan, B.; Gong, X.; Kays, L.; et al. Discovery of a Highly Selective NAMPT Inhibitor That Demonstrates Robust Efficacy and Improved Retinal Toxicity with Nicotinic Acid Coadministration. Mol. Cancer Ther. 2017, 16, 2677–2688. [Google Scholar] [CrossRef] [Green Version]
- Rongvaux, A.; Andris, F.; Van Gool, F.; Leo, O. Reconstructing eukaryotic NAD metabolism. Bioessays 2003, 25, 683–690. [Google Scholar] [CrossRef]
- Magni, G.; Amici, A.; Emanuelli, M.; Orsomando, G.; Raffaelli, N.; Ruggieri, S. Enzymology of NAD+ homeostasis in man. Cell Mol. Life Sci. 2004, 61, 19–34. [Google Scholar] [CrossRef]
- Piacente, F.; Caffa, I.; Ravera, S.; Sociali, G.; Passalacqua, M.; Vellone, V.G.; Becherini, P.; Reverberi, D.; Monacelli, F.; Ballestrero, A.; et al. Nicotinic Acid Phosphoribosyltransferase Regulates Cancer Cell Metabolism, Susceptibility to NAMPT Inhibitors, and DNA Repair. Cancer Res. 2017, 77, 3857–3869. [Google Scholar] [CrossRef] [Green Version]
- Olesen, U.H.; Hastrup, N.; Sehested, M. Expression patterns of nicotinamide phosphoribosyltransferase and nicotinic acid phosphoribosyltransferase in human malignant lymphomas. APMIS 2011, 119, 296–303. [Google Scholar] [CrossRef] [PubMed]
- O’Brien, T.; Oeh, J.; Xiao, Y.; Liang, X.; Vanderbilt, A.; Qin, A.; Yang, L.; Lee, L.B.; Ly, J.; Cosino, E.; et al. Supplementation of nicotinic acid with NAMPT inhibitors results in loss of in vivo efficacy in NAPRT1-deficient tumor models. Neoplasia 2013, 15, 1314–1329. [Google Scholar] [CrossRef] [PubMed] [Green Version]
- Duarte-Pereira, S.; Pereira-Castro, I.; Silva, S.S.; Correia, M.G.; Neto, C.; da Costa, L.T.; Amorim, A.; Silva, R.M. Extensive regulation of nicotinate phosphoribosyltransferase (NAPRT) expression in human tissues and tumors. Oncotarget 2016, 7, 1973–1983. [Google Scholar] [CrossRef] [PubMed] [Green Version]
- Shames, D.S.; Elkins, K.; Walter, K.; Holcomb, T.; Du, P.; Mohl, D.; Xiao, Y.; Pham, T.; Haverty, P.M.; Liederer, B.; et al. Loss of NAPRT1 expression by tumor-specific promoter methylation provides a novel predictive biomarker for NAMPT inhibitors. Clin. Cancer Res. 2013, 19, 6912–6923. [Google Scholar] [CrossRef] [PubMed] [Green Version]
- Peterse, E.F.P.; van den Akker, B.E.W.M.; Niessen, B.; Oosting, J.; Suijker, J.; de Jong, Y.; Danen, E.H.J.; Cleton-Jansen, A.M.; Bovée, J.V.M.G. NAD Synthesis Pathway Interference Is a Viable Therapeutic Strategy for Chondrosarcoma. Mol. Cancer Res. 2017, 15, 1714–1721. [Google Scholar] [CrossRef] [PubMed] [Green Version]
- Fons, N.R.; Sundaram, R.K.; Breuer, G.A.; Peng, S.; McLean, R.L.; Kalathil, A.N.; Schmidt, M.S.; Carvalho, D.M.; Mackay, A.; Jones, C.; et al. PPM1D mutations silence NAPRT gene expression and confer NAMPT inhibitor sensitivity in glioma. Nat. Commun. 2019, 10, 3790. [Google Scholar] [CrossRef] [PubMed] [Green Version]
- Lee, J.; Kim, H.; Lee, J.E.; Shin, S.J.; Oh, S.; Kwon, G.; Choi, Y.Y.; White, M.A.; Paik, S.; Cheong, J.H.; et al. Selective Cytotoxicity of the NAMPT Inhibitor FK866 Toward Gastric Cancer Cells With Markers of the Epithelial-Mesenchymal Transition, Due to Loss of NAPRT. Gastroenterology 2018, 155, 799–814.e13. [Google Scholar] [CrossRef]
- Chowdhry, S.; Zanca, C.; Rajkumar, U.; Koga, T.; Diao, Y.; Raviram, R.; Liu, F.; Turner, K.; Yang, H.; Brunk, E.; et al. NAD metabolic dependency in cancer is shaped by gene amplification and enhancer remodelling. Nature 2019, 569, 570–575. [Google Scholar] [CrossRef]
- Managò, A.; Audrito, V.; Mazzola, F.; Sorci, L.; Gaudino, F.; Gizzi, K.; Vitale, N.; Incarnato, D.; Minazzato, G.; Ianniello, A.; et al. Extracellular nicotinate phosphoribosyltransferase binds Toll like receptor 4 and mediates inflammation. Nat. Commun. 2019, 10, 4116. [Google Scholar] [CrossRef]
- Audrito, V.; Messana, V.G.; Deaglio, S. NAMPT and NAPRT: Two Metabolic Enzymes With Key Roles in Inflammation. Front. Oncol. 2020, 10, 358. [Google Scholar] [CrossRef] [Green Version]
- Duarte-Pereira, S.; Silva, S.S.; Azevedo, L.; Castro, L.; Amorim, A.; Silva, R.M. NAMPT and NAPRT1: Novel polymorphisms and distribution of variants between normal tissues and tumor samples. Sci. Rep. 2014, 4, 6311. [Google Scholar] [CrossRef] [Green Version]
- Davis, C.A.; Hitz, B.C.; Sloan, C.A.; Chan, E.T.; Davidson, J.M.; Gabdank, I.; Hilton, J.A.; Jain, K.; Baymuradov, U.K.; Narayanan, A.K.; et al. The Encyclopedia of DNA elements (ENCODE): Data portal update. Nucleic Acids Res. 2018, 46, D794–D801. [Google Scholar] [CrossRef] [Green Version]
- Wang, J.; Zhuang, J.; Iyer, S.; Lin, X.Y.; Greven, M.C.; Kim, B.H.; Moore, J.; Pierce, B.G.; Dong, X.; Virgil, D.; et al. Factorbook.org: A Wiki-based database for transcription factor-binding data generated by the ENCODE consortium. Nucleic Acids Res. 2013, 41, D171–D176. [Google Scholar] [CrossRef] [Green Version]
- Hume, M.A.; Barrera, L.A.; Gisselbrecht, S.S.; Bulyk, M.L. UniPROBE, update 2015: New tools and content for the online database of protein-binding microarray data on protein-DNA interactions. Nucleic Acids Res. 2015, 43, D117–D122. [Google Scholar] [CrossRef]
- Farré, D.; Roset, R.; Huerta, M.; Adsuara, J.E.; Roselló, L.; Albà, M.M.; Messeguer, X. Identification of patterns in biological sequences at the ALGGEN server: PROMO and MALGEN. Nucleic Acids Res. 2003, 31, 3651–3653. [Google Scholar] [CrossRef] [Green Version]
- Messeguer, X.; Escudero, R.; Farré, D.; Núñez, O.; Martínez, J.; Albà, M.M. PROMO: Detection of known transcription regulatory elements using species-tailored searches. Bioinformatics 2002, 18, 333–334. [Google Scholar] [CrossRef]
- Daily, K.; Patel, V.R.; Rigor, P.; Xie, X.; Baldi, P. MotifMap: Integrative genome-wide maps of regulatory motif sites for model species. BMC Bioinform. 2011, 12, 495. [Google Scholar] [CrossRef] [PubMed] [Green Version]
- Xie, X.; Rigor, P.; Baldi, P. MotifMap: A human genome-wide map of candidate regulatory motif sites. Bioinformatics 2009, 25, 167–174. [Google Scholar] [CrossRef]
- Ziebarth, J.D.; Bhattacharya, A.; Cui, Y. CTCFBSDB 2.0: A database for CTCF-binding sites and genome organization. Nucleic Acids Res. 2013, 41, D188–D194. [Google Scholar] [CrossRef] [Green Version]
- Li, J.H.; Liu, S.; Zhou, H.; Qu, L.H.; Yang, J.H. starBase v2.0: Decoding miRNA-ceRNA, miRNA-ncRNA and protein-RNA interaction networks from large-scale CLIP-Seq data. Nucleic Acids Res. 2014, 42, D92–D97. [Google Scholar] [CrossRef] [Green Version]
- Dweep, H.; Gretz, N. miRWalk2.0: A comprehensive atlas of microRNA-target interactions. Nat. Methods 2015, 12, 697. [Google Scholar] [CrossRef] [PubMed]
- Yang, Y.C.; Di, C.; Hu, B.; Zhou, M.; Liu, Y.; Song, N.; Li, Y.; Umetsu, J.; Lu, Z.J. CLIPdb: A CLIP-seq database for protein-RNA interactions. BMC Genom. 2015, 16, 51. [Google Scholar] [CrossRef] [Green Version]
- Zhu, Y.; Xu, G.; Yang, Y.T.; Xu, Z.; Chen, X.; Shi, B.; Xie, D.; Lu, Z.J.; Wang, P. POSTAR2: Deciphering the post-transcriptional regulatory logics. Nucleic Acids Res. 2019, 47, D203–D211. [Google Scholar] [CrossRef] [PubMed] [Green Version]
- Dassi, E.; Re, A.; Leo, S.; Tebaldi, T.; Pasini, L.; Peroni, D.; Quattrone, A. AURA 2: Empowering discovery of post-transcriptional networks. Translation 2014, 2, e27738. [Google Scholar] [CrossRef]
- Cook, K.B.; Kazan, H.; Zuberi, K.; Morris, Q.; Hughes, T.R. RBPDB: A database of RNA-binding specificities. Nucleic Acids Res. 2011, 39, D301–D308. [Google Scholar] [CrossRef] [Green Version]
- Paz, I.; Kosti, I.; Ares, M.; Cline, M.; Mandel-Gutfreund, Y. RBPmap: A web server for mapping binding sites of RNA-binding proteins. Nucleic Acids Res. 2014, 42, W361–W367. [Google Scholar] [CrossRef] [PubMed]
- Agostini, F.; Zanzoni, A.; Klus, P.; Marchese, D.; Cirillo, D.; Tartaglia, G.G. catRAPID omics: A web server for large-scale prediction of protein-RNA interactions. Bioinformatics 2013, 29, 2928–2930. [Google Scholar] [CrossRef]
- Ray, D.; Kazan, H.; Cook, K.B.; Weirauch, M.T.; Najafabadi, H.S.; Li, X.; Gueroussov, S.; Albu, M.; Zheng, H.; Yang, A.; et al. A compendium of RNA-binding motifs for decoding gene regulation. Nature 2013, 499, 172–177. [Google Scholar] [CrossRef] [Green Version]
- Vlachos, I.S.; Paraskevopoulou, M.D.; Karagkouni, D.; Georgakilas, G.; Vergoulis, T.; Kanellos, I.; Anastasopoulos, I.L.; Maniou, S.; Karathanou, K.; Kalfakakou, D.; et al. DIANA-TarBase v7.0: Indexing more than half a million experimentally supported miRNA:mRNA interactions. Nucleic Acids Res. 2015, 43, D153–D159. [Google Scholar] [CrossRef] [PubMed]
- Chou, C.H.; Chang, N.W.; Shrestha, S.; Hsu, S.D.; Lin, Y.L.; Lee, W.H.; Yang, C.D.; Hong, H.C.; Wei, T.Y.; Tu, S.J.; et al. miRTarBase 2016: Updates to the experimentally validated miRNA-target interactions database. Nucleic Acids Res. 2016, 44, D239–D247. [Google Scholar] [CrossRef]
- Paraskevopoulou, M.D.; Georgakilas, G.; Kostoulas, N.; Vlachos, I.S.; Vergoulis, T.; Reczko, M.; Filippidis, C.; Dalamagas, T.; Hatzigeorgiou, A.G. DIANA-microT web server v5.0: Service integration into miRNA functional analysis workflows. Nucleic Acids Res. 2013, 41, W169–W173. [Google Scholar] [CrossRef] [PubMed] [Green Version]
- Agarwal, V.; Bell, G.W.; Nam, J.W.; Bartel, D.P. Predicting effective microRNA target sites in mammalian mRNAs. eLife 2015, 4, 5005. [Google Scholar] [CrossRef]
- Kuksa, P.P.; Amlie-Wolf, A.; Katanić, Ž.; Valladares, O.; Wang, L.S.; Leung, Y.Y. DASHR 2.0: Integrated database of human small non-coding RNA genes and mature products. Bioinformatics 2019, 35, 1033–1039. [Google Scholar] [CrossRef] [PubMed] [Green Version]
- Cho, S.; Jang, I.; Jun, Y.; Yoon, S.; Ko, M.; Kwon, Y.; Choi, I.; Chang, H.; Ryu, D.; Lee, B.; et al. MiRGator v3.0: A microRNA portal for deep sequencing, expression profiling and mRNA targeting. Nucleic Acids Res. 2013, 41, D252–D257. [Google Scholar] [CrossRef] [PubMed] [Green Version]
- Consortium, U. UniProt: A worldwide hub of protein knowledge. Nucleic Acids Res. 2019, 47, D506–D515. [Google Scholar] [CrossRef] [PubMed] [Green Version]
- Uhlén, M.; Fagerberg, L.; Hallström, B.M.; Lindskog, C.; Oksvold, P.; Mardinoglu, A.; Sivertsson, Å.; Kampf, C.; Sjöstedt, E.; Asplund, A.; et al. Proteomics. Tissue-based map of the human proteome. Science 2015, 347, 1260419. [Google Scholar] [CrossRef]
- Akoglu, H. User’s guide to correlation coefficients. Turk. J. Emerg. Med. 2018, 18, 91–93. [Google Scholar] [CrossRef]
- Han, H.; Cho, J.W.; Lee, S.; Yun, A.; Kim, H.; Bae, D.; Yang, S.; Kim, C.Y.; Lee, M.; Kim, E.; et al. TRRUST v2: An expanded reference database of human and mouse transcriptional regulatory interactions. Nucleic Acids Res. 2018, 46, D380–D386. [Google Scholar] [CrossRef]
- Caudron-Herger, M.; Jansen, R.E.; Wassmer, E.; Diederichs, S. RBP2GO: A comprehensive pan-species database on RNA-binding proteins, their interactions and functions. Nucleic Acids Res. 2021, 49, D425–D436. [Google Scholar] [CrossRef]
- Mi, H.; Ebert, D.; Muruganujan, A.; Mills, C.; Albou, L.P.; Mushayamaha, T.; Thomas, P.D. PANTHER version 16: A revised family classification, tree-based classification tool, enhancer regions and extensive API. Nucleic Acids Res. 2021, 49, D394–D403. [Google Scholar] [CrossRef] [PubMed]
- Consortium, E.P. An integrated encyclopedia of DNA elements in the human genome. Nature 2012, 489, 57–74. [Google Scholar] [CrossRef] [PubMed]
- Lambert, S.A.; Jolma, A.; Campitelli, L.F.; Das, P.K.; Yin, Y.; Albu, M.; Chen, X.; Taipale, J.; Hughes, T.R.; Weirauch, M.T. The Human Transcription Factors. Cell 2018, 172, 650–665. [Google Scholar] [CrossRef] [Green Version]
- Szklarczyk, D.; Gable, A.L.; Lyon, D.; Junge, A.; Wyder, S.; Huerta-Cepas, J.; Simonovic, M.; Doncheva, N.T.; Morris, J.H.; Bork, P.; et al. STRING v11: Protein-protein association networks with increased coverage, supporting functional discovery in genome-wide experimental datasets. Nucleic Acids Res. 2019, 47, D607–D613. [Google Scholar] [CrossRef] [Green Version]
- Allocco, D.J.; Kohane, I.S.; Butte, A.J. Quantifying the relationship between co-expression, co-regulation and gene function. BMC Bioinform. 2004, 5, 18. [Google Scholar] [CrossRef] [Green Version]
- Bem, J.; Brożko, N.; Chakraborty, C.; Lipiec, M.A.; Koziński, K.; Nagalski, A.; Szewczyk, Ł.; Wiśniewska, M.B. Wnt/β-catenin signaling in brain development and mental disorders: Keeping TCF7L2 in mind. FEBS Lett. 2019, 593, 1654–1674. [Google Scholar] [CrossRef] [PubMed] [Green Version]
- Vallée, A.; Vallée, J.N.; Guillevin, R.; Lecarpentier, Y. Interactions Between the Canonical WNT/Beta-Catenin Pathway and PPAR Gamma on Neuroinflammation, Demyelination, and Remyelination in Multiple Sclerosis. Cell Mol. Neurobiol. 2018, 38, 783–795. [Google Scholar] [CrossRef] [PubMed]
- Patzlaff, N.E.; Shen, M.; Zhao, X. Regulation of Adult Neurogenesis by the Fragile X Family of RNA Binding Proteins. Brain Plast. 2018, 3, 205–223. [Google Scholar] [CrossRef] [Green Version]
- Majumder, M.; Johnson, R.H.; Palanisamy, V. Fragile X-related protein family: A double-edged sword in neurodevelopmental disorders and cancer. Crit. Rev. Biochem. Mol. Biol. 2020, 55, 409–424. [Google Scholar] [CrossRef] [PubMed]
- Tomljanovic, Z.; Patel, M.; Shin, W.; Califano, A.; Teich, A.F. ZCCHC17 is a master regulator of synaptic gene expression in Alzheimer’s disease. Bioinformatics 2018, 34, 367–371. [Google Scholar] [CrossRef]
- Ohno, H.; Takimoto, G.; McKeithan, T.W. The candidate proto-oncogene bcl-3 is related to genes implicated in cell lineage determination and cell cycle control. Cell 1990, 60, 991–997. [Google Scholar] [CrossRef]
- Legge, D.N.; Shephard, A.P.; Collard, T.J.; Greenhough, A.; Chambers, A.C.; Clarkson, R.W.; Paraskeva, C.; Williams, A.C. BCL-3 promotes a cancer stem cell phenotype by enhancing β-catenin signalling in colorectal tumour cells. Dis. Model Mech. 2019, 12, 37697. [Google Scholar] [CrossRef] [Green Version]
- Libby, C.J.; Gc, S.; Benavides, G.A.; Fisher, J.L.; Williford, S.E.; Zhang, S.; Tran, A.N.; Gordon, E.R.; Jones, A.B.; Tuy, K.; et al. A role for GLUT3 in glioblastoma cell invasion that is not recapitulated by GLUT1. Cell Adhes. Migr. 2021, 15, 101–115. [Google Scholar] [CrossRef]
- Amin, N.D.; Bai, G.; Klug, J.R.; Bonanomi, D.; Pankratz, M.T.; Gifford, W.D.; Hinckley, C.A.; Sternfeld, M.J.; Driscoll, S.P.; Dominguez, B.; et al. Loss of motoneuron-specific microRNA-218 causes systemic neuromuscular failure. Science 2015, 350, 1525–1529. [Google Scholar] [CrossRef] [PubMed] [Green Version]
- Reichenstein, I.; Eitan, C.; Diaz-Garcia, S.; Haim, G.; Magen, I.; Siany, A.; Hoye, M.L.; Rivkin, N.; Olender, T.; Toth, B.; et al. Human genetics and neuropathology suggest a link between miR-218 and amyotrophic lateral sclerosis pathophysiology. Sci. Transl. Med. 2019, 11, 5264. [Google Scholar] [CrossRef] [PubMed]
- Zhang, W.B.; Zhong, W.J.; Wang, L. A signal-amplification circuit between miR-218 and Wnt/β-catenin signal promotes human adipose tissue-derived stem cells osteogenic differentiation. Bone 2014, 58, 59–66. [Google Scholar] [CrossRef] [PubMed]
- Hu, F.; Sun, B.; Xu, P.; Zhu, Y.; Meng, X.H.; Teng, G.J.; Xiao, Z.D. MiR-218 Induces Neuronal Differentiation of ASCs in a Temporally Sequential Manner with Fibroblast Growth Factor by Regulation of the Wnt Signaling Pathway. Sci. Rep. 2017, 7, 39427. [Google Scholar] [CrossRef]
- Khalil, W.; Tiraihi, T.; Soleimani, M.; Baheiraei, N.; Zibara, K. Conversion of Neural Stem Cells into Functional Neuron-Like Cells by MicroRNA-218: Differential Expression of Functionality Genes. Neurotox. Res. 2020, 38, 707–722. [Google Scholar] [CrossRef] [PubMed]
- Yamada, N.O.; Heishima, K.; Akao, Y.; Senda, T. Extracellular Vesicles Containing MicroRNA-92a-3p Facilitate Partial Endothelial-Mesenchymal Transition and Angiogenesis in Endothelial Cells. Int. J. Mol. Sci. 2019, 20, 4406. [Google Scholar] [CrossRef] [Green Version]
- Jia, X.; Wang, F.; Han, Y.; Geng, X.; Li, M.; Shi, Y.; Lu, L.; Chen, Y. miR-137 and miR-491 Negatively Regulate Dopamine Transporter Expression and Function in Neural Cells. Neurosci. Bull. 2016, 32, 512–522. [Google Scholar] [CrossRef] [Green Version]
- Hrdličková, R.; Nehyba, J.; Bargmann, W.; Bose, H.R. Multiple tumor suppressor microRNAs regulate telomerase and TCF7, an important transcriptional regulator of the Wnt pathway. PLoS ONE 2014, 9, e86990. [Google Scholar] [CrossRef] [Green Version]
- Wiese, K.E.; Nusse, R.; van Amerongen, R. Wnt signalling: Conquering complexity. Development 2018, 145, 165902. [Google Scholar] [CrossRef] [Green Version]
- Lasky-Su, J.; Neale, B.M.; Franke, B.; Anney, R.J.; Zhou, K.; Maller, J.B.; Vasquez, A.A.; Chen, W.; Asherson, P.; Buitelaar, J.; et al. Genome-wide association scan of quantitative traits for attention deficit hyperactivity disorder identifies novel associations and confirms candidate gene associations. Am. J. Med. Genet. B Neuropsychiatr. Genet. 2008, 147B, 1345–1354. [Google Scholar] [CrossRef]
- Periyasamy, S.; John, S.; Padmavati, R.; Rajendren, P.; Thirunavukkarasu, P.; Gratten, J.; Vinkhuyzen, A.; McRae, A.; Holliday, E.G.; Nyholt, D.R.; et al. Association of Schizophrenia Risk With Disordered Niacin Metabolism in an Indian Genome-wide Association Study. JAMA Psychiatry 2019, 2019, 1335. [Google Scholar] [CrossRef]


| Transcrition Factors—BIOLOGICAL PROCESS |
|---|
| Immune response |
| Response to other organism |
| Regulation of epithelial cell proliferation |
| Positive regulation of immune system process |
| Negative regulation of cell population proliferation |
| Cellular response to growth factor stimulus |
| Regulation of immune response |
| Negative regulation of protein modification process |
| Gene Symbol | Protein Name | Spearman | p Value | |
|---|---|---|---|---|
| Transcription factors | BCL3 | BCL3 transcription coactivator | 0.725 | 2.64 × 10⁻¹¹ |
| CEBPB | CCAAT enhancer binding protein β | 0.618 | 8.62 × 10⁻⁸ | |
| JUN | Jun proto-oncogene, AP-1 transcription factor subunit | 0.532 | 8.46 × 10⁻⁶ | |
| MAFB | MAF bZIP transcription factor B | 0.569 | 1.42 × 10⁻⁶ | |
| PML | PML nuclear body scaffold | 0.568 | 1.44 × 10⁻⁶ | |
| RXRA | retinoid X receptor α | 0.628 | 4.67 × 10⁻⁸ | |
| STAT6 | signal transducer and activator of transcription 6 | 0.573 | 1.14 × 10⁻⁶ | |
| TCF3 | transcription factor 3 | 0.543 | 5.23 × 10⁻⁶ | |
| TMEM37 | transmembrane protein 37 | 0.566 | 1.65 × 10⁻⁶ | |
| YY1 | YY1 transcription factor | 0.522 | 1.33 × 10⁻⁵ | |
| ZBTB7A | zinc finger and BTB domain containing 7A | 0.590 | 4.52 × 10⁻⁷ | |
| RNA binding proteins | ESRP2 | epithelial splicing regulatory protein 2 | 0.532 | 8.72 × 10⁻⁶ |
| HNRNPAB | heterogeneous nuclear ribonucleoprotein A/B | 0.638 | 2.41 × 10⁻⁸ | |
| HNRNPH1 | heterogeneous nuclear ribonucleoprotein H1 | 0.503 | 3.15 × 10⁻⁵ | |
| HNRNPL | heterogeneous nuclear ribonucleoprotein L | 0.589 | 4.76 × 10⁻⁷ | |
| PCBP1 | poly(rC) binding protein 1 | 0.522 | 1.34 × 10⁻⁵ | |
| PTBP1 | polypyrimidine tract binding protein 1 | 0.608 | 1.63 × 10⁻⁷ | |
| PTBP3 | polypyrimidine tract binding protein 3 | 0.627 | 5.02 × 10⁻⁸ | |
| SRSF2 | serine and arginine rich splicing factor 2 | 0.621 | 7.30 × 10⁻⁸ | |
| YBX1 | Y-box binding protein 1 | 0.523 | 1.32 × 10⁻⁵ | |
| ZCCHC17 | zinc finger CCHC-type containing 17 | −0.636 | 2.82 × 10⁻⁸ |
| Dataset | Spearman Correlation | p-Value | ||
|---|---|---|---|---|
| hsa-miR-92a-3p | GSE34608 | Pulmonary tuberculosis and sarcoidosis | −0.797 | 1.3 × 10⁻⁵ |
| GSE38974 | Chronic obstructive pulmonary disease | −0.626 | 4.1 × 10⁻⁴ | |
| GSE42095 | Differentiated embryonic stem cells | 0.830 | 4.8 × 10⁻⁷ | |
| GSE28544 | Breast cancer | 0.710 | 5.1 × 10⁻⁵ | |
| GSE15076 | Monocyte-derived dendritic cells | 0.600 | 4.4 × 10⁻² | |
| hsa-miR-218-5p | GSE38226 | Liver fibrosis | −0.726 | 9.7 × 10⁻⁵ |
| Target Genes—PATHWAYS |
|---|
| p53 pathway |
| Toll receptor signaling pathway |
| Apoptosis signaling pathway |
| Interleukin signaling pathway |
| Transcription regulation by bZIP transcription factor |
| Blood coagulation |
| CCKR signaling map |
| Ras Pathway |
| Gonadotropin-releasing hormone receptor pathway |
| Alzheimer disease-presenilin pathway |
| Inflammation mediated by chemokine and cytokine signaling pathway |
| TGF-β signaling pathway |
| Angiogenesis |
| Huntington disease |
Publisher’s Note: MDPI stays neutral with regard to jurisdictional claims in published maps and institutional affiliations. |
© 2021 by the authors. Licensee MDPI, Basel, Switzerland. This article is an open access article distributed under the terms and conditions of the Creative Commons Attribution (CC BY) license (https://creativecommons.org/licenses/by/4.0/).
Share and Cite
Duarte-Pereira, S.; Fajarda, O.; Matos, S.; Luís Oliveira, J.; Silva, R.M. NAPRT Expression Regulation Mechanisms: Novel Functions Predicted by a Bioinformatics Approach. Genes 2021, 12, 2022. https://0-doi-org.brum.beds.ac.uk/10.3390/genes12122022
Duarte-Pereira S, Fajarda O, Matos S, Luís Oliveira J, Silva RM. NAPRT Expression Regulation Mechanisms: Novel Functions Predicted by a Bioinformatics Approach. Genes. 2021; 12(12):2022. https://0-doi-org.brum.beds.ac.uk/10.3390/genes12122022
Chicago/Turabian StyleDuarte-Pereira, Sara, Olga Fajarda, Sérgio Matos, José Luís Oliveira, and Raquel Monteiro Silva. 2021. "NAPRT Expression Regulation Mechanisms: Novel Functions Predicted by a Bioinformatics Approach" Genes 12, no. 12: 2022. https://0-doi-org.brum.beds.ac.uk/10.3390/genes12122022