
Longitudinal Changes in Cortical Thickness in Adolescents with Autism Spectrum Disorder and Their Association with Restricted and Repetitive Behaviors

 , and
, and
Abstract
:1. Introduction
2. Materials and Methods
2.1. Participants
2.2. MRI Data Acquisition
2.3. Cortical Surface Reconstruction Using FreeSurfer
2.4. Statistical Analyses
2.5. Gene Expression Decoding Analysis
3. Results
3.1. Subject Demographics
Intra-Individual Differences in RBS-R Total Severity Scores over Time
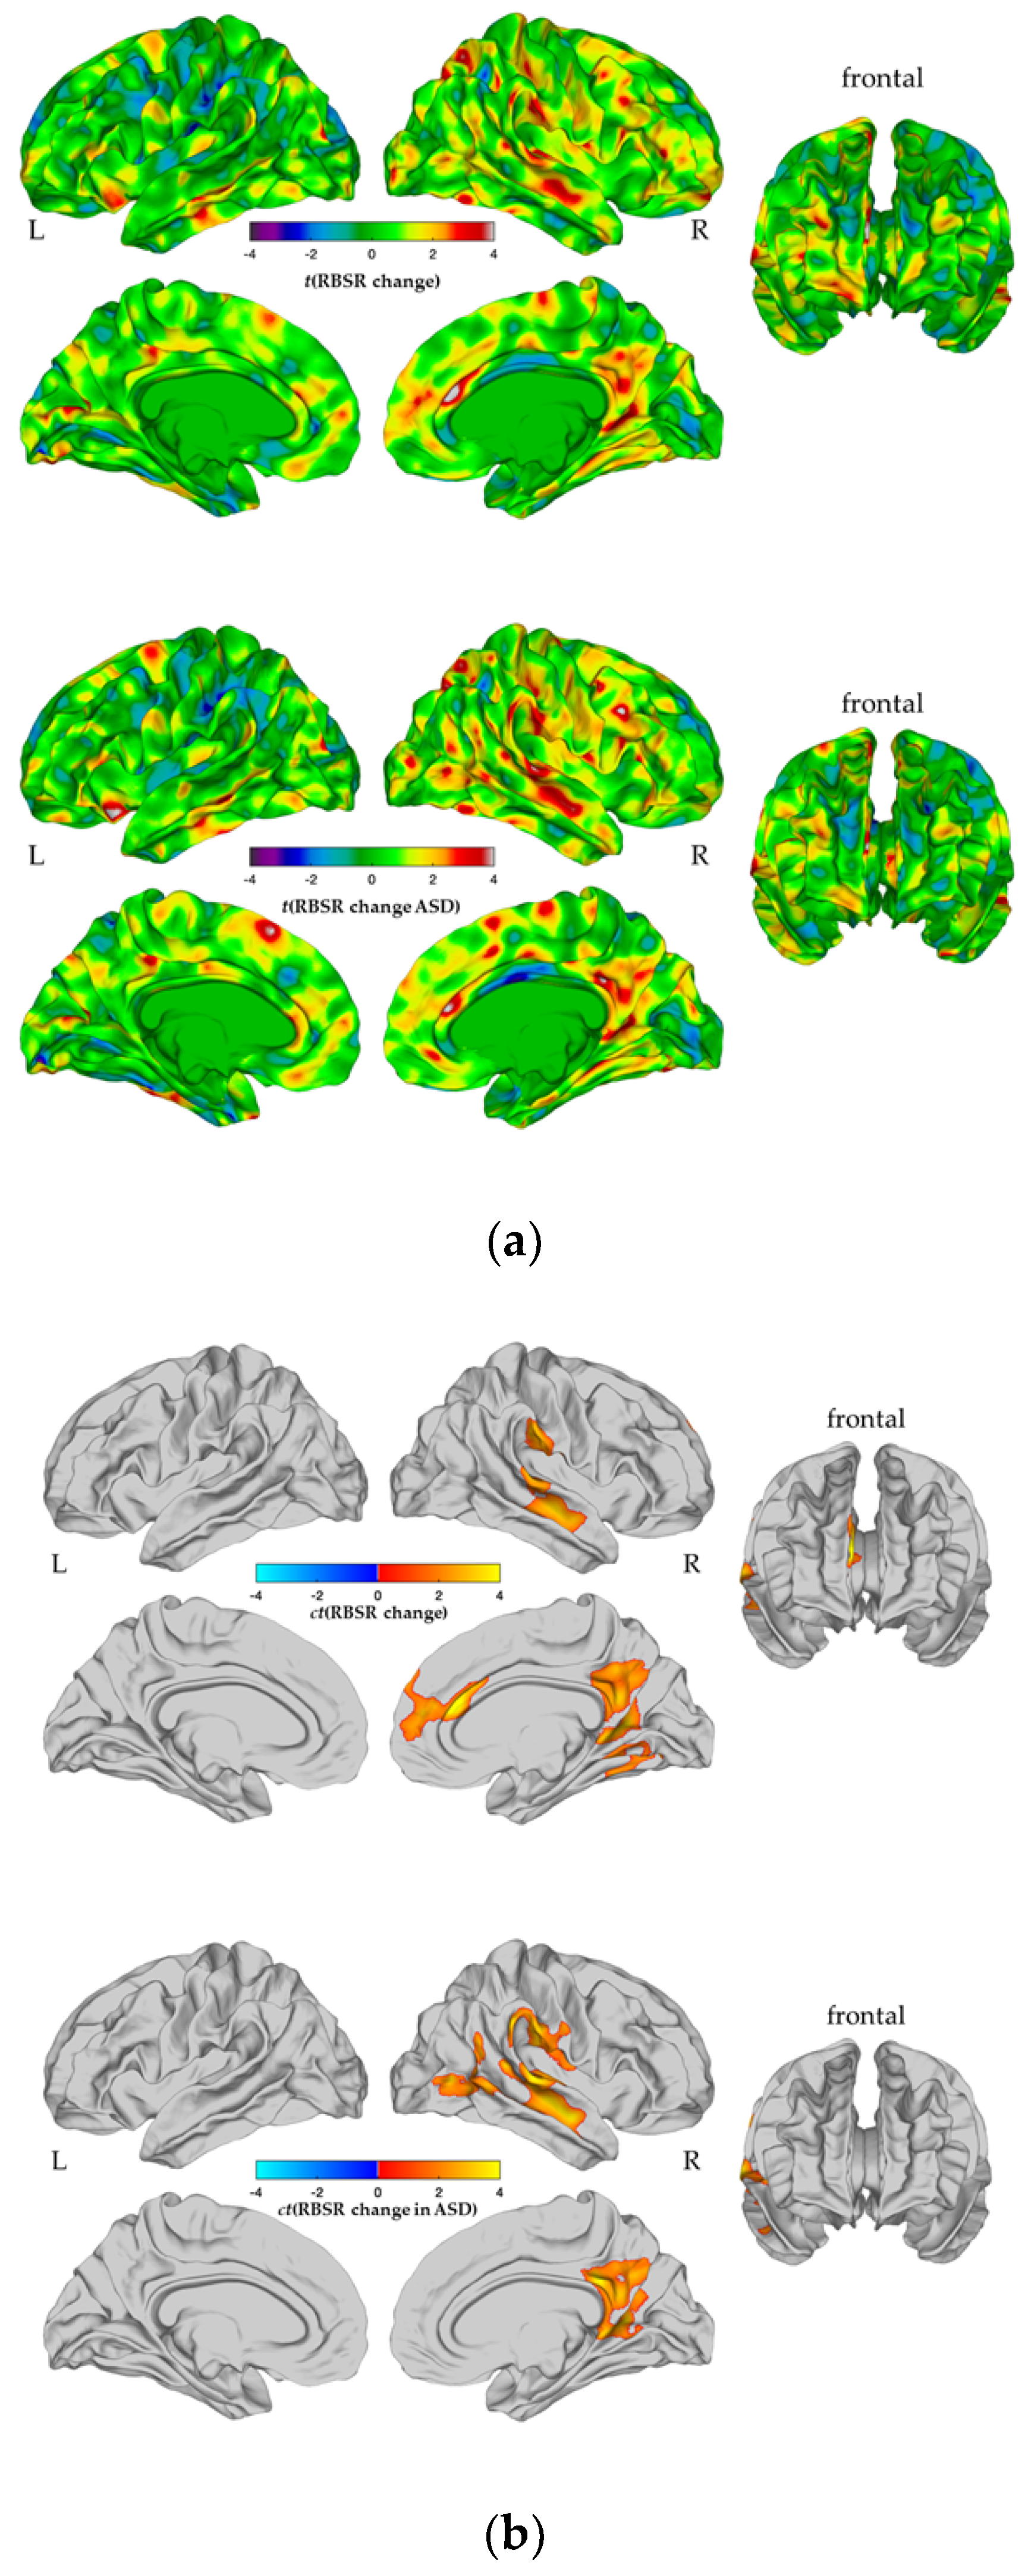
3.2. Between-Group Differences in CTspc
3.3. Brain–Behavioural Correlations
3.4. Association between a Longitudinal Change in CT and a Change in Repetitive Behaviors
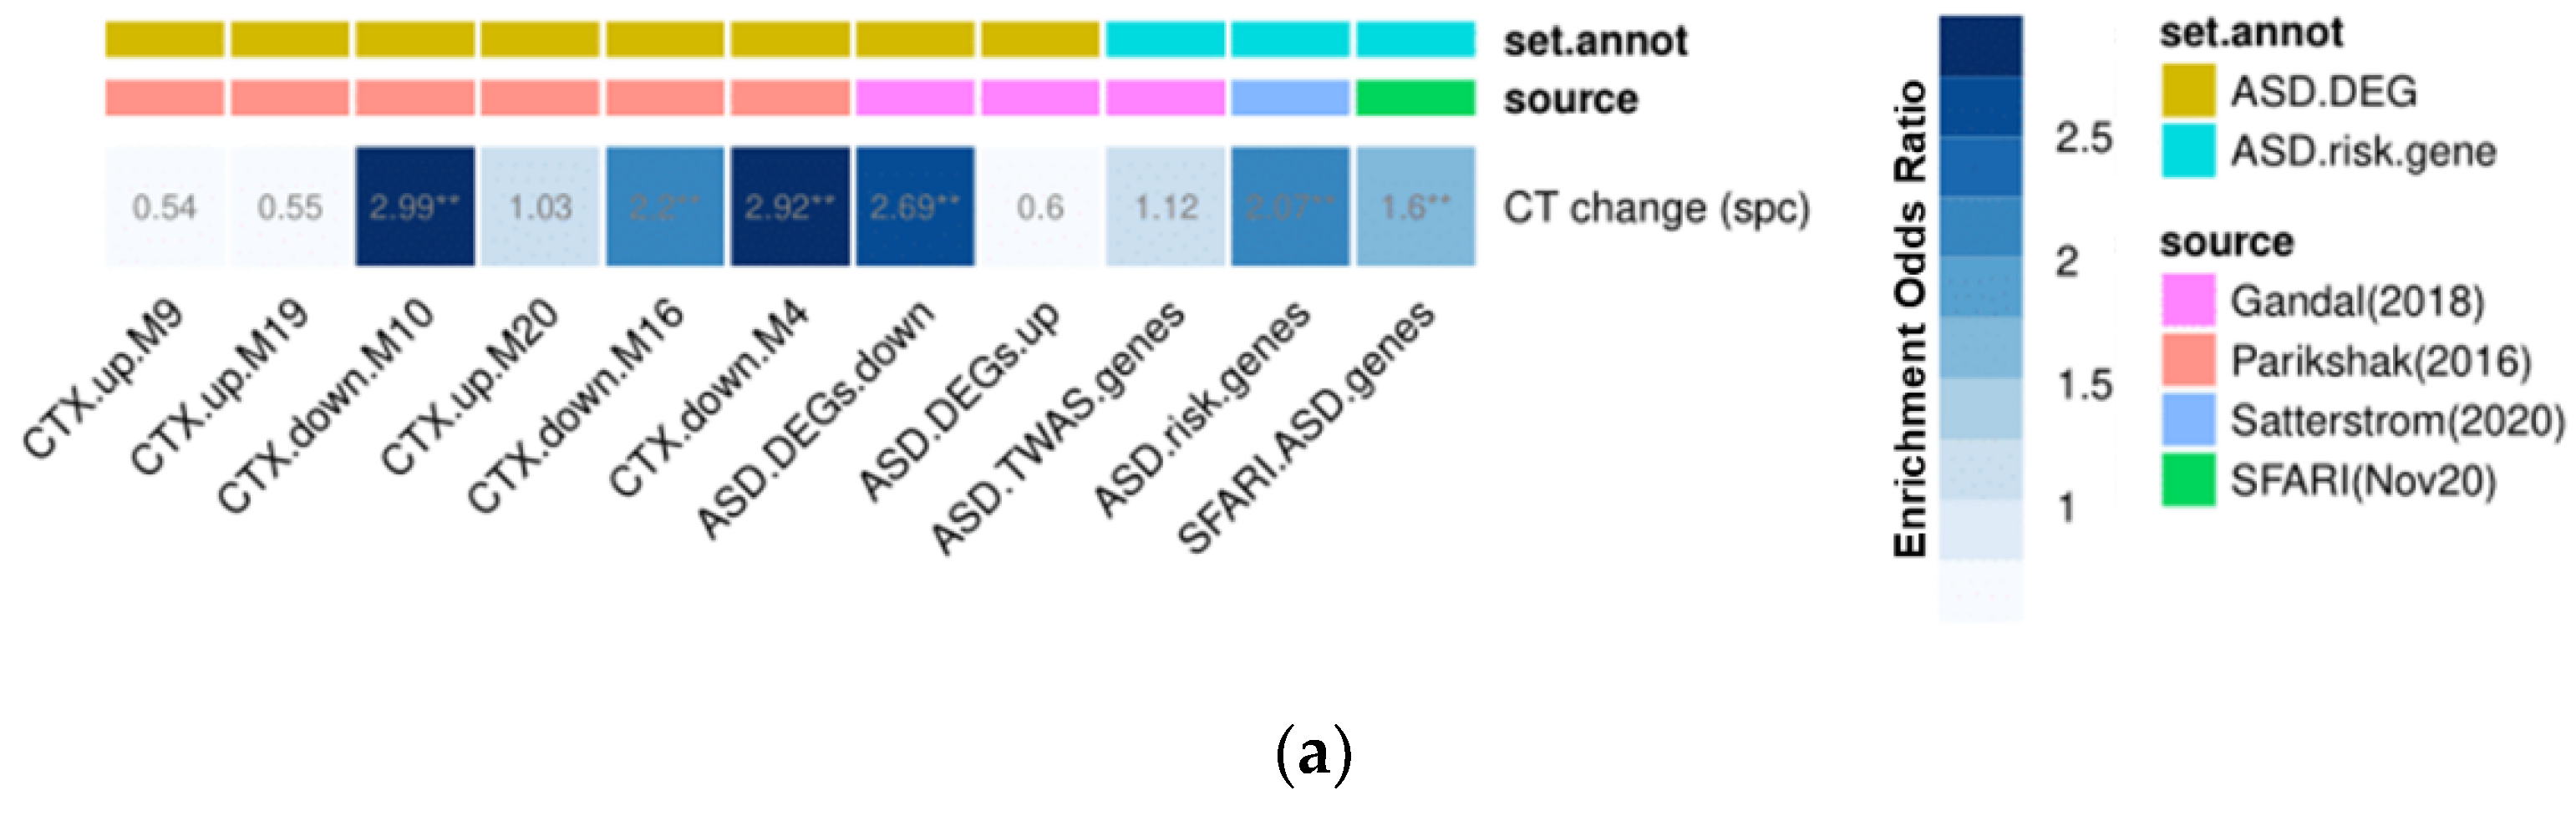
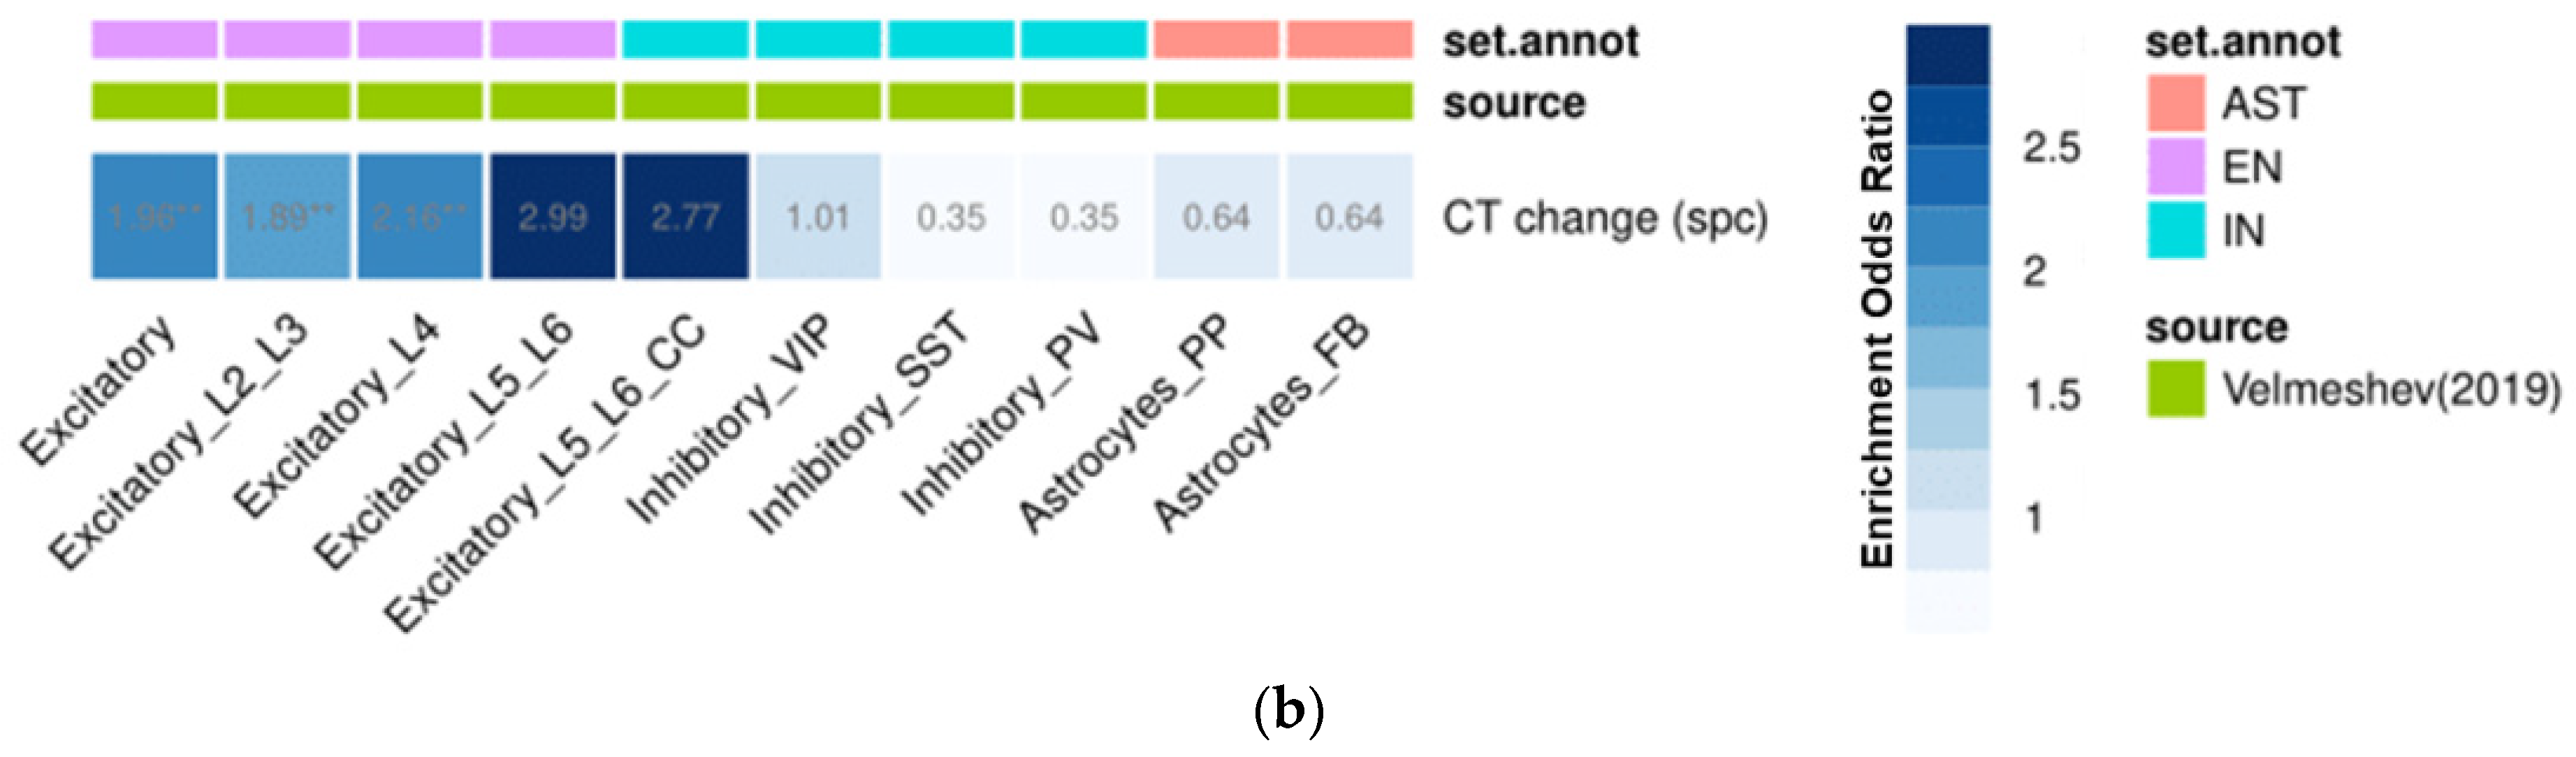
3.5. Gene Set Enrichment Analyses
4. Discussion
Supplementary Materials
Author Contributions
Funding
Institutional Review Board Statement
Informed Consent Statement
Data Availability Statement
Conflicts of Interest
References
- American Psychiatric Association. Diagnostic and Statistical Manual of Mental Disorders, 5th ed.; American Psychiatric Association: Arlington, VA, USA, 2013. [Google Scholar]
- Ecker, C. The neuroanatomy of autism spectrum disorder: An overview of structural neuroimaging findings and their translatability to the clinical setting. Autism 2016, 21, 18–28. [Google Scholar] [CrossRef]
- Veenstra-VanderWeele, J.; Cook, E.H. Molecular genetics of autism spectrum disorder. Mol. Psychiatry 2004, 9, 819–832. [Google Scholar] [CrossRef]
- Courchesne, E.; Karns, C.M.; Davis, H.R.; Ziccardi, R.; Carper, R.A.; Tigue, Z.D.; Chisum, H.J.; Moses, P.; Pierce, K.; Lord, C.; et al. Unusual brain growth patterns in early life in patients with autistic disorder: An MRI study. Neurology 2001, 57, 245–254. [Google Scholar] [CrossRef] [PubMed]
- Zielinski, B.A.; Prigge, M.B.D.; Nielsen, J.; Froehlich, A.L.; Abildskov, T.J.; Anderson, J.; Fletcher, P.T.; Zygmunt, K.M.; Travers, B.G.; Lange, N.; et al. Longitudinal changes in cortical thickness in autism and typical development. Brain 2014, 137, 1799–1812. [Google Scholar] [CrossRef] [Green Version]
- Zabihi, M.; Oldehinkel, M.; Wolfers, T.; Frouin, V.; Goyard, D.; Loth, E.; Charman, T.; Tillmann, J.; Banaschewski, T.; Dumas, G.; et al. Dissecting the heterogeneous cortical anatomy of autism spectrum disorder using normative models. Biol. Psychiatry Cogn. Neurosci. Neuroimaging 2019, 4, 567–578. [Google Scholar] [CrossRef] [PubMed]
- Betancur, C. Etiological heterogeneity in autism spectrum disorders: More than 100 genetic and genomic disorders and still counting. Brain Res. 2011, 1380, 42–77. [Google Scholar] [CrossRef] [PubMed] [Green Version]
- Amaral, D.G.; Schumann, C.M.; Nordahl, C.W. Neuroanatomy of autism. Trends Neurosci. 2008, 31, 137–145. [Google Scholar] [CrossRef] [PubMed]
- Ecker, C.; Andrews, D.; Dell’Acqua, F.; Daly, E.; Murphy, C.M.; Catani, M.; de Schotten, M.T.; Baron-Cohen, S.; Lai, M.-C.; Lombardo, M.; et al. Relationship between cortical gyrification, white matter connectivity, and autism spectrum disorder. Cereb. Cortex 2016, 26, 3297–3309. [Google Scholar] [CrossRef] [Green Version]
- Ecker, C.; Ginestet, C.; Feng, Y.; Johnston, P.; Lombardo, M.; Lai, M.-C.; Suckling, J.; Palaniyappan, L.; Daly, E.; Murphy, C.M.; et al. Brain surface anatomy in adults with autism: The relationship between surface area, cortical thickness, and autistic symptoms. JAMA Psychiatry 2013, 70, 59–70. [Google Scholar] [CrossRef] [Green Version]
- Wallace, G.L.; Dankner, N.; Kenworthy, L.; Giedd, J.N.; Martin, A. Age-related temporal and parietal cortical thinning in autism spectrum disorders. Brain 2010, 133, 3745–3754. [Google Scholar] [CrossRef]
- Fischl, B.; Dale, A.M. Measuring the thickness of the human cerebral cortex from magnetic resonance images. Proc. Natl. Acad. Sci. USA 2000, 97, 11050–11055. [Google Scholar] [CrossRef] [PubMed] [Green Version]
- Hardan, A.Y.; Libove, R.A.; Keshavan, M.S.; Melhem, N.M.; Minshew, N.J. A Preliminary longitudinal magnetic resonance imaging study of brain volume and cortical thickness in autism. Biol. Psychiatry 2009, 66, 320–326. [Google Scholar] [CrossRef] [PubMed] [Green Version]
- Wallace, G.L.; Eisenberg, I.W.; Robustelli, B.; Dankner, N.; Kenworthy, L.; Giedd, J.; Martin, A. Longitudinal cortical development during adolescence and young adulthood in autism spectrum disorder: Increased cortical thinning but comparable surface area changes. J. Am. Acad. Child Adolesc. Psychiatry 2015, 54, 464–469. [Google Scholar] [CrossRef] [PubMed] [Green Version]
- Nunes, A.S.; Vakorin, V.A.; Kozhemiako, N.; Peatfield, N.; Ribary, U.; Doesburg, S.M. Atypical age-related changes in cortical thickness in autism spectrum disorder. Sci. Rep. 2020, 10, 1–15. [Google Scholar] [CrossRef]
- Blakemore, S.-J. The social brain in adolescence. Nat. Rev. Neurosci. 2008, 9, 267–277. [Google Scholar] [CrossRef]
- Rojas, D.C.; Peterson, E.; Winterrowd, E.; Reite, M.L.; Rogers, S.J.; Tregellas, J.R. Regional gray matter volumetric changes in autism associated with social and repetitive behavior symptoms. BMC Psychiatry 2006, 6, 56. [Google Scholar] [CrossRef] [Green Version]
- Wolff, J.J.; Hazlett, H.C.; Lightbody, A.A.; Reiss, A.L.; Piven, J. Repetitive and self-injurious behaviors: Associations with caudate volume in autism and fragile X syndrome. J. Neurodev. Disord. 2013, 5, 12. [Google Scholar] [CrossRef] [Green Version]
- Tekin, S.; Cummings, J.L. Frontal–subcortical neuronal circuits and clinical neuropsychiatry. J. Psychosom. Res. 2002, 53, 647–654. [Google Scholar] [CrossRef]
- Lam, K.S.L.; Aman, M.G. The Repetitive Behavior Scale-Revised: Independent Validation in Individuals with Autism Spectrum Disorders. J. Autism Dev. Disord. 2007, 37, 855–866. [Google Scholar] [CrossRef]
- Kästel, I.S.; Vllasaliu, L.; Wellnitz, S.; Cholemkery, H.; Freitag, C.M.; Bast, N. Repetitive behavior in children and adolescents: Psychometric properties of the German version of the repetitive behavior scale-revised. J. Autism Dev. Disord. 2021, 51, 1224–1237. [Google Scholar] [CrossRef] [PubMed]
- Boyd, B.A.; Baranek, G.; Sideris, J.; Poe, M.D.; Watson, L.R.; Patten, E.; Miller, H. Sensory features and repetitive behaviors in children with autism and developmental delays. Autism Res. 2010, 3, 78–87. [Google Scholar] [CrossRef]
- Uljarević, M.; Baranek, G.; Vivanti, G.; Hedley, D.; Hudry, K.; Lane, A. Heterogeneity of sensory features in autism spectrum disorder: Challenges and perspectives for future research. Autism Res. 2017, 10, 703–710. [Google Scholar] [CrossRef]
- Courchesne, E. Abnormal early brain development in autism. Mol. Psychiatry 2002, 7, S21–S23. [Google Scholar] [CrossRef] [Green Version]
- Giedd, J.N.; Blumenthal, J.; Jeffries, N.O.; Castellanos, F.; Liu, H.; Zijdenbos, A.; Paus, T.; Evans, A.C.; Rapoport, J.L. Brain development during childhood and adolescence: A longitudinal MRI study. Nat. Neurosci. 1999, 2, 861–863. [Google Scholar] [CrossRef]
- Khundrakpam, B.S.; Lewis, J.D.; Kostopoulos, P.; Carbonell, F.; Evans, A.C. Cortical thickness abnormalities in autism spectrum disorders through late childhood, adolescence, and adulthood: A large-scale MRI study. Cereb. Cortex 2017, 27, 1721–1731. [Google Scholar] [CrossRef] [PubMed]
- Lange, N.; Travers, B.G.; Bigler, E.D.; Prigge, M.B.; Froehlich, A.L.; Nielsen, J.; Cariello, A.N.; Zielinski, B.A.; Anderson, J.; Fletcher, P.T.; et al. Longitudinal volumetric brain changes in autism spectrum disorder ages 6-35 years. Autism Res. 2015, 8, 82–93. [Google Scholar] [CrossRef] [PubMed]
- Hawrylycz, M.J.; Lein, E.S.; Guillozet-Bongaarts, A.L.; Shen, E.H.; Ng, L.; Miller, J.A.; Van De Lagemaat, L.N.; Smith, K.A.; Ebbert, A.; Riley, Z.L.; et al. An anatomically comprehensive atlas of the adult human brain transcriptome. Nature 2012, 489, 391–399. [Google Scholar] [CrossRef]
- Bölte, S.; Rutter, M.; Le Couteur, A.; Lord, C. ADI-R-Diagnostisches Interview für Autismus-Revidiert: Manual; Hans Huber: Bern, Switzerland, 2006. [Google Scholar]
- Lord, C.; Rutter, M.; Le Couteur, A. Autism Diagnostic Interview-Revised: A revised version of a diagnostic interview for caregivers of individuals with possible pervasive developmental disorders. J. Autism Dev. Disord. 1994, 24, 659–685. [Google Scholar] [CrossRef]
- Luyster, R.; Gotham, K.; Guthrie, W.; Coffing, M.; Petrak, R.; Pierce, K.; Bishop, S.; Esler, A.; Hus, V.; Oti, R.; et al. The Autism Diagnostic Observation Schedule—Toddler Module: A New Module of a Standardized Diagnostic Measure for Autism Spectrum Disorders. J. Autism Dev. Disord. 2009, 39, 1305–1320. [Google Scholar] [CrossRef] [PubMed] [Green Version]
- Kamp-Becker, I.; Langmann, A.; Stehr, T.; Custodis, K.; Poustka, L.; Becker, K. Zur Validität der deutschen Fassung der ADOS-2 unter Berücksichtigung von Geschlechtseffekten. Z. Kinder Jugendpsychiatrie Psychother. 2017, 45, 193–207. [Google Scholar] [CrossRef]
- Bölte, S.; Poustka, F. Diagnostische Beobachtungsskala für Autistische Störungen (ADOS): Erste Ergebnisse zur Zuverlässigkeit und Gültigkeit. Z. Kinder Jugendpsychiatrie Psychother. 2004, 32, 45–50. [Google Scholar] [CrossRef]
- Reuter, M.; Schmansky, N.J.; Rosas, H.D.; Fischl, B. Within-subject template estimation for unbiased longitudinal image analysis. NeuroImage 2012, 61, 1402–1418. [Google Scholar] [CrossRef] [Green Version]
- Fischl, B.; Liu, A.; Dale, A.M. Automated manifold surgery: Constructing geometrically accurate and topologically correct models of the human cerebral cortex. IEEE Trans. Med. Imaging 2001, 20, 70–80. [Google Scholar] [CrossRef] [PubMed] [Green Version]
- Fischl, B.; Sereno, M.I.; Dale, A. Cortical Surface-Based Analysis: II: Inflation, Flattening, and a Surface-Based Coordinate System. NeuroImage 1999, 9, 195–207. [Google Scholar] [CrossRef] [Green Version]
- Reuter, M.; Fischl, B. Avoiding asymmetry-induced bias in longitudinal image processing. NeuroImage 2011, 57, 19–21. [Google Scholar] [CrossRef] [PubMed] [Green Version]
- Reuter, M.; Rosas, H.D.; Fischl, B. Highly accurate inverse consistent registration: A robust approach. NeuroImage 2010, 53, 1181–1196. [Google Scholar] [CrossRef] [PubMed] [Green Version]
- Van Buuren, S.; Groothuis-Oudshoorn, K. Mice: Multivariate Imputation by Chained Equations in R. J. Stat. Softw. 2011, 45, 1–67. [Google Scholar] [CrossRef] [Green Version]
- Worsley, K.J.; Andermann, M.; Koulis, T.; MacDonald, M.; Evans, A.C. Detecting changes in nonisotropic images. Hum. Brain Mapp. 1999, 8, 98–101. [Google Scholar] [CrossRef]
- Gorgolewski, K.J.; Fox, A.S.; Chang, L.; Schäfer, A.; Arélin, K.; Burmann, I.; Sacher, J.; Margulies, D.S. Tight fitting genes: Finding relations between statistical maps and gene expression patterns. F1000Research 2014, 5. [Google Scholar] [CrossRef]
- Parikshak, N.; Swarup, V.; Belgard, T.; Irimia, M.; Ramaswami, G.; Gandal, M.; Hartl, C.; Leppä, V.; Ubieta, L.D.L.T.; Huang, J.; et al. Genome-wide changes in lncRNA, splicing, and regional gene expression patterns in autism. Nature 2016, 540, 423–427. [Google Scholar] [CrossRef]
- Gandal, M.J.; Haney, J.R.; Parikshak, N.N.; Leppa, V.; Ramaswami, G.; Hartl, C.; Schork, A.J.; Appadurai, V.; Buil, A.; Werge, T.M.; et al. Shared molecular neuropathology across major psychiatric disorders parallels polygenic overlap. Science 2018, 359, 693–697. [Google Scholar] [CrossRef] [Green Version]
- Satterstrom, F.K.; Kosmicki, J.A.; Wang, J.; Breen, M.S.; De Rubeis, S.; An, J.-Y.; Peng, M.; Collins, R.; Grove, J.; Klei, L.; et al. Large-Scale Exome Sequencing Study Implicates Both Developmental and Functional Changes in the Neurobiology of Autism. Cell 2020, 180, 568–584. [Google Scholar] [CrossRef] [PubMed]
- Velmeshev, D.; Schirmer, L.; Jung, D.; Haeussler, M.; Perez, Y.; Mayer, S.; Bhaduri, A.; Goyal, N.; Rowitch, D.H.; Kriegstein, A.R. Single-cell genomics identifies cell type–specific molecular changes in autism. Science 2019, 364, 685–689. [Google Scholar] [CrossRef] [PubMed]
- Tao, Y.; Gao, H.; Ackerman, B.; Guo, W.; Saffen, D.; Shugart, Y.Y. Evidence for contribution of common genetic variants within chromosome 8p21.2-8p21.1 to restricted and repetitive behaviors in autism spectrum disorders. BMC Genomics 2016, 17, 163. [Google Scholar] [CrossRef] [PubMed] [Green Version]
- Grove, J.; Ripke, S.; Als, T.D.; Mattheisen, M.; Walters, R.K.; Won, H.; Pallesen, J.; Agerbo, E.; Andreassen, O.A.; Anney, R.; et al. Identification of common genetic risk variants for autism spectrum disorder. Nat. Genet. 2019, 51, 431–444. [Google Scholar] [CrossRef] [PubMed] [Green Version]
- Voineagu, I.; Wang, X.; Johnston, P.; Lowe, J.K.; Tian, Y.; Horvath, S.; Mill, J.; Cantor, R.M.; Blencowe, B.J.; Geschwind, D.H. Transcriptomic analysis of autistic brain reveals convergent molecular pathology. Nature 2011, 474, 380–384. [Google Scholar] [CrossRef]
- The Gene Ontology Consortium. The Gene Ontology resource: Enriching a gold mine. Nucleic Acids Res. 2021, 49, D325–D334. [Google Scholar] [CrossRef]
- Ashburner, M.; Ball, C.A.; Blake, J.A.; Botstein, D.; Butler, H.; Cherry, J.M.; Davis, A.P.; Dolinski, K.; Dwight, S.S.; Eppig, J.T.; et al. Gene ontology: Tool for the unification of biology. The Gene Ontology Consortium. Nat. Genet. 2000, 25, 25–29. [Google Scholar] [CrossRef] [Green Version]
- Braden, B.B.; Riecken, C. Thinning faster? Age-related cortical thickness differences in adults with autism spectrum disorder. Res. Autism Spectr. Disord. 2019, 64, 31–38. [Google Scholar] [CrossRef] [Green Version]
- Mann, C.; Bletsch, A.; Andrews, D.; Daly, E.; Murphy, C.; Murphy, D.; Ecker, C. The effect of age on vertex-based measures of the grey-white matter tissue contrast in autism spectrum disorder. Mol. Autism 2018, 9, 49. [Google Scholar] [CrossRef] [Green Version]
- Raznahan, A.; Shaw, P.; LaLonde, F.; Stockman, M.; Wallace, G.; Greenstein, D.; Clasen, L.; Gogtay, N.; Giedd, J.N. How Does Your Cortex Grow? J. Neurosci. 2011, 31, 7174–7177. [Google Scholar] [CrossRef] [PubMed]
- Huttenlocher, P.R.; Dabholkar, A.S. Regional differences in synaptogenesis in human cerebral cortex. J. Comp. Neurol. 1997, 387, 167–178. [Google Scholar] [CrossRef]
- Huttenlocher, P.R. Morphometric study of human cerebral cortex development. Neuropsychology 1990, 28, 517–527. [Google Scholar] [CrossRef]
- Gogtay, N.; Giedd, J.N.; Lusk, L.; Hayashi, K.M.; Greenstein, D.; Vaituzis, A.C.; Nugent, T.F.; Herman, D.H.; Clasen, L.S.; Toga, A.W.; et al. Dynamic mapping of human cortical development during childhood through early adulthood. Proc. Natl. Acad. Sci. USA 2004, 101, 8174–8179. [Google Scholar] [CrossRef] [PubMed] [Green Version]
- Raznahan, A.; Toro, R.; Daly, E.; Robertson, D.; Murphy, C.; Deeley, Q.; Bolton, P.F.; Paus, T.; Murphy, D.G.M. Cortical anatomy in autism spectrum disorder: An in vivo MRI study on the effect of age. Cereb. Cortex 2010, 20, 1332–1340. [Google Scholar] [CrossRef] [Green Version]
- Pua, E.P.K.; Ball, G.; Adamson, C.; Bowden, S.; Seal, M. Quantifying individual differences in brain morphometry underlying symptom severity in Autism Spectrum Disorders. Sci. Rep. 2019, 9, 9898. [Google Scholar] [CrossRef]
- Hong, S.-J.; Hyung, B.; Paquola, C.; Bernhardt, B.C. The Superficial White Matter in Autism and Its Role in Connectivity Anomalies and Symptom Severity. Cereb. Cortex 2019, 29, 4415–4425. [Google Scholar] [CrossRef]
- Bishop, S.L.; Hus, V.; Duncan, A.; Huerta, M.; Gotham, K.; Pickles, A.; Kreiger, A.; Buja, A.; Lund, S.; Lord, C. Subcategories of Restricted and Repetitive Behaviors in Children with Autism Spectrum Disorders. J. Autism Dev. Disord. 2012, 43, 1287–1297. [Google Scholar] [CrossRef] [Green Version]
- Bishop, S.L.; Richler, J.; Lord, C. Association between restricted and repetitive behaviors and nonverbal IQ in children with autism spectrum disorders. Child Neuropsychol. 2006, 12, 247–267. [Google Scholar] [CrossRef]
- Richler, J.; Huerta, M.; Bishop, S.L.; Lord, C. Developmental trajectories of restricted and repetitive behaviors and interests in children with autism spectrum disorders. Dev. Psychopathol. 2010, 22, 55–69. [Google Scholar] [CrossRef] [Green Version]
- Esbensen, A.J.; Seltzer, M.M.; Lam, K.S.L.; Bodfish, J.W. Age-related differences in restricted repetitive behaviors in autism spectrum disorders. J. Autism Dev. Disord. 2009, 39, 57–66. [Google Scholar] [CrossRef] [Green Version]
- Wolff, J.J.; Botteron, K.N.; Dager, S.R.; Elison, J.T.; Estes, A.M.; Gu, H.; Hazlett, H.C.; Pandey, J.; Paterson, S.J.; Schultz, R.T.; et al. Longitudinal patterns of repetitive behavior in toddlers with autism. J. Child Psychol. Psychiatry 2014, 55, 945–953. [Google Scholar] [CrossRef] [Green Version]
- Akkermans, S.E.; Rheinheimer, N.; Bruchhage, M.M.; Durston, S.; Brandeis, D.; Banaschewski, T.; Boecker-Schlier, R.; Wolf, I.; Williams, S.C.; Buitelaar, J.K.; et al. Frontostriatal functional connectivity correlates with repetitive behaviour across autism spectrum disorder and obsessive–compulsive disorder. Psychol. Med. 2019, 49, 2247–2255. [Google Scholar] [CrossRef]
- Romero-Garcia, R.; Warrier, V.; Bullmore, E.T.; Baron-Cohen, S.; Bethlehem, R.A.I. Synaptic and transcriptionally downregulated genes are associated with cortical thickness differences in autism. Mol. Psychiatry 2019, 24, 1053–1064. [Google Scholar] [CrossRef] [PubMed] [Green Version]
- Ecker, C.; Pretzsch, C.M.; Bletsch, A.; Mann, C.; Schaefer, T.; Ambrosino, S.; Tillmann, J.; Yousaf, A.; Chiocchetti, A.; Lombardo, M.V.; et al. Interindividual differences in cortical thickness and their genomic underpinnings in autism spectrum disorder. Am. J. Psychiatry 2021. [Google Scholar] [CrossRef] [PubMed]
- Hansel, C. Deregulation of synaptic plasticity in autism. Neurosci. Lett. 2019, 688, 58–61. [Google Scholar] [CrossRef] [PubMed]
- Sohal, V.S.; Rubenstein, J.L.R. Excitation-inhibition balance as a framework for investigating mechanisms in neuropsychiatric disorders. Mol. Psychiatry 2019, 24, 1248–1257. [Google Scholar] [CrossRef]
- Lewis, M.; Kim, S.-J. The pathophysiology of restricted repetitive behavior. J. Neurodev. Disord. 2009, 1, 114–132. [Google Scholar] [CrossRef] [Green Version]
- Shafritz, K.; Dichter, G.; Baranek, G.; Belger, A. The Neural Circuitry Mediating Shifts in Behavioral Response and Cognitive Set in Autism. Biol. Psychiatry 2008, 63, 974–980. [Google Scholar] [CrossRef] [Green Version]
- Thakkar, K.N.; Polli, F.E.; Joseph, R.M.; Tuch, D.S.; Hadjikhani, N.; Barton, J.J.; Manoach, D.S. Response monitoring, repetitive behaviour and anterior cingulate abnormalities in autism spectrum disorders (ASD). Brain 2008, 131 Pt 9, 2464–2478. [Google Scholar] [CrossRef] [Green Version]


| ASD (n = 33) | TD Controls (n = 37) | Group Comparison | |||
|---|---|---|---|---|---|
| t | x2 | p | |||
| Age [years] | |||||
| T1 | 14.48 ± 2.51 | 13.76 ± 2.36 | 1.25 | 0.22 | |
| T2 | 16.61 ± 2.47 | 15.89 ± 2.45 | 1.21 | 0.23 | |
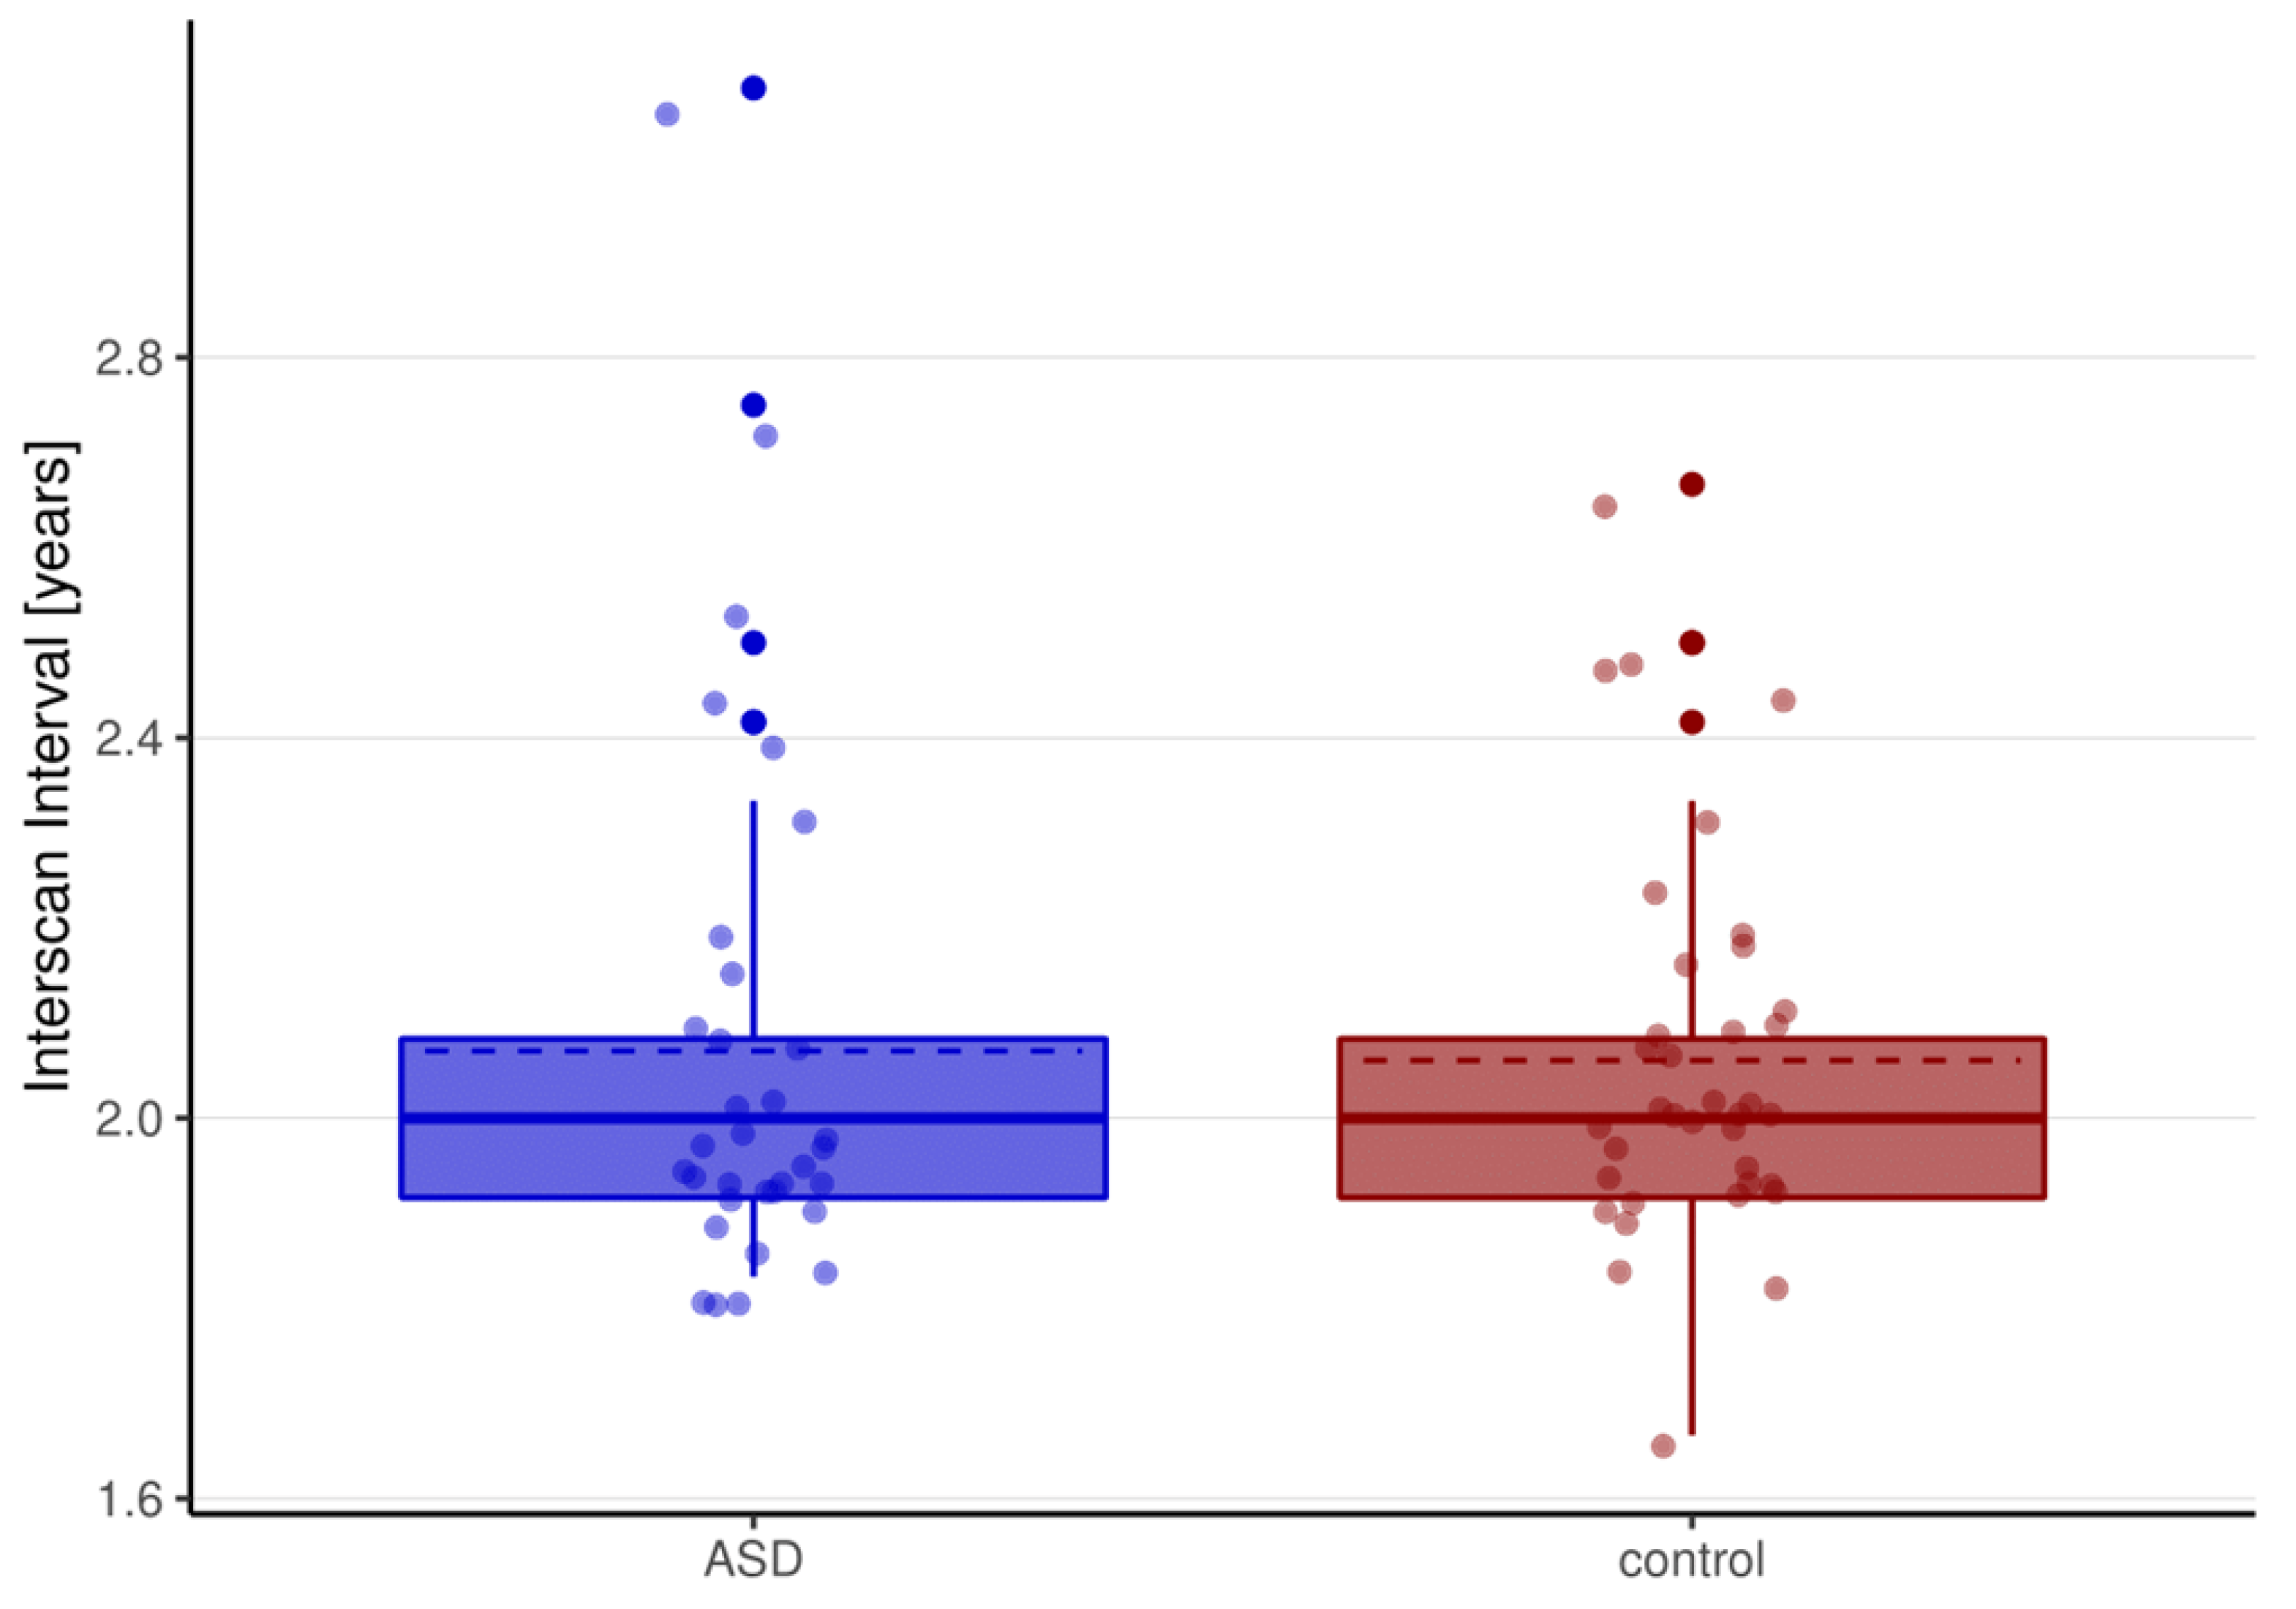
| Interscan-Interval (ISI) [years] | 2.07 ± 0.28 | 2.06 ± 0.20 | 0.17 | 0.87 | |
| Sex (male/female) | 27/6 | 30/7 | <0.001 | 1.00 | |
| Full-scale IQ (FSIQ) | 101.38 ± 13.19 | 107.07 ± 11.52 | −1.91 | 0.06 | |
| Handedness (right/left) | 29/4 | 34/3 | 0.025 | 0.87 | |
| ADI-R Social Interaction | 17.06 ± 4.96 | - | |||
| ADI-R Communication | 13.06 ± 4.12 | - | |||
| ADI-R Repetitive Behaviors | 4.76 ± 2.50 | - | |||
| ADOS CSS | |||||
| T1 | 5.79 ± 2.71 | - | |||
| T2 1 | 5.95 ± 2.22 | - | |||
| RBS-R total | |||||
| T1 | 25.18 ± 18.80 | 2.11 ± 3.67 | 6.9 | <0.001 *** | |
| T2 | 22.48 ± 17.21 | 2.30 ± 4.07 | 6.58 | <0.001 *** | |
| ∆(T2-T1) | −2.70 ± 16.00 | +0.19 ± 3.01 | −1.02 | 0.3148 | |
| RBS-R persistent | |||||
| T1 | 16.88 ± 11.26 | 1.59 ± 2.85 | 7.59 | <0.001 *** | |
| T2 | 14.97 ± 10.39 | 1.81 ± 03.23 | 6.98 | <0.001 *** | |
| ∆(T2-T1) | 1.91 ± 9.43 | −0.22 ± 2.27 | 1.26 | 0.22 | |
| RBS-R stereotyped | |||||
| T1 | 3.06 ± 3.18 | 0.30 ± 0.62 | 4.91 | <0.001 *** | |
| T2 | 2.70 ± 3.66 | 0.08 ± 0.28 | 4.09 | <0.001 *** | |
| ∆(T2-T1) | 0.36 ± 3.63 | 0.22 ± 0.67 | 0.23 | 0.82 | |
| RBS-R self-injurious | |||||
| T1 | 0.88 ± 2.16 | 0.05 ± 0.23 | 2.18 | <0.001 *** | |
| T2 | 1.06 ± 1.84 | 0.03 ± 0.16 | 3.22 | <0.001 *** | |
| ∆(T2-T1) | −0.18 ± 2.51 | 0.03 ± 0.29 | −0.48 | 0.64 | |
| RBS-R compulsive | |||||
| T1 | 4.36 ± 5.17 | 0.16 ± 0.60 | 4.64 | <0.001 *** | |
| T2 | 3.76 ± 4.57 | 0.38 ± 1.14 | 4.14 | <0.001 *** | |
| ∆(T2-T1) | 0.61 ± 3.17 | −0.22 ± 0.71 | 1.46 | 0.15 | |
| Total Brain Volume [l] | |||||
| T1 | 1.18 ± 1.00 | 1.24 ± 0.94 | −2.60 | <0.05 * | |
| T2 | 1.17 ± 0.10 | 1.23 ± 0.10 | −2.49 | <0.05 * | |
| ∆(T2-T1) | −0.01 ± 0.02 | −0.01 ± 0.02 | −0.20 | 0.8445 | |
| Total Surface Area [m2] | |||||
| T1 | 0.18 ± 0.015 | 0.19 ± 0.02 | −2.33 | <0.05 * | |
| T2 | 0.18 ± 0.16 | 0.19 ± 0.02 | −2.28 | <0.05 * | |
| ∆(T2-T1) | −0.02 ± 0.002 | −0.002 ± 0.002 | −0.16 | 0.877 | |
| Mean Cortical Thickness [mm] | |||||
| T1 | 2.75 ± 0.10 | 2.78 ± 0.08 | −1.15 | 0.2555 | |
| T2 | 2.68 ± 0.08 | 2.70 ± 0.08 | −0.81 | 0.4221 | |
| ∆(T2-T1) | −0.07 ± 0.05 | −0.08 ± 0.04 | 0.89 | 0.3759 | |
| Contrast | Cluster | Region Labels | Hemisphere | BA | Vertices | Talairach | tmax | pcluster | ||
|---|---|---|---|---|---|---|---|---|---|---|
| x | y | z | ||||||||
| ASD > Control | ||||||||||
| 1 | Superior frontal gyrus, medial orbital frontal cortex, rostral anterior cingulate cortex | R | 4, 6, 8, 10, 11, 24, 32, 33 | 2358 | 10 | 50 | 11 | 5.07 | 9.59 × 10⁻⁵ | |
| 2 | Lateral orbital frontal cortex, rostral middle frontal gyrus | R | 9–11, 45–47 | 1716 | 25 | 44 | −10 | 3.99 | 8.27 × 10⁻⁴ | |
| 3 | Superior frontal gyrus | L | 4, 6, 8, 10 | 1662 | −16 | 37 | 41 | 3.13 | 9.83 × 10-−4 | |
| 4 | Fusiform gyrus, parahippocampal gyrus, inferior temporal gyrus | L | 20, 28, 34–37 | 1374 | −23 | −24 | 16 | 2.94 | 4.83 × 10⁻³ | |
| 5 | Lateral orbital frontal cortex, rostral middle frontal gyrus, pars orbitalis | L | 6, 8–11, 45–47 | 966 | −22 | 43 | −12 | 3.32 | 1.87 × 10⁻² | |
| 6 | Middle temporal gyrus | L | 21 | 1318 | −48 | −13 | −14 | 3.01 | 2.18 × 10⁻² | |
| ASD < Control | ||||||||||
| 7 | Insula | L | 13 | 580 | −35 | −4 | −6 | −1.67 | 3.84 × 10⁻² | |
Publisher’s Note: MDPI stays neutral with regard to jurisdictional claims in published maps and institutional affiliations. |
© 2021 by the authors. Licensee MDPI, Basel, Switzerland. This article is an open access article distributed under the terms and conditions of the Creative Commons Attribution (CC BY) license (https://creativecommons.org/licenses/by/4.0/).
Share and Cite
Bieneck, V.; Bletsch, A.; Mann, C.; Schäfer, T.; Seelemeyer, H.; Herøy, N.; Zimmermann, J.; Pretzsch, C.M.; Hattingen, E.; Ecker, C. Longitudinal Changes in Cortical Thickness in Adolescents with Autism Spectrum Disorder and Their Association with Restricted and Repetitive Behaviors. Genes 2021, 12, 2024. https://0-doi-org.brum.beds.ac.uk/10.3390/genes12122024
Bieneck V, Bletsch A, Mann C, Schäfer T, Seelemeyer H, Herøy N, Zimmermann J, Pretzsch CM, Hattingen E, Ecker C. Longitudinal Changes in Cortical Thickness in Adolescents with Autism Spectrum Disorder and Their Association with Restricted and Repetitive Behaviors. Genes. 2021; 12(12):2024. https://0-doi-org.brum.beds.ac.uk/10.3390/genes12122024
Chicago/Turabian StyleBieneck, Valentina, Anke Bletsch, Caroline Mann, Tim Schäfer, Hanna Seelemeyer, Njål Herøy, Jennifer Zimmermann, Charlotte Marie Pretzsch, Elke Hattingen, and Christine Ecker. 2021. "Longitudinal Changes in Cortical Thickness in Adolescents with Autism Spectrum Disorder and Their Association with Restricted and Repetitive Behaviors" Genes 12, no. 12: 2024. https://0-doi-org.brum.beds.ac.uk/10.3390/genes12122024