1. Introduction
One of the most prevailing and highly deadly heterogeneous forms of brain tumors is glioblastoma multiforme (GBM) or grade-IV glioma [
1]. The diagnosis of GBM patients is very challenging, and the patient survival rate is 12–15 months even with combinational therapies [
2]. The low efficiency of all therapeutic methods including surgery, chemotherapy, and radiotherapy [
3] demands pointed to new therapeutic targets for GBM in recent years.
GBM is an extremely heterogeneous tumor at the pathological and cellular level [
4,
5]. Gene expression and cell proliferation levels also highly differ in GBM. Glioma stem cells (GSCs) take a central position regarding tumor formation of lower-grade gliomas and glioblastoma multiforme. GSCs have important characteristics including self-renewal ability, tumor initiation, progression ability, and resistance to GBM therapies. Several important roles of GSCs in GBM make GSCs new therapeutic targets [
6,
7]. As the neoplastic cells emerge as immune cells, cancer can be observable since the tumor cells have an extensive clonogenic latent sort called cancer stem cells. In the wet lab conditions, glioblastoma stem-like cells efficiently disseminate in the media after being insulated from newly resected human GBM [
8].
The metabolic relation between the glycolysis and pentose phosphate pathway has been discovered in GSCs [
9]. Neoplastic cells consume glycolysis energy for uncontrolled cell growth and further division. The study further demonstrated that FLK-1 carries a key position in the development of Vasculogenic Mimicry (VM) in glioblastoma multiforme. They reported the clinical characteristics of SOX2 and original outcomes that may offer fresh medical purposes for SOX2 as a prognostic biomarker.
Hence, a restructured knowledge of GBM is essential, and direct machinery is crucial for modified and curable therapies to increase patient survival rates. The multi-gene expression profiling of diseased samples was driven by high-throughput sequencing technology publicly available through the GEO database [
10]. Even though just a small fraction of these datasets have been taken and analyzed, additional aspects of the mechanism of rapid expansion and resistance to treatments of glioblastoma tumor should be highlighted. The gene expression microarray dataset GSE45117 [
9] is re-evaluated and employed to propose useful results for additional investigation in silico.
This study aims to suggest a treatment to handle them to block the rapid progress by associating clinical data with a molecular mechanism. Currently, there are still no permanent therapeutic alternatives available for GBM. Furthermore, patients who are diagnosed with glioblastoma tumors has very low survival rates. Screening of pathways and proteins involved in chemotherapeutic resistance identification use genomic and proteomic analyses [
11]. For instance, changes in the Interleukins protein family expression and related conditions in GBM progression and growth require extensive investigation [
12].
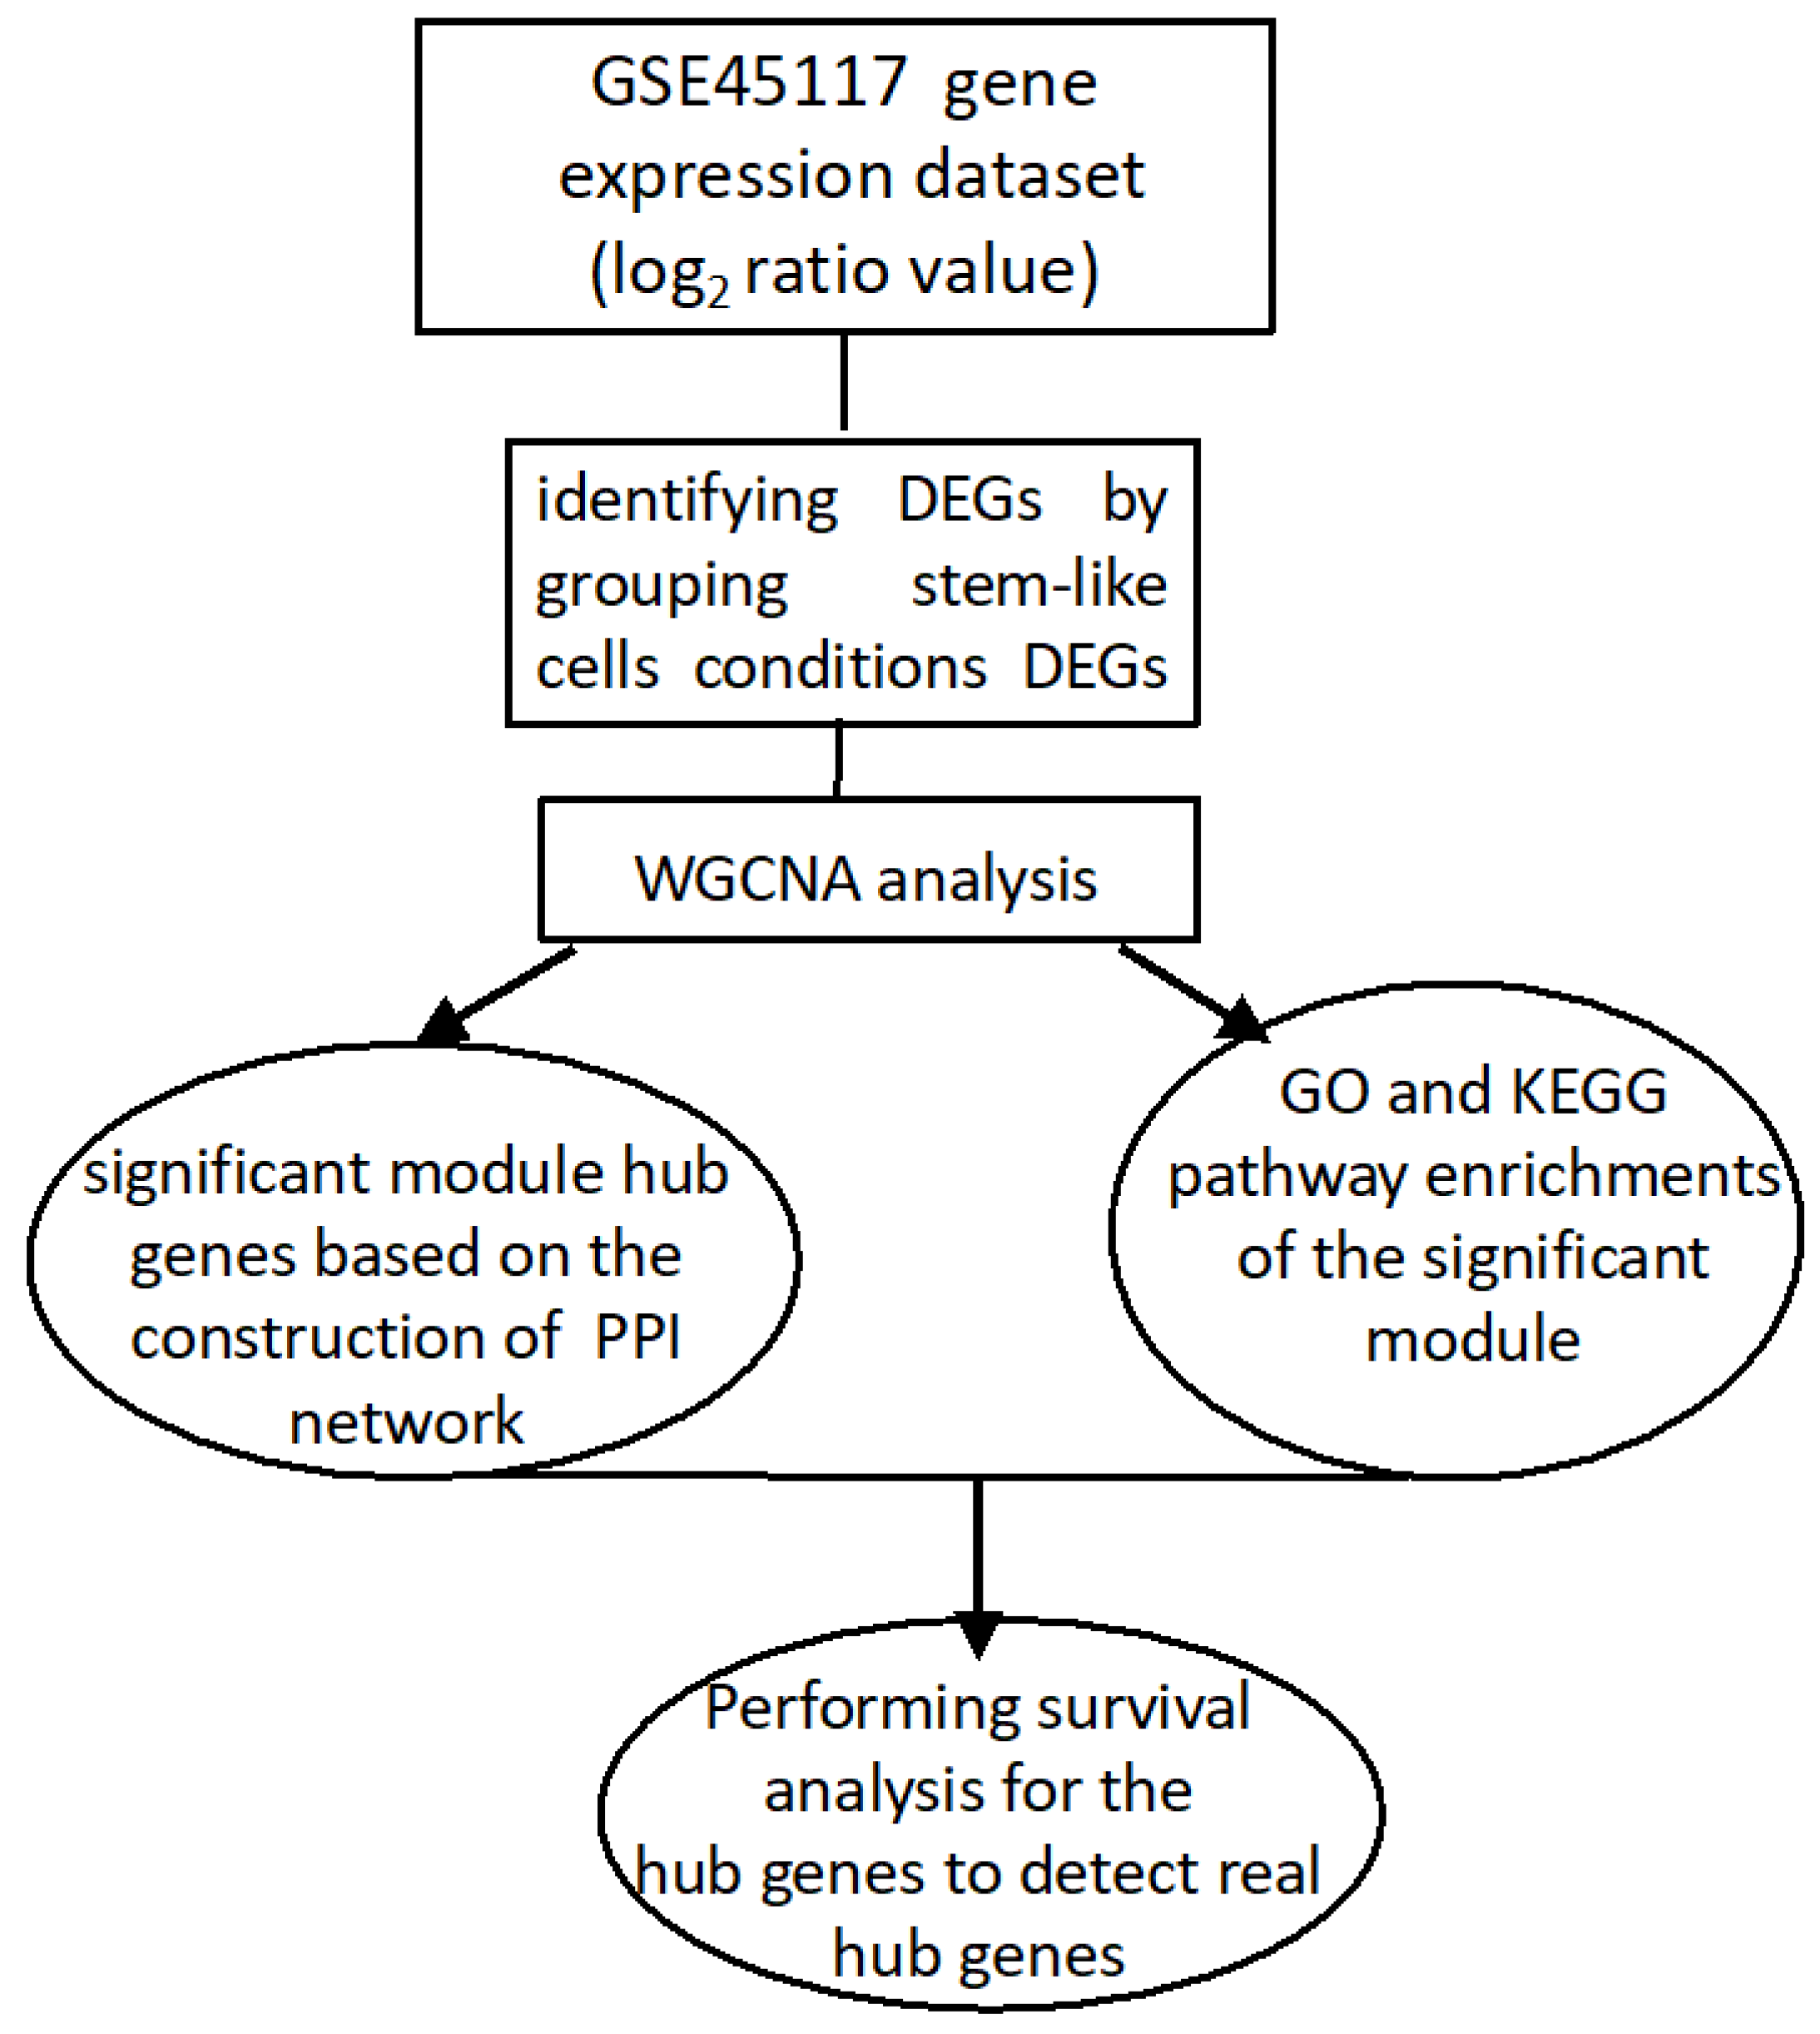
The computational pipeline detects the genetic markers for tumor differentiation by determining discrepancies in expression levels of glioblastoma tumor cells, stem-like cells, and cell lines. The investigation of hub nodes between pairwise samples by treatments of a significant co-expression module of DEGs resulted in the construction of co-expression networks. The current project is intended to reveal the biological, cellular, and functional pathways and linked genetic mechanisms of GB tumor in the most significant module.
The empirical research [
13,
14] so far has only focused on screening the significant genes. This analysis further presented the study of the DEGs utilizing WGCNA. Moreover, GO and KEGG pathway studies were reported concerning the biological process, cellular component, and molecular function of the pathways of the common hub genes. Moreover, a PPI network was built, and the related signaling pathways were studied to identify most significant hub genes of DEGs in the GSE45117 dataset. The gene expression of the GSE124145 dataset was further studied for the verification of the upregulated expression of the most significant hub genes.
4. Discussion
GBM is the most prevalent, destructive, and fatal brain cancer. Present treatment decisions including surgery, adjuvant therapy, and chemotherapy cannot fully treat the disease, because the tumor is highly defiant to these treatments. GSCs have the self-renewal capacity and are accountable for the tumor resistance in treating GBM.
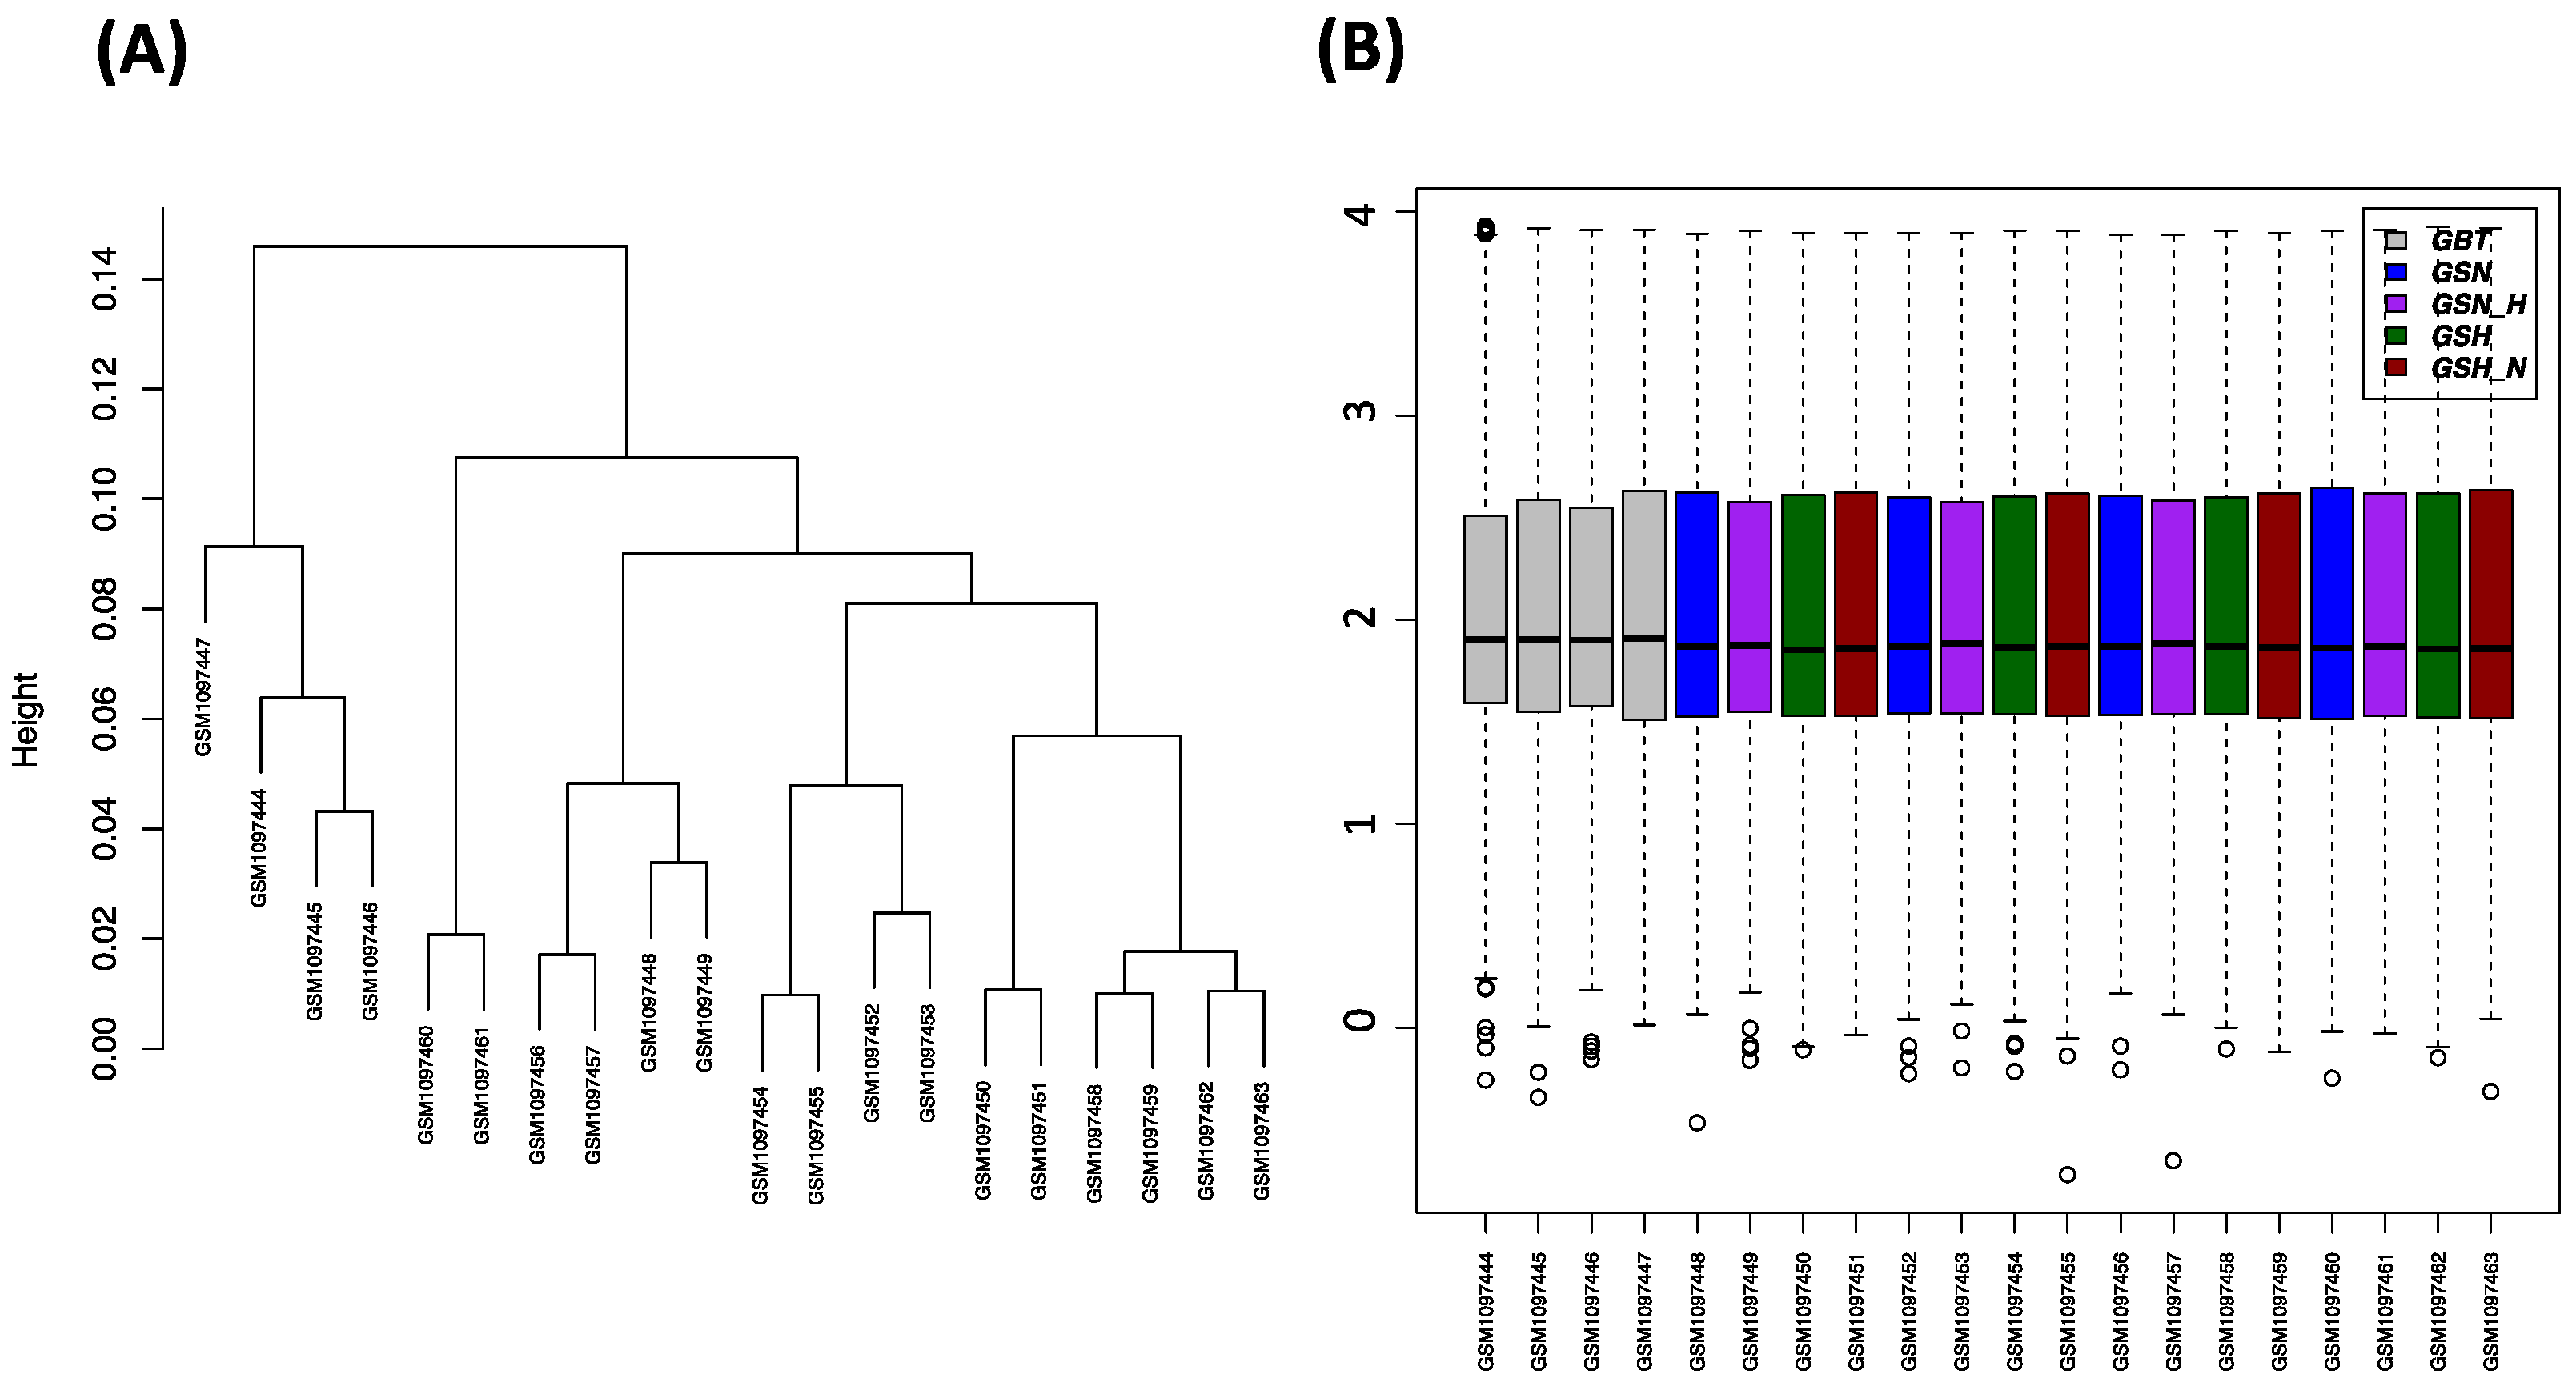
This study identified the DEGs in the GBT–GSN, GBT–GSN_H, GBT–GSH, GBT–GSH_N, GSN-GSN_H, GSN-GSH, GSN-GSH_N, GSN_H-GSH, and GSN_H-GSH_N treatment groups. Prior to the identification of DEGs, normalization is done based on a method used by Chung and Lee (2021). In this study, we performed WGCNA for mutual DEGs derived from the GEO database and reconstructed gene co-expression networks. First, we applied the WGCNA approach to DEGs (
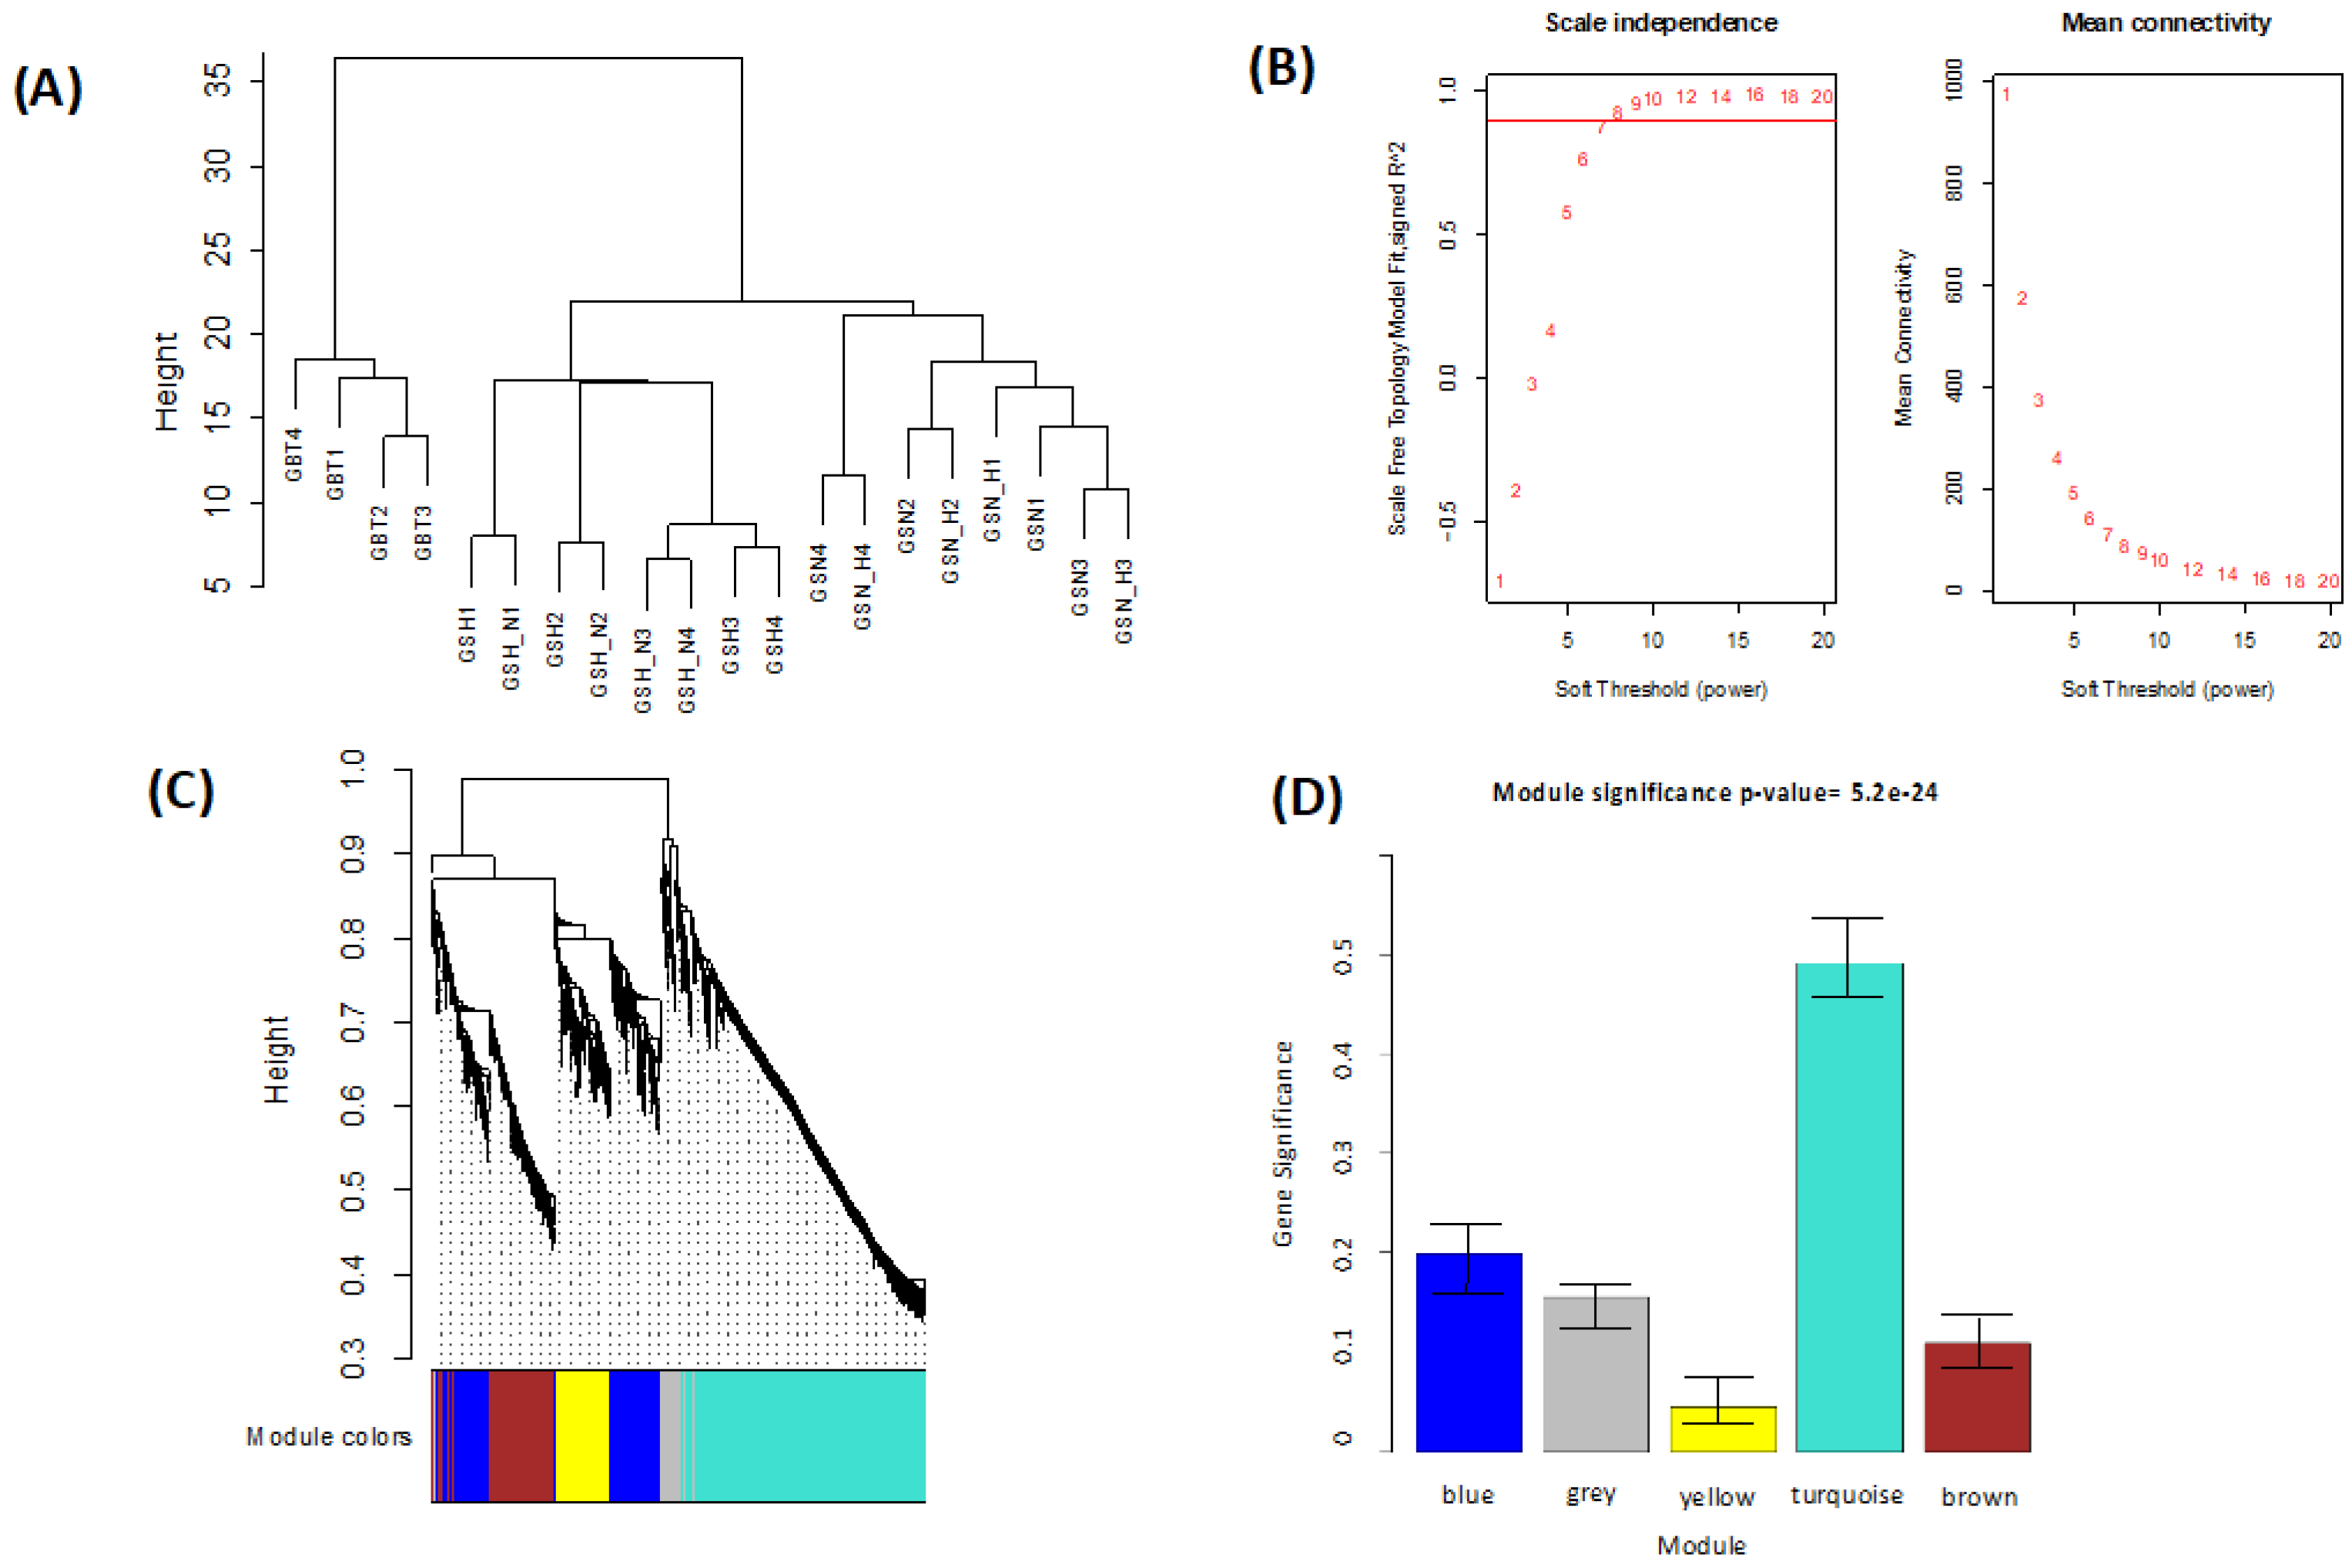
Table 1) of the GSE45117 dataset to evaluate the gene expression profile differences including GSCs, and a human GBT sample. As a data analysis approach or a gene filtering (screening) technique to identify groups (modules) of favorably related proteins, the WGCNA is an R software for weighted co-expression study and can be utilized [
28,
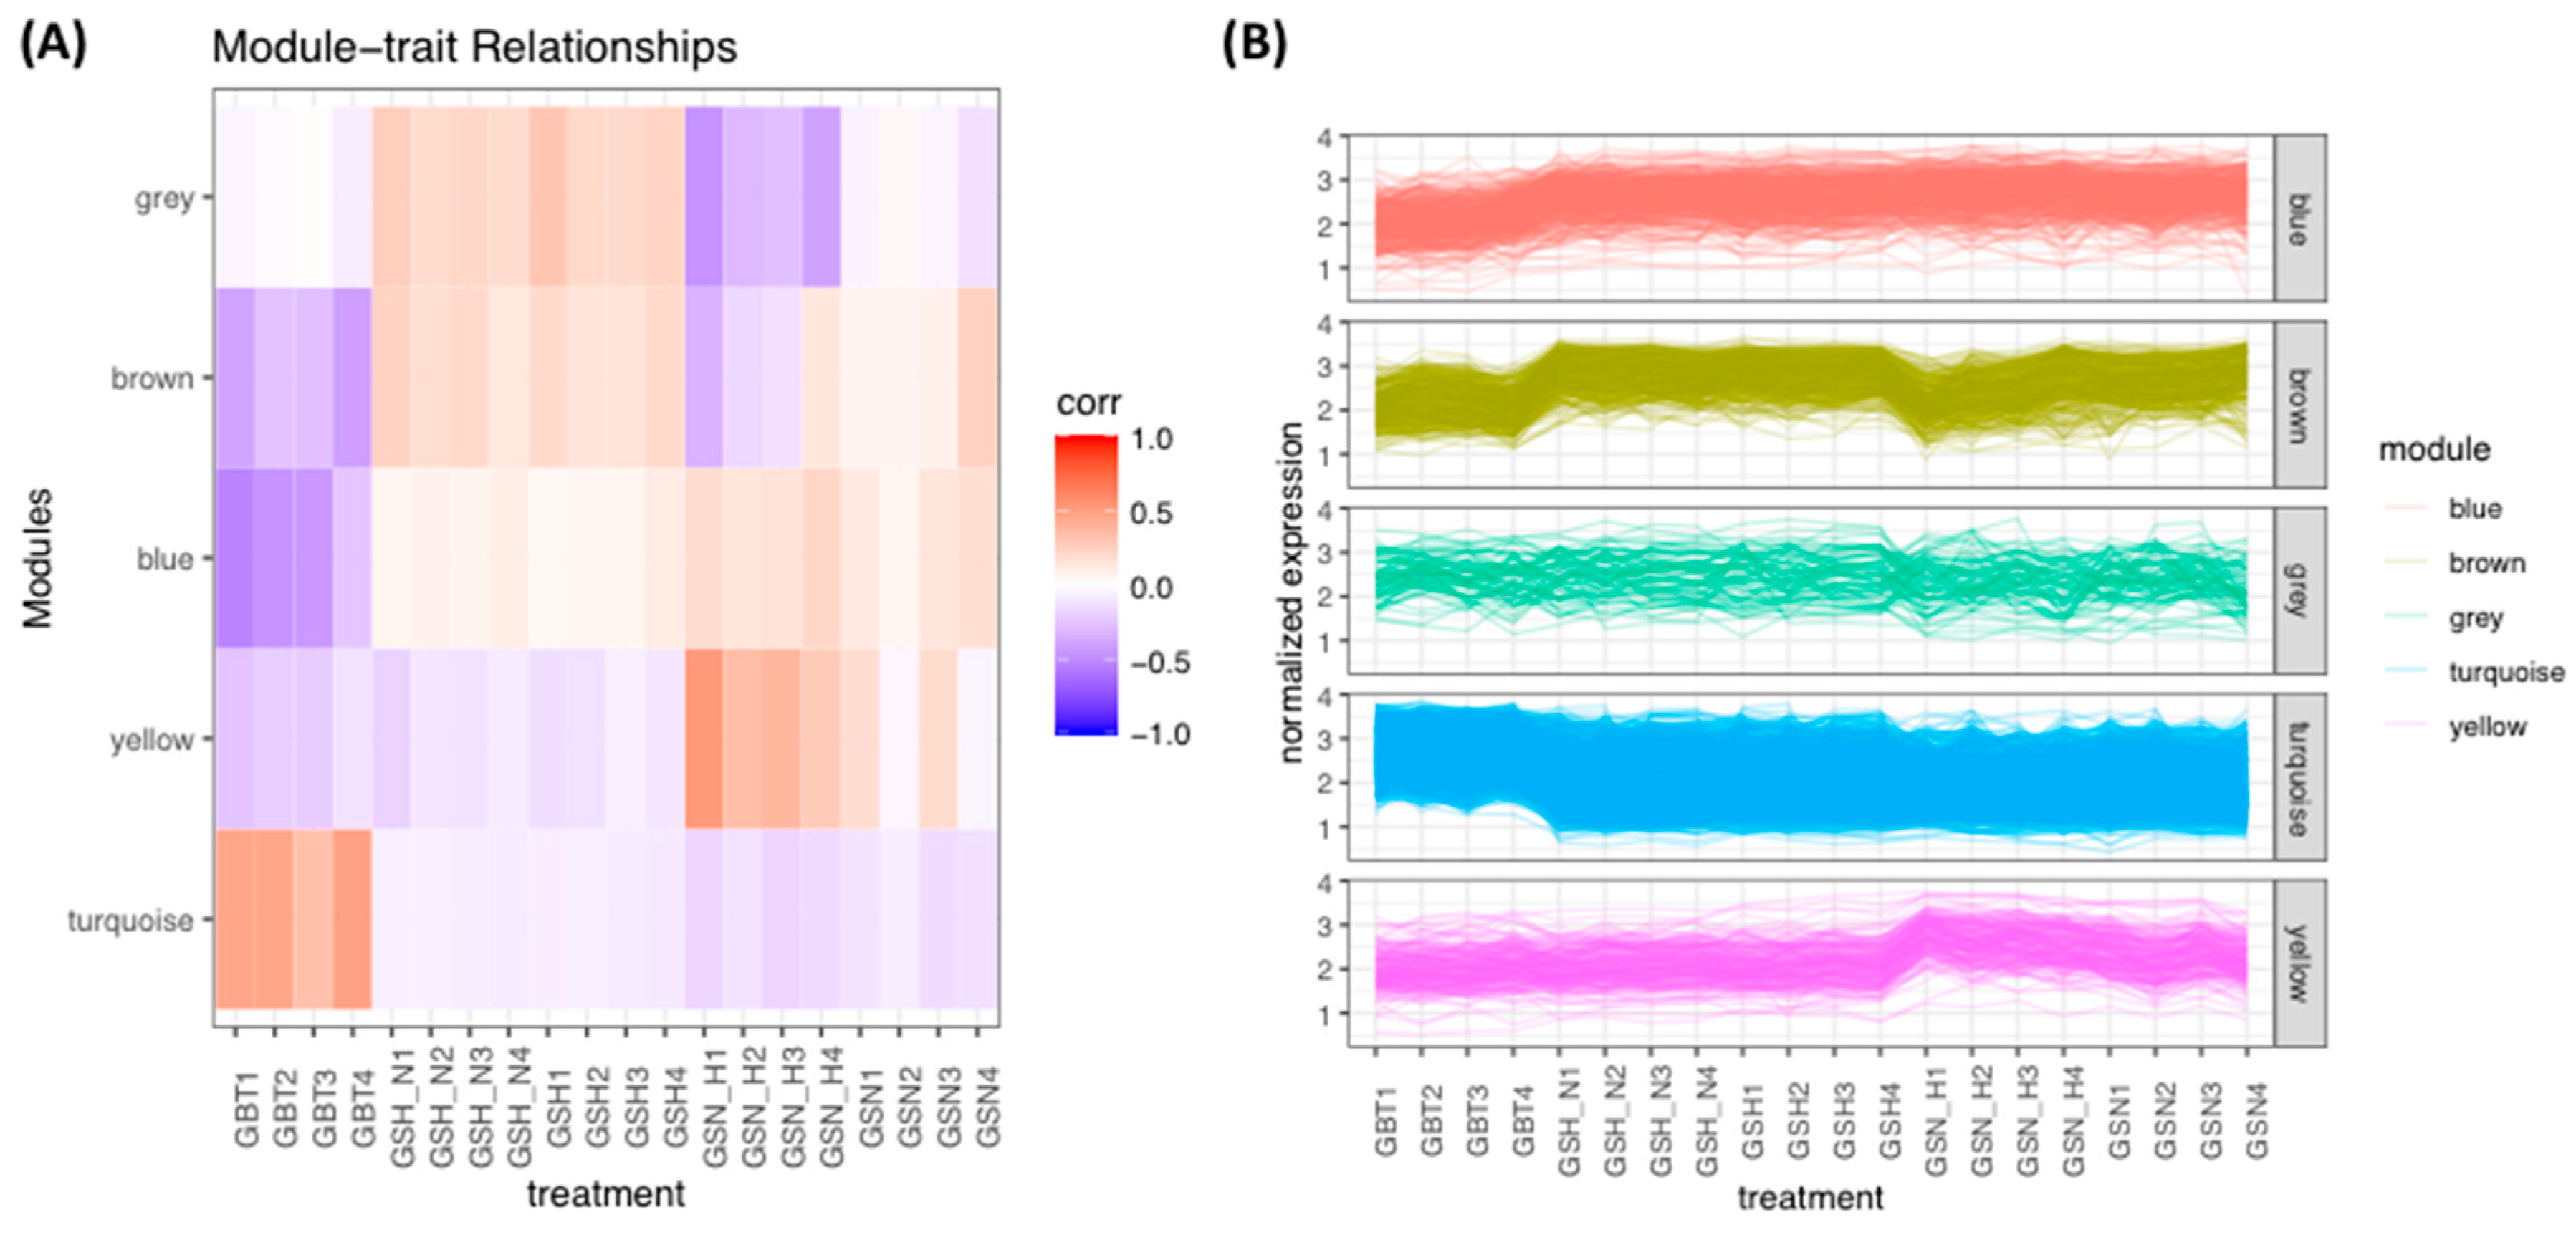
29]. Subsequently, GO and KEGG pathway enrichments were implemented on the turquoise module (
p-value < 0.05), which resulted in the most significant module (
Table 2).
The GO pathway analysis is revealed in biological process (BP) terms GO:0006955~immune response, GO:0006952~defense response, GO:0050900~leukocyte migration, GO:0006954~inflammatory response, and GO:0002682~regulation of immune system process. The significant enrichment GO terms in the cellular component (CC) are revealed as GO:0005887~integral component of plasma membrane, GO:0031226~intrinsic component of plasma membrane, GO:0005615~extracellular space, GO:0044421~extracellular region part, and GO:0031988~membrane-bounded vesicle. Lastly, the significant enrichment of the hub genes in molecular function (MF) contains GO:0005102~receptor binding, GO:0032403~protein complex binding, GO:0005178~integrin binding, GO:0004872~receptor activity, and GO:0060089~molecular transducer activity. The KEGG signaling pathway study reported that the hub genes were significantly enriched in hsa05150:staphylococcus aureus infection, hsa05144:Malaria, hsa04380:Osteoclast differentiation, hsa04064:NF-kappa B signaling pathway, and hsa05134:Legionellosis (
Table 2 and
Figure 5).
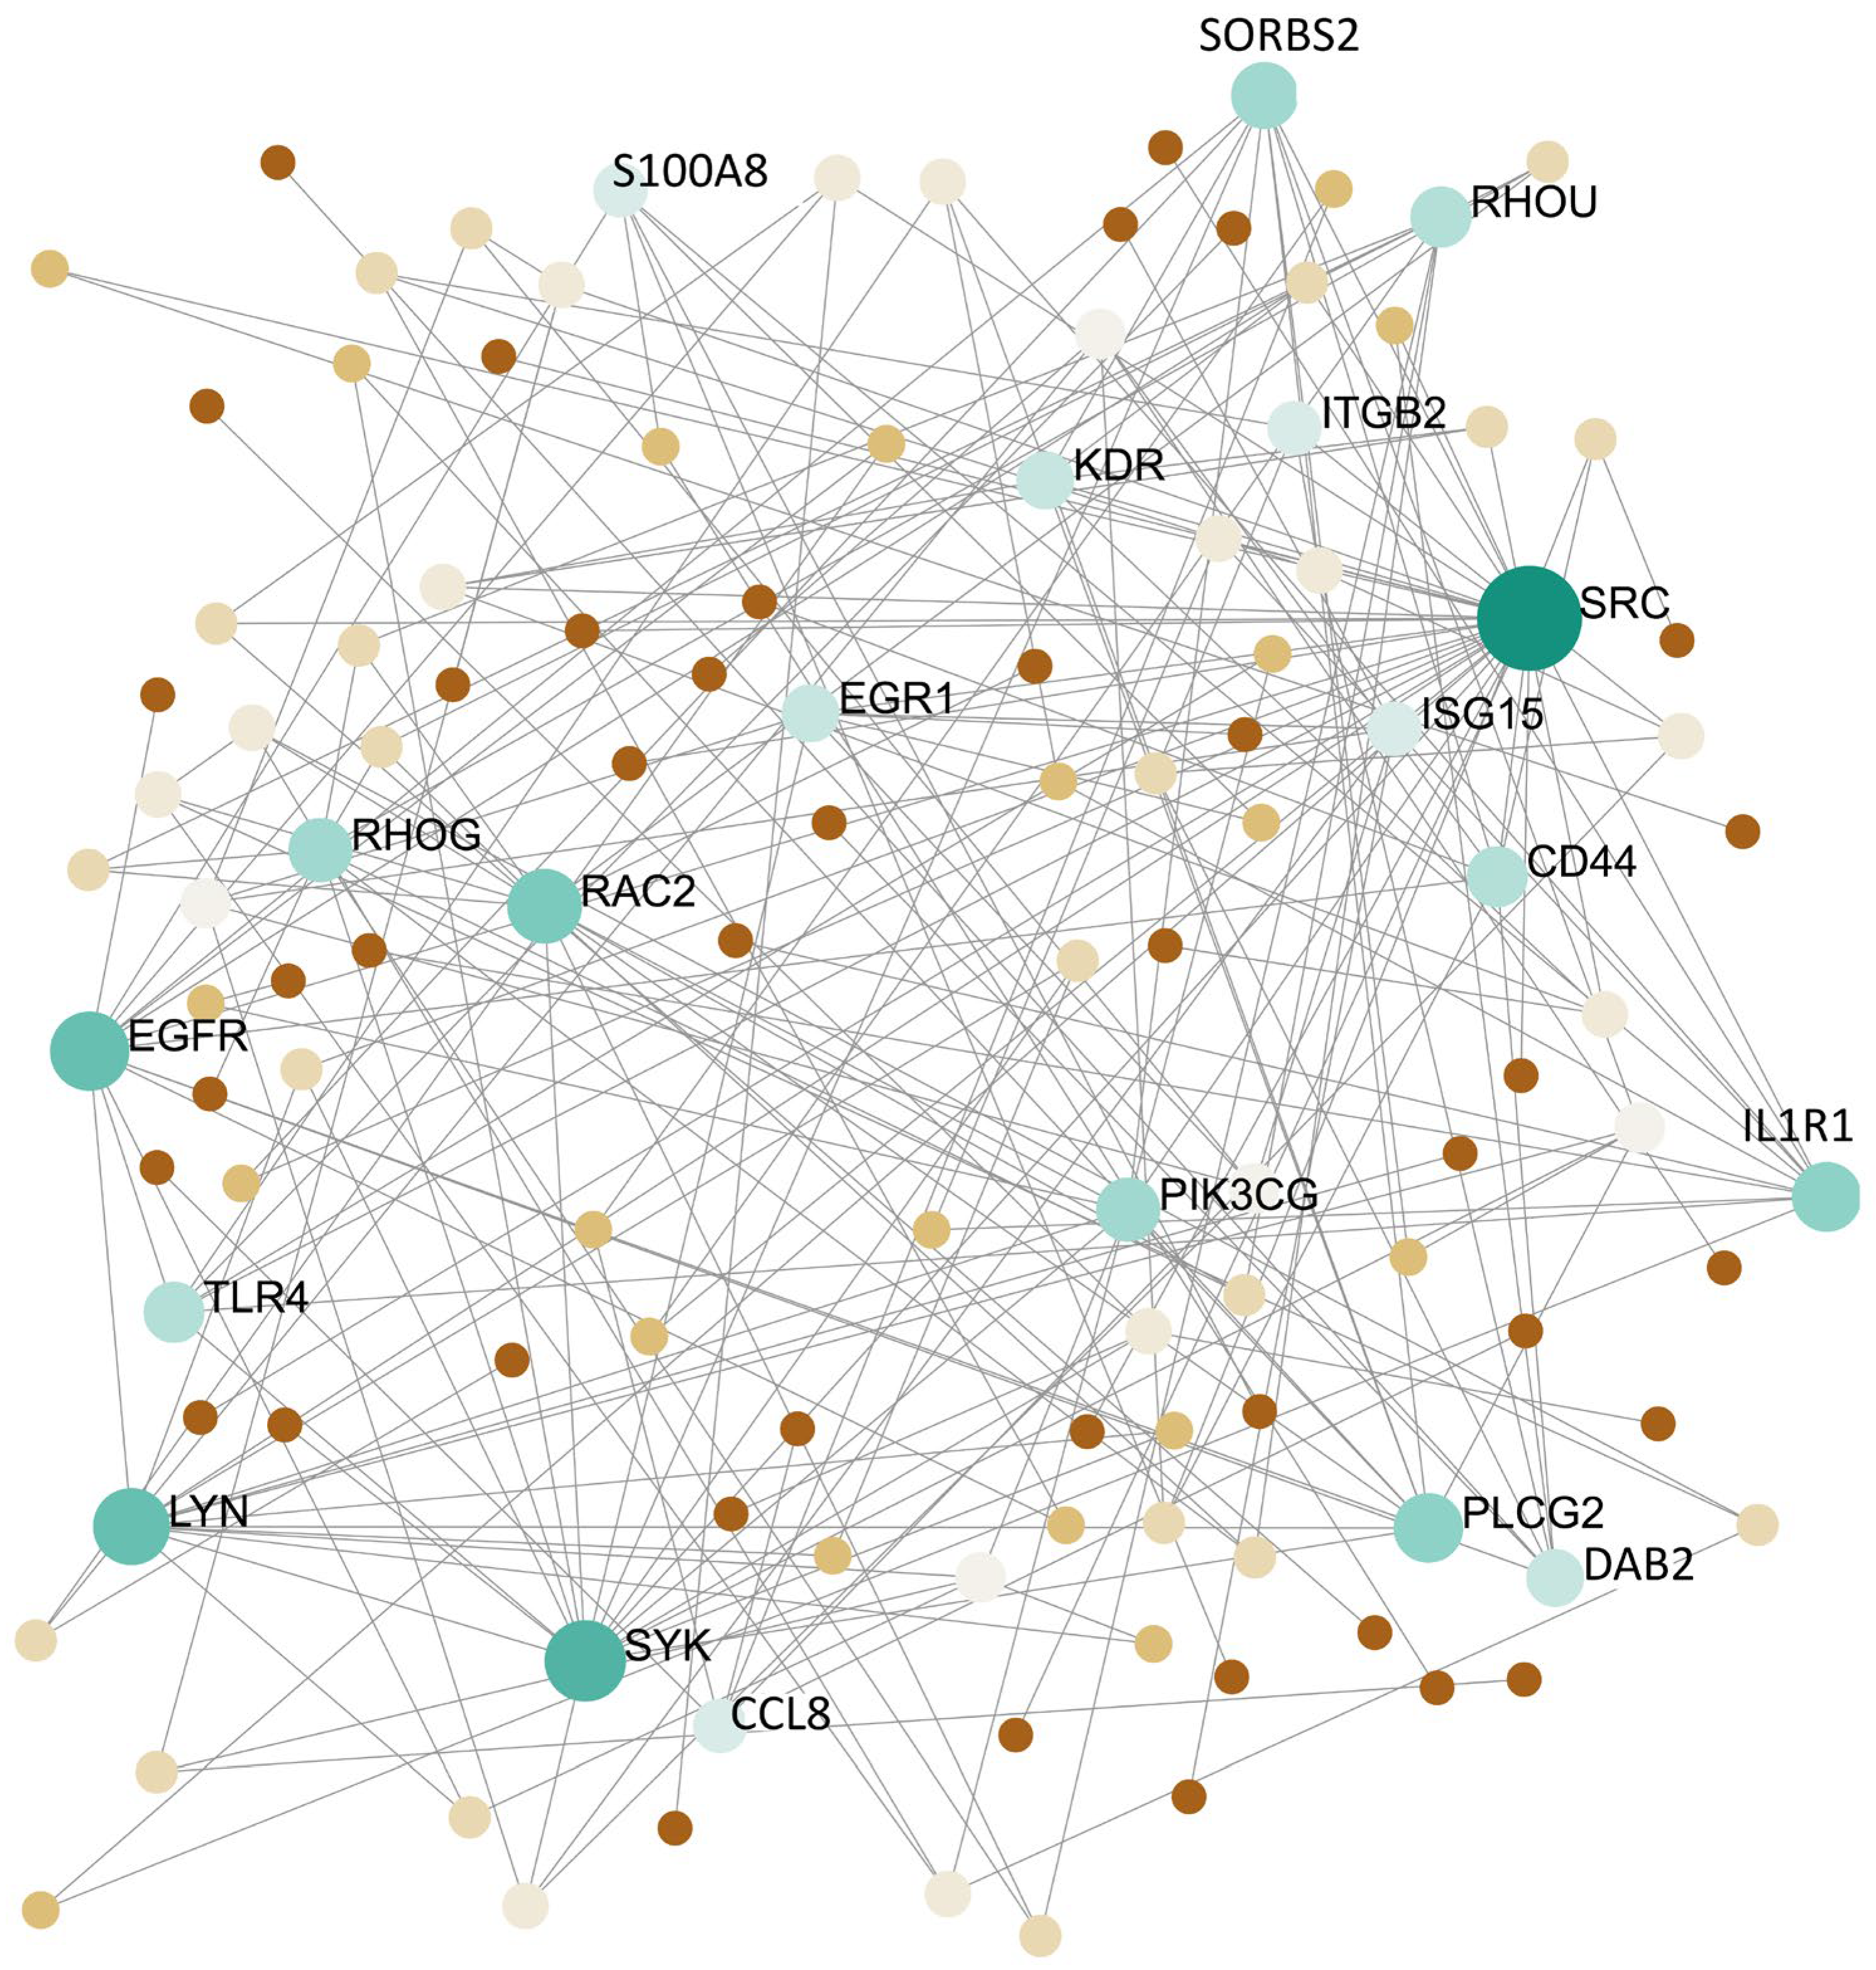
Twenty primary nodes (
Figure 6) with the top degrees in the gene expression levels of DEGs are presented in
Table 3. These genes can be listed as
SRC,
SYK,
EGFR,
LYN,
RAC2,
SORBS2,
IL1R1,
PLCG2,
S100A8,
CCL8,
PIK3CG,
RHOG,
CD44,
TLR4,
RHOU,
EGR1,
DAB2,
KDR,
ITGB2, and
HCK, and so-called common hub genes (
Table 4 and
Figure 7). The VEGF signaling pathway was screened as the most significant (
p-value < 0.05) pathway (
Table 4). The VEGF signaling pathway demonstrates an important role in many cancers involving GBM through hyperactivation and is of concern in various biomarkers of tumorigenic progression such as proliferation and survival. Furthermore, the VEGF signaling pathway is one of the leading angiogenic regulator pathways in these tumors [
39,
40]. Other KEGG pathway enrichments of the top 20 hub genes have resulted in hsa05205:Proteoglycans in cancer, hsa04666:Fc gamma R-mediated phagocytosis, hsa04664:Fc epsilon RI signaling pathway, hsa04662:B cell receptor signaling pathway, and hsa04064:NF-kappa B signaling pathway.
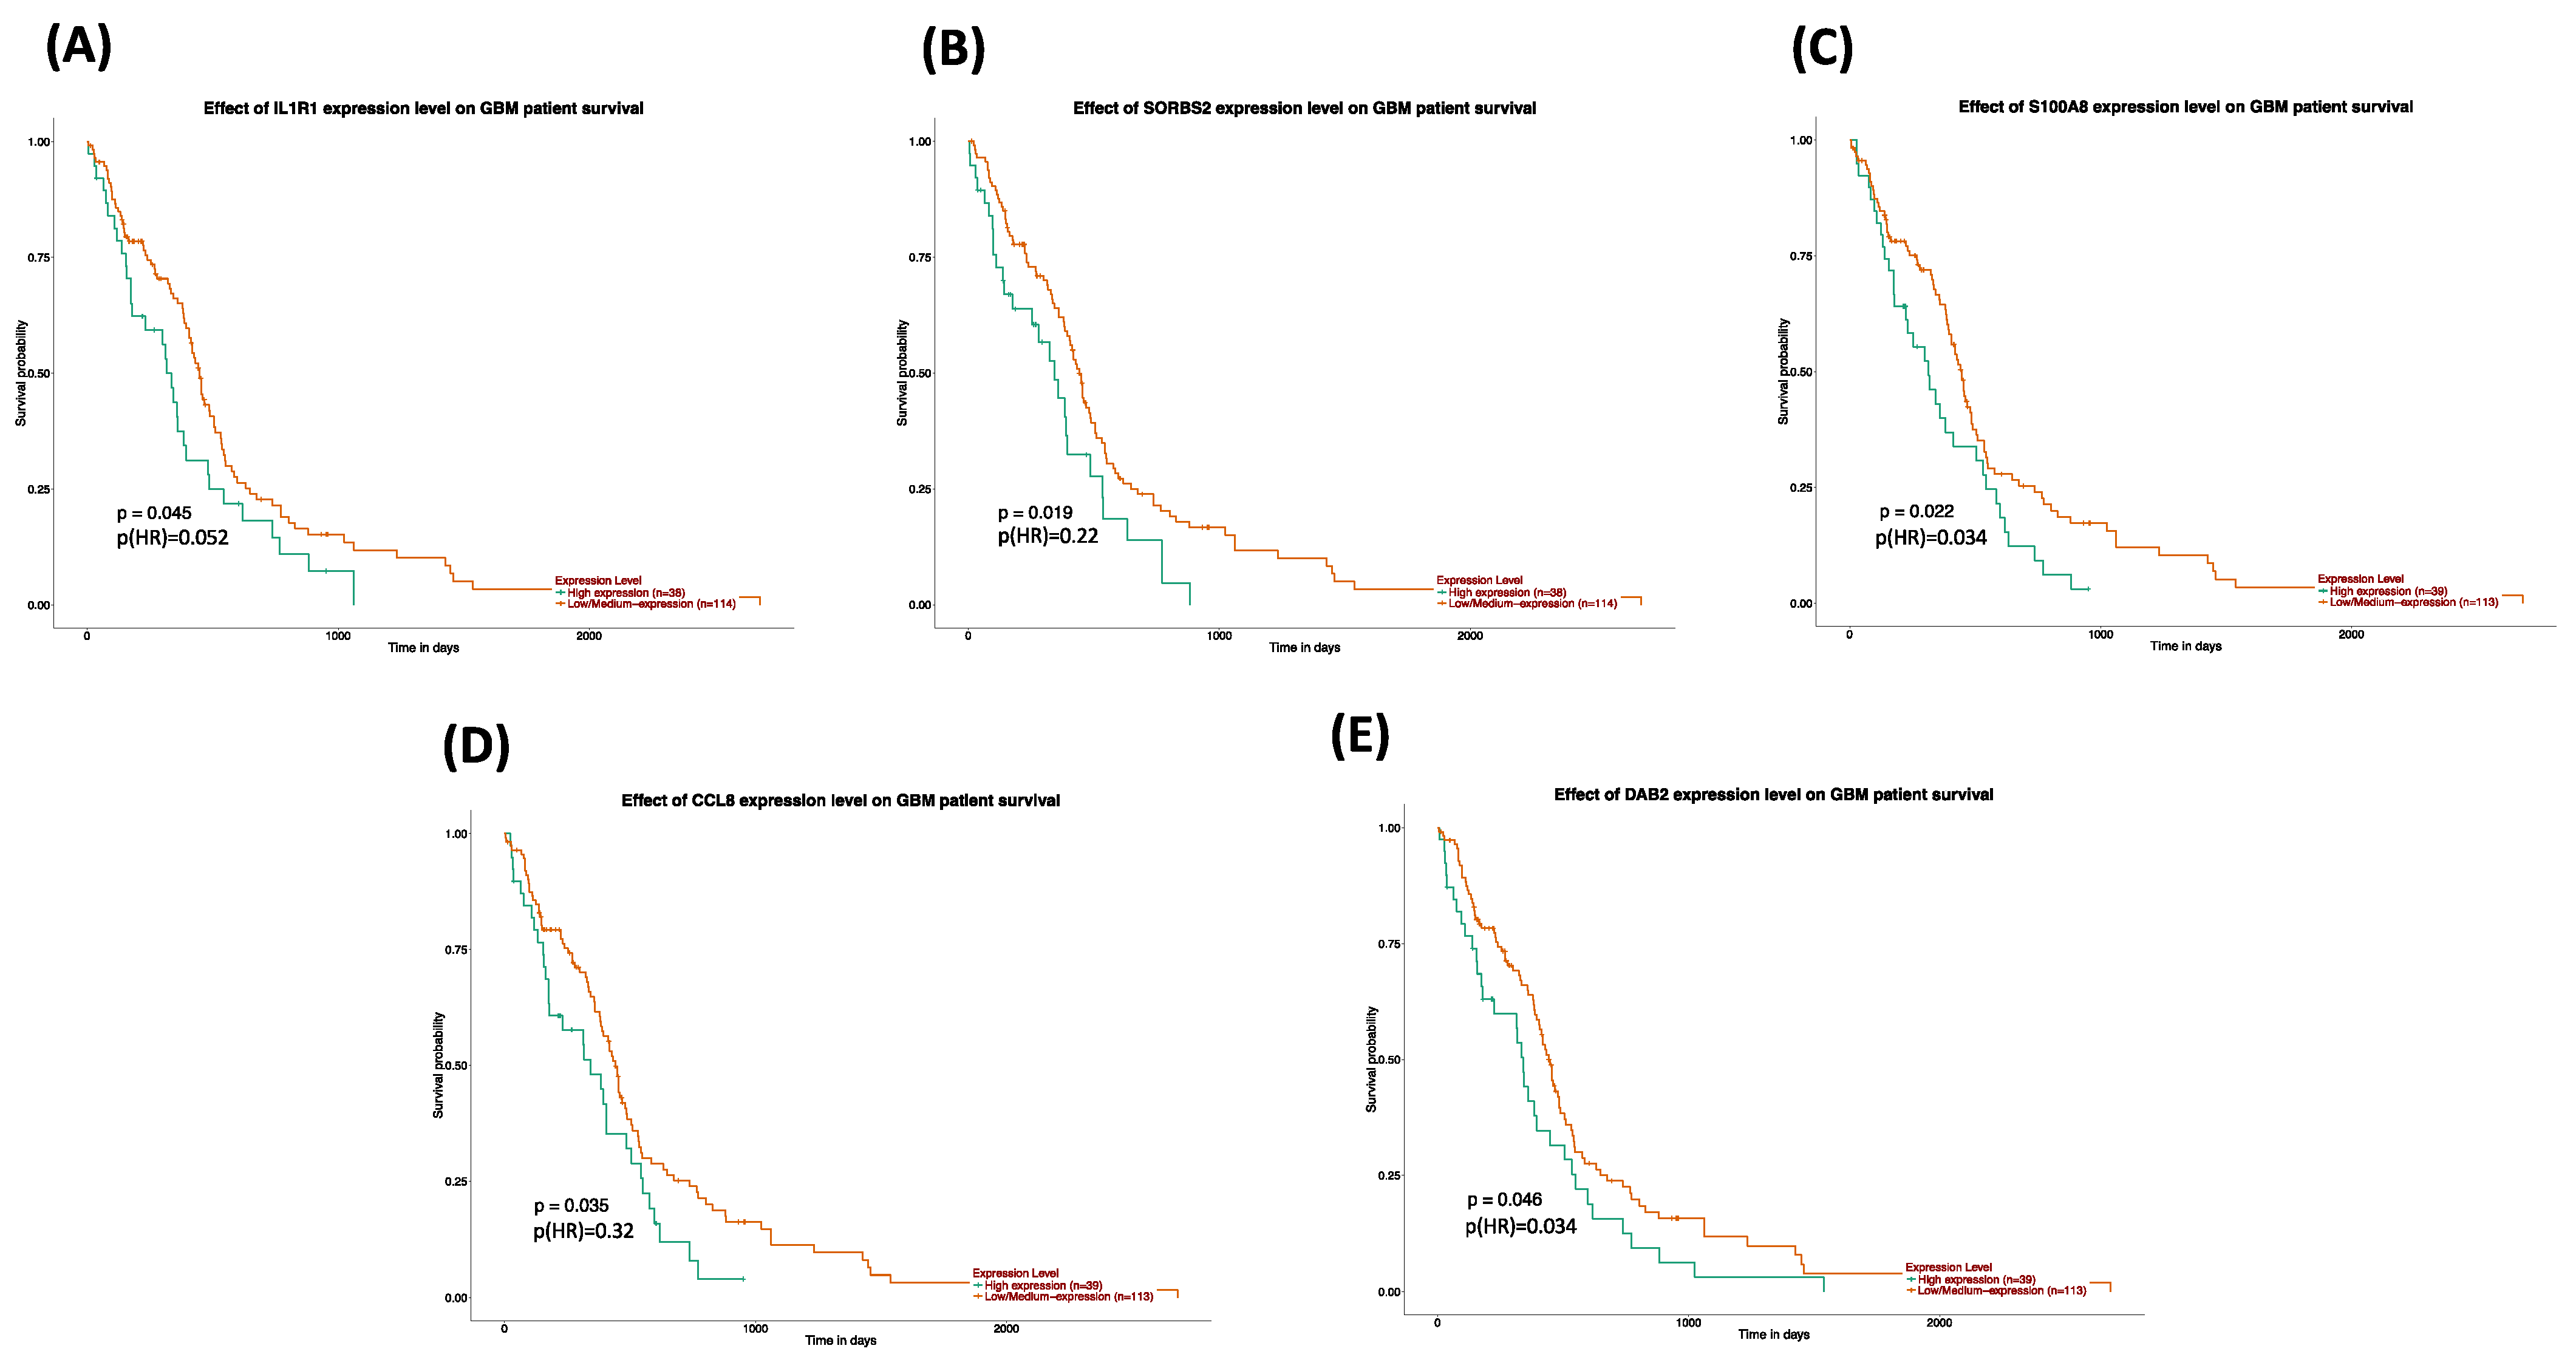
The survival and expression analyses of the common hub genes pick the five most significant hub genes such as Interleukin 1 Receptor Type 1 (
IL1R1), Sorbin and SH3 Domain Containing 2 (
SORBS2), S100 calcium-binding protein A8 (
S100A8), C-C Motif Chemokine Ligand 8 (
CCL8), and DAB Adaptor Protein 2 (
DAB2). The hub genes are powerfully connected with the development of GBM and they might be useful as potential therapeutic agents as shown in
Figure 9. A dramatic drop in the expression of
IL1R1 and
S100A8 with GSN_H and GSH_N treatments is further reported in
Table 5. The association to gene expression analysis results proposes details about comparative expression levels of
IL1R1 and
S100A8 in normal versus GB tumor as shown in
Figure 8C,D. Interleukin-1 signaling is established as an appealing and key therapeutic target for the controlling of glioblastoma-related cerebral edemas [
41]. The role of the IL-1 gene family in glioblastoma linked angiogenesis and tumor development has been reported in several studies [
41,
42,
43]. Therapeutically, a knockdown of the IL-1R1 might evaluate inhibition of IL-1 signaling as a novel therapy for GBM [
44,
45]. In a recent study,
SORBS2 in TCGA GBM cohorts has been reported among other genes as possibly being linked with inferior consequences and PDE1C silencing down-regulated their expression [
46], consequently proving to be promising concerning patient survival. Furthermore, WFDC1 is an instance of
SORBS2-bound transcripts which is mediated by
SORBS2 and a key metastasis suppressor [
47]. Previous research has reported that WFDC1 expression was considerably downregulated in mesenchymal cells in brain cancer [
48,
49].
Recently,
S100A8 has been reported as a prospective indicator with prognostic and diagnostic value in GBM [
50]. Gielen et al. (2016) proposed that glioma patients have enlarged quantities of intracellular S100A8/9 compared with healthy controls. Glioma patients further have boosted S100A8/9 serum quantities correlated with amplified arginase bustle in serum. S100A8/9 can be expressed by various myloid cells and tumor cells in glioma, where it can promote tumor cell growth and migration [
51].
In a recent laboratory investigation [
52], the data uncovered that
CCL8 is a tumor-associated macrophage element that resolves penetration and GBM stemness and has resistance to therapies. Moreover, it is reported in another study that
CCL8 stimulates the development of tumor cells in the glioma microenvironment [
52]. Our study also verified targeting
CCL8 offers a new prospect for GBM treatment.
The usual treatment protocol for GBM involves surgical removal of the tumor at a maximal and healthy level, radiation therapy, and temozolomide (TMZ) chemotherapy which is broadly used for silencing GBM. It is shown that the loss of DAB2IP (DOC-2/DAB2 interacting protein) is liable for TMZ resistance in GBM through autophagy-related protein 9b (ATG9B). In a fresh study that listed four subtypes of GBM,
DAB2 is reported as one of the fifteen selected genes that belong to the classical (CL) subtype. S100A4 was found in the CL subtype of GBM [
53].
To validate our results we further analyzed another clinical GBM gene expression dataset of GSE124145. All these genes were significantly up-regulated in both of the GBM datasets. Thus, targeting these five most significant hub genes (
IL1R1,
SORBS2,
S100A8,
CCL8, and
DAB2) may offer insightful strategies for GBM treatment. To confirm the association with GBM, we constructed a gene–disease association network as shown in
Figure 9. While we validated the results in the TCGA dataset, the accuracy of the results requires molecular and cellular experiments. Thus, by utilizing a sequence of bioinformatics investigation, this current study demonstrated the five most significant hub genes which may be tangled in the diagnosis and prognosis and efficient concerning the characterization of GBM and treatment options. A limitation of this study is the lack of experimental validation to confirm our results. The essential pathways enriched in the candidate hub genes were cell migration, cell motility, localization of cell, locomotion, and leukocyte migration. These results would significantly offer to uncover the progression of GBM.


