1. Introduction
Accessibility plays a fundamental role in the planning of transport infrastructure for the regional development and sustainability of a territory. Transportation networks are a crucial component of accessibility since they determine the location of activities and directly influence the present and future development and functional structure of cities. Accessibility is a key element to strengthen transportation infrastructure in less developed regions since it reduces the spatial cost of distance and facilitates not only the modification of settlements, but also the structure of the economic sectors of a region [
1]. Investment in transportation infrastructure is considered to be an effective instrument to achieve social and economic cohesion and represents one of the main instruments of territorial development policies, as demonstrated by the European Spatial Development Perspective (ESDP) [
2].
Transport planning improves policy decisions from the perspective of land-use and transport policy, and can lead to more developed and livable cities, especially when transport investment has social, environmental, and health impacts [
3]. In this regard, recent studies [
4,
5,
6] have advocated the need to exploit the potential accessibility indicators as a support tool in planning tasks to evaluate the relationship between land-use and transport changes. The different formulations provide varying but complementary approaches to the analysis, allowing for evaluation of the different effects of a given action [
7].
There are multiple spatial indicators to measure the accessibility of transportation infrastructure; however, the results can vary substantially according to each measurement. Therefore, it is important to identify appropriate indicators to analyze the centers of economic activity (population centers) in terms of highway distribution (networks) and measurement in units to determine the distance (time and travel costs), location, and importance of economic activities. Geographically, the accessibility of transportation infrastructure has been measured with indicators involving time and/or travel costs [
1]. These indicators have numerous advantages, such as the definition tools to characterize transportation networks [
8].
An important approach in the study of accessibility of infrastructure planning has been the measurement of spillover effects, that is, the benefits received in a geographic region because of the transportation infrastructure invested in other areas [
9]. Spillover effects could help us to understand how project costs could be distributed fairly according to accessibility gains [
10]. This article considers the concept of accessibility as the potentiality of a territory to reach a destination or a number of destinations from a specific point. The concept relating the accessibility indicators is the location of places and/or attraction centers, related to each other and to exogenous elements [
11].
Developing regions are increasing in urbanization and motorization and, particularly in the global south, transport planning has seen the need to improve the deficits of transport infrastructure to also reduce social, spatial, and environmental inequalities [
12]. In this paper, we focus on the future spillover impacts on the sprawled Latin American metropolitan area of Concepción (MAC), Chile, from the implementation of investments in transport infrastructure covered by the Plan Regional de Infraestructura de Biobío (PRI) of the Ministerio de Obras Públicas (MOP) from 2011 to 2021 (Regional Transportation Plan of the Ministry of Public Works), using accessibility indicators from geographical analyses. The PRI is expected to generate an investment in efficient road infrastructure—with regional competitiveness and better quality for the international integration of the region—to consolidate the development of corridors and to improve national logistical connectivity and the development of strategic productive sectors. In the MAC, this involves strengthening its role as a metropolitan port system and creating a more operational and competitive road connectivity network to increase the area of influence and territorial coverage.
While previous studies have measured the spillovers of new transport infrastructure using different measures of accessibility [
11,
12,
13,
14,
15] and also by transport simulation models focused on trips [
16], the PRI is a plan focused on cargo transportation and private vehicles. Unfortunately, it does not include the entire transport system; therefore, one of the novel aspects of geographical analyses is that we use the network efficiency indicator for measuring spillover effects and viewing the territorial impacts. This purpose is achieved through the spatial analysis of accessibility benefits and by generating a methodology to complement the economic and engineering transportation perspectives traditionally used. The methodological approach is focused on the calculation of accessibility indicators, using geographic information systems (GISs) and network analysis tools according to the suggestions of research [
8,
15,
17].
The rest of the paper is structured as follows. Firstly, following this brief introduction,
Section 2 presents a review of the literature on spillover effects and territorial cohesion from the perspective of accessibility.
Section 3 describes the methodology used to calculate spillover effects and is subdivided in five subsections;
Section 3.1 presents the case study,
Section 3.2 the modeling of the network dataset and procedures used for the calculation of travel times,
Section 3.3 defines the accessibility indicators selected,
Section 3.4 presents the calculation of spillovers, and
Section 3.5 the dispersion indexes used to measure territorial cohesion.
Section 4 shows the main results, and finally
Section 5 provides discussion, while
Section 6 offers some conclusions from the previous exercise.
2. Accessibility Effects
Accessibility is a key element in strengtheing less developed regions in terms of transportation infrastructure [
1]. Accessibility changes thanks to transport investment intended to reduce travel time and create spatial advantages in that region [
18]. The diversity of approaches to accessibility has expanded the formulation to measure it, focusing on different indicators according to complexity [
19]. Accessibility to a transport network can be measured in different ways based on the objectives of the study; however, the most common unit is distance, in terms of time and travel cost [
20,
21,
22].
An important approach in the analysis of the accessibility of a transport network is the interpretation of spillover effects, defined as the indirect effects on a geographic region from transportation infrastructure invested in other areas [
9]. These effects—and potential benefits—are closely related to a network effect [
23], which is characterized as spillover effects on unit costs, prices, and products of associated markets as a result of improvement in transportation. These include the effects produced in the transportation system and the connected economic sectors. In this sense, Holl [
22] includes several accessibility measurements to determine spillover effects in Spain and analyzes the role of road infrastructure (from 1980 to 1994) in the localization of new manufacturing companies. Based on this study, new road investments unexpectedly generated negative spillover effects.
Therefore, accessibility analysis can be used to estimate spillover effects as well as network effects; however, the estimate and monetization of spillover effects caused by two new roads planned for the city region of Eindhoven and the weighting of these with traffic intensities and the value of travel time has been a recent contribution of Condeço-Melhorado et al. [
10]. Thus, this is the first time spillover has been validated with actual mobility data.
Most accessibility measurements include transportation cost and attraction capacity of different activity centers in a single indicator, with a recent perspective on this analysis of accessibility of transportation infrastructure found in the studies of Gutiérrez and Condeço-Melhorado [
8] and Gutiérrez et al. [
15]. Transportation cost is a measure of the frictional effect of distance, which can be expressed in units of distance [
20], time [
21], or generalized transportation cost [
24]. In this way, accessibility indicators can be calculated for different periods to analyze the changes made by particular interventions in the transportation system, comparing the situations before and after a specific intervention or infrastructure plan in the territory.
According to Condeço-Melhorado [
17], spillover depends on the characteristics of transportation infrastructure. For this reason, the first aspect to be considered is the location of the infrastructure, which has an impact on the intensity of the spillover generated. The main function of an infrastructure of national importance—located in the interior of the country—is to connect the national economic centers, and its impacts will occur inside these limits, generating spillovers of less intensity. However, neighboring countries will also benefit from that infrastructure if they use it for their commercial relationships. In the case of a cross-border project between two countries, the spillover effect will be larger because of the importance of this type of infrastructure to the promotion of international relations. Spillover effects are even more extensive in the case of transportation corridors that pass through several countries since they have significant benefits to international relations. On the contrary, some infrastructure in neighboring regions may be used less based on their geographic orientation.
In other studies that quantify the spillover effects of transportation infrastructure from an economic perspective [
25,
26,
27], spillovers are measured through the extension of the public capital stock of one region to a neighboring area and comprise a number of assets of public domain, accumulated through investment (productive infrastructure, healthcare, and education) since the benefits of regional production will not exclusively fall upon a single infrastructure, but also on the infrastructure of adjacent regions. These methodologies follow proximity criteria, considering that the positive effects of the intervention will be stronger in neighboring regions. To analyze and quantify the spillover effects of public investments on the economy of Spanish regions, some authors have made estimates by extending the public capital stock to geographically adjacent regions. They found that positive effects (especially in the case of highways and railways) had greater intensity in the nearest regions [
28].
The measurement of spillover effects through accessibility indicators and the geographic information system are relatively new in relation to traditional econometric techniques, such as the production functions commonly used to analyze and quantify regional spillovers of public capital in transportation infrastructure [
17]. The simplicity of the Cobb–Douglas production function contributes to its widespread use, where infrastructure is compared to the traditional production factors—such as work and private capital—generating positive effects on the productivity of other productive sectors [
28].
One of the most popular indicators in accessibility studies is the economic (or market) potential [
10,
14,
15,
18,
29,
30,
31], where the level of opportunity between a place
i and a destination node
j is positively related to the mass of the destination and inversely proportional to the distance or travel time between both nodes. This indicator is a gravity-based measurement that has been extensively used [
15] to investigate not only accessibility changes due to a pricing policy, but also territorial equity impacts and regional spillover effects. Moreover, changes in the territorial distribution of accessibility resulting from high-speed rail investments have been analyzed to assess the sensitivity of territorial cohesion results at different planning levels [
30]. However, it should be considered that results from this indicator depend to a large extent on the value used to represent the effect of distance decay, which has been studied in Condeço-Melhorado et al. [
31].
Moreover, the locational indicator [
32,
33] has recently been used to calculate spillover effects from an interregional perspective, where the population of each destination is used as a weighting factor. Its results have allowed for the evaluation of accessibility levels before and after the execution of a transportation plan [
8,
14]. This indicator should be interpreted from the locational rather than the economic point of view, having the advantage that its results are easily interpreted, as they are expressed in familiar units—travel times—and therefore changes in this indicator are usually used as a proxy for computing travel time savings. Its main limitations stem from the fact that it does not discriminate between near and far destinations, and its values depend heavily on the selected set of destinations [
34].
Spillover effects can have a considerable influence on regional production levels. Pereira and Sagalés [
9] conclude that the contribution of spillovers and internal infrastructure endowment is closely tied to regional productivity. Other authors [
27,
35] have found positive effects in regions where the infrastructure is located, and negative spillover effects in neighboring regions that compete for the production factors. In contrast, one of the main criticisms of traditional econometric methods in measuring spillovers is that they give the same importance to all infrastructures in the neighboring regions, regardless of their role in commercial relations [
17]. This represents a problem, since transportation infrastructure in neighboring regions has varying degrees of influence according to the location and use of economic activities.
Traditional methods such as Cost Benefit Analysis (CBA), despite being the most common evaluation method used in the public sector, have several limitations [
36,
37,
38] and rarely deal with the spatial redistribution of the effects generated. Spillover analysis can offer some insights into the distribution of impacts across regions and can determine which regions benefit most from a transport project [
10]. In this study, we measure the spillover effects from the perspective of accessibility using locational and network efficiency indicators, the latter of which has never been used in these studies to our knowledge. Another novel aspect is that we apply this methodology in the context of a Latin American metropolitan area such as MAC, where spillover effects have not been included in transport assessment studies.
Most approaches to measure territorial cohesion come from economics, where cohesion is defined as a convergence process at different levels of regional welfare to achieve progress and sustainability [
39]. Therefore, the concept of cohesion is closely related to the definition of a set of ideas about equity and justice. López et al. [
14] state that the improvements in transportation systems—due to infrastructure investment—increase the competitiveness of regions and increase territorial cohesion. The ESDP (European Spatial Development Perspective) is an example of how to link competitiveness and cohesion, specifying that the efficient operation of the transportation system is an essential factor to strengthen the competitiveness of peripheral or less developed regions since it facilitates the social and economic cohesion of territories.
Including this conceptual framework in the process of infrastructure planning implies that the objective of territorial and social cohesion is not only related to the expected demand, since this would lead to a vicious cycle of cumulative causation under the premise that a better dynamic started in a region—with initial advantages—does not improve neighboring areas; therefore, disparities would increase, and the process of regional growth would be unbalanced. In addition, from this perspective, the investment would be made only in places where the population and economic activity is concentrated, increasing their growth and transportation demand, which would justify more transportation investments in these centers. Finally, this perspective does not consider that it is impossible to reduce territorial disparities without significant improvements to the transportation services and infrastructure in regions where accessibility issues restrict economic development [
8]. In this context, it is essential to evaluate whether the installation of new infrastructure would increase (reducing cohesion) or decrease (increasing cohesion) accessibility disparities and to what extent.
Currently, the integration of regional cohesion in the evaluation procedures for large transportation infrastructure investments is a matter of considerable interest [
13,
29]. However, this aspect generally does not have a significant role in the evaluation of investments [
40]. In fact, the analysis of these effects classifies them as “indirect impacts,” and there is little agreement regarding the procedures used to analyze these effects and whether to include them in the assessment methodologies and decision-making processes [
41].
Regional cohesion can also be analyzed through spillover effects, identifying regressive or progressive effects. Regressive effects are the spillovers of a less accessible region to the benefit of more accessible regions; and progressive effects are spillovers in the opposite direction. In terms of territorial cohesion, regressive effects are generally negative, since they represent benefits for central regions derived from the construction of infrastructure in peripheral regions.
3. Materials and Methods
3.1. Case Study
Our case study area is a Latin American urban conglomerate composed of seven municipalities, which together represent a medium metropolitan area known as the metropolitan area of Concepción (MAC), in the Biobío Region of Chile, whose main centers are Concepción and Talcahuano [
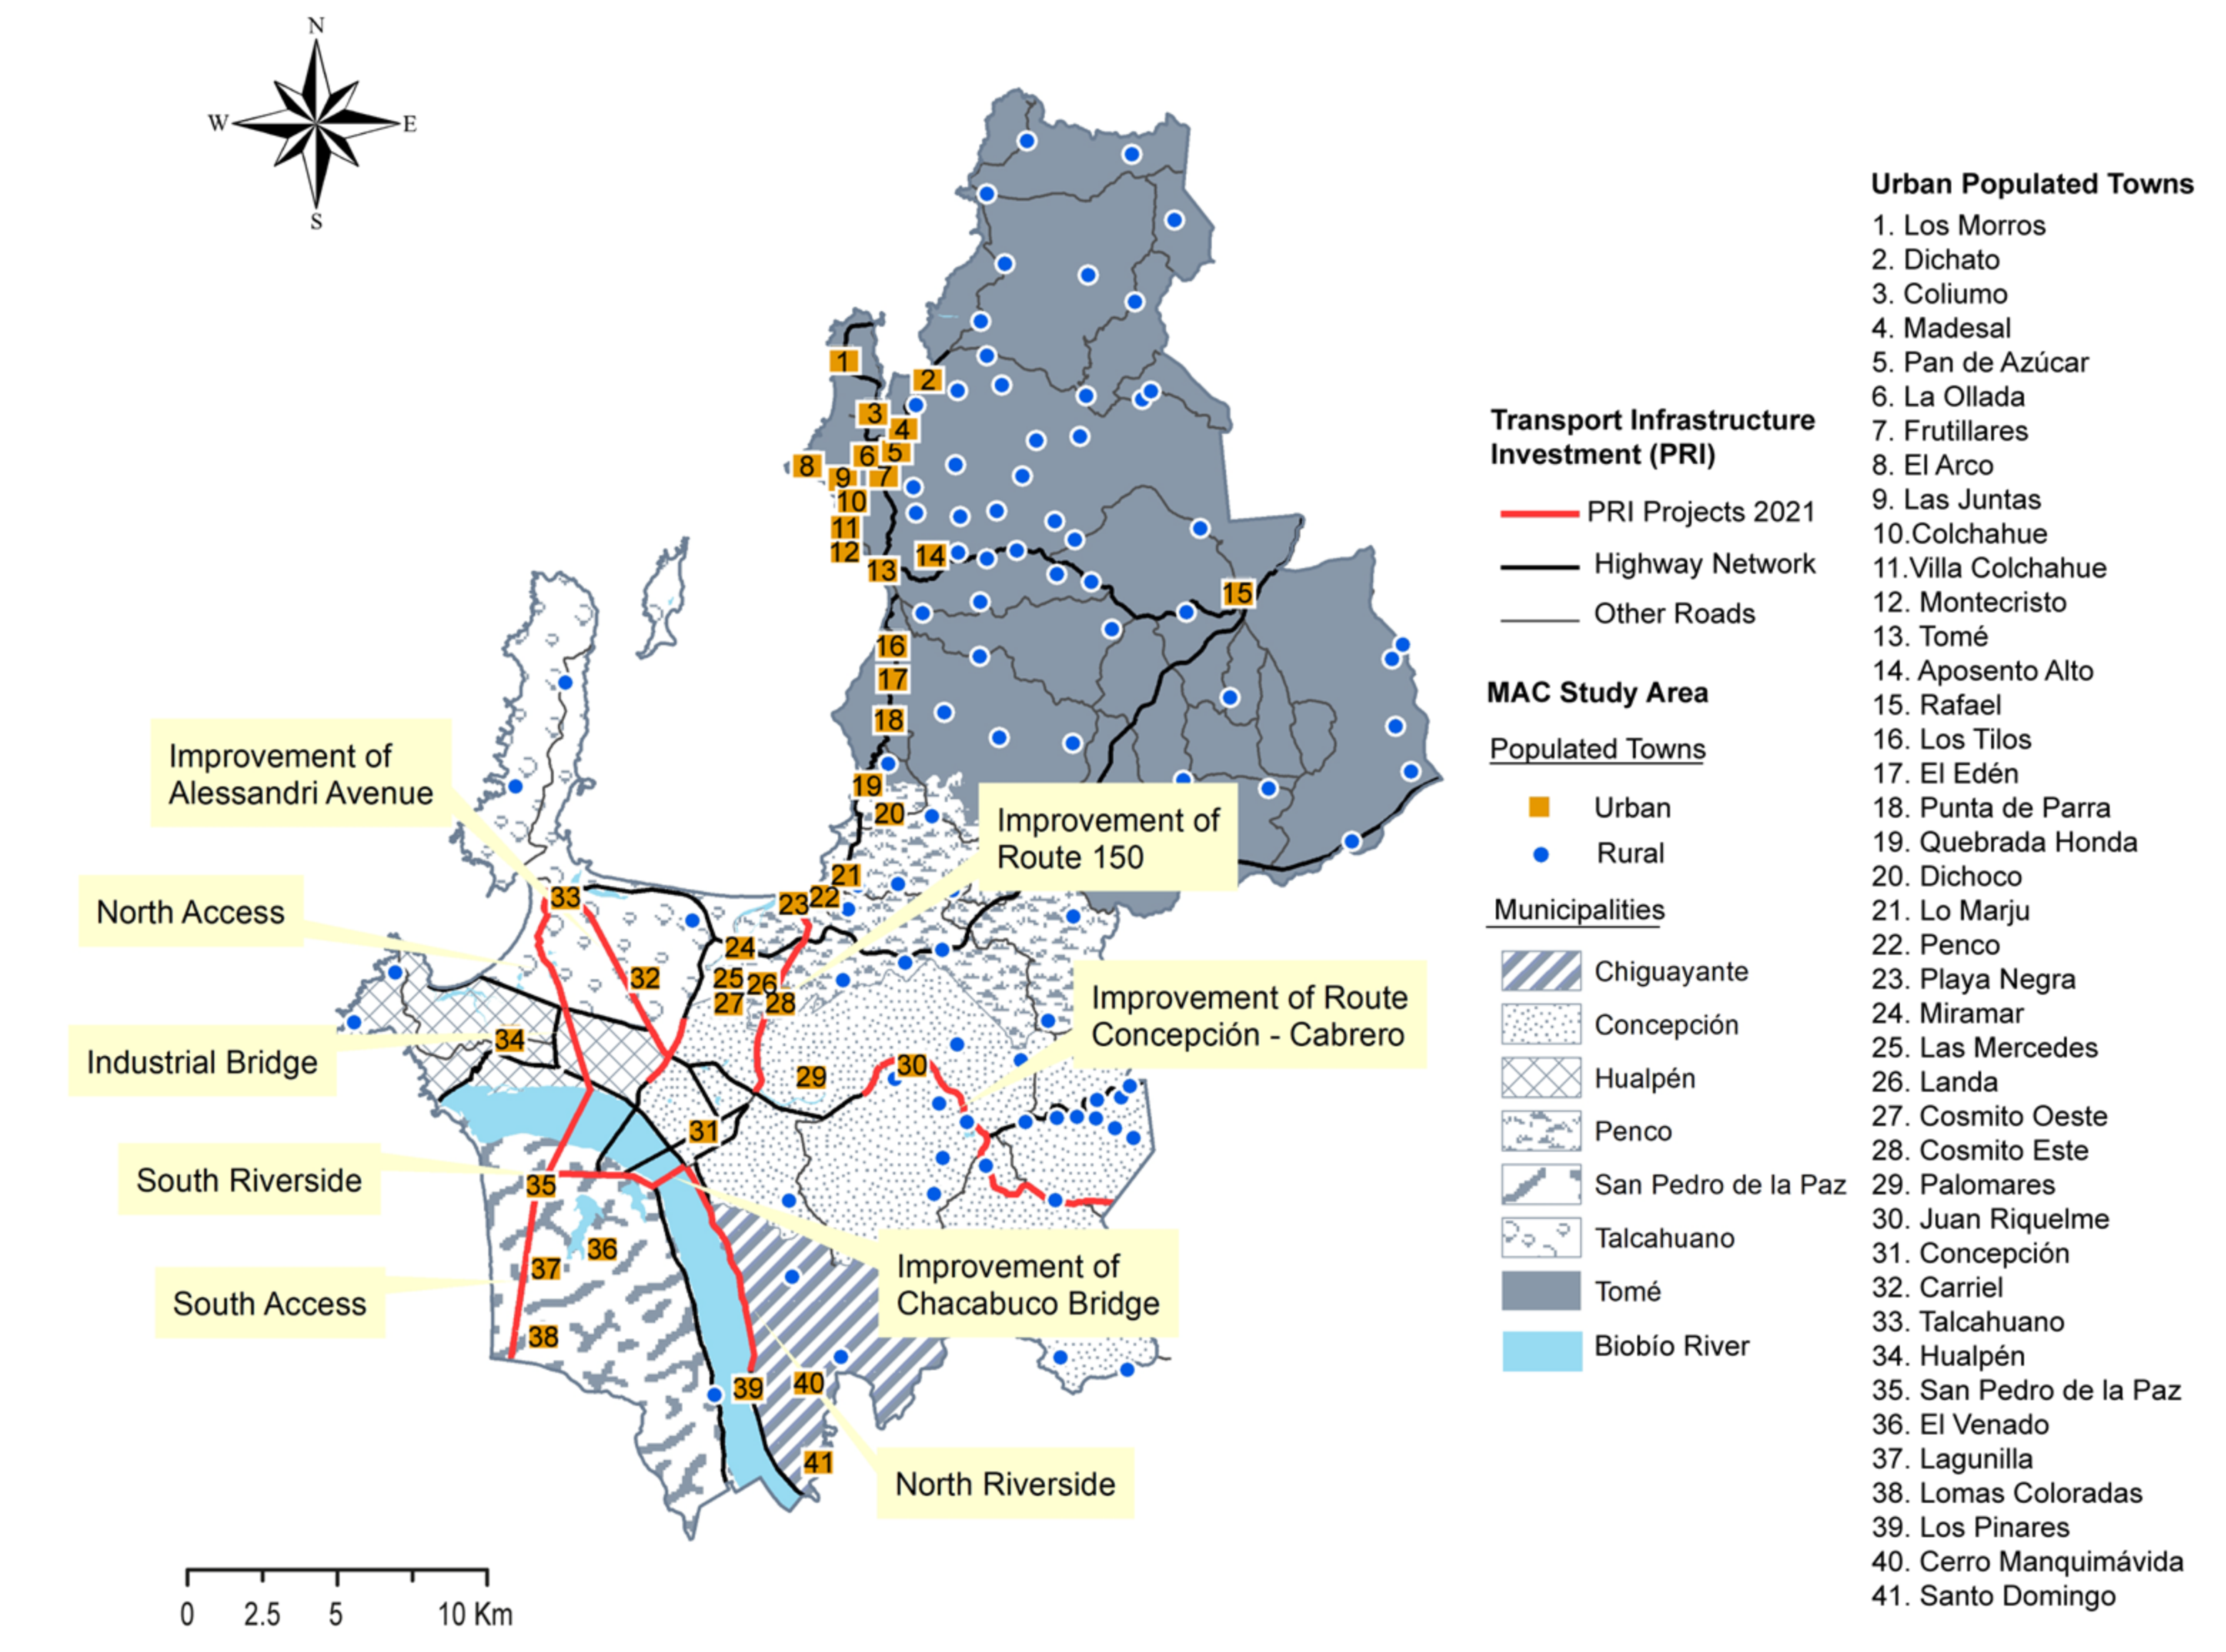
42]. The municipalities included in the PRI are Tomé, Penco, Talcahuano, Concepción, San Pedro de la Paz, Chiguayante, and Hualpén, covering 138 urban and rural populated towns (
Figure 1). It has a population of around 810,000, where over 98% is classified as urban. The municipality of Tomé has a high proportion of rural population (12.36%), with towns that are spatially inaccessible to the road networks that connect these settlements with their urban entity.
The PRI is a medium-scale territorial planning of national investment in public works for 2021 for the Biobío region. The transport infrastructure projects considered in the PRI are shown in
Figure 1.
Two scenarios are considered to identify the spillover effects that the expected actions of the PRI in a municipality may produce on the accessibility of the rest of the territory at a time horizon of 10 years (2011–2021). The PRI scenario includes all actions in the highways included in the plan, whereas the hypothetical reference scenario includes all actions expected from the PRI until 2021 (except for the actions in the municipality under analysis, which would maintain the same infrastructure of 2011). In both scenarios, the population was projected up to 2021 to determine the impacts of the transportation infrastructure, if PRI was finished in that year, which increases the potential applicability for planning. The municipality or area of study is represented by a different color since the objective is to measure the effect of its new infrastructure on the accessibility of the rest of the territory.
3.2. Network Data
We have based our accessibility analysis on a GIS which considers the official regional road network under the charge of the Ministry of Public Works (MOP) (1:10,000 scale and updated to 2010), including highways under concession. The networks are surveyed as a linear element, and the towns or centers of economic activity as geo-referenced elements, both with specific properties and attributes. The network data has basic characteristics such as measurements of length for each section, speed limits, and road types. The centers include demographics associated with their population size. Population is the variable selected to measure each destination’s attractiveness in the accessibility model.
The following speeds were determined to obtain optimal routes:
Highways—120 km/h: National highways used mainly for through traffic associated with long-distance travel and therefore designed for high travel speeds. Only motor vehicles specially designed for passenger and freight transportation are authorized on these highways. The use of self-propelled machinery (for agriculture, construction, etc.) is strictly prohibited.
Primary—80 km/h: National or regional highways with medium to high demand, which are used for medium and long-distance through traffic, but also an important percentage of short-distance traffic in highly populated areas.
Local—50 km/h: Provincial or city roads used preferably by neighboring properties. All types of motor vehicles are authorized to travel on these roads.
In development—40 km/h: Connection to isolated zones where the use of both motorized and animal-drawn vehicles is allowed. The objective is to enable permanent transit at low speeds.
Primary network—60 km/h: Public urban roads that connect different urban zones between municipalities. They have a high travel capacity of vehicle flows, mainly public transportation and automobiles, and animal or human-drawn vehicles are prohibited.
Network Analyst extension (ArcGIS) has been used to calculate minimal routes between the centroids of the 138 towns studied in MAC in order to obtain origin–destination travel time matrices. These matrices generated for each scenario contain the travel times of nearly 20,000 interactions. For the estimate of the internal travel time of each town, a linear adjustment is made from the known average travel times for the seven centers of economic activity (CAE) with a population of at least 20,000 inhabitants.
The total travel time between a node and a centroid is calculated as the sum of the travel time through the network between the origin node and the destination centroid and two penalties (in origin and in destination, respectively) according to Gutiérrez et al. (2007) [
34]:
where:
is the total travel time between the origin node i and the destination centroid j.
is half of the internal time of the zone where node i is located.
is the minimum travel time through the network between the node i and the centroid j.
is half of the internal time of the zone j.
These travel times were used to calculate the accessibility indicators selected in this study (for real and ideal times). The accessibility values for each town are interpolated by raster surface using the deterministic method for spatial interpolation, Inverse Distance Weighted (IDW), which generates a regular matrix where each cell contains the weighted average value of distance values of the six closest points to the location of the cell [
43].
3.3. Accessibility Indicators
Two different formulations of accessibility indicators have been selected, related to different approaches to the concept of accessibility: The locational indicator, more strongly influenced by the geographic position of each location, and the network efficiency indicator, which is more infrastructure oriented.
The locational indicator [
29,
32,
33] is sensitive to the geographic location of population centers and is measured in travel time units, assigning the same weight to long and short distances. This indicator presents the average of impedance (restrictions) that separates each town from the different centers of economic activity through the network (by the road of minimal impedance), considering their income as the weighting factor, which in this case represents the number of inhabitants of the economic activity center of destination:
where
Li is the locational accessibility of the node
i;
Iij is the impedance, defined as the travel time on the minimal route through the network between the origin node
i and the destination node
j; and
Pj is the population of destination
j.
On the other hand, the network efficiency indicator neutralizes the effect of geographic location to emphasize the effects of the infrastructure offer on accessibility. However, this indicator measures the degree of efficiency of the network through the calculation of the relation between real impedance and ideal impedance between the origin and the destination node. In a high-quality infrastructure (in travel time and cost), this could be represented by a straight line, considering the population weighting factor of the destination node.
In order to neutralize the effect of geographic location of the nodes and to emphasize the effect of infrastructure, the usual notion is substituted by another that expresses the ease of access in relative terms to measure the traveling efficiency in relation to the quality of available infrastructure. The network efficiency indicator relates the real access of time with the ideal access of time to obtain that effect. A network efficiency indicator with a gravitational component was selected [
7,
29,
44]. This indicator (
Ei) relates the real time access (
Rij) to the ideal (
Iij) for this purpose [
44] in accordance with to Equation (3):
where
Rij is the network impedance between each origin and destination, calculated according to the shortest travel time route between the two points;
Iij is the Euclidean impedance, defined as the travel time in a straight line between the origin node
i and the destination node
j; each of the
i–j ratios is weighted through
Wij, defined as the ratio between the destination population (
Pj) and the travel time between
i and
j, according to the Equation (4):
where
Wij is the relative weight of destination
j for the origin
i;
Pj is the population of the destination defined in Equation (2); and the term
Rij is already known.
For this network efficiency indicator, the Euclidean impedance (
Iij) between any two nodes is the estimated travel time through a hypothetical straight-line non-congested motorway connection. Additionally, a penalty for entering and leaving the origin and destination was calculated (see Equation (1)), equivalent to half the internal travel time of each town. This is a critical issue in the calculation of the potential market indicator (
Pj/Rij) since the internal accessibility can represent an important part of the total potential market of the zone [
45]. This relation, shown in Equation (4), can be interpreted as the accessibility of opportunities from a node
i to all other nodes
j in which smaller and/or more distant opportunities provide diminishing influences; therefore, the level of opportunities between a place
i and a destination node
j is positively related to the mass of the destination and inversely proportional to the distance or travel time between both nodes [
6,
45].
The indicator gives a value in meaningful units: How much network impedance surpasses Euclidean impedance. The results are on an inverse scale: The lower the value attained, the more accessible the place is in relative terms. Thus, when the infrastructure connecting the nodes to the various economic activity centers is highly efficient (that is, relatively straight and high speed), nodes receive an accessibility value which tends towards 1. A value equal to 2 means that the network impedance is double the Euclidean value and so forth [
44].
The results of the locational and network efficiency indicators are obtained for the ex-ante and ex-post PRI scenario to calculate the difference between the two. This difference represents the contribution of the expected actions to the MAC in terms of accessibility of the towns using both indicators. The change or relative improvements (
) are produced in terms of percentages by the following equation:
where
indicates the accessibility in the reference scenario (ex-ante), and
the accessibility in the final scenario (ex-post).
3.4. Calculation of Spillover Effects
In order to measure the spillover effects for each municipality, accessibility values are computed by comparing the following scenarios: First, the PRI 2021 scenario, and second, the scenario that includes the foreseen improvements for the year 2021 in the entire territory except for the municipality whose spillover effects are being analyzed. The differences between these two scenarios (PRI 2021 and hypothetical scenario) represent the spatial spillover effects of region
i on the rest of the regions. This procedure is repeated for each MAC municipality to calculate a matrix of interregional spillover effects. According to the previous notion, this is reflected in the following equation:
where
is the spillover effects from the investment in municipality
i;
is different for each municipality and represents the year 2021, except in the case of the municipality under analysis (hypothetical scenario); and
represents the year 2021, as the expected completion date for all network infrastructures included in the plan (PRI scenario).
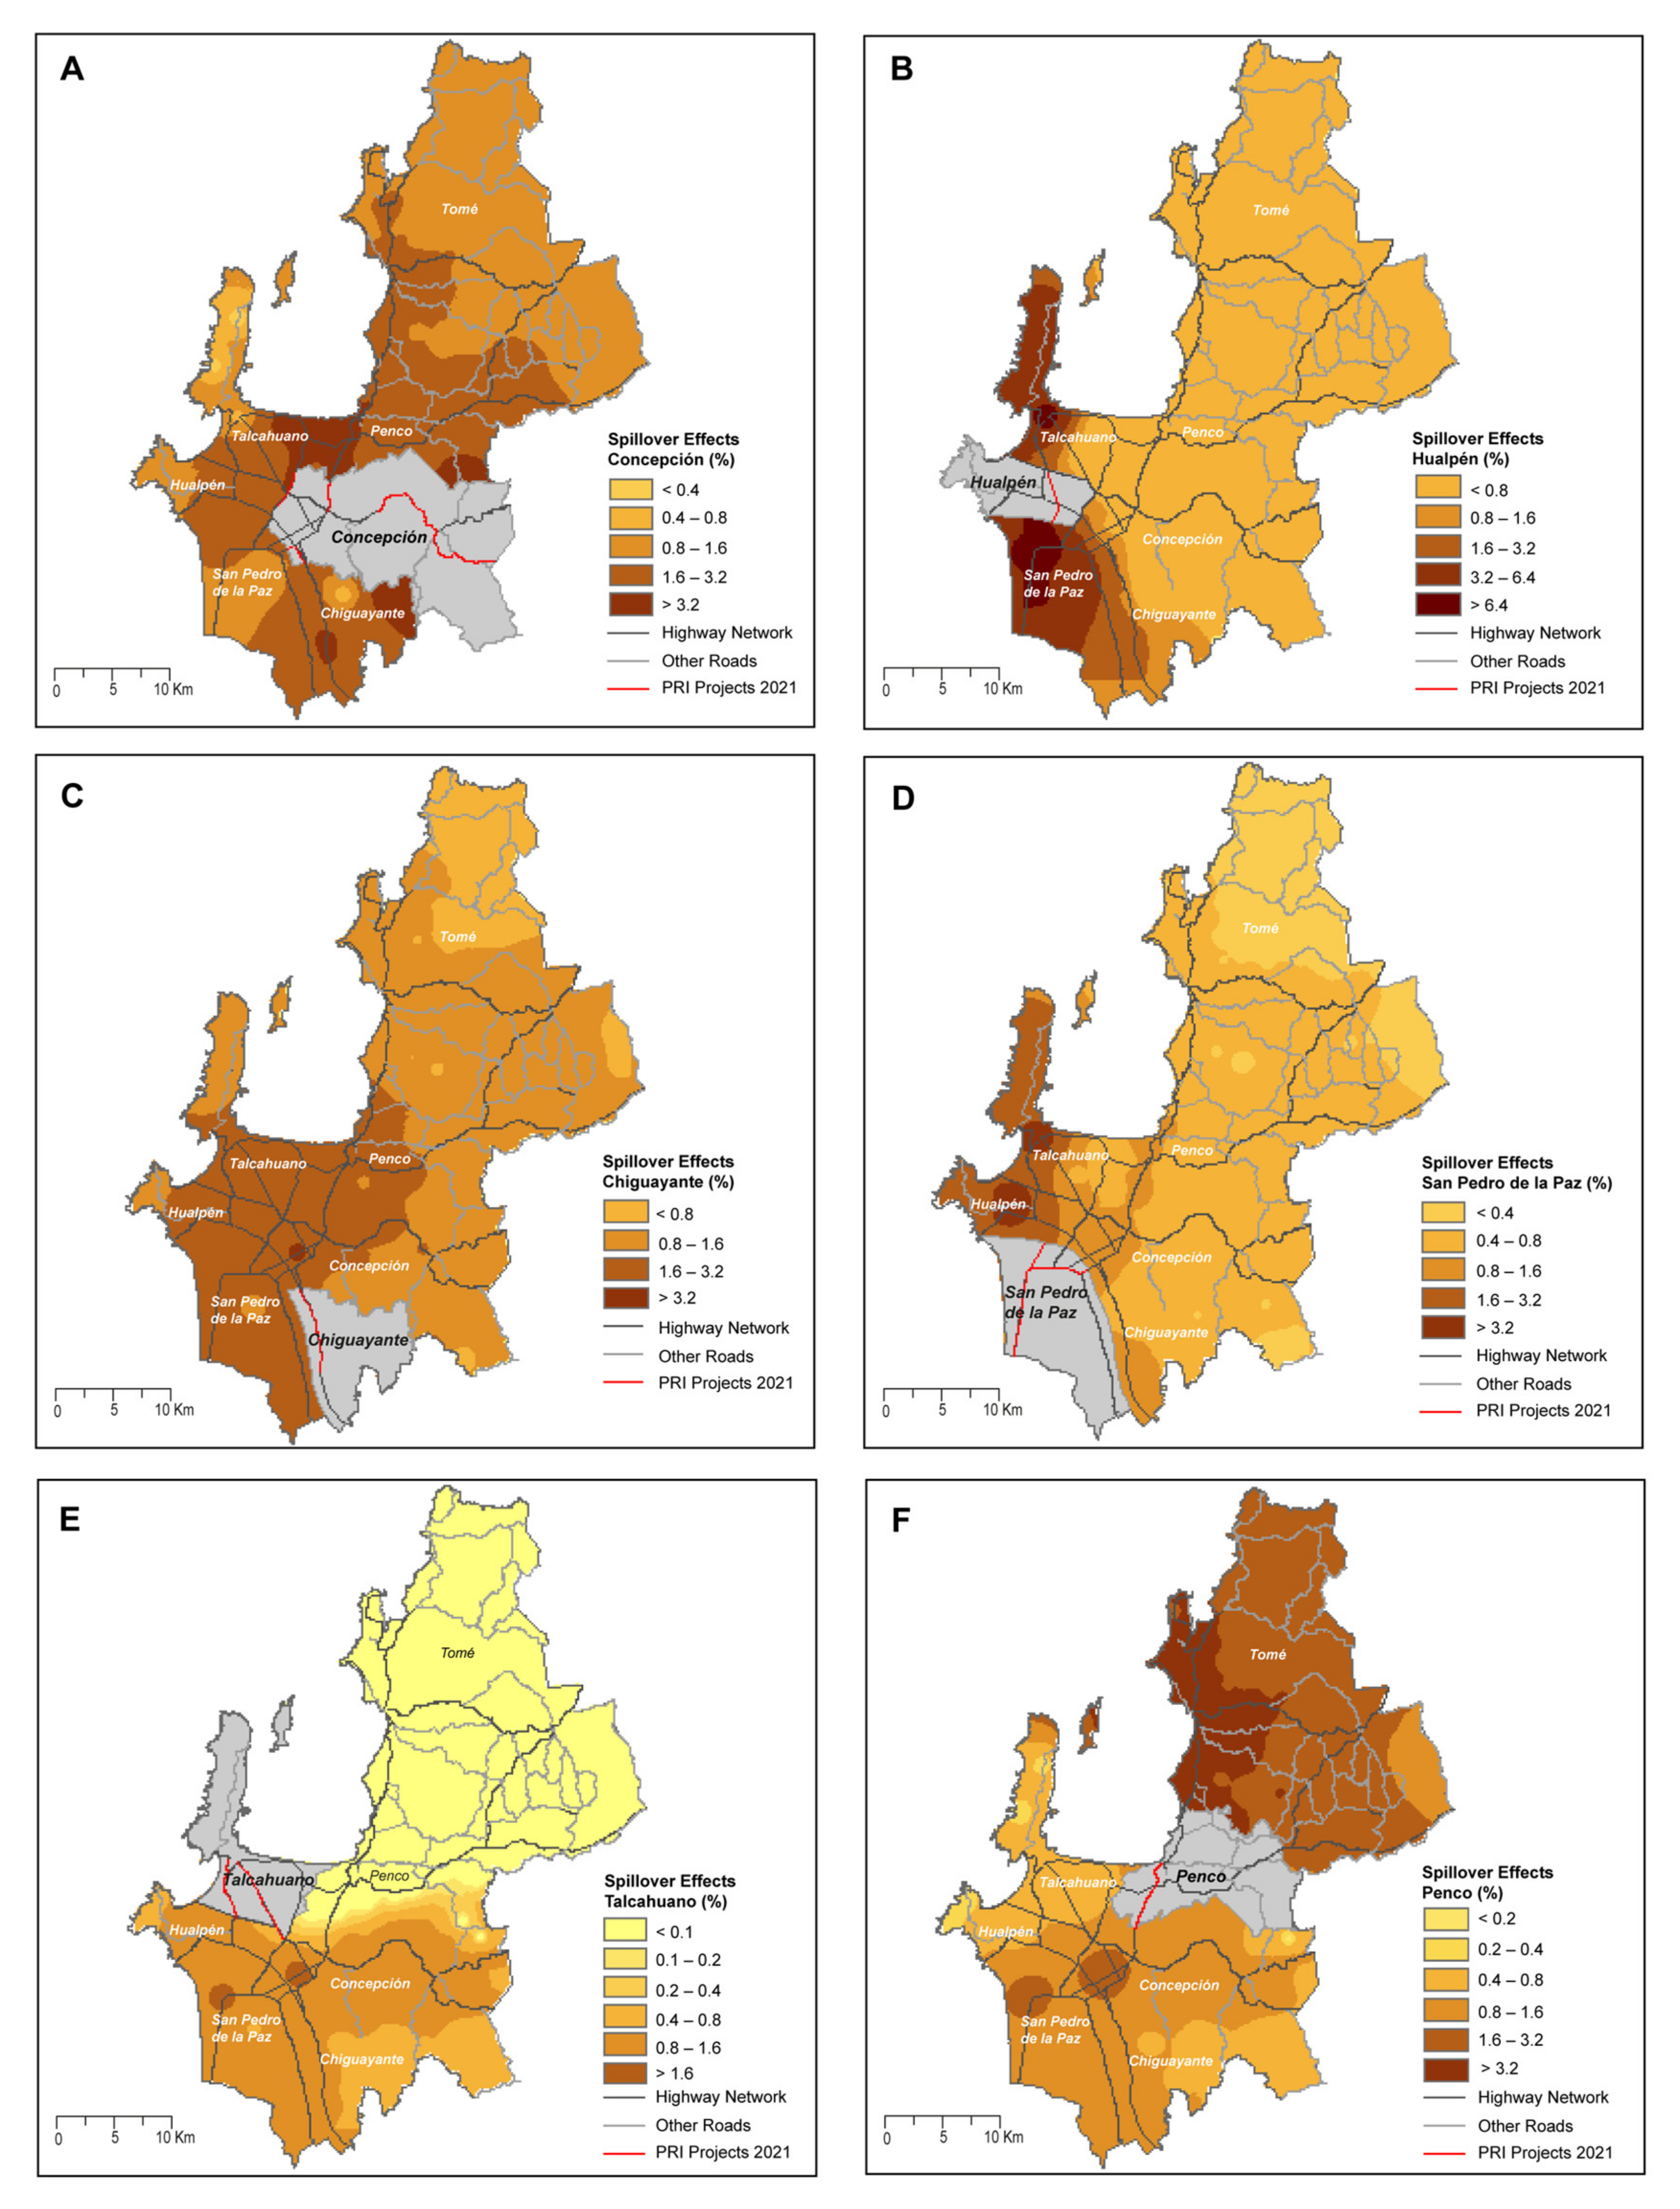
The spillover effects are calculated for each municipality within the MAC, except for Tomé, which does not receive infrastructure investment in the plan. This analysis requires the construction of six scenarios, calculating the differences between the PRI and the hypothetical scenarios for each municipality. This difference represents the contribution to accessibility that a municipality generates for the others; in other words, the spillover effect of expected actions in that municipality [
14].
3.5. Territorial Cohesion and Dispersion Indexes of Accessibility Values
The methodology to assess territorial cohesion involves an analysis of changes in the territorial distribution of the accessibility levels through the calculation of dispersion measurements [
1,
13,
29,
34]. In particular, the accessibility distribution is compared before and after the investment by analyzing the changes in the different scenarios of study. There is a wide variety of inequality indexes to characterize the dispersion levels of a given variable. The choice of these indexes has an influence on the final results. The most common indexes are variation coefficient, Gini coefficient, Atkinson index, and Theil index [
1].
In relation to the methodology, it is essential to evaluate whether and to which extent implementing new infrastructure increases or reduces the indicator of territorial cohesion, depending on accessibility disparities. This requires evaluating territorial cohesion through the methodological application of dispersion measurements to analyze the distribution of accessibility values and selecting statistical indexes to characterize the dispersion levels of a given variable.
Territorial cohesion is evaluated for the ex-ante and ex-post PRI scenarios, considering that, if the values in the future scenario are reduced, the accessibility levels would be less unequal as a result of the effects generated by implementation of the PRI. This would also imply an improvement in territorial cohesion and a positive percentage of change between both scenarios. On the contrary, if values in the future scenario are increased, the accessibility levels would show a wider disparity, which would reduce territorial cohesion, implying a negative percentage of change between the two scenarios. The percentage of change or improvement is obtained from Equation (2) in the case of the reference (2011) and final (2021) scenarios, considering the values of statistical indexes of variation coefficient, GINI index, and Theil index, calculated for the locational and network efficiency accessibility indicators.
In the interpretation of accessibility improvements derived from the investment in transportation infrastructure, there is a spatial relationship indicating that these are especially important in peripheral regions, characterized by low population densities, high unemployment rates, weak industrial development, and poor quality and endowment of transportation infrastructure [
46].
5. Discussion
Transport planning needs to improve on the territorial evaluation of its impact, as now transport investments can differ by location, population density, and settlement structure [
47]. This study contributes to the limited current criteria of infrastructure transport planning with a geographic vision towards Chile, which allow us to observe the extent of accessibility improvements on neighboring territories in relation to the transportation infrastructure investment in other regions. The spillover effects have deep political and planning implications for the construction of infrastructure, since they facilitate the assessment of accessibility levels before and after the implementation of a transport plan. In addition, an analysis of these results from the cohesion perspective overcomes the locally focused vision of demand for new structures and improves the decision-making process regarding the geographical distribution of investments in a transport plan.
Methodologically speaking, the choice of a non-gravitational indicator, such as the location indicator, helps identify improvements of a larger spatial scope. However, this indicator is limited, since it does not reflect the real behavior of travel, as near and far destinations are weighted equally. Moreover, vehicle speed used in the network modeling due to the increase in motorization is limited. Transport investment is related to induced demand [
48], where automobile congestion increases and reduces the capacity of transport infrastructure; therefore, the evaluated plan is metropolitan-scale and composed of several rural settlements where congestion is not relevant for spillover effects. However, the estimate for the main centers (Concepción and Talcahuano) represents a significant challenge, where it is also important to promote non-motorized transport methods. Due to the scarce transport data modeling in Latin American cities, to resolve this limitation, researchers could include online data from Google Maps API to estimate travel times in future studies as suggested for Brazilian cities [
49]. This would require a thorough interpretation of results since it studies the strategic relations between territories but does not represent induced travels.
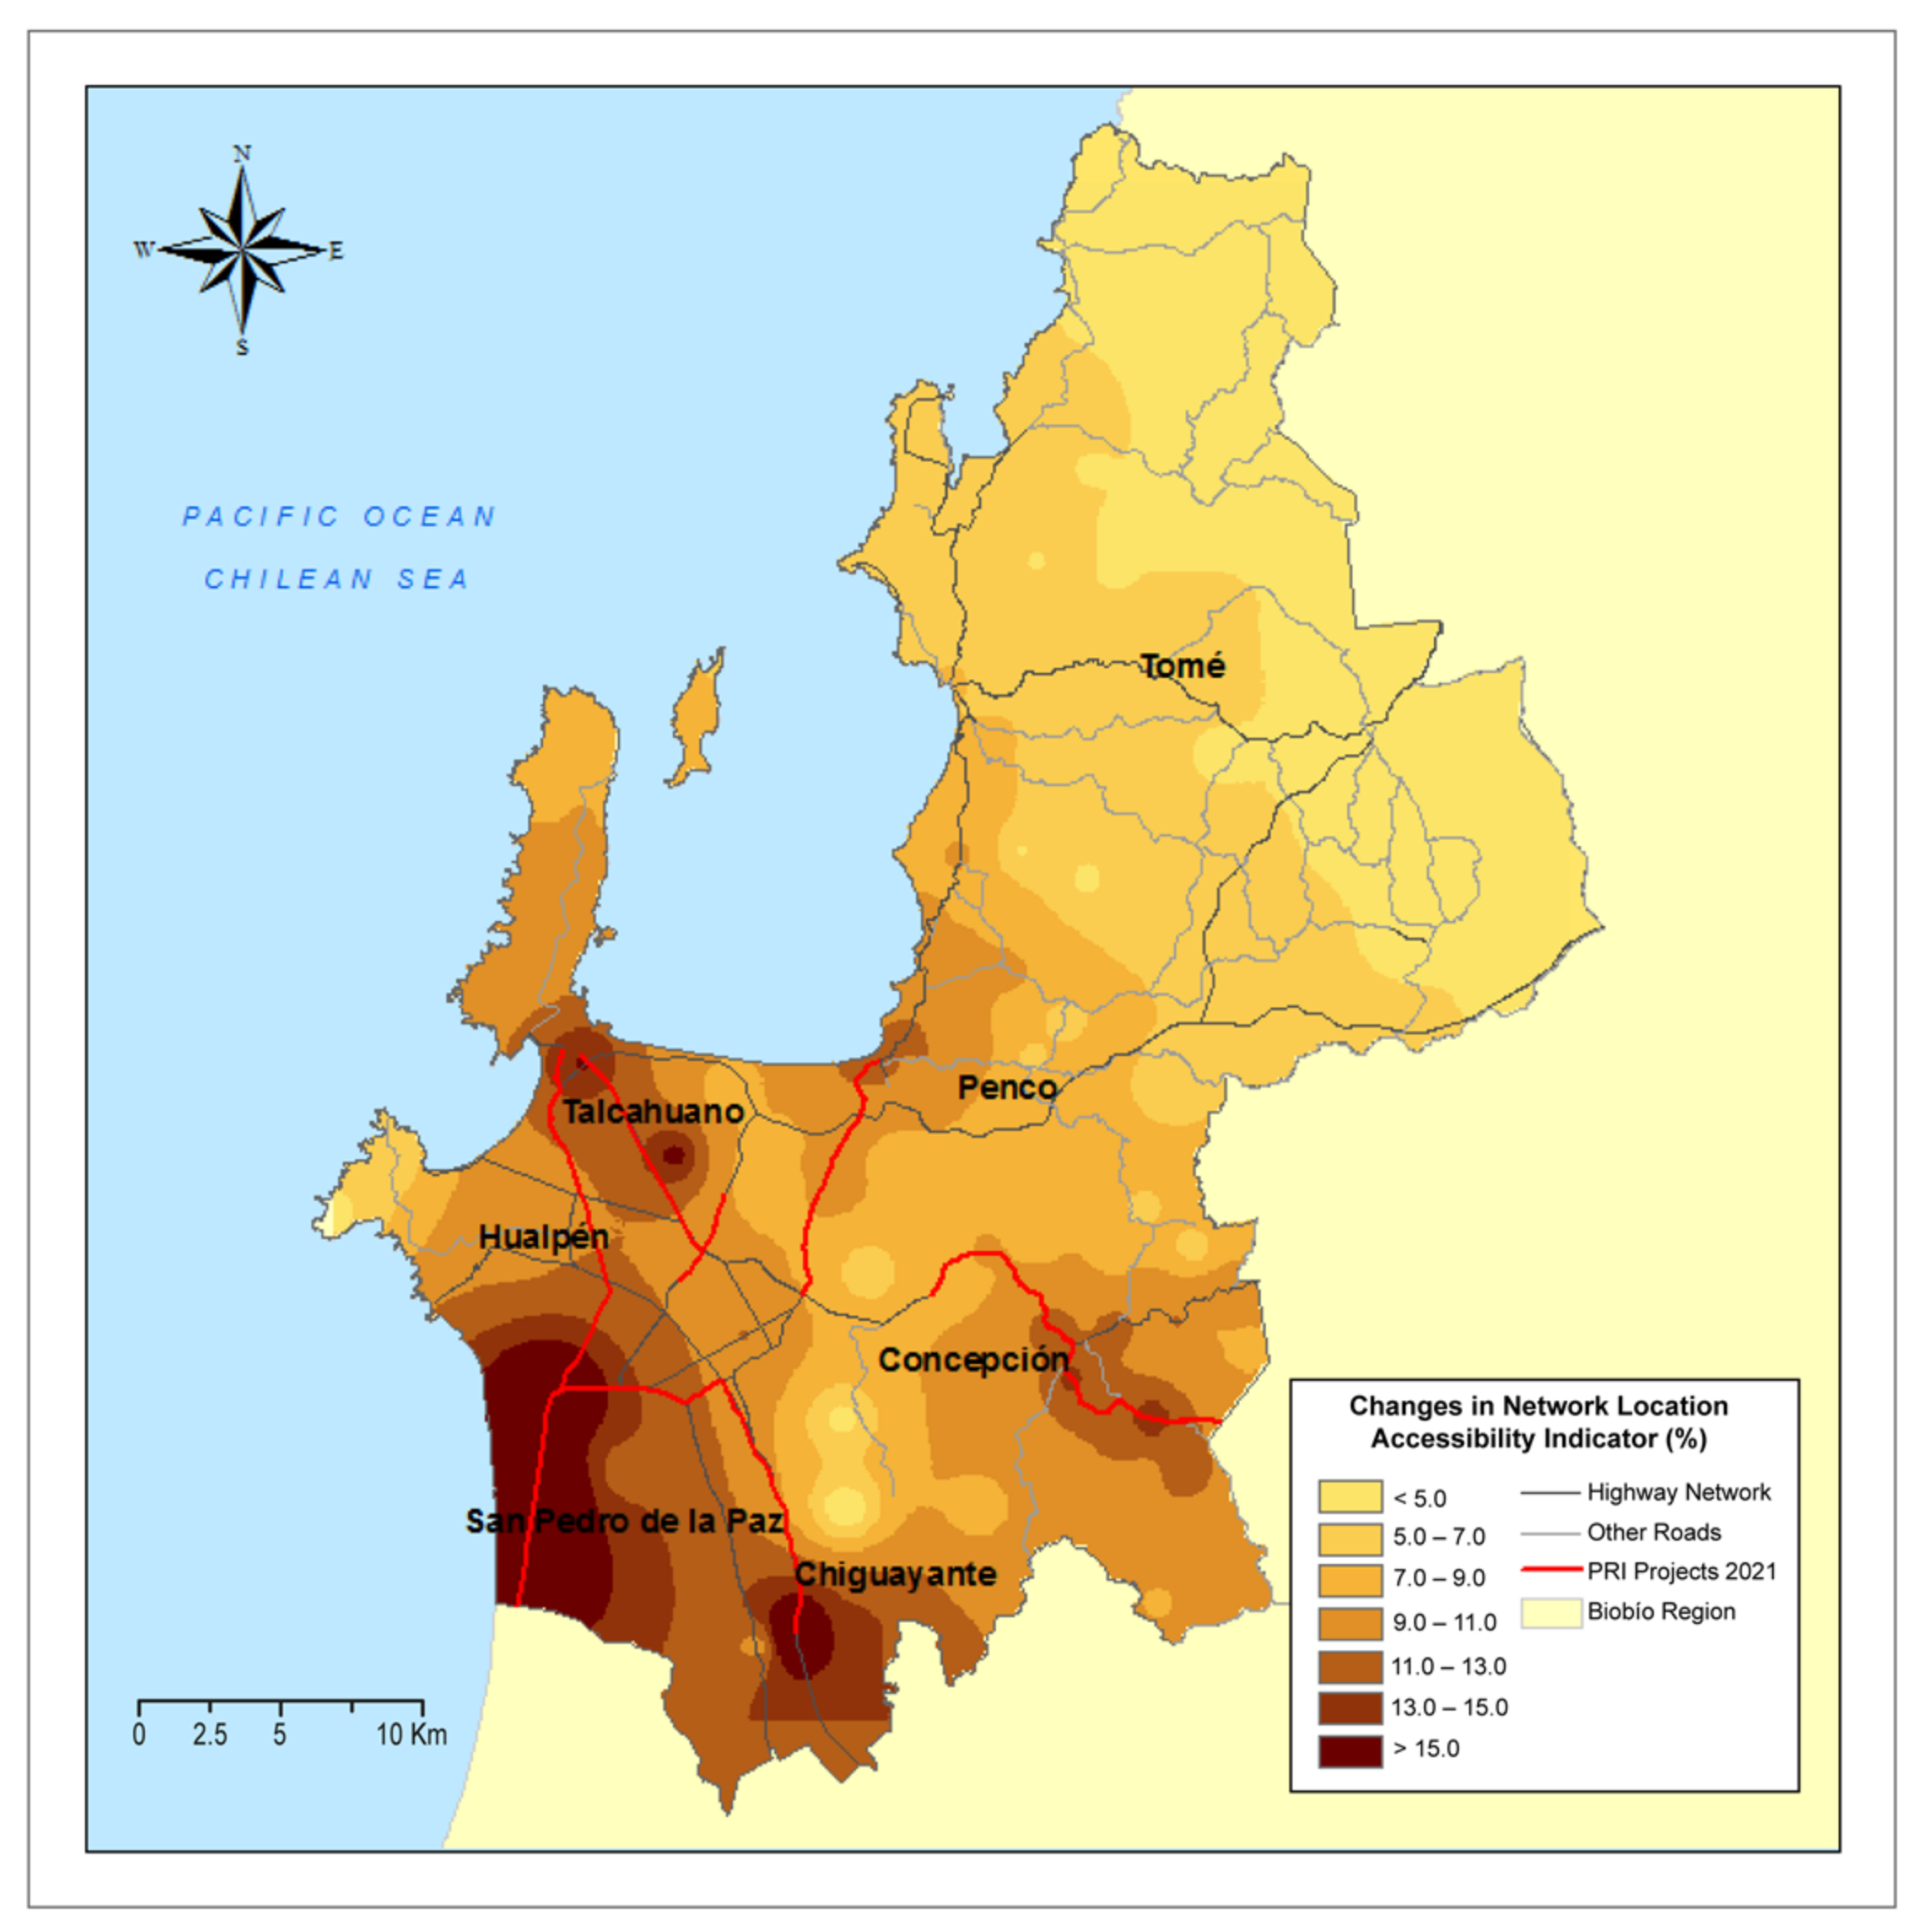
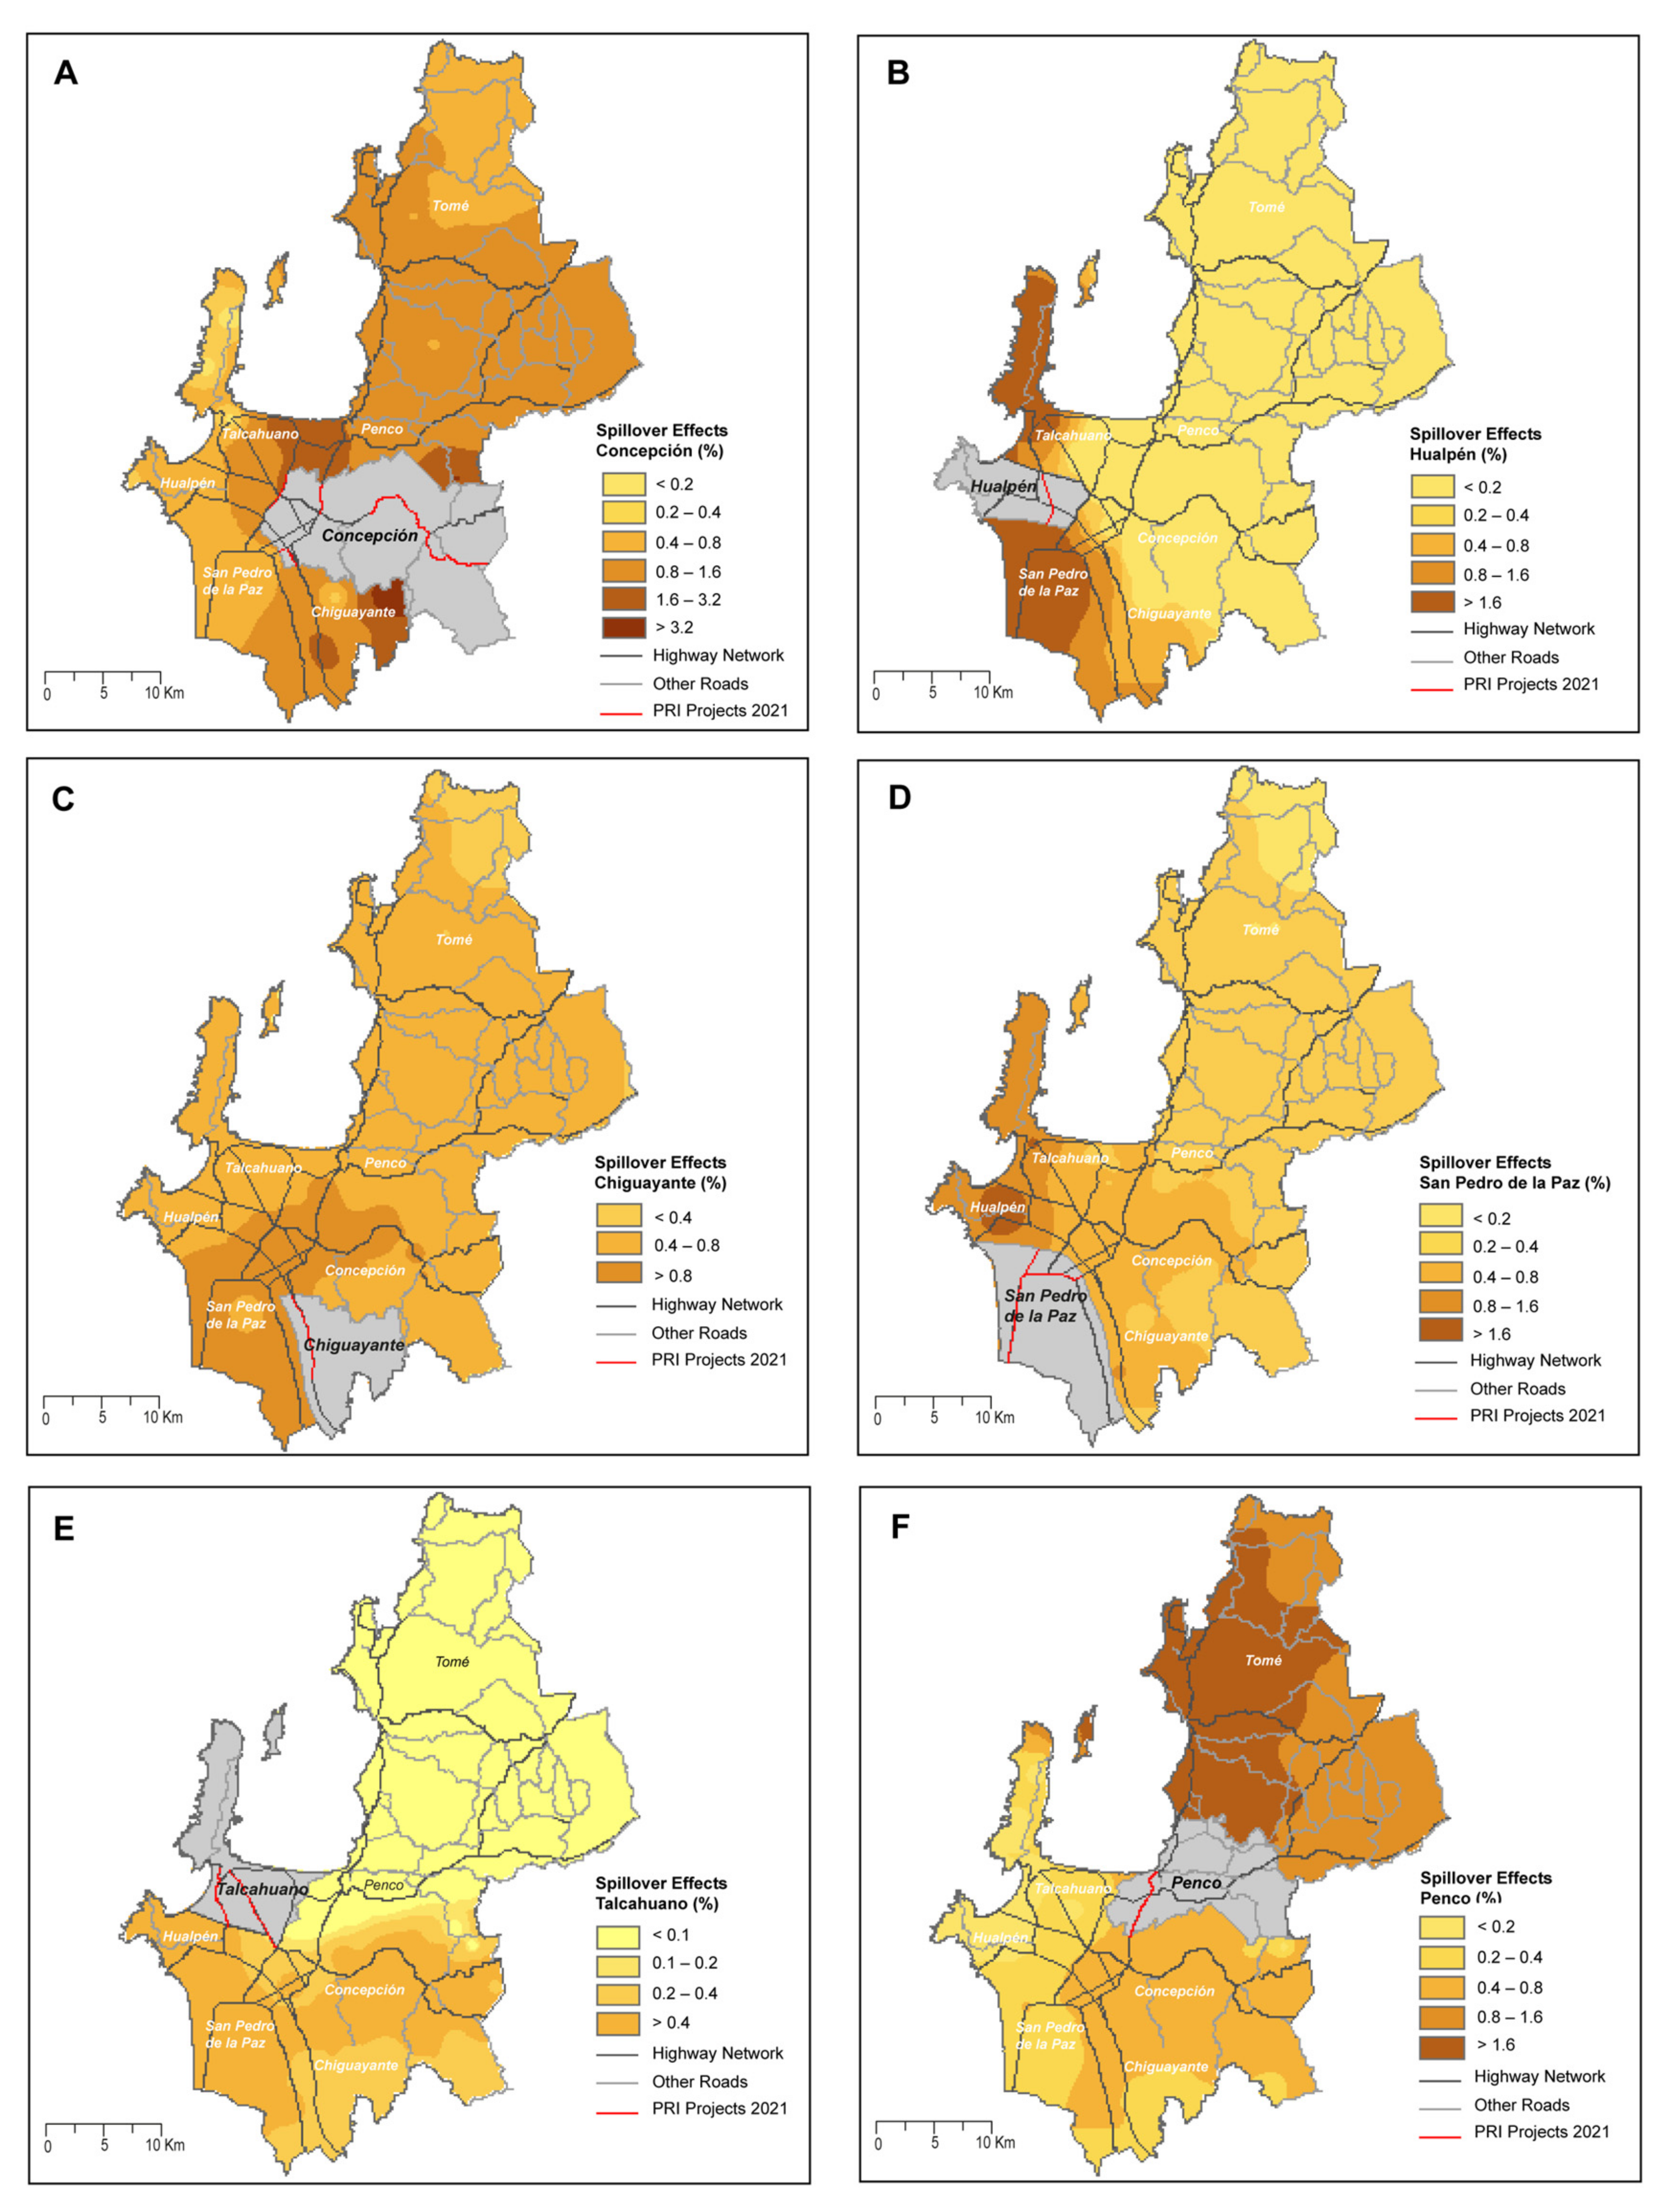
The results of the locational indicator suggest two areas considerably benefited from the expected investment in road infrastructure: first, San Pedro de la Paz, which benefits from most of the projects expected in the PRI, in terms of time savings in minutes and percentage improvements in both assessment scenarios. Territorially speaking, this outcome is not unexpected, because the investments are generally concentrated in centers with high populations and economic activities. In fact, San Pedro de la Paz is a municipality that has concentrated the recent residential urban growth and sprawl and motorization, which also concentrates residential choice for medium and low-density households, considerably increasing the land price and the accessibility demand to favorably reach the opportunities offered in Concepción and Talcahuano, particularly in employment, studies, and services. To verify the residential location with the best performance of the locational indicator, qualitative data on mobility choices should be included from household surveys to support transport planning [
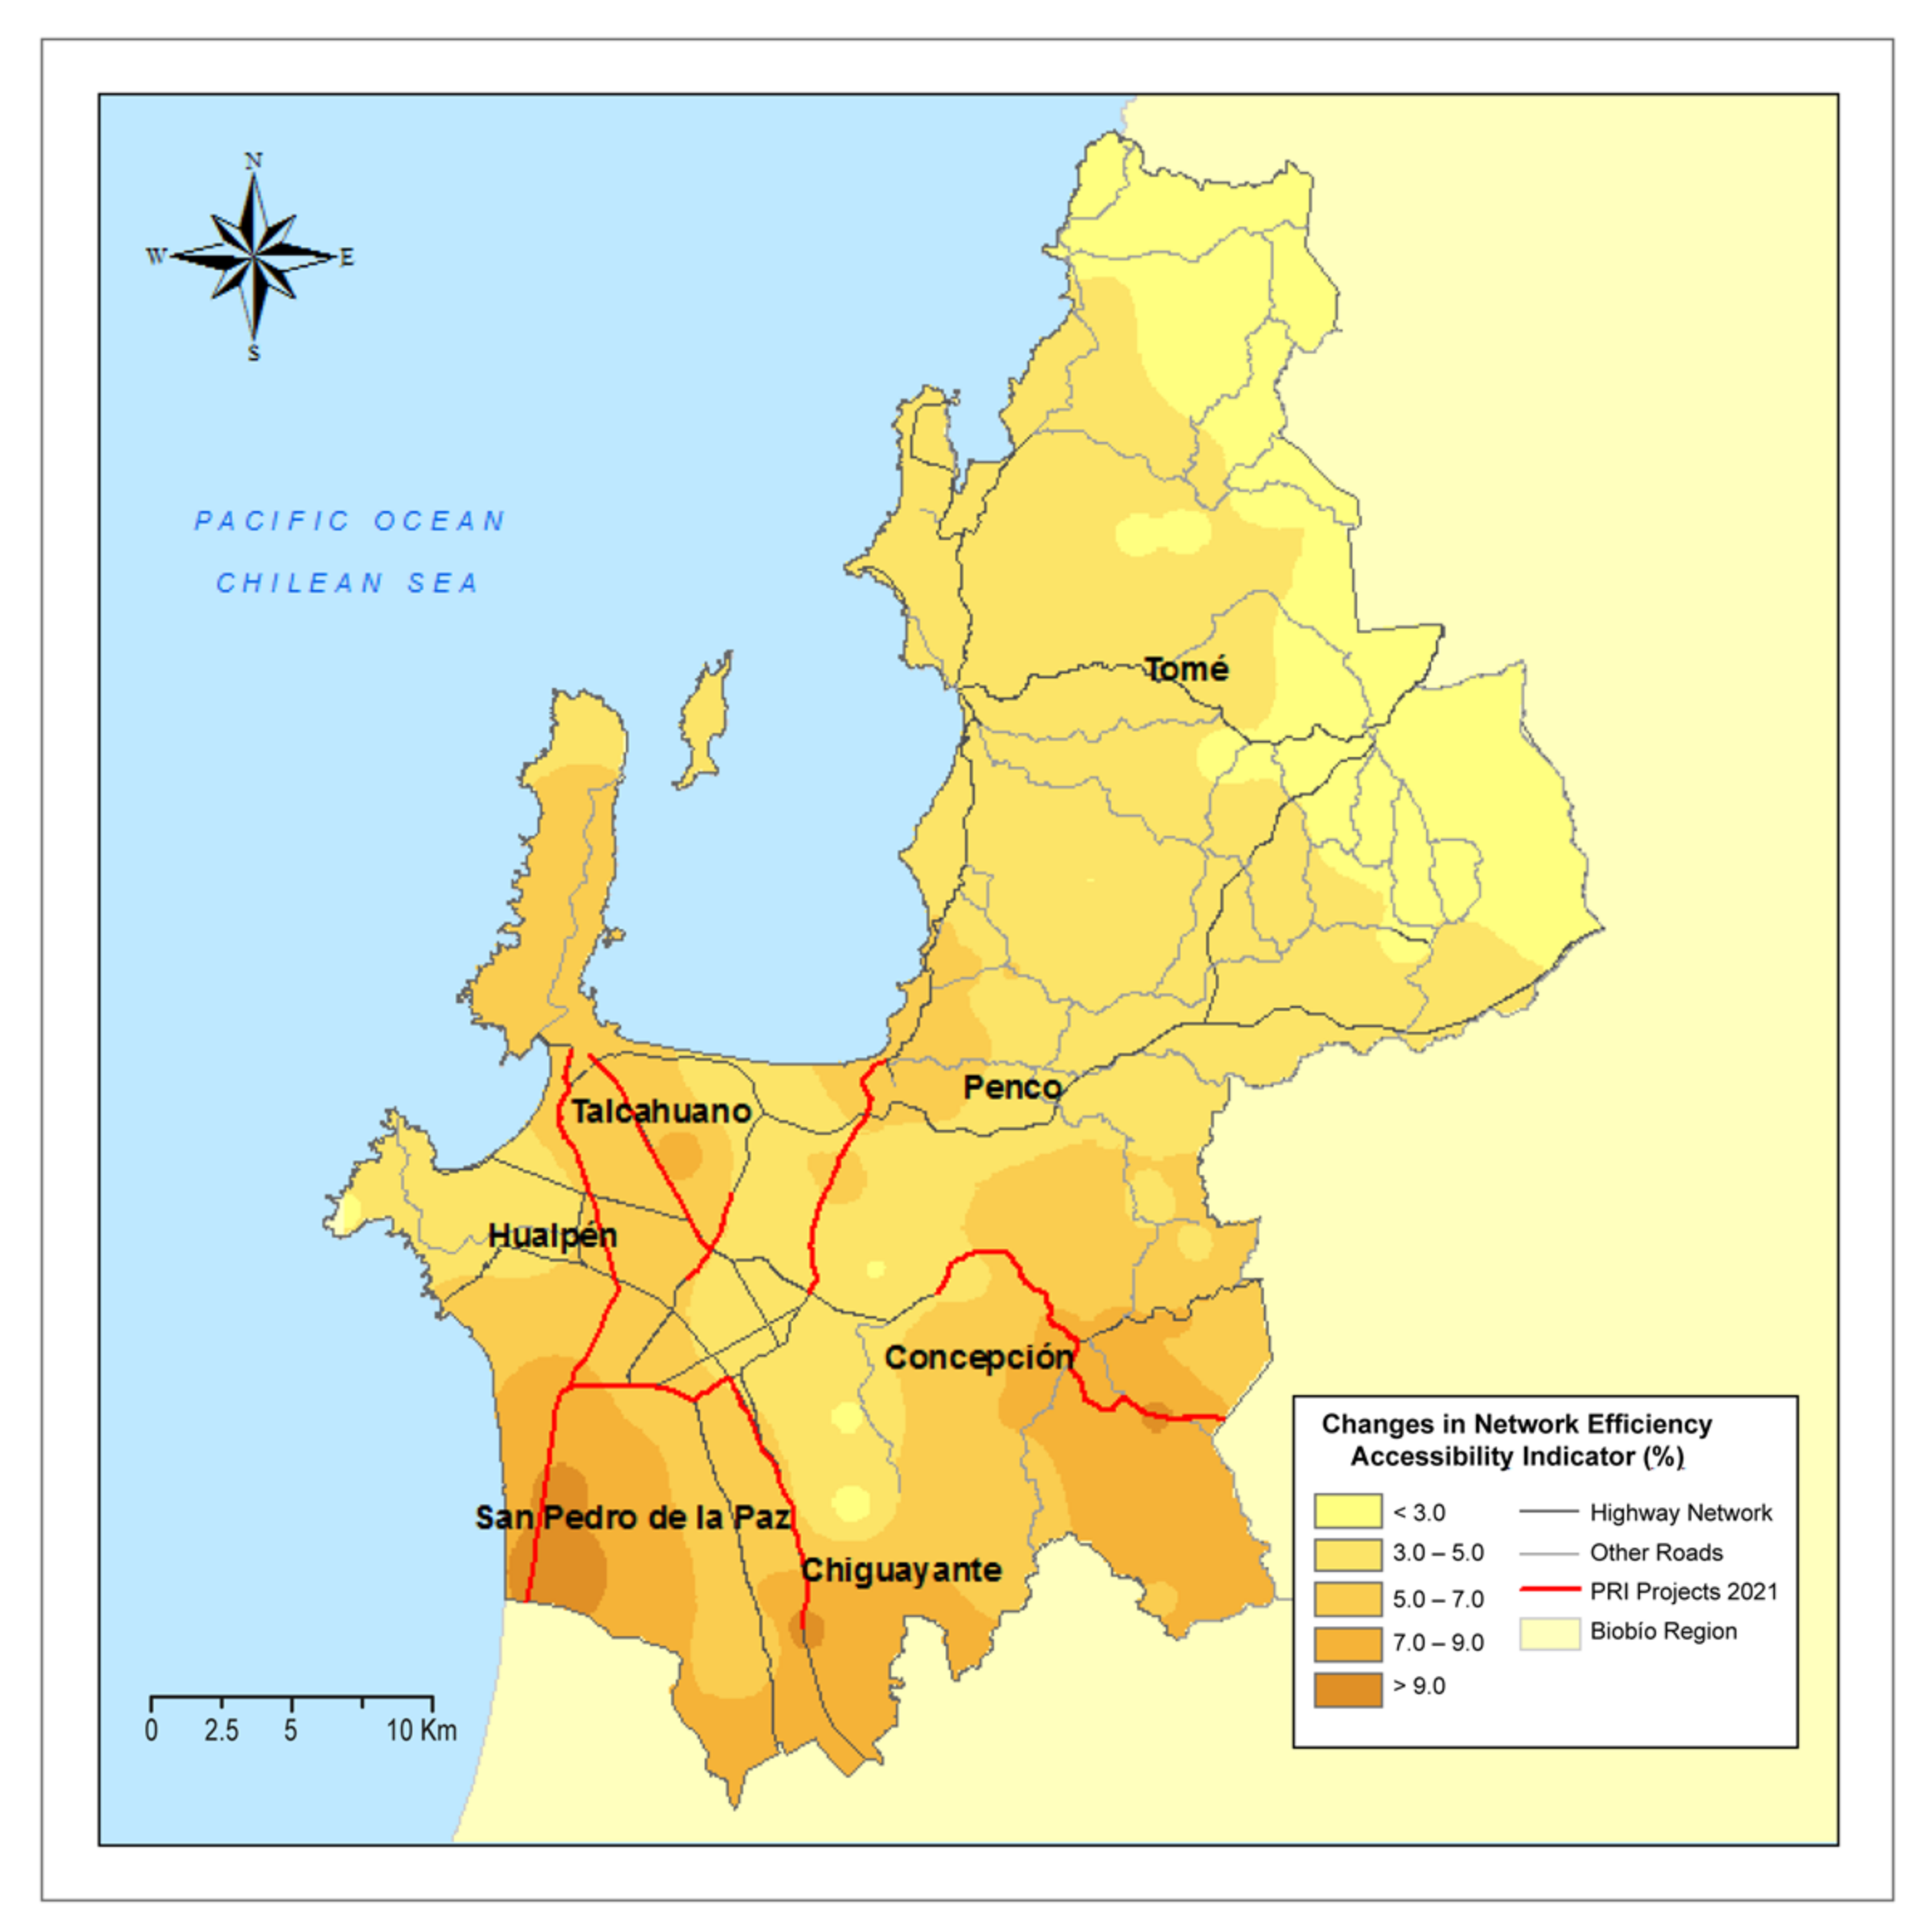
50]. Second, with a potentially positive territorial impact, the benefits to the rural towns around Concepción have been verified as a result of the considered improvements to the Concepción–Cabrero route, which connects with the country’s main interstate. On the other hand, the efficiency indicator shows the benefits that the urban center or port city of Talcahuano will have with the interaction of Ruta 150. High accessibility levels are directly related to an increase in maximum speeds limits on roads, which is the case for all the projects in the PRI.
The spillover effects—measured through the location and efficiency indicators—showed that positive benefits on accessibility are not only located in the territory of investment, but also extend to other towns. The locational indicator generated higher positive effects than the efficiency indicator. Hualpén is the municipality with more spillovers from the construction of the North Access to the Industrial Bridge since the ex-post scenario shows an improvement in the accessibility indexes of this zone, especially for the construction of the Costanera Norte in Chiguayante and the South Access to the Industrial Bridge from the Ruta 160, which reduces minimal access times and, therefore, reduces the distance between real impedance and ideal impedance (Euclidean distance).
Nevertheless, the effects of the infrastructure in Talcahuano are low in both indicators, especially for the towns of Tomé and Penco to the north. In general, Tomé received very low spillovers and, for this reason, was the municipality least benefited by the road project considered in the PRI.
According to the results, we agree that the analysis of the spillover effects can produce very valuable information on the real beneficiaries of the investments in transportation infrastructure [
34]. This aspect is particularly difficult to measure considering the region as a closed system—in the theoretical model—and in a closed isolated transportation system, where connections and communications are analyzed separately to identify their internal operation.
The assessment of territorial cohesion allows us to conclude that the territorial impacts derived from the development of transportation infrastructure in the MAC (for the 2011–2021 period) present a dual behavior according to the accessibility indicator. On the one hand, the disparities of the accessibility values in the network efficiency indicator are reduced, which increases territorial cohesion and, therefore, reveals a more equitable distribution of the territory. On the other hand, the locational indicator suggests that disparities increased and territorial cohesion or equity was reduced, which confirms the benefit of the location of the new network projects. However, territorial cohesion must be thoughtfully measured since there may be numerous biases in the process.
Three sources of possible bias can be identified. First, the selection of the cohesion index is relevant; depending on the index, the conclusions can be rather different and even opposing. Second, the selection of the accessibility indicator may influence the results; in relation to the two indicators in this study, the location indicator tends to show a less equitable distribution of accessibility indexes than the network efficiency indicator. Third, the geographic scale could play a decisive role, since the results may differ depending on the geographic limits established in the study.


