Article

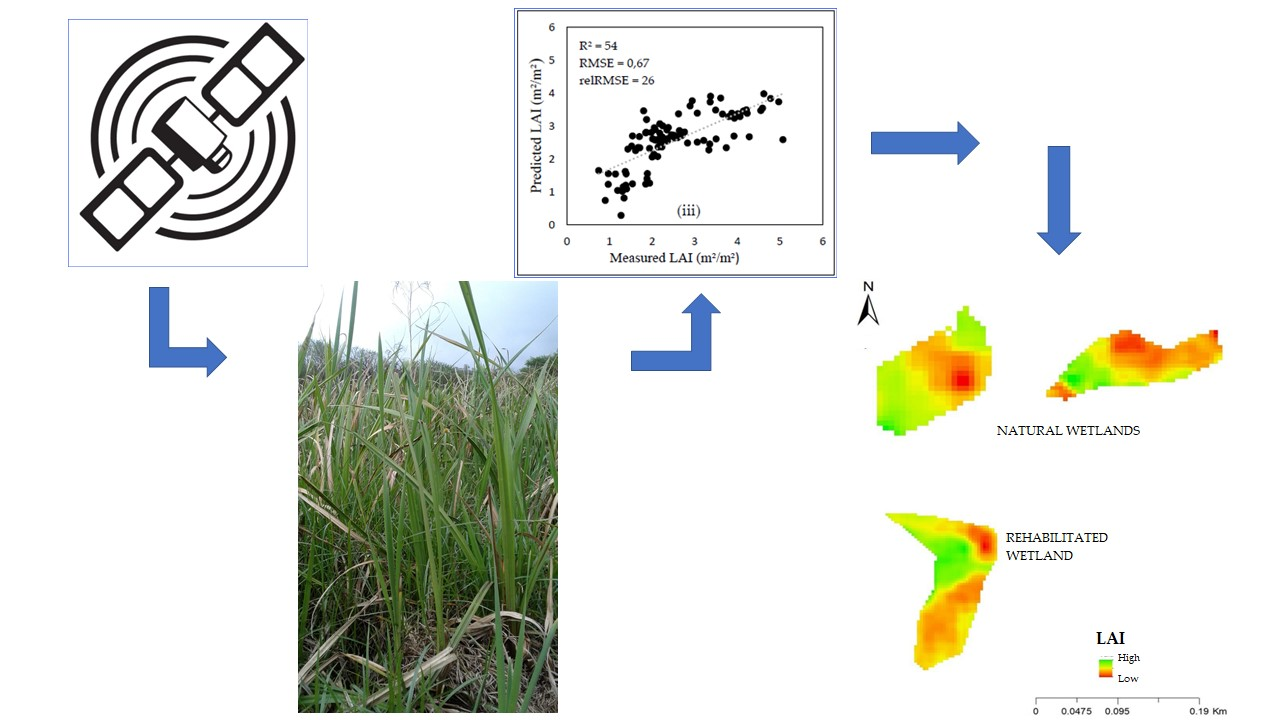
The Utility of Sentinel-2 MSI Data to Estimate Wetland Vegetation Leaf Area Index in Natural and Rehabilitated Wetlands

by
Nonjabulo Neliswa Tshabalala
1,
Onisimo Mutanga
1 and
Mbulisi Sibanda
2,*
1
Discipline of Geography and Environmental Science, School of Agricultural Earth and Environmental Sciences, Pitermaritzburg Camous, University of KwaZulu-Natal, Private Bag X01, Scottsville, Pietermaritzburg 3209, South Africa
2
Department of Geography, Environmental Studies and Tourism, Faculty of Arts, University of the Western Cape, Private Bag X17, Bellville 7535, South Africa
*
Author to whom correspondence should be addressed.
Submission received: 5 August 2021 / Revised: 30 September 2021 / Accepted: 10 October 2021 / Published: 16 October 2021
(This article belongs to the Special Issue Early Career Scientists’ (ECS) Contributions to Geographies)

Abstract

:
Wetland ecosystems are being modified and threatened due to anthropogenic activities and climate change, hence the urgent need for wetland restoration. Wetland rehabilitation is important in the reversal of these dire conditions, and this can be pursued through restoring damaged wetland ecosystems and recovering wetland vegetation. Wetland biophysical properties such as leaf area index (LAI) are important indicators of vegetation productivity and stress. Therefore, the study sought to test the potential of Sentinel-2 multispectral instrument (MSI) derived standard bands, traditional vegetation indices and red-edge derived vegetation indices in estimating wetland vegetation LAI across natural and rehabilitated wetlands. Traditional field surveys were carried out for LAI measurement of wetland vegetation using the LAI-2200 Plant Canopy Analyser. Partial Least Squares Regression (PLSR) algorithms were used to compare the estimation strength of models derived from all Sentinel-2 MSI bands, conventional vegetation indices and red-edge derived vegetation indices. Leave-one-out cross-validation (LOOCV) was completed on a selected measured dataset to evaluate the performance and accuracy of the estimation models. The optimal models for estimating wetland vegetation LAI were produced based on red-edge bands centred between the 705–783 nm as well as the 865 nm (Band 8a) of the electromagnetic spectrum. The results showed that vegetation indices derived from red-edge bands performed better at estimating LAI for both wetlands with a root mean square error of prediction (RMSE) of 0.32 m2/m2 and R2 of 0.61 for the natural wetland, and RMSE of 0.51 m2/m2 and R2 of 0.75 for the rehabilitated wetland. The optimal model for predicting LAI across natural and rehabilitated wetlands was attained based on red-edge bands centred at 705 nm (Band 5), 740 nm (Band 6), 783 nm (Band 7) as well as 865 nm (Band 8a) yielding a RMSE of 0.51 m2/m2 and R2 of 0.54. Overall, the results underscore the importance of remotely sensed derived data and vegetation indices in the optimal characterisation of wetland vegetation productivity which can be utilized in the monitoring and management of wetland ecosystems.

Graphical Abstract

1. Introduction

Wetlands are important ecosystems and play a significant role in regulating the health of the environment [1,2]. Wetlands are responsible for maintaining environmental quality, micro-climate stabilisation, flood control, water infiltration and biodiversity support [1,3,4,5]. They provide an interface for terrestrial and wetland species interaction [2,6]. Furthermore, wetlands have been providing an array of social and economic benefits for centuries [7]. However, wetlands are continuously being degraded in terms of their ecosystem services, diversity and spatial extent by chiefly anthropogenic activities such as urbanization, agriculture and sand mining, and the effects of climate change and invasive species [8]. Invasive alien plant infestation also affects wetland functionality, as they reduce the amount of water that is available for the wetland through their voluminous intakes. Alien invasive plants compete with the natural indigenous wetland vegetation for water, therefore decreasing the ability of these plants to perform their function in the wetland ecosystem. Hopkins et al. [9], state that wetland degradation or loss could increase the net global carbon dioxide in the atmosphere, by up to 6% per year. This challenge is compounded by the fact that currently there is a dearth of comprehensive frameworks and objective criteria for monitoring the health of these wetlands. In this regard, even after restoring the degraded wetland ecosystems, it is still difficult to monitor and assess their health improvement. Recent studies on wetland restoration have highlighted the importance of restoring degraded wetlands and the importance of monitoring and maintaining these wetlands [10,11,12].
Wetland functionality and health monitoring have proven to be complex tasks due to the complexity of these ecosystems. This is a result of limited wetland data that can be used to assess restored wetlands over a period of time [10,11]. However, there has been an increase in studies exploring different methods that can be used to assess the ecological attributes of restored wetlands [12]. According to Eviner et al. [11] and Wortley et al. [11], vegetation characteristics such as LAI, biomass and vegetation height, as well as wetland ecological processes, can be used to measure wetland functionality. In practice, wetland vegetation is the most common indicator of wetland rehabilitation success or failure and therefore can serve as a health index of these ecosystems. This is because wetland degradation is directly reflected in the decreased productivity and even mortality of wetland vegetation. Therefore, vegetation’s biophysical properties such as leaf area index, biomass, chlorophyll and water content can be used as the main indicators of vegetation health and productivity in wetland ecosystems [8,13,14]. Currently, there is no standardised method for monitoring and assessing the ecological attributes of wetlands, hence the necessity to explore and develop detailed and accurate methods for wetland assessment.
Remote sensing techniques are frequently used to map and monitor plant species distribution, quality and quantity as a sustainable management method for wetlands [15,16]. This is because traditional wetland monitoring methods such as manual species discrimination and taxonomical information are highly labour intensive, overpriced and time-consuming. Furthermore, some of these methods cannot be applied in larger areas. Meanwhile, remote sensing techniques offer time and cost-effective means of estimating wetland vegetation biophysical parameters [15]. Leaf area index (LAI) is one of the commonly used vegetation biophysical properties in measuring vegetation health and functionality. It is an indicator of ecological processes, such as photosynthesis, plant and soil respiration, net primary productivity and energy exchange rates between plants and the atmosphere [17]. It can be used to predict future growth and changes in canopy structure, which are fundamental aspects of environmental management [18]. Specifically, when a plant grows, even after a disturbance, its leaf area index increases with the increase in leaf density. In this regard, LAI can then be used as a proxy for assessing the health and productivity of vegetation across restored and natural wetlands. Wetland plants and their attributes such as LAI are not easy to detect using point-based manual techniques. As a result of varying wetland conditions such as soil moisture and wetland hydrology, wetland vegetation traits vary and these compound the challenge of characterising their productivity [19]. Above all, it could be very challenging to identify the boundaries between their plant communities. Therefore, there is a need to establish techniques that are robust and can cost and time effectively distinguish wetland vegetation attributes such as LAI [20].
Remote Sensing has been widely proven to be a time and cost-effective technique for detecting and mapping vegetation attributes such as LAI [21,22]. It is in this regard that the launch of the advanced new generation sensor, the Sentinel-2 Multispectral Instrument (MSI), has been proven to be of great advantage to LAI estimation [21]. Studies have confirmed the strength of the added red-edge bands provided by the Sentinel-2 Multispectral Instrument for LAI estimation [22]. For instance, Clevers & Gitelson [22] successfully estimated LAI in crops and grasslands, which illustrated the significance of the red-edge bands of the multispectral instrument. A study by Delegido, Verrelst, Alonso, & Moreno [23], also demonstrated the importance of the red-edge band on Sentinel-2 MSI for LAI estimation in grasslands and crop vegetation. Furthermore, vegetation indices derived from the red-edge spectrum have proven to have high accuracies when estimating vegetation properties such as biomass, which are particularly associated with LAI [24,25].
Research on estimating wetland vegetation LAI has often been done on forested wetlands and mangrove wetlands [26]. According to Adam et al. [15], the univariate regression analysis inclusive of vegetation indices (some of which are normalized), the difference vegetation index (NDVI), and simple ratio (SR) derived from the visible and NIR wavelengths are the most commonly used empirical models used in estimating LAI. Sibanda et al. [25] illustrated that the error in the estimation of LAI was reduced with the inclusion of red-edge vegetation indices. This is because vegetation spectral reflectance is influenced by vegetation biophysical properties such as LAI, chlorophyll content and leaf angle distribution, these properties are known to be highly associated with the red-edge [23,24,27,28]. However, wetlands are characterised by high moisture content, leaf density, and leaf angle distribution associated with various wetland plant species. These often attenuate the signal of vegetation through the process of saturation, making it difficult to characterise physiochemical plant characteristics such as LAI in a wetland setting. Therefore, it is perceived that including red-edge vegetation indices could significantly improve the accuracy of LAI estimation models across the rehabilitated and natural wetlands. In our understanding, there has not been a study undertaken to estimate wetland vegetation LAI across natural and rehabilitated wetlands using Sentinel-2 MSI with the red-edge bands. Therefore, this study aims to test the ability of Sentinel-2 MSI-derived data and vegetation indices in estimating the variation in leaf area index for vegetation growing in a natural wetland and that growing in a rehabilitated wetland. The ultimate goal is to evaluate whether wetland rehabilitation improves the productivity of wetland vegetation and assess the extent to which this natural capital can be monitored from remote sensing.

2. Materials and Methods

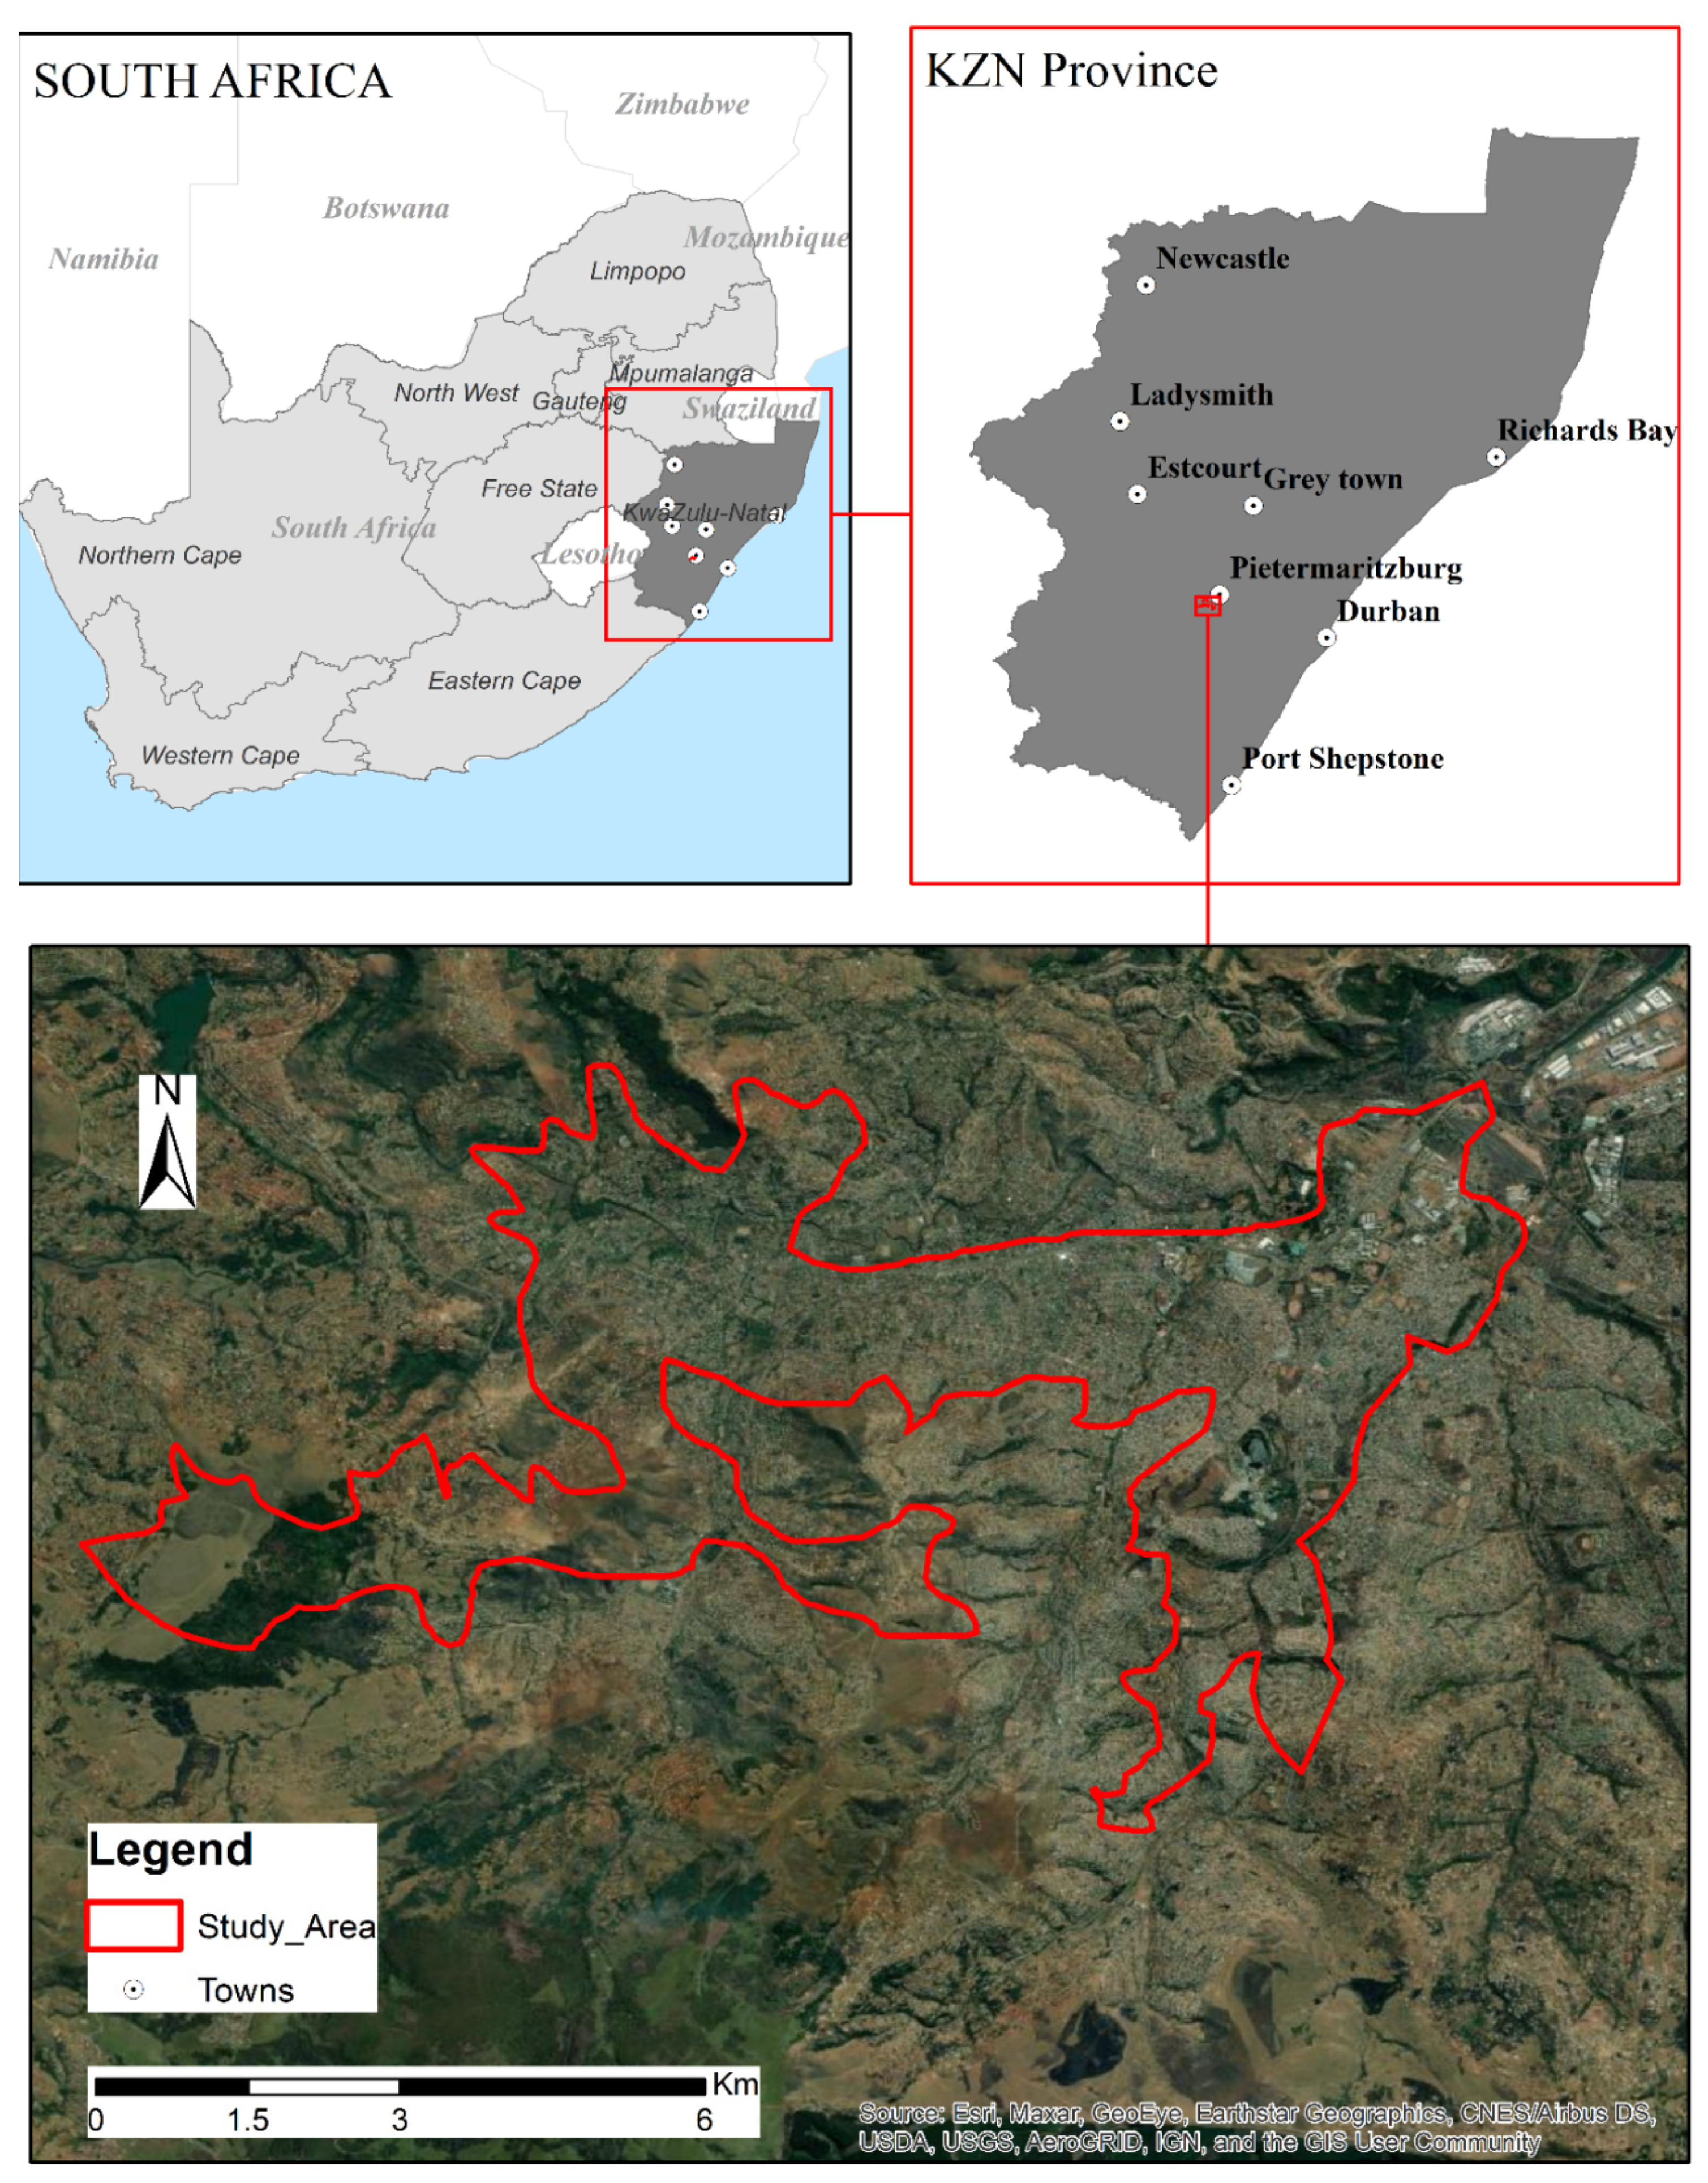
2.1. Study Area Description

The study was conducted in the Greater Edendale Mall wetland (29°38′54.70″S and 30°20′28.03″E) and Wetland Erf 1105 in Willowfontain (29°42′41.51″S and 30°20′49.22″E), both situated in Pietermaritzburg, KwaZulu-Natal (Figure 1). The Willowfontain wetland is a natural wetland that is approximately 347.051 m2, while the Edendale wetland is a rehabilitated wetland that is approximately 502.519 m2. Currently, these wetlands are colonised by common hydrophytes such as Typha Capensis and Cyperus dives species (Figure 2). However, other species such as Cyperus sphaerospermus, Cyperus textilis, Imperata cylindrical and Ischaemum fasciculatum grow on these wetlands. Degradation of the Edendale wetland was a result of historic and current land-use practices, which include the encroachment of residential and commercial development as well as grazing pressure, which has resulted in significant modifications to the catchment. This in turn altered the wetland system’s functions such as flood attenuation, sediment trapping and erosion control.
The rehabilitation process on the Greater Edendale wetland started in the year 2010. This was done as part of the development of the Greater Edendale Mall. The rehabilitation was done to ensure that there is no diffuse flow of water through the wetland system. This has allowed for the establishment of a diverse range of wetland species through the transformation from temporary to permanently wet soils. The wetland was dominated by alien invasive plant species such as Lantana camara, Melia azedarach, Solanum mauritianum and Sorghum halepense. Sewage water was also identified as one of the main disturbances to the wetland ecosystem.
The study site generally experiences summer rainfall, but with some rainfall in winter. Average annual rainfall ranges between 801–1000 mm, while mean annual temperatures range from approximately 4.1 °C to 27 °C. The dominant soil types in the study site consist of fill colluvial and residual soils that overlie weathered shale, with the average elevation ranging from 712–721 m.

2.2. Field Data Collection

Prior to field sampling, Google Earth Pro was used to digitise the wetland areas. Subsequently, the digitised polygons were transferred into a geographic information system (GIS), where a total of 130 random points were generated for LAI measurement. Specifically, 72 sampling points from the Greater Edendale wetland and 58 from the Willow fountain wetlands were conducted and considered for this research. A handheld global positioning system (GPS) was used for navigation around the wetlands to the point of sampling. At each point, a 10 m by 10 m quadrat was established and used as a sampling unit.
At each quadrat, LAI estimate measurements were conducted and recorded against the coordinates of that sampling point using the LAI-2200 Plant Canopy Analyser.
The Plant Canopy Analyser computes the LAI from the canopy based on incoming radiation measurements from a fisheye optical sensor. In measuring LAI estimates, five measurements were conducted (1 measurement) above and (4 measurements) below the canopy on sunny conditions. LAI estimates measurements were conducted in such a way that no external object obstructed the LAI-2200 instrument’s optical sensor. The optical sensor was then placed levelled underneath the leaf canopy, with the above canopy measurement focusing in a similar direction. LAI measurements were recorded, captured in Microsoft Excel as a CSV file and imported into GIS as a table. A point map of LAI was then created using the imported Excel sheet with recorded LAI from each sampling point. This point map was then overlaid with the remotely sensed data to extract the spectral signatures from each sampling point.

2.3. Remotely Sensed Data

A Sentinel-2 Multispectral Instrument satellite image of the study area that was acquired on 3 October 2018 was obtained from the ESA Copernicus Open Access Hub (https://scihub.copernicus.eu/, accessed on 8 October 2018). The image’s acquisition date coincided with the period when field sampling was conducted. The image was pre-processed using Sentinel Application Platform (SNAP) version 2.2, the atmospheric correction was thereafter implemented on the image in order to extract accurate wetland vegetation spectra in a GIS system. The spatial resolution on Sentinel-2 MSI ranges between 10 m to 60 m with a revisit period of five days under clear sky conditions (Frampton et al., 2013). Sentinel-2 MSI consists of 12 spectral bands, where bands 2, 3, 4 and 8 are positioned at 10 m, bands 5, 6, 7, 8a, 11 and 12 are positioned at 20 m and bands 1, 9 and 10 are positioned at 60 m. Sentinel-2 MSI offers unique red-edge bands which are situated at wavelengths between 705–783 nm (bands 5, 6 and 7).
However, spectral signatures for wetland vegetation were extracted from all Sentinel-2 MSI bands. Vegetation indices were generated based on the simple ratio (sR) and normalised difference vegetation (nDVI) from all conceivable Sentinel-2 MSI band combinations including red-edge bands for estimating LAI. Additionally, traditional vegetation indices such as the green normalised difference index (GNDVI), the normalised difference water index (NDWI), and the chlorophyll green (Clgreen), transformed difference vegetation index (TDVI) were also computed using Sentinel-2 MSI bands excluding those with a 60-m spatial resolution, which are atmospheric correction channels (Table 1). Approximately 270 spectral variables were used in this study, as illustrated in Table 1.

2.4. Statistical Analysis

Before the analysis, a Shapiro-Wilk normality test was completed. This was done to ensure that there are no significant deviations of field-measured LAI. The descriptive statistics were also computed on SPSS statistics 24. The Shapiro-Wilk test results illustrated that there were no significant deviations in LAI data from the normal distribution (p > 0.05).

2.5. Partial Least Squares Regression Method

Partial Least Square Regression (PLSR) in R was used to evaluate the capability of Sentinel-2 MSI derived data in estimating wetland vegetation LAI between a natural and rehabilitated wetland. This advanced technique was selected because it uses a selection of independent variables to predict a selection of dependent variables and is particularly advantageous when prediction is done using a considerable selection of independent variables [28,29]. This model is desirable for this study because the remotely sensed data (bands) are transformed into new orthogonal factors which aid in avoiding multicollinearity and overfitting issues [25,30]. The algorithm imposes sparsity, as it selects the optimal variables for each model that are most suitable for LAI estimation [25].
The process of model validation refers to assessing the performance of a model under realistic conditions using independent data [31]. Leave-one-out cross-validation (LOOCV) was therefore completed on a selected measured dataset to evaluate the performance of the PLSR model. Cross-validation (CV) has been proven as a useful method in prediction error estimation [32]. It is an unbiased and commonly used method to determine the optimal number of components to take into account [33]. CV splits data into training and testing data. Research conducted on plant biophysical data often uses LOOCV as a validation method [31]. The LOOCV coefficient of determination (R²), root mean square error (RMSE) and relative root mean square error of prediction (relRMSE) of the regression were used to generate the goodness of fit for all of the models, and these were computed to assess and compare the LAI estimation models across both wetlands. The models representing the measured and predicted LAI were compared for both wetland types. The most optimal model was represented by the lowest RMSE and relRMSE. This indicated that the model performed better than the other models.

3. Results

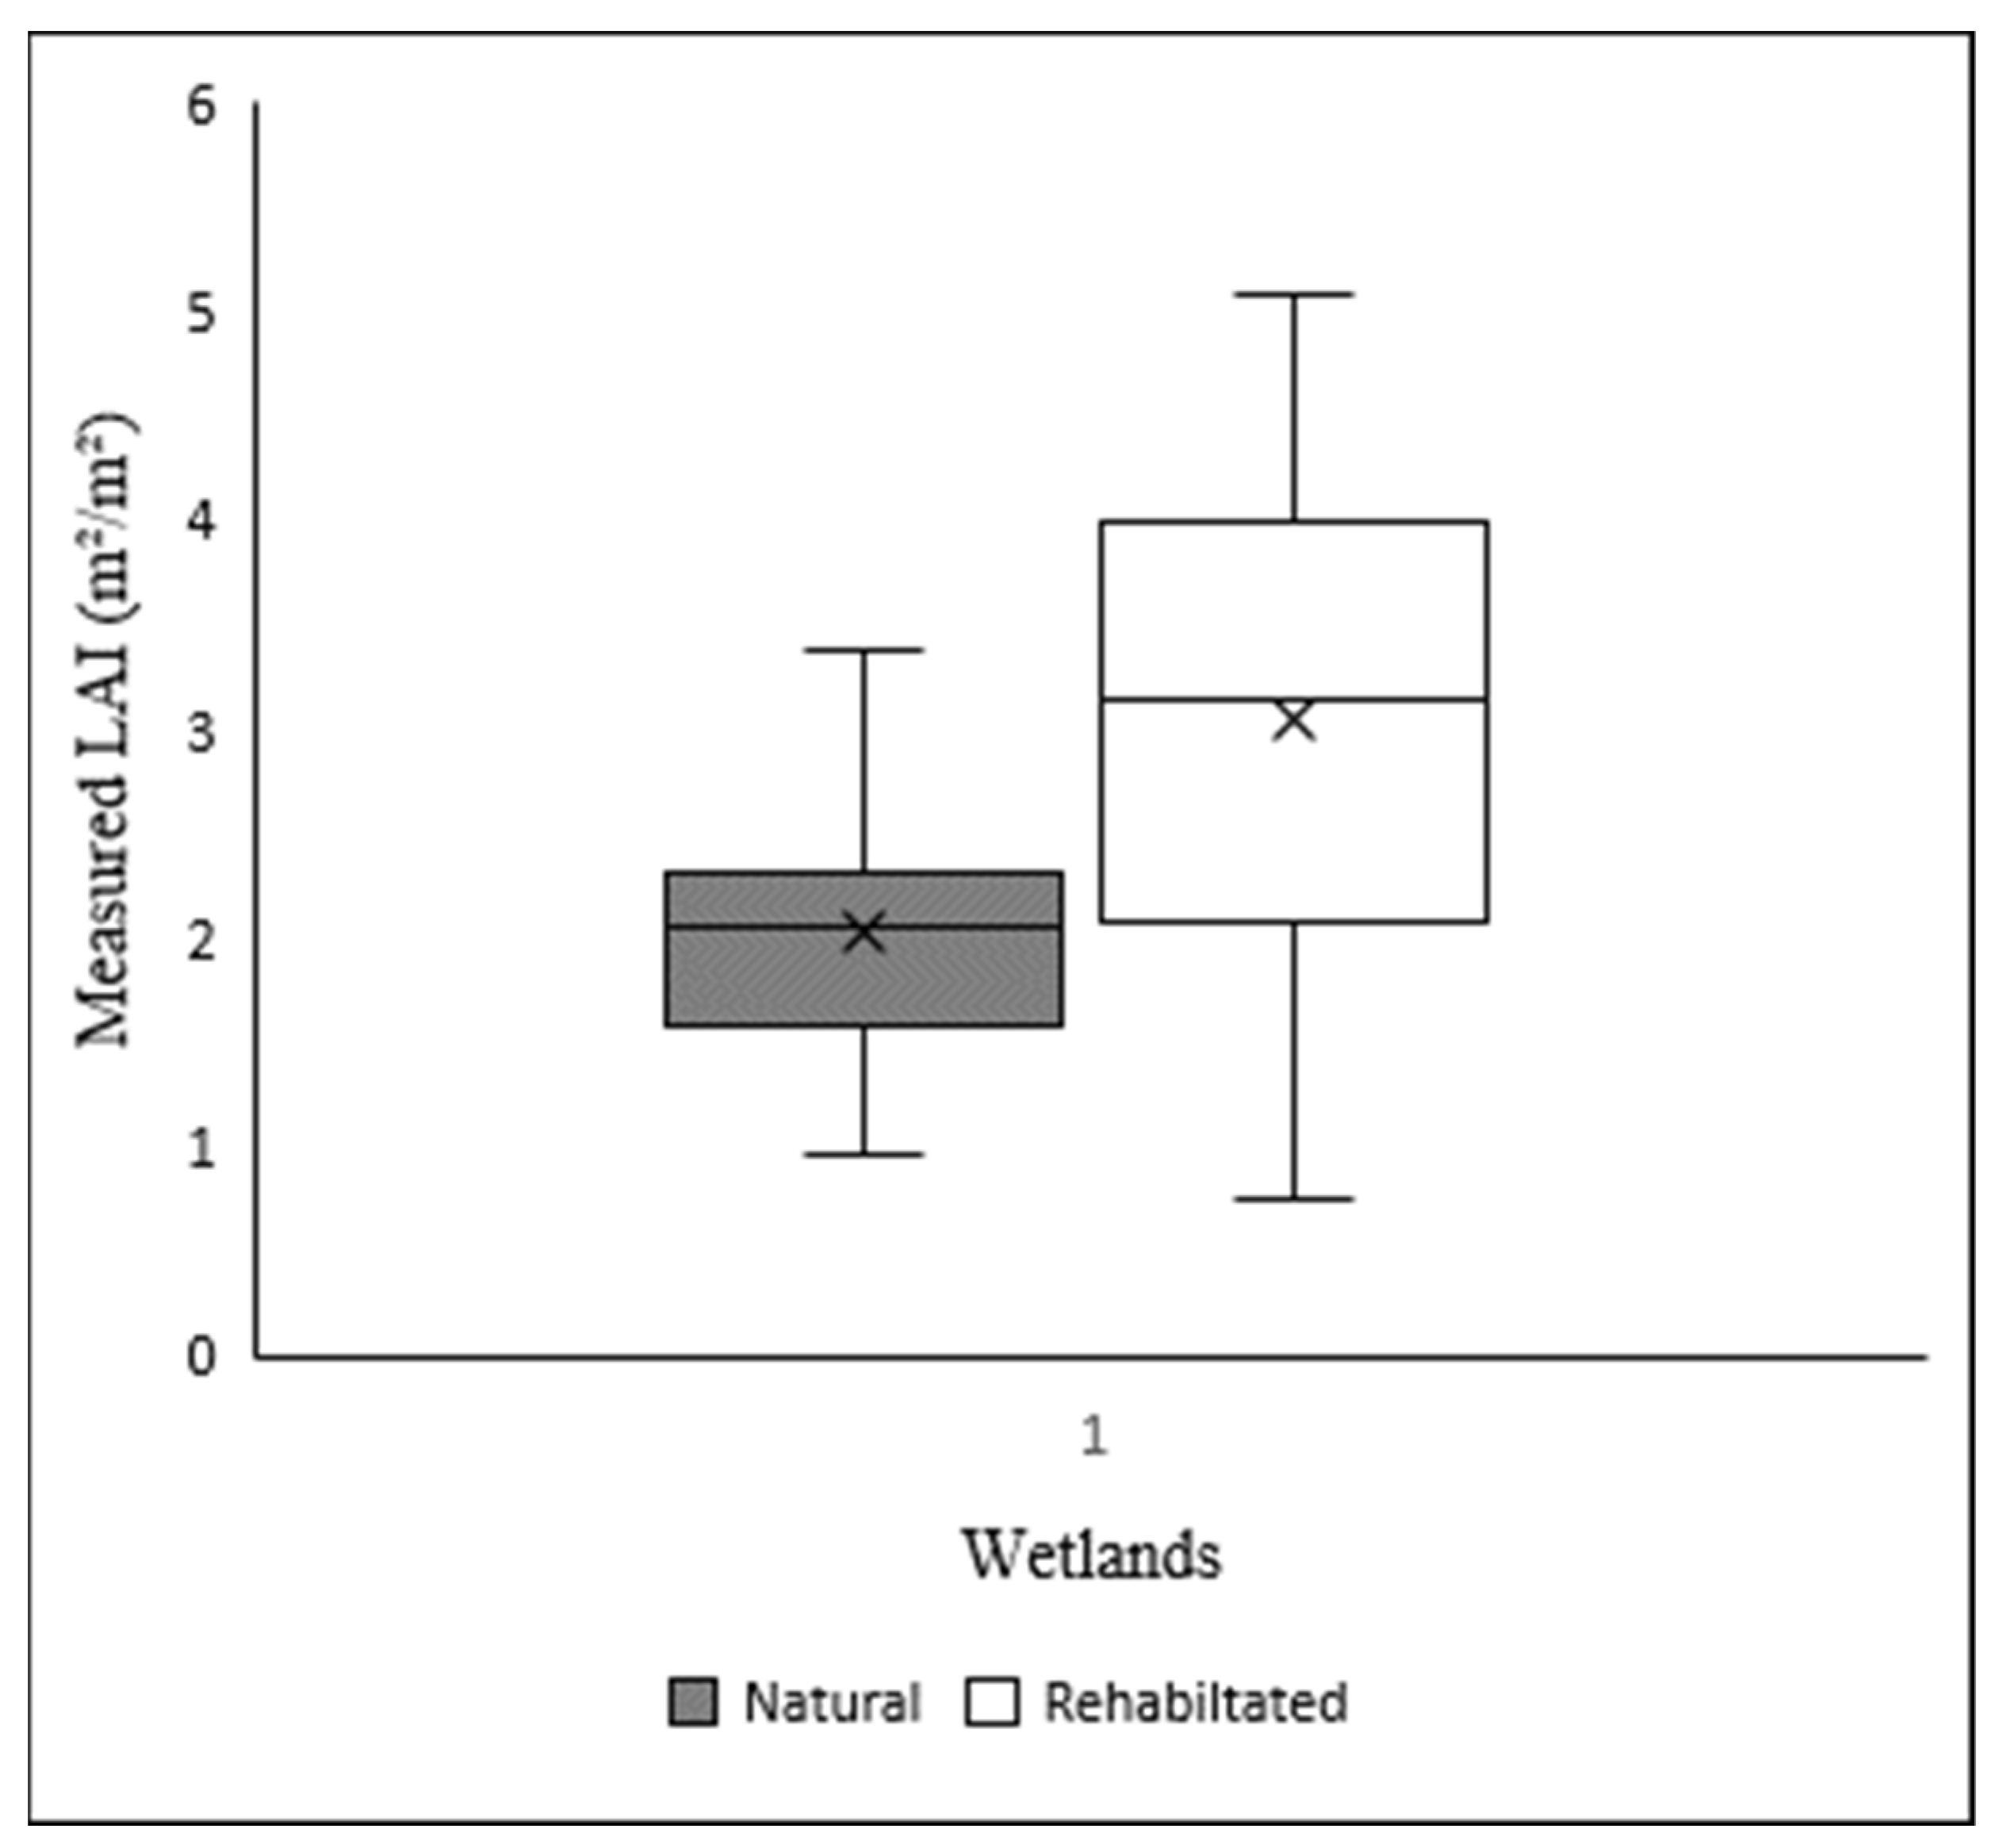
3.1. Measured LAI Descriptive Statistics

The highest in-situ measured LAI value was 5.07 m2/m2, which was recorded from the rehabilitated wetland (Figure 3). The number of sampled points in the rehabilitated wetland were higher in measured LAI compared to the natural wetland. This is due to the productivity of the rehabilitated wetland as compared to the natural wetland. Field measured LAI mean values of 2 m2/m2 and 3 m2/m2 were observed for the natural and rehabilitated wetlands, respectively. The standard deviation of LAI data in the natural wetland was 0.60 m2/m2 and 1.17 m2/m2 for the rehabilitated wetland (Table 2). After the outliers were removed, 3.61 m2/m² was the highest recorded LAI measured for natural wetland and 5.07 m2/m² for the rehabilitated wetland. The LAI measurements represent a variable distribution across the two types of wetlands, and a wide range of LAI measurements was recorded for the rehabilitated wetland (Figure 3). The Shapiro-Wilk test results illustrated that there were no significant deviations in LAI data from the normal distribution (p > 0.05).

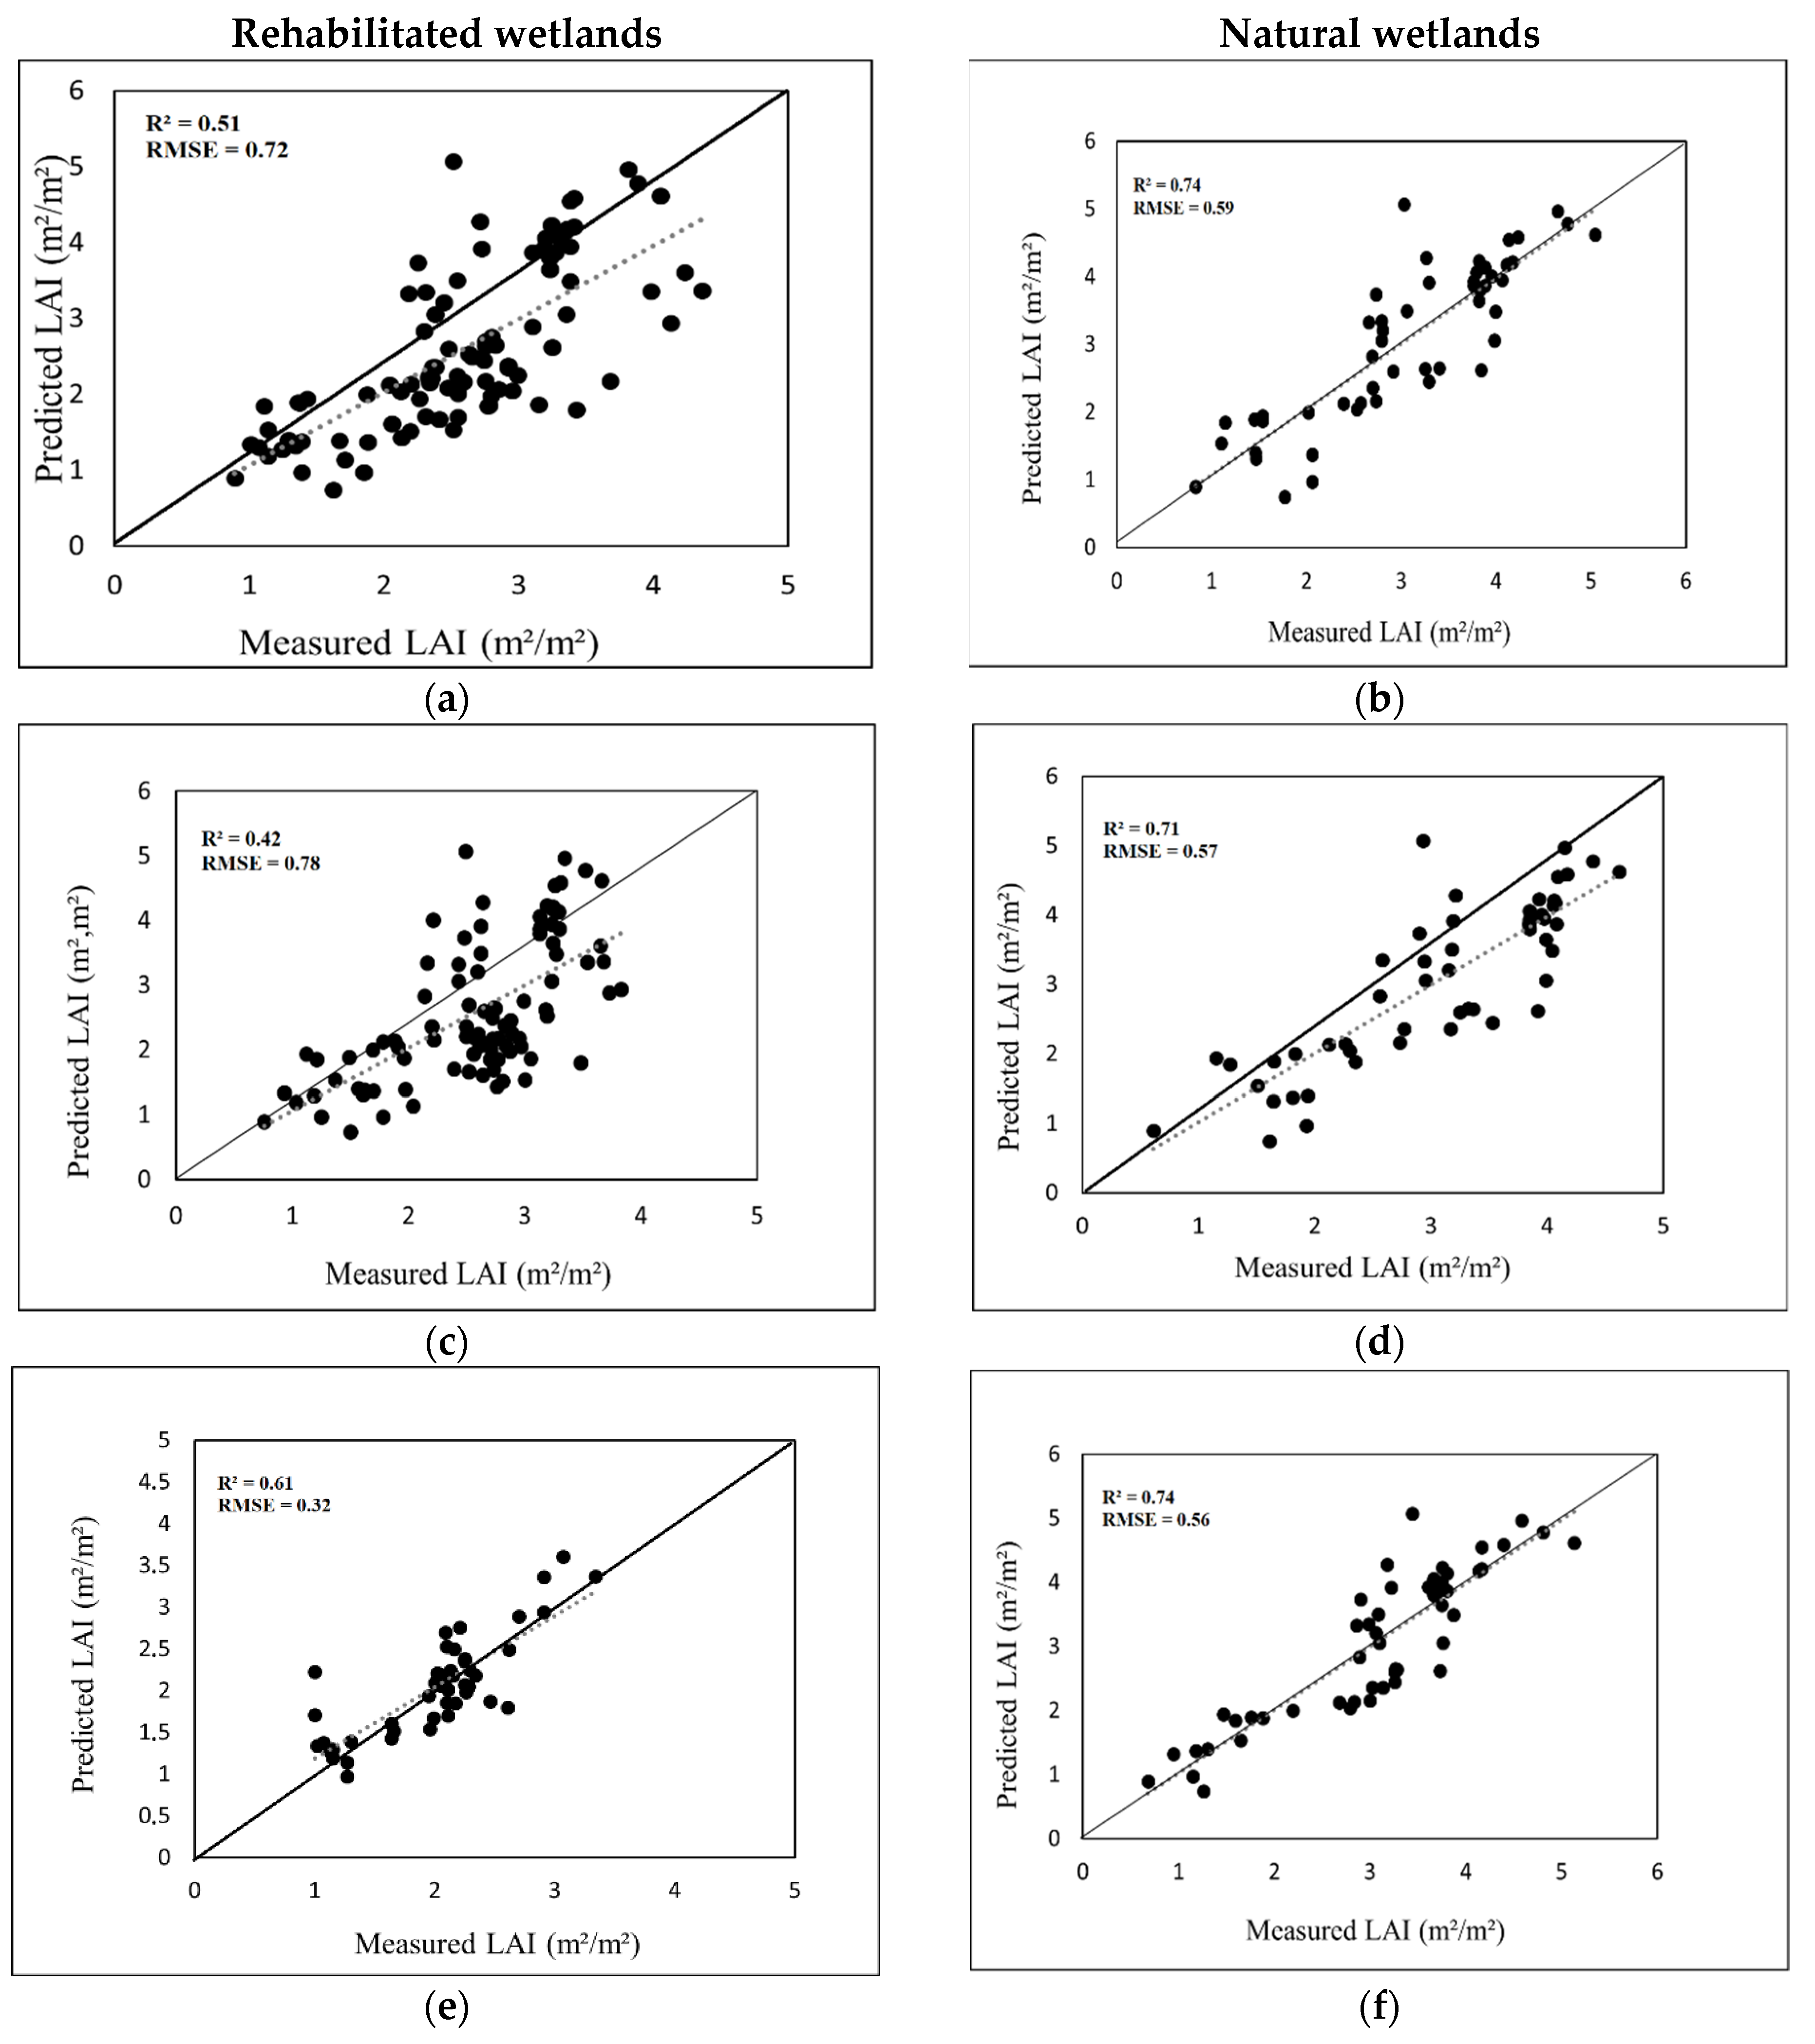
3.2. Comparing the Influence of Standard Bands and Traditional Vegetation Indices in Estimating LAI of Wetland Vegetation between Natural and Rehabilitated Wetlands

In comparing the standard bands with traditional vegetation indices in estimating LAI of wetland vegetation, the results exhibited better accuracies when standard bands were used for LAI estimation for the natural wetland, as compared to traditional vegetation indices. An RMSE of 0.72 m2/m2 and an R2 of 0.51 was obtained from using standard bands, whereas a RMSE of 0.78 m2/m2 and an R2 of 0.42 was obtained when traditional vegetation indices were used based on the PLSR algorithm. However, for the rehabilitated wetland, results showed that standard bands were outperformed by traditional indices in estimating wetland vegetation LAI. A RMSE of 0.59 m2/m2 and R2 of 0.74 was attained using standard bands, while a RMSE of 0.57 m2/m2 and an R2 of 0.71 was obtained when traditional indices were used. The optimal variables that were selected for this model included red-edge bands, vegetation indices which comprised of red, green and yellow near-infrared (NIR) and mid-infrared (MIR) for the natural wetland. Whereas the optimal variables selected for the rehabilitated wetland were from the red section and the red-edge bands.

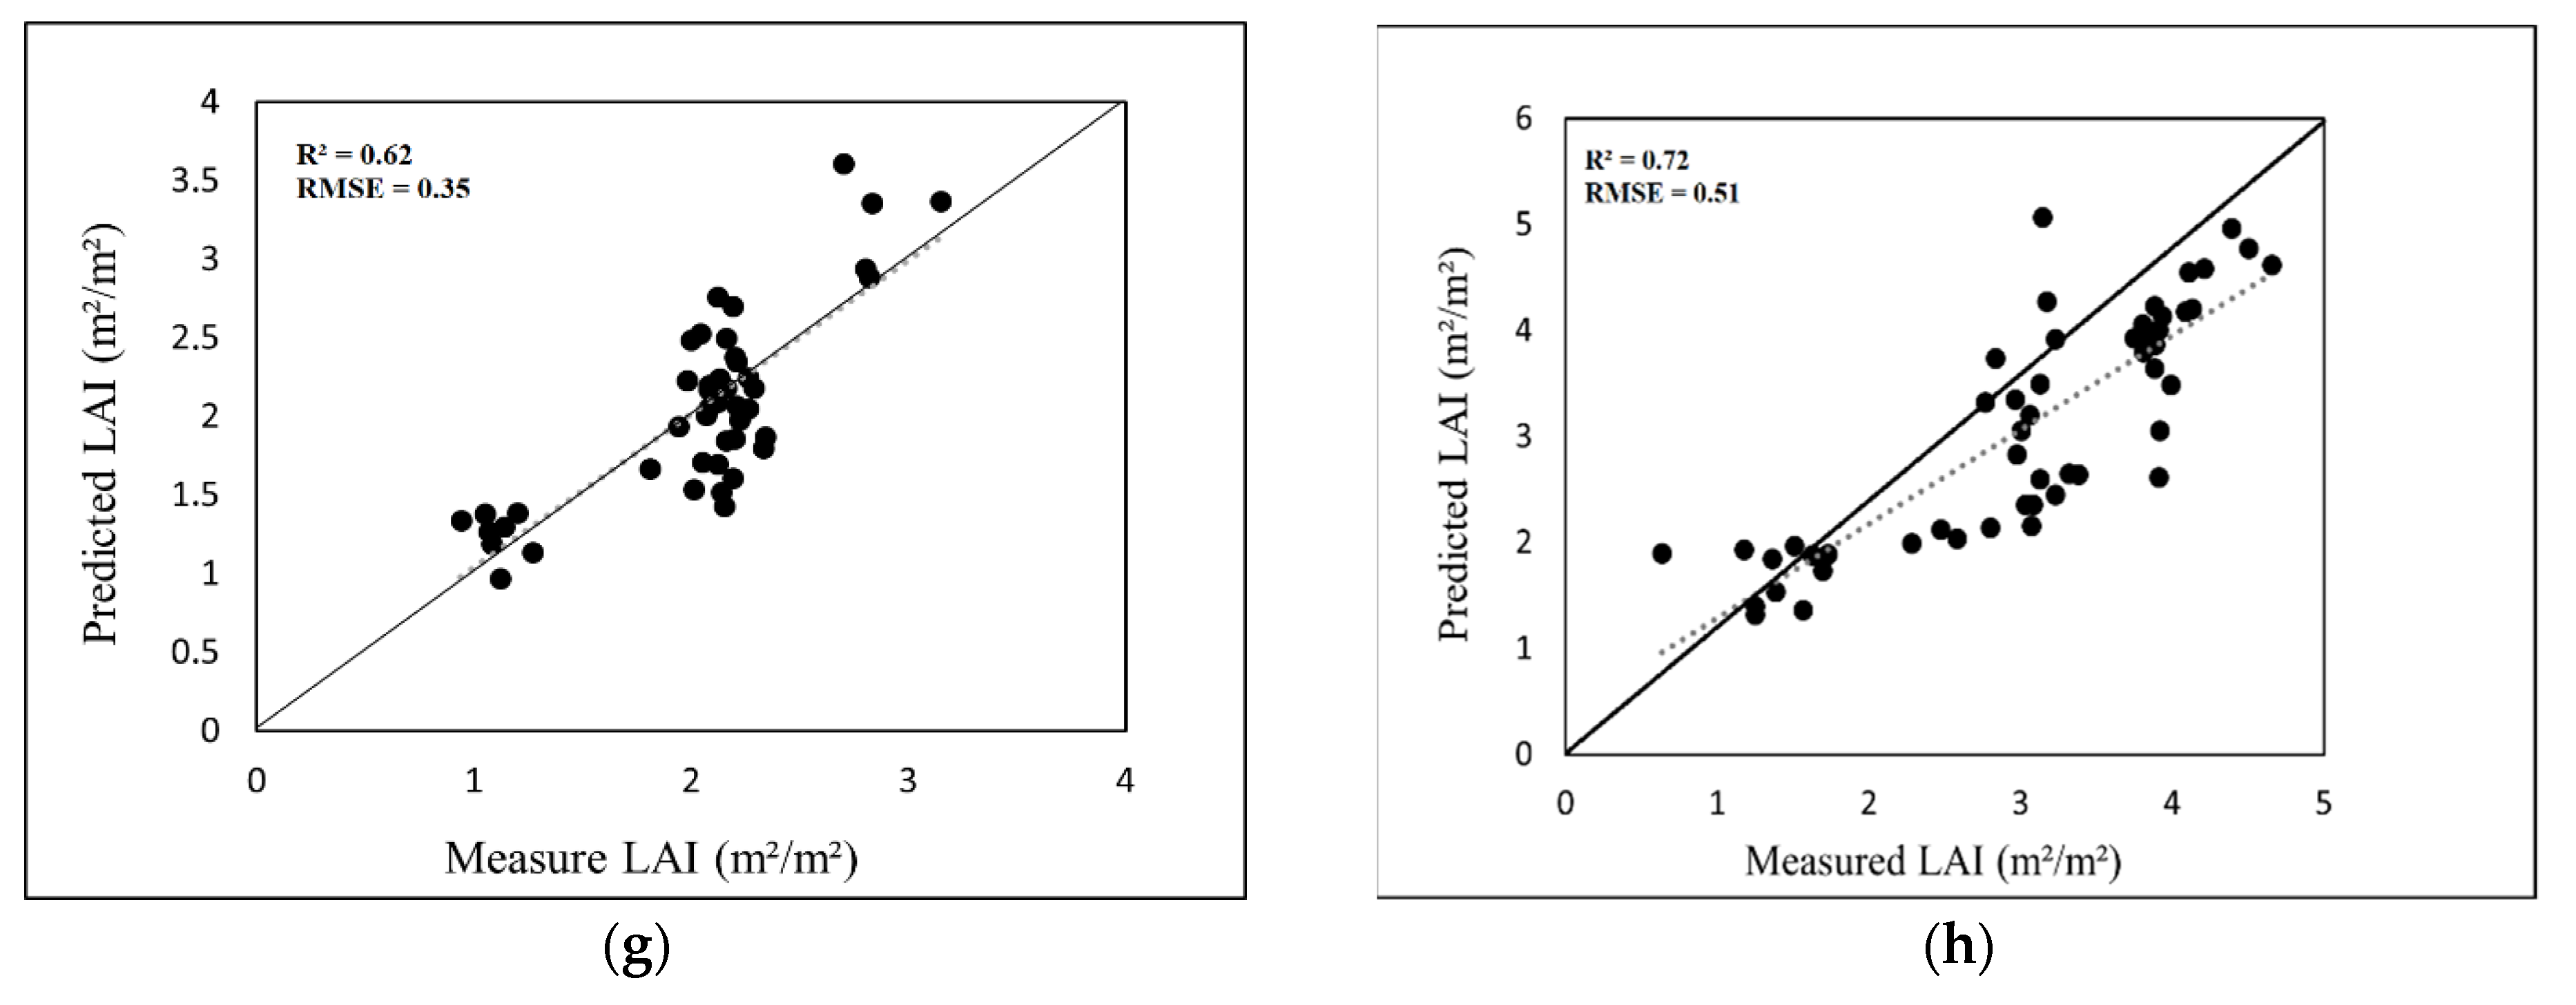
3.3. Comparing the Influence of nDVI and sR Vegetation Indices in Estimating LAI of Wetland Vegetation between Natural and Rehabilitated Wetlands

LAI estimation accuracies improved with the use of nDVI and sR vegetation indices, as compared to the accuracies derived from using standard bands only. A RMSE of 0.32 m2/m2 and an R2 of 0.61 were attained for sR vegetation indices whereas, a RMSE of 0.34 m2/m2 and an R2 of 0.62 were obtained from nDVI (Figure 4). Therefore, nDVI vegetation indices were outperformed by sR vegetation indices in the natural wetland. However, for the rehabilitated wetland, results show improved accuracies in LAI estimations for wetland vegetation with the use of nDVI vegetation indices. A RMSE of 0.51 m2/m2 and an R2 of 0.72 were obtained for nDVI vegetation indices and an RMSE of 0.56 m2/m2 and an R2 of 0.74 was attained for sR vegetation indices. The selected optimal variables for the natural wetland were vegetation indices that were a combination of the green, red, red-edge and NIR/SWIR bands. However, for the rehabilitated wetland, some of the optimal vegetation indices included the blue band, red-edge bands and bands from the NIR sections of the electromagnetic spectrum.

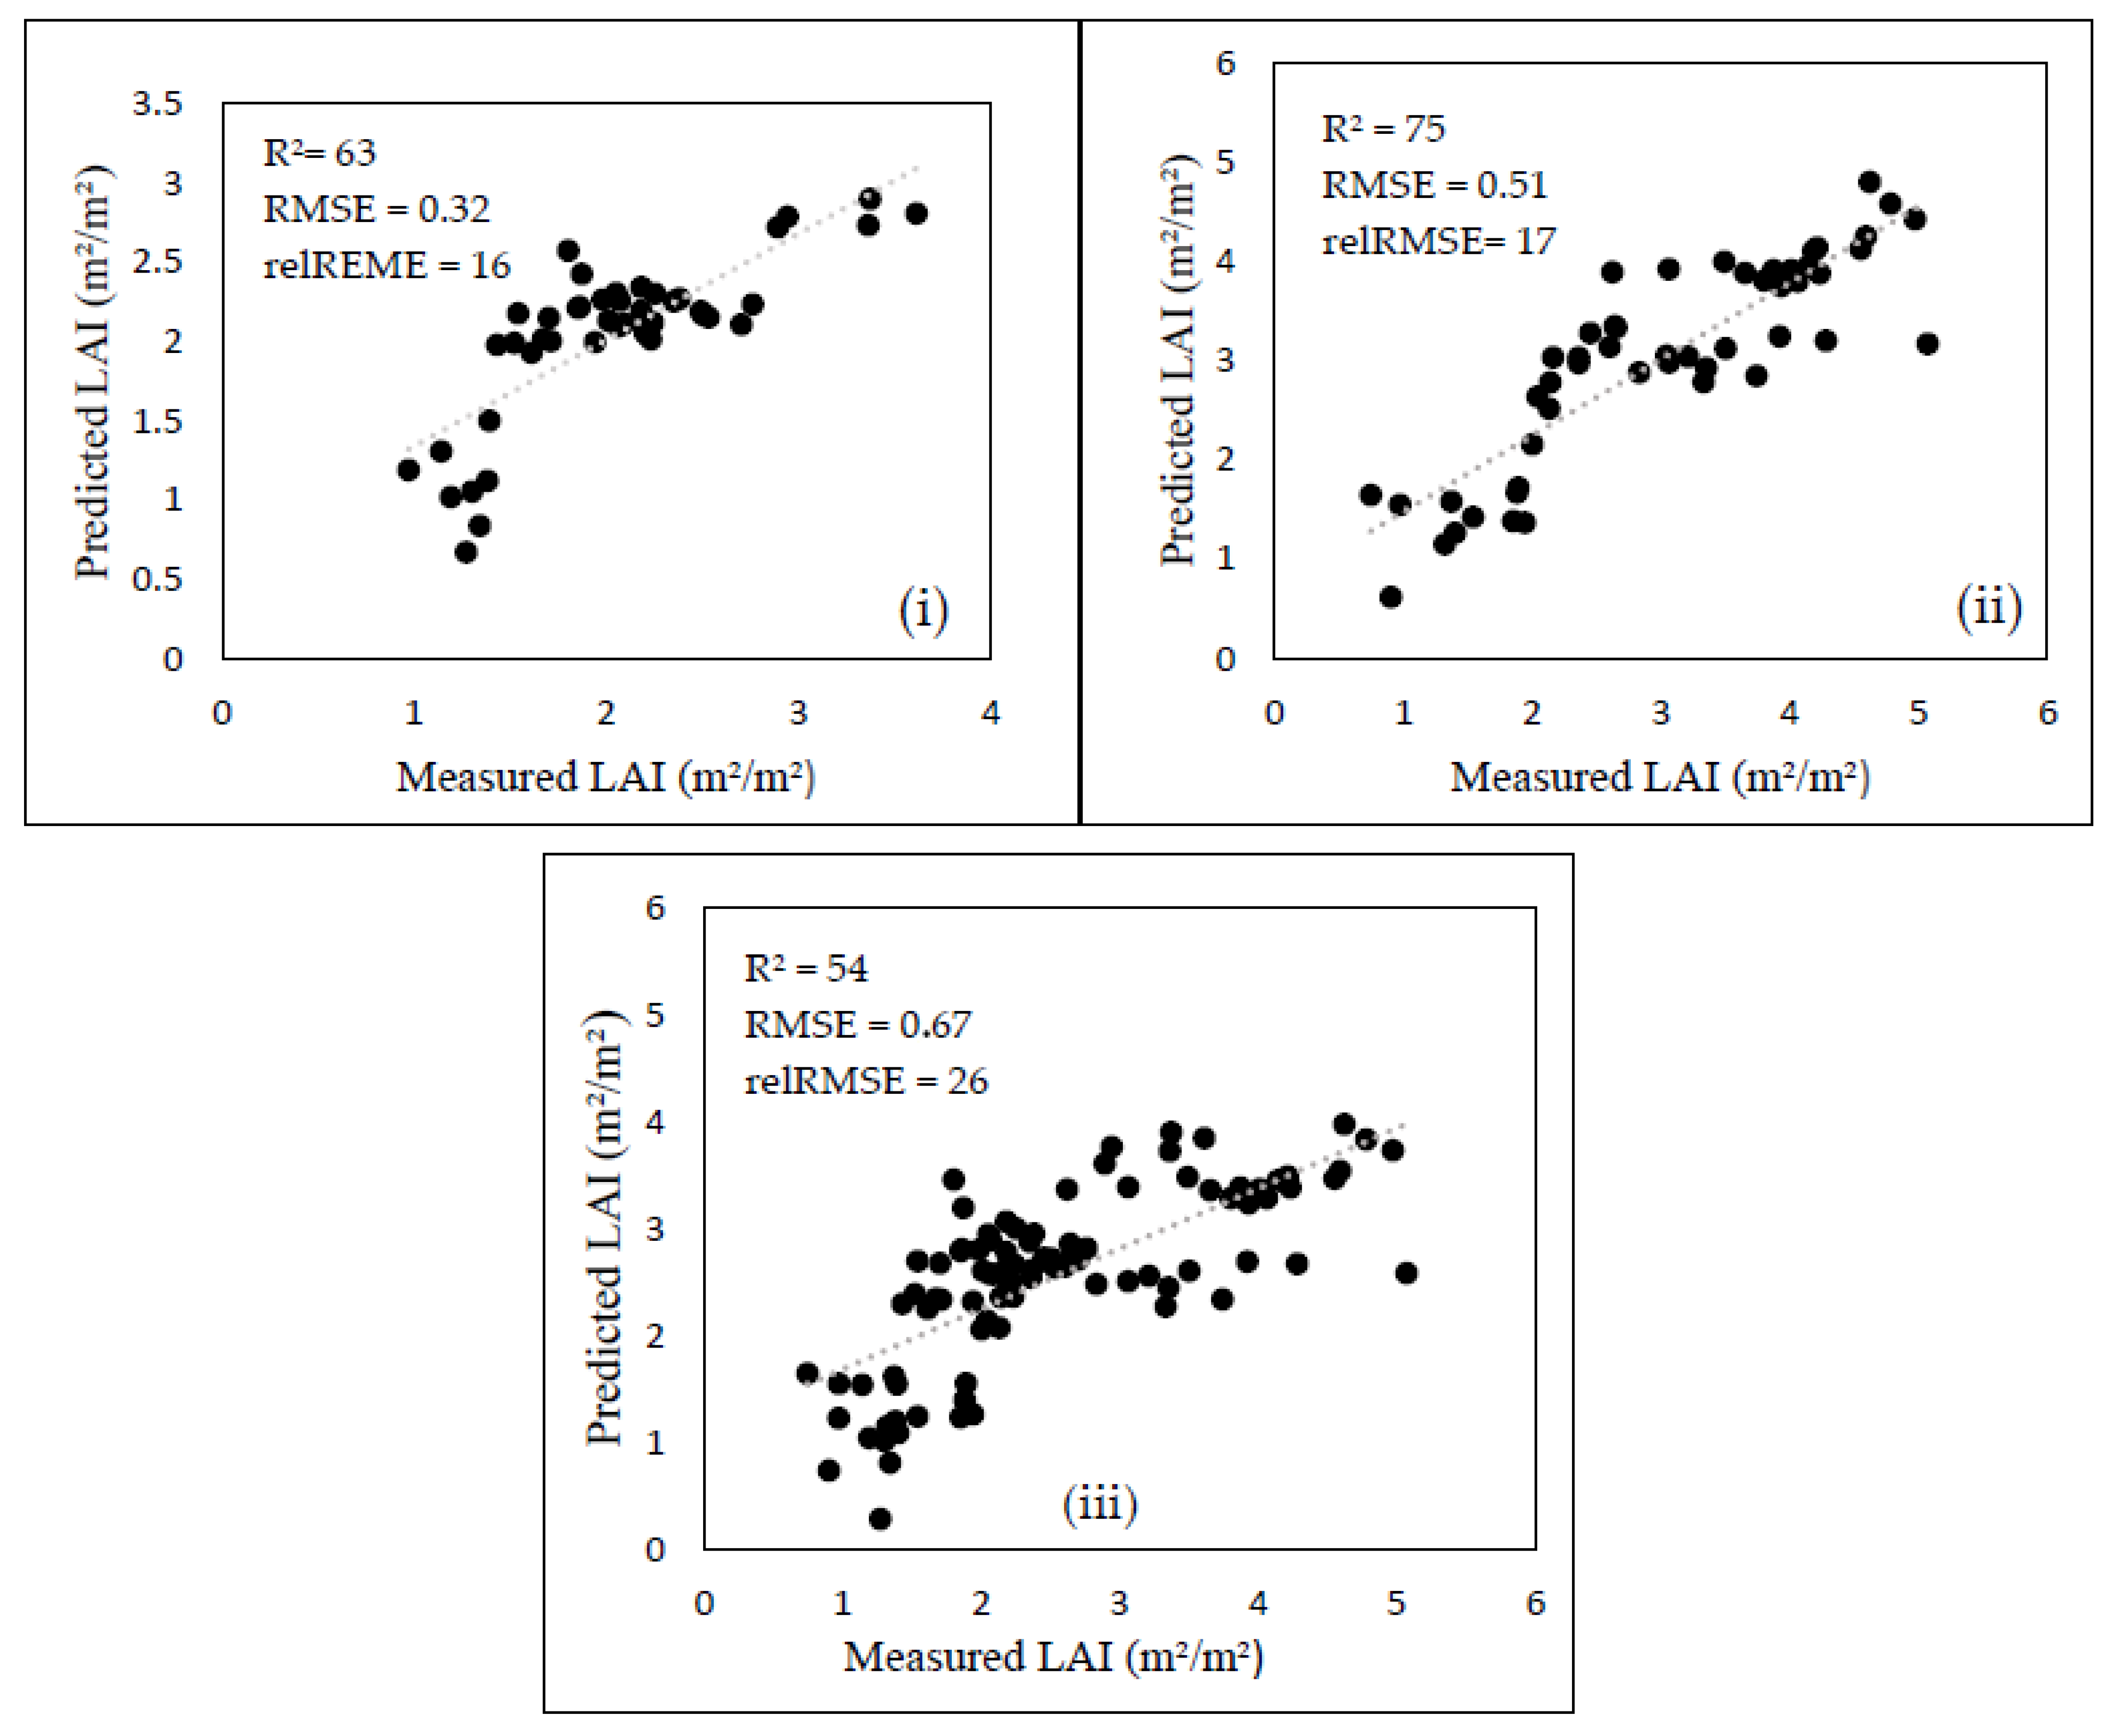
3.4. Estimating Wetland Vegetation Leaf Area Index Using Combined Data

When all the Sentinel-2 MSI conventional bands and vegetation indices were collectively used for wetland vegetation LAI prediction, a high estimation accuracy was attained for the natural wetland as compared to the rehabilitated wetland (Figure 4 and Figure 5i,ii). A RMSE of 0.32 m2/m2 and an R2 of 0.63 was obtained for combined data (conventional bands and all vegetation indices) for the natural wetland, whereas a RMSE of 0.52 m2/m2 and an R2 of 0.75 was obtained for the rehabilitated wetland. When data from both sites (natural and rehabilitated wetlands) were pooled together a low accuracy was produced for wetland vegetation LAI, with a RMSE of 0.67 m2/m2 and an R2 of 0.51. Figure 5iii illustrates the relationship between measured and predicted LAI. Noticeably, the individual predictive models outperformed the pooled predictive model, with the natural wetland model producing high accuracies (Figure 5i). The selected optimal variables when natural wetland data was combined were comprised of red-edge derived vegetation indices paired with the red, green and yellow NIR bands. The optimal variables that were selected for the rehabilitated wetland included all the visible sections of the electromagnetic spectrum, coupled with the red-edge derived vegetation indices and the NIR and SWIR section of the electromagnetic spectrum. The spatial distribution of the modelled LAI in natural and rehabilitated wetlands is illustrated in Figure 6.

4. Discussion

Results of this study show that wetland vegetation productivity was optimally characterised across wetland systems under different management practices using Sentinel-2 MSI data (Figure 4). Specifically, the results illustrated that optimal wetland vegetation LAI estimations were obtained with the use of Sentinel-2 MSI red edge derived vegetation indices in combination with traditional vegetation indices. In particular, the optimal variables in the model that estimated LAI across the natural and the rehabilitated wetlands were red edge bands 5, 6 and 7, as well as NIR band 8a. The findings of the current study show that the estimation error for the natural wetland was lower when compared to the rehabilitated wetland. This suggests that the estimation model performed better in LAI estimation for the natural wetland. This could be due to high moisture content, leaf density, as well as lack of vegetation diversity in the rehabilitated wetland. These wetland characteristics attenuate the vegetation signal through the process of saturation, making it difficult to characterise physiochemical vegetation properties such as LAI in wetland settings, especially in more managed wetlands as compared to natural wetlands. However, for the natural wetland, these saturation issues were overcome by plant species diversity and representation due to the natural setting of the wetland. The Sentinel-2 MSI red edge region directly influenced the spectral reflectance of wetland vegetation in the natural wetland. Xie et al. [34] presented similar results, where they illustrated that red and red-edge vegetation indices improved the R2 of LAI by 10% in a study that highlighted the influence of red and red-edge vegetation indices combinations for LAI estimation. Sibanda et al. [25], also attained high accuracies with an RMSE of 0.5074 m2/m2 and R2 of 0.91 when Sentinel-2 MSI red edge bands were used to estimate LAI.
The findings from this analysis show that vegetation indices significantly improved wetland vegetation LAI estimation for both wetlands by producing a lower error of estimation of 0.32 m2/m2 for sR vegetation indices and 0.34 m2/m2 for nDVI vegetation indices for the natural wetland, whereas the error of estimation for the rehabilitated wetland vegetation LAI was reduced to 0.56 m2/m2 when using sR vegetation indices and 0.51 m2/m2 when using NDVI vegetation indices. Background effects such as soil and litter can affect the model performance, especially with the use of standard bands only. Standard bands are more susceptible to soil background interference and other atmospheric issues that result in the impairment of vegetation reflectance when properties such as LAI are measured [24,35,36]. The findings of this analysis also indicate that the use of red-edge vegetation indices outperformed standard bands in LAI estimation. This is mainly due to the strong relationship between red-edge bands and LAI as compared to standard bands. It has been demonstrated that LAI strongly influences the shape of red edge reflectance spectra [34].
The results indicate that traditional indices performed poorly in estimating wetland vegetation LAI. Out of the traditional indices that were used in this study, Clgreen was the most optimal in estimating wetland vegetation LAI in the natural wetland., For the rehabilitated wetland it was Clgreen and NDWI that proved to be the most optimal variables in estimating wetland vegetation LAI. The reason for this could be that these traditional indices were derived from the broadband sections of the electromagnetic spectrum. This makes these vegetation indices (VIs) unstable due to soil moisture and atmospheric conditions [16,37,38]. In a related study, Adam et al. [15] illustrated that NDVI asymptotically saturates within the particular measurement of biomass density and specific ranges of LAI measurements. Therefore, the estimation accuracy drops considerably for both the natural and rehabilitated wetland. Overall, the model performed better for wetland vegetation LAI in the natural wetland, as it provided the least estimation error when compared to the model derived for the rehabilitated wetland. The study adopted a PLSR model to establish the capability of Sentinel-2 MSI- derived data in estimating the wetland vegetation leaf area index between a natural and rehabilitated wetland. The findings show that the PLSR algorithm can be used to estimate wetland vegetation LAI.

5. Conclusions

The current study sought to investigate the ability of Sentinel-2 MSI derived data and vegetation indices to estimate wetland vegetation LAI under different management regimes. Grounded on the findings of this study, the following can be concluded.
  • the new generational Sentinel-2 MSI sensor data can optimally quantify the variability of wetland vegetation LAI across natural and rehabilitated wetlands based on the red-edge bands, as most of the optimal variables with the lowest estimation errors for LAI estimation included red-edge bands and red-edge derived vegetation indices.
  • The combination of standard bands, red-edge derived vegetation indices and traditional indices yielded low estimation errors for the natural wetland as compared to the rehabilitated wetland.
Although the study focused on using the Sentinel-2 MSI sensor data, the study suggests comparing the potential of other multispectral sensors to quantify the variability of wetland vegetation LAI across natural and rehabilitated wetlands. Overall, the findings confirmed that Sentinel-2 MSI offers a cost-effective and less time-consuming data source to accurately estimate LAI in resource-scarce environments. The methods used in this study can be used for wetland monitoring by means of LAI estimation and comparison across wetlands under different management regimes.

Author Contributions

In this article; Conceptualization, N.N.T., M.S. and O.M.; methodology, N.N.T., M.S. and O.M.; formal analysis, N.N.T., M.S. and O.M.; investigation, N.N.T., M.S. and O.M.; data curation, N.N.T. and M.S.; writing—original draft preparation, N.N.T., and M.S.; writing—review and editing, N.N.T., M.S. and O.M.; supervision, M.S. and O.M.; project administration, O.M.; funding acquisition, O.M. All authors have read and agreed to the published version of the manuscript.

Funding

This research was funded by the DST/National Research Foundation of South Africa, Chair in Land Use Planning and Management (Grant Numbers: 84157) and in part by the National Research Foundation of South Africa (grant number 119409).

Institutional Review Board Statement

Not applicable.

Informed Consent Statement

Not applicable.

Data Availability Statement

Data used in this study will be availed upon request. To request the data, contact details are supplied in this paper for requesting the data.

Acknowledgments

A special thanks to Sonya Caldecott, the general manager of The Greater Edendale Mall for granting access to field data collection.

Conflicts of Interest

The authors declare no conflict of interest.

References

  1. Jiang, W.; Wang, W.; Chen, Y.; Liu, J.; Tang, H.; Hou, P.; Yang, Y. Quantifying driving forces of urban wetlands change in Beijing City. J. Geogr. Sci. 2012, 22, 301–314. [Google Scholar] [CrossRef]
  2. Janse, J.H.; van Dam, A.A.; Hes, E.M.; de Klein, J.J.; Finlayson, C.M.; Janssen, A.B.; Verhoeven, J.T. Towards a global model for wetlands ecosystem services. Curr. Opin. Environ. Sustain. 2019, 36, 11–19. [Google Scholar] [CrossRef]
  3. Trexler, J.C.; Loftus, W.F. Invertebrates of the Florida Everglades. In Invertebrates in Freshwater Wetlands, 2nd ed.; Batzer, D.P., Boix, D., Eds.; Springer International Publishing: Cham, Switzerland, 2018; pp. 321–356. [Google Scholar]
  4. Dini, J.; Bahadur, U. South Africa’s National Wetland Rehabilitation Programme: Working for Wetlands. In The Wetland Book; Springer: Dordrecht, The Netherlands, 2016. [Google Scholar] [CrossRef]
  5. Kotze, D. South Africa’s foreign policy and international relations during. SAYIL 2012, 37, 356–377. [Google Scholar]
  6. Akumu, C.E.; Pathirana, S.; Baban, S.; Bucher, D. Examining the potential impacts of sea level rise on coastal wetlands in north-eastern NSW, Australia. J. Coast. Conserv. 2011, 15, 15–22. [Google Scholar] [CrossRef]
  7. Traynor, C.; Kotze, D.; McKean, S. Wetland craft plants in KwaZulu-Natal: An ecological review of harvesting impacts and implications for sustainable utilization. Bothalia 2010, 40, 135–144. [Google Scholar] [CrossRef] [Green Version]
  8. Pan, F.; Xie, J.; Lin, J.; Zhao, T.; Ji, Y.; Hu, Q.; Xi, X. Evaluation of climate change impacts on wetland vegetation in the Dunhuang Yangguan National Nature Reserve in Northwest China using Landsat derived NDVI. Remote Sens. 2018, 10, 735. [Google Scholar] [CrossRef] [Green Version]
  9. Hopkinson, C.S.; Cai, W.-J.; Hu, X. Carbon sequestration in wetland dominated coastal systems—A global sink of rapidly diminishing magnitude. Curr. Opin. Environ. Sustain. 2012, 4, 186–194. [Google Scholar] [CrossRef]
  10. Eviner, V.T.; Garbach, K.; Baty, J.H.; Hoskinson, S.A. Measuring the effects of invasive plants on ecosystem services: Challenges and prospects. Invasive Plant Sci. Manag. 2012, 5, 125–136. [Google Scholar] [CrossRef]
  11. Wortley, L.; Hero, J.M.; Howes, M. Evaluating ecological restoration success: A review of the literature. Restor. Ecol. 2013, 21, 537–543. [Google Scholar] [CrossRef]
  12. Ebbets, A.L.; Lane, D.R.; Dixon, P.; Hollweg, T.A.; Huisenga, M.T.; Gurevitch, J. Using Meta-Analysis to Develop Evidence-Based Recovery Trajectories of Vegetation and Soils in Restored Wetlands in the Northern Gulf of Mexico. Estuaries Coasts 2020, 43, 1692–1710. [Google Scholar] [CrossRef]
  13. Eckert, S.; Engesser, M. Assessing vegetation cover and biomass in restored erosion areas in Iceland using SPOT satellite data. Appl. Geogr. 2013, 40, 179–190. [Google Scholar] [CrossRef]
  14. Stefanik, K.C. Structure and Function of Vascular Plant Communities in Created and Restored Wetlands in Ohio; The Ohio State University: Columbus, OH, USA, 2012. [Google Scholar]
  15. Adam, E.; Mutanga, O.; Rugege, D. Multispectral and hyperspectral remote sensing for identification and mapping of wetland vegetation: A review. Wetl. Ecol. Manag. 2010, 18, 281–296. [Google Scholar] [CrossRef]
  16. Mutanga, O.; Adam, E.; Cho, M.A. High density biomass estimation for wetland vegetation using WorldView-2 imagery and random forest regression algorithm. Int. J. Appl. Earth Obs. Geoinf. 2012, 18, 399–406. [Google Scholar] [CrossRef]
  17. Kamal, M.; Phinn, S.; Johansen, K. Assessment of multi-resolution image data for mangrove leaf area index mapping. Remote Sens. Environ. 2016, 176, 242–254. [Google Scholar] [CrossRef]
  18. Medeiros, T.C.C.; Sampaio, E.V.; Nascimento, D.M. Leaf area index and vegetation cover of the Paripe river mangrove, Pernambuco, Brazil, in 1997 and 2017. J. Integr. Coast. Zone Manag. 2018, 18, 41–48. [Google Scholar] [CrossRef]
  19. Silva, T.S.; Costa, M.P.; Melack, J.M.; Novo, E.M. Remote sensing of aquatic vegetation: Theory and applications. Environ. Monit. Assess 2008, 140, 131–145. [Google Scholar] [CrossRef] [PubMed]
  20. Corbane, C.; Lang, S.; Pipkins, K.; Alleaume, S.; Deshayes, M.; Millán, V.E.G.; Michael, F. Remote sensing for mapping natural habitats and their conservation status—New opportunities and challenges. Int. J. Appl. Earth Obs. Geoinf. 2015, 37, 7–16. [Google Scholar] [CrossRef]
  21. Shoko, C.; Mutanga, O. Examining the strength of the newly-launched Sentinel 2 MSI in detecting and discriminating subtle differences between C3 and C4 grass species. ISPRS J. Photogramm. Remote Sens. 2017, 129, 32–40. [Google Scholar] [CrossRef]
  22. Clevers, J.G.; Gitelson, A.A. Remote estimation of crop and grass chlorophyll and nitrogen content using red-edge bands on Sentinel-2 and-3. Int. J. Appl. Earth Obs. Geoinf. 2013, 23, 344–351. [Google Scholar] [CrossRef]
  23. Delegido, J.; Verrelst, J.; Alonso, L.; Moreno, J. Evaluation of sentinel-2 red-edge bands for empirical estimation of green LAI and chlorophyll content. Sensors 2011, 11, 7063–7081. [Google Scholar] [CrossRef] [Green Version]
  24. Mutanga, O.; Skidmore, A.K. Narrow band vegetation indices overcome the saturation problem in biomass estimation. Int. J. Remote Sens. 2004, 25, 3999–4014. [Google Scholar] [CrossRef]
  25. Sibanda, M.; Mutanga, O.; Dube, T.S.; Vundla, T.L.; Mafongoya, P. Estimating LAI and mapping canopy storage capacity for hydrological applications in wattle infested ecosystems using Sentinel-2 MSI derived red edge bands. GISci. Remote Sens. 2019, 56, 68–86. [Google Scholar] [CrossRef]
  26. Turner, K.R.; Van der Bergh, C.J.M.; Soderqvist Barendregt, A.; van der Straaten, J.; Malty, E.; van Ierland, E.C. Ecological-economic analysis of wetlands: Scientific integration for management and policy. Ecol. Econ. 2000, 35, 7–23. [Google Scholar] [CrossRef]
  27. Verrelst, J.; Muñoz, J.; Alonso, L.; Delegido, J.; Rivera, J.P.; Camps-Valls, G.; Moreno, J. Machine learning regression algorithms for biophysical parameter retrieval: Opportunities for Sentinel-2 and-3. Remote Sens. Environ. 2012, 118, 127–139. [Google Scholar] [CrossRef]
  28. Wold, S.; Sjostrom, M.; Eriksson, L. PLS-regression: A basic tool of chemometrics. Chemom. Intell. Lab. Syst. 2001, 58, 109–130. [Google Scholar] [CrossRef]
  29. Abdi, H. Partial least square regression (PLS regression). Encycl. Res. Methods Soc. Sci. 2003, 6, 792–795. [Google Scholar]
  30. Eriksson, L.; Johansson, E.; Kettaneh-Wold, N.; Wold, S. Multivariate and Megavariate Data Analysis—Principles and Applications; Umetrics AB: Umeå, Sweden, 2001. [Google Scholar]
  31. Richter, K.; Hank, T.B.; Vuolo, F.; Mauser, W.; D’Urso, G. Optimal exploitation of the Sentinel-2 spectral capabilities for crop leaf area index mapping. Remote Sens. 2012, 4, 561–582. [Google Scholar] [CrossRef] [Green Version]
  32. Varma, S.; Simon, R. Bias in error estimation when using cross-validation for model selection. BMC Bioinform. 2006, 7, 91. [Google Scholar] [CrossRef] [Green Version]
  33. Wehrens, R.; Mevik, B.H. The Pls Package: Principal Component and Partial Least Squares Regression in R. J. Stat. Softw. 2007, 18, 1–23. [Google Scholar]
  34. Xie, Q.; Dash, J.; Huang, W.; Peng, D.; Qin, Q.; Mortimer, H.; Casa, R.; PignattiI, S.; Laneve, G.; Pascucci, S. Vegetation indices combining the red and red-edge spectral information for leaf area index retrieval. IEEE J. Sel. Top. Appl. Earth Obs. Remote Sens. 2018, 11, 1482–1493. [Google Scholar] [CrossRef] [Green Version]
  35. Dong, T.; Liu, J.; Shang, J.; Qian, B.; Kovacs, J.M.; Walters, D.; Jiao, X.; Geng, X.; Shi, Y. Assessment of red-edge vegetation indices for crop leaf area index estimation. Remote Sens. Environ. 2019, 222, 133–143. [Google Scholar] [CrossRef]
  36. Du, H.; Jiang, H.; Zhang, L.; Mao, D.; Wang, Z. Evaluation of spectral scale effects in estimation of vegetation leaf area index using spectral indices methods. Chin. Geogr. Sci. 2016, 26, 731–744. [Google Scholar] [CrossRef] [Green Version]
  37. Taddeo, S.; Dronova, I.; Depsky, N. Spectral vegetation indices of wetland greenness: Responses to vegetation structure; composition and spatial distribution. Remote Sens. Environ. 2019, 234, 111–467. [Google Scholar] [CrossRef]
  38. Maguigan, M.; Rodgers, J.; Dash, P.; Meng, Q. Assessing net primary production in Montane wetlands from proximal; airborne; and satellite remote sensing. ARS 2016, 5, 118–130. [Google Scholar] [CrossRef] [Green Version]
Figure 1. Map showing the location of the study area within KwaZulu-Natal, Pietermaritzburg.
Geographies 01 00011 g001
Figure 2. (A) Greater Edendale Wetland (rehabilitated wetland), (B) Willow fountain wetland (natural wetland) and (C) Typha Capensis, one of the two dominant wetland vegetation species.
Geographies 01 00011 g002
Figure 3. Box plots of LAI, where the grey box represents the natural wetland and the white box represents the rehabilitated wetland.
Geographies 01 00011 g003
Figure 4. LAI estimation accuracies (a,b) Bands, (c,d) Traditional Indices, (e,f) Simple Ration and (g,h) nDVI for natural and rehabilitated wetland, respectively.
Geographies 01 00011 g004aGeographies 01 00011 g004b
Figure 5. The relationship between measured and predicted LAI, (i) representing the natural wetland, (ii) representing the rehabilitated wetland and (iii) pooled dataset.
Geographies 01 00011 g005
Figure 6. The spatial distribution of LAI for natural wetlands (a) and (b) as well as rehabilitated wetland (c).
Geographies 01 00011 g006
Table 1. List of Sentinel-2 bands and vegetation indices used in this study.
Analysis StageVariable TypeVariableFormula
1All Sentinel 2 MSI bandsBlues green red NIR and red-edge
2Conventional VIsSRNIR/Red
SR.reNIR/Red-edge
NDVI(NIR−Red)/(NIR + Red)
NDWI(Green−NIR)/(Green -NIR)
GNDVI(NIR)/(Blue + NIR)
Chlgreen(NIR−Green)/(Green + Red)
TDVI√(NIR−Red)/(NIR + Red)
3Modified VIssRB1/B2 *
nDVI(B1−B2)/(B1 + B2) *
4Combined spectral variablesBands & VIs
5Pooled dataCombined wetlands & VIs
* Where B1 and B2 are any Sentinel 2 MSI spectral bands.
Table 2. Descriptive statistics of LAI (m2/m2) for natural and rehabilitated wetlands.
SamplesMinimumMaximumMeanStd. Dev
Natural Wetland LAI460.973.612.0510.602
Rehabilitated Wetland LAI520.755.073.0421.176
Publisher’s Note: MDPI stays neutral with regard to jurisdictional claims in published maps and institutional affiliations.

