
Bibliometric Analysis of Remote Sensing of Inland Waters Publications from 1985 to 2020


Department of Experimental Limnology, Leibniz-Institute of Freshwater Ecology and Inland Fisheries, 12587 Berlin, Germany
Geographies 2021, 1(3), 346-361; https://0-doi-org.brum.beds.ac.uk/10.3390/geographies1030019
Submission received: 15 October 2021
/
Revised: 26 November 2021
/
Accepted: 1 December 2021
/
Published: 4 December 2021
(This article belongs to the Special Issue Early Career Scientists’ (ECS) Contributions to Geographies)
Abstract
:Over the past few decades, there has been a significant increase in the number of studies about the use of remote sensing techniques for the monitoring of inland waters. Since these aquatic environments have multiple uses for mankind, monitoring them is essential for the environment, society, and the economy. The use of Earth Observations data for the monitoring of inland waters is important for water quantity and quality management. Because of this, the goal of the present study is to systematically analyze and visualize the evolution of publications in this field. This study will not focus on algorithm comparisons or descriptions; instead, it will use a co-citation analysis to map the relationship among publications. Using the Web of Science database, publications related to the terms, “remote sensing” + “inland waters”, were analyzed using the entire database. The bibliometric analysis showed how research topics evolved from measuring optical properties and understanding their signal to the development of remote sensing algorithms and their applications to satellite imagery. This study provides the historical development of the scientific publications in this field and points out what could be the direction for future research.
1. Introduction
In the past few decades, the use of Earth Observation (EO) technologies for monitoring the environment has become a common tool to support scientists, managers, and policy makers [1]. However, EO data is not yet used as an operational data source for monitoring inland water quality [2], especially due to the lack of EO sensors with the adequate spatial and spectral resolution [3]. Considering that lakes and reservoirs cover a total of 2.93 × 10⁶ km2 or 1.82% of global area land [4] and the fact that these aquatic environments provide multiple services for mankind [5], it is essential to monitor water quality.
Current EO sensors were not developed for the estimation of water quality for small to medium aquatic systems due to the tradeoff among the spatial, spectral, radiometric, and temporal resolutions [6]. Nevertheless, there is a growing body of research using land design satellite sensors such as the Landsat 8 Operational Land Imager (OLI) and Sentinel 2 Multispectral Instrument (MSI) to study inland waters [3,7,8,9,10]. Recently, the use of unmanned aerial vehicles (UAVs) has been proposed for monitoring these aquatic systems [11,12].
Because of the growing interest in the use of remote sensing techniques to monitor inland waters, it is important to revise the evolution of techniques and technology to understand the state of the art knowledge. However, previous reviews focused more on the comparison of remote sensing algorithms instead of evaluating the time series of publications [13,14,15,16,17,18]. Therefore, there is a lack of bibliometric analysis of the scientific production in the field of remote sensing of inland waters.
The goal of this study is to conduct a bibliometric analysis to understand the evolution of this research field based on published work. To accomplish this objective, this review is based on a quantitative approach to analyzing research articles collected from the Web of Science (WoS) Core Collection database between 1985 and 2020.
2. Materials and Methods
2.1. Data Acquisition
In this research, publications from 1985 to 2020 were analyzed from the WoS database (http://0-www-webofknowledge-com.brum.beds.ac.uk/ (accessed on 7 October 2021)). Data acquisition was based on the search for the terms “remote sensing” + “inland water” in the titles, keywords, and abstracts. The type of research was defined to be articles and reviews, which resulted in a dataset containing 843 publications published between January 1985 and December 2020.
2.2. Methodology
Compared with existing reviews on remote sensing of inland waters [13,14,15,16,17,18], the present study will not focus on the descriptions and comparisons of remote sensing algorithms. Instead, this study will provide a quantitative and comprehensive analysis of the publications in this research field during the period.
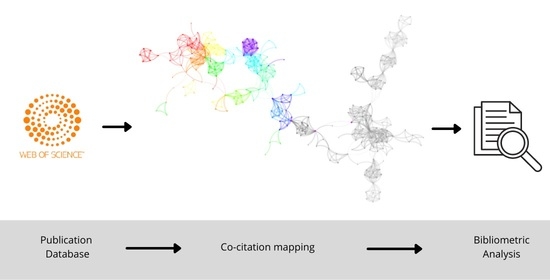
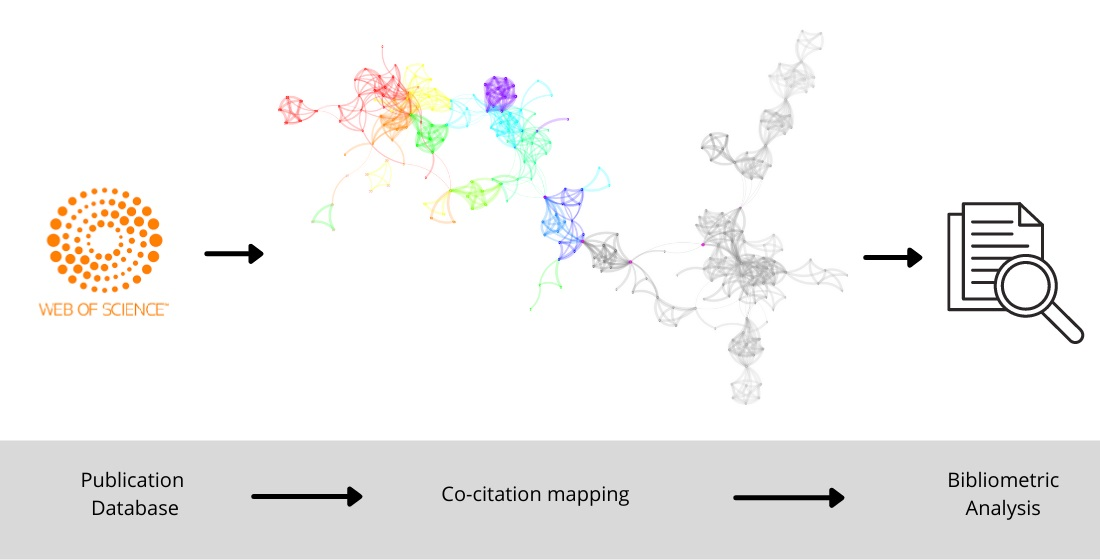
The bibliometric analysis was done using CiteSpace (v.5.8 R2), a Java-based software for bibliometric analysis of scientific publications, which provides tools for data visualization and analysis of trends and patterns by bibliographic coupling, cluster maps, and dual-map overlays (https://citespace.podia.com/ (accessed on 7 October 2021)) [19,20,21]. Because of these functions, CiteSpace was chosen due to its capabilities in the visualization of co-citation maps [20]. In this study the following capabilities of the software were used: (1) the co-citation analysis and (2) the bibliometric mapping. The dataset described in Section 2.1 was analyzed using document co-citation analysis. This is based on a network of co-cited references that reveal underlying intellectual structures based on how two research articles may be linked. The connection between two publications is based on the number of times that they have been cited together. If the frequency of co-citation between the two publications is high, the ideas presented in both works are strongly linked.
In this study, the bibliometric analysis was defined for the entire period of the publications (from 1985 to 2020) and for each decade (1980s, 1990s, 2000s and 2010s) plus the year 2020. Each decade was analyzed to evaluate the relationships between key ideas in a field for each period, which were compared to assess the evolution of the field. To accomplish this, citation clusters were computed for each period by clustering algorithms implemented in CiteSpace [19,20], where the label of each cluster was extracted from the article’s abstract using the common terms from the latent semantic indexing (LSI) and Log-Likelihood Ratio (LLR). For the mapping of clusters, the most co-cited publication within each cluster was highlighted to give an idea of the topic of the publications within each cluster.
3. Results
3.1. Scientific Production
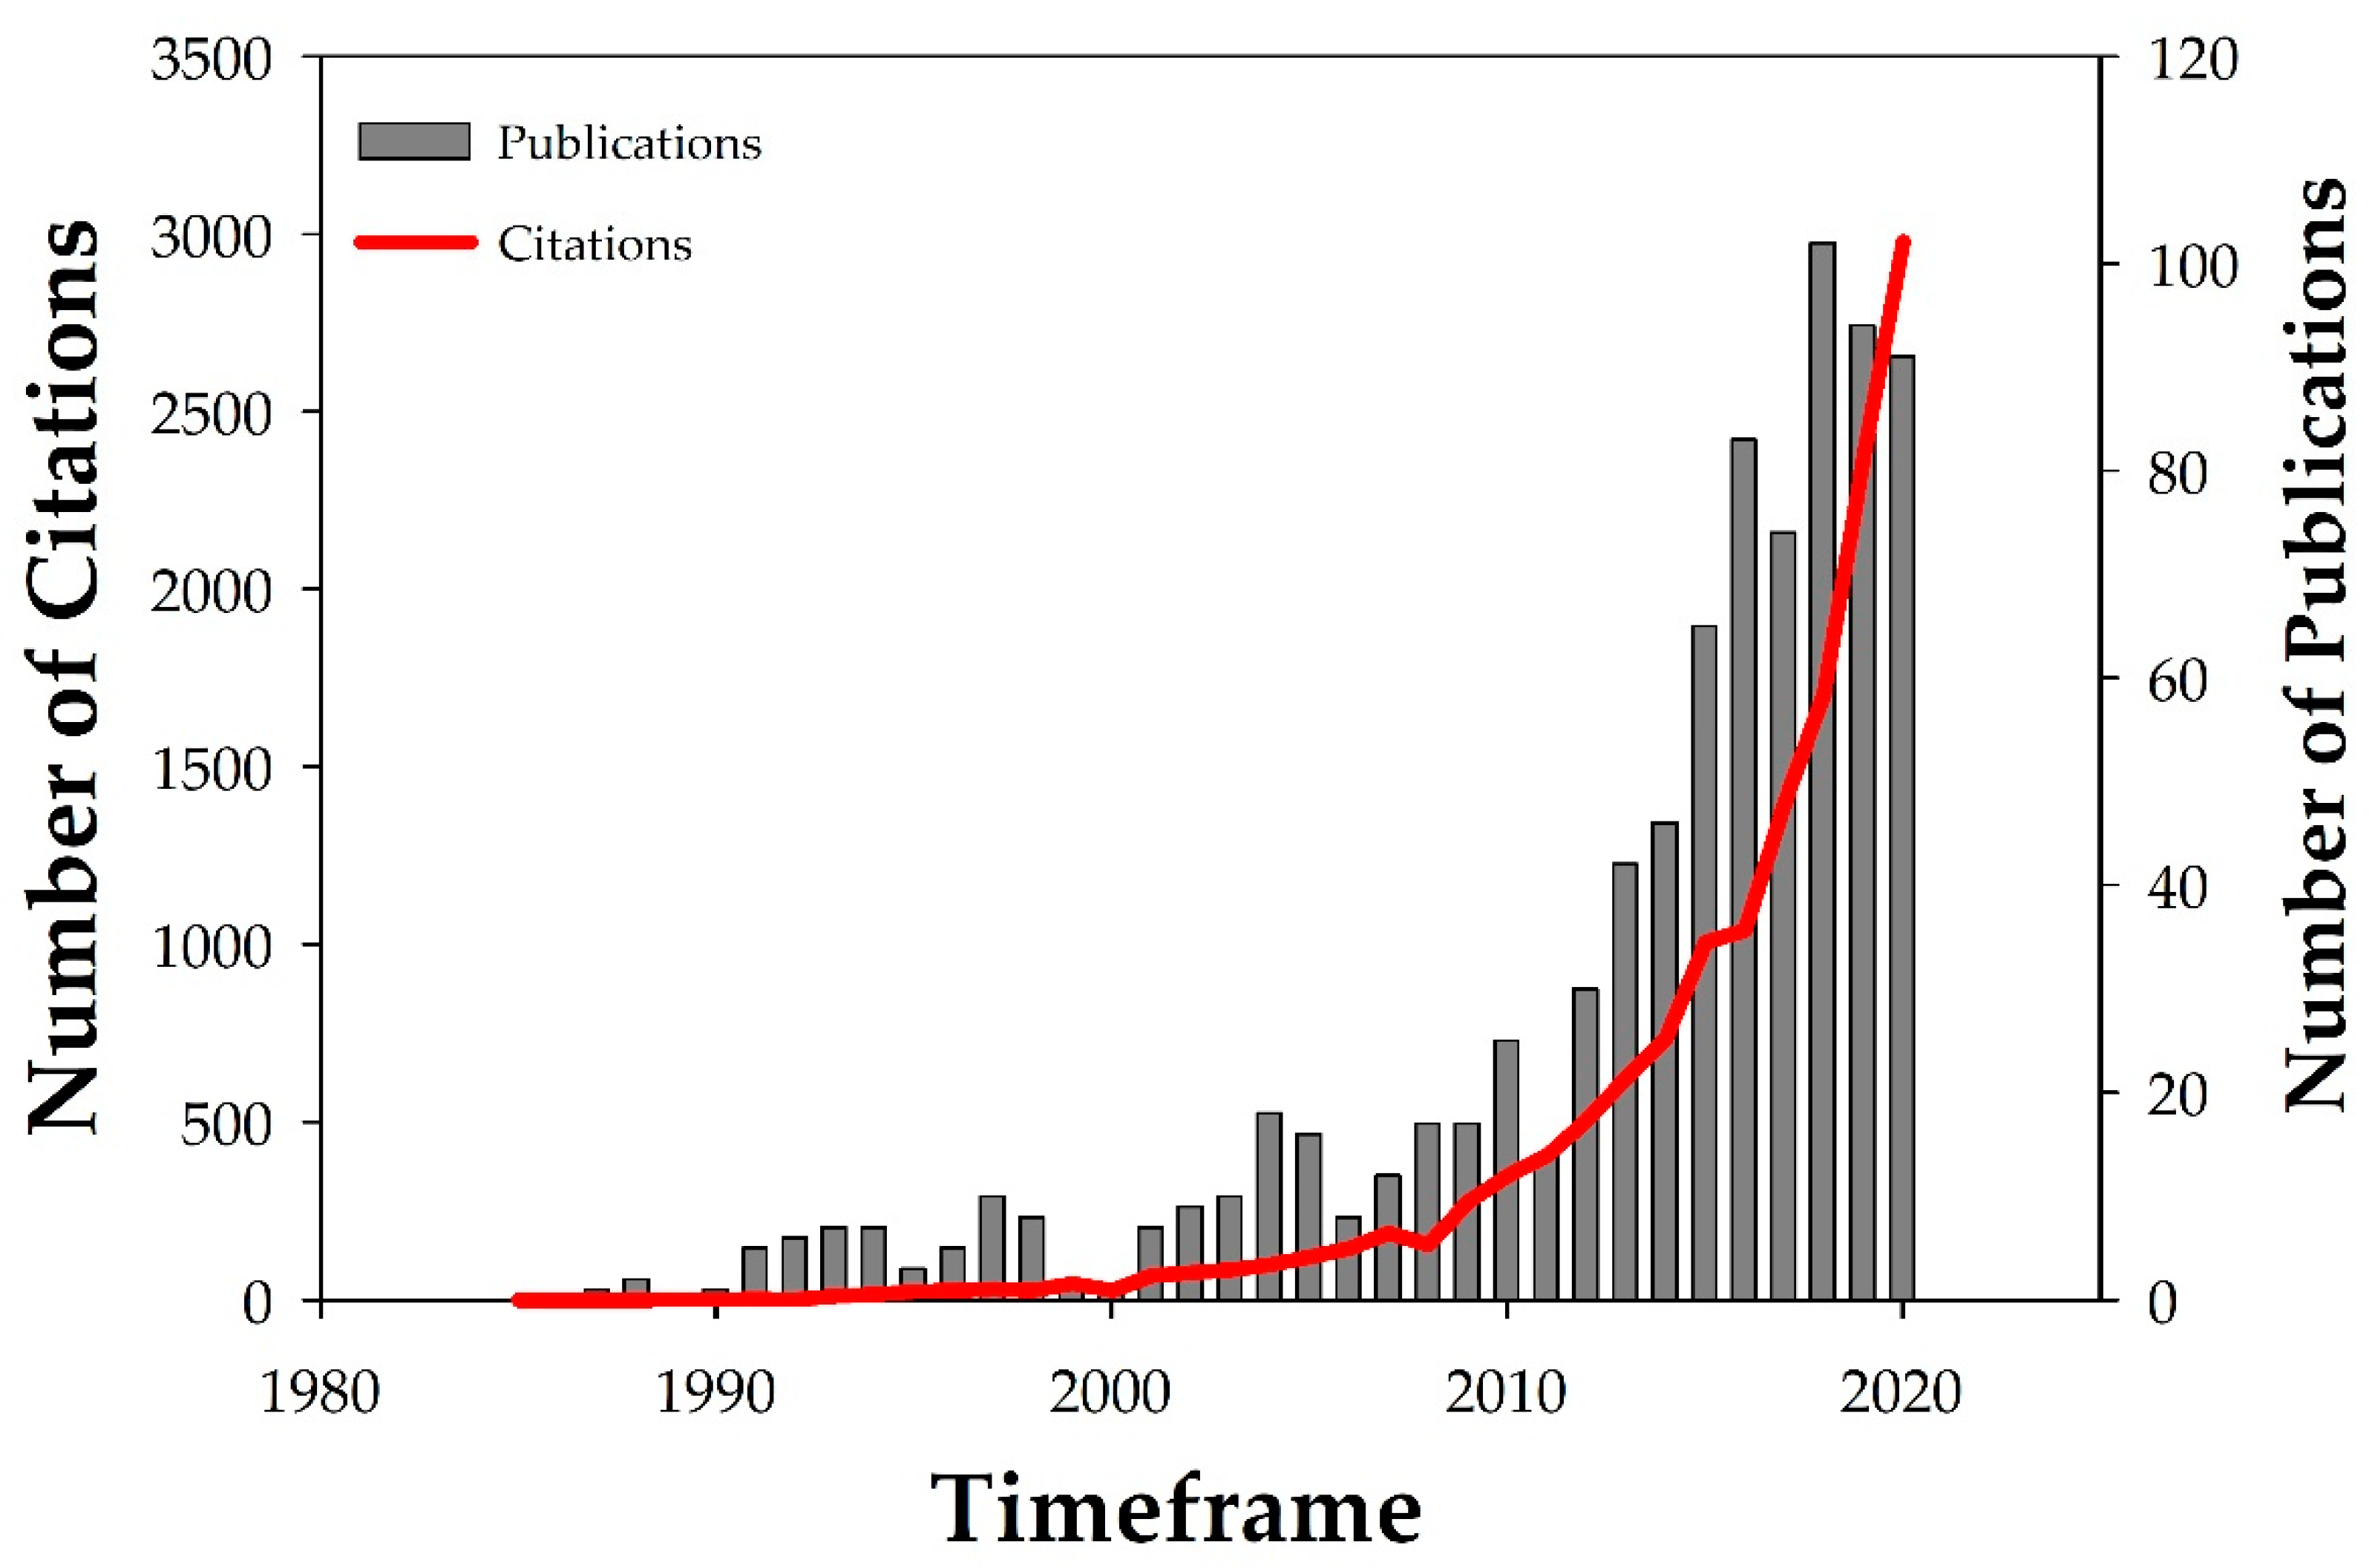
There is a clear and fast increase in the number of research papers published in this field in the last decade within the WoS database (Figure 1). In the 1980s only six publications were found in the database, corresponding to 0.71% of all publications in this field. In the 1990s the number of publications increased to 57, which corresponds to 6.76% of all publications. This number more than doubled in the 2000s, with 120 publications corresponding to 14.23% of the total publications. The highest increase in the number of publications was observed in the 2010s (with the addition of the year 2020 in this series), which had 660 publications (78.30% of the total). These numbers highlight the importance of this field of science, which is in its growth stage and still has lots of space to grow, especially with the development of new sensors.
The bibliometric analysis for the entire period (1985–2020) generated a list of the top 10 journals in terms of number of citations, which is shown in Table 1. From this list, the five journals are in the field of remote sensing, two journals are in the field of physics (optics), one journal is in the field of geophysics, one journal is in the field of sciences, and one journal is in the field of limnology. The most cited journal is Remote Sensing of Environment with 549 citation counts, and the journal Remote Sensing is in second place with a count of 284 citations. Despite the big difference between the most cited journal and the second most cited journal, it is important to highlight that the first was launched in 1969 while the second was launched in 2009.
3.2. Bibliometric Analysis from the 1980s
Unfortunately, there were only six publications identified in the Web of Science database for this period. Therefore, the bibliometric analysis over this period was not possible. The main references used in the 1980s are: Bukata et al. [22], Bukata et al. [23], and Jerlov [24]. The first publication is a scientific report evaluating the direct measurements of optical parameters as a means of estimating water quality indicators (concentrations of chlorophyll-a (chl-a), total suspended solids (TSS), and colored dissolved organic matter (CDOM)) [22]. The second was also a scientific report about the optical measurements in the turbid waters of Lake St. Clair in Canada [23]. Finally, the third publication was not published in this period; however, it was an important reference to this period since it is a book compiling the existing knowledge of the light and water interaction [24].
Based on the publications in this period, it was observed that the main topics in this period were (1) the development of methods for the proximal measuring optical properties in lake waters, especially the apparent optical properties (AOPs) [23]; and (2) the correlation of the in situ measured AOPs and water quality parameters [22].
3.3. Bibliometric Analysis from the 1990s
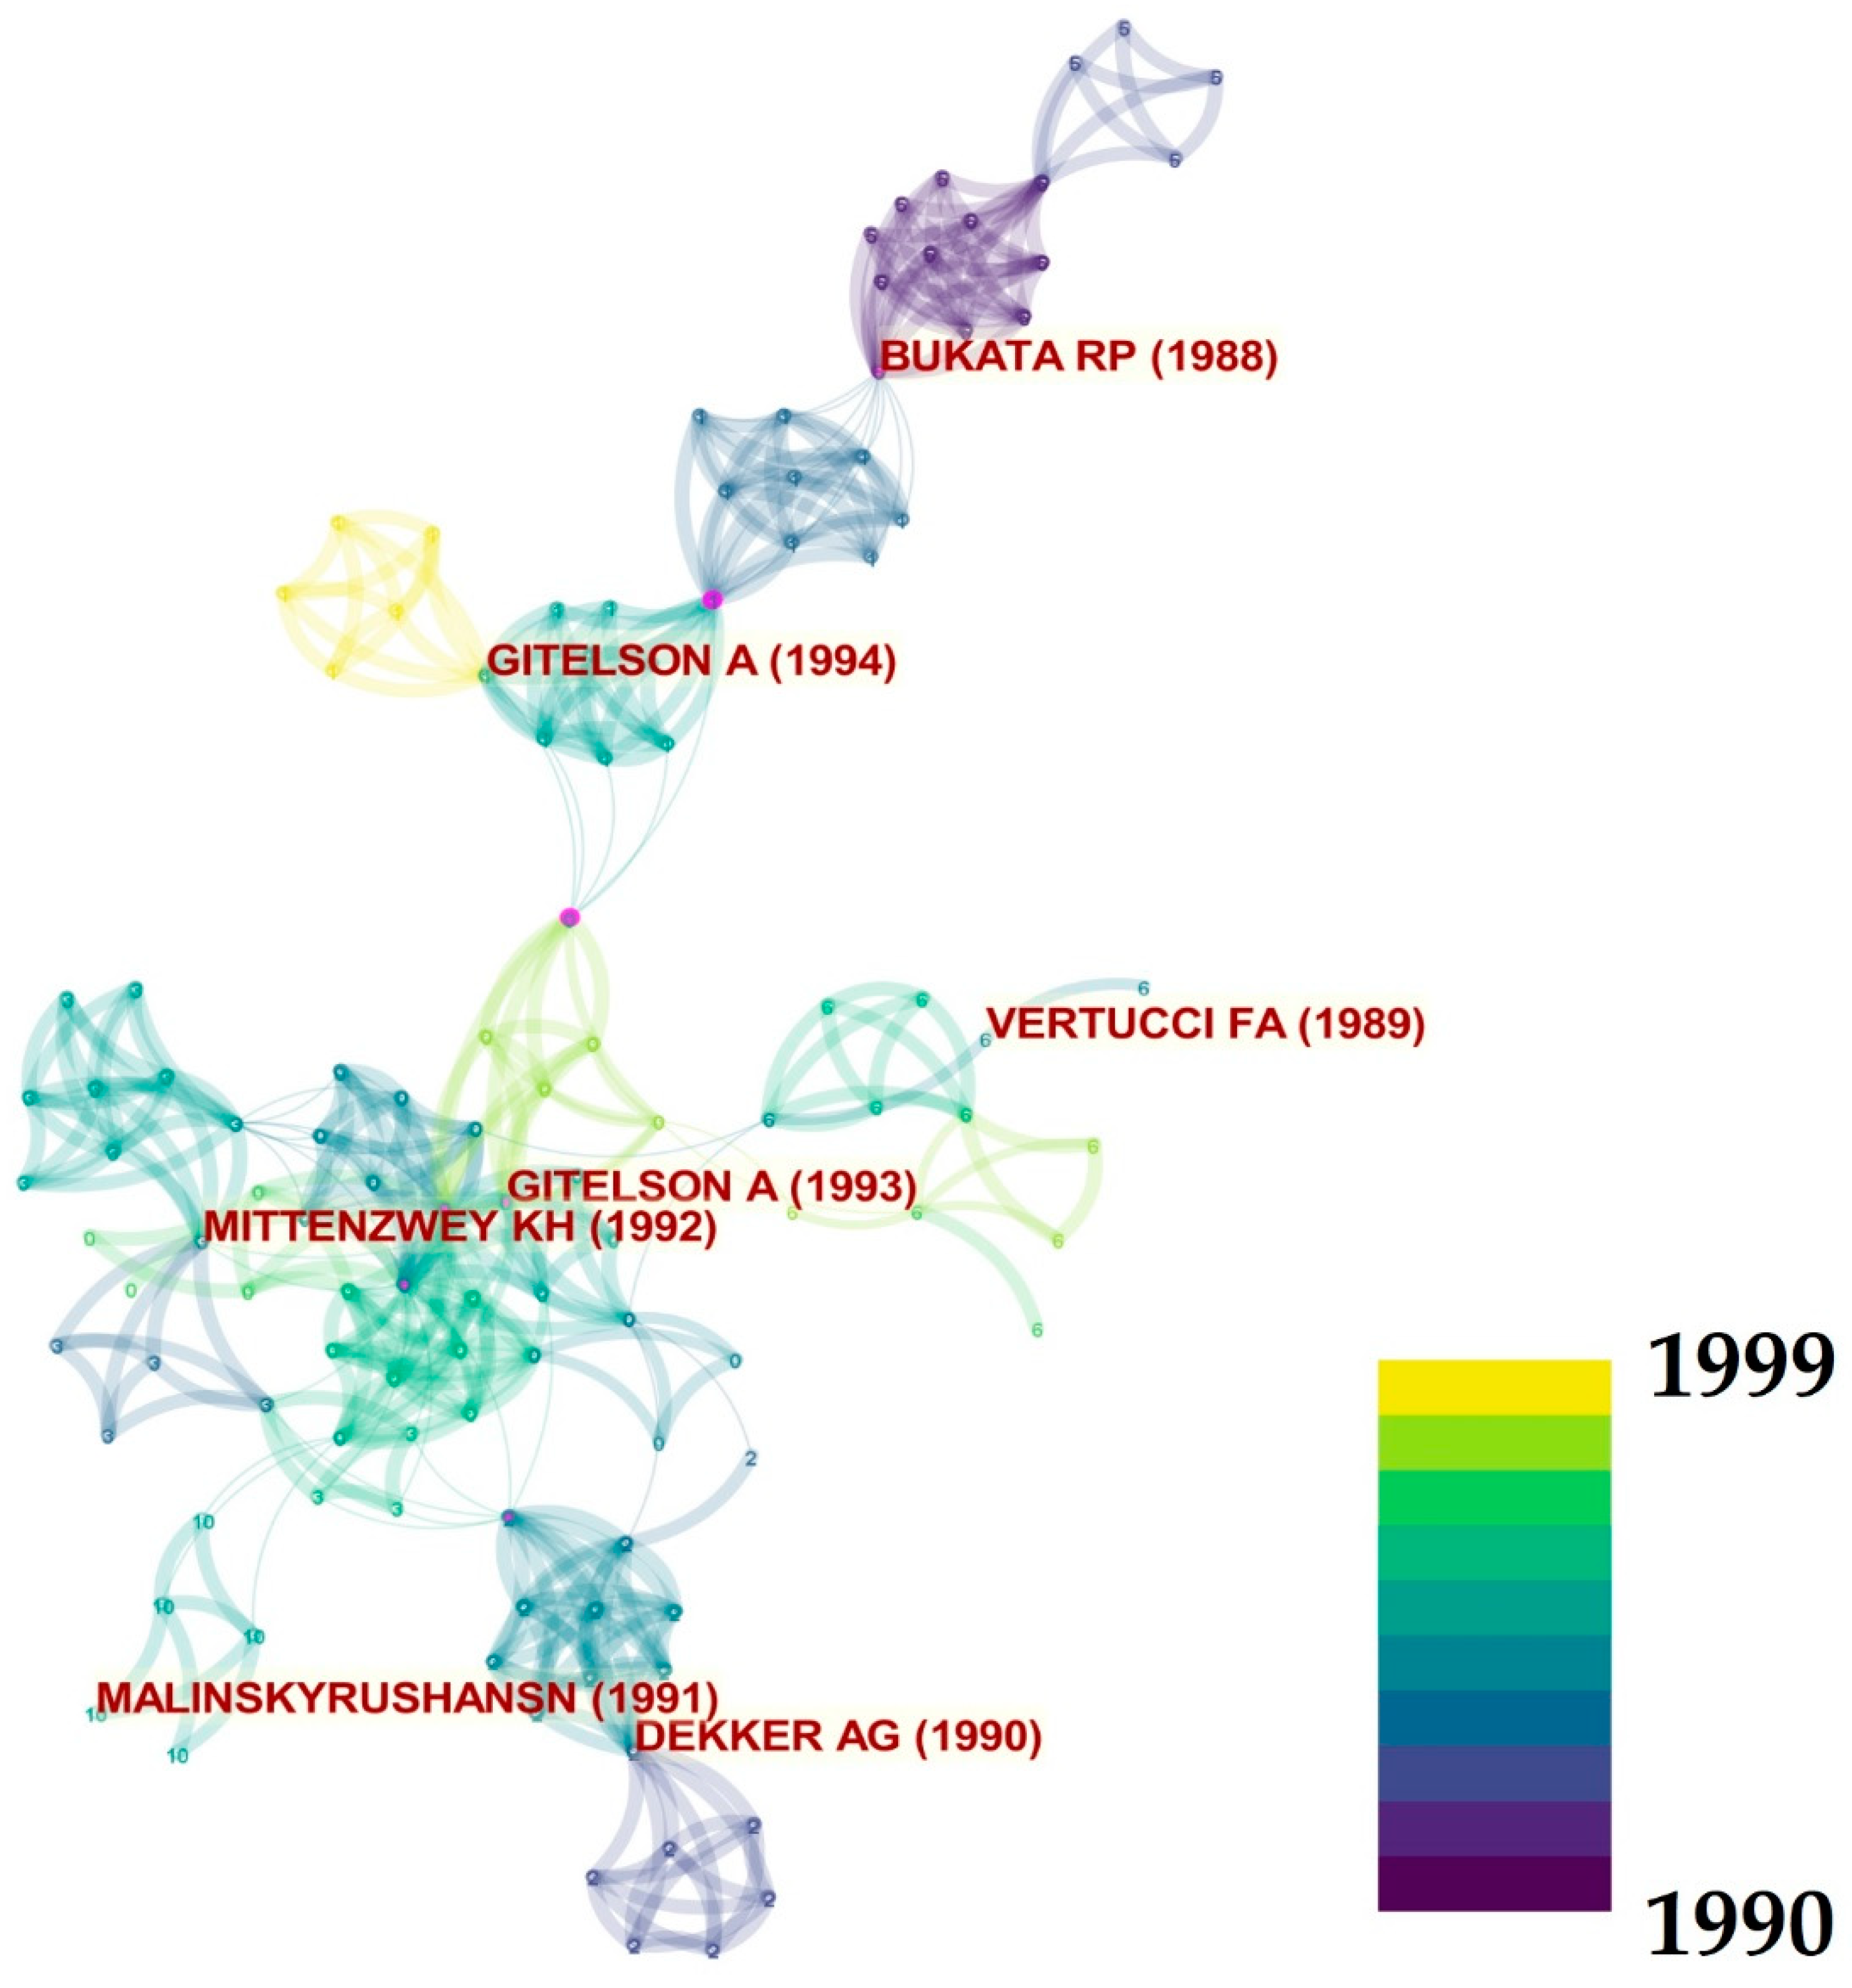
During the 1990s there was a small increase in the number of scientific publications in this field (Figure 1). With 57 publications, it was possible to perform a bibliometric mapping of the co-citations in which colors represent the year of each publication (Figure 2). Seven clusters of publications were identified, and for each cluster, the most co-cited publication was also highlighted in Figure 2 to map the topics covered in this cluster. These references cover different aspects of the field such as development of a system to measure in situ AOPs from a boat [25], the use of in situ AOPs for the estimation of dissolved organic carbon (DOC) [26], the selection of spectral bands for the estimation of water quality parameters [27], the monitoring of picocyanobacteria [28], the estimation of chl-a concentration [29,30], and the use of band ratios for estimating water quality parameters [31]. Unfortunately, the software is not very accurate on the retrieval of the lead authors names of each publication, but the reference for each publication can be found in Table 2.
Table 2 also presents the mutual terms found in both LSI and LLR analyses of the abstracts from each publication per cluster. Based on these term analyses, it was observed that for this period the publications on the use of multispectral data, especially from Landsat Thematic Mapper (TM), were for the computation of band ratios to estimate water quality parameters such as secchi disk, DOC, water color, and eutrophication. The relationship between band ratios and water quality parameters was mainly established using linear regression.
3.4. Bibliometric Analysis from the 2000s
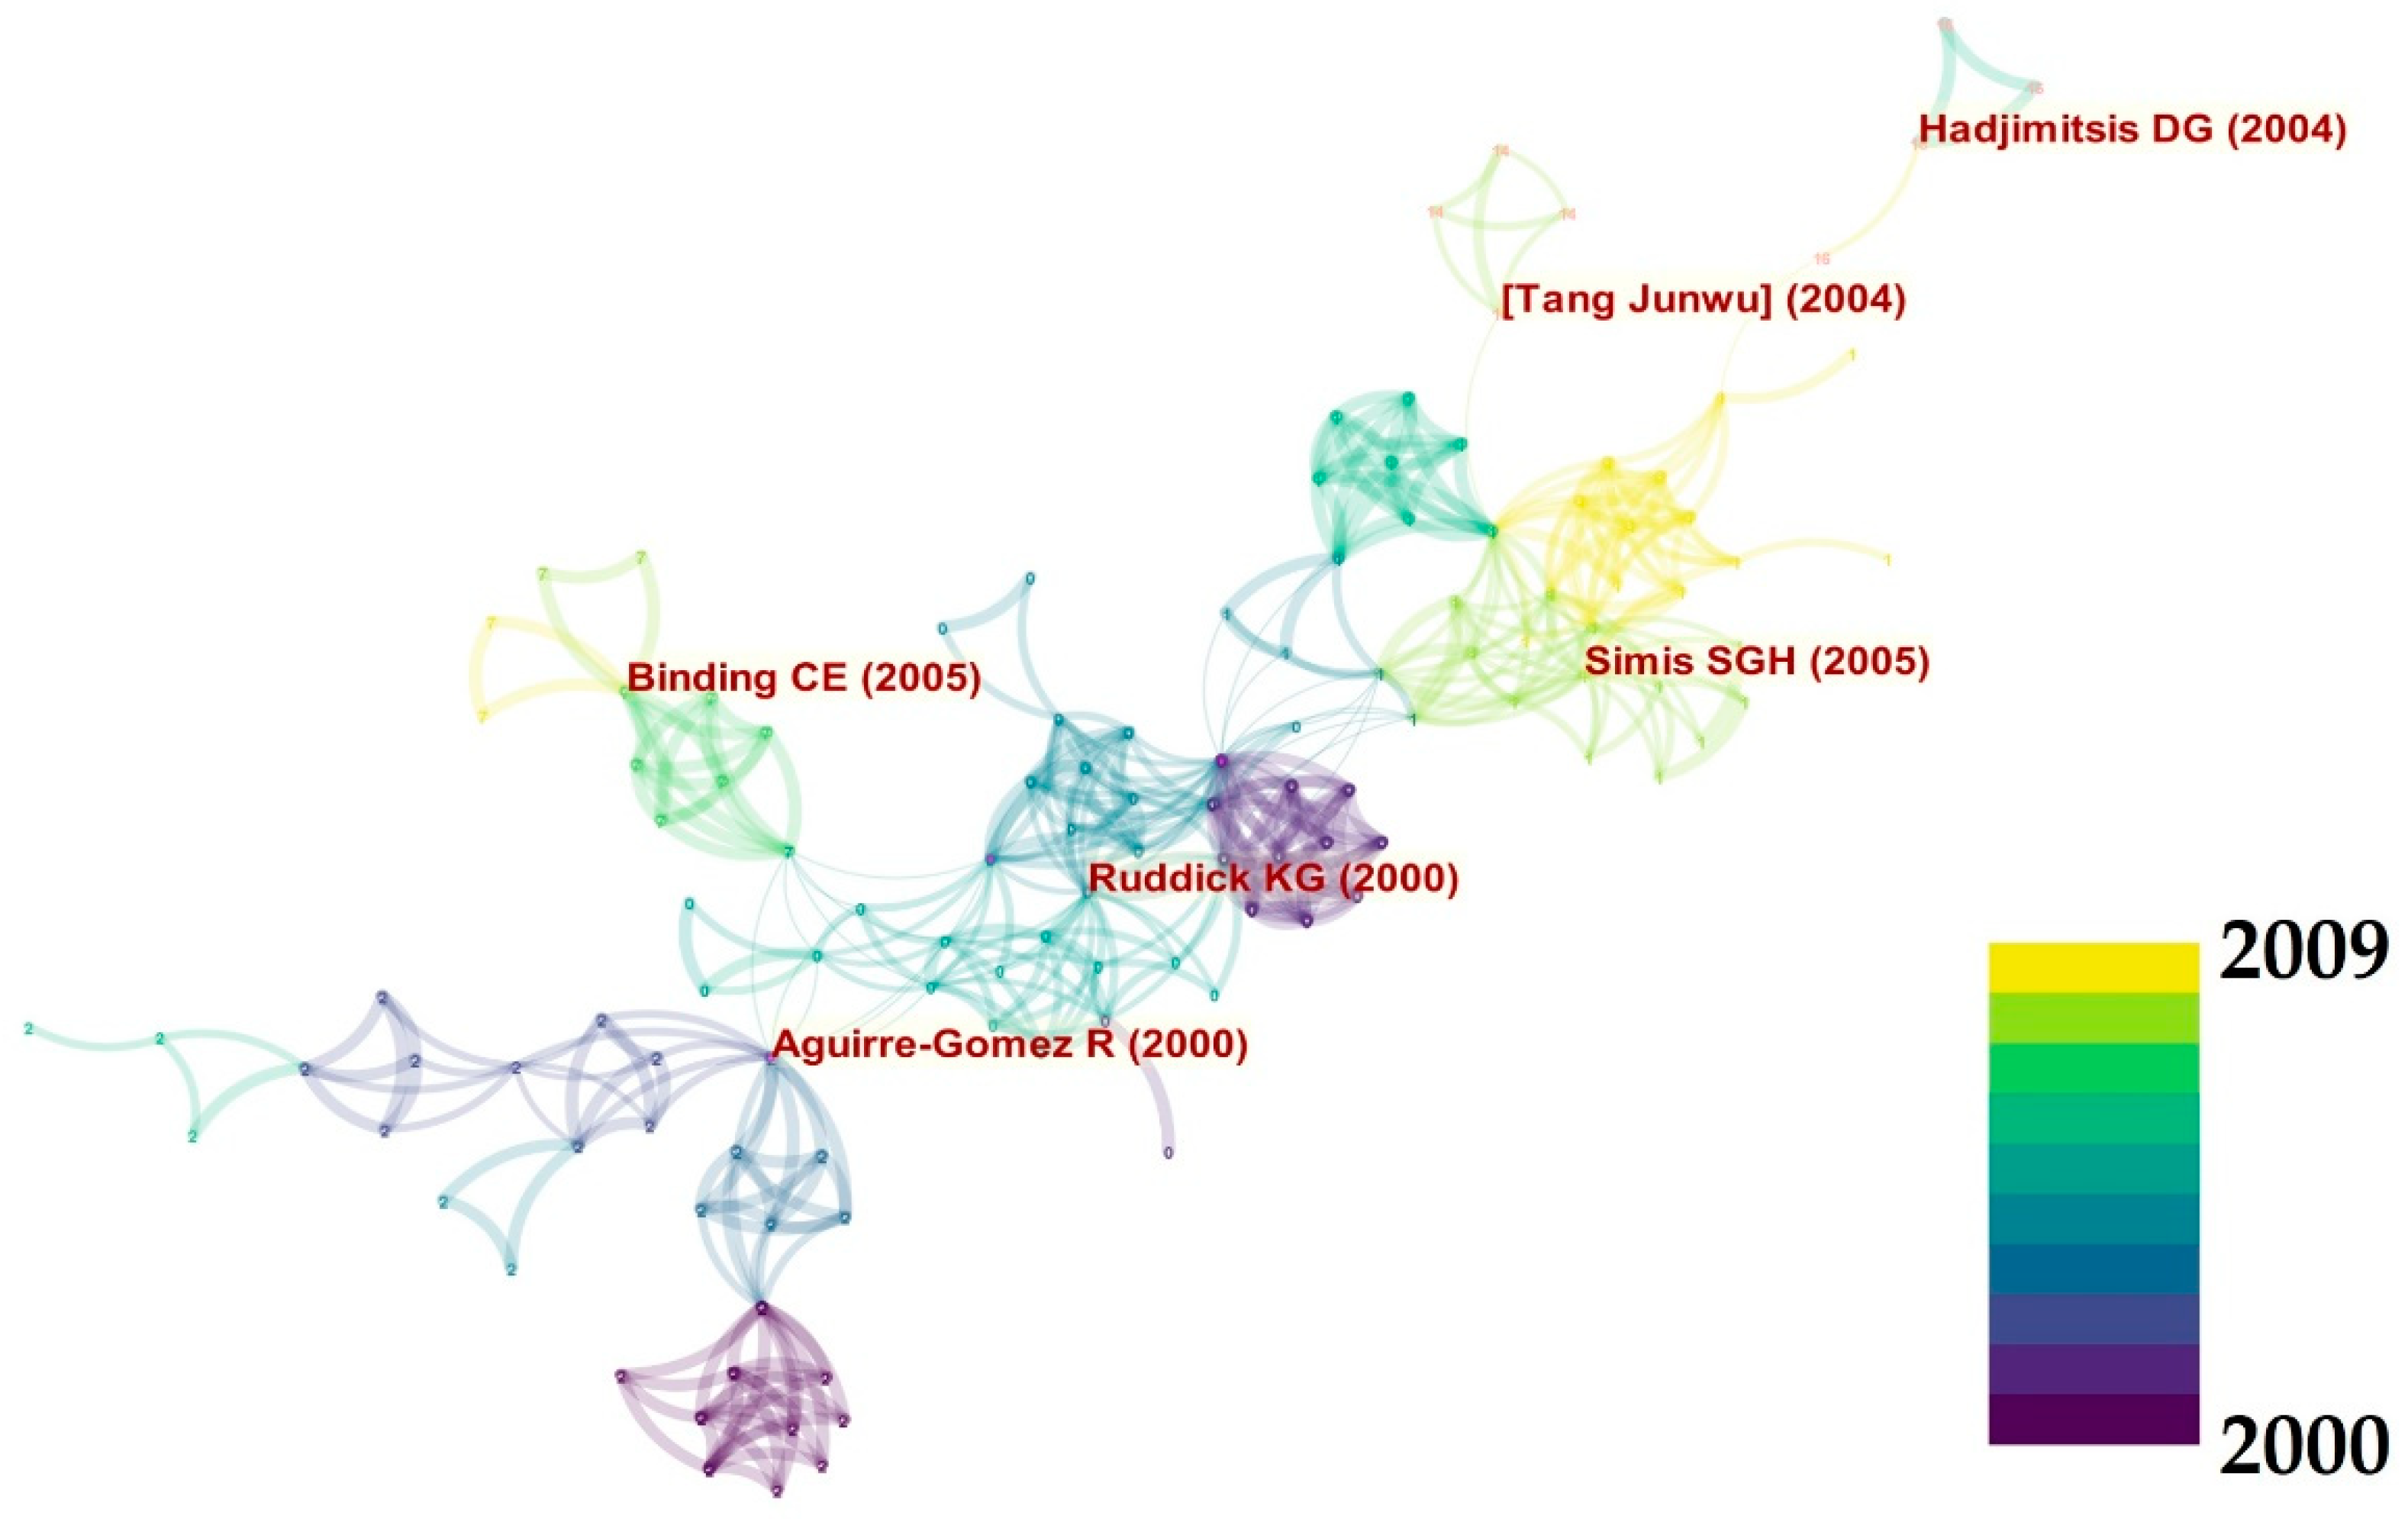
In the 2000s, with the increase in the number of publications to 120, the bibliometric analysis was performed. For this period, a total of six clusters were identified based on the co-citation mapping (Figure 3), and for the 1990s period (Figure 2) the main references for each cluster were identified. These main references cover different topics such as the detection of suspended sediments using proximal remote sensing and satellite data for coastal waters [32,33], atmospheric correction for ocean color sensors over coastal and inland waters [34], evaluation of atmospheric corrections for Landsat TM images over inland waters [35], establishment of a protocol for the measurement of AOPs over water [36], and the estimation of phycocyanin (PC) from proximal remote sensing measurements [37]. As in the previous subsection, Table 3 shows the full reference for each of the main identified publications as well as the mutual terms found in both LSI and LLR analyses.
Terms for this period (Table 3) changed from the previous ones (Table 2), and it was observed that instead of looking for band ratios, publications in this period were interested in understanding the spectrum of the remote sensing reflectance (Rrs) in the visible and near infrared range by distinct absorption troughs and fluorescence properties. In addition, there was a noticeable change in the interest in water quality parameters such as PC and other phytoplankton pigments as well as the development of atmospheric correction for satellite imagery.
3.5. Bibliometric Analysis from the 2010s + 2020
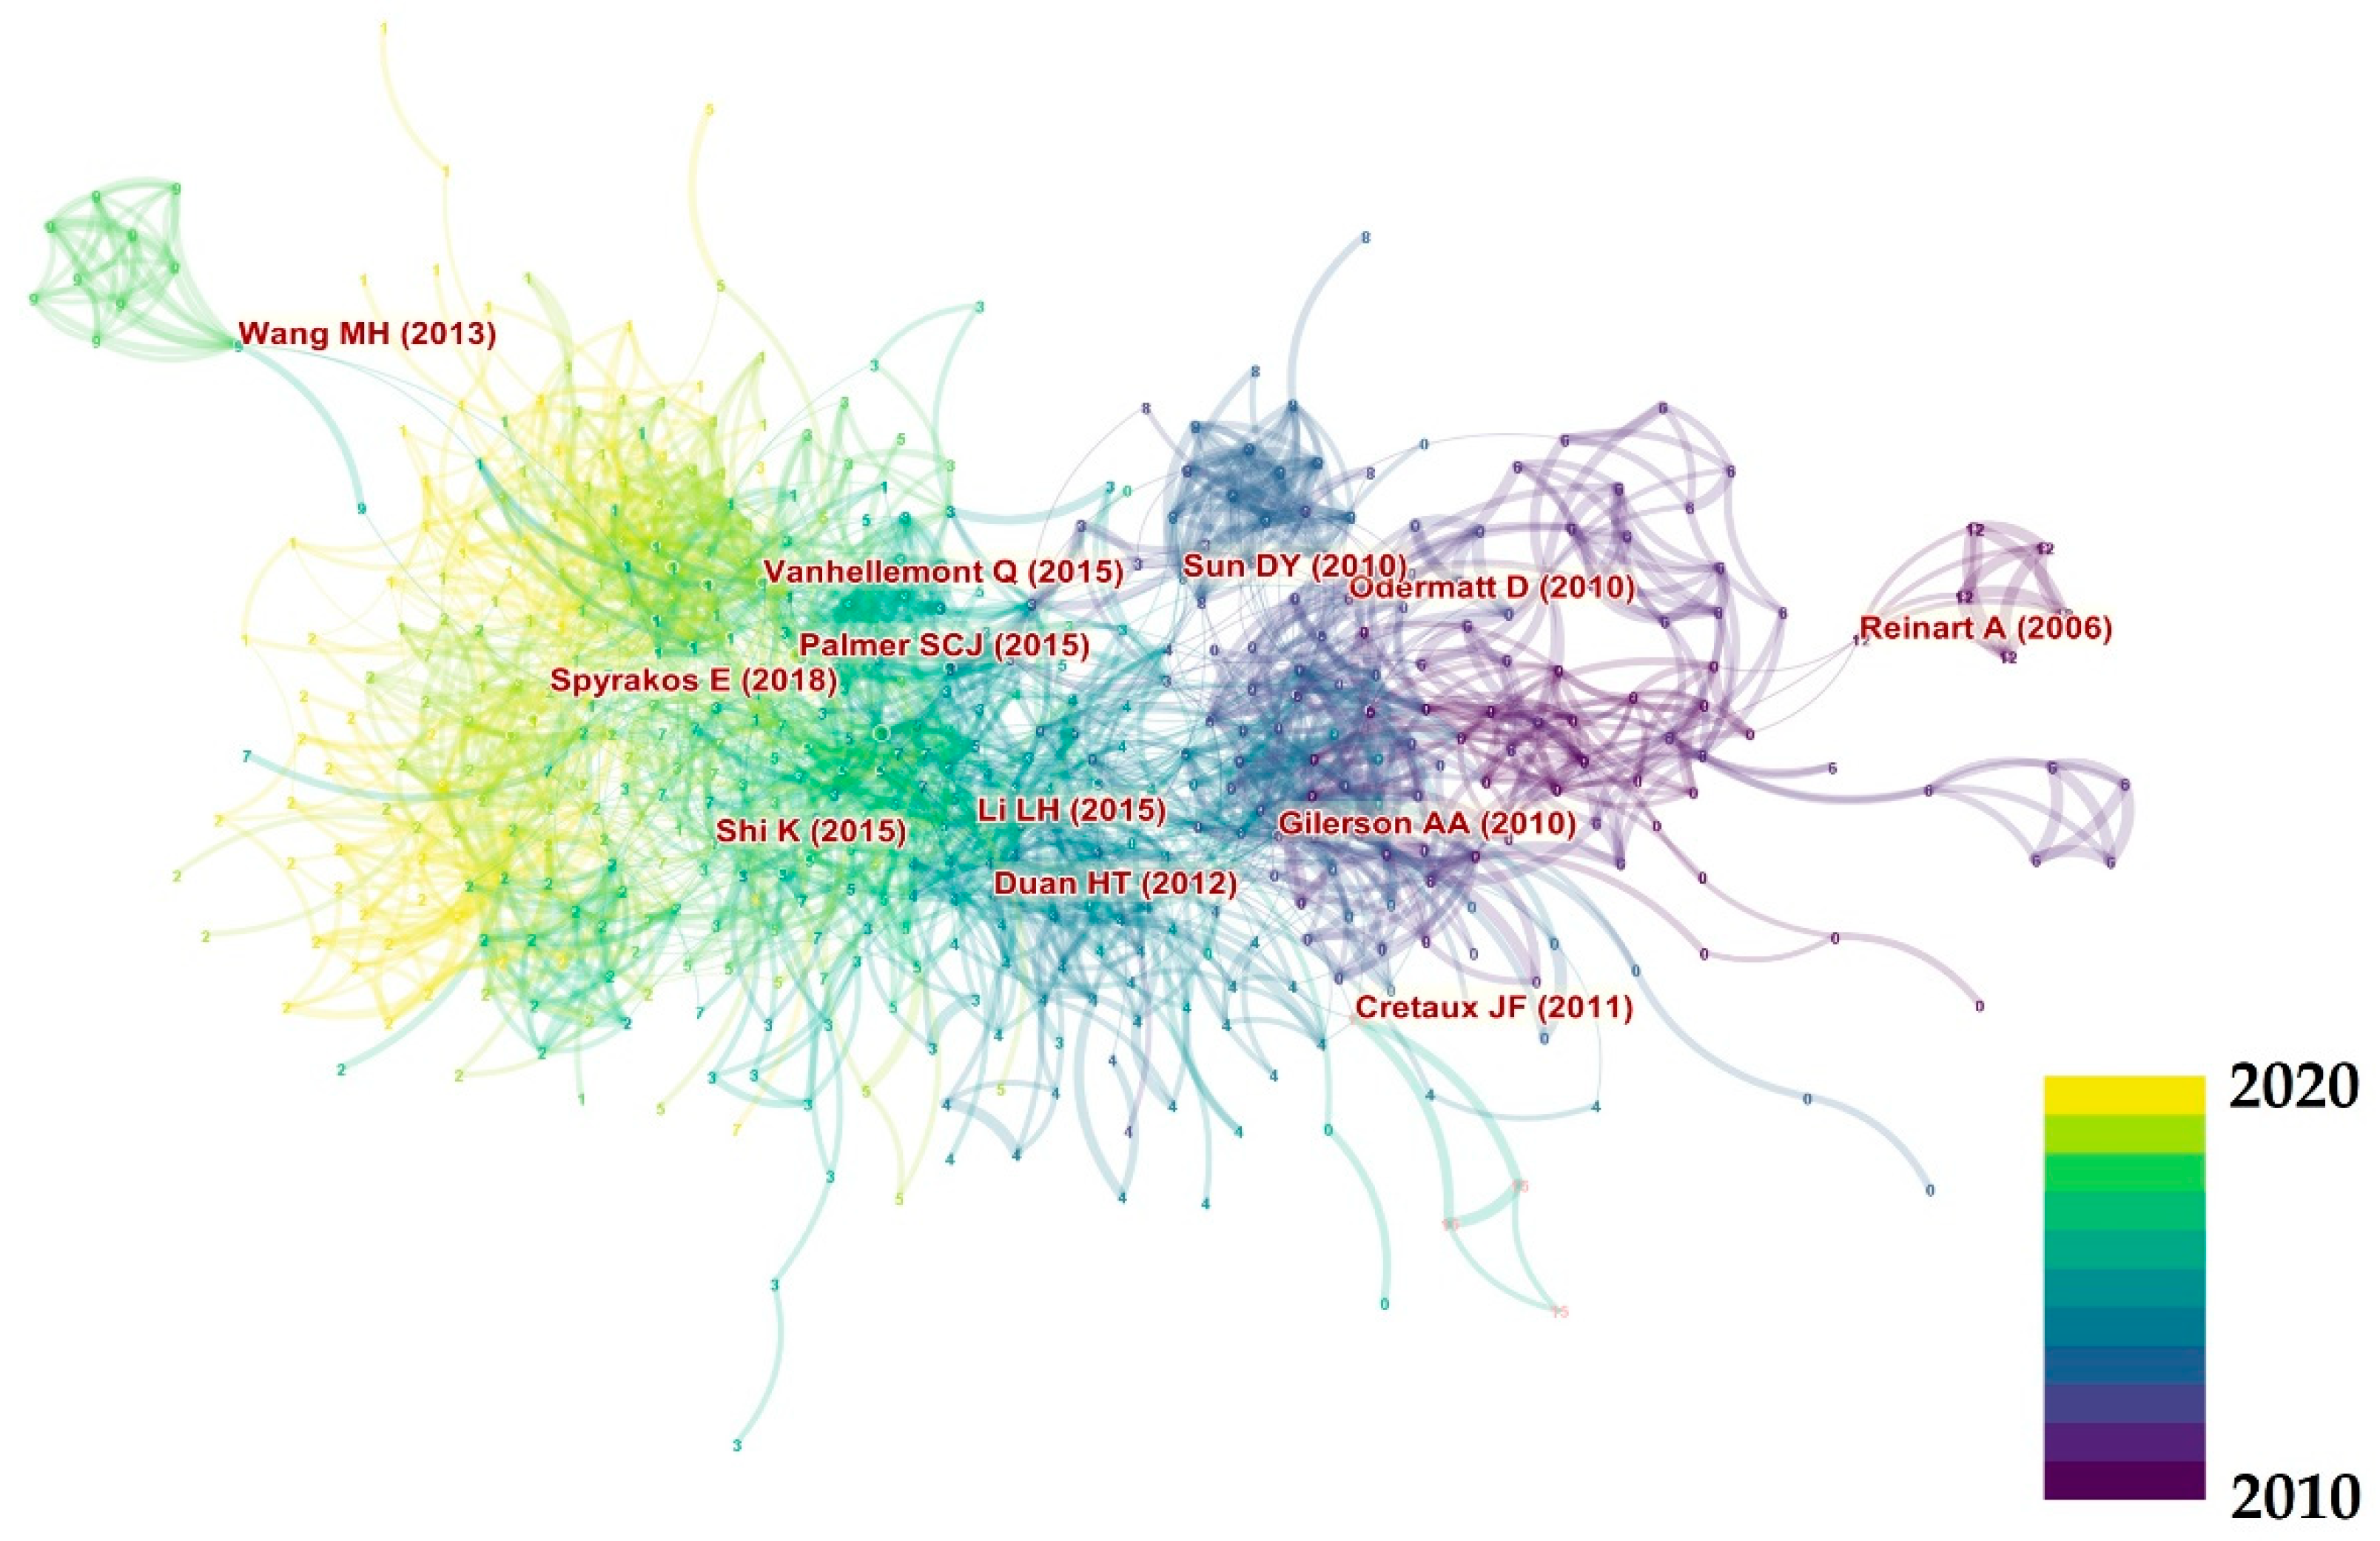
The main increase in the number of publications happened in this last period from 2010 to 2020 (Figure 1). With 660 publications in this period, the co-citation mapping was able to detect 12 clusters which were labeled with the main reference within each cluster (Figure 4). The main references covered topics that are different from previous periods, showing a temporal variability of the covered topics. In this period, publications covered topics such as the detection of cyanobacteria blooms using satellite imagery [38], the retrieval of chl-a concentrations from lakes using satellite data [39,40], the retrieval of total suspended solids using satellite data and machine learning [41,42], the estimation of lake surface area [43], the retrieval of cyanobacteria pigments from proximal remote sensing data [44], the production of level 2 ocean color satellite products [45], the development of a quasianalytical algorithm for the estimation of IOPs (Inherent Optical Properties) [46], a review of the field [47], an atmospheric correction for inland waters [48], and the development of an optical water class classification [49].
Table 4 shows the mutual terms found in both LSI and LLR analyses of the abstracts from each publication by co-citation cluster. The main terms were diverse and show a large variability if compared to previous periods (Table 2 and Table 3). In this period, the types of algorithms were observed using terms such as: three-band algorithm, GA-PLS (Genetic Algorithm-based Partial Least Squares), SVR (Support Vector Regression) algorithm, neural network, semianalytical model, and quasianalytical algorithm. For the water quality parameters, the new terms are: drinking water, terrestrial humic-like component, nutrients, heavy metal, algal growth, phytoplankton bloom, biogeochemical product, cyanobacteria bloom, and water clarity. Finally, other terms that are new are related to the atmospheric correction and optical water typology: water pixel, classification-based method, shallow water, and atmospheric contribution. These terms showed that in this period the references were mostly related to bio-optical algorithm development for different water quality parameters while considering water typology and atmospheric contributions.
3.6. Co-Citation Mapping for the Entire Period (1985–2020)
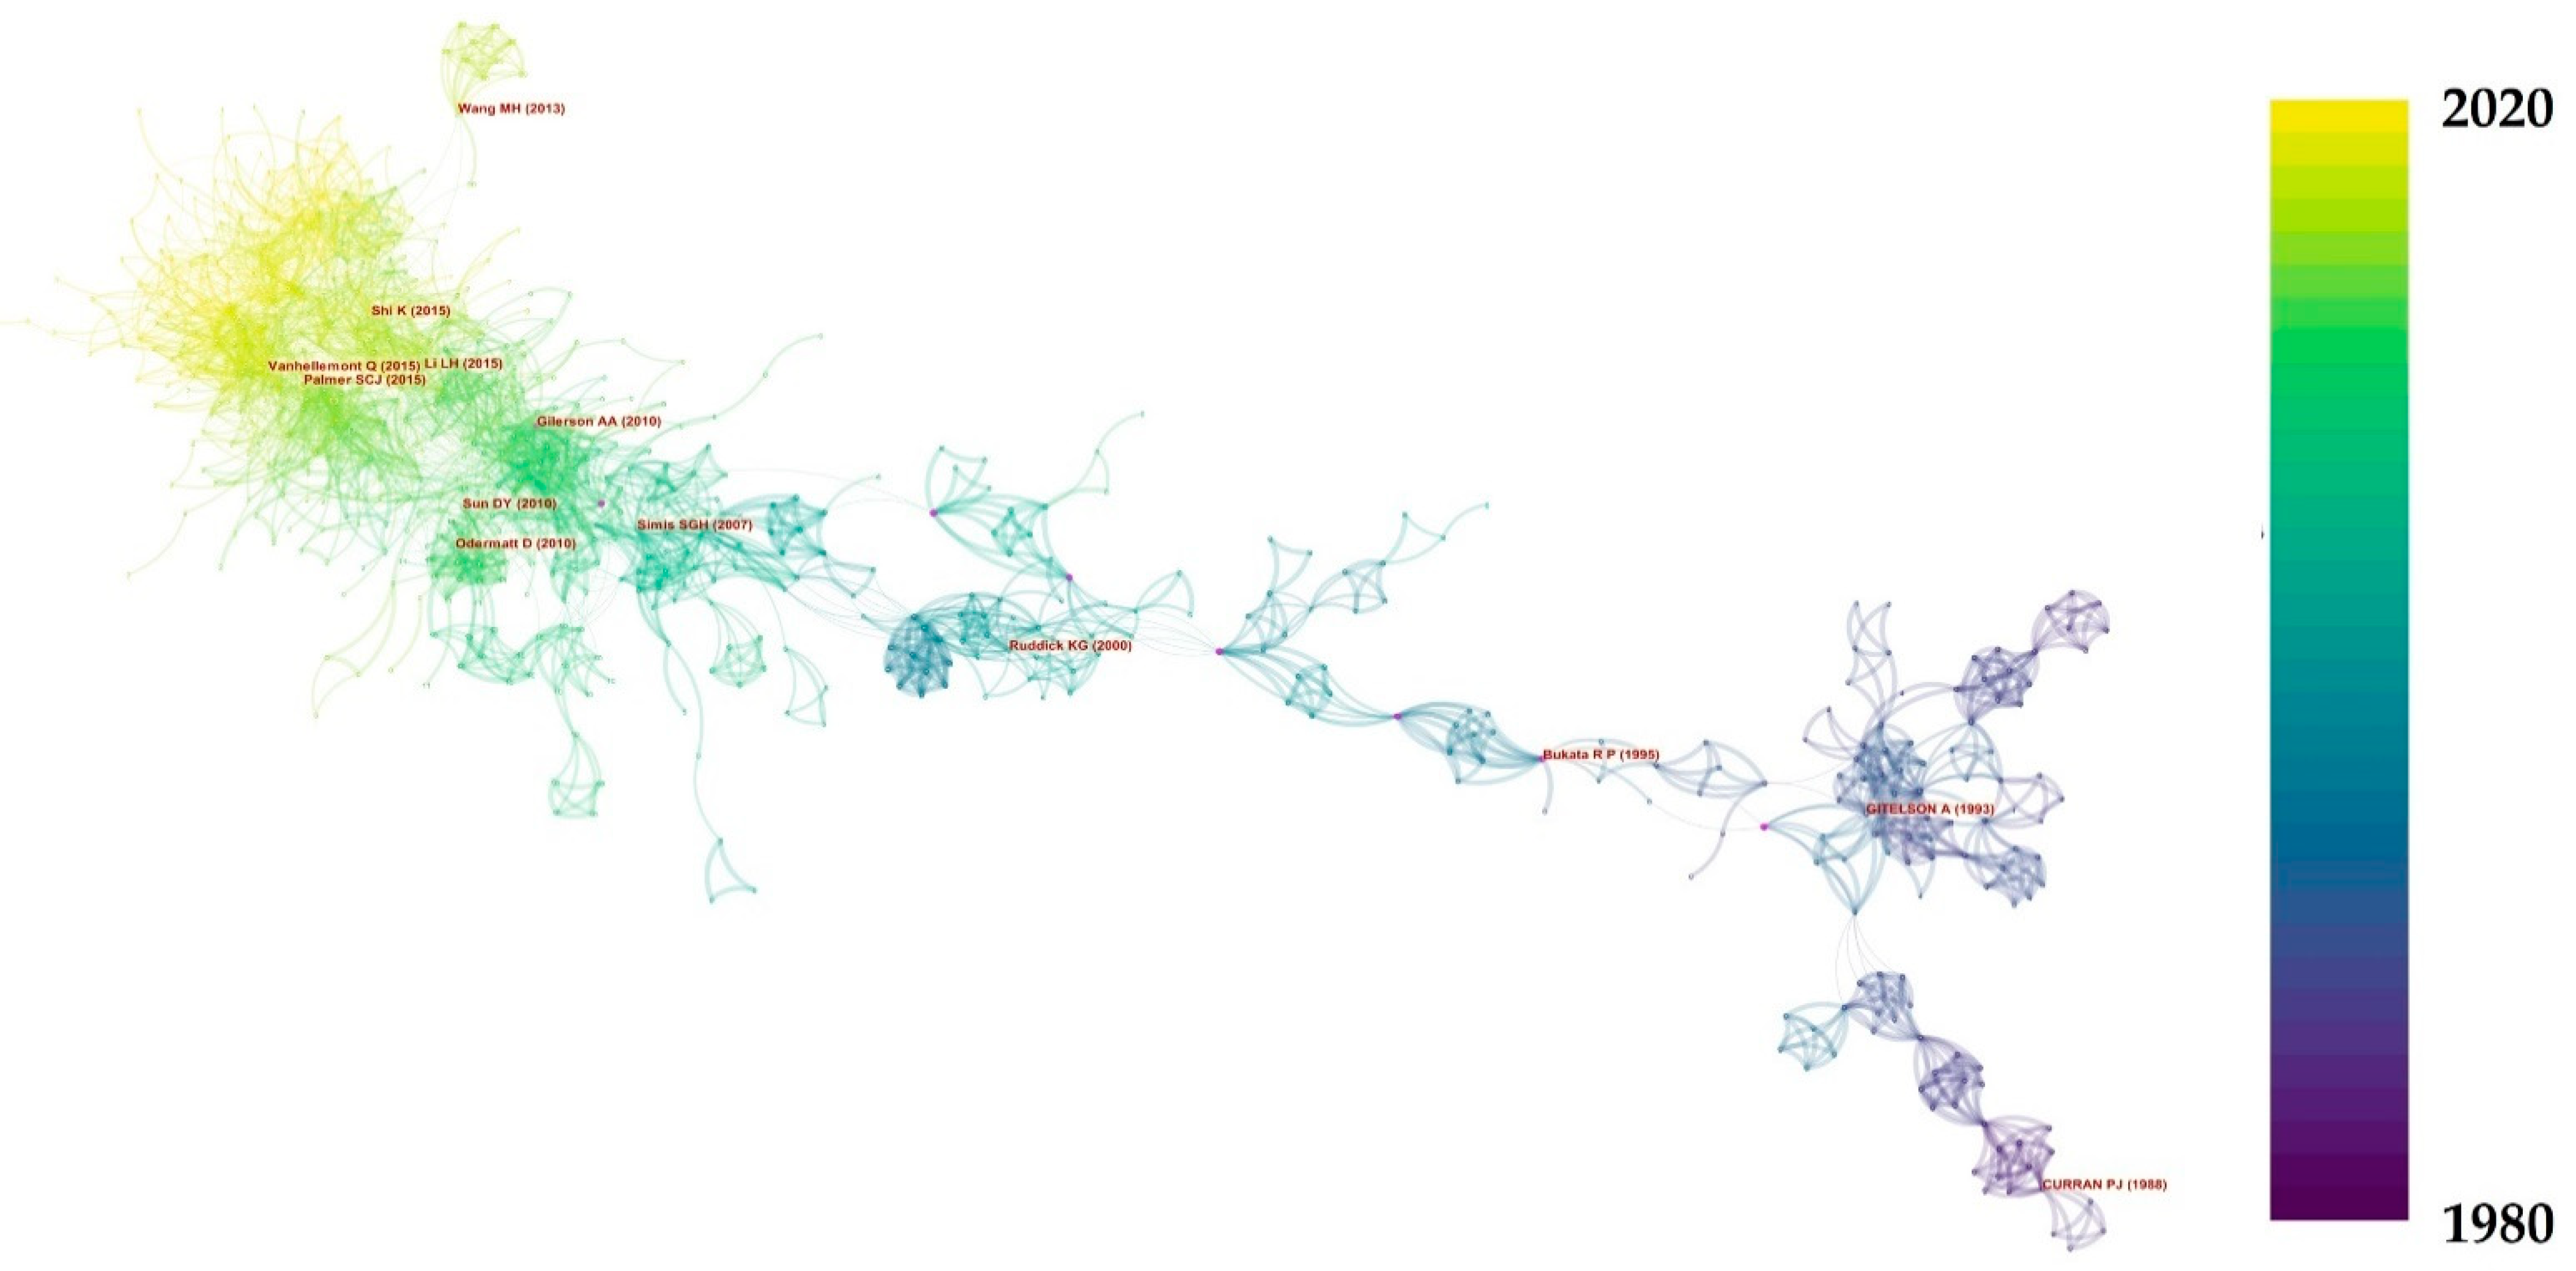
The co-citation map for the entire period (Figure 5) highlights that during the 1980s and 1990s publications stayed within small groups with simple networks (cold colors in the Figure). However, during the 2000s and especially during the 2010s, the co-citation map is a complex network, which could be related to: (1) the growth of the field (Figure 1); (2) easier access to publications due to the digital format; (3) the growth of international collaborations. When considering the entire period, some new main references emerged from this new clustering such as Curran and Novo [50], a review on the use of remote sensing for the estimation of suspended sediment concentration; Bukata et al. [51], a book about the optical properties of inland and coastal waters; and Simis et al. [52], which replaced Simis et al. [37] on studies of the retrieval of PC concentration from proximal remote sensing data.
4. Discussion
4.1. The Search Limitations
The search on this study was limited to the following terms: “remote sensing”+ “inland waters” which resulted in studies mostly related to water quality. However, other terms could be used to represent the inland waters such as “case 2” or “lake”. The “case 2” term is based on the oceanographic studies which used to classify water in two classes: case 1 and case 2 [53,54]. Case 1 waters are the ones that have optical properties dominated by phytoplankton and other co-varying compounds, such as CDOM and detritus [53]. Case 2 waters have optical properties that are significantly influenced by different constituents, such as phytoplankton, mineral particles, and land originated CDOM, and their concentrations do not covary among each other [54]. Because of these characteristics, case 2 waters have been used to describe inland waters. Nevertheless, the use of these 2 classes (case 1 and case 2) has been disused due to the identification of different optical water types [48,55]. The term “lake” has also been used frequently to describe inland waters once all lakes are located in the continental part. Hence, a search in the WoS for the terms “remote sensing”+ “case 2” and “remote sensing” + “lakes” were also included in this study.
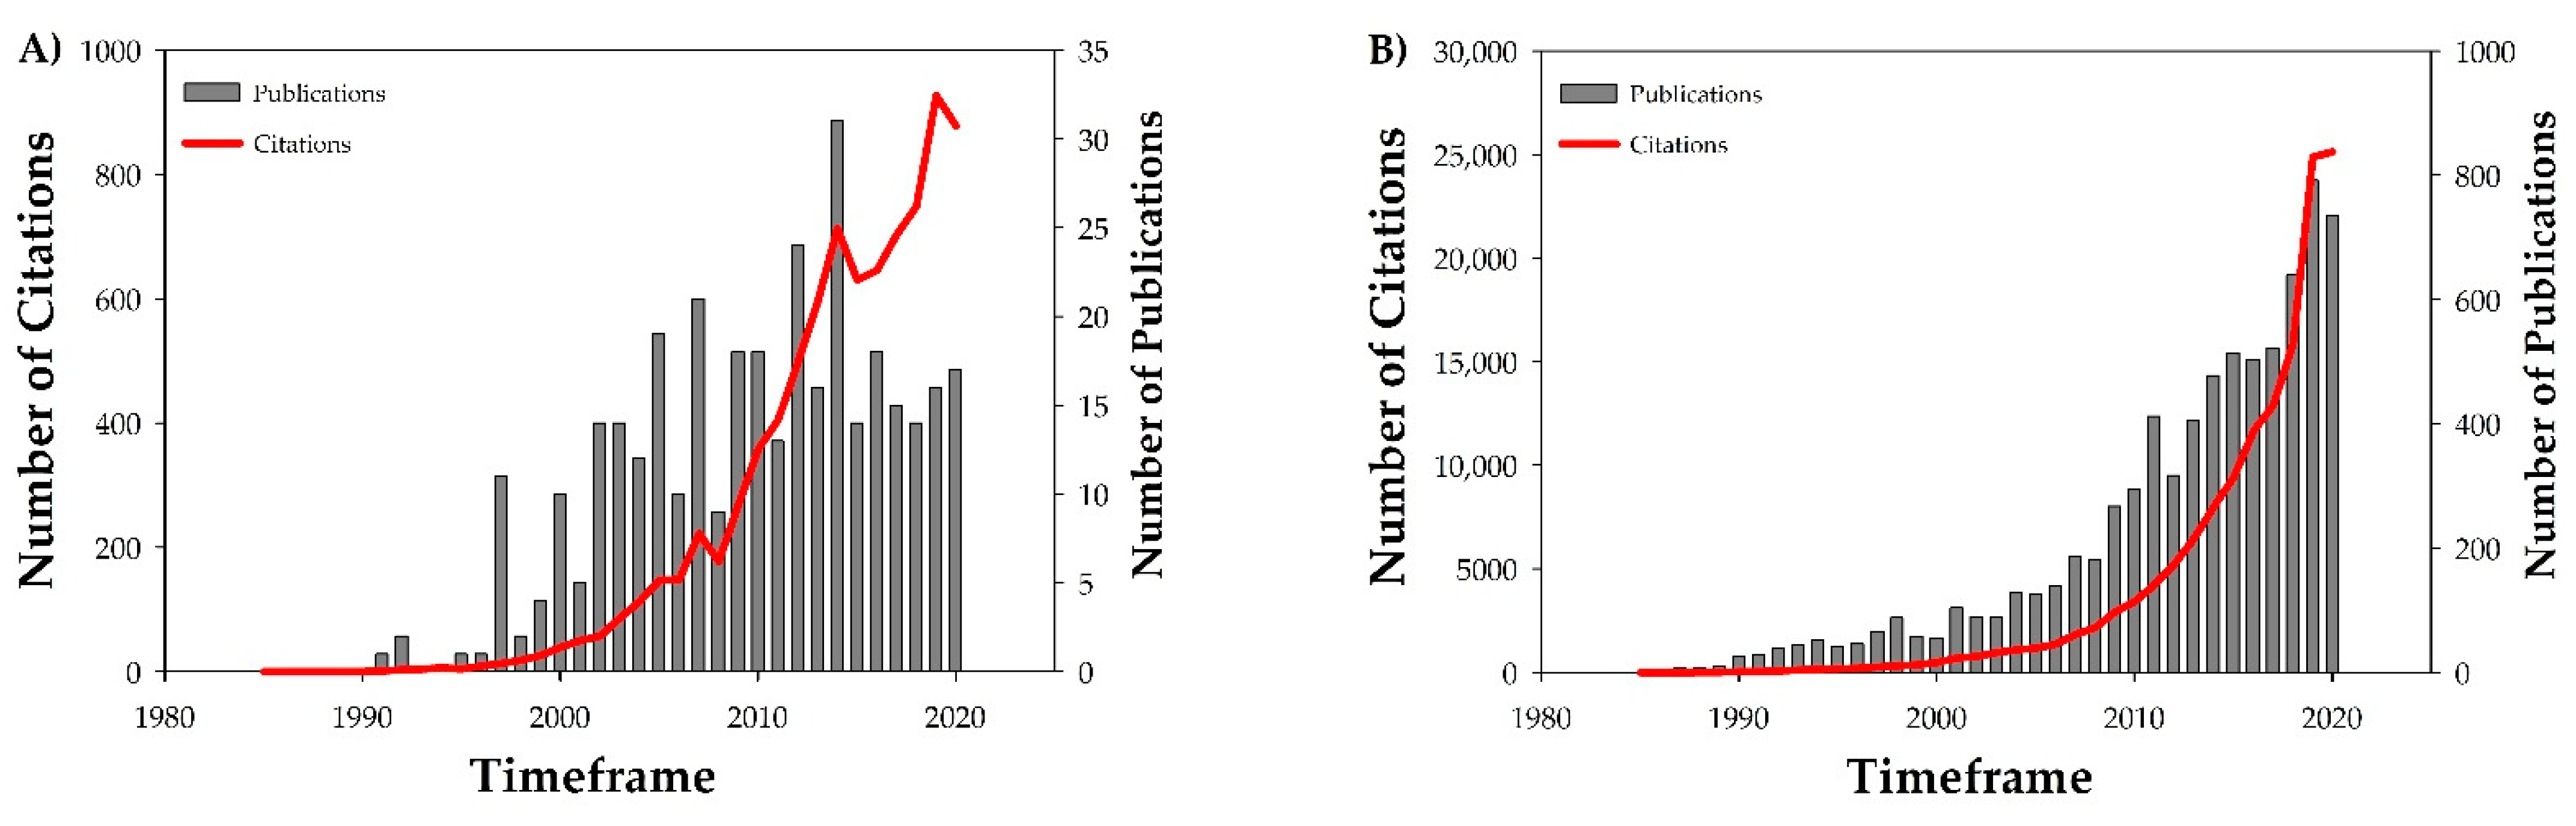
Figure 6 shows the number of publications and citations for each of these searches. For the “remote sensing”+ “case 2” search, it was interesting to see that although the terms were established in 1983 [54], the first publication in the WoS database was only available in 1991. In contrast to the exponential trend noticed in the “remote sensing” + “inland water” search (Figure 1), the use of “remote sensing” + “case 2” varies within the publications during the timeframe with a small decrease in the last years (Figure 6A). On the other hand, the search using the terms “remote sensing” + “lake” showed a similar exponential growth trend in a number of citations and publications (Figure 6B). The number of publications was also different with “remote sensing” + “case 2” totaling 370 and “remote sensing” + “lake” totaling 8236 publications.
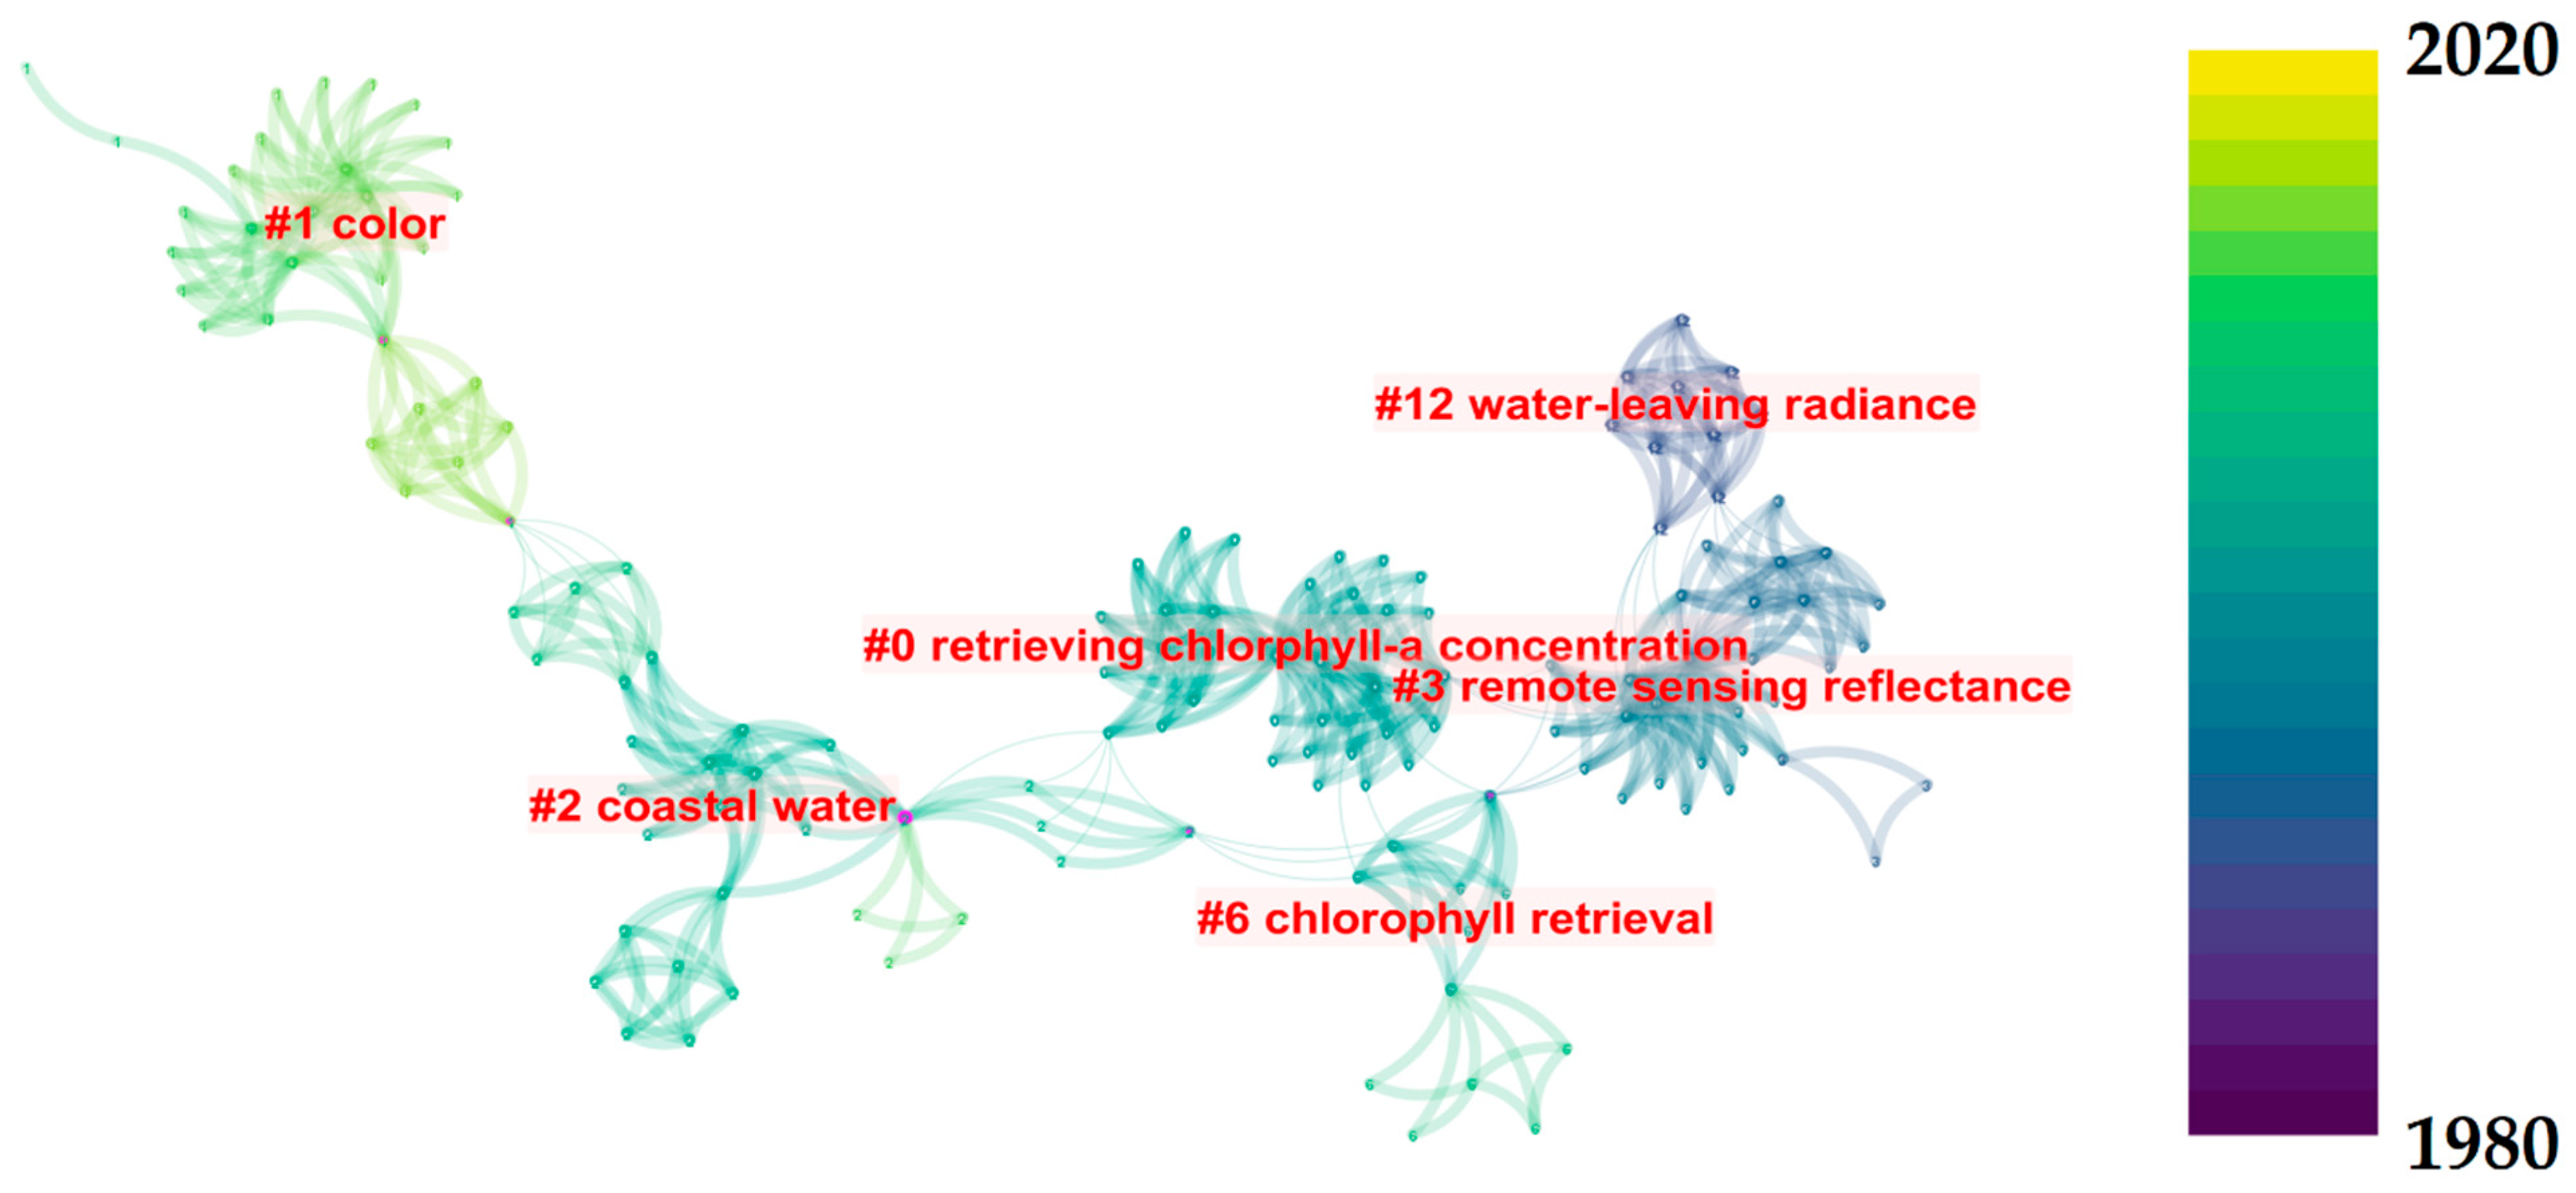
The search using the “remote sensing” + “case 2” terms showed publications related to water quality with earlier studies focusing on the measurement of water leaving radiance and remote sensing reflectance, and recent studies focused on water color and chl-a retrieval from coastal waters (Figure 7). This topic trend is similar to the one observed in the search for “remote sensing”+ “inland water”, with earlier studies focusing on the measurement of optical properties (especially apparent optical properties) and later on the development of remote sensing methods for the extraction of water quality parameters.
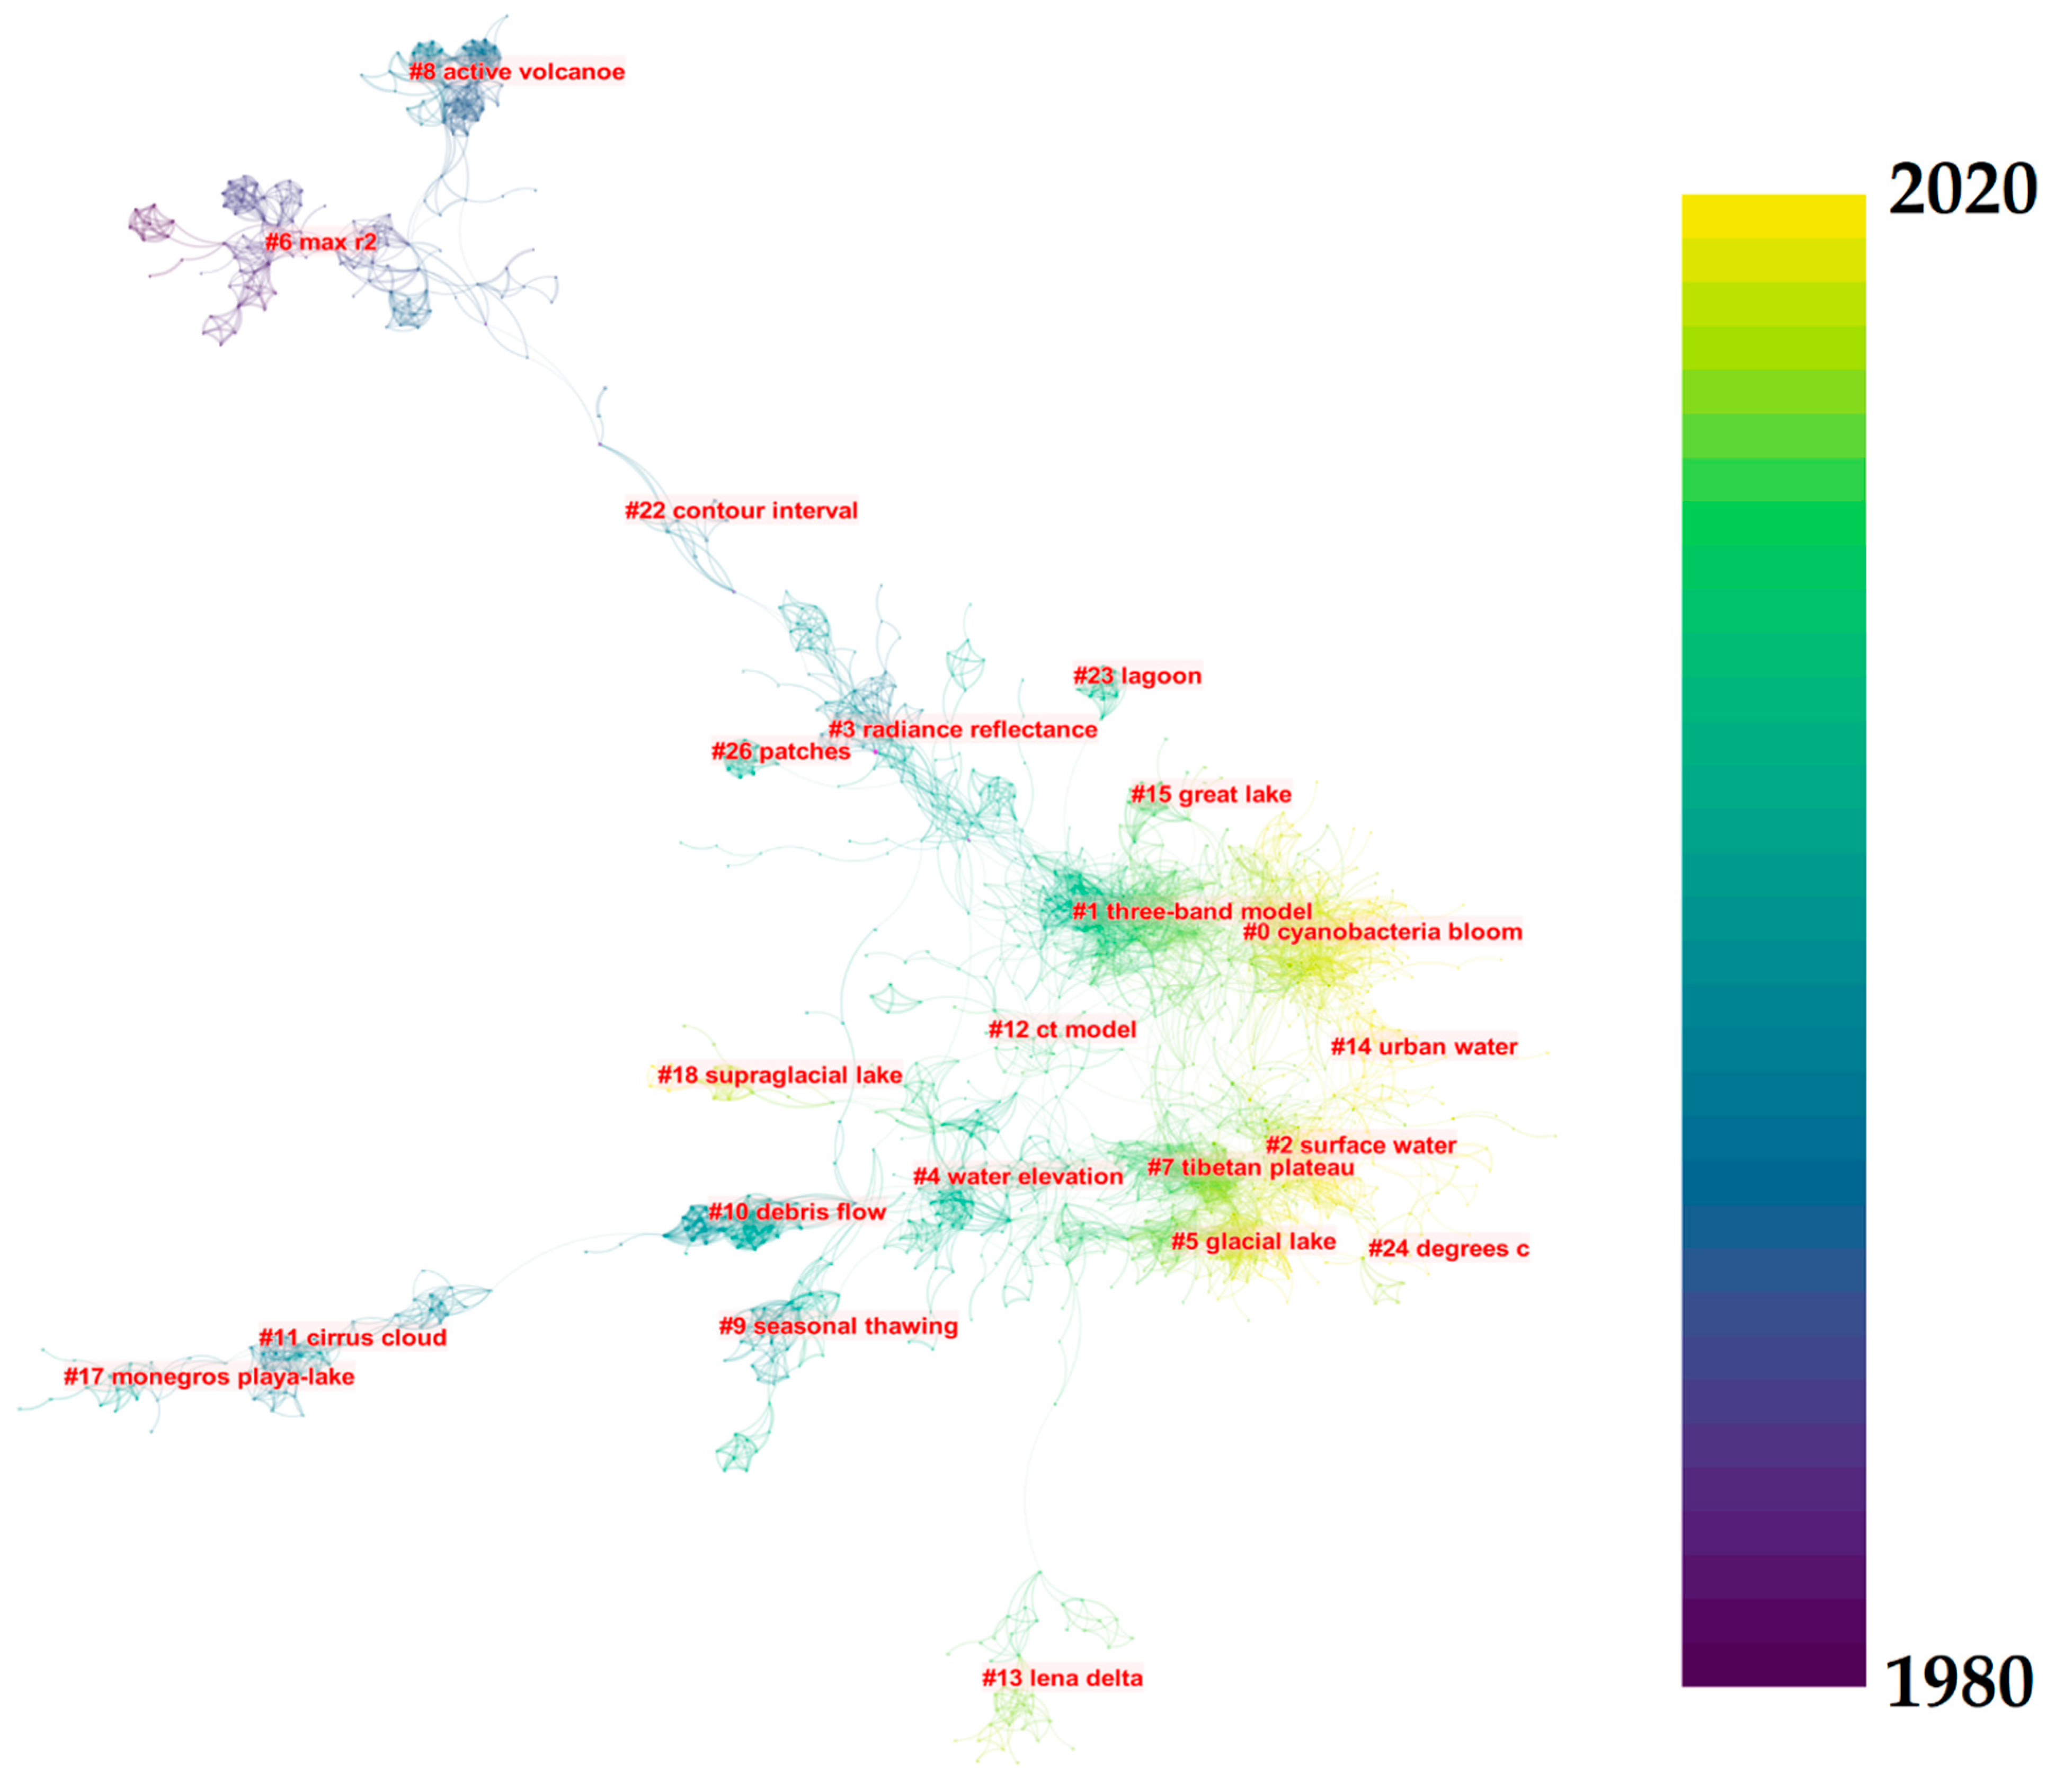
The search using the “remote sensing” + “lake” terms showed a high number of publications covering water quality and water quantity topics (Figure 8). Publications in the 1980s covered topics which are not related to inland waters like active volcanos, statistics, and cirrus cloud. In the 1990s publications were focused on ice cover, lake area, debris flow, water elevation, and reflectance measurements. In the last two decades, the appearance of water quality parameter modeling and water temperature was observed. The timeline of these topics showed the increase in water quality in the last decades, while water quantity research was more dominant in the first two periods.
Compared to the search using terms such as “remote sensing” + “case 2”, “remote sensing” + “lake”, and “remote sensing”+ “inland water”, it was observed that both “case 2” and “inland water” are focused on water quality (Table 2, Table 3 and Table 4 and Figure 7), while the use of the term “lake” combined research covering both water quality and water quantity (Figure 8). However, it seems that the term “case 2” has been disused in the publications once other optical water types were identified [48]. Thus, for water quality, the use of “inland waters” seems to be the most appropriate terminology for future studies.
4.2. The Inland Water Search
The impressive increase in the number of publications in the period between 2010 and 2020 (Figure 1) can be related to the growing interest of stakeholders in developing monitoring tools for water quality in lakes and reservoirs. According to the Synthesis Report from the United Nations (UN) Sustainable Development Goals on Water and Sanitation, 60% of the member states suffer from the lack of data. Additionally, only 20% of the UN members states have the full data (spatial extent, quantity, and quality) on their aquatic ecosystems [56]. Because of this lack of data, EO-derived data are becoming increasingly important for the understanding of the environment. Besides the sociopolitical interest, advancements in technology, especially in the development of new orbital sensors, also contributed to the increase in the number of publications using EO data to monitor inland waters [57]. Thus, current research is moving towards image analysis, especially for water quality in inland waters due to: (1) the increasing need of environmental monitoring (especially water quality monitoring) and (2) the establishment of remote sensing as a science and the specialization of scientists on this specific topic (in the beginning scientists working on vegetation were also working on water quality remote sensing, and now we have experts in water quality remote sensing).
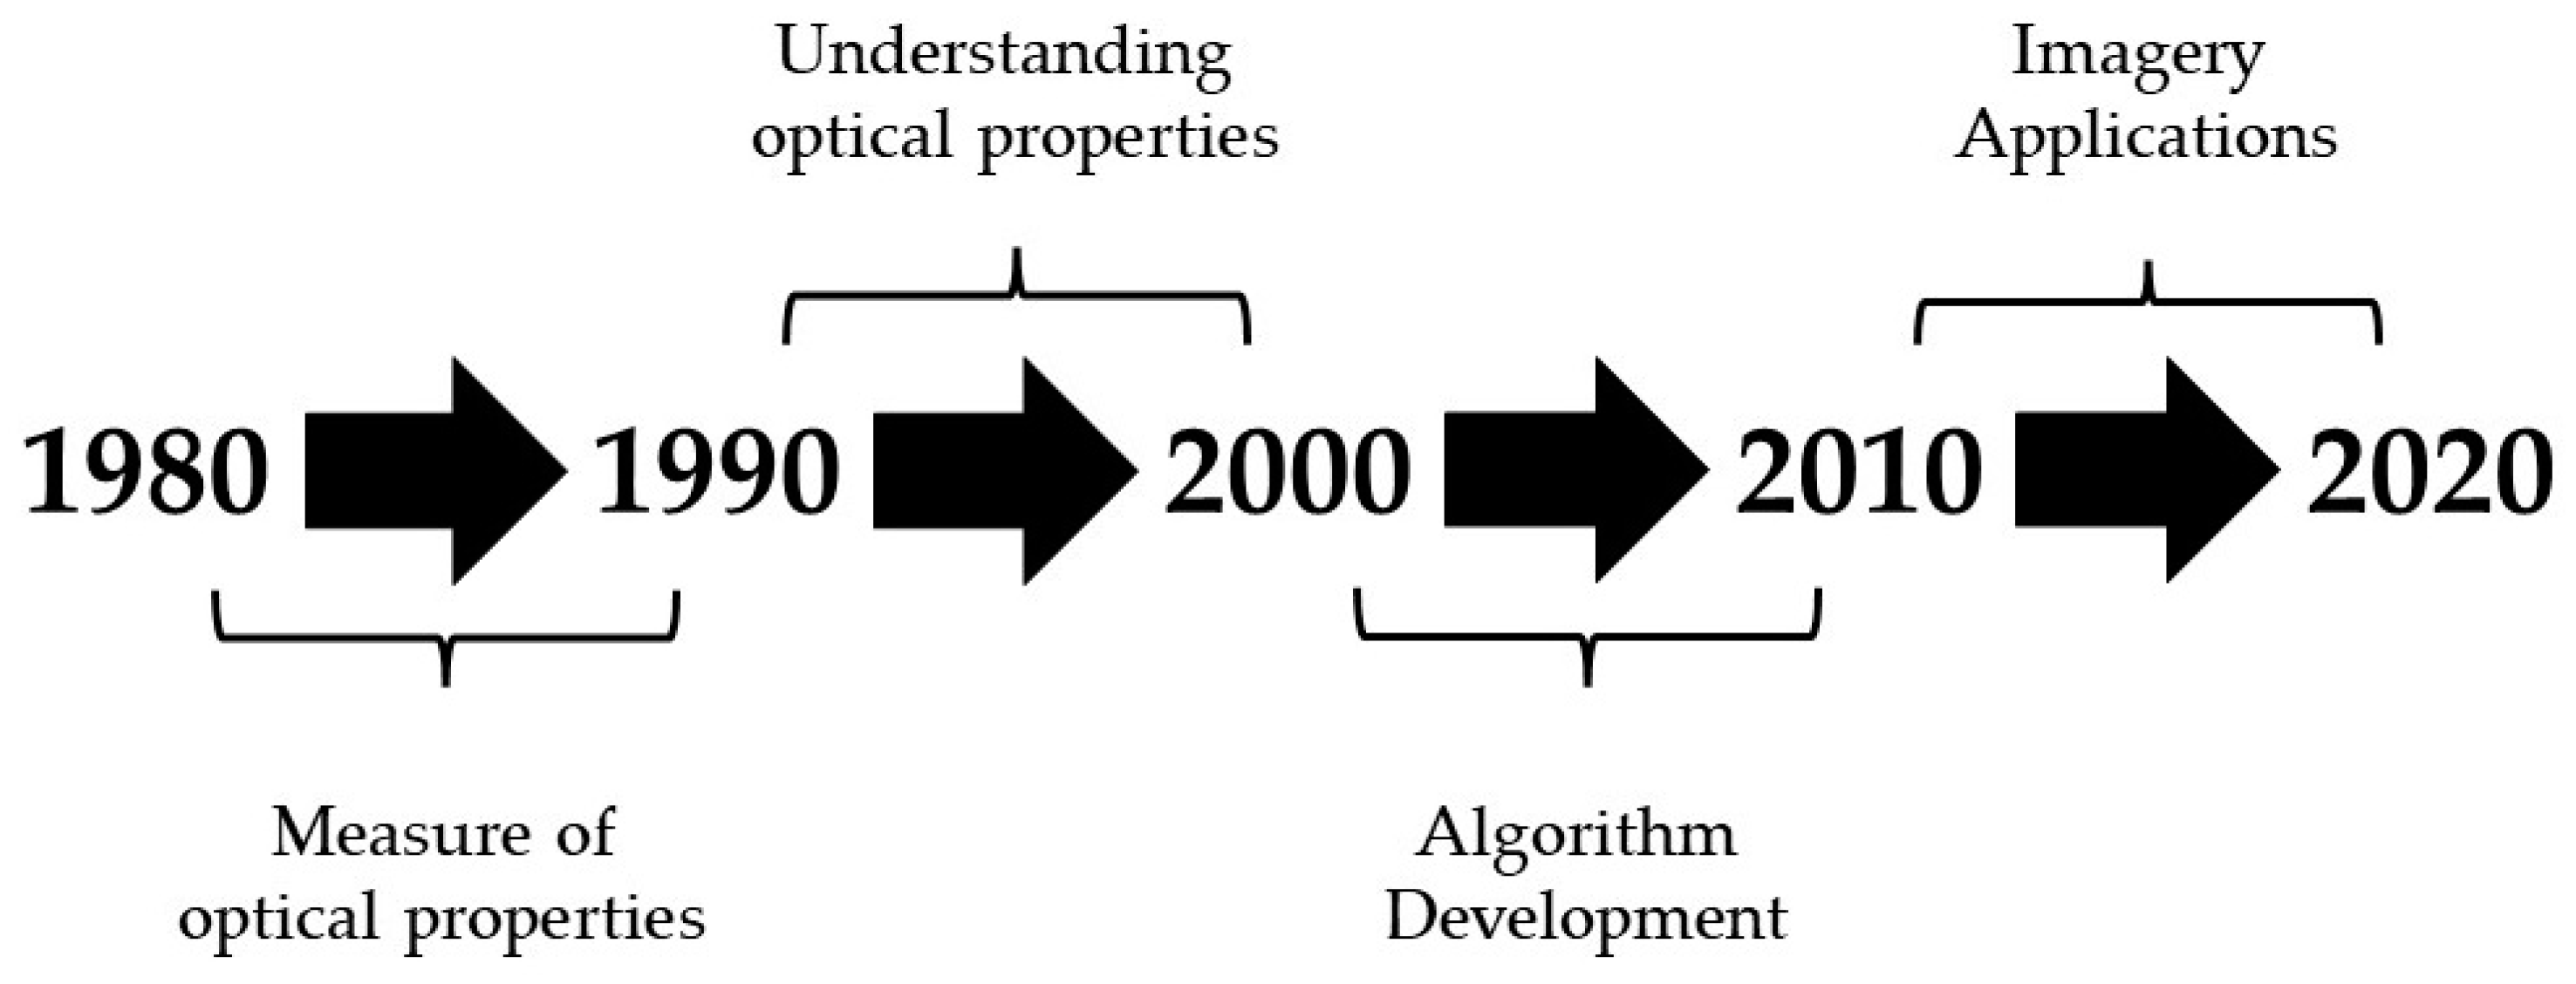
The results in this study showed an evolution of the publications through each defined period (Figure 9) based solely on the main terms analyses. Because of the limitations of only analyzing the mutual LSI and LLR terms for this specific search, it is important to acknowledge that the results may not cover all scientific publications in this field as shown in the previous subsection (Section 4.1). Thus, the following interpretation is based only on the publications found using the search terms “remote sensing”+ “inland water”, which showed during the 1980s, an effort on developing methods, protocols, and equipment for measuring optical properties (AOPs and IOPs), especially those used to calculate the Rrs [22,23]. In this period, publications were based on the development of methods and procedures to calculate the remote sensing reflectance in situ or the absorption coefficient in the laboratory from water samples collected in situ [58]. Thus, this period was characterized by the establishment of protocols, which will later be used in other studies. Because of these publications, the 1980s could be classified as a period in which the measurement of optical properties (AOPs and IOPs) was established while future periods are not heavily focused on the testing of methodologies or protocols but on the interpretation of the measurements. In the 1990s the term analyses showed that there was an effort in comparing proximal remote sensing data to water quality parameters (Table 2). Based on the topic of main references for the 1990s (Figure 2), a similar trend of content was observed for this period, with studies of the estimation of water quality parameters [26,27,29,30] using band ratios of proximal remote sensing measurements or Landsat 5/TM. Due to the use of band ratios and looking for the most appropriate spectral band, the 1990s could be classified as a period focused on the understanding of the Rrs spectrum. In the 2000s the main publications (Figure 3) still related water quality data with EO data for coastal and inland waters [32,33,37], but instead of only looking for their relationship with band ratios, these studies explored the use of absorption and fluorescence features in the Rrs spectrum. Another topic that was introduced by these selected publications was the development and comparison of different atmospheric corrections over inland waters [34,35]. Similarly, the term analyses (Table 3) highlighted the same topics such as the use of distinct absorption troughs, the impact of atmospheric properties, and the estimation of new water quality parameters such as PC. In this period the development of bio-optical algorithms and atmospheric correction algorithms were dominating the literature, especially after having a clear understanding of the Rrs spectrum. Therefore, algorithm development was clearly the main topic during the 2000s. In the last period (the 2010s), the term analyses show many terms related to types of bio-optical algorithms [59], which can be related to the algorithms that were developed in the previous period. There was an increase in the terms for water quality parameters (Table 4) as well as new terms related to water typology and atmospheric correction. Based on the main publications in this period, it was observed that publications focused on algorithm development, but several studies focused on the applications of these algorithms to the current sensors. Because of the launch of new orbital sensors, which have the adequate spectral resolution for the observation of inland waters, the number of satellite imagery application studies increased during this period.
Overall, the field of “remote sensing of inland waters” seems to be closely related to the technologies available at the time. In the 1980s, only some field equipment publications focused on the methods and protocols for measuring optical properties. In the 1990s, technology did not change much; orbital sensors (especially for Ocean Color) were still under development [60], and publications during this period were focused on understanding the optical properties that were measured from the methods and protocols developed in the previous period. In the 2000s, with the launch of Ocean Color sensors and proximal remote-sensing sensors for the measurement of AOPs and IOPs, the focus was on the development of new remote sensing algorithms. In the last period, with the launch of new orbital sensors (Landsat 8/Operational Land Imager, Sentinel 2/Multispectral Instrument, Sentinel 3/Ocean and Land Color Instrument, Hyperspectral Precursor of the Application Mission, and DLR Earth Sensing Imaging Spectrometer), the development of applications for these sensors was the major topic of the publications during this period. The observed development of orbital sensors agrees with the results of the current research trends in this field with the development of atmospheric correction methods [48] and satellite applications [7,8,9,10]. It is important to highlight that the search term “remote sensing” is commonly associated with satellite images, which can be biased towards the interpretation that the field is evolving with the development of new technologies or towards the development of satellite imagery applications. Additionally, the change in terminology noticed in the previous subsection (Section 4.1) was not considered here; it was only evaluated based on the search terms “remote sensing” + “inland water”.
Therefore, based on this concept, the future of the field can be closely related to the future hyperspectral satellite missions such as: the Plankton, Aerosol, Cloud, ocean Ecosystem (PACE) mission, the Surface Biology and Geology (SBG) mission, the Copernicus Hyperspectral Imaging Mission (CHIME), and the Environmental Mapping and Analysis Program (EnMAP). All these missions are planned to be launched within the next decade and future studies should focus on the development of algorithms and operational products for these sensors. It is important to highlight that soon the quality of EO-based analysis ready data (ARD) will be assessed to ensure the distribution of trustworthy data. This movement already started with an initiative of the Committee on Earth Observation Satellites (CEOS) called CEOS Analysis Ready Data for Land (CARD4L). In this initiative the CEOS will ensure that EO-based ARD will have the minimum level required to support time series analysis and data interoperability [61]. This will also improve the distribution of trustworthy data for databases within cloud-based platforms for planetary scale geospatial analysis for image processing such as the Google Earth Engine [62].
Therefore, future studies in this field should focus on the following topics:
- (1)
- Atmospheric correction over inland aquatic systems, which is essential for the accurate development of remote sensing algorithms;
- (2)
- The development of remote-sensing-blended algorithms considering the existence of different optical water types;
- (3)
- The development of new water quality products, especially for the above-mentioned hyperspectral sensors; some examples of possible products are phytoplankton pigments, phytoplankton groups, primary productivity, dissolved organic matter quality, among others.
5. Conclusions
The information about scientific publications were retrieved from the WoS database for the following search, “remote sensing” + “inland waters”. In this analysis, publications were assessed by a co-citation analysis and mapping and not by describing their content or by comparing different remote-sensing algorithms or methods. The results presented in this study are unique since previous reviews of the publications in the field of remote sensing of inland water did not perform a co-citation analysis.
The number of publications on this topic has been increasing in recent years. In this 35-year analysis it was observed that in the earlier years, co-citations occur mostly within one specific research group, generating sparse co-citation clusters. With the globalization and rapid increase of communications, recent co-citation clusters are dense, and it is sometimes very difficult to identify their limits. The growth in the number of publications can also be related to the development of technology in terms of measuring in situ optical properties (both AOPs and IOPs) as well as new orbital sensors with adequate spatial and spectral resolutions.
Future studies in this field should cover the topics presented in the 2010s, which are related to (1) atmospheric correction over inland aquatic systems; (2) the development of blended algorithms considering the optical water type classification; (3) the development of hyperspectral orbital sensors which cover the entire globe allowing for the development of new water quality products (i.e., phytoplankton pigments, phytoplankton groups, dissolved organic matter quality).
Funding
This research received no external funding.
Institutional Review Board Statement
Not applicable.
Informed Consent Statement
Not applicable.
Data Availability Statement
All data used in this study is available at Web of Sciences (https://0-www-webofknowledge-com.brum.beds.ac.uk/ (accessed on 7 October 2021)).
Acknowledgments
I would like to thank Chaomei Chen for making CiteSpace freely available for use.
Conflicts of Interest
The author declares no conflict of interest.
References
- Anderson, K.; Ryan, B.; Sonntag, W.; Kavvada, A.; Friedl, L. Earth observation in service of the 2030 Agenda for Sustainable Development. Geo. Spat. Inf. Sci. 2017, 20, 77–96. [Google Scholar] [CrossRef]
- Sagan, V.; Peterson, K.T.; Maimaitijiang, M.; Sidike, P.; Sloan, J.; Greeling, B.A.; Maalouf, S.; Adams, C. Monitoring inland water quality using remote sensing: Potential and limitations of spectral indices, bio-optical simulations, machine learning, and cloud computing. Earth-Sci. Rev. 2020, 205, 103187. [Google Scholar] [CrossRef]
- Ogashawara, I.; Kiel, C.; Jechow, A.; Kohnert, K.; Ruhtz, T.; Grossart, H.-P.; Hölker, F.; Nejstgaard, J.C.; Berger, S.A.; Wollrab, S. The Use of Sentinel-2 for Chlorophyll-a Spatial Dynamics Assessment: A Comparative Study on Different Lakes in Northern Germany. Remote Sens. 2021, 13, 1542. [Google Scholar] [CrossRef]
- Messager, M.; Lehner, B.; Grill, G.; Nedeva, I.; Schmitt, O. Estimating the volume and age of water stored in global lakes using a geo-statistical approach. Nat. Commun. 2016, 7, 13603. [Google Scholar] [CrossRef] [PubMed]
- Tundisi, J.G.; Matsumura-Tundisi, T.; Tundisi, J.E.M. Reservoirs and human well being: New challenges for evaluating impacts and benefits in the neotropics. Braz. J. Biol. 2008, 68, 1133–1135. [Google Scholar] [CrossRef]
- Dekker, A.; Pinnel, N. Feasibility Study for an Aquatic Ecosystem. Earth Observing System, 2nd ed.; Commonwealth Scientific and Industrial Research Organisation (CSIRO): Camberra, Australia, 2018.
- Olmanson, L.G.; Brezonik, P.L.; Finlay, J.C.; Bauer, M.E. Comparison of Landsat 8 and Landsat 7 for regional measurements of CDOM and water clarity in lakes. Remote Sens. Environ. 2016, 185, 119–128. [Google Scholar] [CrossRef]
- Toming, K.; Kutser, T.; Laas, A.; Sepp, M.; Paavel, B.; Nõges, T. First experiences in mapping lake water quality parameters with Sentinel-2 MSI imagery. Remote Sens. 2016, 8, 640. [Google Scholar] [CrossRef] [Green Version]
- Ogashawara, I.; Li, L.; Moreno-Madriñán, M.J. Slope algorithm to map algal blooms in inland waters for Landsat 8/Operational Land Imager images. J. Appl. Remote Sens. 2017, 11, 012005. [Google Scholar] [CrossRef] [Green Version]
- Bresciani, M.; Cazzaniga, I.; Austoni, M.; Sforzi, T.; Buzzi, F.; Morabito, G.; Giardino, C. Mapping phytoplankton blooms in deep subalpine lakes from Sentinel-2A and Landsat-8. Hydrobiologia 2018, 824, 197–214. [Google Scholar] [CrossRef] [Green Version]
- Koparan, C.; Koc, A.B.; Privette, C.V.; Sawyer, C.B. Autonomous In Situ Measurements of Noncontaminant Water Quality Indicators and Sample Collection with a UAV. Water 2019, 11, 604. [Google Scholar] [CrossRef] [Green Version]
- Cillero Castro, C.; Domínguez Gómez, J.A.; Delgado Martín, J.; Hinojo Sánchez, B.A.; Cereijo Arango, J.L.; Cheda Tuya, F.A.; Díaz-Varela, R. An UAV and Satellite Multispectral Data Approach to Monitor Water Quality in Small Reservoirs. Remote Sens. 2020, 12, 1514. [Google Scholar] [CrossRef]
- Matthews, M.W. A current review of empirical procedures of remote sensing in Inland and near-coastal transitional waters. Int. J. Remote Sens. 2011, 32, 6855–6899. [Google Scholar] [CrossRef]
- Odermatt, D.; Gitelson, A.; Brando, V.E.; Schaepman, M. Review of constituent retrieval in optically deep and complex waters from satellite imagery. Remote Sens. Environ. 2012, 118, 116–126. [Google Scholar] [CrossRef] [Green Version]
- Ogashawara, I.; Mishra, D.; Mishra, S.; Curtarelli, M.; Stech, J. A Performance Review of Reflectance Based Algorithms for Predicting Phycocyanin Concentrations in Inland Waters. Remote Sens. 2013, 5, 4774–4798. [Google Scholar] [CrossRef] [Green Version]
- Beck, R.; Zhan, S.; Liu, H.; Tong, S.; Yang, B.; Xu, M.; Ye, Z.; Huang, Y.; Shu, S.; Wu, Q.; et al. Comparison of satellite reflectance algorithms for estimating chlorophyll-a in a temperate reservoir using coincident hyperspectral aircraft imagery and dense coincident surface observations. Remote Sens. Environ. 2016, 178, 15–30. [Google Scholar] [CrossRef] [Green Version]
- Neil, C.; Spyrakos, E.; Hunter, P.D.; Tyler, A.N. A global approach for chlorophyll-a retrieval across optically complex inland waters based on optical water types. Remote Sens. Environ. 2019, 229, 159–178. [Google Scholar] [CrossRef]
- Riddick, C.A.L.; Hunter, P.D.; Domínguez-Gómez, J.A.; Martinez-Vicente, V.; Présing, M.; Horváth, H.; Kovács, A.W.; Vörös, L.; Zsigmond, E.; Tyler, A.N. Optimal Cyanobacterial Pigment Retrieval from Ocean Colour Sensors in a Highly Turbid, Optically Complex Lake. Remote Sens. 2019, 11, 1613. [Google Scholar] [CrossRef] [Green Version]
- Chen, C. Searching for intellectual turning points: Progressive knowledge domain visualization. Proc. Natl. Acad. Sci. USA 2004, 101, 5303–5310. [Google Scholar] [CrossRef] [PubMed] [Green Version]
- Chen, C. Citespace ii: Detecting and visualizing emerging trends and transient patterns in scientific literature. J. Am. Soc. Inf. Sci. Technol. 2006, 57, 359–377. [Google Scholar] [CrossRef] [Green Version]
- Pan, X.; Yan, E.; Cui, M.; Hua, W. Examining the usage, citation, and diffusion patterns of bibliometric mapping software: A comparative study of three tools. J. Informetr. 2018, 12, 481–493. [Google Scholar] [CrossRef]
- Bukata, R.P.; Bruton, J.E.; Jerome, J.H. Application of Direct Measurements of Optical Parameters to the Estimation of Lake Water Quality Indicators; Scientific Series 140; Inland Waters Directorate National Water Research Institute Canada Centre for Inland Waters: Burlington, ON, Canada, 1985. [Google Scholar]
- Bukata, R.P.; Jerome, J.H.; Bruton, J.E. Remote and in situ Optical Studies of Seston and Suspended Sediment. Concentrations in Lake St. Clair; NWRI Contribution 87-42; Inland Waters Directorate National Water Research Institute Canada Centre for Inland Waters: Burlington, ON, Canada, 1987. [Google Scholar]
- Jerlov, N.G. Marine Optics, 2nd ed.; Elsevier: Amsterdam, The Netherlands, 1976. [Google Scholar]
- Bukata, R.P.; Jerome, J.H.; Bruton, J.E. Particulate Concentrations in Lake St. Clair as Recorded by a Shipborne Multispeetral Optical Monitoring System. Remote Sens. Environ. 1988, 25, 201–229. [Google Scholar] [CrossRef]
- Vetucci, A.F.; Likens, G.E. Spectral reflectance and water quality of Adirondack mountain region lakes. Limnol. Oceanogr. 1989, 24, 1656–1672. [Google Scholar] [CrossRef]
- Dekker, A.G.; Malthus, T.J.; Seyhan, E. An inland water quality bandset for the CAESAR system based on spectral signature analysis. In Proceedings of the International Symposium of Remote Sensing and Water Resources, Enschede, The Netherlands, 20–24 August 1990; pp. 597–606. [Google Scholar]
- Malinsky-Rushanksy, N.; Berman, T. Picocyanobacteria and Bacteria in Lake Kinneret. Int. Rev. Ges. Hydrobiol. 1991, 76, 555–564. [Google Scholar] [CrossRef]
- Mittenzwey, K.H.; Gitelson, A.A.; Ullrich, S.; Kondratiev, K.Y. Determination of chlorophyll a of inland waters on the basis of spectral reflectance. Limnol. Oceanogr. 1992, 37, 147–149. [Google Scholar] [CrossRef]
- Gitelson, A.A.; Mayo, M.; Yacobi, Y.Z.; Parparov, A.; Berman, T. The use of high-spectral-resolution radiometer data for detection of low chlorophyll concentrations in Lake Kinneret. J. Plankton Res. 1994, 16, 993–1002. [Google Scholar] [CrossRef]
- Gitelson, A.; Garbuzov, G.; Szilagyi, F.; Mittenzwey, K.-H.; Karnieli, A.; Kaiser, A. Quantitative remote sensing methods for real-time monitoring of inland waters quality. Int. J. Remote Sens. 1993, 14, 1269–1295. [Google Scholar] [CrossRef]
- Aguirre-Gomez, R. Detection of total suspended sediments in the North Sea using AVHRR and ship data. Int. J. Remote Sens. 2000, 21, 1583–1596. [Google Scholar] [CrossRef]
- Binding, C.E.; Bowers, D.G.; Mitchelson-Jacob, E.G. Estimating suspended sediment concentrations from ocean colour measurements in moderately turbid waters; the impact of variable particle scattering properties. Remote Sens. Environ. 2005, 94, 373–383. [Google Scholar] [CrossRef]
- Ruddick, K.G.; Ovidio, F.; Rijkeboer, M. Atmospheric correction of SeaWiFS imagery for turbid coastal and inland waters. Appl. Opt. 2000, 39, 897–912. [Google Scholar] [CrossRef] [Green Version]
- Hadjimitsis, D.G.; Clayton, C.R.I.; Hope, V.S. An assessment of the effectiveness of atmospheric correction algorithms through the remote sensing of some reservoirs. Int. J. Remote Sens. 2004, 25, 3651–3674. [Google Scholar] [CrossRef]
- Tang, J.; Tian, G.; Wang, X.; Wang, X.; Song, Q. Water spectrum measurement and analysis: Measurement method for above water surface. J. Remote Sens. 2004, 8, 37–44. [Google Scholar] [CrossRef]
- Simis, S.G.H.; Peters, S.W.M.; Gons, H.J. Remote sensing of the cyanobacterial pigment phycocyanin in turbid inland water. Limnol. Oceanogr. 2005, 50, 237–245. [Google Scholar] [CrossRef]
- Reinart, A.; Kutser, T. Comparison of different satellite sensors in detecting cyanobacterial bloom events in the Baltic Sea. Remote Sens. Environ. 2006, 102, 74–85. [Google Scholar] [CrossRef]
- Odermatt, D.; Giardino, C.; Heege, T. Chlorophyll retrieval with MERIS Case-2-Regional in perialpine lakes. Remote Sens. Environ. 2010, 114, 607–617. [Google Scholar] [CrossRef] [Green Version]
- Gilerson, A.; Gitelson, A.A.; Zhou, J.; Gurlin, D.; Moses, W.J.; Ioannou, I.; Ahmed, S.A. Algorithms for remote estimation of chlorophyll-a in coastal and inland waters using red and near infrared bands. Opt. Express 2010, 18, 24109–24125. [Google Scholar] [CrossRef] [PubMed] [Green Version]
- Sun, S.Y.; Li, Y.; Wang, Q.; Lv, H.; Le, C.; Huang, C.; Gong, S. Detection of Suspended-Matter Concentrations in the Shallow Subtropical Lake Taihu, China, Using the SVR Model Based on DSFs. IEEE Geosci. Remote. Sens. Lett. 2010, 7, 816–820. [Google Scholar] [CrossRef]
- Shi, K.; Zhang, Y.; Zhu, G.; Liu, X.; Zhou, Y.; Xu, H.; Qin, B.; Liu, G.; Li, Y. Long-term remote monitoring of total suspended matter concentration in Lake Taihu using 250m MODIS-Aqua data. Remote Sens. Environ. 2015, 164, 43–56. [Google Scholar] [CrossRef]
- Cretaux, J.-F.; Arsen, A.; Calmant, S.; Kouraev, A.; Vuglinski, V.; Bergé-Nguyen, M.; Gennero, M.C.; Nino, F.; Abarca Del Rio, R.; Cazenave, A.; et al. SOLS: A lake database to monitor in the Near Real Time water level and storage variations from remote sensing data. Adv. Space Res. 2011, 47, 1497–1507. [Google Scholar] [CrossRef]
- Duan, H.; Ma, R.; Hu, C. Evaluation of remote sensing algorithms for cyanobacterial pigment retrievals during spring bloom formation in several lakes of East China. Remote Sens. Environ. 2012, 126, 126–135. [Google Scholar] [CrossRef]
- Wang, M.; Liu, X.; Tan, L.; Jiang, L.; Son, S.H.; Shi, W.; Rausch, K.; Voss, K. Impacts of VIIRS SDR performance on ocean color products. J. Geophys. Res. Atmos. 2013, 118, 10347–10360. [Google Scholar] [CrossRef]
- Li, L.; Li, L.; Song, K. Remote sensing of freshwater cyanobacteria: An extended IOP Inversion Model of Inland Waters (IIMIW) for partitioning absorption coefficient and estimating phycocyanin. Remote Sens. Environ. 2015, 157, 9–23. [Google Scholar] [CrossRef]
- Palmer, S.C.J.; Kutser, T.; Hunter, P.D. Remote sensing of inland waters: Challenges, progress and future directions. Remote Sens. Environ. 2015, 157, 1–8. [Google Scholar] [CrossRef] [Green Version]
- Vanhellemont, Q.; Ruddick, K. Advantages of high quality SWIR bands for ocean colour processing: Examples from Landsat-8. Remote Sens. Environ. 2015, 161, 89–106. [Google Scholar] [CrossRef] [Green Version]
- Spyrakos, E.; O’Donnell, R.; Hunter, P.D.; Miller, C.; Scott, M.; Simis, S.G.H.; Neil, C.; Barbosa, C.C.F.; Binding, C.E.; Bradt, S.; et al. Optical types of inland and coastal waters: Optical types of inland and coastal waters. Limnol. Oceanogr. 2017, 63, 846–870. [Google Scholar] [CrossRef] [Green Version]
- Curran, P.J.; Novo, E. The relationship between suspended sediment concentration and remotely sensed spectral radiance—A review. J. Coast. Res. 1988, 4, 351–368. [Google Scholar]
- Bukata, R.P.; Jerome, J.H.; Kondratyev, K.Y.; Pozdnyakov, D.V. Optical Properties and Remote Sensing of Inland and Coastal Waters; CRC Press: Boca Raton, FL, USA, 1995. [Google Scholar]
- Simis, S.G.H.; Ruiz-Verdú, A.; Domínguez-Gómez, J.A.; Peña-Martinez, R.; Peters, S.W.M.; Gons, H.J. Influence of phytoplankton pigment composition on remote sensing of cyanobacterial biomass. Remote Sens. Environ. 2007, 106, 414–427. [Google Scholar] [CrossRef]
- Morel, A.; Prieur, L. Analysis of variations in ocean color. Limnol. Oceanogr. 1977, 22, 709–722. [Google Scholar] [CrossRef]
- Gordon, H.R.; Morel, A. Remote Assessment of Ocean Color for Interpretation of Satellite Visible Imagery: A Review; Springer: New York, NY, USA, 1983; 44p. [Google Scholar]
- Botha, E.J.; Anstee, J.M.; Sagar, S.; Lehmann, E.; Medeiros, T.A.G. Classification of Australian Waterbodies across a Wide Range of Optical Water Types. Remote Sens. 2020, 12, 3018. [Google Scholar] [CrossRef]
- United Nations. Sustainable Development Goal 6 Synthesis Report on Water and Sanitation; United Nations: New York, NY, USA, 2018. [Google Scholar]
- Greb, S.; Dekker, A.; Binding, C. (Eds.) Earth Observations in Support. of Global Water Quality Monitoring; IOCCG Report Series, No. 17; International Ocean Colour Coordinating Group: Dartmouth, NS, Canada, 2018. [Google Scholar]
- Kishino, M.; Takahashi, M.; Okami, N.; Ichimura, S. Estimation of the spectral absorption coefficients of phytoplankton in the sea. Bull. Mar. Sci. 1985, 37, 634–642. [Google Scholar]
- Ogashawara, I. Terminology and classification of bio-optical algorithms. Sens. Lett. 2015, 6, 613–617. [Google Scholar] [CrossRef]
- Historical Ocean-Colour Sensors. Available online: https://ioccg.org/resources/missions-instruments/historical-ocean-colour-sensors/ (accessed on 14 October 2021).
- CEOS Analysis Ready Data. Available online: https://ceos.org/ard/ (accessed on 14 October 2021).
- Gorelick, N.; Hancher, M.; Dixon, M.; Ilyushchenko, S.; Thau, D.; Moore, R. Google Earth Engine: Planetary-scale geospatial analysis for everyone. Remote Sens. Environ. 2017, 202, 18–27. [Google Scholar] [CrossRef]
Figure 1.
The number of citations (line) and publications (bars) related to the search terms published between 1985 and 2020—data from the Web of Sciences database.
Figure 1.
The number of citations (line) and publications (bars) related to the search terms published between 1985 and 2020—data from the Web of Sciences database.

Figure 2.
Co-citation map of the publications from the WoS database from 1990 to 1999 for the search: “remote sensing” + “inland water”. Each label represents the most co-cited publication per co-citation cluster.
Figure 2.
Co-citation map of the publications from the WoS database from 1990 to 1999 for the search: “remote sensing” + “inland water”. Each label represents the most co-cited publication per co-citation cluster.

Figure 3.
Co-citation map of the publications from the WoS database from 2000 to 2009 for the search: “remote sensing” + “inland water”. Each label represents the most co-cited publication per co-citation cluster.
Figure 3.
Co-citation map of the publications from the WoS database from 2000 to 2009 for the search: “remote sensing” + “inland water”. Each label represents the most co-cited publication per co-citation cluster.

Figure 4.
Co-citation map of the publications from the WoS database from 2010 to 2020 for the search: “remote sensing” + “inland water”. Each label represents the most co-cited publication per co-citation cluster.
Figure 4.
Co-citation map of the publications from the WoS database from 2010 to 2020 for the search: “remote sensing” + “inland water”. Each label represents the most co-cited publication per co-citation cluster.

Figure 5.
Co-citation map of the publications from the WoS database from 1985 to 2020 for the search: “remote sensing” + “inland water”. Each label represents the most co-cited publication per co-citation cluster.
Figure 5.
Co-citation map of the publications from the WoS database from 1985 to 2020 for the search: “remote sensing” + “inland water”. Each label represents the most co-cited publication per co-citation cluster.

Figure 6.
The number of citations (line) and publications (bars) related to the search terms published between 1985 and 2020 (data from the Web of Sciences database) (A) for the search using “remote sensing” + ”case 2” and (B) for the search using “remote sensing” + ”lake”.
Figure 6.
The number of citations (line) and publications (bars) related to the search terms published between 1985 and 2020 (data from the Web of Sciences database) (A) for the search using “remote sensing” + ”case 2” and (B) for the search using “remote sensing” + ”lake”.

Figure 7.
Co-citation map of the publications from the WoS database from 1985 to 2020 for the search: “remote sensing” + “case 2”. Each label represents the most common term presented in the abstracts in each co-citation cluster.
Figure 7.
Co-citation map of the publications from the WoS database from 1985 to 2020 for the search: “remote sensing” + “case 2”. Each label represents the most common term presented in the abstracts in each co-citation cluster.

Figure 8.
Co-citation map of the publications from the WoS database from 1985 to 2020 for the search: “remote sensing” + “lake”. Each label represents the most common term presented in the abstracts in each co-citation cluster.
Figure 8.
Co-citation map of the publications from the WoS database from 1985 to 2020 for the search: “remote sensing” + “lake”. Each label represents the most common term presented in the abstracts in each co-citation cluster.

Figure 9.
Evolution of the main topics of the scientific literature in the field of remote sensing of inland waters from 1985 to 2020.
Figure 9.
Evolution of the main topics of the scientific literature in the field of remote sensing of inland waters from 1985 to 2020.


Table 1.
Top 10 journals with the most citations found in the WoS database based on the search terms.
Table 1.
Top 10 journals with the most citations found in the WoS database based on the search terms.
| Journal | Year of the First Issue | Count of Citations |
|---|---|---|
| Remote Sensing of Environment | 1969 | 549 |
| Remote Sensing | 2009 | 284 |
| International Journal of Remote Sensing | 1980 | 281 |
| IEEE Transactions on Geoscience and Remote Sensing | 1980 * | 199 |
| Journal of Geophysical Research-Oceans | 2004 * | 180 |
| Optics Express | 1997 | 179 |
| Science of Total Environment | 1972 | 169 |
| Applied Optics | 1962 | 164 |
| Limnology and Oceanography | 1956 | 151 |
| IEEE Journal of Selected Topics in Applied Earth Observations and Remote Sensing | 2008 | 126 |
* Not considering previous names of the journal.
Table 2.
List of the mutual terms for the LSI and LLR term analyses of the abstracts of the publications from 1990 to 1999 per co-citation cluster.
Table 2.
List of the mutual terms for the LSI and LLR term analyses of the abstracts of the publications from 1990 to 1999 per co-citation cluster.
| Cluster Most Cited Reference | Mutual Terms (LSI and LLR) |
|---|---|
| Bukata et al. [25] | Secchi disk; useful index; accuracy; band; using linear regression technique |
| Vertucci and Likens [26] | optical model; large doc concentration; color purity; responsiveness; water color scale |
| Dekker et al. [27] | monitoring modeling; using ratioed wavelength band; radiance; 710 nm range |
| Malinsky-Rushanksy and Berman [28] | optical model; TM Landsat; Secchi disk; useful index; future application |
| Mittenzwey et al. [29] | upwelling; multispectral statistical modeling; eutrophication processes |
| Gitelson et al. [31] | TM Landsat; future application; previous studies; spectral-resolution data; current data base |
| Gitelson et al. [30] | assumption; multi-spectral statistical modelling; water quality monitoring; article; concept |
Table 3.
List of the mutual terms for the LSI and LLR term analyses of the abstracts of the publications from 2000 to 2009 per co-citation cluster.
Table 3.
List of the mutual terms for the LSI and LLR term analyses of the abstracts of the publications from 2000 to 2009 per co-citation cluster.
| Cluster Most Cited Reference | Mutual Terms (LSI and LLR) |
|---|---|
| Aguirre-Gomes [32] | visible spectrum; red-near infrared color ratio; distinct absorption trough; second profile |
| Ruddick et. al. [34] | Line fluorometer data; atmospheric properties; full spatial coverage; sea-viewing wide field |
| Hadjimitsis et al. [35] | correlation; reflectance value; satellite; satellite overpass; biggest dam |
| Tang et al. [36] | Suzhou; Taihu lake; analytical method; total suspended matter concentration |
| Simis et al. [37] | Spanish dataset; other phytoplankton pigment; increasing pc; single reflectance ratio; pc absorption effect |
| Biding et al. [33] | estuaries; water color; test; using visible band satellite data |
Table 4.
List of the mutual terms for the LSI and LLR term analyses of the abstracts of the publications from 2010 to 2020 per co-citation cluster.
Table 4.
List of the mutual terms for the LSI and LLR term analyses of the abstracts of the publications from 2010 to 2020 per co-citation cluster.
| Cluster Most Cited Reference | Mutual Terms (LSI and LLR) |
|---|---|
| Reinart and Kutser [38] | organic matter; water quality; situ measurement; remote sensing reflectance; water bodies |
| Odermatt [39] | main river; drinking water; terrestrial humic-like component; nutrients; heavy metal |
| Gilerson et al. [40] | three-band algorithm; optical complexity; GA-PLS model |
| Sun et al. [41] | complex turbid; neural network; suspended particulate composition; SVR algorithm |
| Cretaux et al. [43] | water; application; in situ; new waveform retracker |
| Duan et al. [44] | GOCI-derived chl-a; algal growth; Taihu lake; typical plateau lake; phytoplankton bloom |
| Wang et al. [45] | biogeochemical product; VIIRS measurement; ocean color data; removing unphysical retrieval |
| Li et al. [46] | floating leaf vegetation; quasianalytical algorithm; cyanobacteria bloom; remote sensing technique |
| Shi et al. [42] | eastern China; water clarity; large lake; ambient water quality; semianalytical model |
| Palmer et al. [47] | shallow water; bottom reflectance; organic matter; lake monitoring; remote sensing indicator |
| Vanhellemont and Ruddick [48] | water pixel; atmospheric contribution; NIR band; multispectral instrument; Rrs product |
| Spyrakos et al. [49] | classification-based method; water application; aerosol model; Dongting lake |
Publisher’s Note: MDPI stays neutral with regard to jurisdictional claims in published maps and institutional affiliations. |
© 2021 by the author. Licensee MDPI, Basel, Switzerland. This article is an open access article distributed under the terms and conditions of the Creative Commons Attribution (CC BY) license (https://creativecommons.org/licenses/by/4.0/).
Share and Cite
MDPI and ACS Style
Ogashawara, I. Bibliometric Analysis of Remote Sensing of Inland Waters Publications from 1985 to 2020. Geographies 2021, 1, 346-361. https://0-doi-org.brum.beds.ac.uk/10.3390/geographies1030019
AMA Style
Ogashawara I. Bibliometric Analysis of Remote Sensing of Inland Waters Publications from 1985 to 2020. Geographies. 2021; 1(3):346-361. https://0-doi-org.brum.beds.ac.uk/10.3390/geographies1030019
Chicago/Turabian StyleOgashawara, Igor. 2021. "Bibliometric Analysis of Remote Sensing of Inland Waters Publications from 1985 to 2020" Geographies 1, no. 3: 346-361. https://0-doi-org.brum.beds.ac.uk/10.3390/geographies1030019