Article

Improving Community Resilience and Emergency Plans by Mapping Risk and Preparedness at the Neighborhood Scale

1
Dead Sea and Arava Science Center, Mitzpe Ramon 8060000, Israel
2
Ben-Gurion University of the Negev Eilat Campus, Eilat 8855630, Israel
3
Mitzpe Ramon Local Council, Mitzpe Ramon 8060000, Israel
4
Fioscope GmbH, Dresden, 01705 Freital, Germany
*
Author to whom correspondence should be addressed.
Submission received: 26 April 2021 / Revised: 24 May 2021 / Accepted: 29 May 2021 / Published: 4 June 2021

Abstract

:
People living in areas of significant seismic risk seldom undertake sufficient preparations to safeguard their families. This is most problematic in remote communities such as those along the Dead Sea Fault, Israel, where self-reliance is a key factor in coping with disasters. To facilitate individual and familial involvement in earthquake preparedness in remote areas, we designed a tool for self-assessment of risk and preparedness. The personalized risk assessment is based on national hazard and building standards, and on personal input regarding structure characteristics. The risk and preparedness evaluations enhance awareness and provide immediate feedback to help users improve familial preparedness. The spatial analysis of the data collected is used to form high-resolution maps that expose specific challenges for emergency responses. A study conducted in the town of Mitzpe Ramon exposed neighborhoods with a relatively high risk of damage and low preparedness. Integrating these results with seasonal stress-factors such as peak tourism and extreme weather, provides new and important insights into the ability of the local community and emergency forces to cope with multihazard situations. An analysis of the heterogeneous distribution of expected hardship within a community should be implemented worldwide to improve risk mitigation.

1. Introduction

1.1. Community Resilience—The Challenge of Activating People to Improve Self-Reliance

While natural hazards, such as earthquakes, cannot be controlled or avoided, there are ways to minimize their impact on society. A central key to risk reduction is building community resilience—the ability of a community to work together to prepare for, cope with and recover from a disaster [1,2,3,4]. Active personal preparedness and involvement in community risk mitigation programs are considered effective ways to improve local and national resilience [5,6,7,8]. The first steps to successful public engagement are the dissemination and clarification of risks, and a demonstration of the proper behavior during and following an earthquake [9,10,11]. Such engagement hopefully leads to informed, predictable and productive behavior of readied individuals and emergency response teams [12,13].
Many studies propose tools and indicators for gauging community resilience. Ostadtaghizadeh et al. [14] provide a review of 17 resilience assessment models published recently. They assert that while there is a consensus regarding the main components of resilience, there is limited agreement about the quantification of indicators and operational implementation of models (see also [15]). Another important challenge in assessing community resilience is the scale and spatial variability of the required data [16,17,18]. Few studies tailor their models to the regional scale [19] and even fewer address the city scale in a way that could help local risk reduction [20,21,22].
In light of the COVID-19 pandemic, an important aspect of community resilience has been highlighted: the ability to respond, recover and adapt to multihazard crises [23,24]. The occurrence of geohazards, such as storms or earthquakes during a prolonged pandemic, will dramatically complicate emergency response and evacuation efforts. Obviously, the efforts to limit infections and prevent the overwhelming of medical resources are greatly hindered by geohazards [23]. The improvements required in emergency planning and resilience building, in light of the likelihood of multihazard events, include an analysis of temporal patterns such as flu seasons and various weather patterns (heat waves, bush fires, hurricanes).
Unfortunately, improving community resilience has been a challenging practice, even before the COVID-19 pandemic. Social-psychology studies do provide outlines for effective intervention. For example, Dogulu et al. (2016) and Karanci et al. (2018) [25,26] conclude that effective communal engagement and improved resilience are most likely achieved by individual awareness, preparedness, outcome expectancy and self-efficacy, and by communal solidarity, shared responsibility, collective efficacy and trust. However, only a few studies evaluate the long-term effectiveness of such intervention methods to improve community resilience [27,28]. In Israel, the ongoing efforts to improve resilience struggle to engage communities and national risk reduction policies are mostly implemented in central Israel [29,30]. Improving resilience and risk reduction are particularly difficult yet vital in remote periphery communities that may be impacted by disparities in service provision during disaster response and recovery [31].

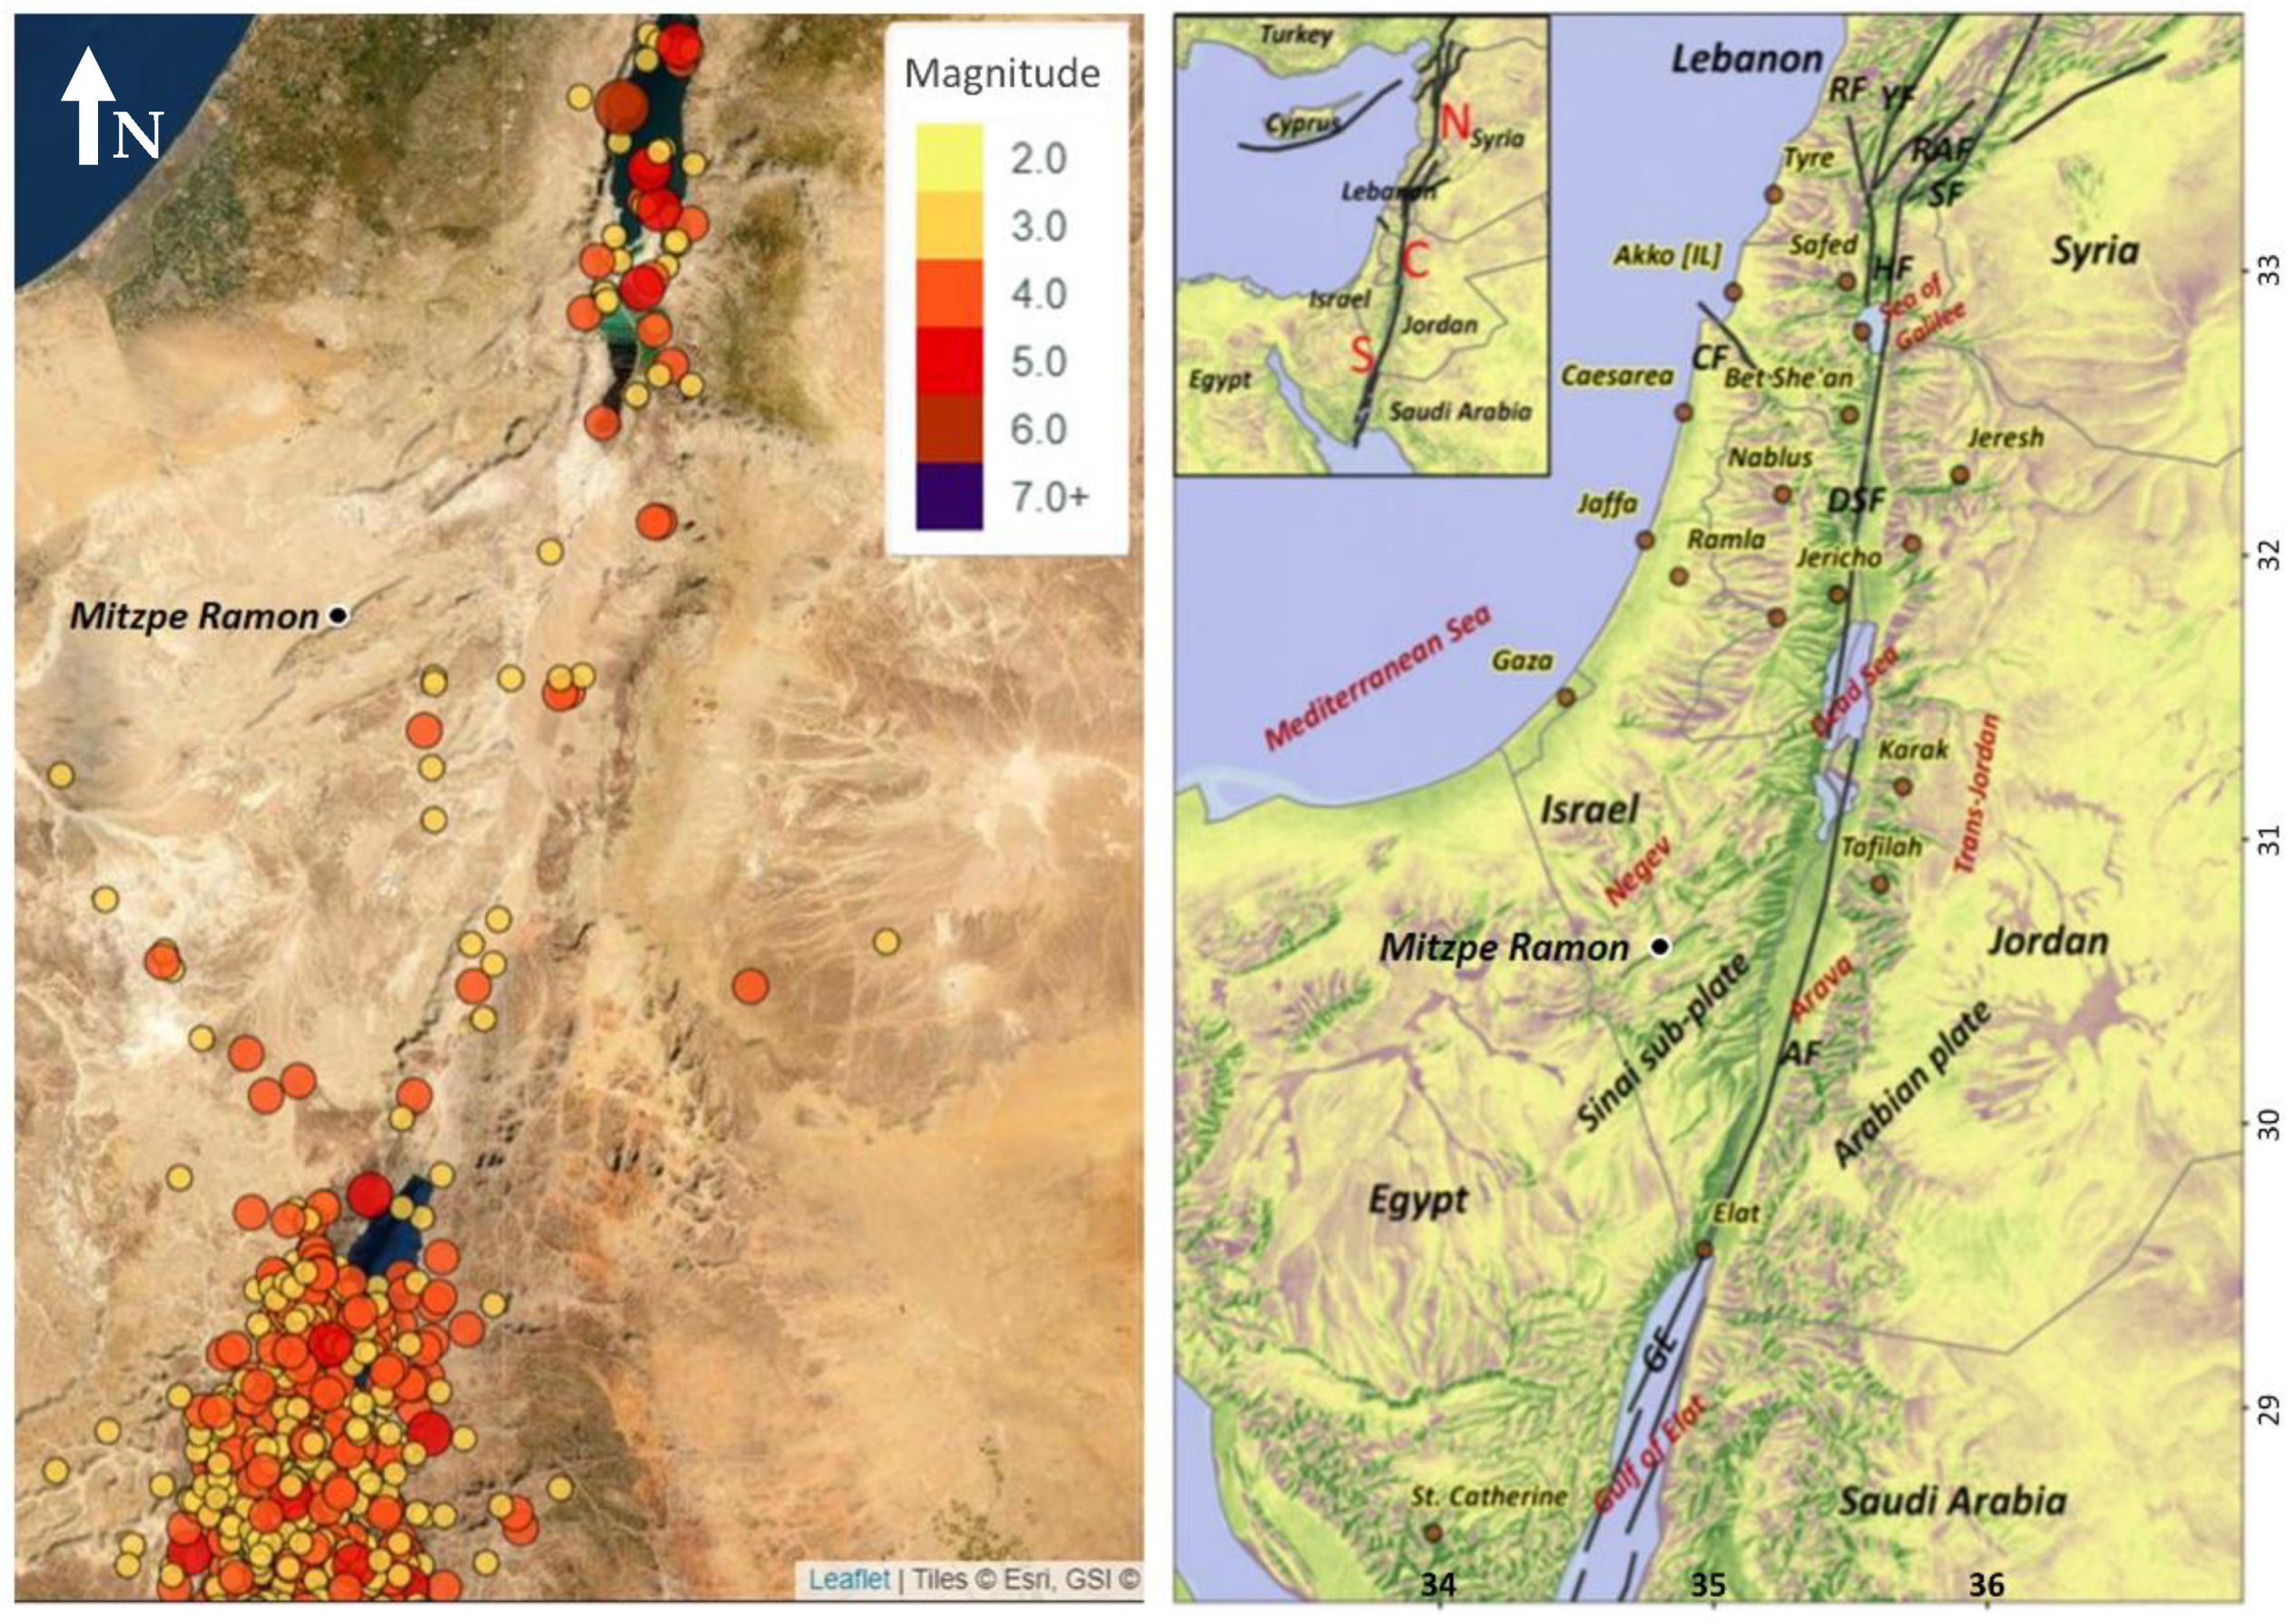
1.2. Seismic Risk in Israel and the Case for Localized Assessment of Risk and Preparedness

Israel is situated along the Dead Sea Transform (Figure 1), which is tectonically active and has generated many large earthquakes including a magnitude 7.2 event in 1995, in the Gulf of Aqaba [32]. Historical records indicate that almost every city in Israel was damaged in the last two millennia by large earthquakes [33,34].
To prepare for future earthquakes, national emergency scenarios have been developed in Israel to evaluate expected damage intensity. Such scenarios show that a high-magnitude earthquake might cause serious damage to vital infrastructure, roads and communication networks [35]. In outlying-peripheral areas, earthquakes impose a risk of the regional shut down of transportation and life-lines, causing insufficient access to water, food, shelter, medical care and information. Communication and leadership collapse might further increase confusion and suffering [30]. In its efforts to prepare for an impending earthquake, the Israel National Emergency Management Authority (NEMA) has formulated an extensive emergency plan that provides guidelines and procedures for coping with earthquakes [36]. NEMA has long realized that in order to improve community resilience and self-reliance during harsh post-earthquake conditions, it must promote personal and familial preparedness. This is particularly challenging and important in peripheral communities. These communities are physically and, to a large extent, cognitively cut off from the center of the country, making it harder to motivate them to prepare for earthquakes [37].
While national scale studies of community resilience are vital for improving national disaster and recovery strategies (e.g., [38]), they are not tailored to gauge the ability of specific communities and individuals to cope with the aftermath of a disaster, and in particular, they do not address the difficulties expected in isolated communities such as those in the Negev desert. A central example may be the availability of emergency water and supplies, or high risk of damage to old and fragile housing projects in which more vulnerable people and families often reside. Phibbs et al. (2018) [31] discuss how such inequities and vulnerabilities are magnified post disaster, due to locally deficient access to resources (they define and explain these within the context of an “Inverse Response Law”). Existing emergency plans and policies based on national generic resilience surveys should therefore be augmented with studies and surveys tailored to the state and condition of such remote towns.
Finally, some of these desert towns are tourist hubs and therefore experience significant seasonal variation in population. If roads are blocked or transportation is restricted in a disaster during the holidays or during one of many local festivals, the visitors stranded in the town would greatly outnumber its permanent residents and overwhelm its emergency and medical facilities. The unique high-desert weather conditions (hot summer days and cold winter nights) could also inflict significant suffering and “secondary damage” in the aftermath of a disaster in an isolated town where self-reliance is crucial and resources and facilities are limited.
The case study of Mitzpe Ramon situated in the center of the Negev desert. Mitzpe Ramon is the most isolated town in Israel (Figure 1). It was initially established as a temporary housing camp for workers, later it evolved into a mining community, and eventually was established as a municipality in 1965. Additional neighborhoods were constructed to house immigrants in the 1990s. Like many other peripheral towns in Israel, the gradual growth resulted in neighborhoods that are very different in demographic and housing characteristics—and therefore may be characterized by various vulnerability factors. The older neighborhoods consist of three–four story high apartment buildings which are largely populated by older immigrants and the original settlers of the town, and the newer neighborhoods consist of one story semi-detached (duplex) houses and single family detached houses with younger families or young adults. As of 2020, the permanent population in the town is approximately 5200.
Due to its remoteness, topographic altitude, climate and location (on the edge of an erosional crater, Finzi et al., 2018 [39]), the town is a national and international tourist attraction. Local accommodation caters to a very diverse clientele, with approximately 550 hotel/hostel rooms in town, 100 AIRBNB apartments and 1000 beds in tents and campgrounds near town. As expected in the desert, tourism is seasonal, with highest occupancy in March and April and low occupancy in June, July, September, October and November. While tourism is a blessing and accounts for about 30% of all jobs in Mitzpe Ramon, it also inflicts large fluctuations in the total population of the town, with up to 20,000 visitors in town during annual multiday festivals (e.g., Perseids meteor shower, [40]).
Mitzpe Ramon council emergency plans are largely based on national guidelines and scenarios and therefore do not explicitly account for the special demographic, structural, climatic and other characteristics of the town and do not address the significant differences between the various neighborhoods in the town [41].

2. Objectives

The work presented here demonstrates a proposed methodology to improve familial awareness to seismic risk and to improve local emergency plans by mapping spatial patterns of risk and preparedness. In addition, we demonstrate how spatial and temporal variations in weather and population factors may significantly influence community resilience and the ability to cope independently with a natural disaster in an isolated town (using Mitzpe Ramon as a limited case study).
An online tool for self-assessment of risk and familial preparedness was designed to make the data defined in the Israeli construction standard [36] and the international citizen preparedness guidelines [42] to be self-explanatory, personalized and suitable for the general public. The interactive self-assessment tool provides immediate feedback that emphasizes practical recommendations tailored to the characteristics of each home and level of current household preparedness. By coupling risk and preparedness and indicating the effectiveness of suggested actions (in terms of preparedness score), we hope to increase the sense of self-efficacy and motivate people to take action.
We conducted a comprehensive survey in the desert town of Mitzpe Ramon, Israel, and found significant spatial variance in the severity of the expected damage to residential structures and in preparedness (Section 4). These results suggest that mapping the self-evaluation results of preparedness and expected damage at the neighborhood level may be used to identify areas of high and low community resilience within towns and cities. Finally, in Section 5 we discuss the need to incorporate seasonal peaks in tourism and extreme weather conditions in disaster management plans, especially in periphery desert towns such as Mitzpe Ramon. In the discussion we outline conceptual indexes for “seasonal over-burden” and “emergency hardship” that could improve the analysis of resilience and emergency plans. Such temporal analysis is especially important for planning ahead of multihazard crises (including the occurrence of an earthquake during a pandemic or an extreme weather event).

3. Methodology

3.1. Algorithm for Evaluating Personal Risk

A simplified concept of risk is presented to the user of the online self-assessment tool. Risk is portrayed as a qualitative damage intensity (DI) evaluation and verbal description of the expected damage and shaking intensity in one’s house if it experiences the ground accelerations described by national authorities (peak ground accelerations (PGA) for 10% probability of exceedance in 50 years based on Israel Standard 413 [43]). In other words, the risk of damage is described to the resident in terms of severity (intensity) per probability and time period defined in the building code for residential structures.
The DI scale introduced by Finzi et al. [41,44] is based on the Modified Mercalli Intensity scale (MMI; [45]) which is a qualitative scale used of the shaking intensity felt during an earthquake. This scale is composed of 12 degrees of severity, based on the feelings and observations of the person experiencing the quake. The scale describes damage to buildings and incidences within structures, but does not consider the details of the building’s features, such as height, structural elements, or building standards. Since the Mercalli scale was developed, many studies have attempted to correlate MMI severity levels with physical ground shaking measures (e.g., PGA) and the structural characteristics of the building [46,47,48,49,50,51]. A consensus has not been reached, but most data and studies indicate a qualitative (but inaccurate) correlation between ground acceleration (or combined measures of acceleration and velocity) and the 12 MMI severity levels. As our goal is to portray a simplified, qualitative scale with only four risk categories (low/moderate/high/very high risk), the existing correlation is sufficiently accurate.
To simplify the MMI scale, low intensities (MMI ≤ 3) are binned into one level of DI (DI = 0) and high intensities (MMI ≥ 9) are binned into the maximal DI level (DI = 6). The online tool includes even simpler verbal categories of low/moderate/high/very high DI levels (i.e., DI = 0,1 correlate to low risk, DI = 2,3 moderate risk, DI = 4,5 high risk and DI = 6 is very high risk). Table 1 presents the correlation between DI and MMI levels and it details the horizontal ground acceleration values plausible at these intensity levels according to numerous statistical studies in the US and New Zealand [47,51].
The self-evaluation of DI requires input of the address and four structural characteristics of the person’s house: height (number of floors), date of construction, whether the house is built on pillars (a soft ground floor that may amplify motion), and if the structure includes an elevator or a bomb shelter (strong elements that, according to the National Homefront guidelines, make the house more resistant and safe). The address of the house is used to derive the spectral acceleration values stated in the Israeli building code and national hazard maps (IS 413 [43]) and lithology/soil properties that affect the shaking intensity at a given site [43]. The DI evaluation accounts for building height by considering which spectral acceleration from the Israeli building code best correlates to the natural frequency of shaking. For simple structures it is assumed that the natural frequency may be approximated by: f ≈ 10/(number of floors), suggesting that PGA values are most relevant for houses with 1–2 floors (natural frequency ≥ 5 Hz), spectral accelerations SS (oscillation periods of 0.2–0.3 s; [43]) for low apartment buildings with 3–5 floors (2–4 Hz), and Sl (1 Hz) for taller structures.
Based on the maximum accelerations and amplifications expected at the house (according to IS 413), an initial MMI intensity is resolved. This initial intensity estimate is then increased if a house was constructed before 1980 (when Israeli building codes started to address ground shaking implications) and if it has pillars (a soft ground floor). For a house with initial MMI estimate of 8 or higher, the increase in intensity due to structural properties (and age) is limited to 1. This reflects an expected saturation in damage due to factors with high correlation (old buildings in Israel do not have a shelter and often have a soft ground level). It is also in accord with expert opinions regarding the highest intensity and damage levels expected in Israel (A. Salomon, O. Dor, T. Levi and G. Biran, oral comm. 2019). The MMI estimate is reduced if the house was built after 1995 (when probabilistic hazard analysis was integrated into the building code) and if the house has a shelter or a lift. As houses built after 1995 were required to include a shelter, MMI is only reduced by one level for new houses with a shelter.
The final MMI is then correlated to a damage intensity level and to verbal descriptions of perceived shaking, indoor situations and damage to buildings based on Table 1. The resulting DI severity assessment adjusts the MMI scale to account for structural properties and it simplifies that scale to make it appropriate for communicating to the general public. However, as the MMI scale and its correlation to ground accelerations are based on statistical studies that cannot predict the extent of damage to a particular structure, our DI estimates must be considered as qualitative, simplified evaluations that should be presented to the public in abstract, verbal terms (low, medium, high, very high risk). While the simplified DI scale is used to communicate knowledge to the public, in our analysis and in communications with emergency planners and municipality representatives, we use the well-known MMI scale.

3.2. Evaluating Readiness

In 2006, the U.S. Council for Excellence in Government (CEG) and American Red Cross (ARC) introduced a Public Readiness Index [5,52] The CEG realized that in spite of spending millions of dollars to educate the public about what to do in an emergency, no one has ever given the public a simple, consistent tool to measure how prepared they are. To fix this, an online self-evaluation test (http://www.whatsyourrq.org/ (accessed on 1 May 2021)) was developed for individuals and families to determine their personal “RQ” score (readiness quotient). The RQ survey consists of three “knowledge” questions (e.g., Does your local government have an emergency or disaster plan for your community?) and seven “behavior” questions (e.g., Have you actually practiced or drilled on what to do in an emergency at home?). FEMA (2013) [9] validated the strong effect that RQ-based intervention had on community engagement and preparedness.
Following the RQ rationale and inspired by new tools being developed [41,52], we built an online Personal Readiness Evaluation tool (PRE; scale from 0 to 10). The PRE score is calculated based on answers to 13 questions covering the following aspects: infrastructure (instrumental preparedness, four questions accounting for 35% of the overall score), action plan for during and right after an earthquake (two questions, 15% of score), physical disability and emotional/experience factors (two questions, 15% of score), community involvement and support (two questions, 15% of score), and awareness and risk perception (two questions, 20% of score). All questions were closed ended (e.g., “Do you (or your neighbors) have a fire extinguisher?”, “Do you (or your neighbors) have a first aid kit?”) with three optional answers representing three degrees of community preparedness: yes (1 point), a neighbor has (0.5 point), no (0 point)). The questions and their exact wording were based on previous surveys [5,52].
The online PRE calculator provides immediate feedback with personally tailored recommendations based on National Homefront recommendations and considering the responses that indicate lack of preparedness. For example, a person without a first aid kit and a plan for where to go after an earthquake will be advised to improve on these issues and will be notified how this would improve his or hers PRE score. The recommendations are sorted based on practicality, plausibility of being implemented by people and potential impact during an emergency.
In Mitzpe Ramon, we complemented the online collection of data with extensive at-school and door-to-door surveys that focused on the older and newer neighborhoods of Mitzpe Ramon, where 115 households were surveyed out of a total of 750.

3.3. Mapping Risk and Readiness at the Neighborhood Scale in Order to Identify Local Patterns

The appropriate scale for a combined analysis of risk and preparedness depends on the scope of interest and on the variability of risk amplifying factors, such as seismic wave amplification, demographic and architecture spatial patterns. In a regional study, one might compare the risk and readiness of different villages and towns in order to improve regional and national resource allocation and risk mitigation strategies. Such a study could also benefit from an analysis of specific neighborhoods in the various towns of a region, in order to identify low-resilience, high-risk zones that require the adaptation of emergency plans or resource allocation. The current study introduces the risk-evaluation algorithm and attempts to provide tools to improve the local emergency plans of an isolated desert town. For this we first compare risk evaluations for selected house types that typify numerous neighborhoods in peripheral towns in Israel (Table 2), and then we focus on defining the risk and preparedness levels of the main neighborhoods of Mitzpe Ramon (each neighborhood has a typical type and age of residential structures, with very few exceptions of rebuilt or renovated structures). To complete the analysis in Mitzpe Ramon, we combined a field survey of all houses in these neighborhoods, offline surveys and online surveys of readiness and risk. While the typical risk score (in terms of MMI) was calculated for each neighborhood separately, the readiness (PRE) averages were determined for the new and old neighborhoods (where we retrieved responses from approximately 15% of households).

4. Results—Earthquake Intensity, Resident Preparedness and Seasonality

4.1. Evaluating Damage Intensity in Buildings Typical of Israeli Peripheral Towns

To assess our damage model, we focused on five types of structures that are common in the development towns of Israel’s periphery. We analyzed the severity of damage to these building types in the full range of soil types that are common in Mitzpe Ramon and in Beer Sheva (the largest city in southern Israel) and in Eilat (an international tourist destination in the southern Negev). Table 3 shows the intensity felt in each type of structure according to the algorithm and ground acceleration, as defined in Standard 413. This considers the building’s location and foundation. It is evident that in most towns, many of the common structure types are at medium to very high risk of damage. The results are in agreement with statistical, national evaluations [35] and expert opinions on the plausible damage severity and variations expected within these cities (A. Salomon, O. Dor, T. Levi and G. Biran, oral comm. 2019; [41]).
The large range of intensities (MMI = 4–10) represents the significantly variable level of damage expected to occur in the five structure types and three different settings in which the algorithm of the risk calculator was assessed. Table 2 describes localities 0–50 km from the Dead Sea Transform (the dominant source of seismic risk in the region) with diverse lithologies (from A—hard rock to D—soft soil or sediments). The variations in lithology and distance from the DST dictate the range in ground accelerations considered in our DI assessments, based on PGA and Ss data from the Israeli building code (PGA = 0.06–0.28 g, Ss = 0.16–0.7 g; [43]).
The intensity values in Table 2 demonstrate the dominant influence of building type on the plausible damage level inflicted by an earthquake. At all selected settings, the maximal ground acceleration stated in the Israeli building code results in a large range of MMI levels, with a severity differences of 4–5 levels between damage in new, small homes and old, three to five story high apartment buildings. In Mitzpe Ramon, for example, the same earthquake is expected to cause low intensity (MMI = 4) damage in a new, one-story house with a shelter, while in an old, four-story house on pillars, without an elevator or shelter, the intensity is expected to reach MMI = 8 (the two structures are in close proximity and on the same lithology).

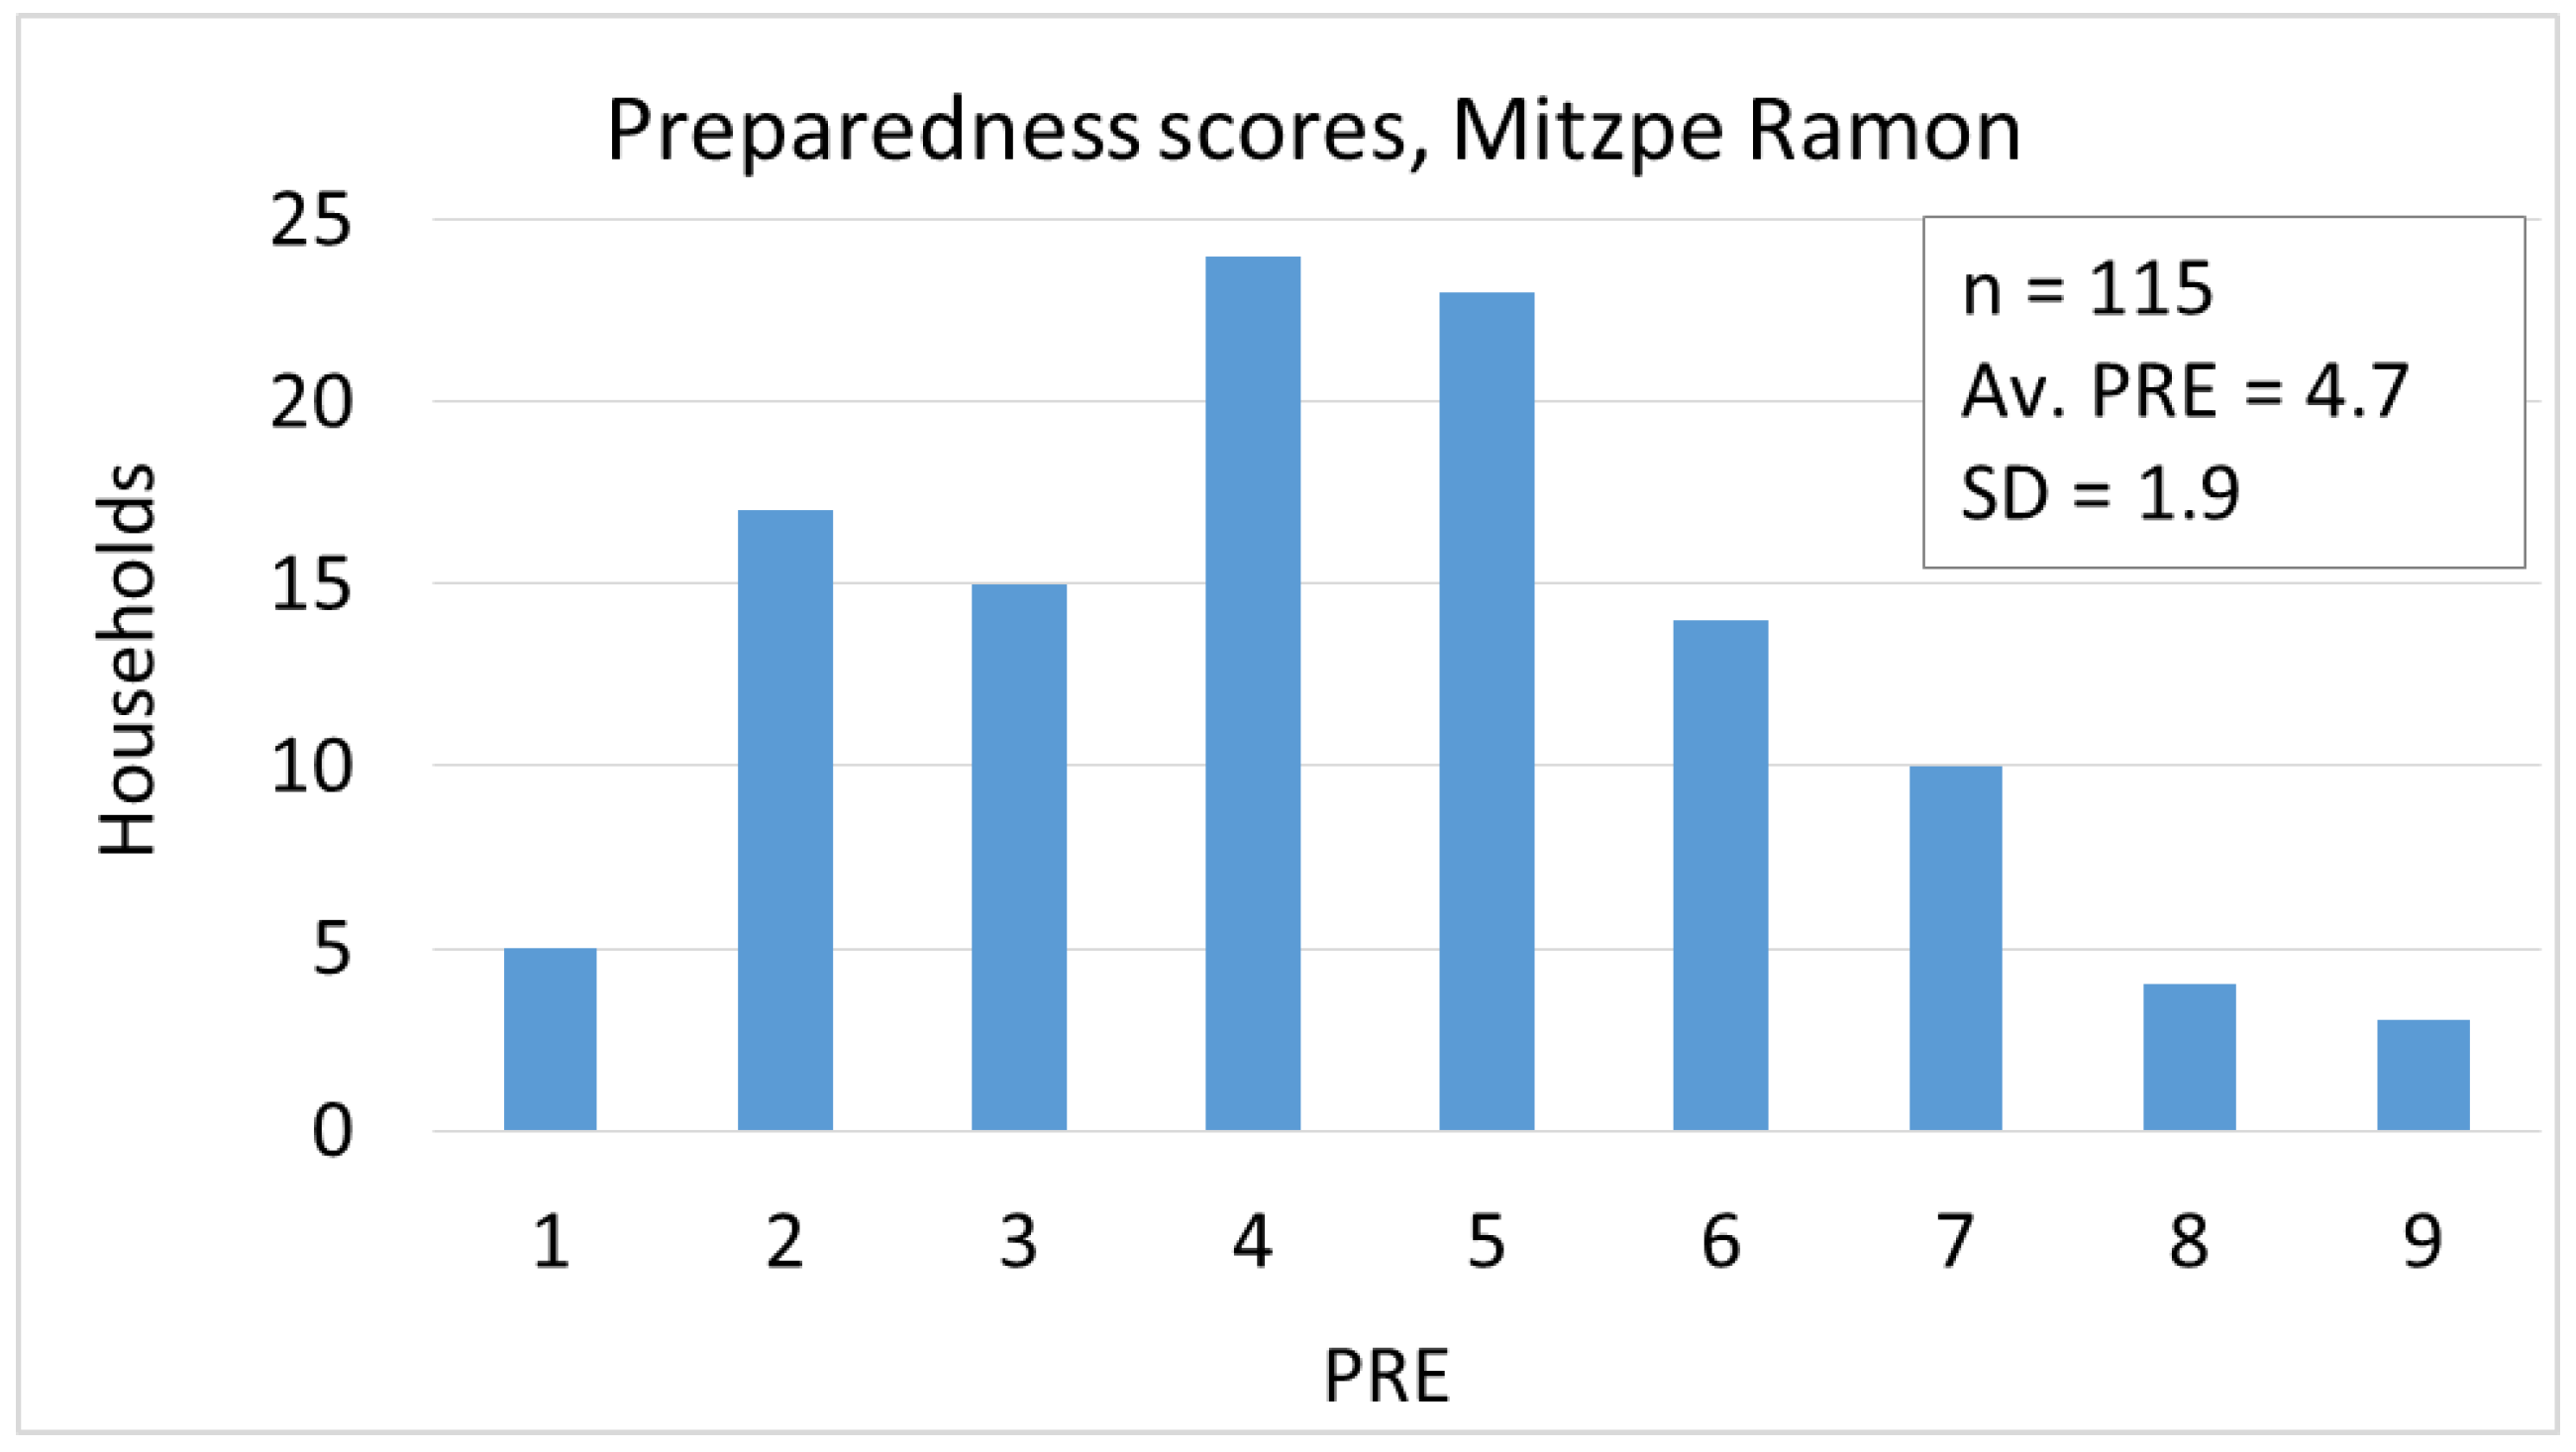
4.2. Familial Preparedness of Mitzpe Ramon Residents

Figure 2 shows the results of the preparedness questionnaires answered by residents of Mitzpe Ramon. The questionnaires assessed the personal/familial preparedness only, without considering the type of residence or its structural integrity. It is evident that most households that participated in the survey (85%) indicated low to moderate preparedness (PRE = 1–6); the average PRE score is 4.7, the standard deviation is 1.9 and the median score is 4.5. As will be discussed in the next section, the large standard deviation is related to the diverse demography in town, with some communities scoring higher PRE scores than others. The Personal Readiness Evaluation (PRE) app is designed to identify the weak points of each resident’s preparedness level and suggest ways to improve their score. By providing immediate feedback and emphasizing appropriate actions to improve preparedness, we hope to encourage residents to become more prepared for an emergency scenario.
The spatial pattern showing the degree of community preparedness (per neighborhood) is presented in the following section.

4.3. Mapping Risk and Preparedness to Improve Local Emergency Planning

Risk (DI) and average preparedness were mapped for the residential neighborhoods of Mitzpe Ramon. The uniform design of homes resulted in a common DI evaluation for practically all buildings in each neighborhood (each polygon in Figure 3). While the entire town is generally characterized by an ill-prepared population (average PRE = 4.7, few households with PRE > 7; Figure 2) and most structures are expected to endure medium or low damage in the scenario presented above, the spatial distribution of risk and damage is far from uniform and it reveals areas of strength and weakness in community resilience. Our spatial analysis reveals an inverse-correlation between damage severity and level of preparedness (Figure 3). In two neighborhoods, which consist mainly of old three to five story apartments (raised on pillars, and without a fortified shelter or elevator) we found that the population was ill-prepared for an emergency (MMI = 8; PRE = 3.9). In contrast, within the newer neighborhoods of Mitzpe Ramon, the modern buildings are less susceptible to damage and therefore the expected damage severity is lower (MMI = 4–5). In addition, resident preparedness in this area was significantly better (PRE = 5.2; Figure 3). Preparedness within each neighborhood was more uniform than the overall preparedness of the entire population of Mitzpe Ramon (PRE SD = 1.9 for the entire town and SD = 1.5 for the old and new neighborhoods analyzed separately).

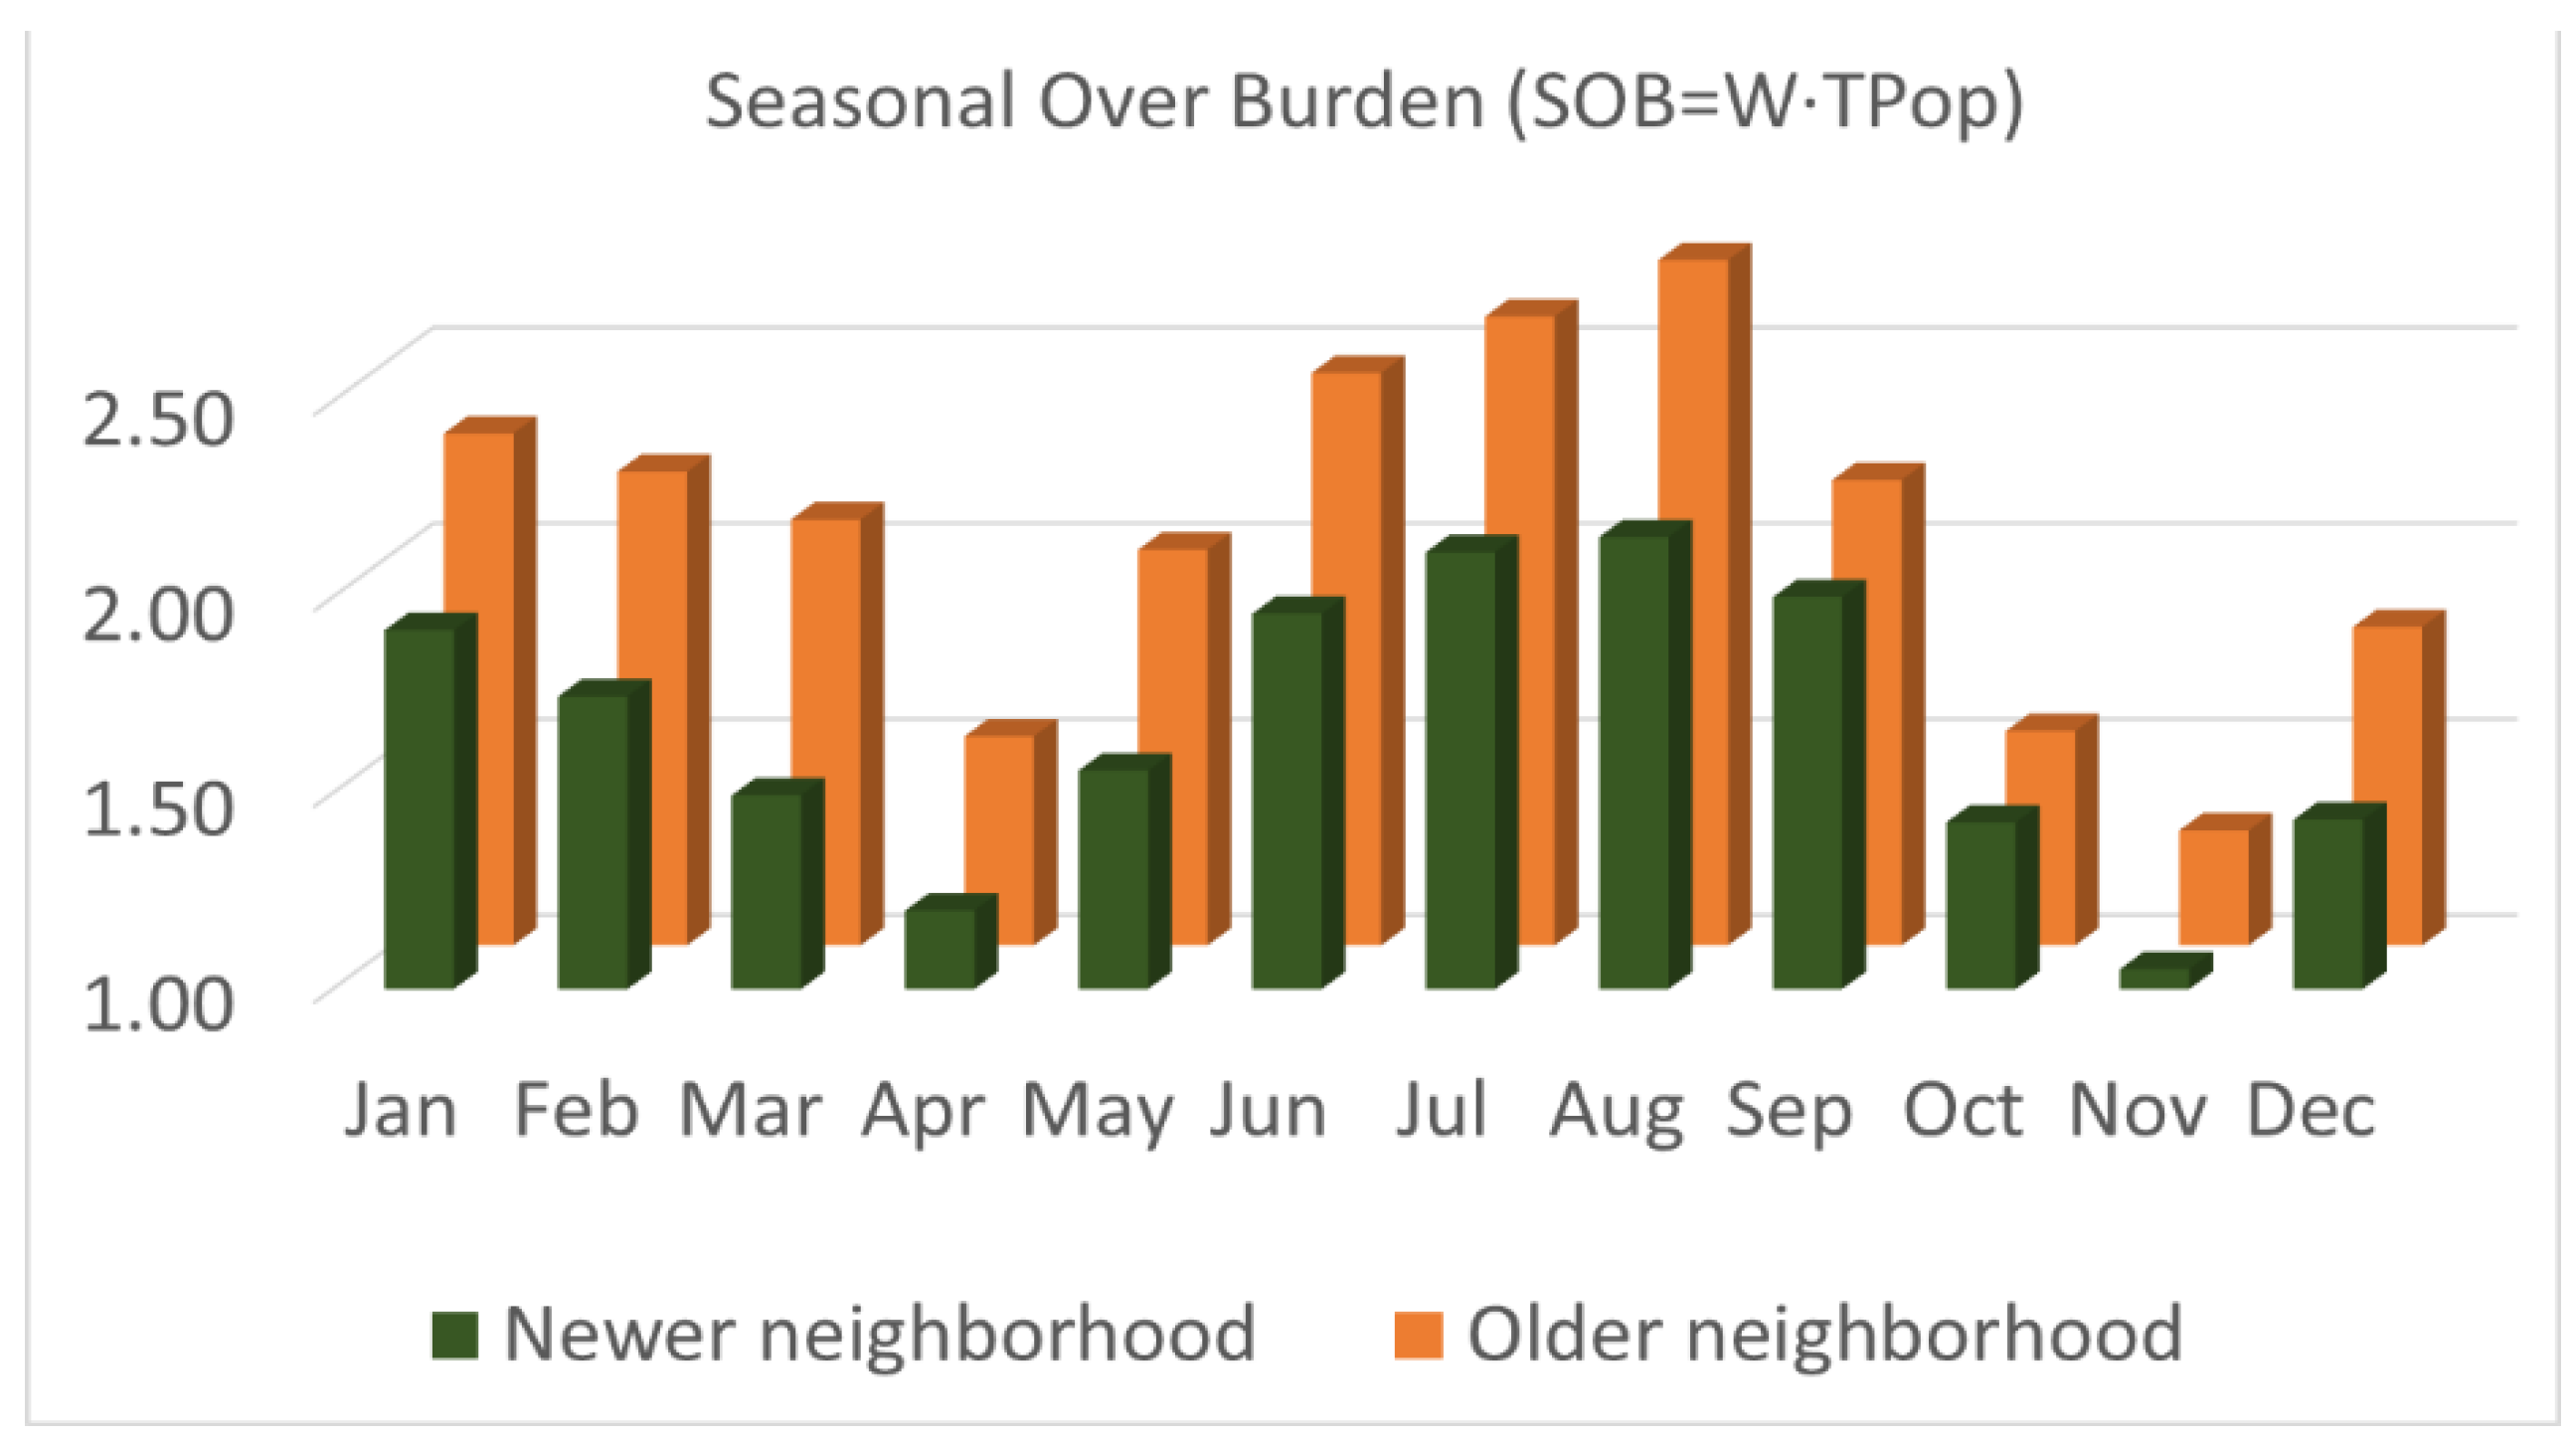
4.4. Seasonal Impacts on the Resilience of an Isolated Desert Community

Many peripheral towns such as Mitzpe Ramon will have to rely on local resources and emergency forces in the aftermath of a significant natural disaster. The closure of roads, failure of long life-lines and diversion of limited national resources to larger cities with higher damage levels will temporarily demand self-reliance and will prevent the mass evacuation of people from the town. In fact, the national Israeli emergency plans include the possibility that Mitzpe Ramon would take in thousands of people evacuated from Eilat. A successful local response to a prolonged state of emergency greatly depends on the ability to shelter and provide for evacuees. This is significantly affected by weather conditions (that are often harsh in the desert) and by the total amount of population “stranded” in the town (including tourists and evacuees).
Temporal patterns in tourism, and in extreme heat and cold conditions, were analyzed to demonstrate and highlight the effect these may have on emergency efforts in the days after a disaster. Assuming that national emergency responders, supplies and medical teams will become available for Mitzpe Ramon after a few days, we chose to focus on the potential effect of harsh conditions during a three-day period of emergency response (the probability of a co-occurring multihazard event increases significantly in prolonged states of emergency, such as experienced during the COVID-19 pandemic; [25]).
Extreme weather was analyzed, based on Israeli Meteorology Service data (2004–2020; IMS, 2020 [53]). Conditions of heat stress were determined from air temperature and humidity data (Tfelt > 24 °C defined as the threshold for significant heat stress; [53]) and conditions of “cold-stress” were determined from air temperature and wind velocity (Tfelt < 4 °C defined as the threshold for significant cold stress). A day with at least three hours of heat or cold stress is considered to have harsh conditions. As expected, there are many days of extreme weather in Mitzpe Ramon—on average 125 days a year (89–143 days annually). We also found a clear seasonal pattern with 50–60% of days with harsh conditions occurring in the heights of summer and winter (January, July, August) and typically less than 12% during the months of spring and autumn (March, April, October, November). Table 3 presents the probability of experiencing at least one day of harsh weather within an interval of three days in Mitzpe Ramon. A three-day period was chosen to represent the time period in which self-reliance and local-response are expected in the rural towns of Israel (in the aftermath of a plausible earthquake; e.g., [11,36]). The probability of coping with harsh weather during an emergency in spring (April) and autumn (November) is lower by a factor of 9–50 (compared to the probability during the summer). In the discussion we introduce a factor W that qualitatively represents the burdening effect of harsh weather in the aftermath of a disaster.
Table 3. Seasonal stressors in Mitzpe Ramon. Probability of experiencing extreme weather in an interval of three days, and total population in the neighborhoods discussed in the text and shown in Figure 3. Variability in monthly probability was calculated based on the variability in the number of days with heat or cold stress in the 16 years of data. Monthly TPop represents average values of population between July 2016 and May 2020, and as tourism is growing fast (and is directly affected by disasters such as the Covid-19 pandemic) the numbers are only used for qualitative insights on seasonality.
Probability of Heat/Cold Stress during 3 Days of Emergency
JanuaryFebruaryMarchAprilMayJuneJulyAugustSeptemberOctoberNovemberDecember
Probability82%65%38%11%48%86%100%100%87%32%2%34%
Variability
(1 SD)
60–94%36–83%3–62%1–19%22–70%61–97%97–100%99–100%66–97%0–58%0–10%7–56%
Seasonal total population (TPop)
JanuaryFebruaryMarchAprilMayJuneJulyAugustSeptemberOctoberNovemberDecember
Newer neighborhood1.01.11.11.11.01.01.11.11.11.11.01.1
Older neighborhood1.31.31.51.41.41.31.31.41.21.21.31.3
It is of no coincidence that many tourists come to Mitzpe Ramon during the months with milder weather conditions (March–May, November, December), but school vacations, holidays and weather conditions in Europe also affect tourism seasonality. In August, in spite of daily highs regularly reaching 30–35 °C, the evenings are much cooler and windier than in most of Israel, and many people come to view the famous starry nights and Perseids meteor shower. When considering the impact of tourists on local emergency responses and supplies, it is important to realize that tourists lack knowledge about local services, emergency contacts and procedures, and are often hindered by a language barrier. Tourists therefore require as much of the resources from emergency personal as the more weakened groups of the local population.
Based on average occupancy in two hotels and all AirBNB properties that are listed within Mitzpe Ramon (July 2016–May 2020), we analyzed the transient population during weekends throughout the year (Thursday and Friday nights are considered weekend nights and on average they exhibit occupancy 2–4 times higher than weeknights). The tourism dataset gives a qualitative idea of seasonal fluctuations in the number of tourists, but it vastly underestimates the actual number as it excludes special dates (festivals with thousands of visitors) and it excludes a large hotel and hostel that are located just outside of Mitzpe Ramon (and another hotel in town, for which we could not obtain data). The weekend occupancy was evaluated from monthly average room sales, “per sale occupancy“ estimates (2.5 people per sale) and testimonies of tourism managers regarding the proportion of visitors during weekends. While the tourist numbers are incomplete for the entire town, they are sufficiently complete for three specific neighborhoods for which we have analyzed average risk and preparedness (Figure 3). These neighborhoods are the largest in Mitzpe (ca. 3000 residents) and host a large majority (85%) of tourists. Table 3 shows the total population in older and newer neighborhoods as a fraction of the number of residents (TPop = (tourists + residents)/residents). While the seasonality patterns are almost uniform all over town, it is clear that the older neighborhood (with lower preparedness and higher risk) has greater fluctuations in transient population (TPop = 1.2–1.5) than the new neighborhood (TPop = 1.0–1.1; Table 3). This shows that the spatial distribution of population within the town changes with time, suggesting that emergency plans should account for such spatial−temporal patterns.
In Section 5, we discuss a proposed conceptual method to describe temporal and spatial variations in population and weather extremes, in a way that could improve emergency plans.

5. Discussion

5.1. Conceptual Integration of Seasonality and Local Spatial Factors in Emergency Planning

Mitzpe Ramon offers a good case study to show spatial and temporal patterns in community resilience and the ability to cope with disasters. Because of its isolation and limited resources, survivors of an earthquake will likely be without shelter and with a shortage of basic supplies for a significant period of time. The severe cold of winter nights in the high desert, and the extreme heat of summer days, are life threatening in the aftermath of such disaster. So much so, that survivors might be forced to find shelter in structurally compromised buildings. The relatively moderate conditions during fall and spring pose no such threat. Hence, between the dramatic difference in weather and the fluctuations and spatial distribution of tourism occupancy, seasonality must be taken into account when assessing preparedness, risk and emergency plans.
A generic, qualitative index for seasonal overburden (SOB) due to changing population and harsh weather conditions could be defined as follows [44]:
SOB = W∙TPop
where W represents the probability of experiencing harsh weather conditions in any single day or night during the aftermath of a disaster (W = 1 + probability), and TPop is a factor representing fluctuations in total population ((tourists + residents)/residents). The probability obviously strongly depends on the number of days during which survivors are in makeshift shelters without the ability to be evacuated (in the Mitzpe Ramon case study we assumed this self-reliance and isolation stage would last three days). The SOB evaluations for the newer and older neighborhood addressed in previous sections are shown in Figure 4. Harsh winter and summer conditions are well represented by SOB values greater or equal to two. It is also apparent in Figure 4 that the older neighborhood hosts many more tourists and therefore exhibits higher SOB values. In August, with harsh weather conditions and high numbers of tourists in town, the SOB reaches values of 2.2–2.9 in new and old neighborhoods, respectively. This suggests that during an emergency (in August), responders and community members would face much greater challenges and difficulties, compared to a similar scenario in the months of April, October or November (SOB = 1.2–1.5, 1.4–1.5, 1.1–1.3, respectively).
A more complex conceptual “emergency hardship index“ can be derived from using SOB as a factor enhancing the overall severity of a disaster or the difficulty to cope with its aftermath. For example, if the overall severity is represented by the ratio between the risk of damage (DI) and preparedness (PRE), then factoring this ratio by SOB would account for the impact of seasonal weather and tourism effects. Such a conceptual “emergency hardship index” should be used for emergency planners to better understand the ability of a community to cope with a state of emergency related to the given earthquake scenario. Finzi et al. (2021) suggests that damage intensity (calculated MMI) should have more weight in such a hardship index (compared to SOB and PRE) and suggests that in a regional comparative study, a regional scaling factor could be applied to normalize the highest hardship index value to 100 (Equation (2) in Finzi et al., 2021 [44]). The procedure demonstrated by Finzi et al. [44] facilitates the regional spatial analysis of hardship and resilience, and could be used to compare hardship in different seasons (or any temporal scenario). While more work is needed in order to establish and calibrate such a hardship index, applying its simplest form in our case study highlights the fact that the older neighborhoods of Mitzpe Ramon are expected to constitute a much greater challenge for emergency forces than the newer neighborhoods (i.e., due to higher risk, lower preparedness, more tourists during the harsher conditions of winter and summer).
Communicating our results and insights to Mitzpe Ramon Council and its emergency response officer, a few improvements were outlined for local emergency plans. Water and supply distribution plans should take into account the potential extensive damage severity and transient population in the old neighborhoods. The capacity for local evacuee management should take into account the increased transient population and seasonally harsh weather conditions (with SOB peaking in August). In addition, as instrumental PRE scores were low in the old neighborhoods (lacking fire extinguishers and first aid kits), a program was proposed to encourage residents and tenant associations/committees to get such emergency equipment and improve their risk awareness and resilience. As these improvements do not require much funding, and as they were derived in collaboration with council representatives and with a direct focus on local plans, the feasibility of implementation is high (but ultimately depends on local authorities).
Applied on a regional scale, in Israel or other countries, the methodology could be used to identify vulnerable communities that are likely to experience inadequate post-disaster services, a lack of basic resources and greater dependency on governmental and NGO assistance [31]. In collaboration with local authorities and emergency services, identification of spatial and temporal patterns in preparedness and risk may provide a basis for improving emergency plans and community resilience.

5.2. Limitations and Future Work

Further research is needed to determine the effectiveness of online self-evaluation tools as a method to encourage preparations and enhance awareness or risk [27,28]. Our PRE-DI evaluator is tailored to be user friendly and its simplicity was appreciated by users in our case study. However, user-friendly dissemination comes at the expense of a thorough account of the complexity of risk and resilience. In addition, we did not yet engage in a long term assessment of the improved perceptions or preparedness of people and communities that used our online PRE-DI evaluator. A larger scale, long term study is being planned to evaluate the effectiveness of our intervention method.
The risk (DI) calculator should be improved by incorporating ground velocity data, fragility curves for structures, in-depth analysis of structural integrity and geological site properties that may amplify seismic shaking. However the online tool would then only be suitable for professional use—by engineers who could collect such data and perform such analysis. Due to the reliance on user-provided input, the lack of fragility curves and the inaccurate correlation between shaking intensity and damage, the qualitative nature of our risk index (DI) is primarily suitable for the dissemination of knowledge to the public.
Finally, quantifying resilience and its many contributions (social, economic, institutional, physical and natural etc.) is very challenging. To date, there is no model that offers systematically quantified relative weights and interdependencies between components of resilience, taking into account temporal patterns as people and communities transition through different stages of response and recovery [14,54,55]. The “emergency hardship index“, discussed above, provides a crude quantification tailored to amalgamate qualitative evaluations of hazard, exposure and fragility (DI) together with a self-evaluated preparedness score (PRE) and with a simplified factor representing seasonal stressors (SOB). Although this index is tailored to inform risk reduction strategies at the highest resolution, it does not systematically quantify resilience or predict hardship levels after an earthquake. Further theoretical and empirical investigations are needed to develop such operational models.

6. Summary

The two main contributions presented here are conceptual and require significant adaptation before implementation in other communities or upscaling for national use. Nevertheless, the PRE-DI self-evaluation tool constitutes an innovative platform for dissemination of national risk and guidelines and for motivating people to self-evaluate and thereafter improve preparedness. The spatial and temporal analysis of risk, preparedness and seasonal stressors clearly demonstrates the need for high-resolution, multihazard analysis for improving local resilience and emergency plans. The presented methodology should be used to identify local community vulnerabilities, challenges in emergency plans and opportunities to improve risk reduction strategies. In order to implement the methodology elsewhere, the risk (DI) evaluation algorithm must be refined and tailored to reflect national building codes and practices and hazard scenarios.
For the authorities of Mitzpe Ramon, the results assert and emphasize, what was until now a vague notion, that some neighborhoods will pose a greater challenge and suffer greater hardship in the wake of a strong earthquake. They also illuminate the fact that seasonal stressors, such as tourism and weather extremes, should be accounted for in emergency plans, in the same way that an ongoing pandemic should be accounted for when coping with a multihazard crisis.
The multidimensional interactions between stressors are clearly demonstrated in the international response to the COVID-19 pandemic in regions that also suffer from heat waves, fires and earthquakes. Multihazard situations can overburden medical and emergency resources. Emergency response and recovery plans should at least consider the probability and burden inflicted by a pandemic or by seasonal stressors (e.g., heat waves, fires and hurricanes). Similarly, infection mitigation strategies, medical supplies, personnel management and recovery plans in time of a pandemic, should account for the inevitable setbacks and complications inflicted by seasonal stressors. At times of uncertainty and potentially ongoing natural hazards, as the risk of multihazard crises increases, so does the need for comprehensive emergency plans that include spatial and temporal analysis of risk, preparedness, potential stressors and local vulnerabilities. Our work provides a simple methodology and a limited case study of such an analysis.

Author Contributions

Conceptualization, Y.F., S.L. and Y.L.; methodology, Y.F., Y.L. and N.G.; software, S.L.; validation, Y.F.; formal analysis, S.L. and Y.L.; investigation, Y.F. and N.G.; resources, Y.F. and S.L.; data curation, Y.F., S.L. and N.G.; writing—original draft preparation, Y.F.; writing—review and editing, Y.F., N.G., S.L. and Y.L.; visualization, S.L. and N.G.; supervision, Y.F.; project administration, Y.F.; funding acquisition, Y.F. All authors have read and agreed to the published version of the manuscript.

Funding

This research was funded by Ministry of science technology and space, Israel, grant number 3-15045.

Institutional Review Board Statement

Not applicable.

Informed Consent Statement

Not applicable.

Data Availability Statement

The data presented in this study are available on request from the corresponding author.

Conflicts of Interest

The authors declare no conflict of interest.

References

  1. Holling, C.S. Resilience and Stability of Ecological Systems. Annu. Rev. Ecol. Syst. 1973, 4, 1–23. [Google Scholar] [CrossRef] [Green Version]
  2. Burton, I.; Kates, R.W.; White, G.F. The Environment as Hazard; Oxford University Press: New York, NY, USA, 1978. [Google Scholar]
  3. UNISDR. Living with Risk: A Global Review of Disaster Reduction Initiatives; UNISDR: Geneva, Switzerland, 2004. [Google Scholar]
  4. Aldrich, D.P. Building Resilience: Social Capital in Post-Disaster Recovery; University of Chicago Press: Chicago, IL, USA, 2012. [Google Scholar]
  5. Council for Excellence in Government (CEG)/American Red Cross (ARC). America’s Ready Quotient (RQ, WhatsYourRQ. Org); CEG/ARC: Washington, DC, USA, 2007.
  6. Kano, M.; Wood, M.M.; Kelley, M.M.; Bourque, L.B. The Study of Household Preparedness: Preparing California for Earthquakes; University of California: Los Angeles, CA, USA, 2009. [Google Scholar]
  7. Hoffmann, R.; Muttarak, R. Learn from the Past, Prepare for the Future: Impacts of Education and Experience on Disaster Preparedness in the Philippines and Thailand. World Dev. 2017, 96, 32–51. [Google Scholar] [CrossRef] [Green Version]
  8. UNDRR. Global Assessment Report on Disaster Risk Reduction; United Nations Office for Disaster Risk Reduction (UNDRR): Geneva, Switzerland, 2019. [Google Scholar]
  9. Federal Emergency Management Agency. Personal Preparedness in America: Findings from the 2012 FEMA National Survey; Federal Emergency Management Agency: Washington, DC, USA, 2013.
  10. Godschalk, D.R.; Brody, S.; Burby, R. Public Participation in Natural Hazard Mitigation Policy Formation: Challenges for Comprehensive Planning. J. Environ. Plan. Manag. 2003, 46, 733–754. [Google Scholar] [CrossRef]
  11. Goldschmidt, R.; Sharon, S. Earthquake Preparedness in Israel. Research Report Presented to the Israeli Council for Science and Technology. 2010. Available online: https://fs.knesset.gov.il/globaldocs/MMM/40f06d8d-f1f7-e411-80c8-00155d01107c/2_40f06d8d-f1f7-e411-80c8-00155d01107c_11_7602.pdf (accessed on 3 May 2021). (In Hebrew)
  12. Johnston, D.; Ruth, T.; Karlene, T.; Maureen, C.; Sandy, P.; Ruth, G. Preparing Schools for Future Earthquakes in New Zealand: Lessons from an Evaluation of a Wellington School Exercise. Aust. J. Emerg. Manag. 2011, 26, 24–30. [Google Scholar]
  13. Ronan, K.R.; Johnston, D.M. Promoting Community Resilience in Disasters: The Role for Schools, Youth, and Families; Springer: New York, UY, USA, 2005. [Google Scholar] [CrossRef]
  14. Ostadtaghizadeh, A.; Ardalan, A.; Paton, D.; Jabbari, H.; Khankeh, H.R. Community disaster resilience: A systematic review on assessment models and tools. PLoS Curr. 2015, 7. [Google Scholar] [CrossRef] [PubMed]
  15. Patel, S.; Rogers, M.B.; Amlôt, R.; Rubin, G.J. What Do We Mean by ’Community Resilience’? A Systematic Literature Review of How It Is Defined in the Literature. PLoS Curr. 2017, 9. [Google Scholar] [CrossRef]
  16. Birkmann, J.; Cardona, O.D.; Carreño, M.L.; Barbat, A.H.; Pelling, M.; Schneiderbauer, S.; Kienberger, S.; Keiler, M.; Alexander, D.; Zeil, P.; et al. Framing vulnerability, risk and societal responses: The MOVE framework. Nat. Hazards 2013, 67, 193–211. [Google Scholar] [CrossRef]
  17. Cutter, S.L.; Ash, K.; Emrich, C.T. The geographies of community disaster resilience. Glob. Environ. Chang. 2014, 29, 65–77. [Google Scholar] [CrossRef]
  18. Frazier, T.G.; Thompson, C.M.; Dezzani, R.J.; Butsick, D. Spatial and temporal quantification of resilience at the community scale. Appl. Geogr. 2013, 42, 95–107. [Google Scholar] [CrossRef]
  19. Birkmann, J. Risk and vulnerability indicators at different scales: Applicability, usefulness and policy implications. Environ. Hazards 2007, 7, 20–31. [Google Scholar] [CrossRef]
  20. Cariolet, J.-M.; Vuillet, M.; Diab, Y. Mapping urban resilience to disasters—A review. Sustain. Cities Soc. 2019, 51, 101746. [Google Scholar] [CrossRef]
  21. Kontokosta, C.E.; Malik, A. The Resilience to Emergencies and Disasters Index: Applying big data to benchmark and validate neighborhood resilience capacity. Sustain. Cities Soc. 2018, 36, 272–285. [Google Scholar] [CrossRef]
  22. Xu, H.; Li, Y.; Wang, L. Resilience Assessment of Complex Urban Public Spaces. Int. J. Environ. Res. Public Health 2020, 17, 524. [Google Scholar] [CrossRef] [Green Version]
  23. Quigley, M.C.; Attanayake, J.; King, A.; Prideaux, F. A multi-hazards earth science perspective on the COVID-19 pandemic: The potential for concurrent and cascading crises. Environ. Syst. Decis. 2020, 40, 199–215. [Google Scholar] [CrossRef] [PubMed]
  24. Trump, B.D.; Linkov, I. Risk and resilience in the time of the COVID-19 crisis. Environ. Syst. Decis. 2020, 40, 171–173. [Google Scholar] [CrossRef] [PubMed]
  25. Doğulu, C.; Karanci, A.N.; Ikizer, G. How do survivors perceive community resilience? The case of the 2011 earthquakes in Van, Turkey. Int. J. Disaster Risk Reduct. 2016, 16, 108–114. [Google Scholar] [CrossRef]
  26. Karanci, N.A.; Ikizer, G.; Doğulu, C.; Özceylan-Aubrecht, D. Perceptions of Individual and Community Resilience to Earthquakes: A Case Study from Turkey. In Framing Community Disaster Resilience: Resources, Capacities, Learning, and Action; Wiley: Hoboken, NJ, USA, 2018; pp. 237–256. [Google Scholar]
  27. Joffe, H.; Perez-Fuentes, G.; Potts, H.W.W.; Rossetto, T. How to increase earthquake and home fire preparedness: The fix-it intervention. Nat. Hazards 2016, 84, 1943–1965. [Google Scholar] [CrossRef] [Green Version]
  28. Verrucci, E.; Perez-Fuentes, G.; Rossetto, T.; Bisby, L.; Haklay, M.; Rush, D.; Rickles, P.; Fagg, G.; Joffe, H. Digital engagement methods for earthquake and fire preparedness: A review. Nat. Hazards 2016, 83, 1–22. [Google Scholar] [CrossRef] [Green Version]
  29. Altshuler, A.; Azaiza, F.; Yishai, Y. Preparedness for emergency: Learning from war-caused disaster in Israel. In Community Disaster Recovery and Resiliency: Exploring Global Opportunities and Challenges; Miller, D.S., Rivera, J.D., Eds.; Auerbach Publications: Boca Raton, FL, USA, 2011; pp. 363–395. [Google Scholar]
  30. Sharkansky, I. Local Autonomy, Non-Governmental Service Providers and Emergency Management: An Israeli Case. J. Homel. Secur. Emerg. Manag. 2007, 4. [Google Scholar] [CrossRef]
  31. Phibbs, S.; Kenney, C.; Rivera-Munoz, G.; Huggins, T.J.; Severinsen, C.; Curtis, B. The Inverse Response Law: Theory and Relevance to the Aftermath of Disasters. Int. J. Environ. Res. Public Health 2018, 15, 916. [Google Scholar] [CrossRef] [Green Version]
  32. Baer, G.; Funning, G.J.; Shamir, G.; Wright, T.J. The 1995 November 22, Mw7.2 Gulf of Elat earthquake cycle revisited. Geophys. J. Int. 2008, 175, 1040–1054. [Google Scholar] [CrossRef] [Green Version]
  33. Zohar, M.; Salamon, A.; Rubin, R. Reappraised list of historical earthquakes that affected Israel and its close surroundings. J. Seism. 2016, 20, 971–985. [Google Scholar] [CrossRef]
  34. Zohar, M.; Salamon, A.; Rubin, R. Earthquake damage history in Israel and its close surrounding—Evaluation of spatial and temporal patterns. Tectonophys. 2017, 696–697, 1–13. [Google Scholar] [CrossRef]
  35. Levi, T.; Amos, S.; Shmuel, H.; Yariv, H.; Oded, K.; Boaz, A. Earthquake damage scenarios in Israel as a basis for a national emergency exercise. In Turning Point 6; Geological Survey of Israel: Jerusalem, Israel, 2012; Report GSI/21/2012. (In Hebrew) [Google Scholar]
  36. Eqred. Israeli Government Site for Preparing for an Earthquake in Israel. 2013. Available online: http://www.eqred.gov.il/eqred (accessed on 3 August 2020). (In Hebrew)
  37. Schmidt, J.; Ginat, H.; Morris, A.; Finzi, Y.; Shalom, C.I.; Alon, P.; Ryvkin, I. Notes from a diachronic comparative study on bolstering readiness for earthquakes in schools in southern Israel. Negev Dead Sea Arava Stud. 2019, 11, 58–69, (Hebrew with English abstract). [Google Scholar]
  38. Cohen, O.; Leykin, D.; Lahad, M.; Goldberg, A.; Aharonson-Daniel, L. The conjoint community resiliency assessment measure as a baseline for profiling and predicting community resilience for emergencies. Technol. Forecast. Soc. Chang. 2013, 80, 1732–1741. [Google Scholar] [CrossRef]
  39. Finzi, Y.; Avni, S.; Maroz, A.; Avriel-Avni, N.; Ashckenazi-Polivoda, S.; Ryvkin, I. Extraordinary Geodiversity and Geoheritage Value of Erosional Craters of the Negev Craterland. Geoheritage 2018, 11, 875–896. [Google Scholar] [CrossRef]
  40. Limon, Y. Touristic Astronomy in Mitzpe Ramon, A Complementary Service or a Growth Generator? 2019. Available online: https://docs.google.com/presentation/d/13Z1scrc6yovaVI59BChjwzA-YpKaZGTYttw-ytzNNEA/edit?usp=sharing (accessed on 1 May 2021). (In Hebrew).
  41. Finzi, Y.; Ariel, M.; Shaked, A.; Sebastian, L. Developing a personal seismic-risk and readiness self-evaluation tool for activating citizens and improving communal resilience. Negev Dead Sea Arava Stud. 2019, 11, 24–34, (Hebrew with English abstract). [Google Scholar]
  42. Council for Excellence in Government (CEG). Introducing the Public Readiness Index: A Survey-Based Tool to Measure the Preparedness of Individuals, Families and Communities; CEG: Washington, DC, USA, 2006.
  43. Israel Standard IS (413). 1995.1998. “IS 413—Design Provisions for Earthquake Resistance of Structures—Including Correction Sheets 6-1” . In The Standards Institution of Israel, Tel Aviv; Available online: https://portal.sii.org.il/heb/standardization/showpdf/?dname=vaK7×6uNQro=&fx=1 (accessed on 1 January 2020).
  44. Finzi, Y.; Ganz, N.; Limon, Y.; Langer, S. The next big earthquake may inflict a multi-hazard crisis—Insights from COVID-19, extreme weather and resilience in peripheral cities of Israel. Int. J. Disaster Risk Reduct. 2021. [Google Scholar] [CrossRef]
  45. Wood, H.O.; Neumann, F. Modified Mercalli Intensity Scale of 1931. Bull. Seismol. Soc. Am. 1931, 21, 277–283. [Google Scholar] [CrossRef]
  46. Atkinson, G.M.; Kaka, S.I. Relationships between Felt Intensity and Instrumental Ground Motion in the Central United States and California. Bull. Seism. Soc. Am. 2007, 97, 497–510. [Google Scholar] [CrossRef]
  47. Cua, G.; Wald, D.J.; Allen, T.I.; García, D.; Worden, C.; Gerstenberger, M.; Kuo-Wan, L.; Marano, K. “Best Practices” for using macroseismic intensity and ground motion intensity conversion equations for Hazard and Loss Models in GEM1. In GEM Technical Report 2010-4; 2020; Available online: www.globalquakemodel.org (accessed on 1 May 2021).
  48. Dowrick, D.J.; Hancox, G.T.; Perrin, N.D.; Dellow, G.D. The Modified Mercalli intensity scale. Bull. N. Z. Soc. Earthq. Eng. 2008, 41, 193–205. [Google Scholar] [CrossRef]
  49. Grünthal, G.; Roger, W.; Jochen Schwartz, M.; Stucchi, M. European Macroseismic Scale 1998 (EMS-98). In Cahiers du Centre Européen de Géodynamique et de Séismologie 15; Grünthal, G., Musson, R.M.W., Schwarz, J., Stucchi, M., Eds.; Centre Européen de Géodynamique et de Séismologie: Walferdange, Luxembourg, 1998; p. 99. Available online: http://www.gfz-potsdam.de/EMS98 (accessed on 1 May 2021). [CrossRef]
  50. Jones, R. Investigating the Mercalli Intensity Scale Through. Sci. Scope 2012, 36, 54–61. [Google Scholar]
  51. Worden, C.B.; Gerstenberger, M.C.; Rhoades, D.; Wald, D.J. Probabilistic Relationships between Ground-Motion Parameters and Modified Mercalli Intensity in California. Bull. Seism. Soc. Am. 2012, 102, 204–221. [Google Scholar] [CrossRef]
  52. Schoch-Spana, M.; Gill, K.; Hosangadi, D.; Slemp, C.; Burhans, R.; Zeis, J.; Carbone, E.G.; Links, J. The COPEWELL Rubric: A Self-Assessment Toolkit to Strengthen Community Resilience to Disasters. Int. J. Environ. Res. Public Health 2019, 16, 2372. [Google Scholar] [CrossRef] [Green Version]
  53. IMS. Israel Meteorological Service. 2020. Available online: https://ims.gov.il/he/ (accessed on 1 July 2020).
  54. Paton, D.; Johnston, D.; Mamula-Seadon, L.; Kenney, C.M. Recovery and Development: Perspectives from New Zealand and Australia. In Disaster and Development; Springer: Cham, Germany, 2014; pp. 255–272. [Google Scholar]
  55. Paton, D. Disaster risk reduction: Psychological perspectives on preparedness. Aust. J. Psychol. 2019, 71, 327–341. [Google Scholar] [CrossRef]
Figure 1. Location map. Right—regional seismogenic sources (active fault marked as black lines). Left—southern Israel seismicity (M > 3.5) of the past century and location of Mitzpe Ramon.
Geohazards 02 00007 g001
Figure 2. Preparedness of residents in Mitzpe Ramon. The majority of surveyed households (85%) got a low to moderate preparedness score (PRE = 1–6) and only 6% of the households reported very high preparedness (PRE > 7).
Geohazards 02 00007 g002
Figure 3. Intensity (MMI) and preparedness (PRE) of neighborhoods in Mitzpe Ramon (polygons, color coded based on MMI data, average PRE stated where sufficient data exists). PRE scores were calculated separately for the two new neighborhoods (PRE = 5.2) and for the two largest old neighborhoods (PRE = 3.9).
Geohazards 02 00007 g003
Figure 4. Seasonal overburden (SOB) calculated for two neighborhoods in Mitzpe Ramon. The seasonal variations in weather and tourism in the two neighborhoods impacts emergency response efforts and should be addressed in emergency plans.
Geohazards 02 00007 g004
Table 1. Correlations between the twelve degrees of Modified Mercalli Intensity (MMI), six degrees of the proposed Damage Intensity (DI) scale and ground acceleration values [47,51]. Four major DI severity levels are proposed for our public self-evaluation tool: low (MMI = I–IV; blue), medium (MMI = V–VI; green), high (MMI = VII–VIII; yellow) and very high (MMI > IX; red).
MMIDIPGA (g)Shaking FeltEffect on PeopleEffect within HomeDamage to Buildings
I0<0.0017Not feltFelt mostly indoorsHousehold items and doors rattle slightlyNo damage
II-III0.0017–0.014Weak
IV10.014–0.039Light
V20.039–0.092ModerateFelt by most, some frightened or dizzyHousehold items rattle, books and dishes may fall, doors may slam or jar due to frame distortionUnstable buildings may be slightly damaged: cracks may form, plaster may fall, buildings may tilt
VI30.092–0.18Strong
VII40.18–0.34Very strongFelt by all, many frightened, difficulty standingHousehold items shake violently, some heavy furniture move, doors jam due to frame distortionPoorly built structures experience significant damage, some may tilt or even collapse. Damage slight in well-constructed structures
VIII50.34–0.65Severe
IX60.65–1.24ViolentPeople may fall because of violent shakingFurniture will shift and/or fallPoorly built structures may collapse, high-rises will undergo considerable damage or collapse, some well-built structures destroyed
X+>1.24Extreme
Table 2. Modified Mercalli Intensity (MMI) damage intensity calculated for six typical building types in Mitzpe Ramon and two cities in southern Israel. The colors emphasize the degree of risk: blue (low); green (medium), yellow (high) and red (very high). Modified from Finzi et al., 2019 [41]. PGA is peak ground acceleration, Ss is the spectral acceleration for short periods.
Structure Features1–2 Floors; Post 1995;
Elevator; No Pillars
One Floor; 1990–1992; No Elevator; No PillarsOne Floor; before 1980; No Elevator; No PillarsThree Floors; before 1980; No Elevator; No Pillars3–5 Floors; before 1980; No Elevator; on Pillars
Town
(Ground Type)
Mitzpe Ramon (A)
PGA = 0.06 g
Ss = 0.16 g
45678
Beer Sheva (B)
PGA = 0.06 g
Ss = 0.14 g
45678
Beer Sheva (D)
PGA = 0.09 g
Ss = 0.22 g
45689
Eilat (A)
PGA = 0.16 g
Ss = 0.4 g
56799
Eilat (D)
PGA = 0.28 g
Ss = 0.7 g
6781010
Publisher’s Note: MDPI stays neutral with regard to jurisdictional claims in published maps and institutional affiliations.

