
Effectiveness of Protected Areas in the Pan-Tropics and International Aid for Conservation


1
Office of Global Innovation, United Nations Children’s Fund, New York, NY 10017, USA
2
Independent Evaluation Office, The Global Environment Facility, Washington, DC 20433, USA
*
Author to whom correspondence should be addressed.
Geomatics 2021, 1(3), 335-346; https://0-doi-org.brum.beds.ac.uk/10.3390/geomatics1030019
Submission received: 9 March 2021
/
Revised: 16 June 2021
/
Accepted: 28 June 2021
/
Published: 4 July 2021
Abstract
:Evaluation of the effectiveness of protected areas is critical for forest conservation policies and priorities. We used 30 m resolution forest cover change data from 1990 to 2010 for ~4000 protected areas to evaluate their effectiveness. Our results show that protected areas in the tropics avoided 83,500 ± 21,200 km2 of deforestation during the 2000s. Brazil’s protected areas have the largest amount of avoided deforestation at 50,000 km2. We also show the amount of international aid received by tropical countries compared to the effectiveness of protected areas. Thirty-four tropical countries received USD 42 billion during the 1990s and USD 62 billion during the 2000s in international aid for biodiversity conservation. The effectiveness of international aid was highest in Latin America, with 4.3 m2/USD, led by Brazil, while tropical Asian countries showed the lowest average effect of international aid, reaching only 0.17 m2/USD.
1. Introduction
In 2010, the Convention on Biological Diversity (CBD) adopted a revised strategic plan for biodiversity for 2011–2020, including the Aichi Biodiversity Targets. One of the targets is to reduce the rate of loss of all natural habitats, including forests, by 2020 [1]. However, recent studies [2,3] have shown acceleration and high sustained rates of tropical deforestation since 2000. To meet the proposed goals of conservation plans, such as the Aichi Biodiversity Targets, evaluating the effectiveness of previous and current efforts to reduce tropical deforestation is essential. Within this context, assessing the effectiveness of protected areas (PAs) throughout the tropics is relevant, especially given that PAs are central to climate and biodiversity policies [4,5,6]. Previous efforts have been made to evaluate the effectiveness of PAs over various spatial and temporal scales [4,5,7,8,9]. Some studies have been conducted to evaluate the cost-effectiveness of these PAs [10,11]; these have explored the links between the value of PAs and surrounding socioeconomic drivers of tropical deforestation [12]. Others have examined the management effectiveness of PAs for limited times and spatial scales to create a framework and guidelines for the management of protected areas [13,14].
Satellite-based remotely sensed data have been used to evaluate the effectiveness of PAs in reducing deforestation because of their spatio-temporal consistency and their ability to complement ground-based observations, including filling data gaps and solving compatibility issues [4,15,16]. However, in selected locations, spatially explicit information on pan-tropical forest cover change at Landsat resolutions was not previously available beyond satellite analysis [4,17]. The lack of comprehensive long-term spatial data has precluded pan-tropical scale analysis on the effectiveness of PAs in terms of their regulating socioeconomic factors. Long-term, large-area forest cover change at 30 m resolution has recently been made available [18,19,20]. Based on this information, this study aims to (1) estimate avoided deforestation by PAs in each tropical country during the 2000s, and (2) compare the avoided deforestation against international aid for biodiversity conservation received by each tropical country.
2. Experimental Section
2.1. Study Area
2.2. Forest Change Data
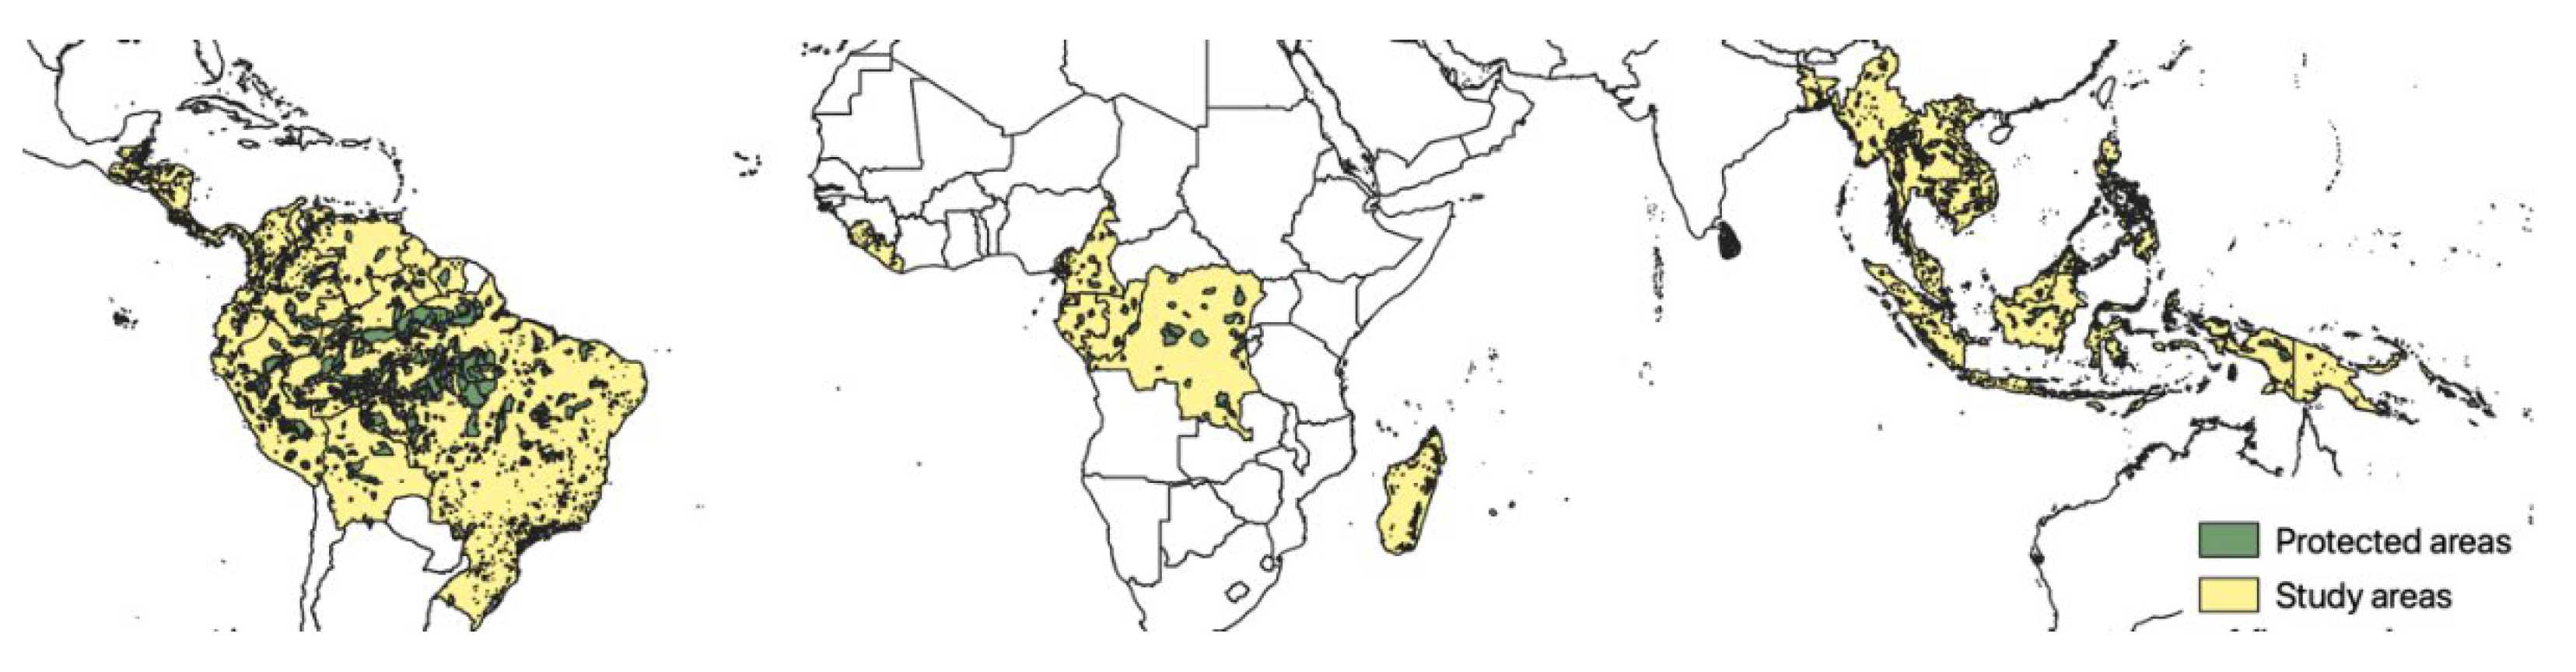
Landsat-based forest cover change data between 1990, 2000, and 2010 [3,18,19] were used to derive net forest cover change in 34 tropical countries that comprise over 80% of forest area in the tropics [3] and dominate the forest area of the humid tropics (Figure 1). These data were derived from 5444 surface reflectance images collected for 1990, 2000, and 2010 epochs from the Global Land Survey (GLS) collection of Landsat images [21,22,23,24], supplemented by many additional images [21]. Forest cover was defined as parcels > 1 ha in area and comprising pixels with >30% tree cover [25,26,27]. We also combined the International Geosphere–Biosphere Programme’s (IGBP) classes of forest (>60% tree cover) and woody savannas (>30% tree cover) for our definition.
We extracted the forest cover change maps for each of the 3888 designated PAs and their surrounding areas in 34 tropical countries [28] from the Landsat-based forest cover change data. We used global forest cover and change data developed by Kim et al. [3,18,19,29]. Kim et al. used the Global Land Survey collection [23] of Landsat data and decision tree-based methods to map the extent of forests in 1990, 2000, and 2010. The original GLS data were augmented with additional images to improve radiometric calibration, reduce cloud cover, and maximize spectral discrimination of forests [30]. Each image of this augmented GLS data set was atmospherically corrected to estimate surface reflectance using the LEDAPS (Landsat Ecosystem Disturbance Adaptive Processing System) [24]. Validation of the forest cover and change maps was performed globally and by eco-regions using high-resolution satellite imagery-based validation samples. The accuracy of the forest map for 1990 was 93% in relation to the reference forest cover map, and it was 84% for the forest cover change map between 1990 and 2000.
We analyzed all designated PAs in the selected tropical countries instead of using any sampling, and we did so to take full advantage of the spatially explicit, fine resolution data. Despite their conceptual importance, the effects of protected areas downgrading, downsizing, and degazetting (PADDD) [31,32] were not considered in this study, since there were only a small number of relevant PADDDs identified from the available PADDD data [33]. We derived the annual gross forest loss, gross forest gain, and net forest change rates within each PA and its surrounding area from the forest change maps. We then calculated the forest loss rate by dividing the area of forest loss by area of forest within PAs or surrounding areas. Each GLS epoch spans a range of years focused on the nominal year [23], so the forest/nonforest layer for each year was accompanied by the year of image acquisition to estimate changes over time as rates.
2.3. International Aid Data for Biodiversity Conservation
Global aid data for the period 1990–2010 were obtained from the AidData Version 3 database [34]. The database contains records of development projects from more than 90 bilateral and multilateral donors and constitutes a detailed source of project-level information on international aid [34]. We used the nominal value of currency (in USD) to account for changes in currency value over time. The project data extracted from AidData include data from all the sectors [35]. We excluded the sectors less relevant for biodiversity and natural resource management, such as reproductive health care and secondary education. Averages for the 1990s and the 2000s were calculated from each data set and the differences are used as independent variables for regression analysis.
2.4. Estimation of Avoided Deforestation by PAs
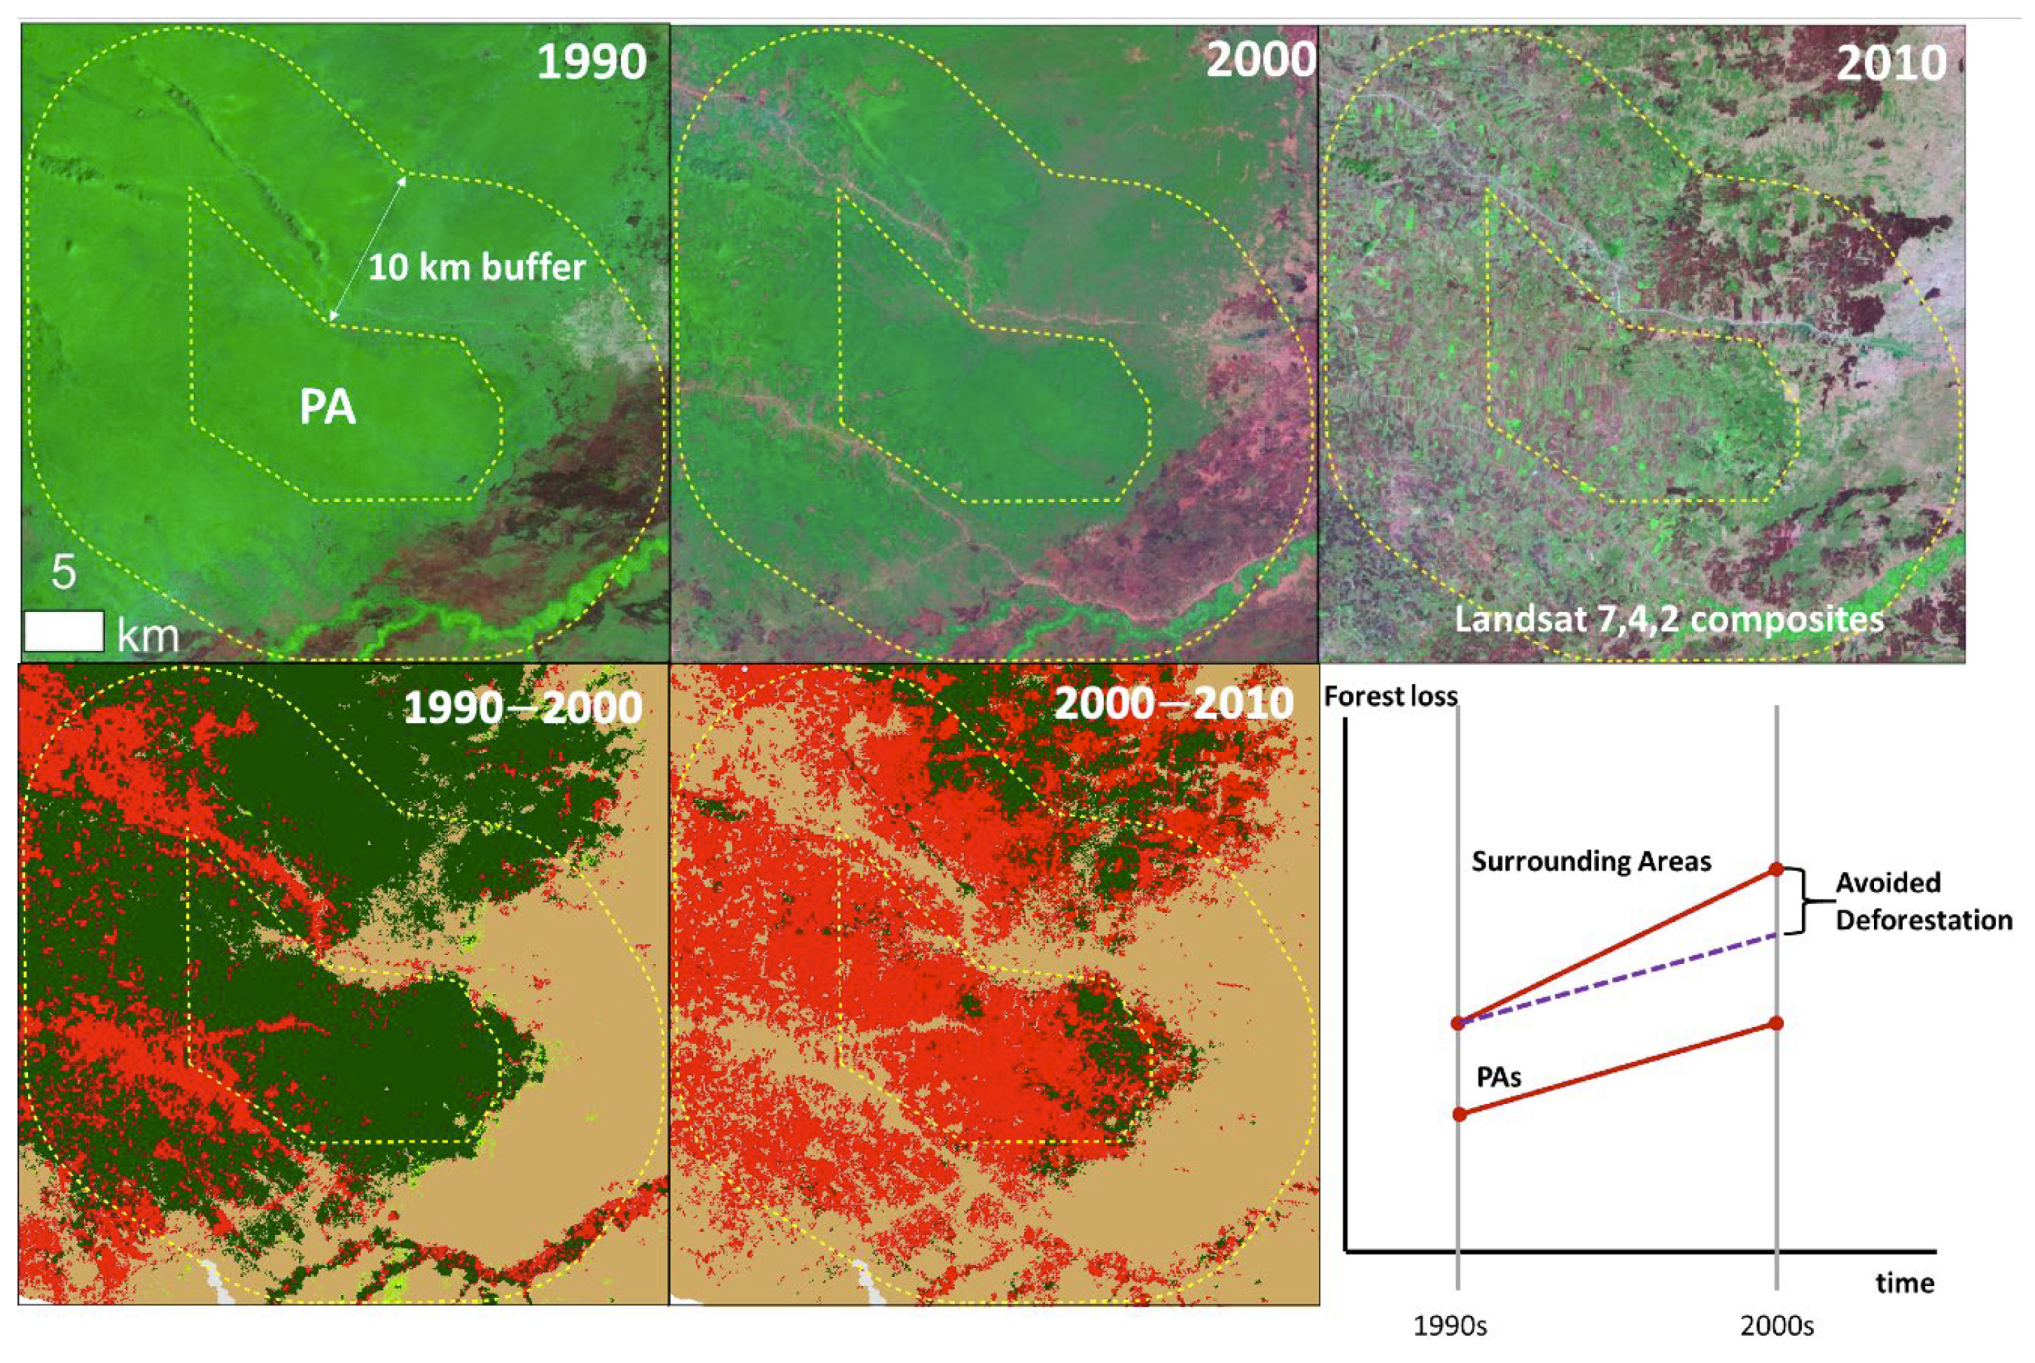
Measuring the amount of avoided deforestation by PAs is complex because it cannot be measured directly [7]. Broadly, two different approaches have been in use to estimate avoided deforestation. The first set of approaches compares differences in forest change rate between inside and outside PAs [4,5,15]. However, approaches these have been criticized for their inability to account for the spillover effect from PAs to the adjacent areas outside of Pas, as well as for selection bias due to un-randomized selection of PAs and inherently different deforestation probability between the inside and outside of PAs [36]. Second, there are statistical matching approaches that can be used to match the difference in deforestation probability between samples inside and outside PAs [7,37]. The statistical matching of samples is robust but challenging to implement due to high computational costs and difficulties in finding statistically significant matches, especially when a PA network covers large continuous tracts of land [11]. Moreover, some important factors, such as policies (e.g., concession) which contribute to deforestation probability, can be overlooked in this approach. To avoid selection bias and computational difficulties associated with previously mentioned methods, we used the Difference-In-Differences (DID) estimator to measure avoided deforestation in the 2000s compared to the 1990s for PAs in each tropical country [38,39] (Figure 2).
This method has a relatively strong inferential ability as it eliminates selection biases by attempting to mimic an experimental research design using observational data [38,40]. The impact of a treatment on outcome Yi, which is the annual forest change rate in this study, was modeled by the following equation:
where T is the treatment status; t is the time period before and after the treatment; the coefficients given by the Greek letters α, β, γ, δ are all unknown parameters; and εi is a random, unobserved “error” term. In the DID estimator, the effect of treatment (avoided deforestation), , is defined as the difference in average outcome in the treatment group T before and after treatment minus the difference in average outcome in the control group C before and after treatment, and it is expressed as:
where the treatment group is PAs and the control group is the surrounding areas before and after the year 2000 (Figure 2). We applied this method to (a) the 3888 PAs and surrounding areas designated before 2010 to determine the accumulated effect during the 2000s, and (b) to the subset of 1253 PAs established between 2000–2010 to estimate the effect of newly established PAs.
2.5. Estimation of Spillover Effect
The spillover effect refers to the displacement of forest loss from one place to a neighboring area due to the establishment of a PA. If PAs displaced deforestation to their immediate surroundings through the spillover effect, deforestation rate increases within those areas would be higher than in other regions with similar characteristics (e.g., accessibility) [16,41]. Based on these assumptions, we measured the potential spillover or leakage effect by comparing forest loss between the 1990s and the 2000s, and avoided deforestation estimates using surrounding areas at different buffer distances (500 m, 1 km, 5 km, 10 km, 15 km, 20 km, and 25 km).
2.6. Statistical Analysis
To ensure the robustness of the DID method, we tested (1) ordinary least squares (OLS) regression analysis between treatment, time period, and estimated avoided deforestation, as expressed in Equation (1); and (2) a paired t-test between the difference in forest loss rates in PAs and the difference in forest loss rates in the surrounding areas to determine the significance of the effect of PAs before and after 2000. Effects of PAs are graphically presented with changes in frequency distributions.
3. Results and Discussion
3.1. Avoided Deforestation by Protected Areas
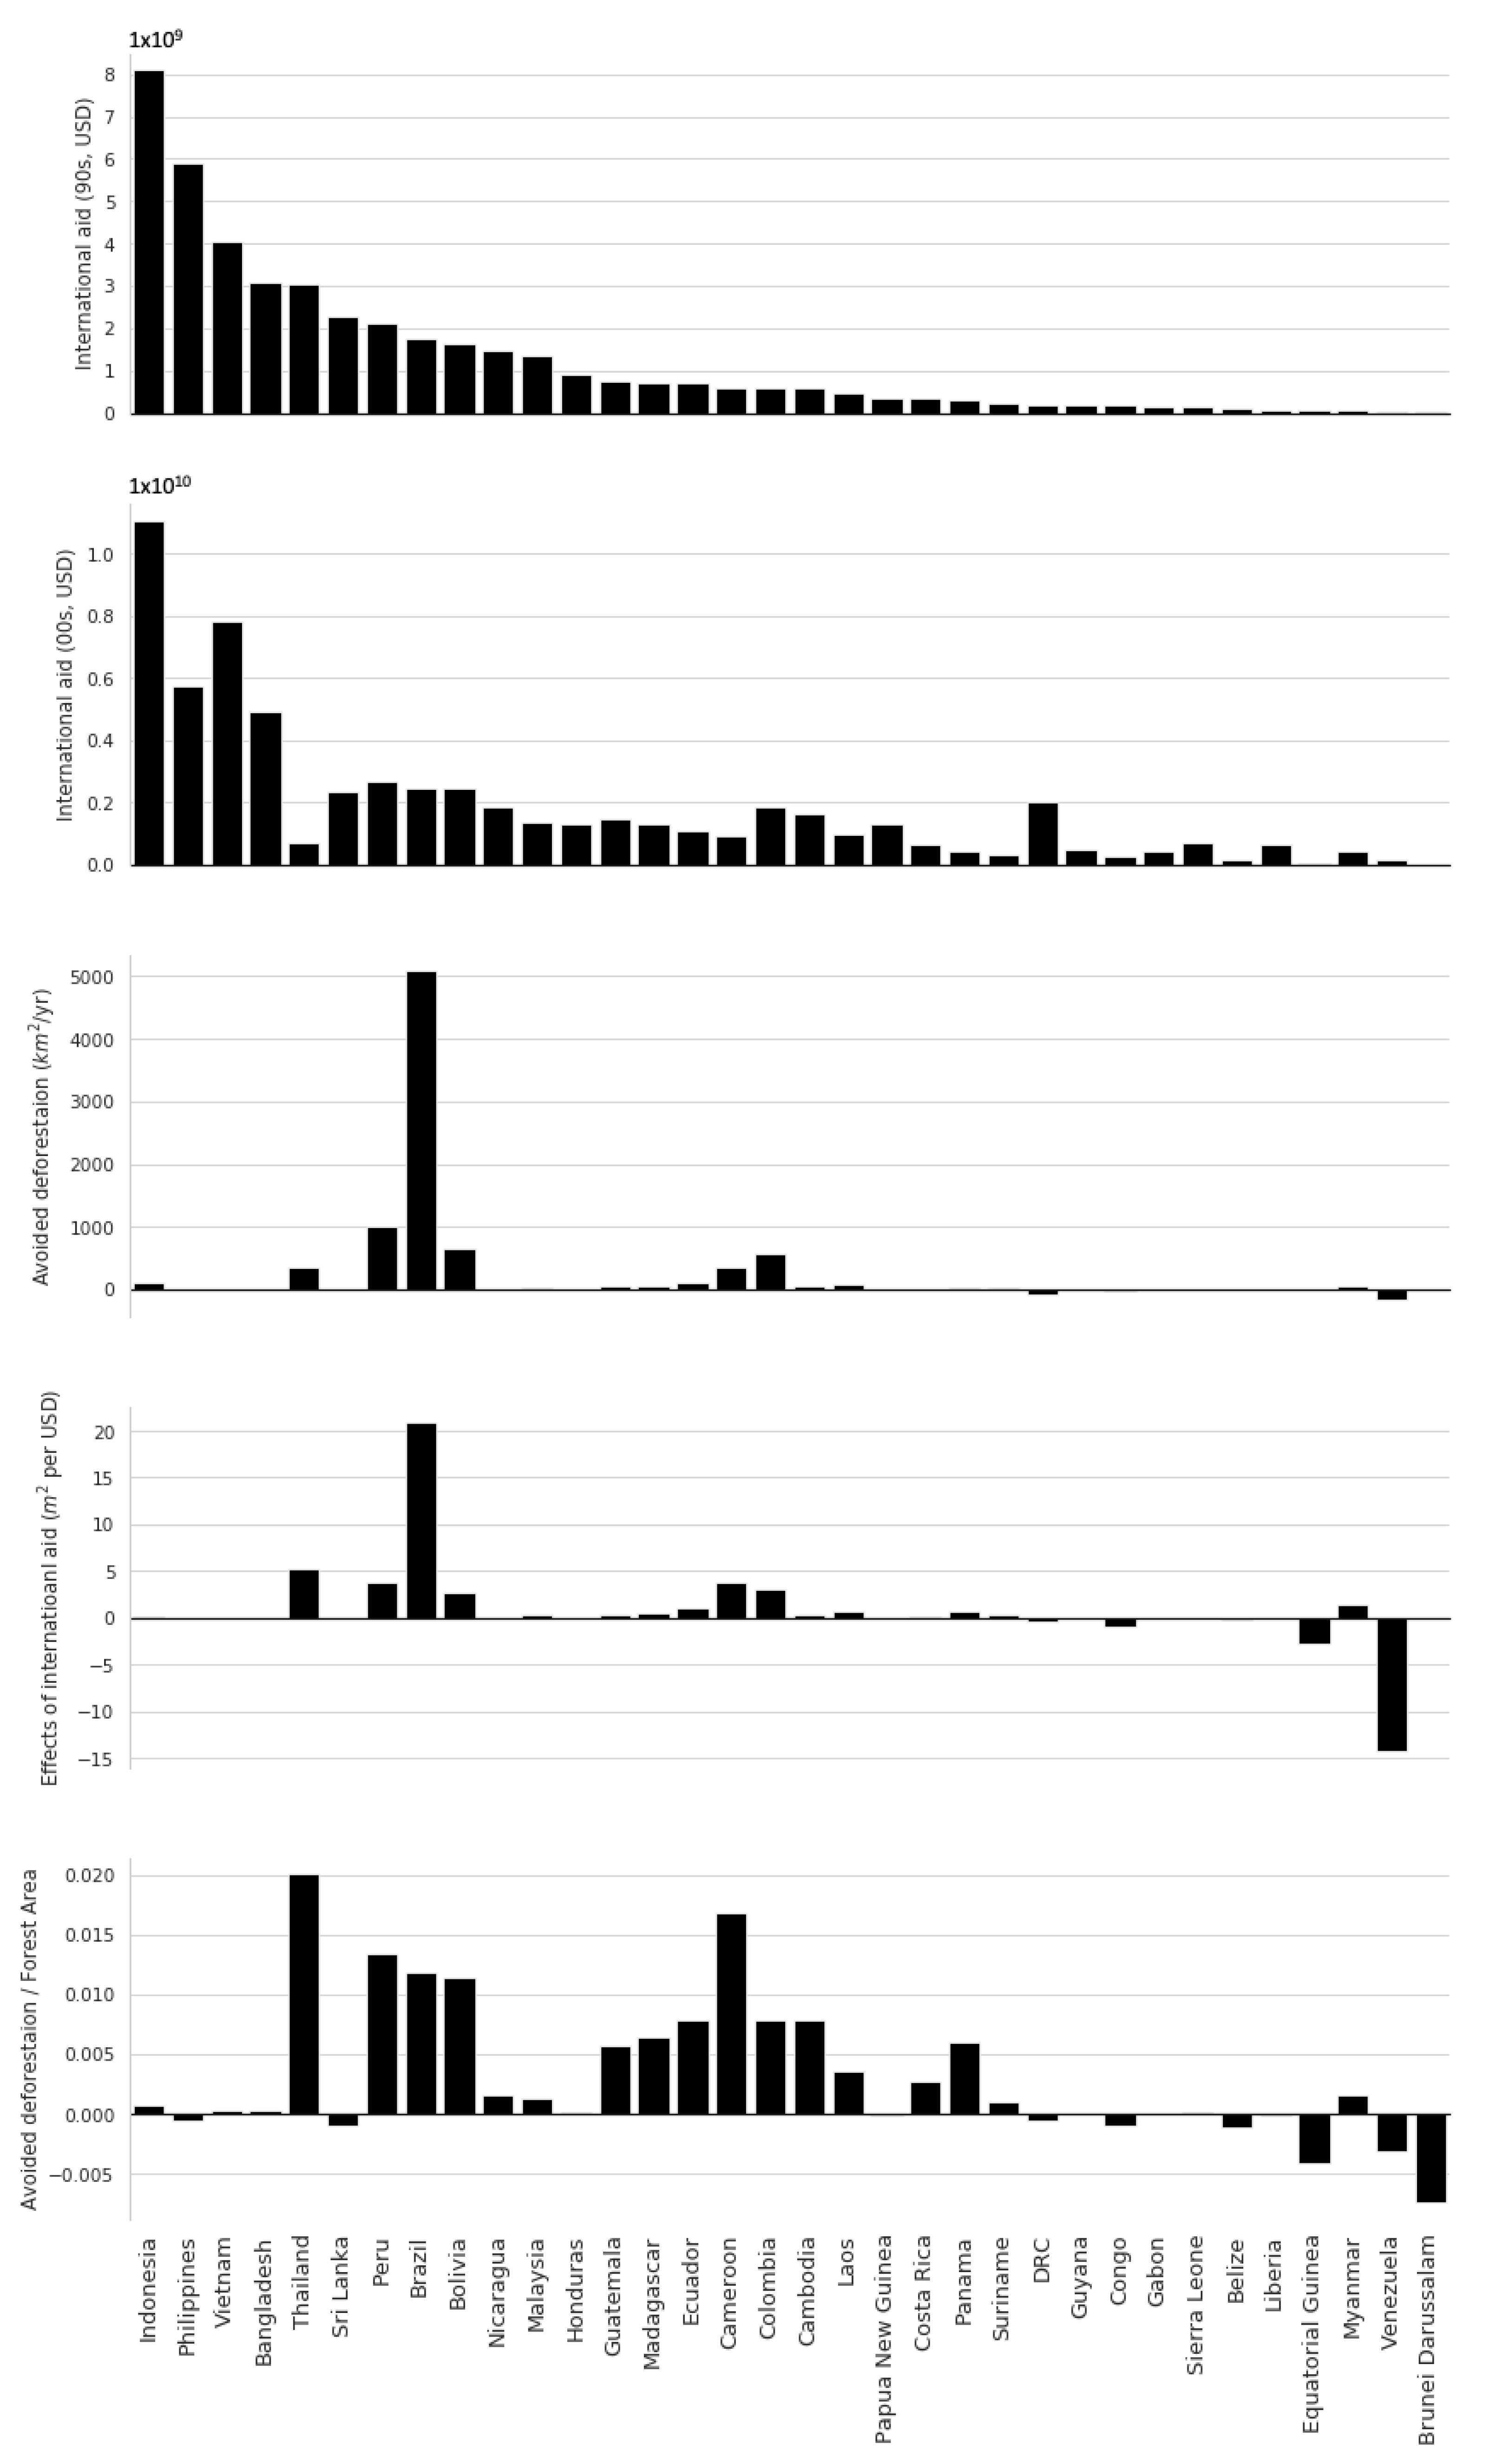
Our results demonstrate an overall 83,500 ± 21,200 km2 of avoided deforestation by the PAs during the 2000s throughout the tropics, which equals 3.5% of all forest area within PAs in the study area (Figure 1, Table A1). Figure 3 shows avoided deforestation by each country along with international aid received by them.
Latin America showed the largest estimates of avoided deforestation during the 2000s (73,900 km2). In Latin America, Brazil showed the largest avoided deforestation (50,870 km2), followed by Peru (9970 km2) and Bolivia (6611 km2) for the same time- period. Venezuela was found to have the largest negative effect (−1622 km2) among Latin American countries. The negative effect means forest loss rates within PAs exceeded the forest loss rates in surrounding areas. Relatively high rates of avoided deforestation from PAs in Brazil emphasize Brazil’s important role in tropical forest conservation. Positive avoided deforestation effects of PAs in Brazil were also reported by previous studies [11,12]. Tropical Asia showed the second largest estimates of avoided deforestation of 6744 km2, with the largest amount in Thailand, followed by Indonesia. Tropical Africa has the lowest estimates, except Cameroon, which showed the largest estimate of 3411 km2. In terms of the percentage of avoided deforestation against the entire forest area in PAs, Africa showed the lowest estimates of 1.8%, while Latin America and Asia showed similar estimates of 3.8%. The comparison between estimates for the entire set of PAs and the PAs established after 2000 showed that PAs established post-2000 had a higher rate of avoided deforestation at 0.5% annually compared to 0.4% for the entire set of PAs. The area of avoided deforestation in PAs established during the 2000s was about 60% of estimated avoided deforestation in all PAs in the study area. In comparison, the area of avoided deforestation in PAs established during the 1990s was about 27%. Prior to 1990, estimated avoided deforestation was about 13% in all PAs in the study area.
On average, PAs in the tropics established after 2000 showed a greater avoided deforestation than PAs established before 2000. Nevertheless, old established PAs were still effective, although not as effective as recently established ones [39]. Estimates of avoided deforestation based on the median value of forest loss exhibited similar results. Changes in mean and median forest loss within PAs and the surrounding areas before and after 2000 demonstrate the positive effects of PAs on reducing deforestation (Table 1).
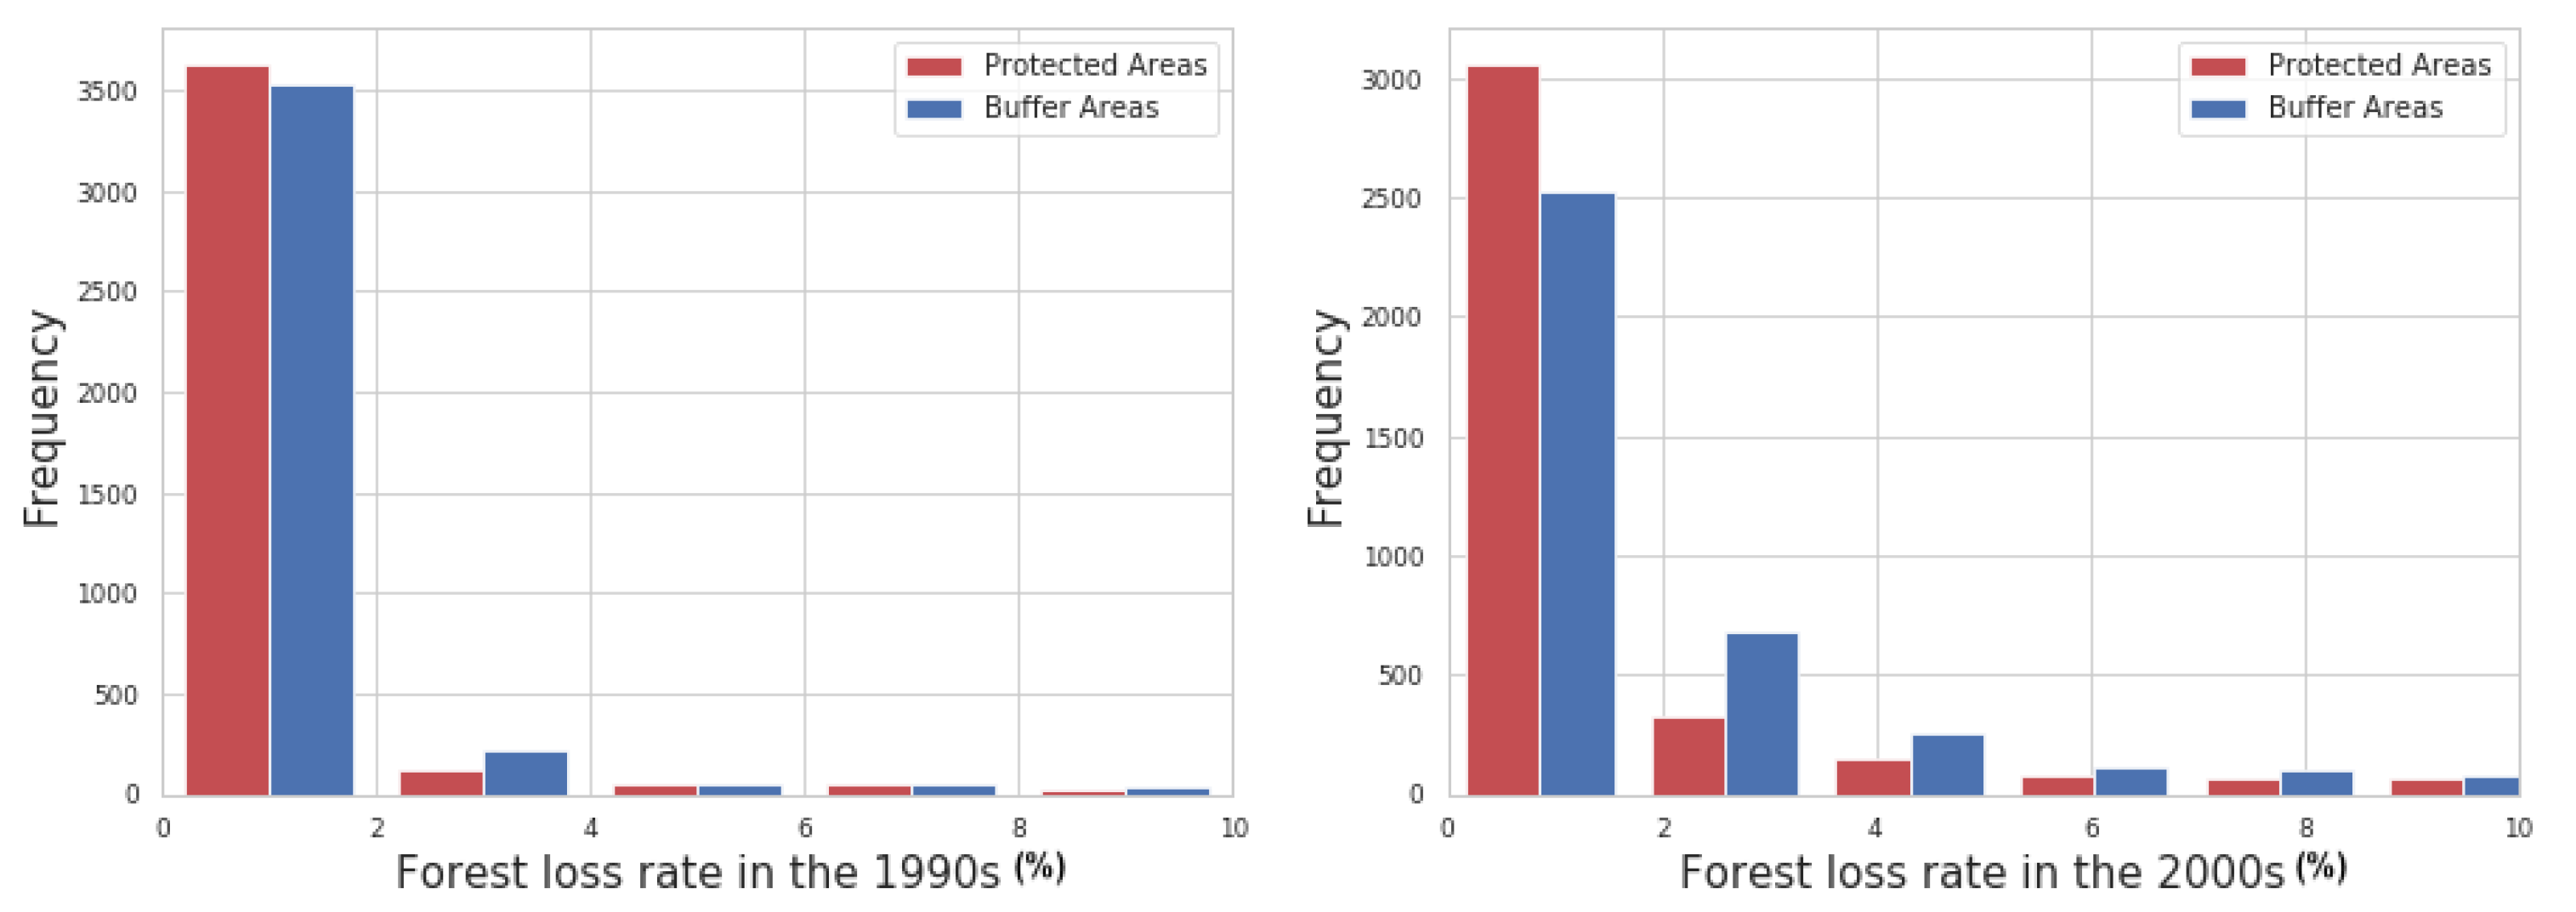
The lower deforestation rates in recent PAs and the higher rates in the recent surrounding areas after 2000 show that the greater avoided deforestation of recent PAs is not because of their remoteness (Table 1). Congo, Belize, the Philippines, and Sri Lanka showed positive avoided deforestation from PAs established since 2000, while estimates including all PAs established before 2000 showed negative effects in these countries, suggesting the old established PAs in those countries are experiencing higher rates of deforestation. The following analysis supports our estimates of avoided deforestation. First, the ordinary least squares (OLS) regression analysis of the PA effect evaluation model (Equation (1)) shows a strong association (p < 0.001) between forest loss rate change and protected area designation (Table A2). Second, a paired t-test between the forest loss rate changes in PAs and the surrounding areas confirms the hypothesis that the two groups show a significant difference before and after the designation of PAs (t = 6.6). Third, Figure 4 suggests that, at t1 (pre-2000), the forest loss rate was high inside PA areas and, at t2 (post-2000), the loss was lower, confirming the positive effects of PAs in reducing deforestation in the tropics.
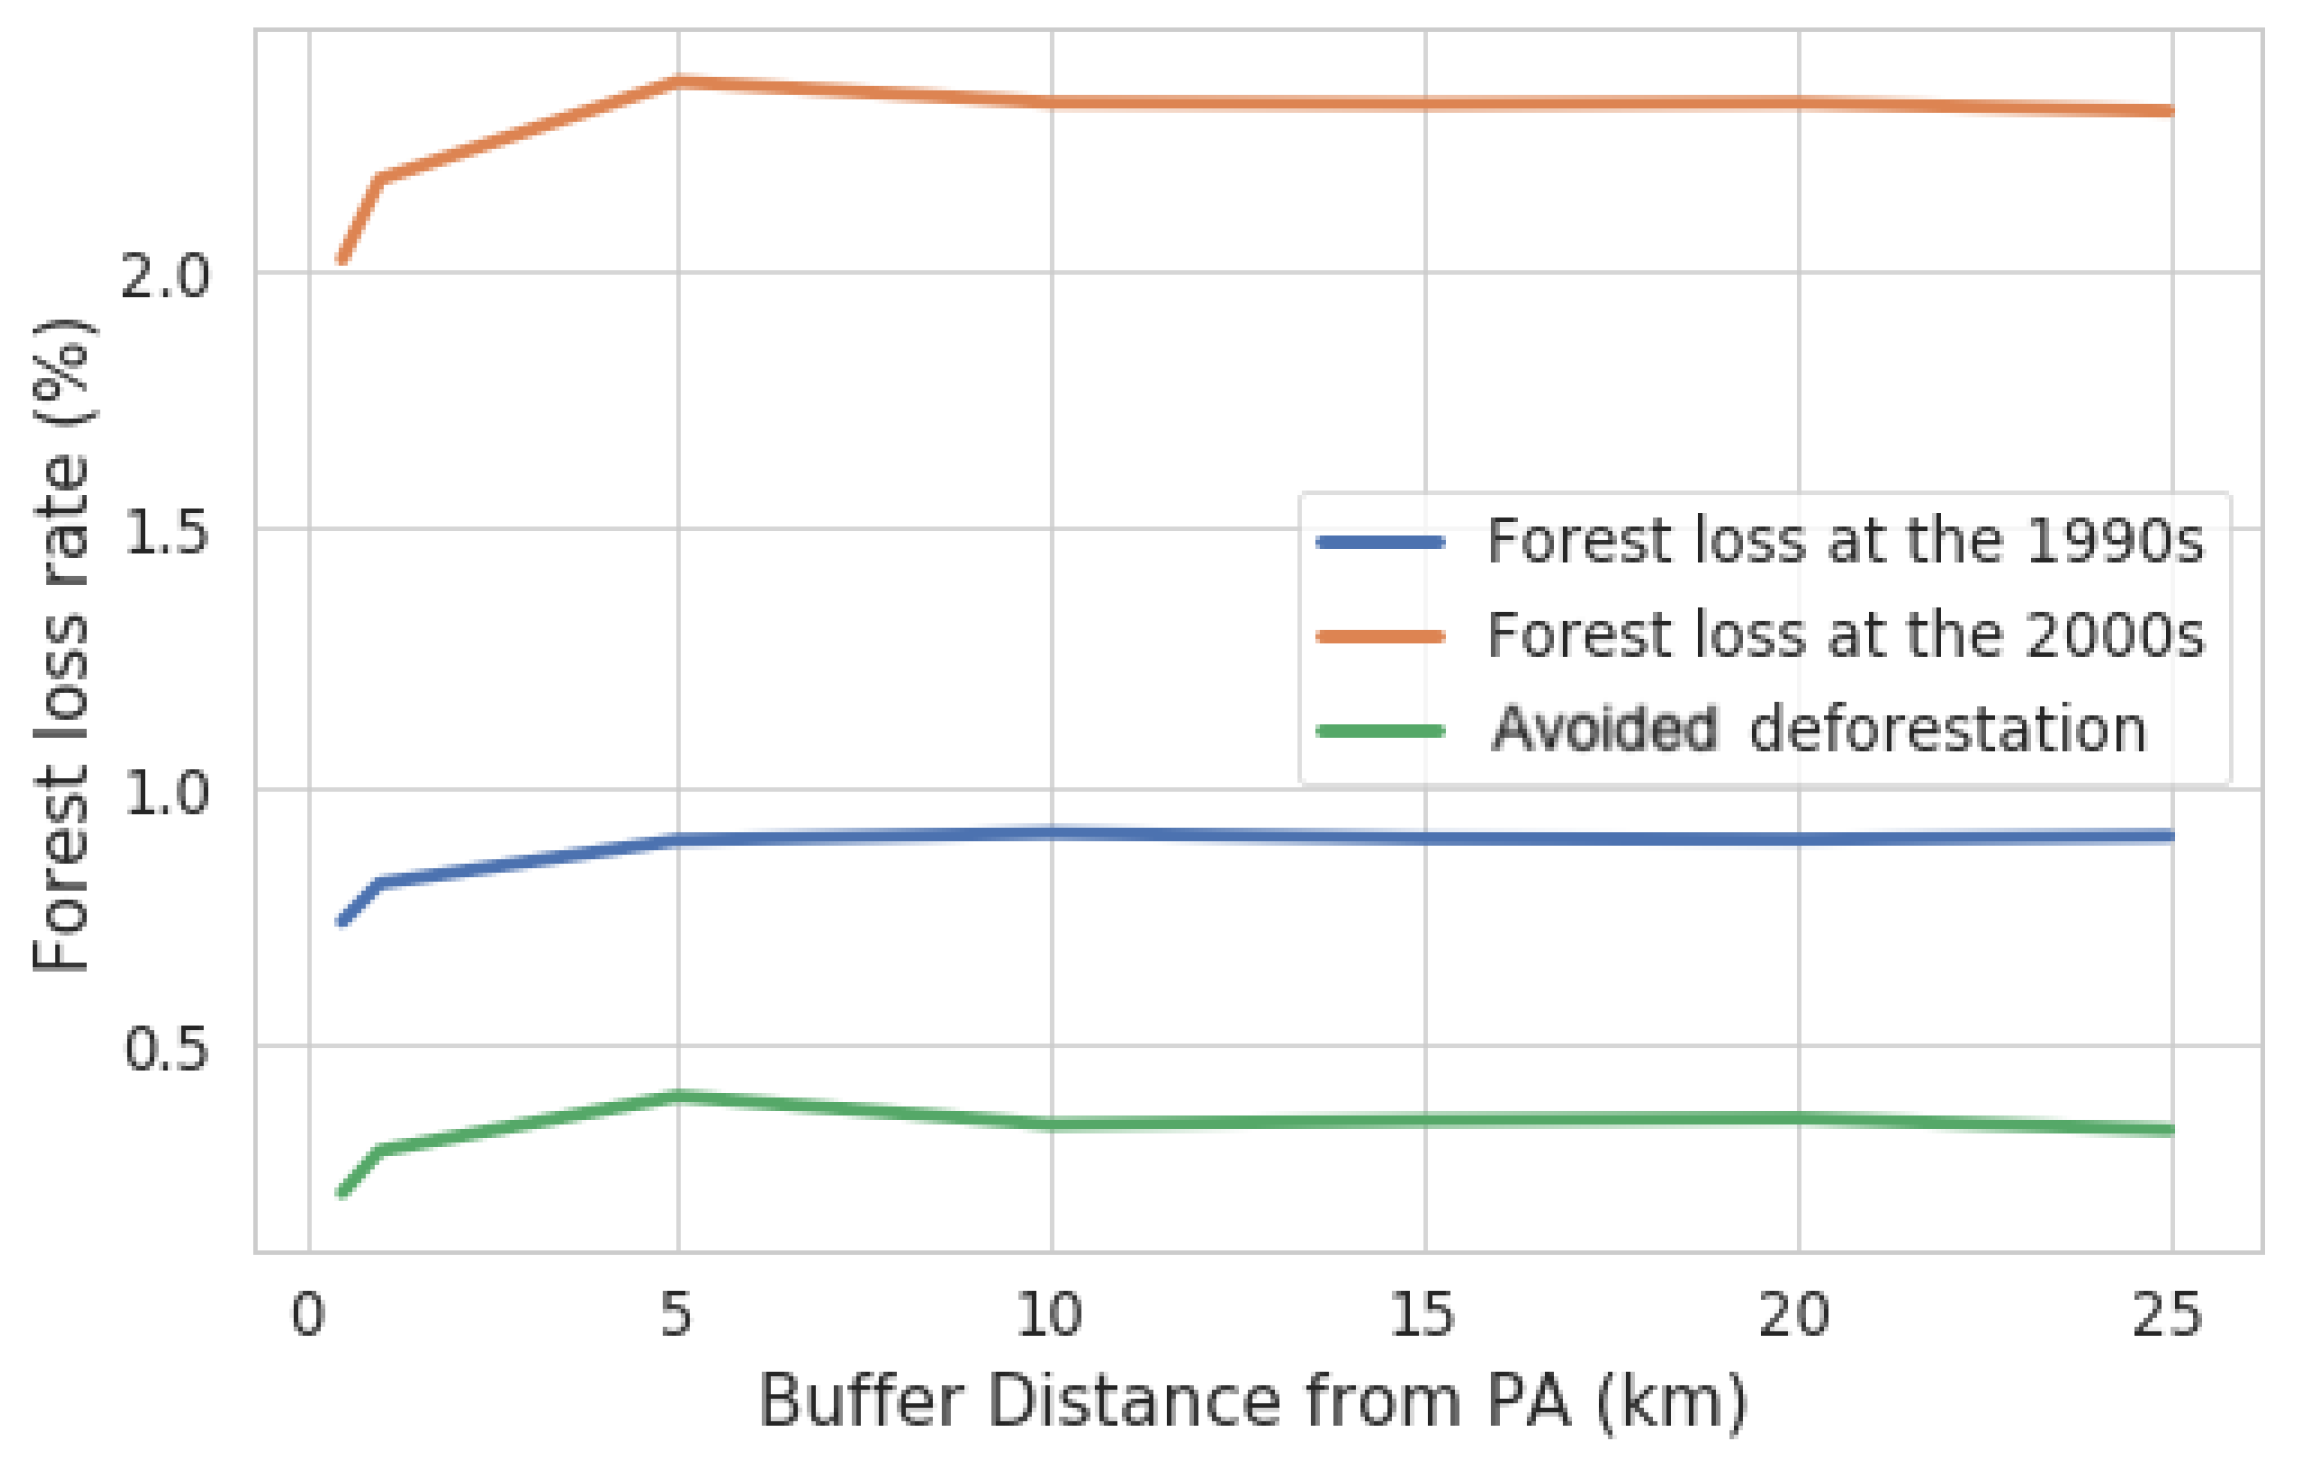
Finally, our results show that PAs in Brazil established since 2000 avoided deforestation of 2794 km2 annually, which is corroborated by an annual 2500 km2 of avoided deforestation between 2004 and 2006 reported by Soares-Filho et al. [11]. Figure 5 shows the mean forest loss rates of surrounding areas with various distances from 500 m to 25 km from PAs in the 1990s (a) and in the 2000s (b).
Figure 5 demonstrates that the increase in forest loss between two decades was the largest within a 10 km distance. This suggests that the spill-over effects were largest in the areas immediately adjacent to PAs, and the areas further than 10 km from PAs had marginal spill-over effects. Spill-over effect refers to the displacement of forest loss from PAs to surrounding areas due to the establishment of PAs. Relatively lower forest loss rates within surrounding areas with less than a 10 km buffer distance are because of a given PA’s relative inaccessibility, isolation [4], or even better protection due to buffer zone conservation initiatives [42]. We used estimates of avoided deforestation with a 10 km buffer distance for the regression analysis, where spill-over effects start to be marginal.
3.2. International Aid for Conservation
Thirty-four tropical countries received total international aid for biodiversity conservation of USD 42 billion during the 1990s and USD 62 billion during the 2000s, with a net increase of 46% (USD 20 billion) between the two periods (Figure 3). Among continents, tropical Asian countries were the largest recipients, receiving 62% of all funds during the 2000s, followed by Latin American countries (28%). Among the countries, Indonesia received the largest amount of aid—18% of all funds received by 34 tropical countries—followed by Vietnam (1%) and the Philippines (9%) for the same period [43].
To compare the avoided deforestation against international aid for biodiversity conservation received by each tropical country, we determined the relative contribution of the international aid—“effectiveness of international aid”—by dividing the estimated avoided deforestation area with the amount of international aid for biodiversity conservation received by each country. The rationale for this assumption is that (1) the primary goal of international aid for biodiversity conservation is to enhance biodiversity conservation, regardless of the political and economic circumstances, and (2) conservation of biodiversity in the tropics has a negative association with tropical deforestation [6,34,44]. However, did not analyze causal relationships between avoided deforestation and the amount of international aid received.
The effectiveness of international aid was highest in Latin America, with 4.3 m2/USD, led by Brazil, while tropical Asian countries showed the lowest average effect of international aid, reaching only 0.17 m2/USD. Among the countries examined, Brazil showed the absolute highest cost-effect of 21 m2/USD. The blue line in Figure 1 indicates that only 9 out of 34 countries were found to have higher effects of international aid than the average. Country-based estimates of avoided deforestation by PAs and effects of international aid showed a varied pattern throughout the tropics. Notably, the two largest sources of tropical deforestation during the 2000s, Brazil (2.2 Mha∙yr −1) and Indonesia (0.8 Mha∙yr −1), showed a sharp contrast [3]. Brazil showed higher estimates of avoided deforestation compared to Indonesia by a factor of 50, although Indonesia has received about 500% more international aid (USD 11 billion) compared to Brazil (USD 2.4 billion), resulting in lower estimates of the effects of international aid (0.5 m2/USD) compared to Brazil (22 m2/USD) by a factor of 44.
Our approach using a DID estimator with fine resolution and spatially explicit forest change data offered an alternative way to handle commonly criticized selection bias and spillover problems [7,36]. Despite the methodological advances made in this study, it has some limitations. First, our forest cover change estimates do not distinguish between primary and managed forests, leaving a potential for confusion between loss of natural forest and managed harvest. Second, the coarse spatial scale of socioeconomic data limited the regression analysis to the country scale, which prevented the regression analysis between individual PAs and their geophysical factors. Third, Brazil’s success in reducing deforestation is an exceptional case made possible under a special political landscape [12,45], which is difficult to generalize to other tropical countries. Finally, for the estimates of the effect of international aid on avoided deforestation by PAs, we only considered the contribution of international monetary aid, while the amount of international aid may not be the only factor determining a given PA’s effectiveness. Other domestic sources of funds (e.g., Amazon Region Protected Areas Program of Brazil) and different aspects of conservation (e.g., biodiversity) or political environment, which vary by country and over time, were not accounted for in this study. Additionally, the processes of international aid delivery were not considered in this study. For example, Norwegian funds are committed to Indonesia under the condition that they meet specific conservation goals. Further analysis is needed to estimate the effect of differences in the distribution of funds.
4. Conclusions
Our results showed an overall positive effect of pan-tropical PAs on reducing deforestation during the 2000s. The overall positive effect of PAs in reducing deforestation throughout the tropics corroborates with the findings of previous studies [7,37,39,46,47]. However, unlike many previous studies, our results provide a consistent, long-term estimate throughout the pan-tropics. The estimated avoided deforestation and effects of international aid by countries pinpoint where conservation activity and resources distribution are effectively practiced. These findings underscore the challenges that policy instruments face, and also provide a launchpad for alternative strategies for future conservation policies and initiatives. However, the study does not link its findings to political–economic contexts. Not covering these aspects remains a limitation of this study. Nevertheless, with a robust empirical approach and future data availability on socioeconomic drivers, the protection of critical ecosystem services in a coupled human–natural system can be better understood.
Author Contributions
D.-H.K. and A.A. equally contributed to the manuscript. Both authors have read and agreed to the published version of the manuscript.
Funding
Funding support for this study was provided by the following NASA programs: Making Earth System Data Records for Use in Research Environments (NNH06ZDA001N-MEASURES), Land Cover and Land Use Change (NNH07ZDA001N-LCLUC), and Earth System Science Research Using Data and Products from Terra, Aqua, and Acrimsat Satellites (NNH06ZDA001N-EOS).
Institutional Review Board Statement
Not applicable.
Informed Consent Statement
Not applicable.
Acknowledgments
Rachel Headley (USGS) sent the GLS datasets to the GLCF. Min-Kyung Shin assisted in the collection and processing of socioeconomic data. The opinions expressed in this article may not reflect the views of UNICEF and the Global Environment Facility.
Conflicts of Interest
The authors declare no conflict of interest.
Appendix A

Table A1.
Summary of the avoided deforestation estimates by countries and continents. Acceleration of deforestation is indicated by percent increase in net deforestation rate from the 1990s to the 2000s (3). Avoided deforestation is presented in percent of conserved forest relative to remaining forest in PAs and total area of conserved forest. All estimates are on an annual basis. Negative effect means forest loss rates within PAs exceeded the forest loss rates in surrounding areas.
| Country | Acceleration of Deforestation (%) | Avoided Deforestation (%) | Avoided Deforestation (km2) | Area of PAs (km2) | Forest area in PAs (%) | No. of PAs |
|---|---|---|---|---|---|---|
| Cameroon | 20.6 | 1.39 | 341.1 | 46,414 | 53 | 35 |
| Congo | 0.0 | −0.23 | −24.2 | 22,624 | 46 | 13 |
| Democratic Republic Congo | 31.2 | −0.09 | −77.4 | 219,677 | 41 | 31 |
| Equatorial Guinea | −2.0 | −0.32 | −10.7 | 3602 | 93 | 6 |
| Gabon | −11.5 | 0.01 | 1.5 | 16,677 | 97 | 8 |
| Liberia | −8.2 | −0.17 | −1.5 | 1687 | 53 | 2 |
| Madagascar | 15.6 | 0.69 | 57.5 | 15,322 | 55 | 42 |
| Sierra Leone | 8.9 | 0.03 | 0.3 | 2955 | 38 | 31 |
| Africa Total | 6.8 | 0.18 | 286.5 | 328,957 | 47 | 168 |
| Bangladesh | 16.3 | 0.17 | 0.5 | 490 | 56 | 19 |
| Brunei Darussalam | 0.0 | −0.90 | −3.8 | 448 | 94 | 18 |
| Cambodia | 27.8 | 0.49 | 61.7 | 24,779 | 51 | 24 |
| Indonesia | 2.9 | 0.22 | 100.8 | 95,981 | 49 | 152 |
| Laos | 5.1 | 0.49 | 67.6 | 17,095 | 80 | 12 |
| Malaysia | 2.5 | 0.21 | 38.4 | 19,330 | 96 | 122 |
| Myanmar | 11.5 | 0.88 | 64.5 | 15,201 | 48 | 29 |
| Papua New Guinea | 1.1 | −0.19 | −5.1 | 3849 | 69 | 27 |
| Philippines | 12.0 | −0.05 | −9.0 | 26,890 | 64 | 165 |
| Sri Lanka | 19.5 | −0.05 | −3.0 | 11,860 | 46 | 210 |
| Thailand | 15.9 | 0.76 | 357.1 | 61,541 | 76 | 117 |
| Vietnam | 18.5 | 0.06 | 4.7 | 18,295 | 43 | 65 |
| Asia Total | 11.1 | 0.38 | 674.4 | 295,758 | 61 | 960 |
| Belize | −1.1 | −0.06 | −2.2 | 4353 | 86 | 63 |
| Bolivia | 5.6 | 0.92 | 661.1 | 98,585 | 73 | 42 |
| Brazil | 3.3 | 0.34 | 5087.0 | 1,852,181 | 82 | 1321 |
| Colombia | 18.0 | 0.89 | 582.9 | 169,960 | 38 | 593 |
| Costa Rica | 12.0 | 0.23 | 10.8 | 5424 | 86 | 79 |
| Ecuador | 2.2 | 0.76 | 119.8 | 22,467 | 70 | 20 |
| Guatemala | 2.6 | 0.27 | 42.7 | 18,053 | 86 | 225 |
| Guyana | −6.2 | 0.01 | 0.6 | 10,426 | 41 | 3 |
| Honduras | 8.3 | 0.02 | 1.6 | 11,733 | 56 | 62 |
| Nicaragua | 26.5 | 0.68 | 9.4 | 4597 | 30 | 61 |
| Panama | 18.8 | 0.76 | 27.3 | 4610 | 78 | 13 |
| Peru | 4.5 | 0.51 | 997.0 | 308,599 | 64 | 185 |
| Suriname | 4.4 | 0.05 | 14.2 | 29,041 | 99 | 7 |
| Venezuela | 26.7 | −0.39 | −162.2 | 80,919 | 51 | 85 |
| Latin America Total | 9.0 | 0.38 | 7389.8 | 2,620,949 | 75 | 2759 |
| Grand Total | 6.2 | 0.35 | 8350.6 | 3,245,663 | 71 | 3887 |
Appendix B
Table A2.
Statistics of Difference-in-Differences analysis to calculate avoided deforestation by country and individuals. PA.
Table A2.
Statistics of Difference-in-Differences analysis to calculate avoided deforestation by country and individuals. PA.
| By country | ||||
|---|---|---|---|---|
| Independent variables | Estimate | Std. Error | t Value | Pr (>|t|) |
| (Intercept) | −0.39885 | 0.06 | −6.020 | 1.62 × 10⁻⁸ *** |
| Period | −0.39489 | 0.09370 | −4.215 | 4.61 × 10⁻⁵ *** |
| Treatment | 0.23511 | 0.09370 | 2.50 | 0.0133 * |
| Treatment∙Period | 0.2719 | 0.13250 | 2.052 | 0.0421 * |
| * p < 0.01, *** p < 0.0001, independent variables are log transformed | ||||
| Residual standard error: 0.3863 on 132 degrees of freedom, Multiple R-squared: 0.2781, Adjusted R-squared: 0.2617 F-statistic: 16.95 on 3 and 132 DF, p-value: 2.257 × 10⁻⁹ | ||||
| By individual PA | ||||
| Independent variables | Estimate | Std. Error | t Value | Pr (>|t|) |
| (Intercept) | −0.9100 | 0.04603 | −19.772 | <2 × 10⁻¹⁶ *** |
| Period | −1.41258 | 0.04603 | −21.702 | <2 × 10⁻¹⁶ *** |
| Treatment | 0.32492 | 0.06509 | 4.992 | 6.06 × 10⁻⁷ *** |
| Treatment∙Period | 0.34607 | 0.09205 | 3.759 | 0.000171 *** |
| *** p < 0.0001, independent variables are log transformed | ||||
| Residual standard error: 2.659 on 13,348 degrees of freedom, Multiple R-squared: 0.0603, Adjusted R-squared: 0.06009 F-statistic: 285.5 on 3 and 13348 DF, p-value: < 2.2 × 10⁻¹⁶ | ||||
References
- CBD COP10. Strategic Plan for Biodiversity, 2011–2020. In Proceedings of the Conference of the Parties to the Convention on Biological Diversity, Nagoya, Japan, 22 December 2010. [Google Scholar]
- Hansen, M.C.; Potapov, P.V.; Moore, R.; Hancher, M.; Turubanova, S.A.; Tyukavina, A.; Thau, D.; Stehman, S.V.; Goetz, S.J.; Loveland, T.R. High-resolution global maps of 21st-century forest cover change. Science 2013, 342, 850–853. [Google Scholar] [CrossRef] [Green Version]
- Kim, D.-H.; Sexton, J.O.; Townshend, J.R. Accelerated deforestation in the humid tropics from the 1990s to the 2000s. Geophys. Res. Lett. 2015, 42, 3495–3501. [Google Scholar] [CrossRef] [PubMed]
- DeFries, R.; Hansen, A.; Newton, A.C.; Hansen, M.C. Increasing isolation of protected areas in tropical forests over the past twenty years. Ecol. Appl. 2005, 15, 19–26. [Google Scholar] [CrossRef] [Green Version]
- Joppa, L.N.; Loarie, S.R.; Pimm, S.L. On the protection of “protected areas”. Proc. Natl. Acad. Sci. USA 2008, 105, 6673–6678. [Google Scholar] [CrossRef] [Green Version]
- Pimm, S.L.; Ayres, M.; Balmford, A.; Branch, G.; Brandon, K.; Brooks, T.; Bustamante, R.; Costanza, R.; Cowling, R.; Curran, L.M.; et al. Can We Defy Nature’s End? Science 2001, 293, 2207–2208. [Google Scholar] [CrossRef] [PubMed]
- Andam, K.S.; Ferraro, P.J.; Pfaff, A.; Sanchez-Azofeifa, G.A.; Robalino, J. a Measuring the effectiveness of protected area networks in reducing deforestation. Proc. Natl. Acad. Sci. USA 2008, 105, 16089–16094. [Google Scholar] [CrossRef] [Green Version]
- Huang, C.; Kim, S.; Song, K.; Townshend, J.R.G.; Davis, P.; Altstatt, A.; Rodas, O.; Yanosky, A.; Clay, R.; Tucker, C.J.; et al. Assessment of Paraguay’s forest cover change using Landsat observations. Glob. Planet. Change 2009, 67, 1–12. [Google Scholar] [CrossRef]
- Schmitt, C.B.; Burgess, N.D.; Coad, L.; Belokurov, A.; Besançon, C.; Boisrobert, L.; Campbell, A.; Fish, L.; Gliddon, D.; Humphries, K.; et al. Global analysis of the protection status of the world’s forests. Biol. Conserv. 2009, 142, 2122–2130. [Google Scholar] [CrossRef]
- Kindermann, G.; Obersteiner, M.; Sohngen, B.; Sathaye, J.; Andrasko, K.; Rametsteiner, E.; Schlamadinger, B.; Wunder, S.; Beach, R. Global cost estimates of reducing carbon emissions through avoided deforestation. Proc. Natl. Acad. Sci. USA 2008, 105, 10302–10307. [Google Scholar] [CrossRef] [Green Version]
- Soares-Filho, B.; Moutinho, P.; Nepstad, D.; Anderson, A.; Rodrigues, H.; Garcia, R.; Dietzsch, L.; Merry, F.; Bowman, M.; Hissa, L.; et al. Role of Brazilian Amazon protected areas in climate change mitigation. Proc. Natl. Acad. Sci. USA 2010, 107, 10821–10826. [Google Scholar] [CrossRef] [PubMed] [Green Version]
- Nolte, C.; Agrawal, A.; Silvius, K.M.; Soares-Filho, B.S. Governance regime and location influence avoided deforestation success of protected areas in the Brazilian Amazon. Proc. Natl. Acad. Sci. USA 2013, 110, 4956–4961. [Google Scholar] [CrossRef] [PubMed] [Green Version]
- Hockings, M.; Stolton, S.; Dudley, N. Management Effectiveness: Assessing Management of Protected Areas? J. Environ. Policy Plan. 2004, 6, 157–174. [Google Scholar] [CrossRef]
- Kolahi, M.; Sakai, T.; Moriya, K.; Makhdoum, M.F.; Koyama, L. Assessment of the effectiveness of protected areas management in iran: Case study in khojir national park. Environ. Manag. 2013, 52, 514–530. [Google Scholar] [CrossRef] [PubMed]
- Curran, L.M.; Trigg, S.N.; McDonald, A.K.; Astiani, D.; Hardiono, Y.M.; Siregar, P.; Caniago, I.; Kasischke, E. Lowland forest loss in protected areas of Indonesian Borneo. Science 2004, 303, 1000–1003. [Google Scholar] [CrossRef] [PubMed] [Green Version]
- Gaveau, D.L.A.; Epting, J.; Lyne, O.; Linkie, M.; Kumara, I.; Kanninen, M.; Leader-Williams, N. Evaluating whether protected areas reduce tropical deforestation in Sumatra. J. Biogeogr. 2009, 36, 2165–2175. [Google Scholar] [CrossRef]
- Achard, F.; Eva, H.D.; Stibig, H.-J.; Mayaux, P.; Gallego, J.; Richards, T.; Malingreau, J.-P. Determination of deforestation rates of the world’s humid tropical forests. Science 2002, 297, 999–1002. [Google Scholar] [CrossRef] [Green Version]
- Kim, D.-H.; Sexton, J.O.; Noojipady, P.; Huang, C.; Anand, A.; Channan, S.; Feng, M.; Townshend, J.R. Global, Landsat-based forest-cover change from 1990 to 2000. Remote Sens. Environ. 2014, 155, 178–193. [Google Scholar] [CrossRef] [Green Version]
- Sexton, J.O.; Song, X.-P.; Feng, M.; Noojipady, P.; Anand, A.; Huang, C.; Kim, D.-H.; Collins, K.M.; Channan, S.; DiMiceli, C.; et al. Global, 30-m resolution continuous fields of tree cover: Landsat-based rescaling of MODIS vegetation continuous fields with lidar-based estimates of error. Int. J. Digit. Earth 2013, 6, 427–448. [Google Scholar] [CrossRef] [Green Version]
- Townshend, J.R.; Masek, J.G.; Huang, C.; Vermote, E.F.; Gao, F.; Channan, S.; Sexton, J.O.; Feng, M.; Narasimhan, R.; Kim, D.; et al. Global characterization and monitoring of forest cover using Landsat data: Opportunities and challenges. Int. J. Digit. Earth 2012, 5, 373–397. [Google Scholar] [CrossRef] [Green Version]
- Channan, S.; Feng, M.; Kim, D.-H.; Sexton, J.O.; Song, X.-P.; Song, D.-X.; Noojipady, P.; Collins, K.; Anand, A.; Townshend, J.R. The GLS+: An Enhancement of the Global Land Survey Datasets. Photogramm. Eng. Remote Sens. 2015, 81, 521–525. [Google Scholar] [CrossRef]
- Feng, M.; Sexton, J.O.; Huang, C.; Masek, J.G.; Vermote, E.F.; Gao, F.; Narasimhan, R.; Channan, S.; Wolfe, R.E.; Townshend, J.R. Global surface reflectance products from Landsat: Assessment using coincident MODIS observations. Remote Sens. Environ. 2013, 134, 276–293. [Google Scholar] [CrossRef]
- Gutman, G.; Byrnes, R.; MASEK, I.; Covington, S.; Justice, C.; Franks, S.; Headley, R. Towards monitoring changes at a Globa the Global Land S. Photogramm. Eng. Remote Sens. 2008, 74, 6–10. [Google Scholar]
- Masek, J.G.; Vermote, E.F.; Saleous, N.E.; Wolfe, R.; Hall, F.G.; Huemmrich, K.F.; Gao, F.; Kutler, J.; Lim, T.-K. A Landsat surface reflectance dataset for North America, 1990–2000. IEEE Geosci. Remote Sens. Lett. 2006, 3, 68–72. [Google Scholar] [CrossRef]
- Belward, A. The IGBP-DIS Global 1 km Land Cover Data Set (DISCover): Proposal and Implementation Plans; IGBP-DIS Working Paper 13; International Geosphere–Biosphere Programme Data and Information System Office (IGBP-DIS): Toulouse, France, 1996. [Google Scholar]
- FAO. Proceedings, Expert Meeting on Harmonizing Forest-Related Definitions for Use by Various Stakeholders; FAO: Rome, Italy, 2002. [Google Scholar]
- UNFCCC Report of the Conference of the Parties on Its Seventh Session, held at Marrakesh from 29 October to 10 November 2001 [The Marrakesh Accords & the Marrakesh Declaration]. Addendum Part Two: Action Taken by the Conference of Parties; UNFCCC: Marrakesh, Morocco, 2002.
- UNEPWCMC. The World Database on Protected Areas (WDPA); UNEPWCMC: Cambridge, UK, 2010. [Google Scholar]
- Sexton, J.O.; Noojipady, P.; Song, X.-P.; Feng, M.; Song, D.-X.; Kim, D.-H.; Anand, A.; Huang, C.; Channan, S.; Pimm, S.L.; et al. Conservation policy and the measurement of forests. Nat. Clim. Chang. 2016, 6, 192–196. [Google Scholar] [CrossRef]
- Kim, D.-H.; Narashiman, R.; Sexton, J.O.; Huang, C.; Townshend, J.R. Methodology to select phenologically suitable Landsat scenes for forest change detection. In Proceedings of the 2011 IEEE International Geoscience and Remote Sensing Symposium, Vancouver, BC, Canada, 24–29 July 2011; pp. 2613–2616. [Google Scholar]
- Mascia, M.B.; Pailler, S.; Krithivasan, R.; Roshchanka, V.; Burns, D.; Mlotha, M.J.; Murray, D.R.; Peng, N. Protected area downgrading, downsizing, and degazettement (PADDD) in Africa, Asia, and Latin America and the Caribbean, 1900–2010. Biol. Conserv. 2014, 169, 355–361. [Google Scholar] [CrossRef]
- Forrest, J.L.; Mascia, M.B.; Pailler, S.; Abidin, S.Z.; Araujo, M.D.; Krithivasan, R.; Riveros, J.C. Tropical Deforestation and Carbon Emissions from Protected Area Downgrading, Downsizing, and Degazettement (PADDD). Conserv. Lett. 2015, 8, 153–161. [Google Scholar] [CrossRef]
- World Wildlife Fund. PADDDtracker.org Data Release Version 1.0 (January 2014); World Wildlife Fund: Washington, DC, USA, 2014. [Google Scholar]
- Grainger, A. Estimating areas of degraded tropical lands requiring replenishment of forest cover. Int. Tree Crop. J. 1988, 5, 31–61. [Google Scholar] [CrossRef]
- Miller, D.C.; Agrawal, A.; Roberts, J.T. Biodiversity, Governance, and the Allocation of International Aid for Conservation. Conserv. Lett. 2013, 6, 12–20. [Google Scholar] [CrossRef] [Green Version]
- Stern, M.; Bhagwat, S.; Brown, N.; Evans, T.; Jennings, S.; Savill, P.; Bruner, A.G.; Gullison, R.E.; Rice, R.E.; Da Fonseca, G.A.B. Parks and factors in their success. Science 2001, 293, 1045–1047. [Google Scholar] [CrossRef]
- Joppa, L.N.; Pfaff, A. Global protected area impacts. Proc. R. Soc. B Biol. Sci. 2010, rspb20101713. [Google Scholar] [CrossRef] [Green Version]
- Abadie, A. Semiparametric difference-in-differences estimators. Rev. Econ. Stud. 2005, 72, 1–19. [Google Scholar] [CrossRef]
- Nelson, A.; Chomitz, K.M. Effectiveness of strict vs. multiple use protected areas in reducing tropical forest fires: A global analysis using matching methods. PLoS ONE 2011, 6, e22722. [Google Scholar] [CrossRef] [PubMed]
- Card, D.; Krueger, A.B. Time-series minimum-wage studies: A meta-analysis. Am. Econ. Rev. 1995, 238–243. [Google Scholar]
- Ewers, R.M.; Rodrigues, A.S.L. Estimates of reserve effectiveness are confounded by leakage. Trends Ecol. Evol. 2008, 23, 113–116. [Google Scholar] [CrossRef] [PubMed]
- Alers, M. Reducing Threats to Protected Areas: Lessons from the Field; World Bank: Washington, DC, USA, 2007. [Google Scholar]
- Tierney, M.J.; Nielson, D.L.; Hawkins, D.G.; Roberts, J.T.; Findley, M.G.; Powers, R.M.; Parks, B.; Wilson, S.E.; Hicks, R.L. More dollars than sense: Refining our knowledge of development finance using AidData. World Dev. 2011, 39, 1891–1906. [Google Scholar] [CrossRef]
- Myers, N.; Mittermeier, R.A.; Mittermeier, C.G.; Da Fonseca, G.A.B.; Kent, J. Biodiversity hotspots for conservation priorities. Nature 2000, 403, 853–858. [Google Scholar] [CrossRef]
- Gibbs, H.K.; Rausch, L.; Munger, J.; Schelly, I.; Morton, D.C.; Noojipady, P.; Soares-Filho, B.; Barreto, P.; Micol, L.; Walker, N.F. Brazil’s Soy Moratorium. Science 2015, 347, 377–378. [Google Scholar] [CrossRef]
- Nagendra, H. Do parks work? Impact of protected areas on land cover clearing. AMBIO A J. Hum. Environ. 2008, 37, 330–337. [Google Scholar] [CrossRef]
- Oliveira, P.J.C.; Asner, G.P.; Knapp, D.E.; Almeyda, A.; Galván-Gildemeister, R.; Keene, S.; Raybin, R.F.; Smith, R.C. Land-use allocation protects the Peruvian Amazon. Science 2007, 317, 1233–1236. [Google Scholar] [CrossRef] [Green Version]
Figure 1.
34 Tropical countries and protected areas analyzed in this study.

Figure 2.
Avoided deforestation estimates for a designated protected area in Cambodia: top images show forest change over time in the Roniem Daun Sam wildlife sanctuary, which was designated in 1993. The bottom figures show forest cover change maps between periods and an illustration of the DID method. Avoided deforestation (DID) is estimated by calculating differences between difference in forest loss rate in the PAs before and after designation and the difference in forest loss rate in the surrounding areas over time.

Figure 3.
The amount of international funds committed to each tropical country in the 1990s and the 2000s; the amount of funds are converted to a nominal value of USD; avoided deforestation by each country; effects of international aid (amount of international aid per unit of avoided deforestation) for 34 tropical countries; and avoided deforestation divided by the entire forest area of each country.

Figure 4.
Frequency distribution of the difference in forest loss rates between the interior of protected areas and the surrounding 10 km buffers in the 1990s (left) and the 2000s (right).
Figure 4.
Frequency distribution of the difference in forest loss rates between the interior of protected areas and the surrounding 10 km buffers in the 1990s (left) and the 2000s (right).

Figure 5.
Mean forest loss rate in surrounding areas at various buffer distances in the 1990s and in the 2000s.
Figure 5.
Mean forest loss rate in surrounding areas at various buffer distances in the 1990s and in the 2000s.

Table 1.
Estimates of avoided deforestation by all PAs (established prior to 2010) by year of establishment to show the difference in effectiveness. Newer PAs established during the 2000s show more effectiveness compared to PAs established prior to 2000, as well as all PAs. Numbers in parenthesis represent estimates using median forest loss rate.
| Avoided Deforestation | Mean Forest Loss Rate within Protected Areas | Mean Forest Loss Rate within Buffer Zones | ||||
|---|---|---|---|---|---|---|
| Year of establishment | (%) | (km2) | Before 2000 | After 2000 | Before 2000 | After 2000 |
| Prior to 2010 | 3.46 (4.1) | 83,500 | 0.59 (0.09) | 1.65 (0.17) | 0.91 (0.46) | 2.32 (0.94) |
| 1990–2000 | 3.42 (4.6) | 22,800 | 0.5 (0.01) | 1.66 (0.02) | 0.86 (0.46) | 2.32 (1) |
| 2000–2010 | 4.47 (5) | 47,650 | 0.5 (0.02) | 1.52 (0.04) | 0.897 (0.35) | 2.37 (0.87) |
Publisher’s Note: MDPI stays neutral with regard to jurisdictional claims in published maps and institutional affiliations. |
© 2021 by the authors. Licensee MDPI, Basel, Switzerland. This article is an open access article distributed under the terms and conditions of the Creative Commons Attribution (CC BY) license (https://creativecommons.org/licenses/by/4.0/).
Share and Cite
MDPI and ACS Style
Kim, D.-H.; Anand, A. Effectiveness of Protected Areas in the Pan-Tropics and International Aid for Conservation. Geomatics 2021, 1, 335-346. https://0-doi-org.brum.beds.ac.uk/10.3390/geomatics1030019
AMA Style
Kim D-H, Anand A. Effectiveness of Protected Areas in the Pan-Tropics and International Aid for Conservation. Geomatics. 2021; 1(3):335-346. https://0-doi-org.brum.beds.ac.uk/10.3390/geomatics1030019
Chicago/Turabian StyleKim, Do-Hyung, and Anupam Anand. 2021. "Effectiveness of Protected Areas in the Pan-Tropics and International Aid for Conservation" Geomatics 1, no. 3: 335-346. https://0-doi-org.brum.beds.ac.uk/10.3390/geomatics1030019