
Arctic Inshore Biogeochemical Regime Influenced by Coastal Runoff and Glacial Melting (Case Study for the Templefjord, Spitsbergen)

 , and
, and 
Abstract
:1. Introduction
2. Materials and Methods
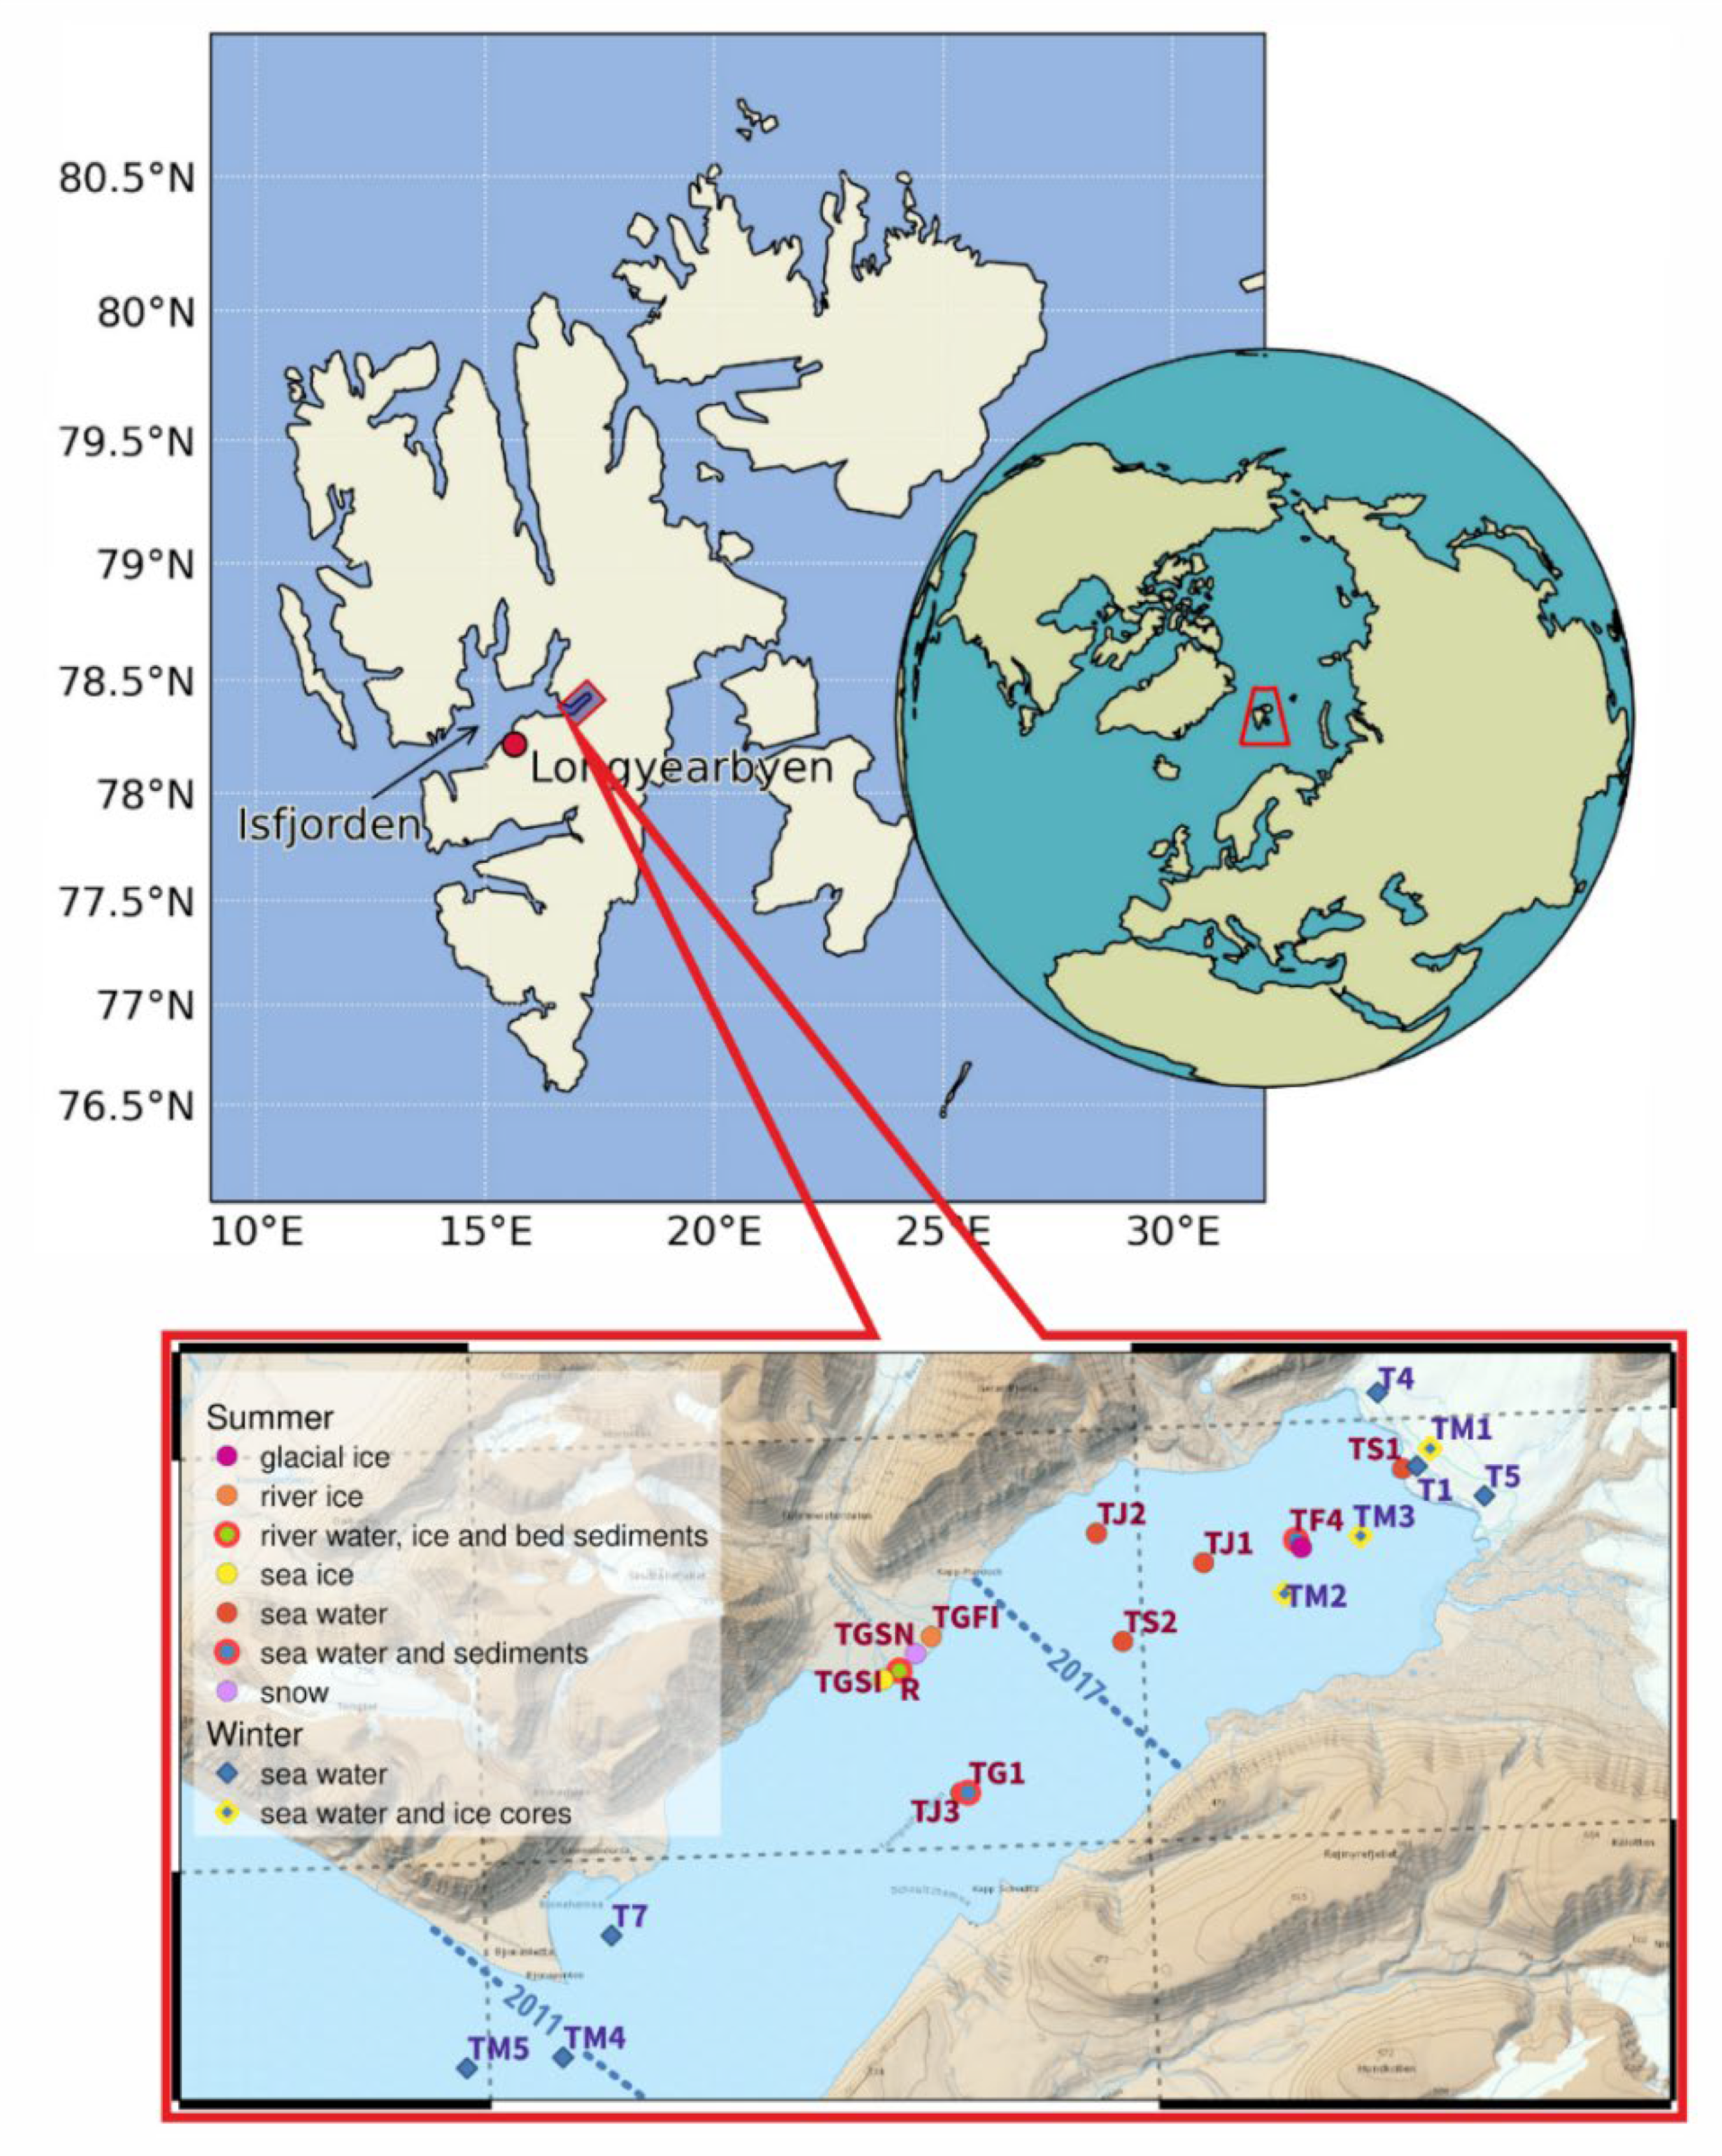
2.1. Study Area
2.2. Methods and Data
3. Results
3.1. Distribution of Hydrophysical and Biogeochemical Properties in the Water Column
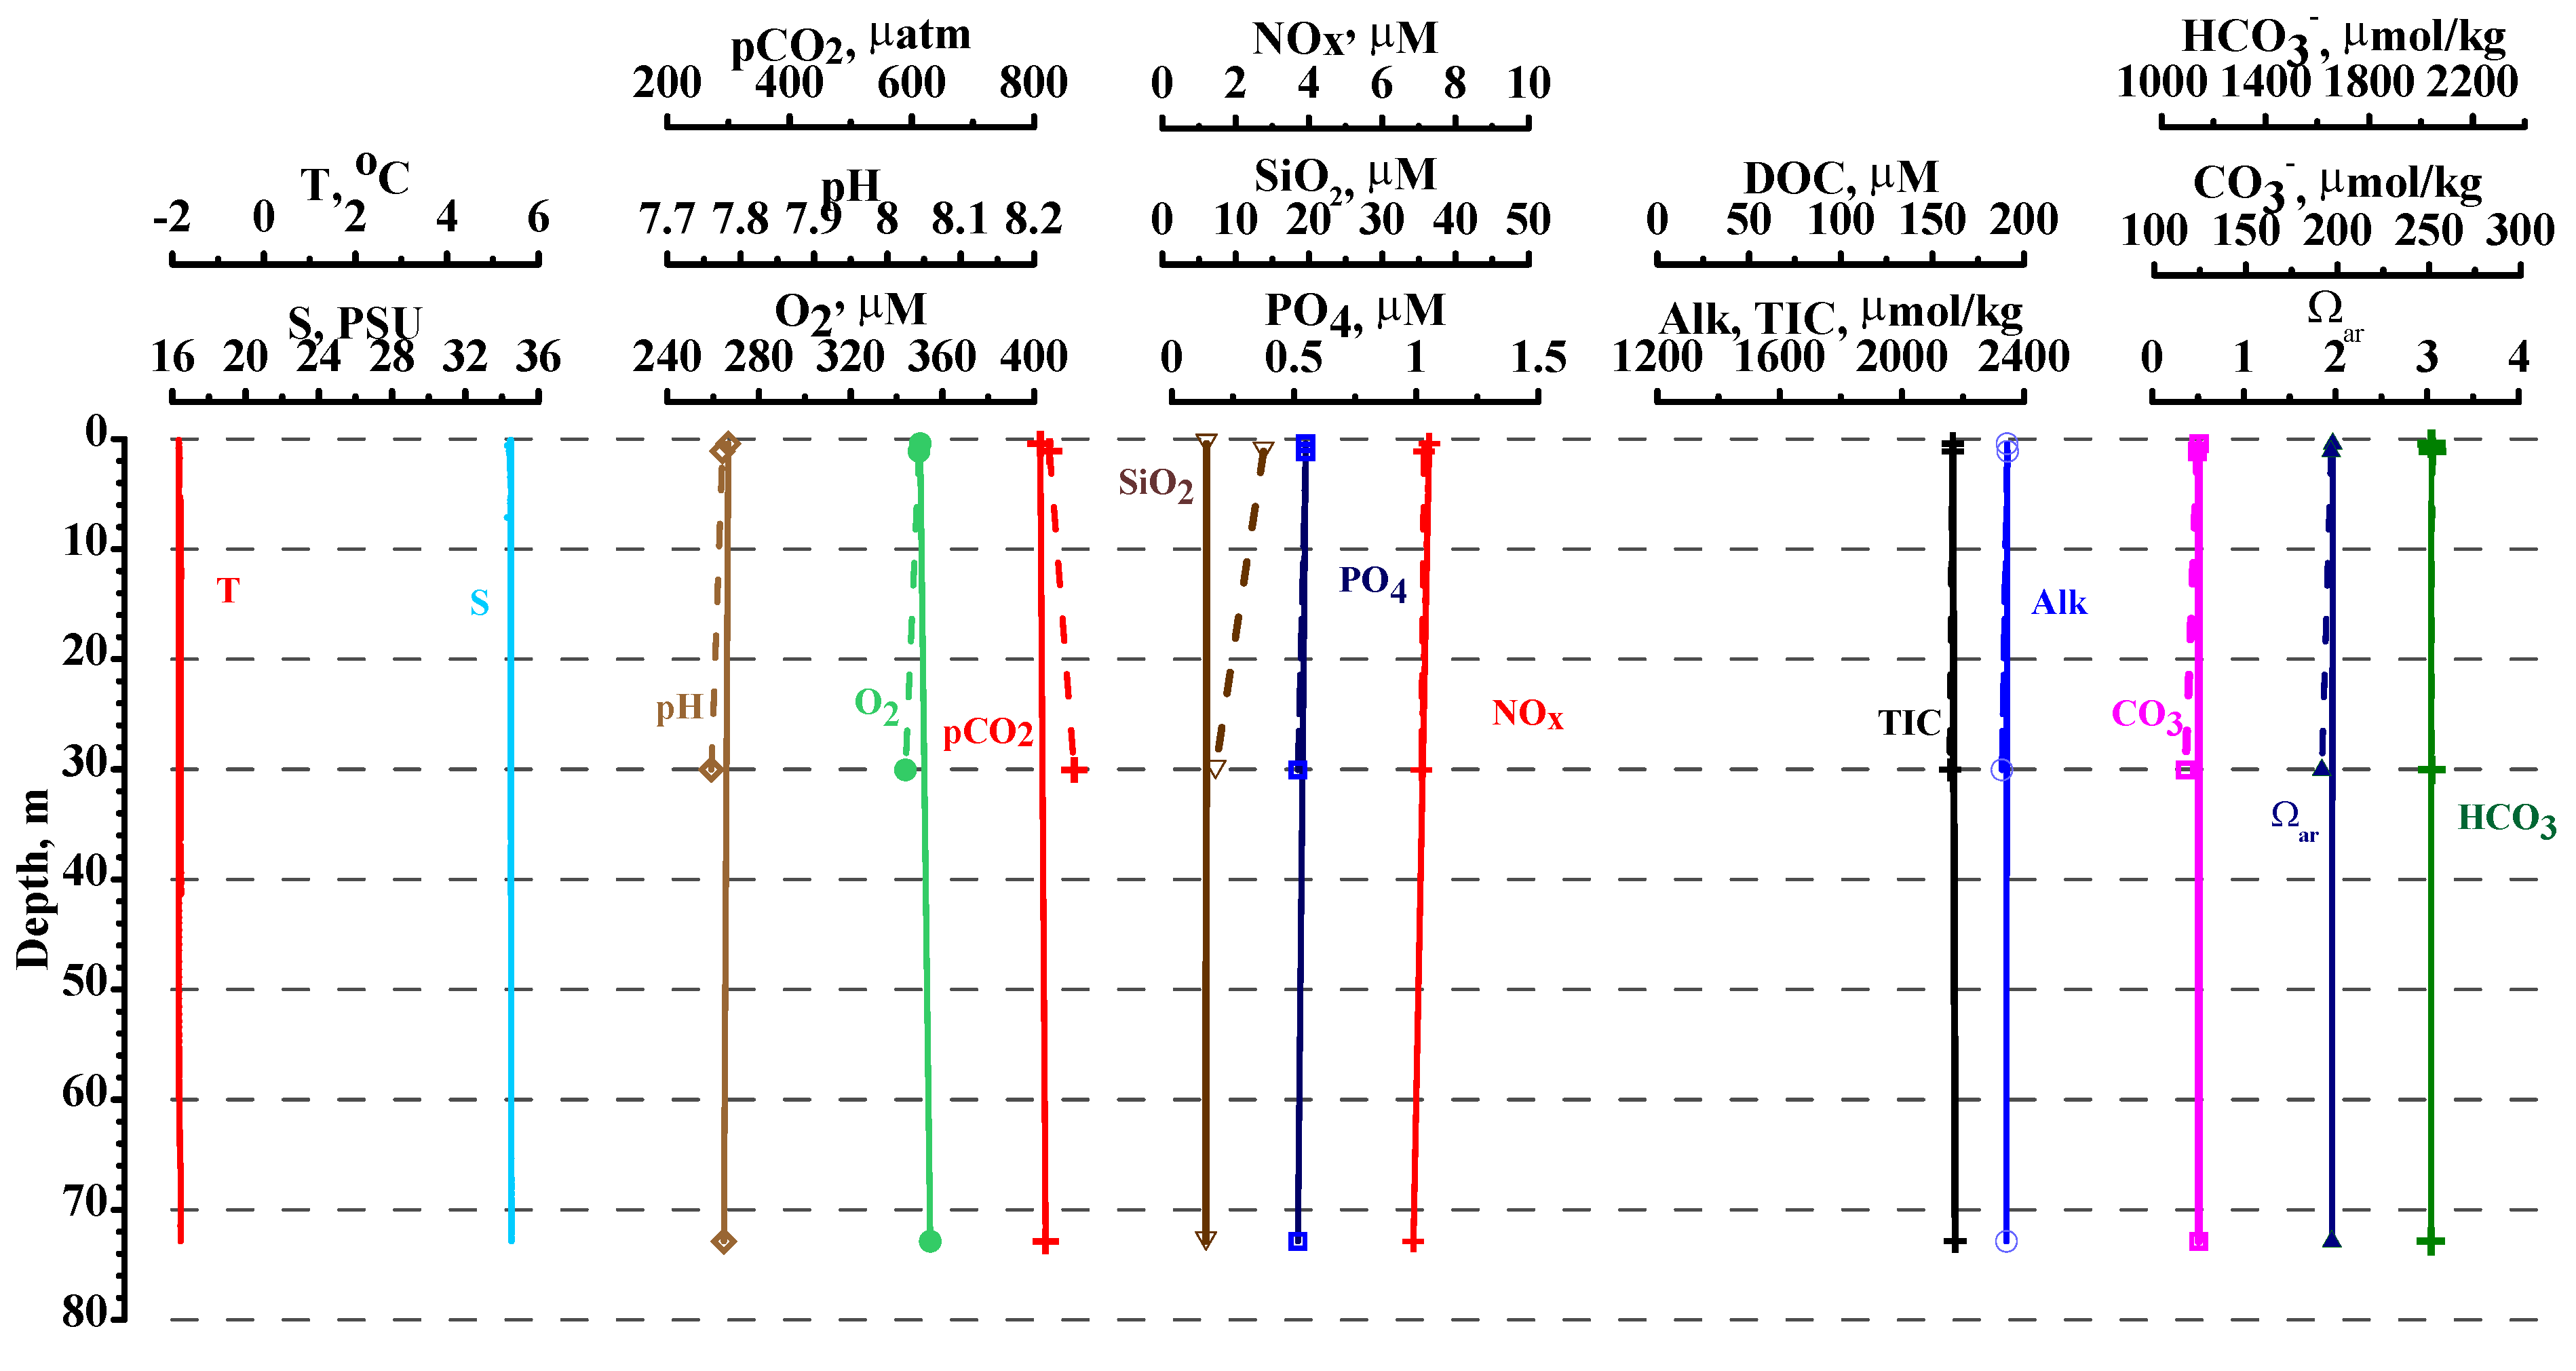
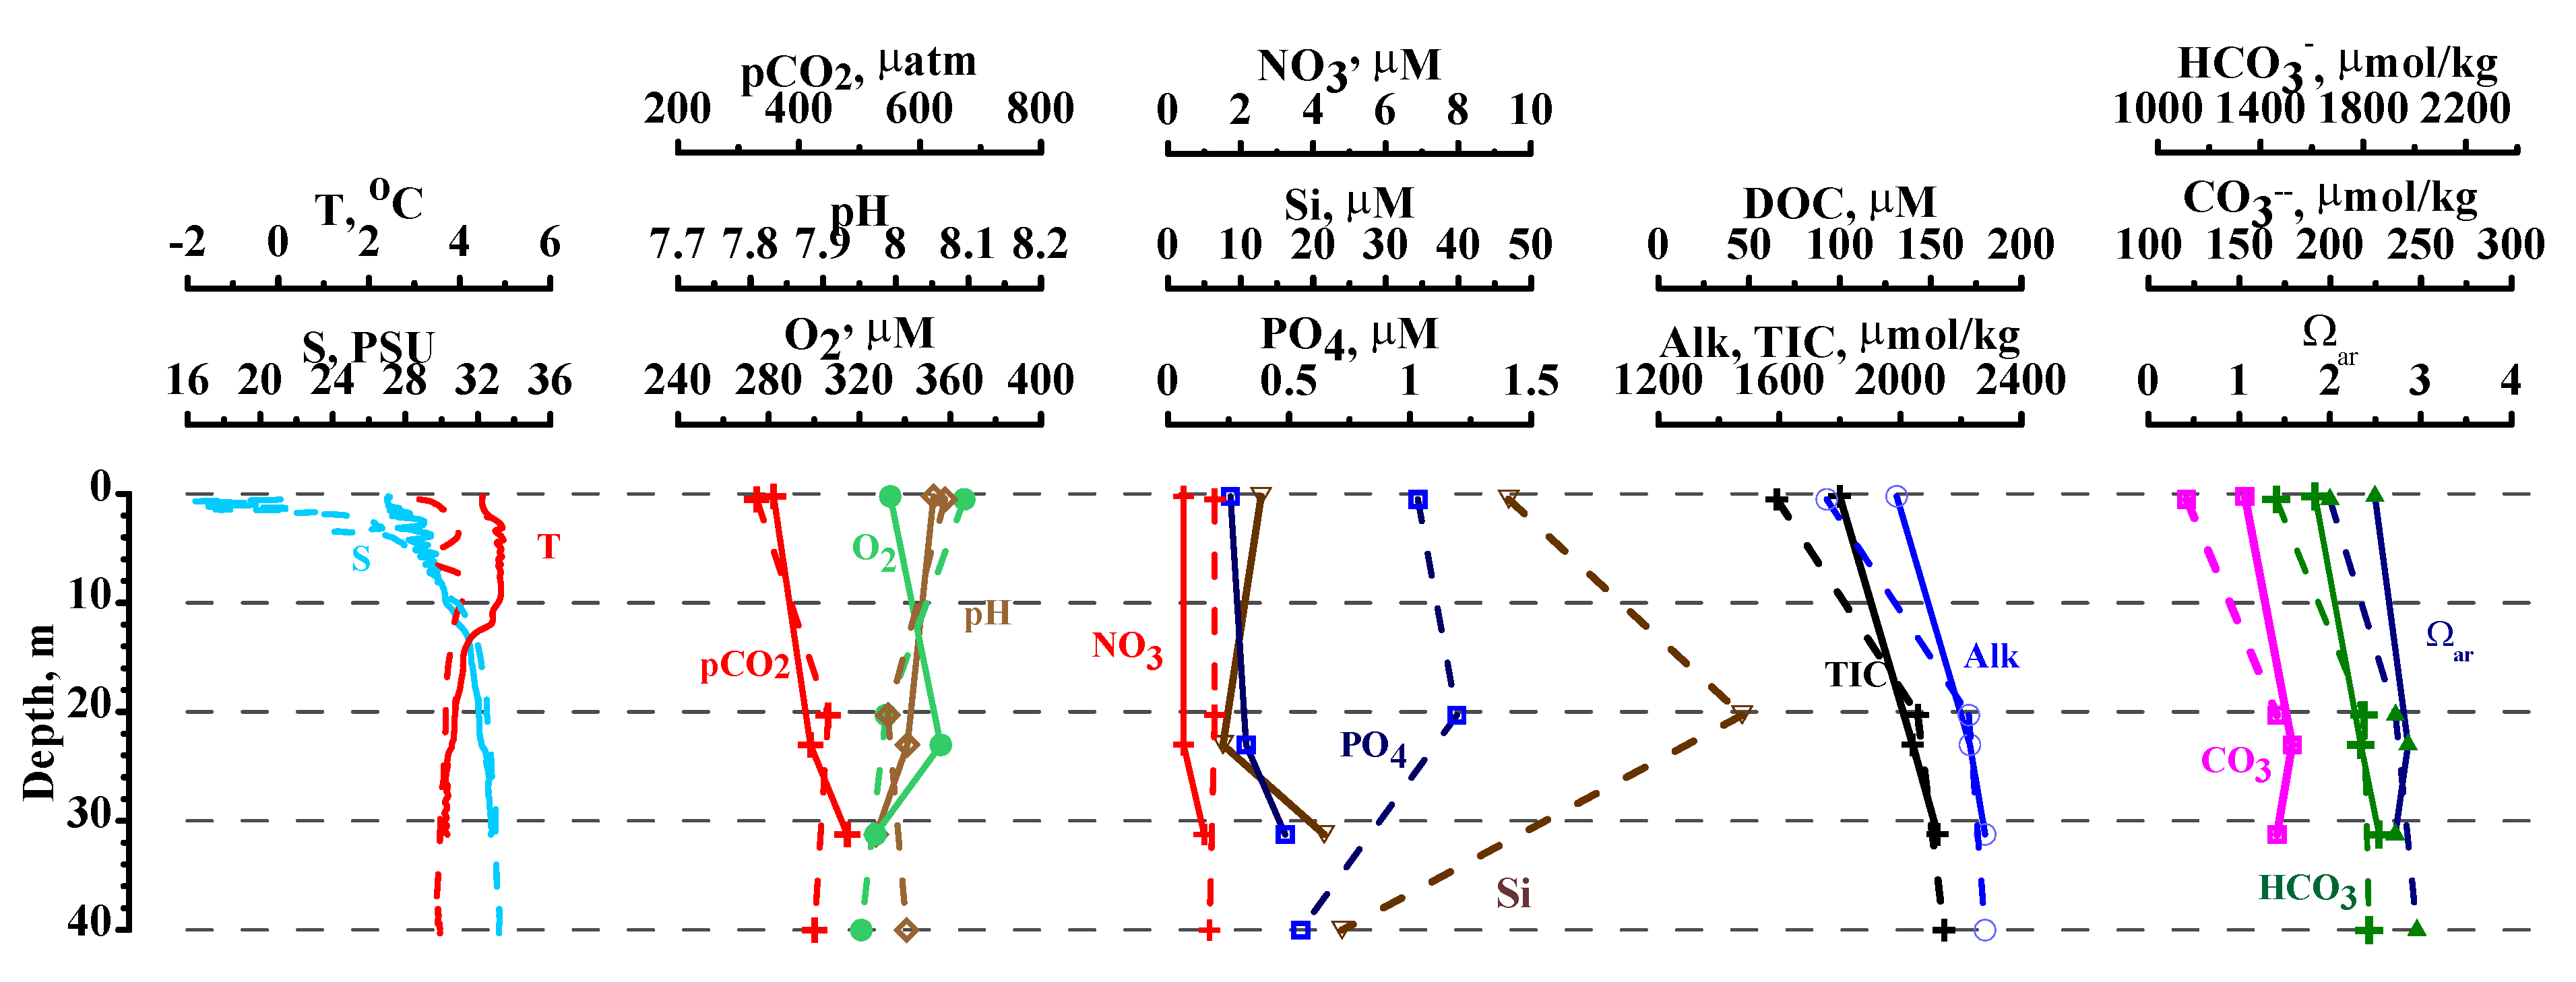
3.1.1. Winter
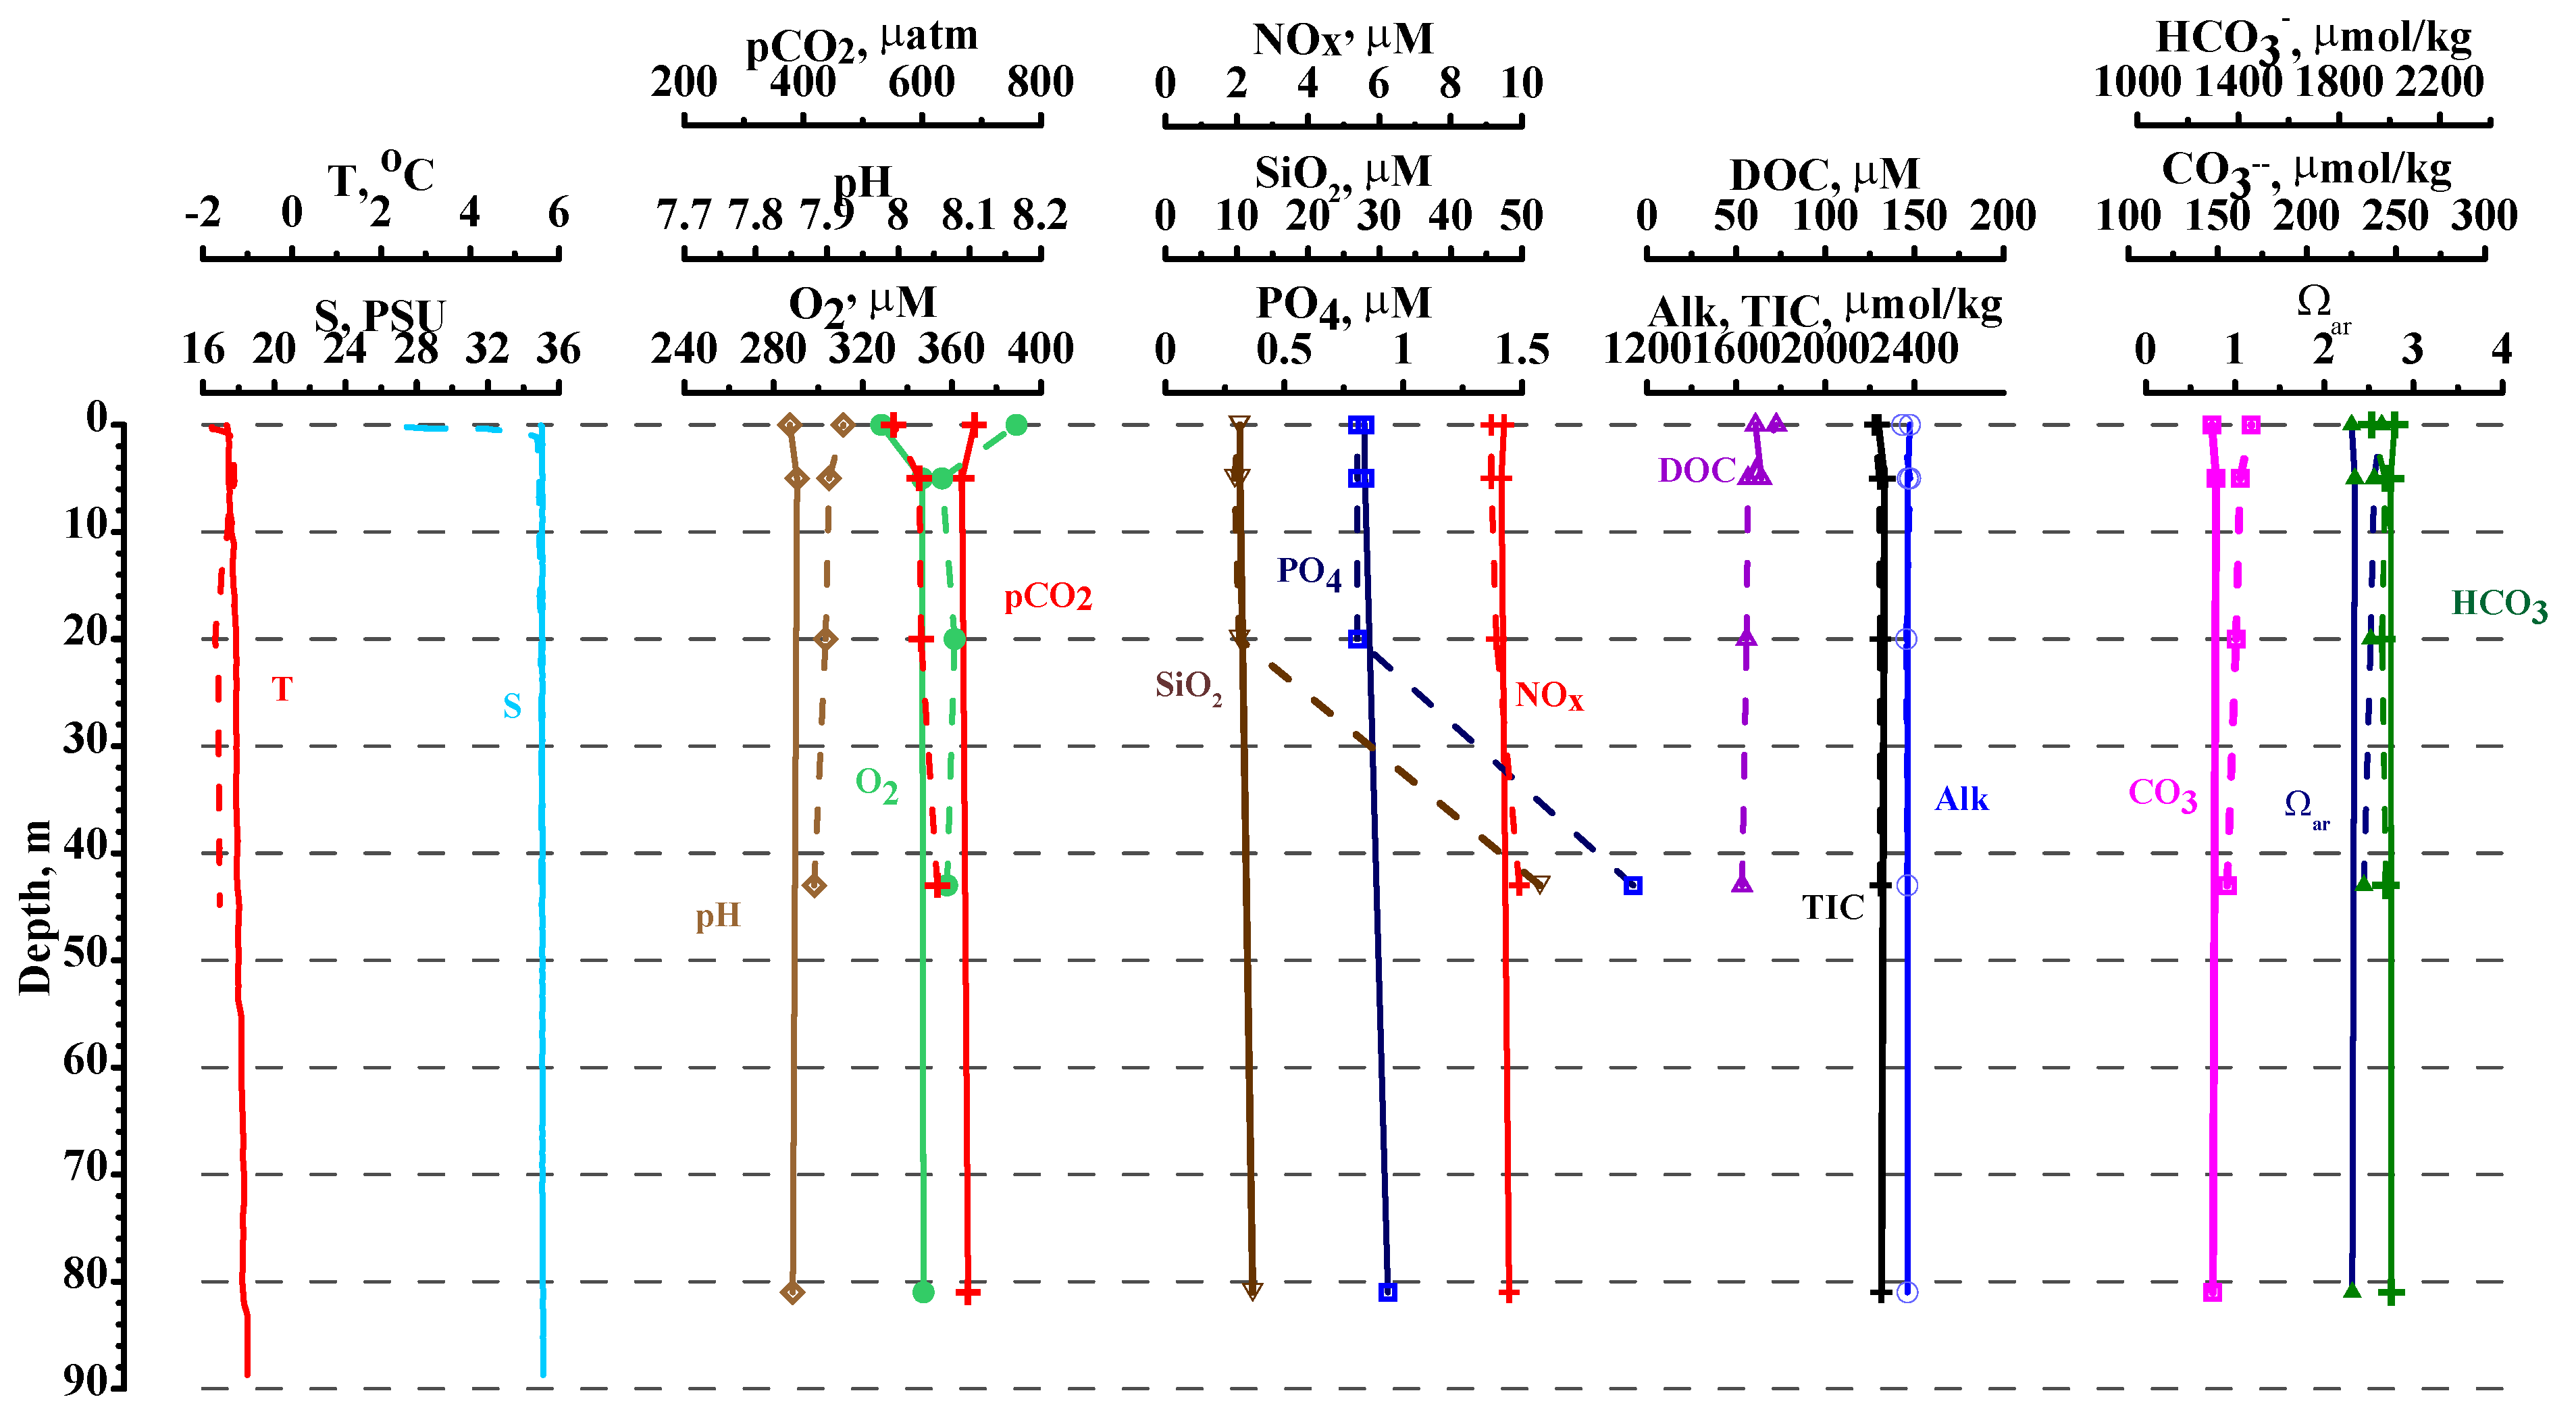
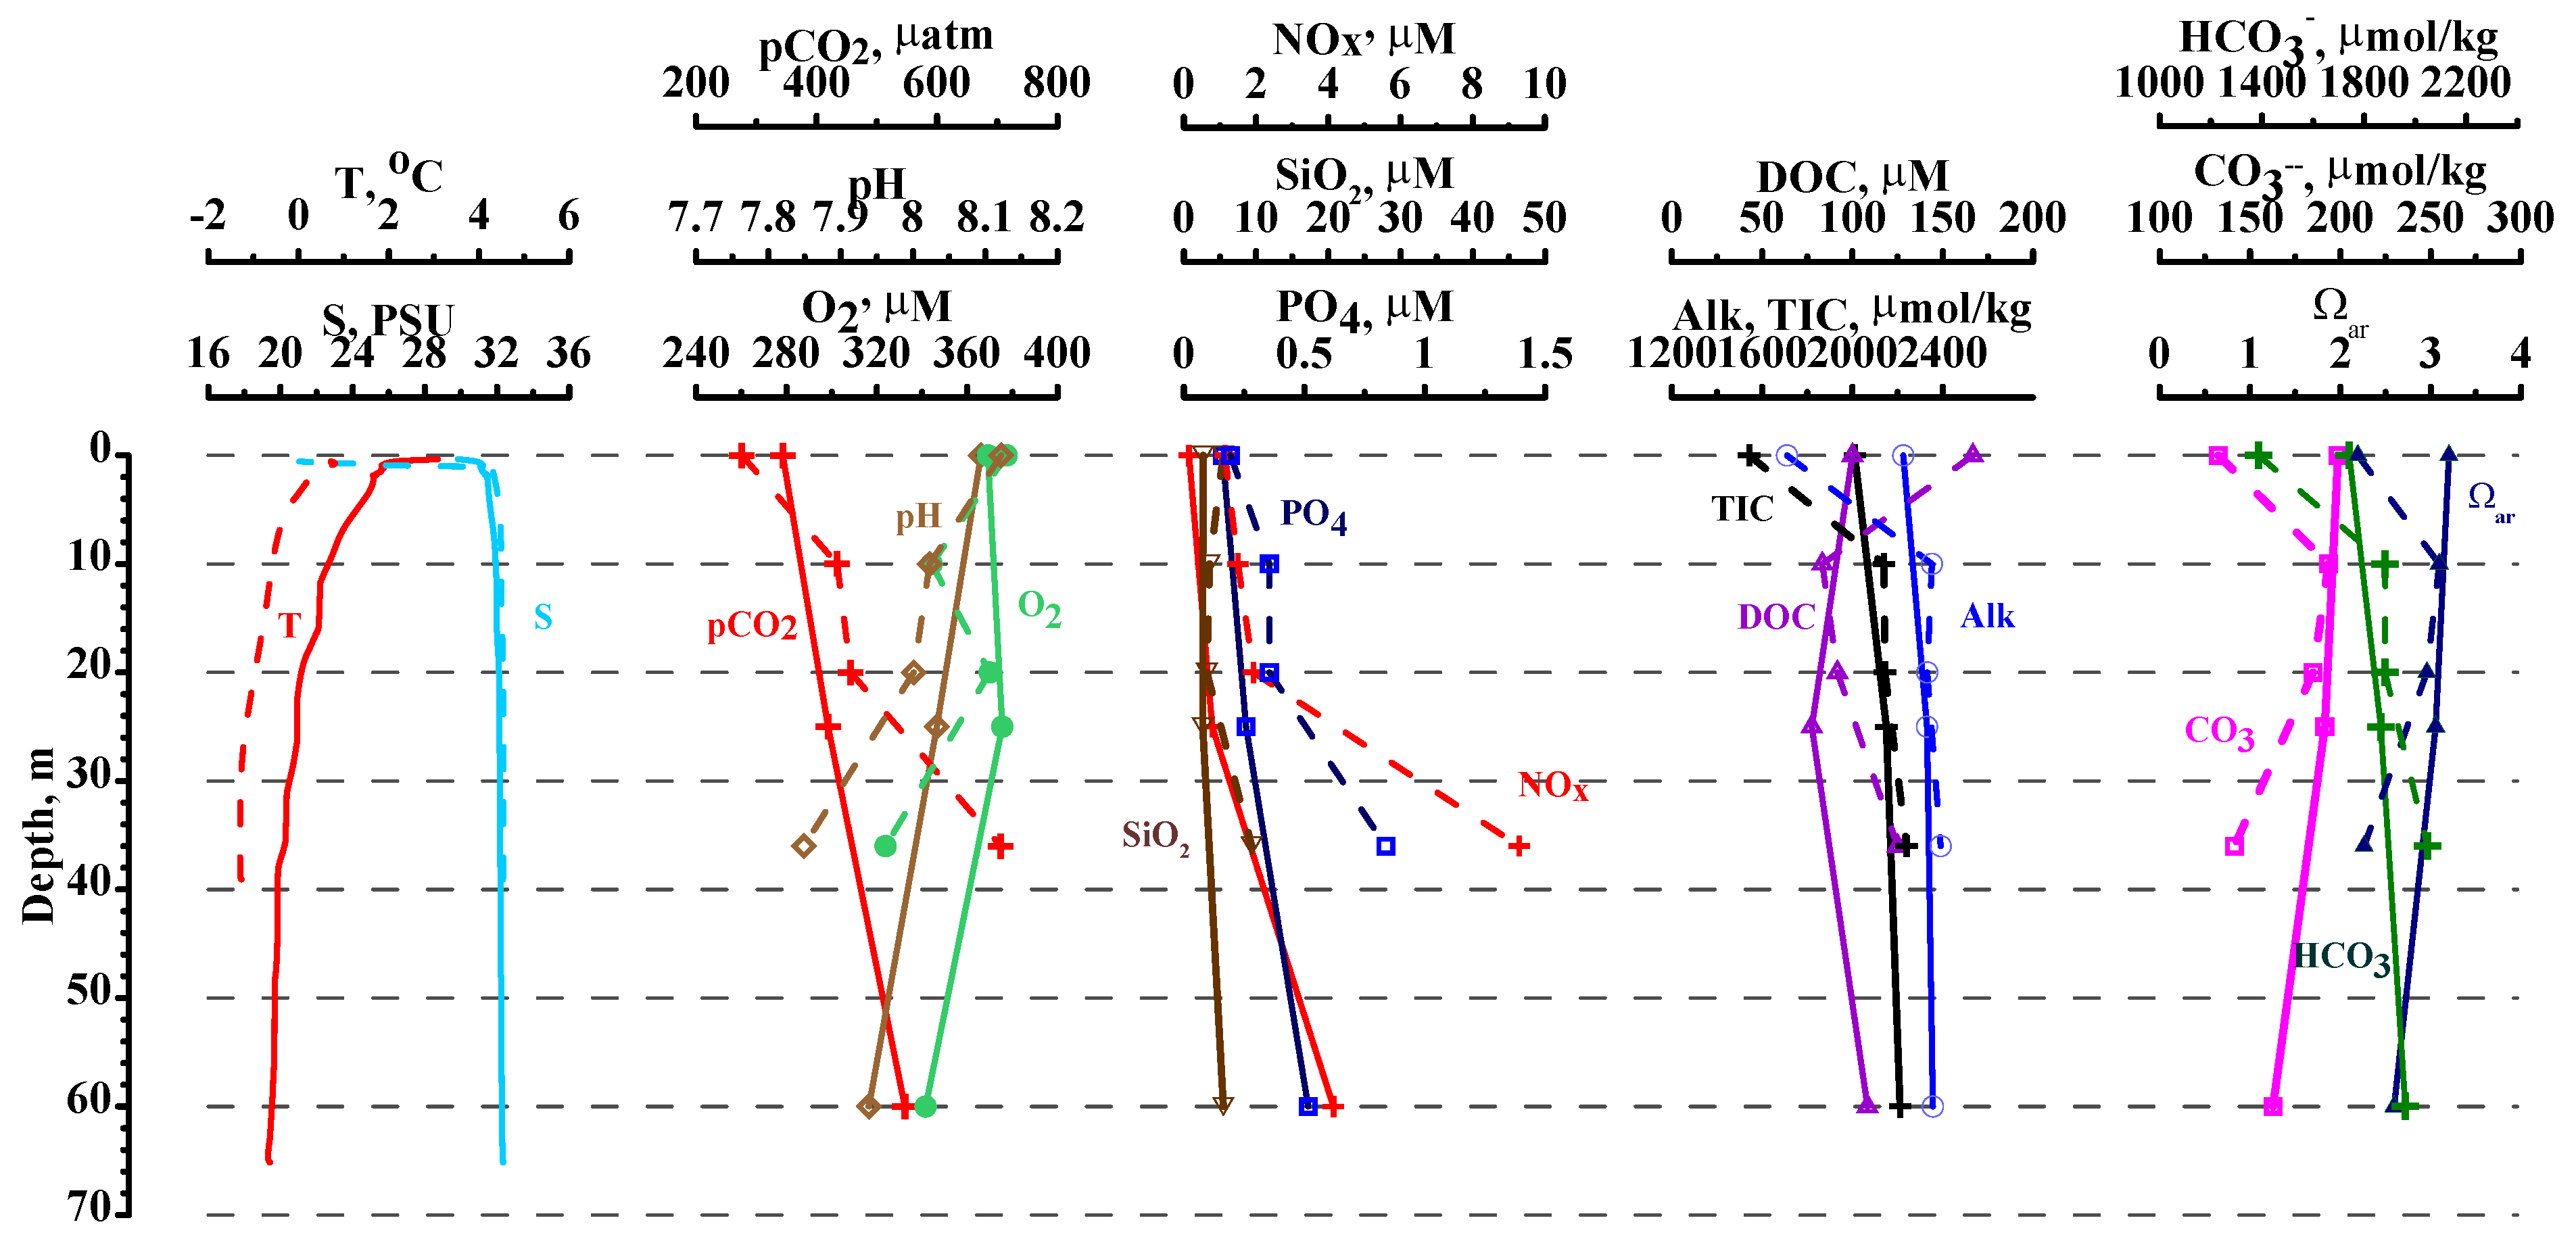
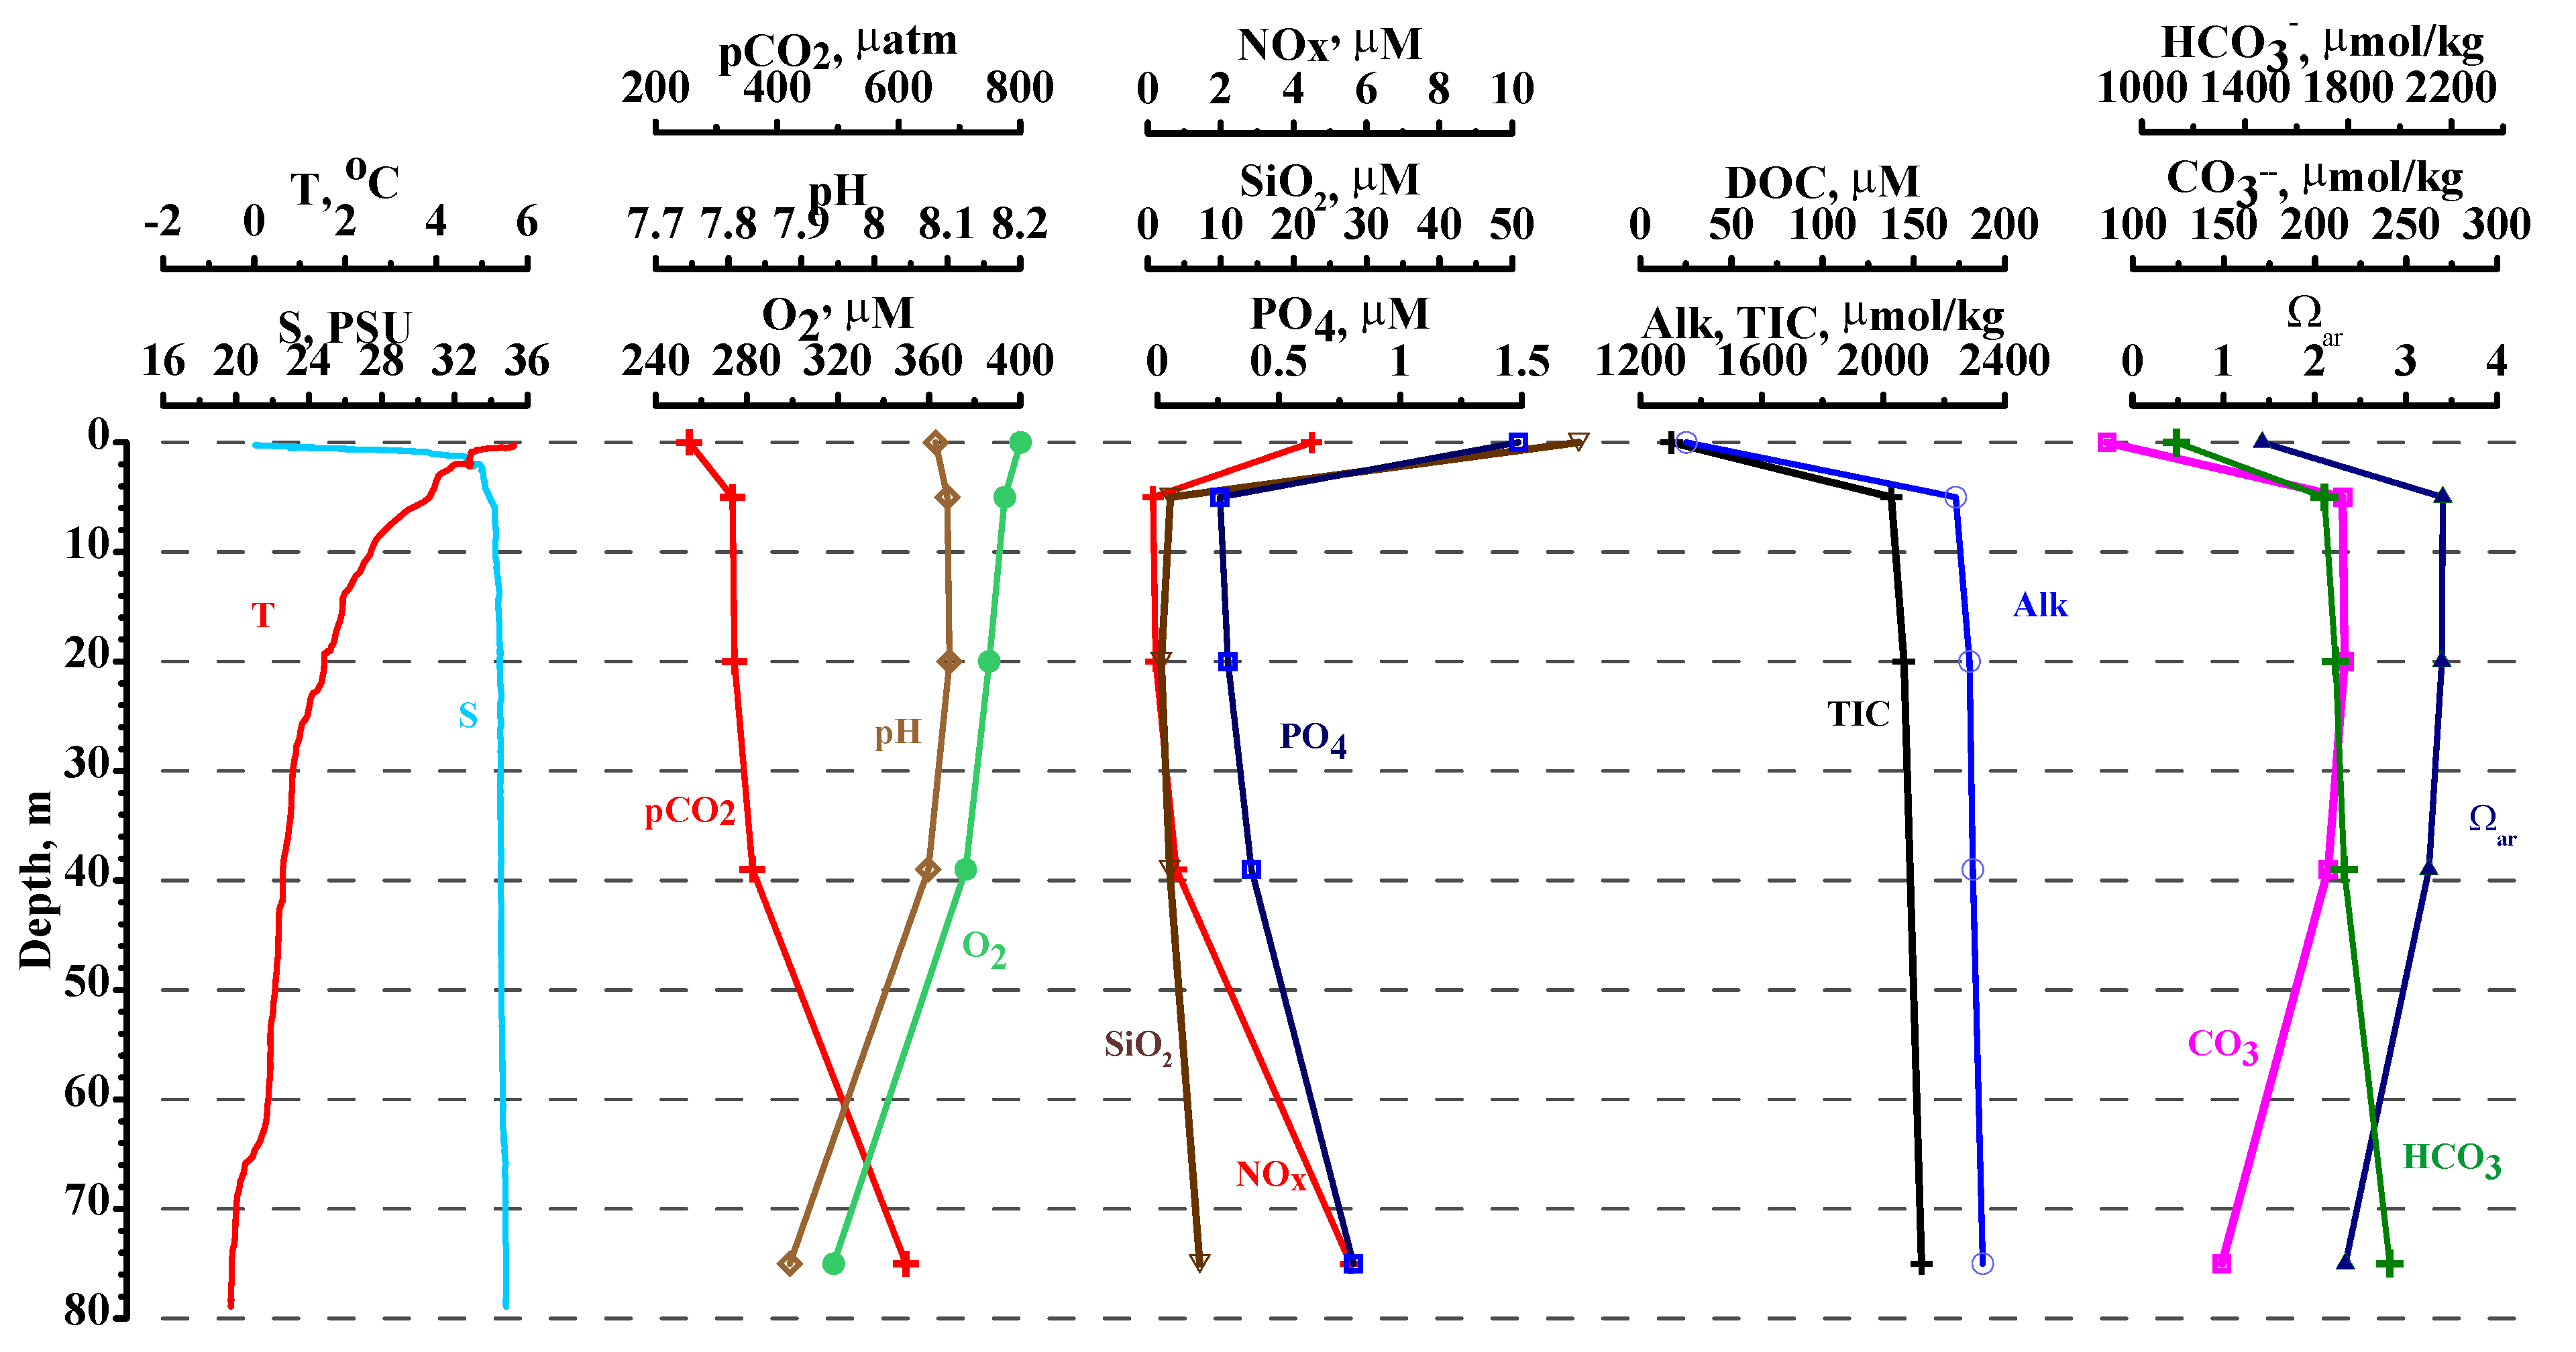
3.1.2. Summer
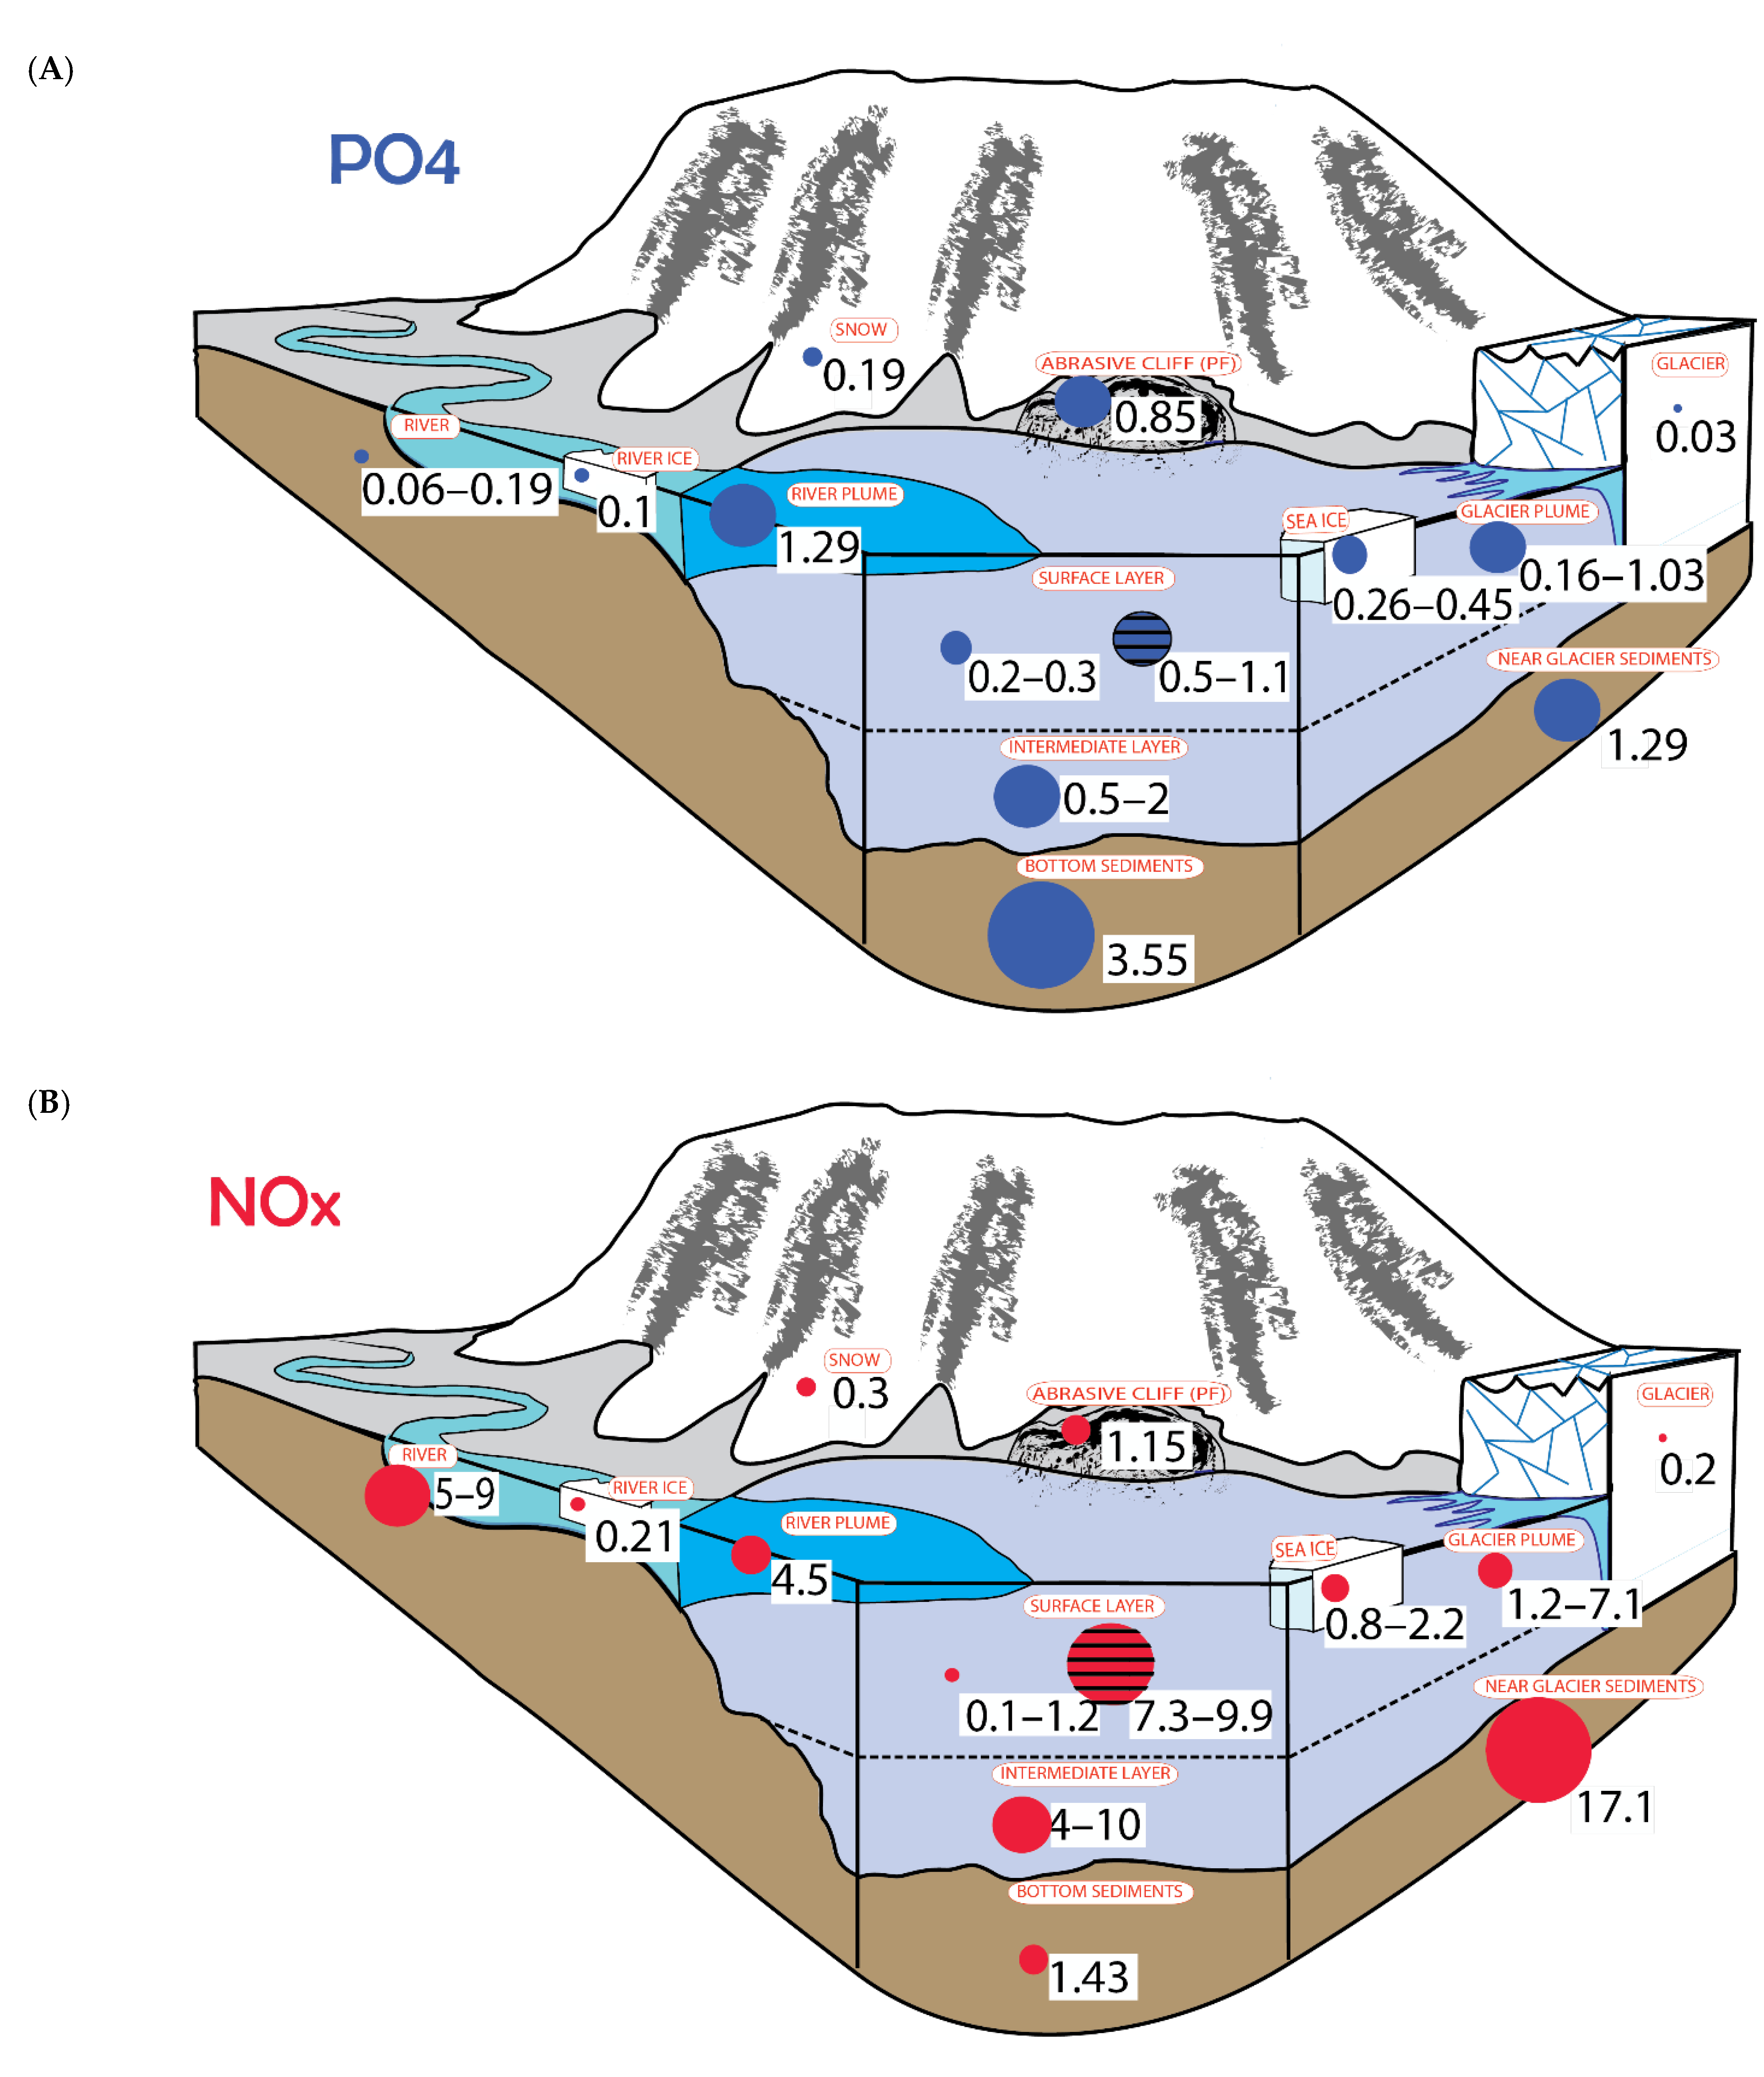
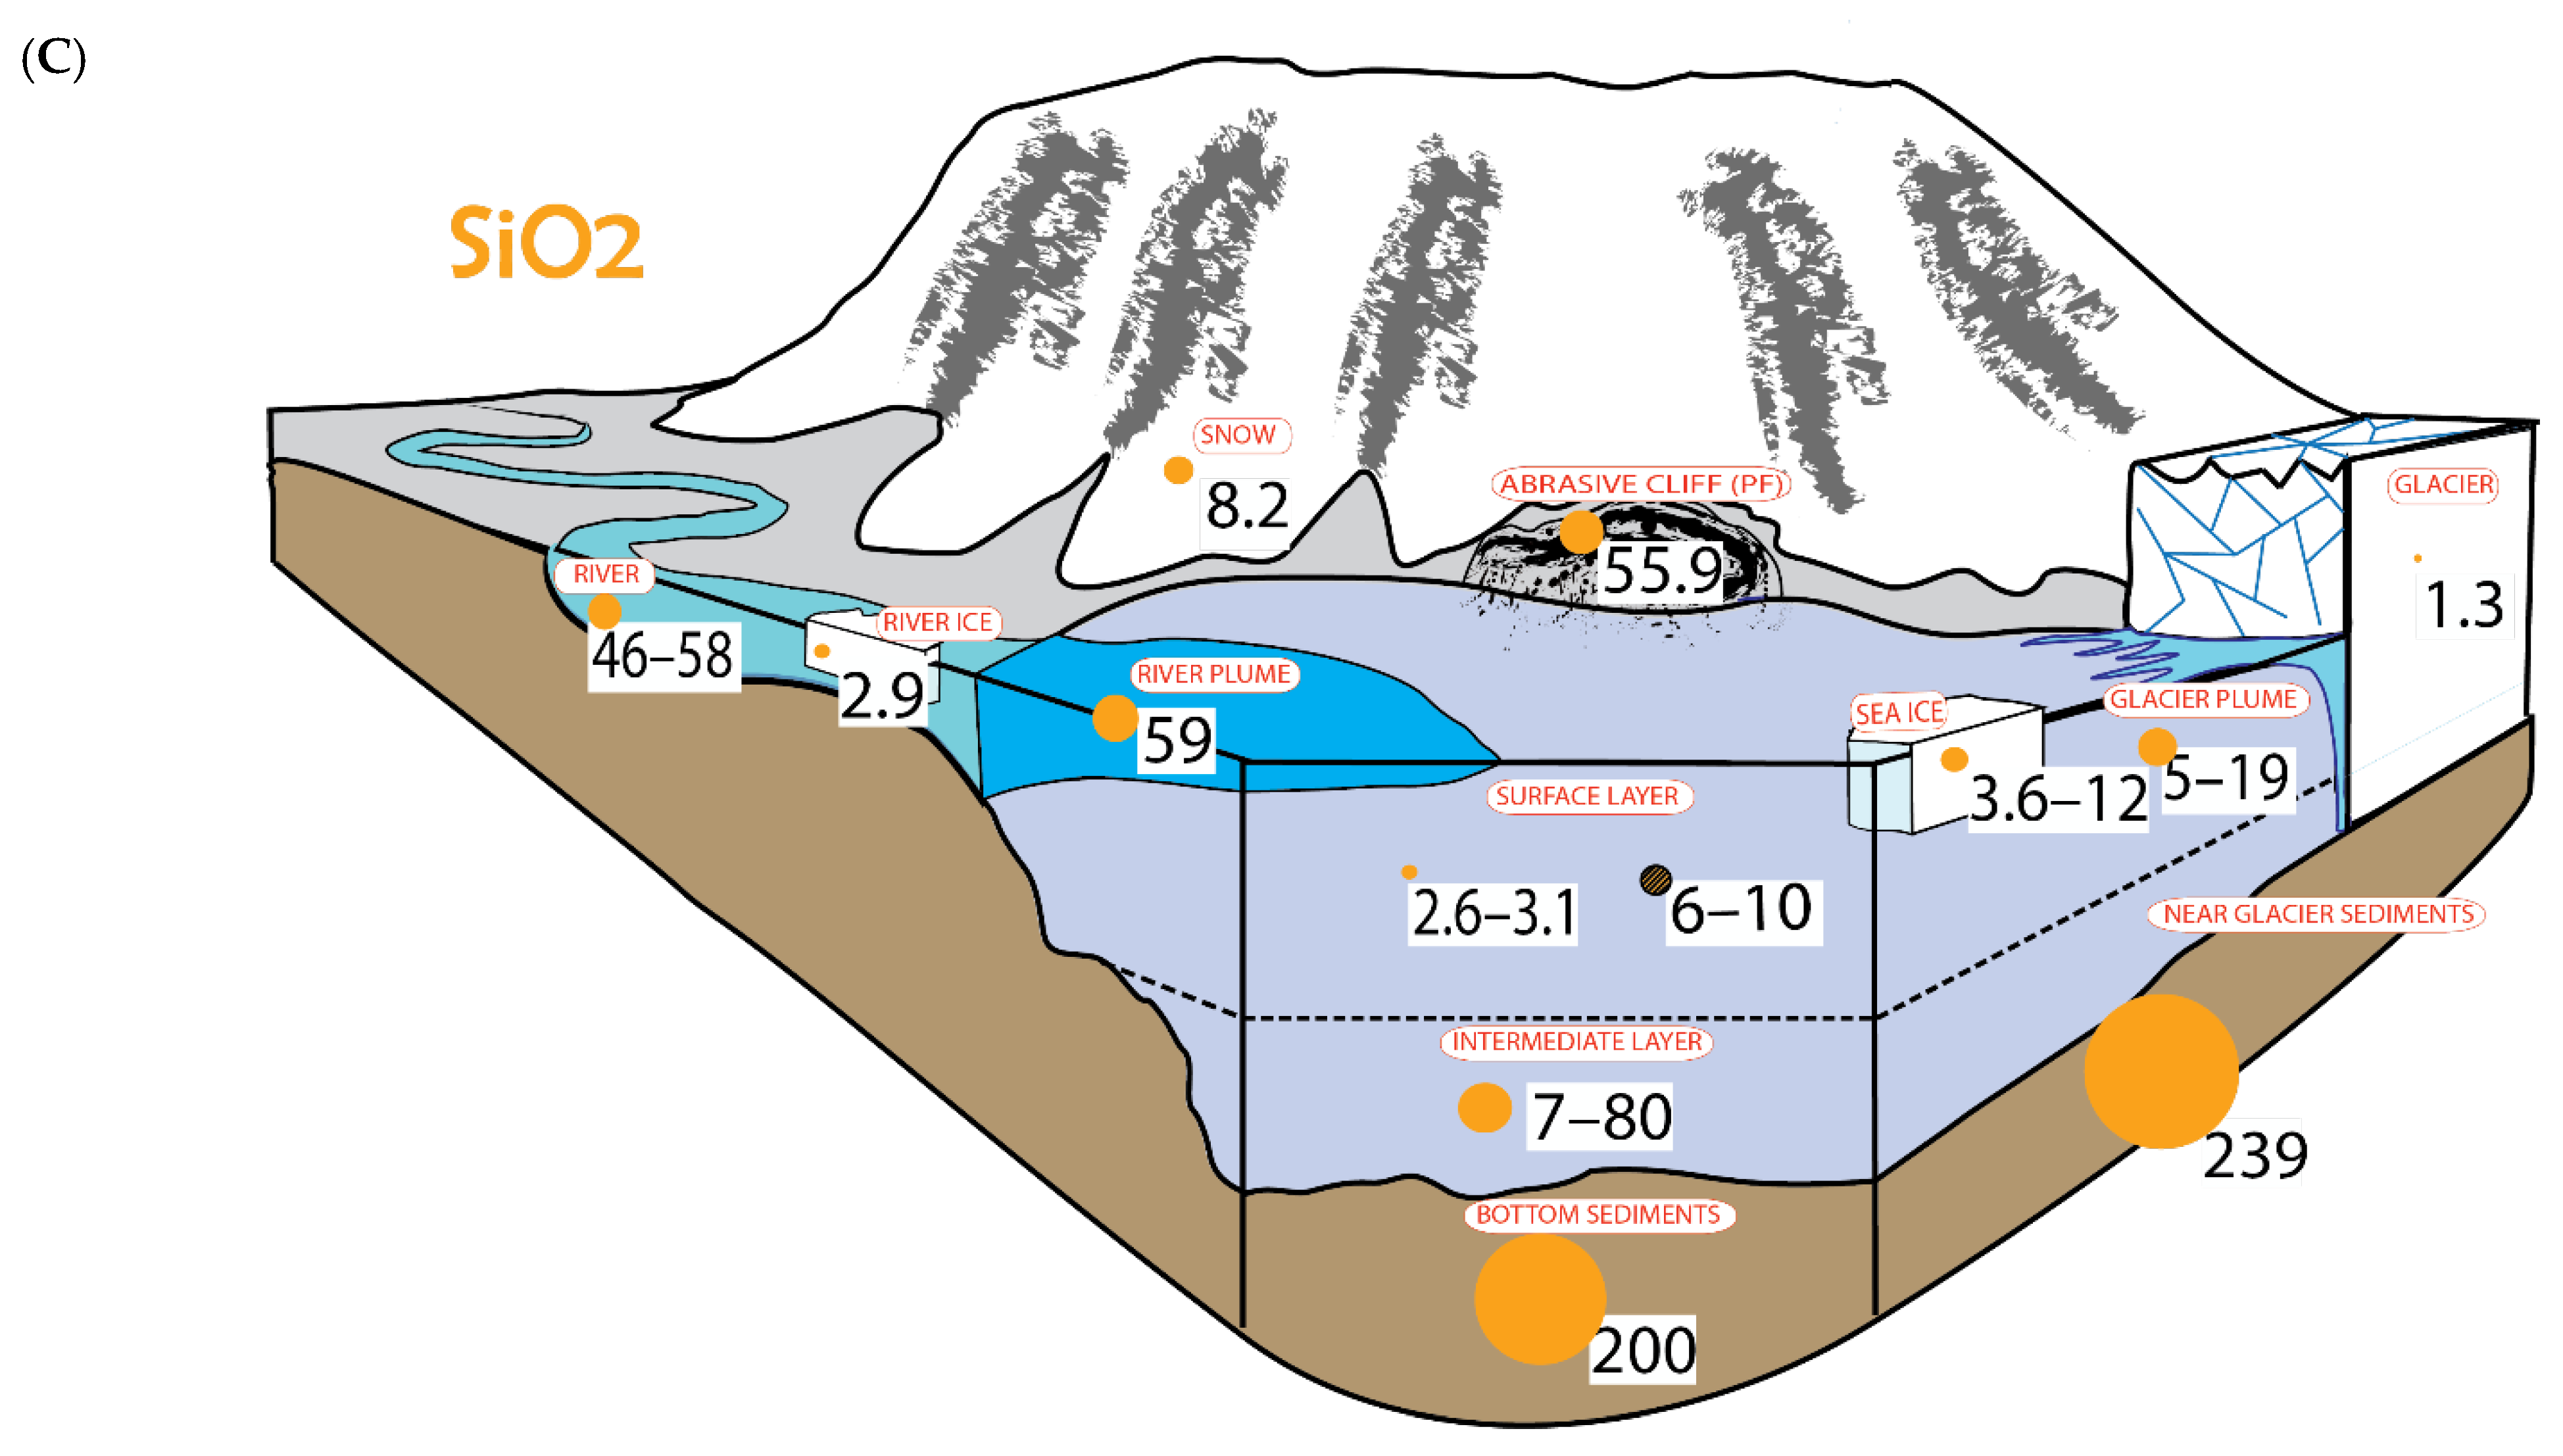
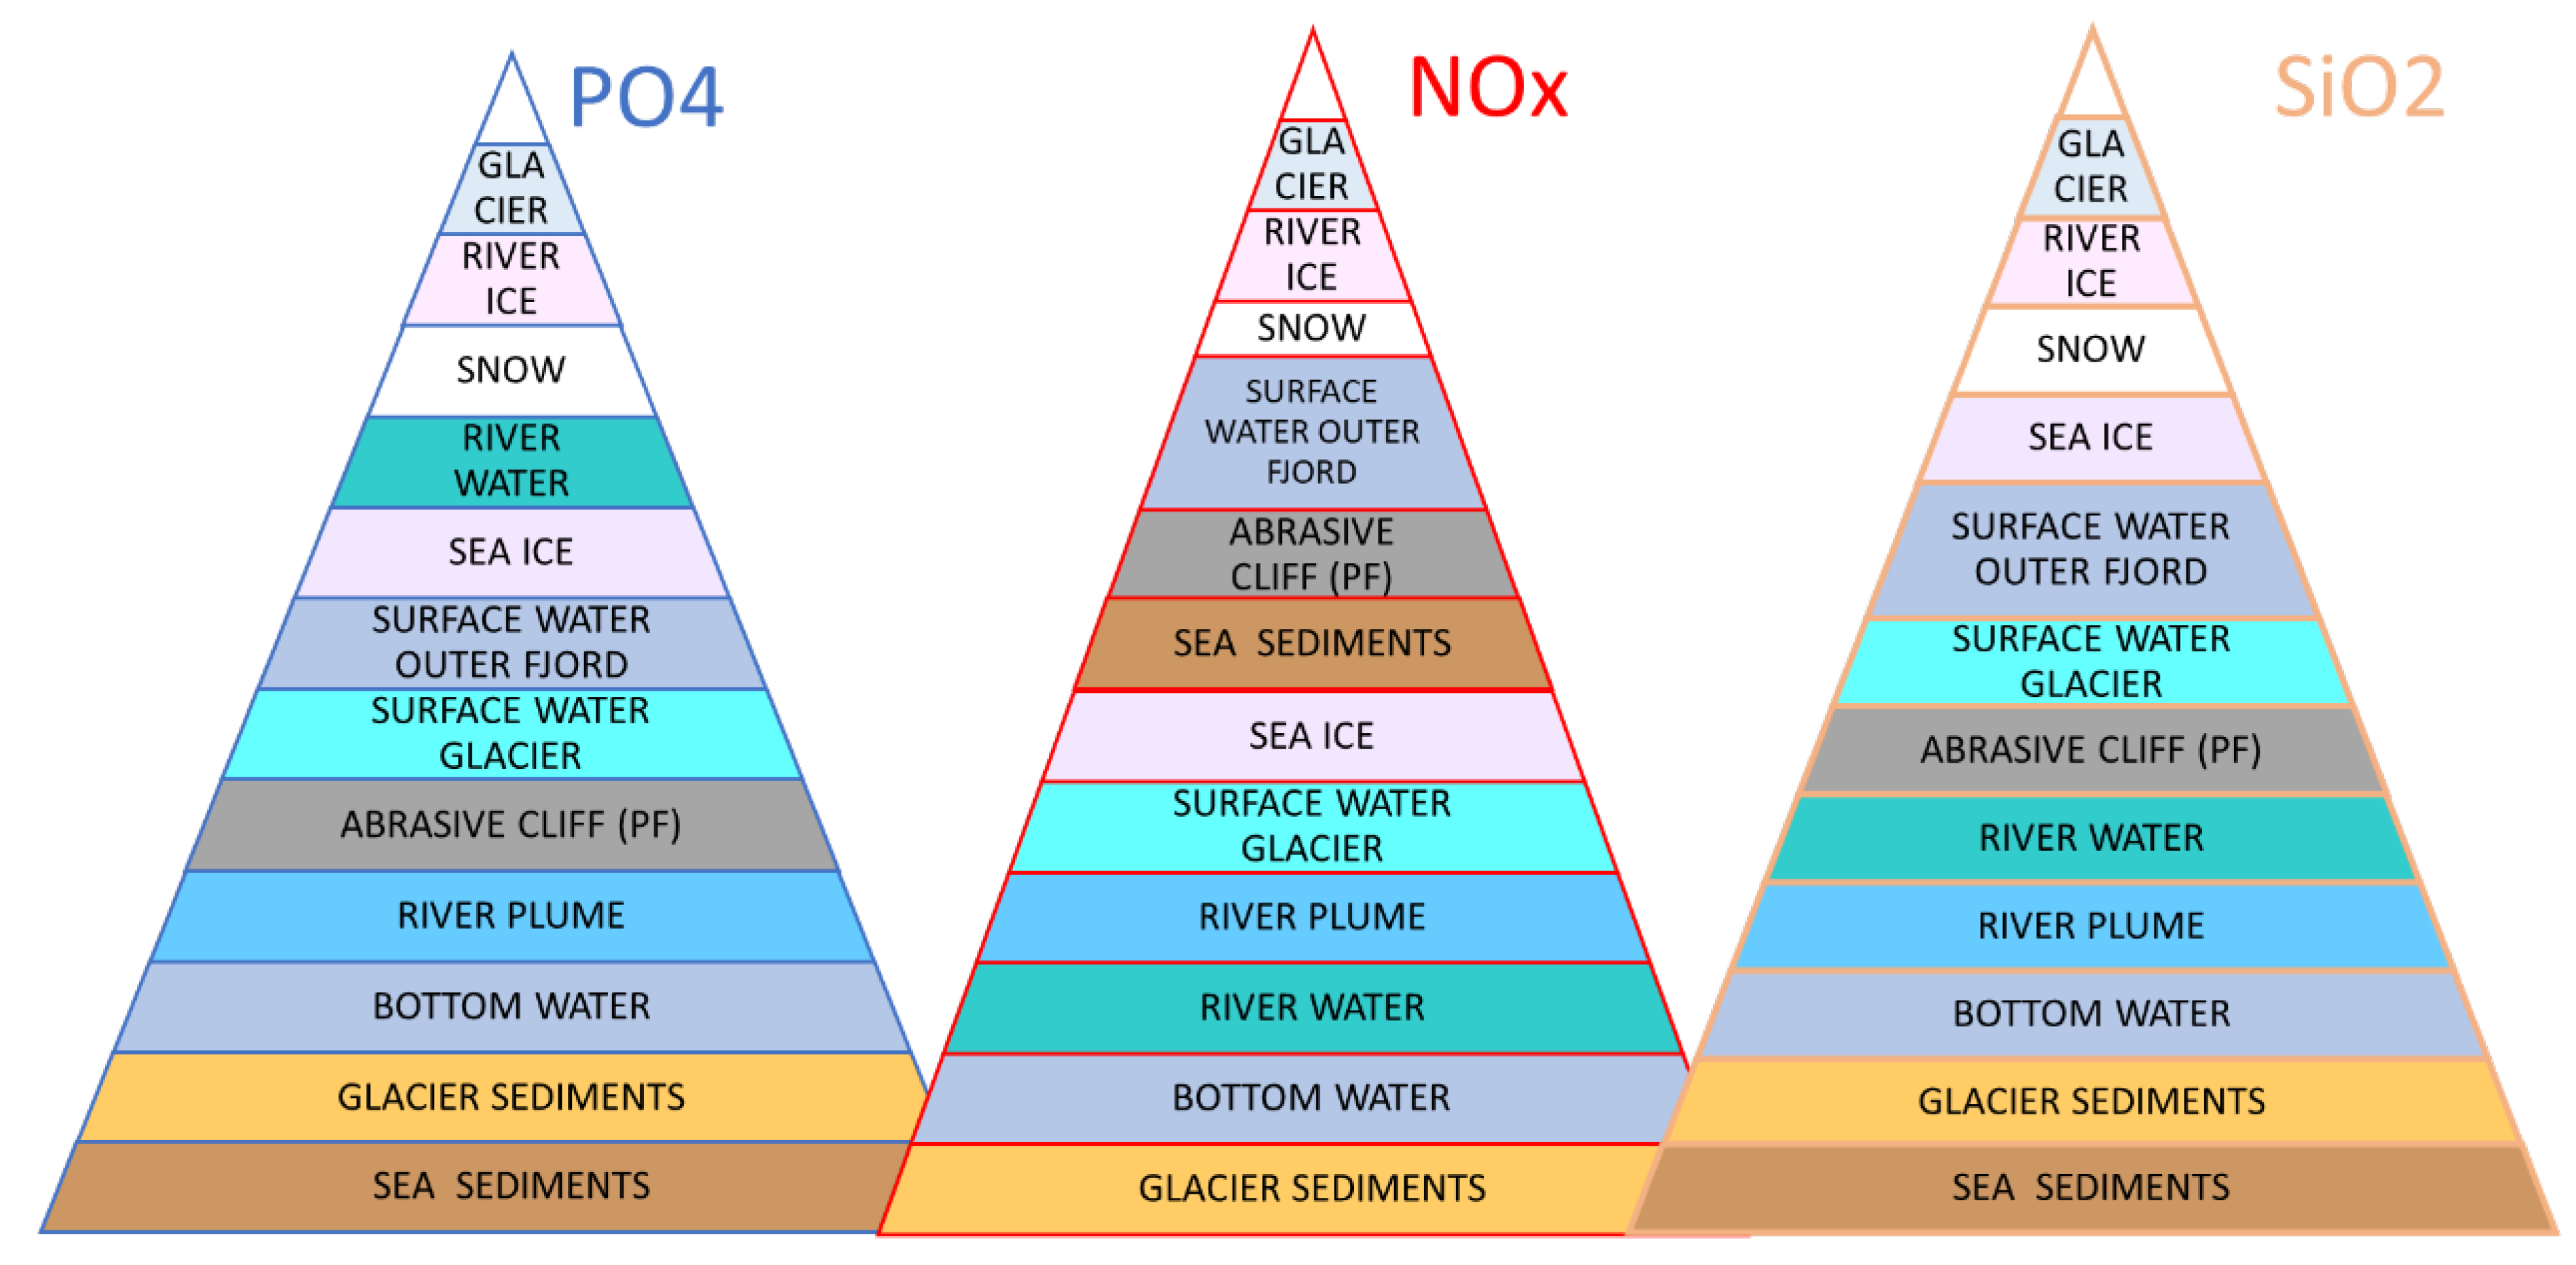
3.2. Comparison of Nutrient Concentrations in Different Arctic Media
4. Discussion
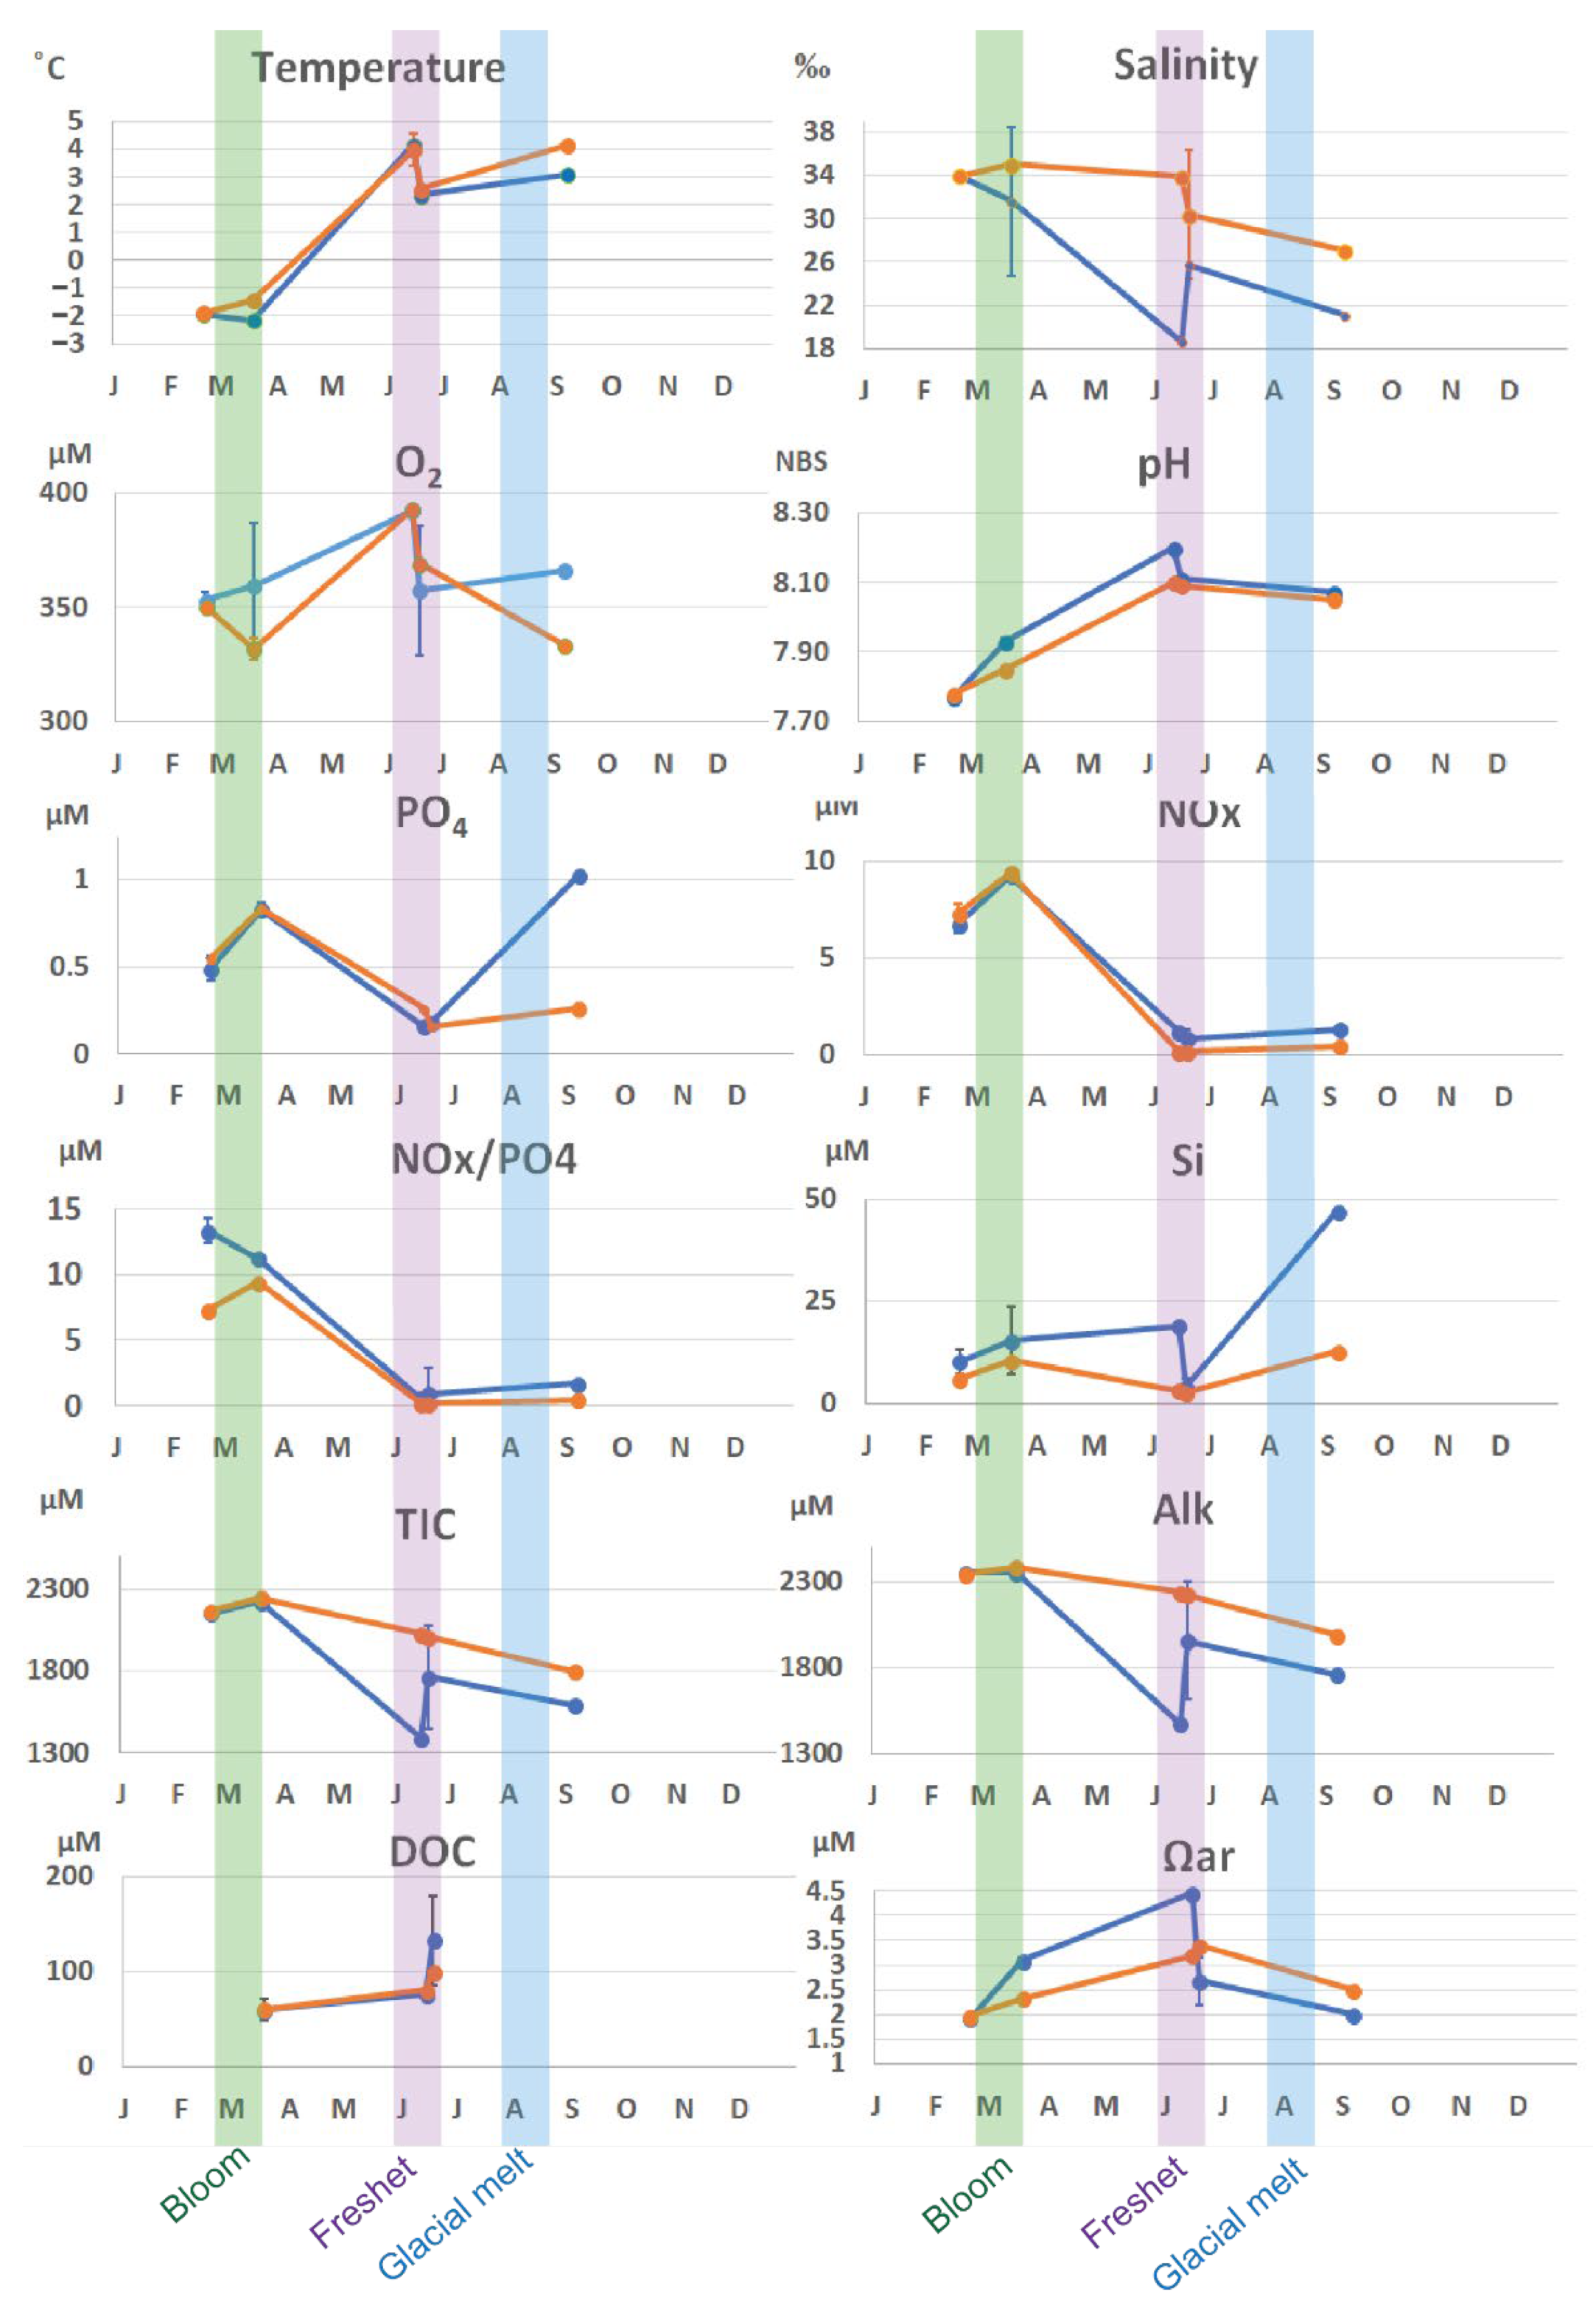
4.1. Seasonality
4.2. Near Glacier vs. Outer Fjord
4.3. River Plume
4.4. Future Projections
5. Conclusions
Author Contributions
Funding
Institutional Review Board Statement
Informed Consent Statement
Data Availability Statement
Acknowledgments
Conflicts of Interest
Appendix A
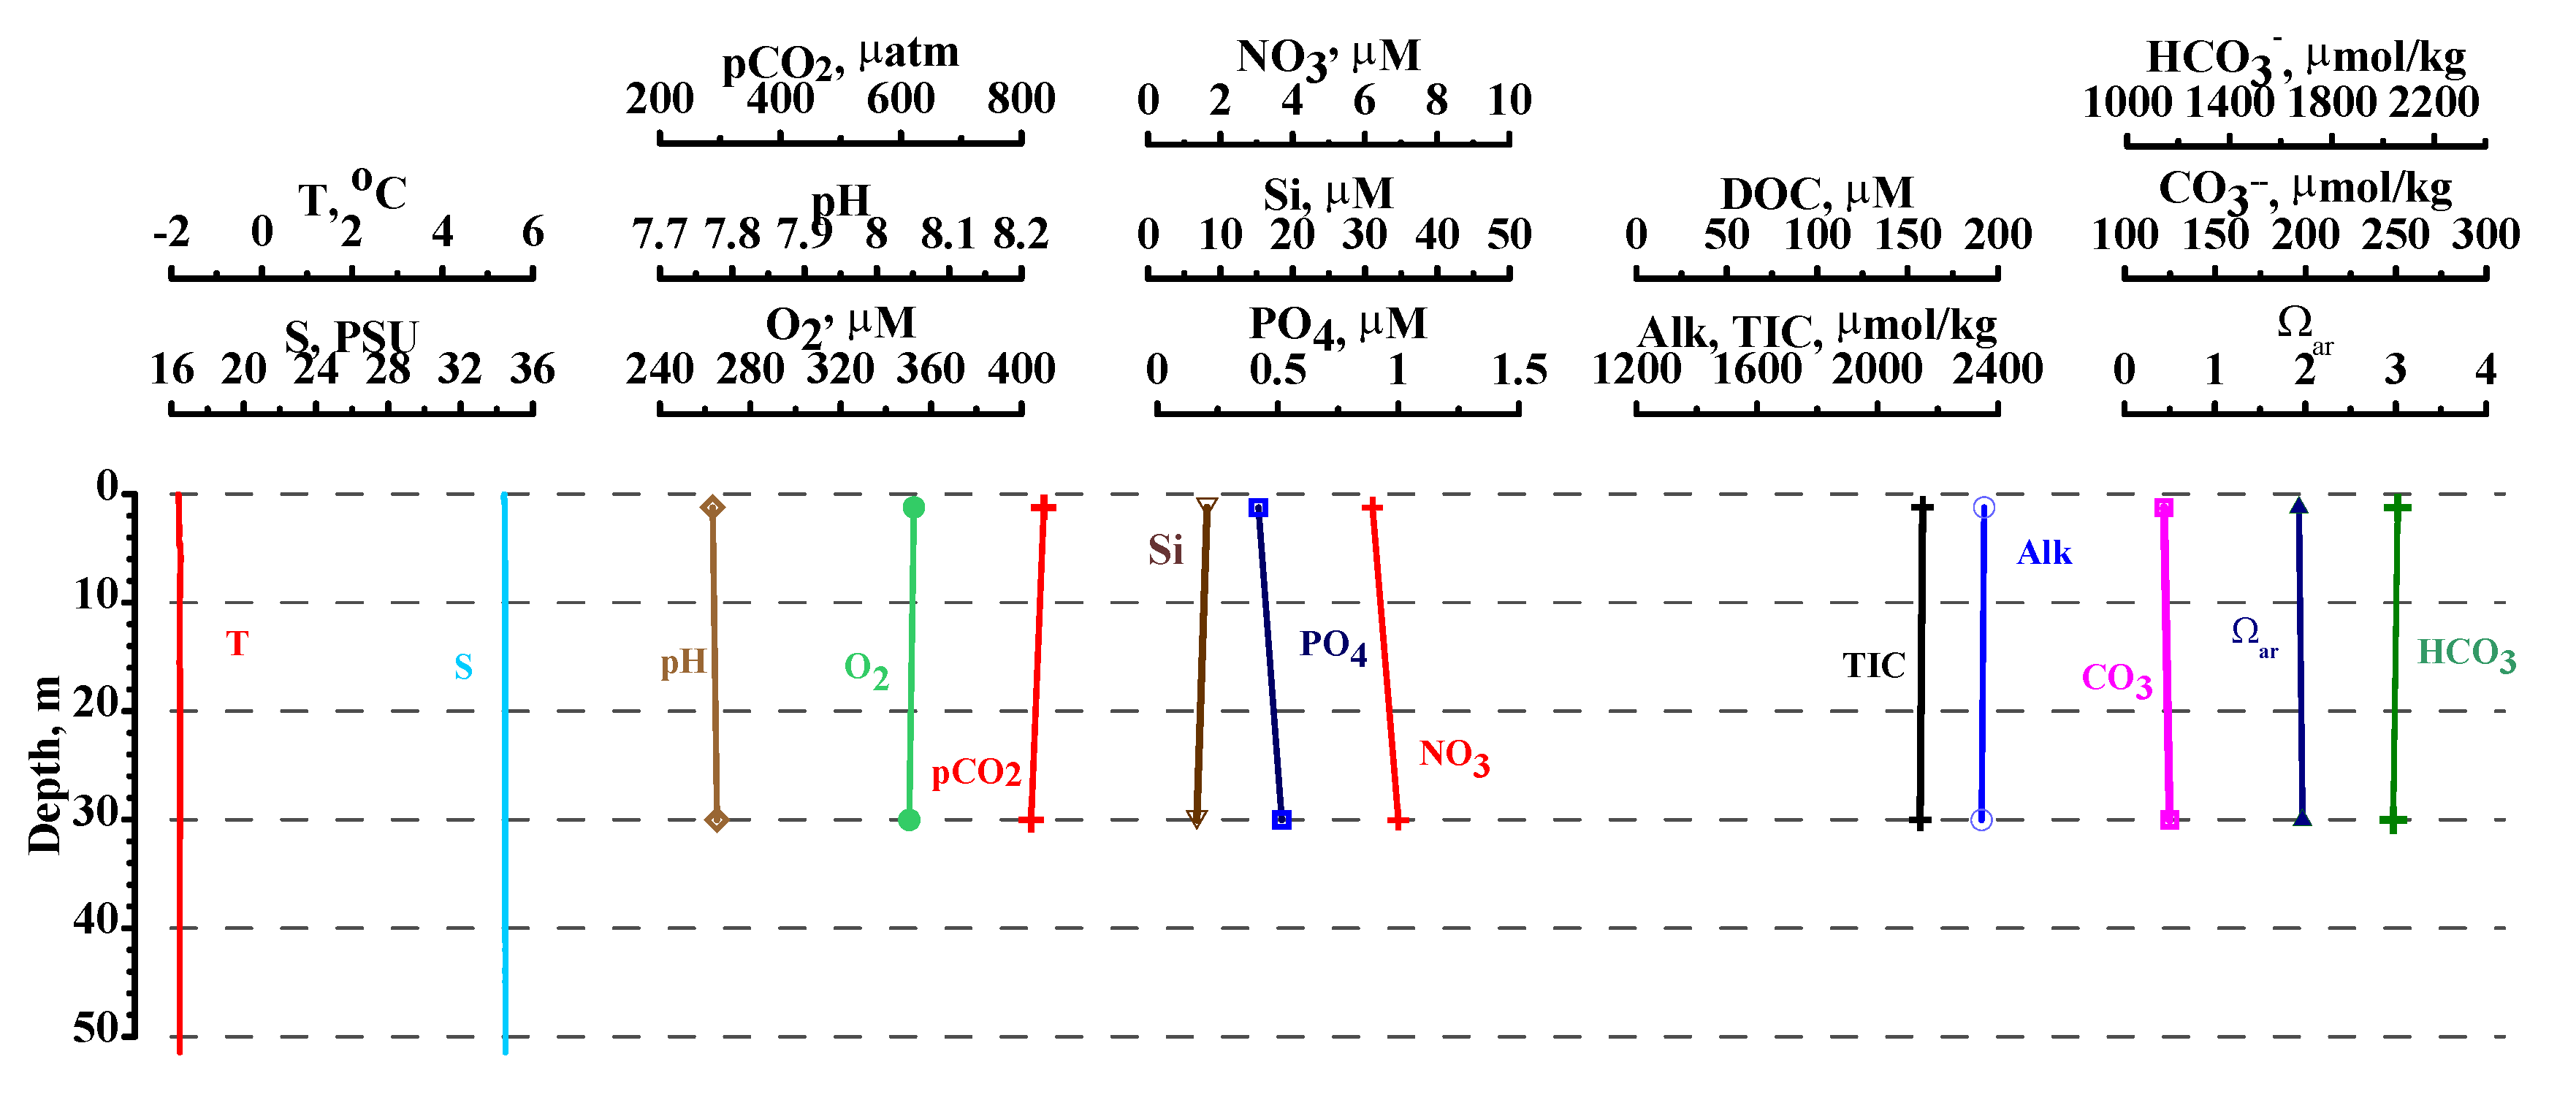
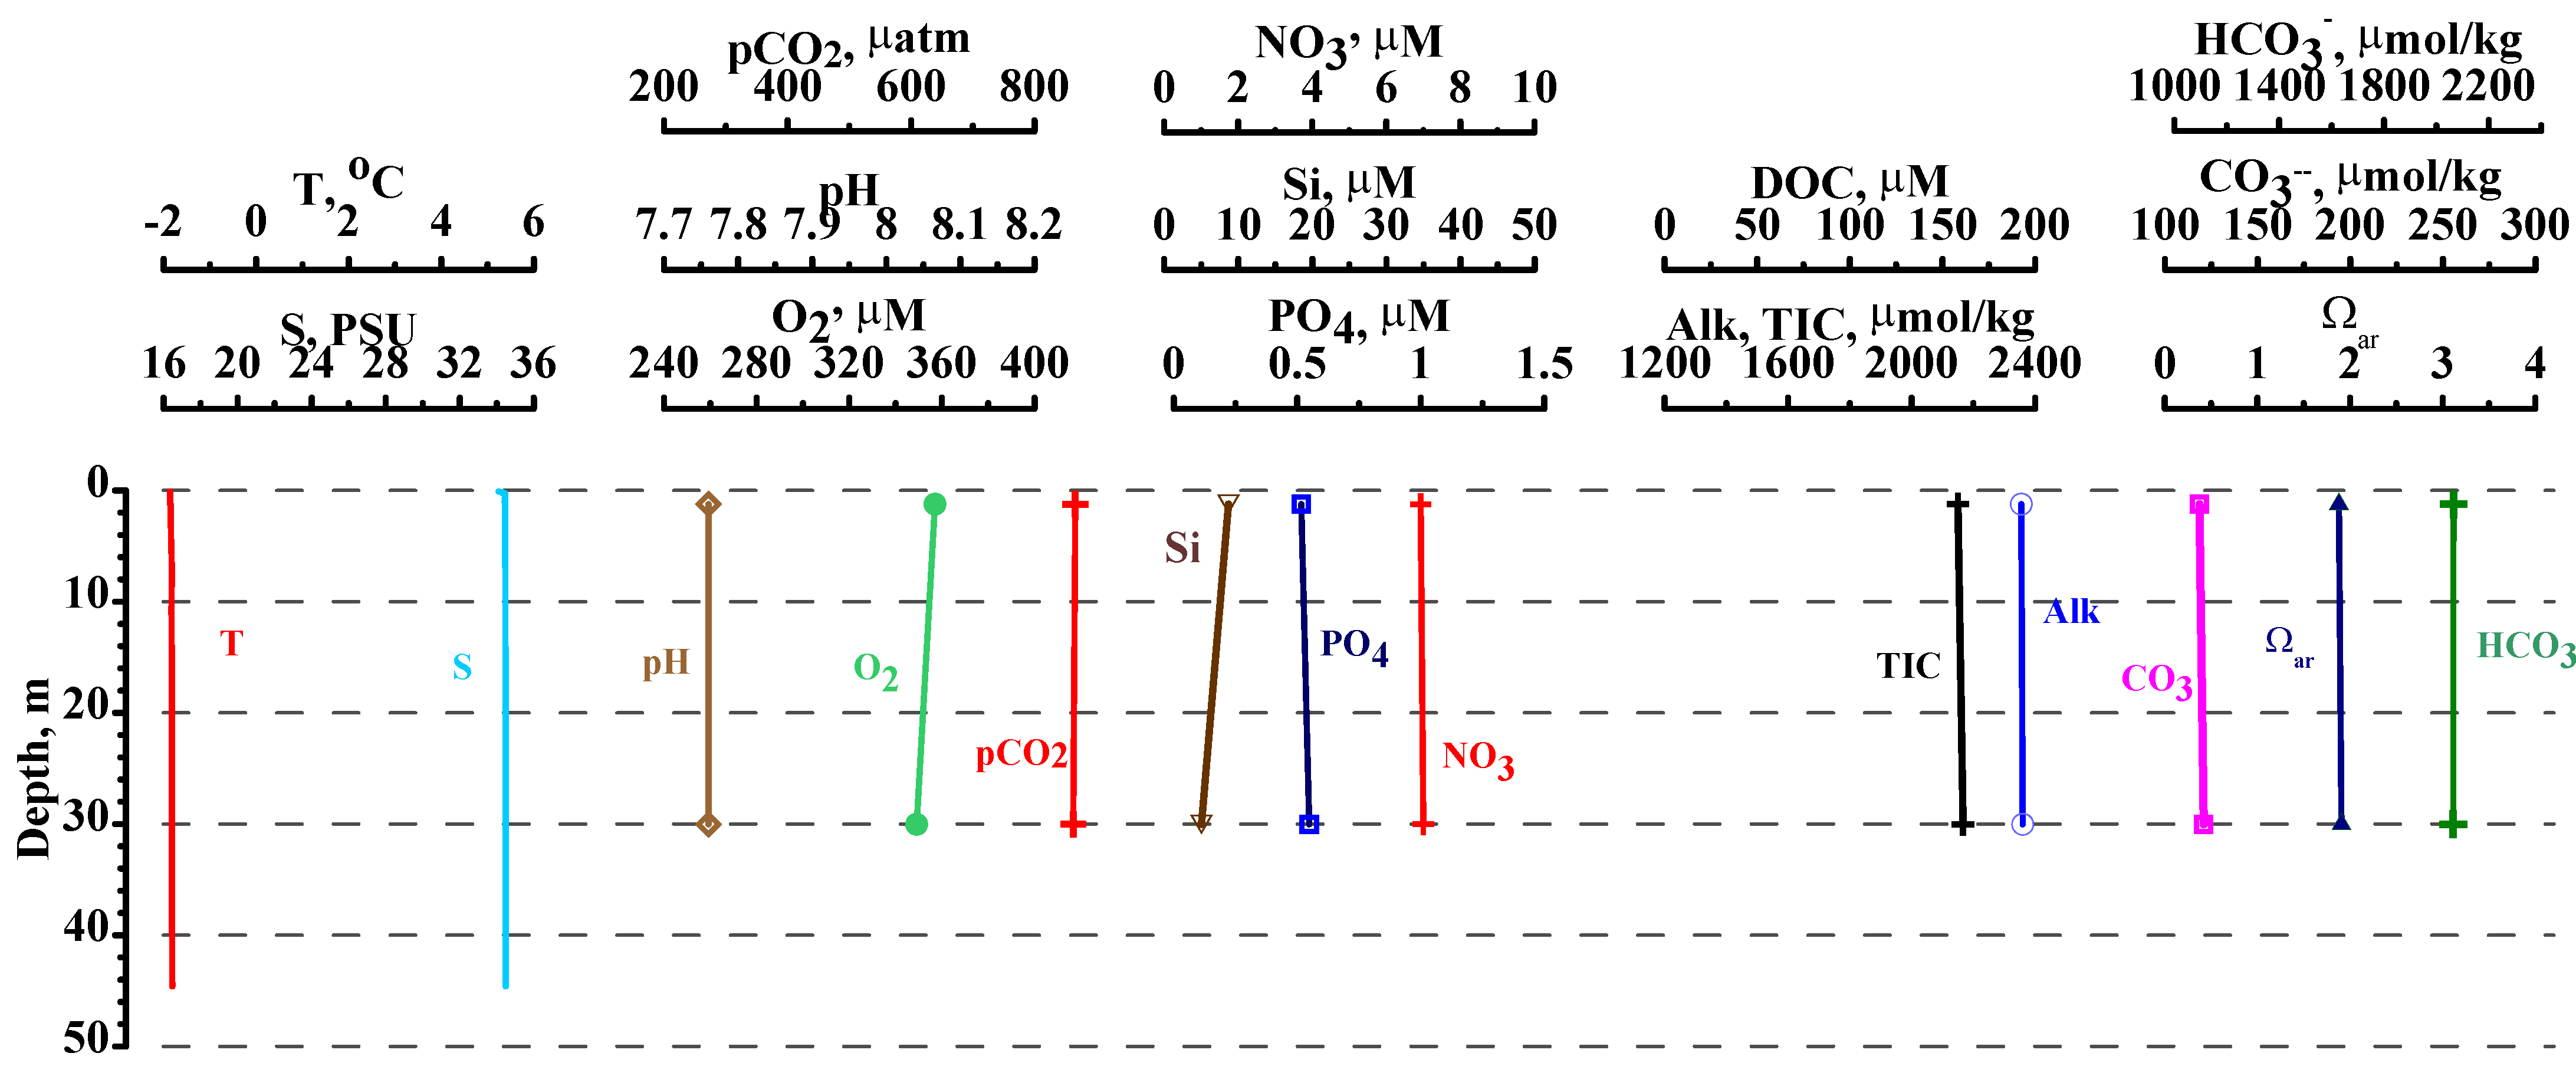
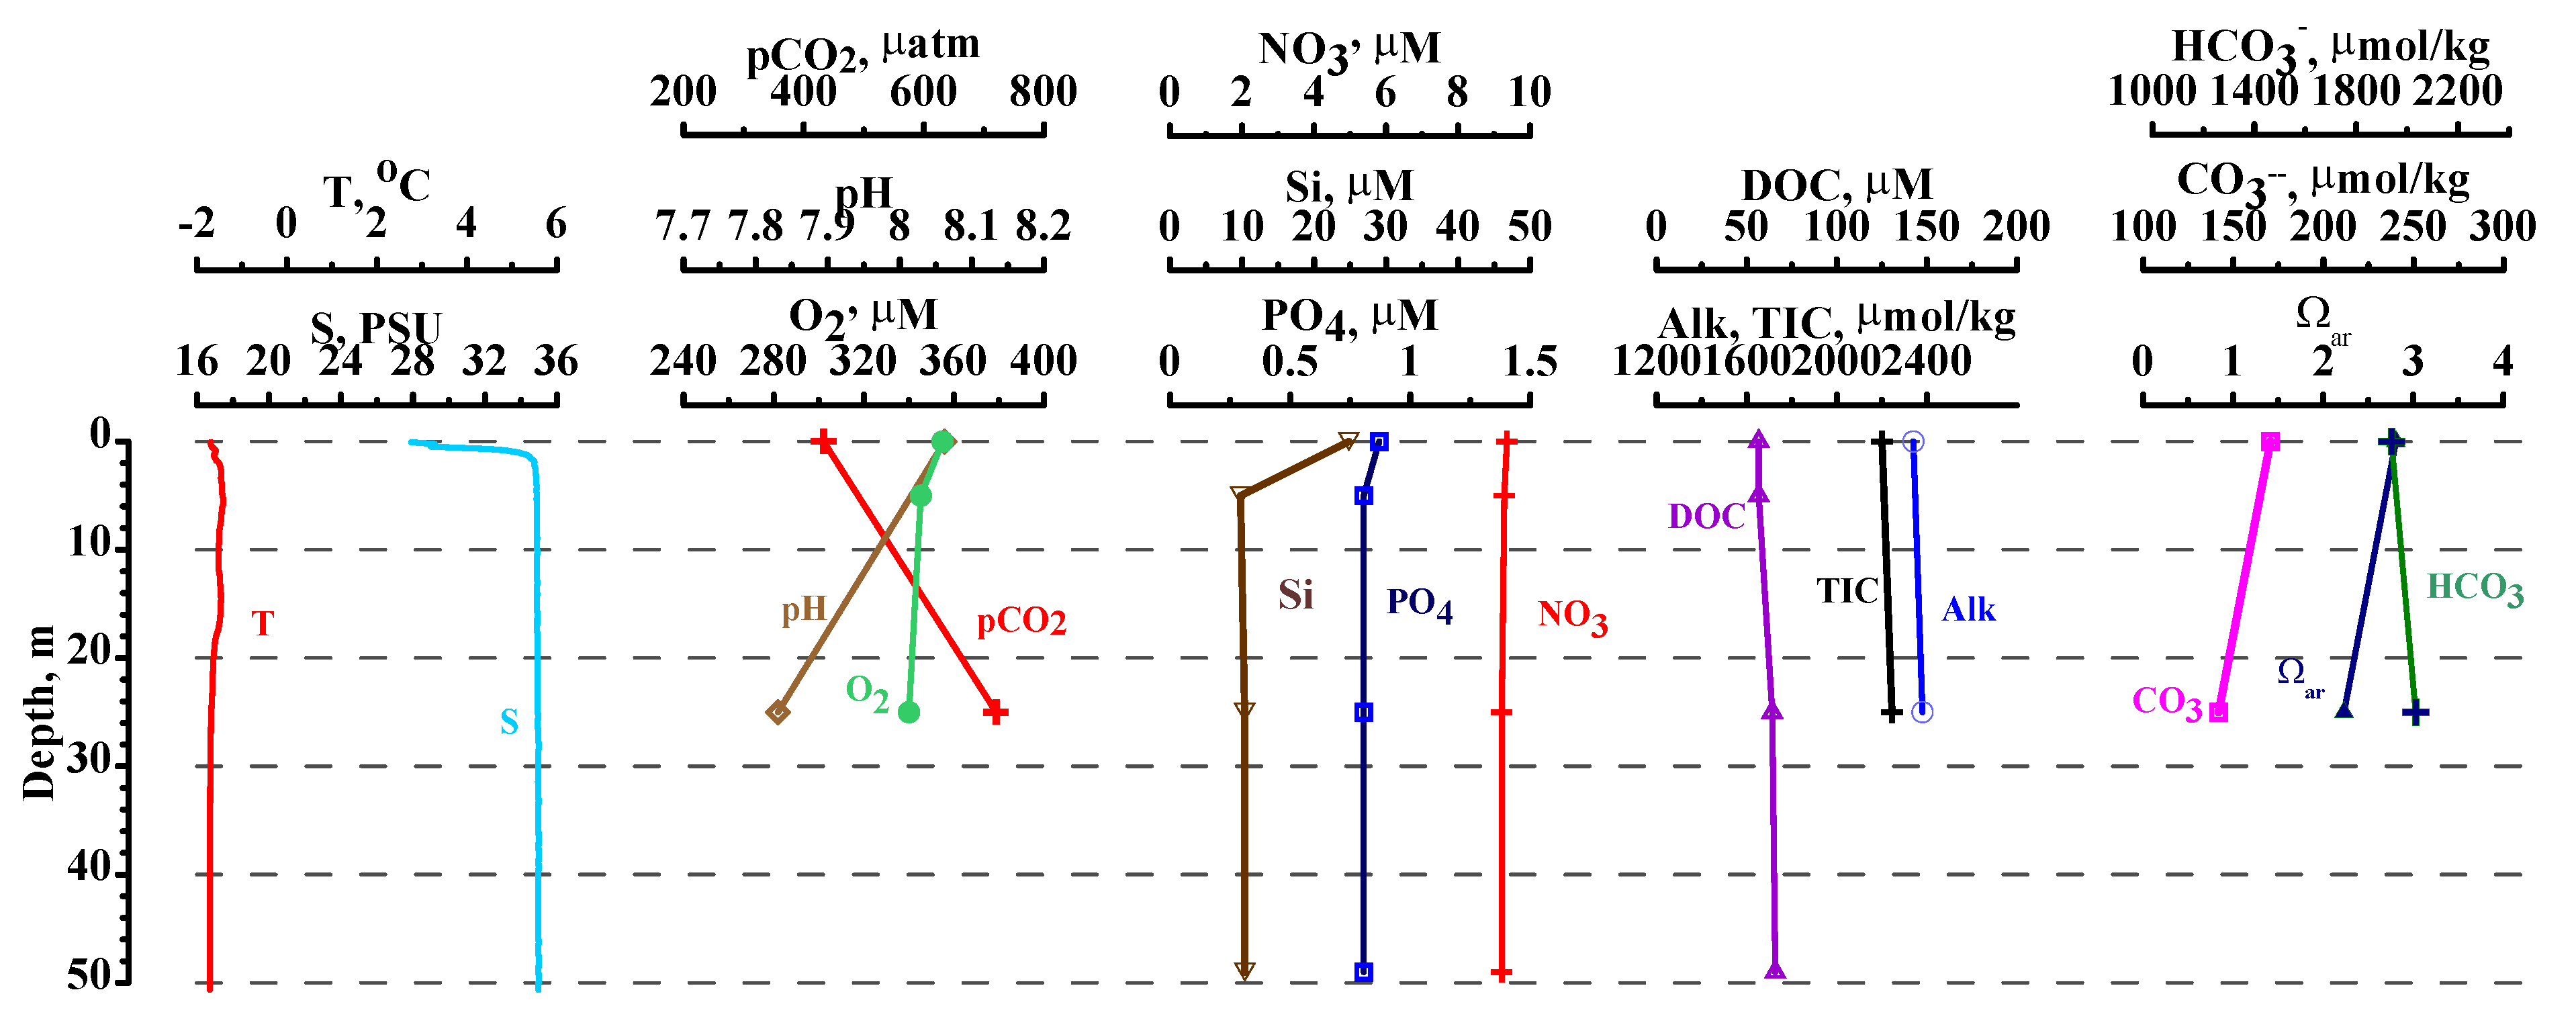
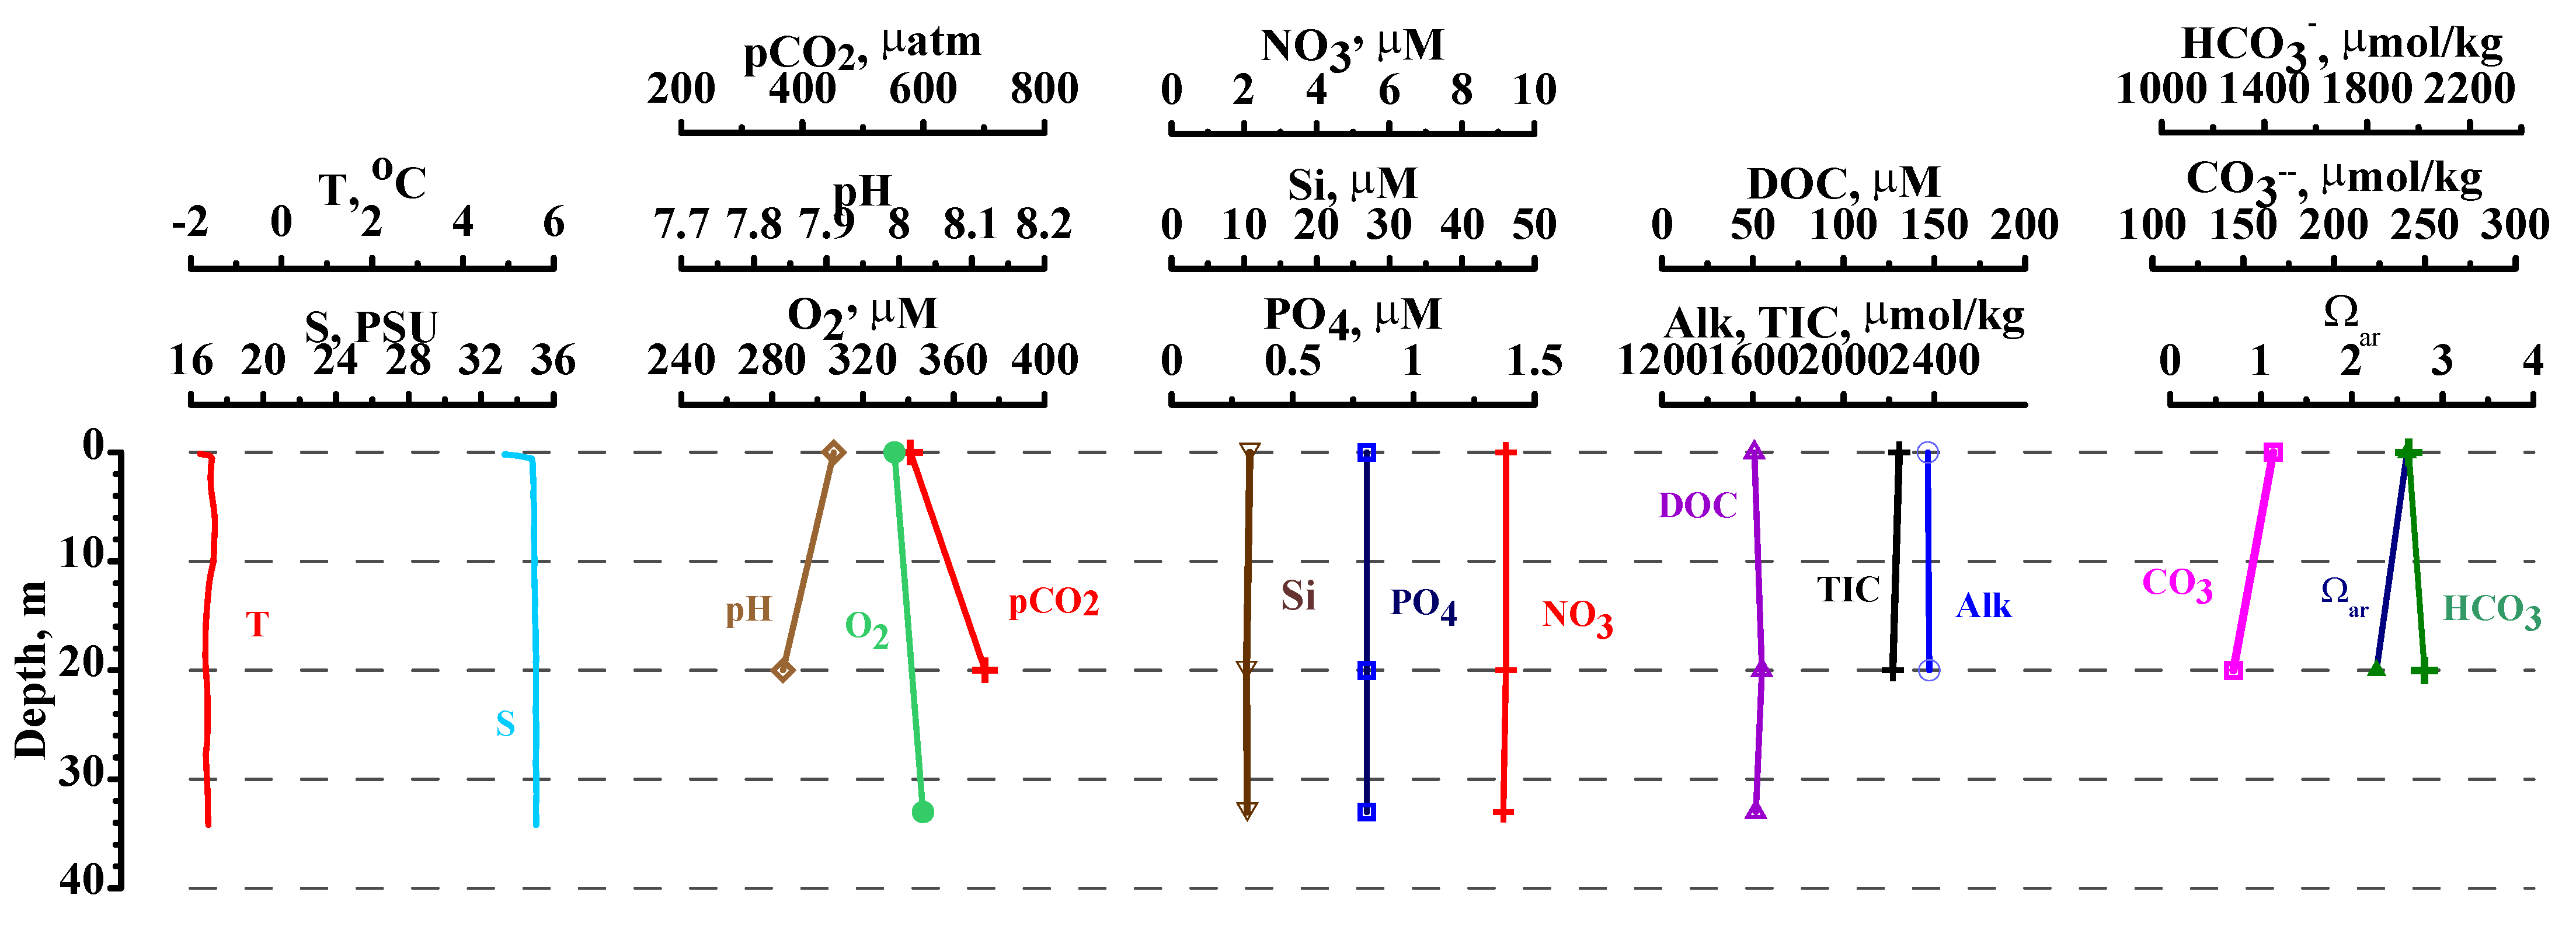
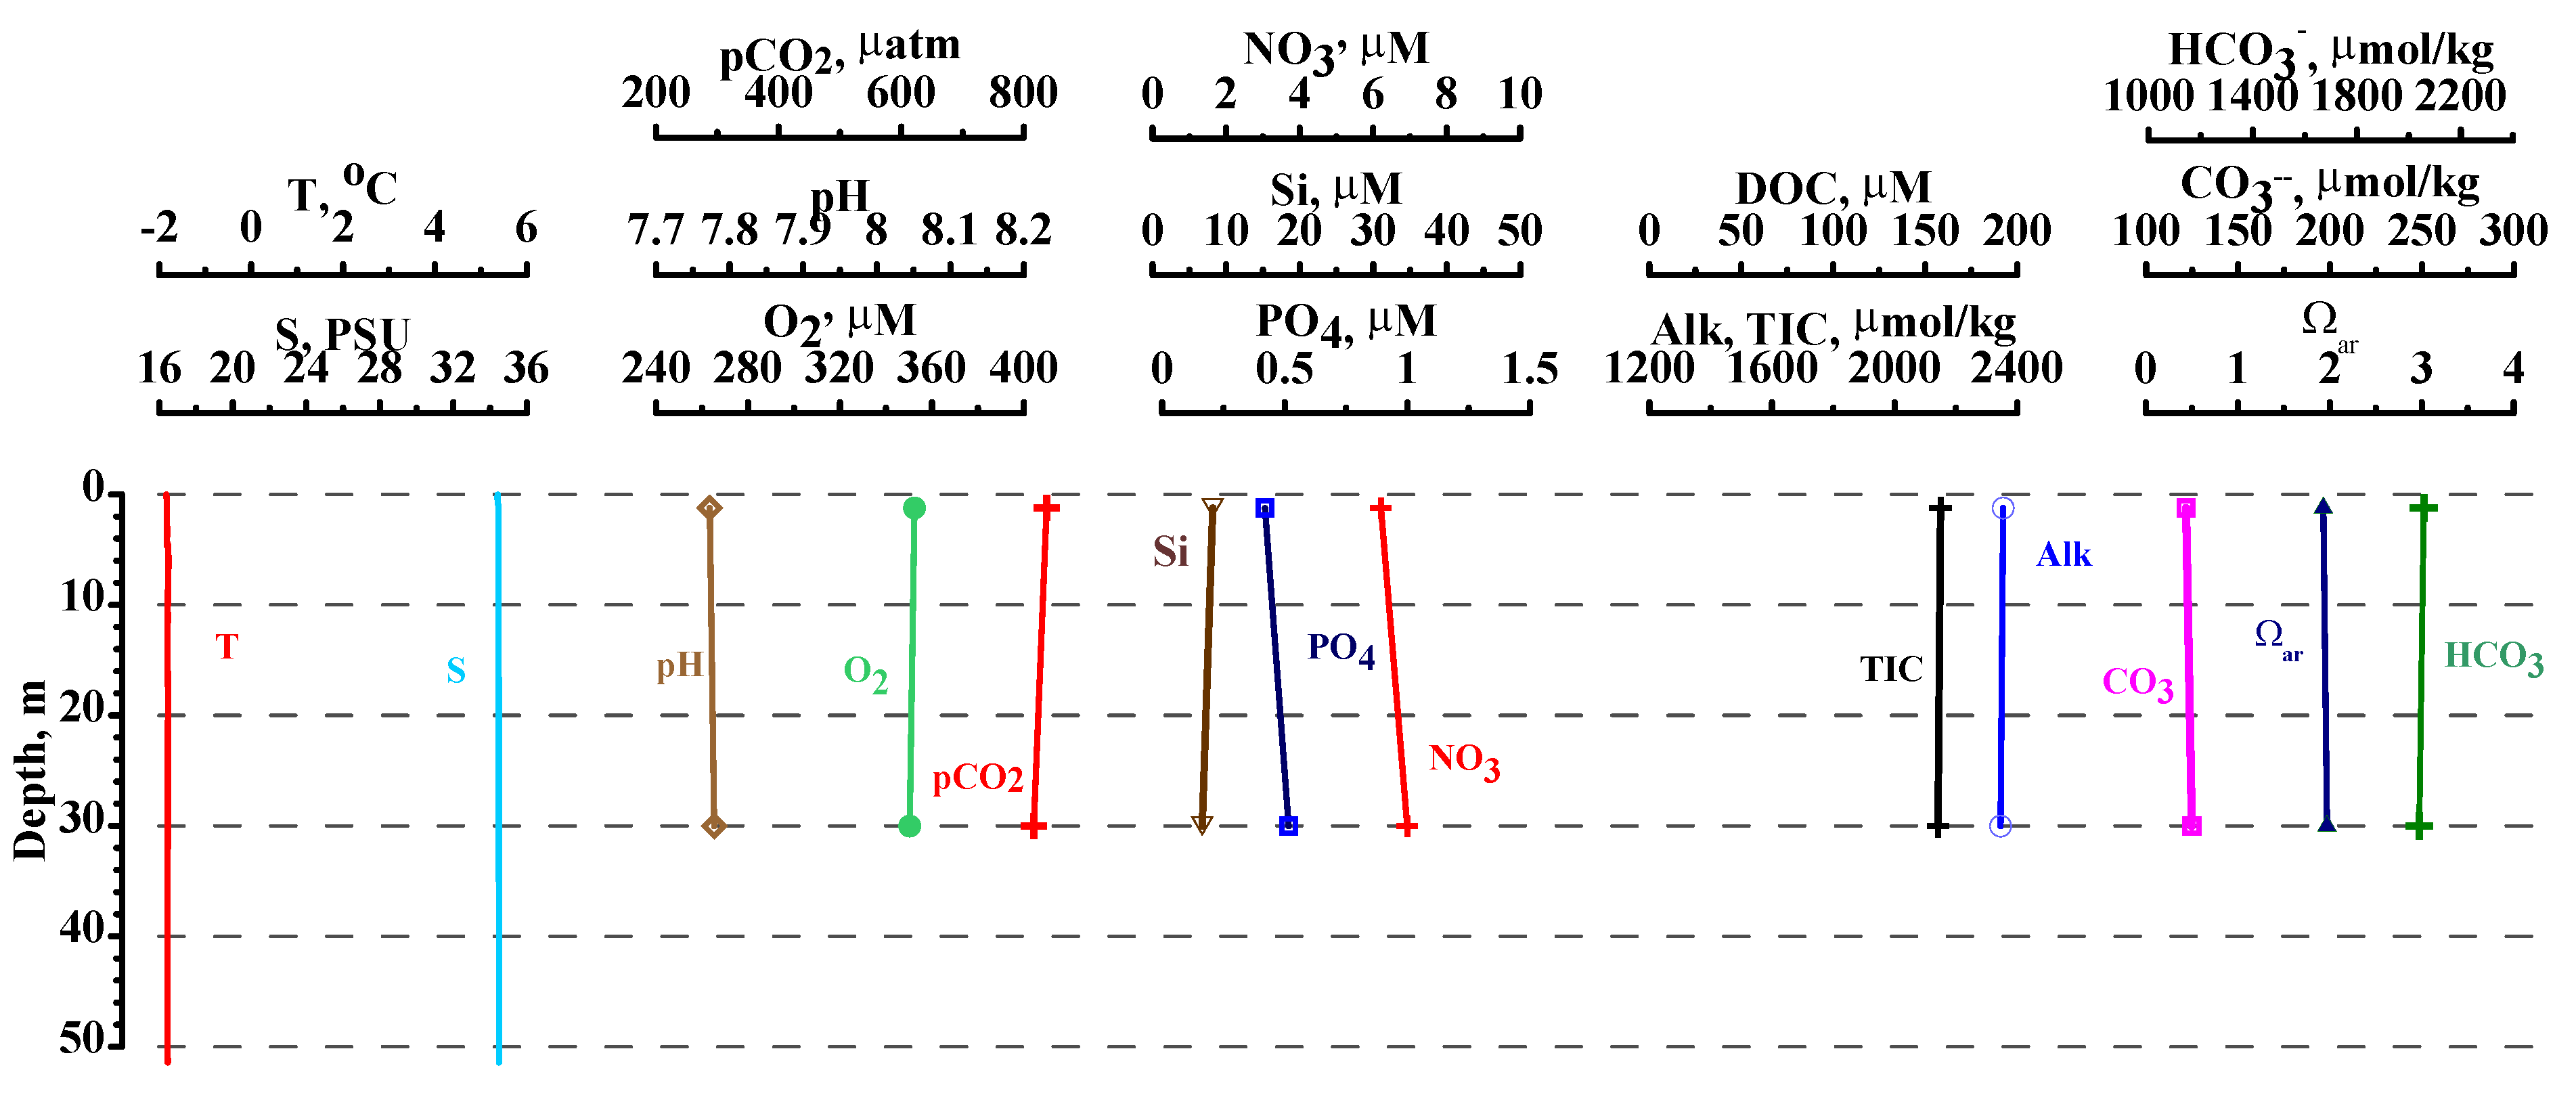
Appendix A.1. Vertical Distributions of the Studied Parameters at the Sampled Stations
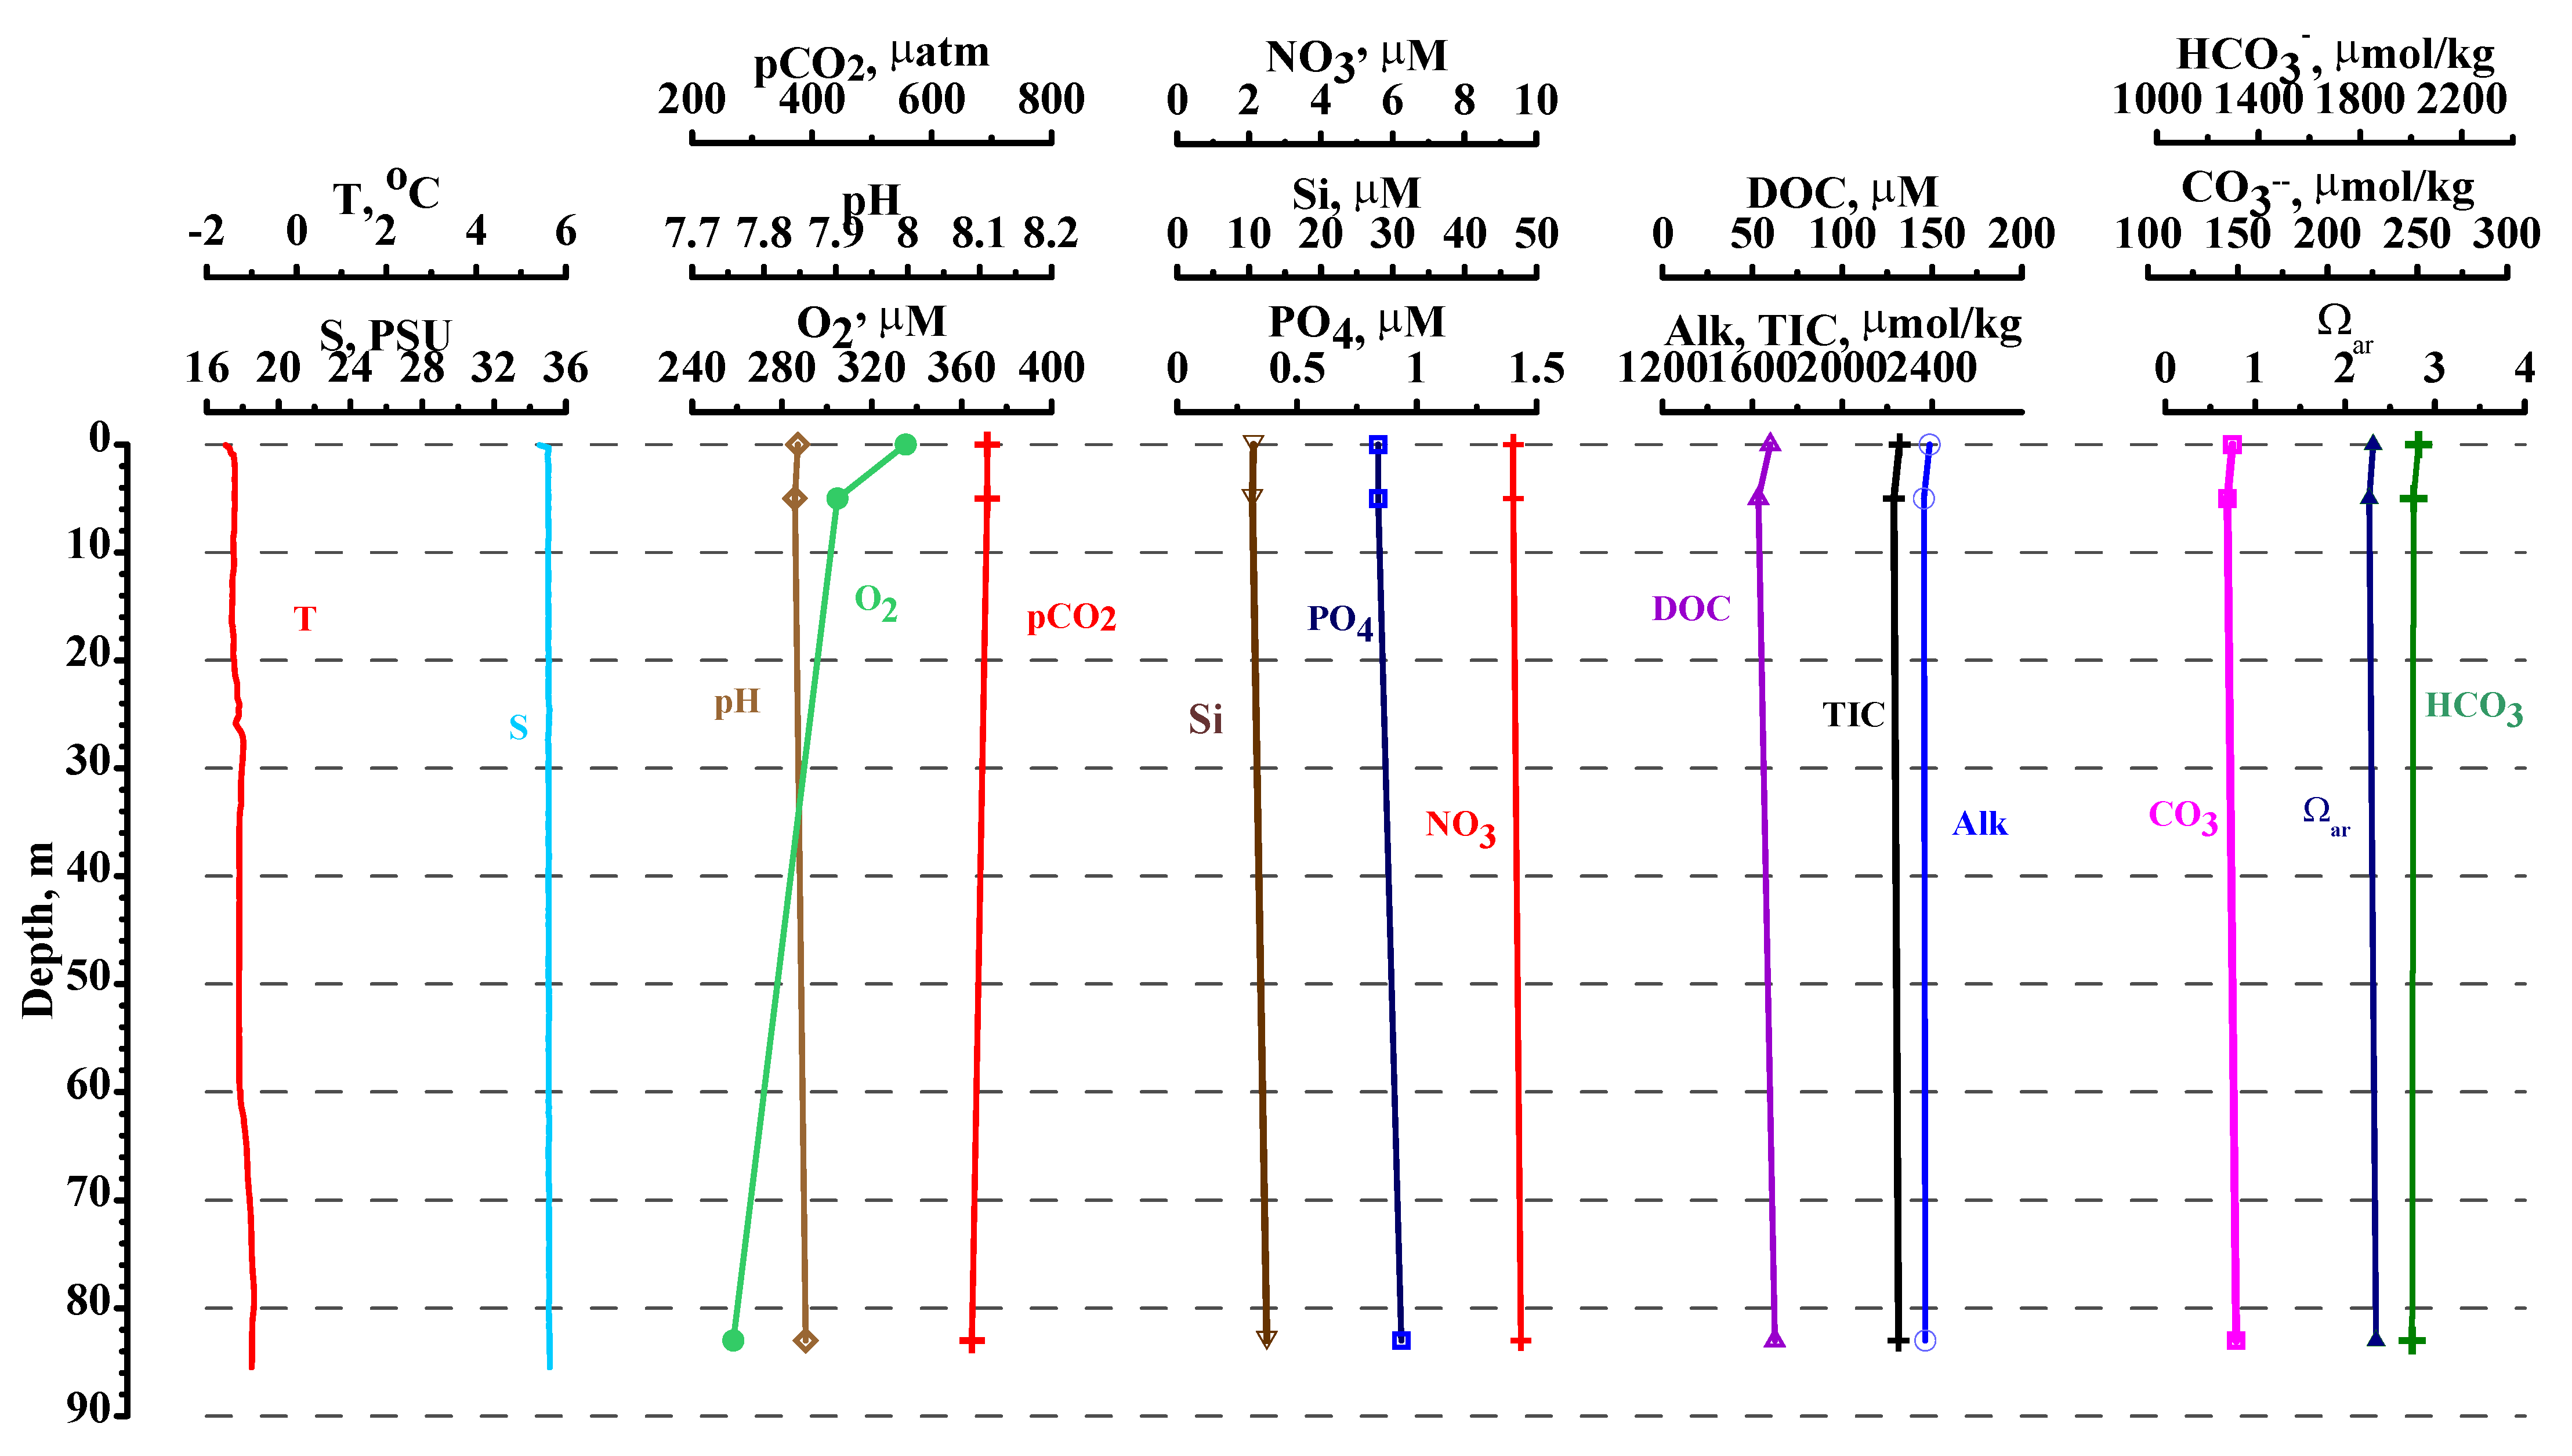
Appendix A.1.1. Winter expedition, February 2011


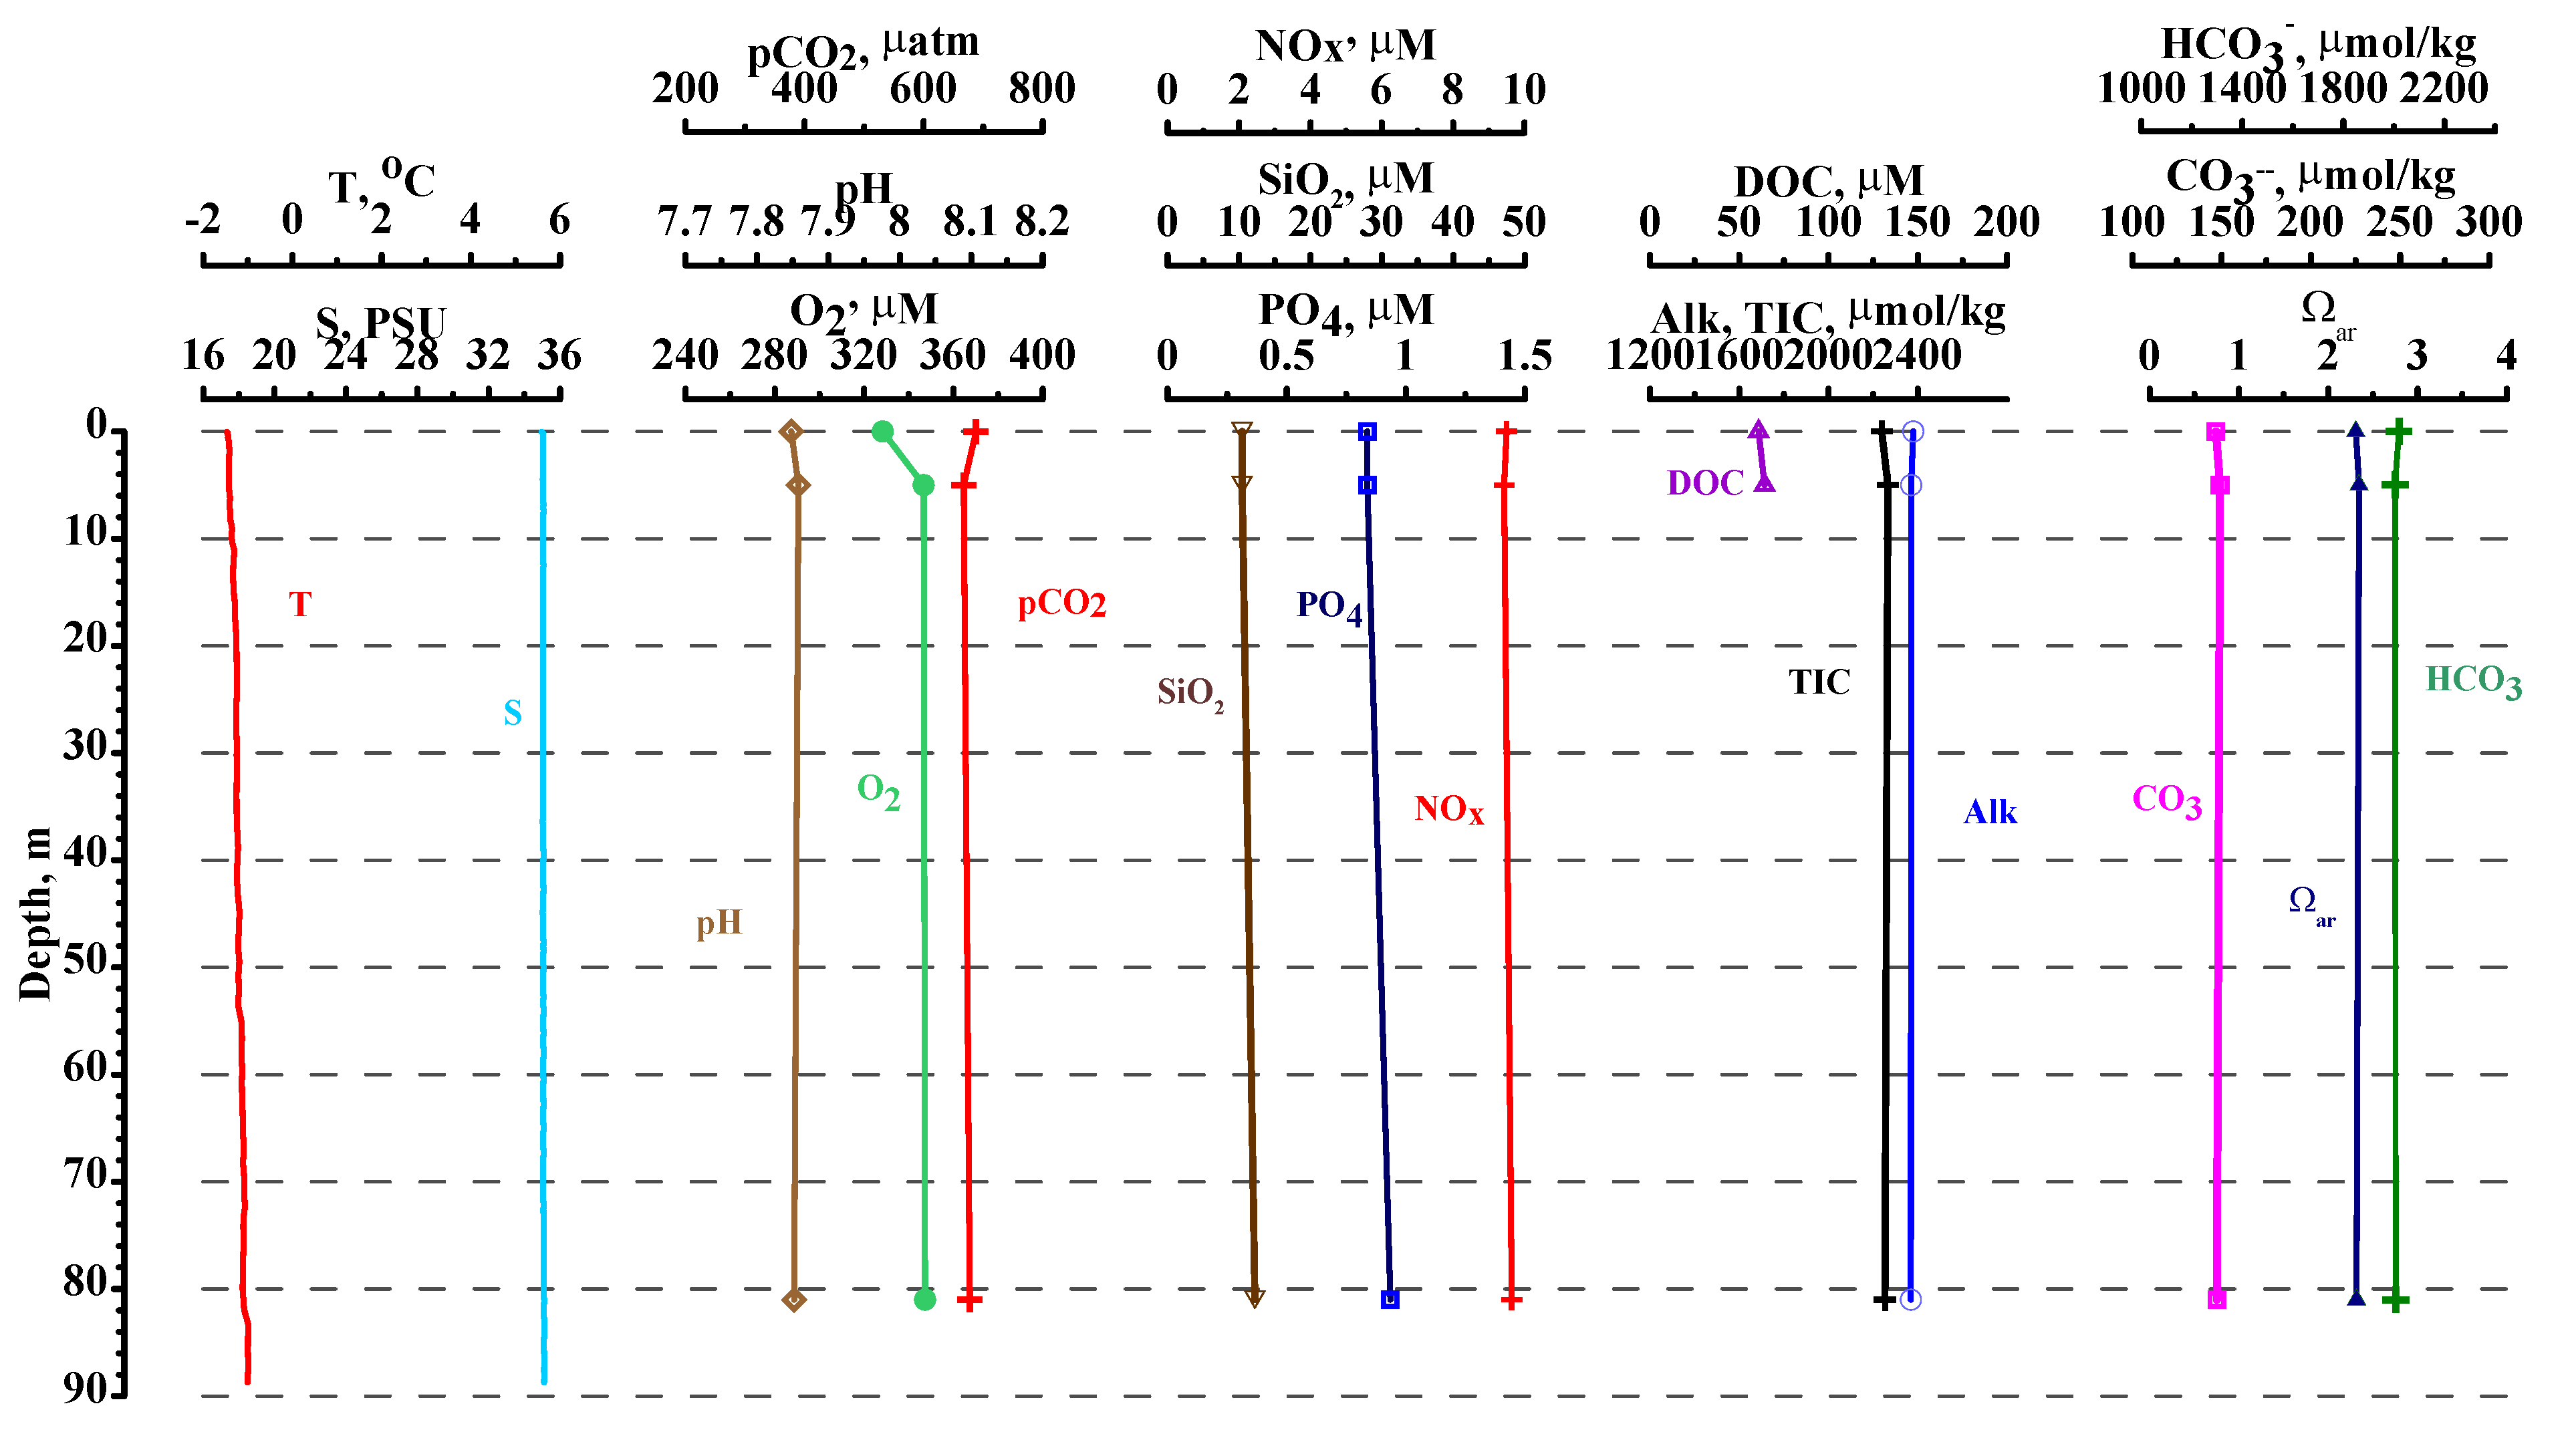
Appendix A.1.2. Winter expedition, March 2014


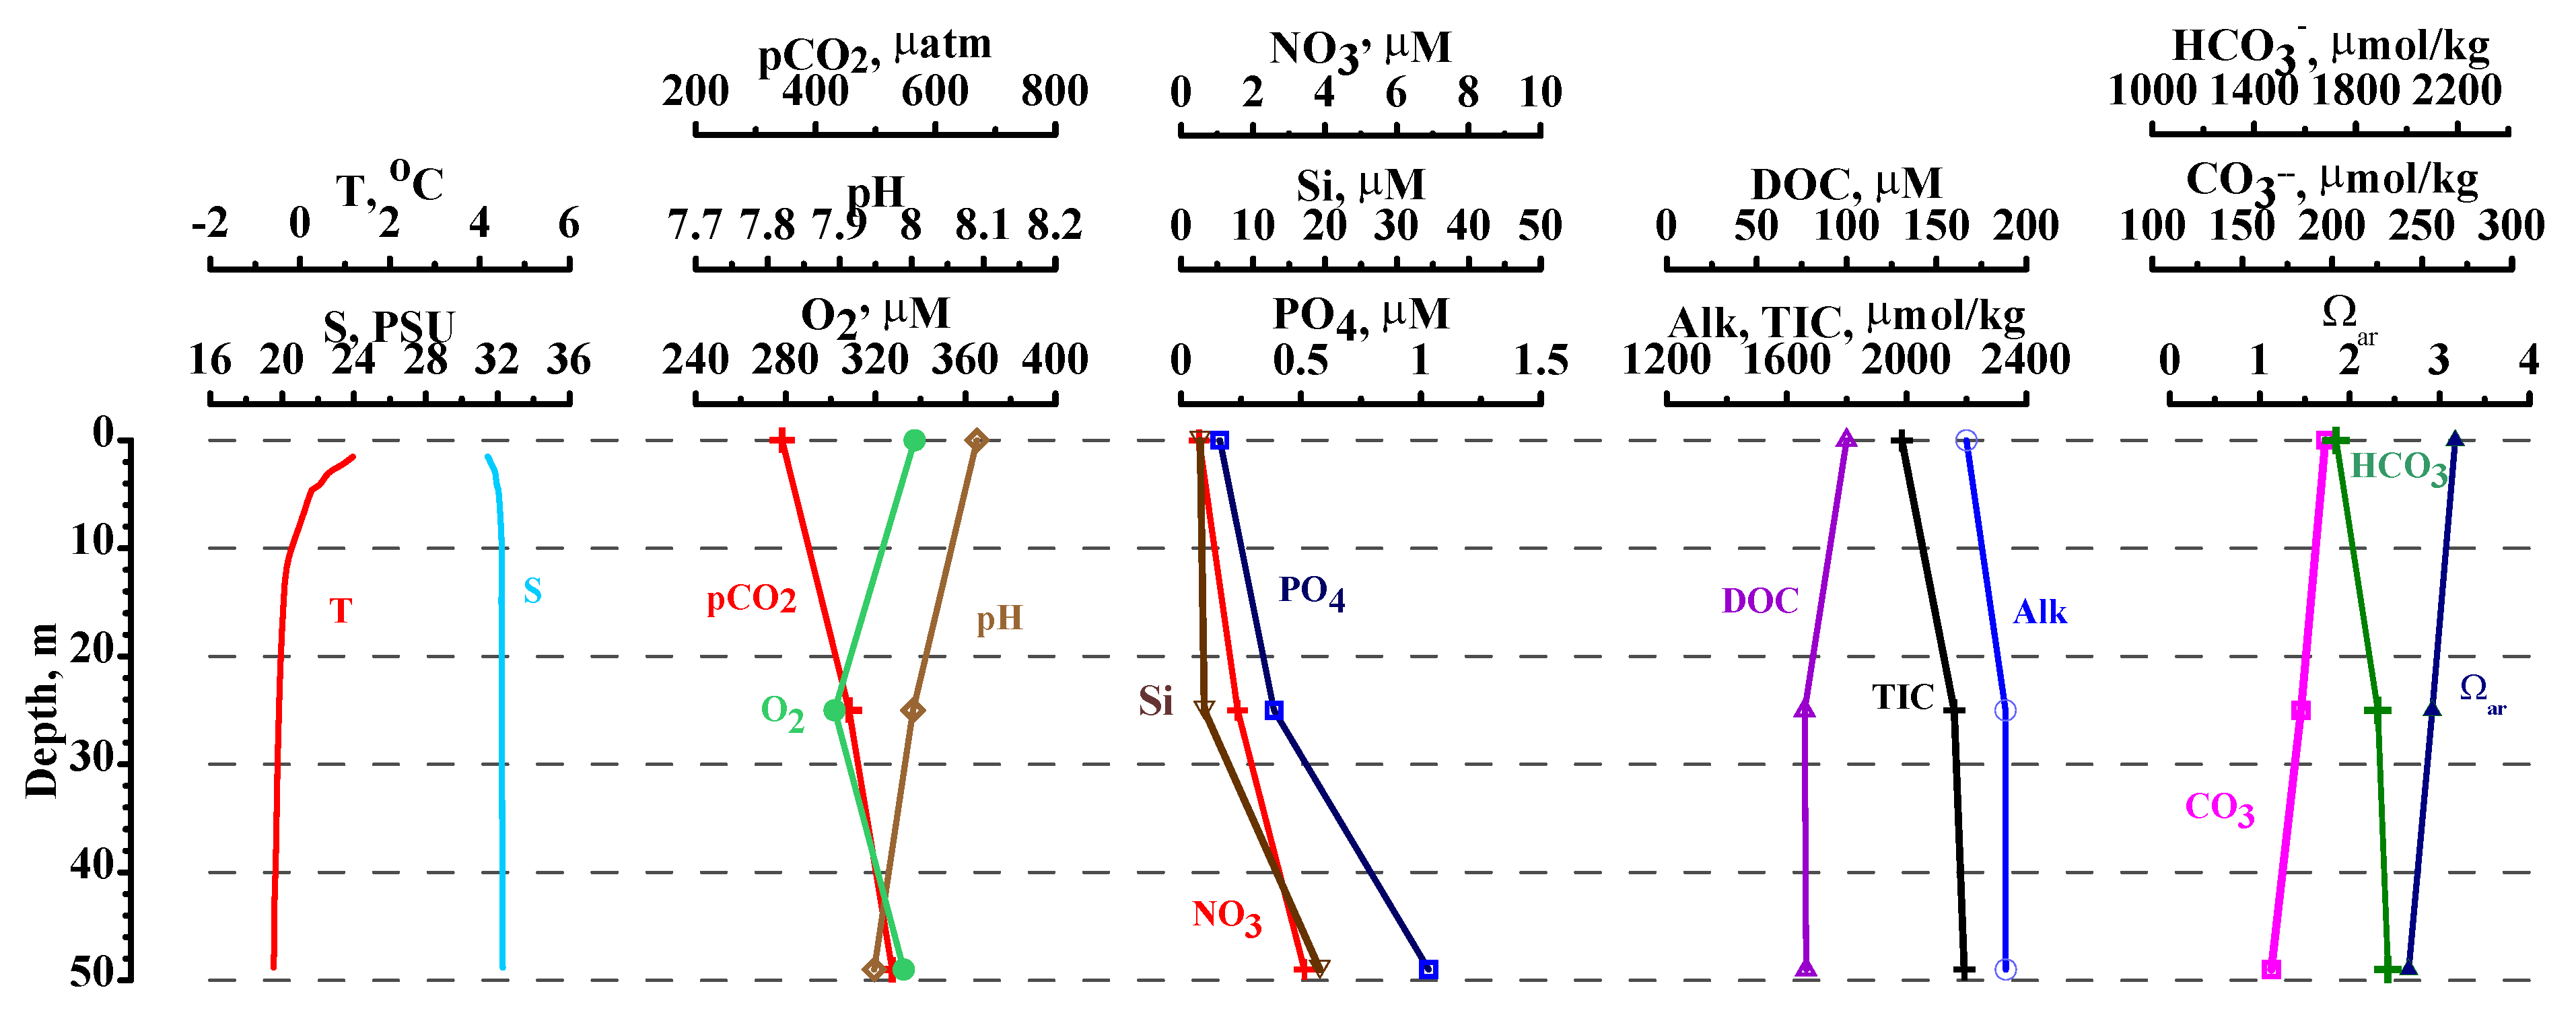
Appendix A.1.3. Summer expedition, June 2015

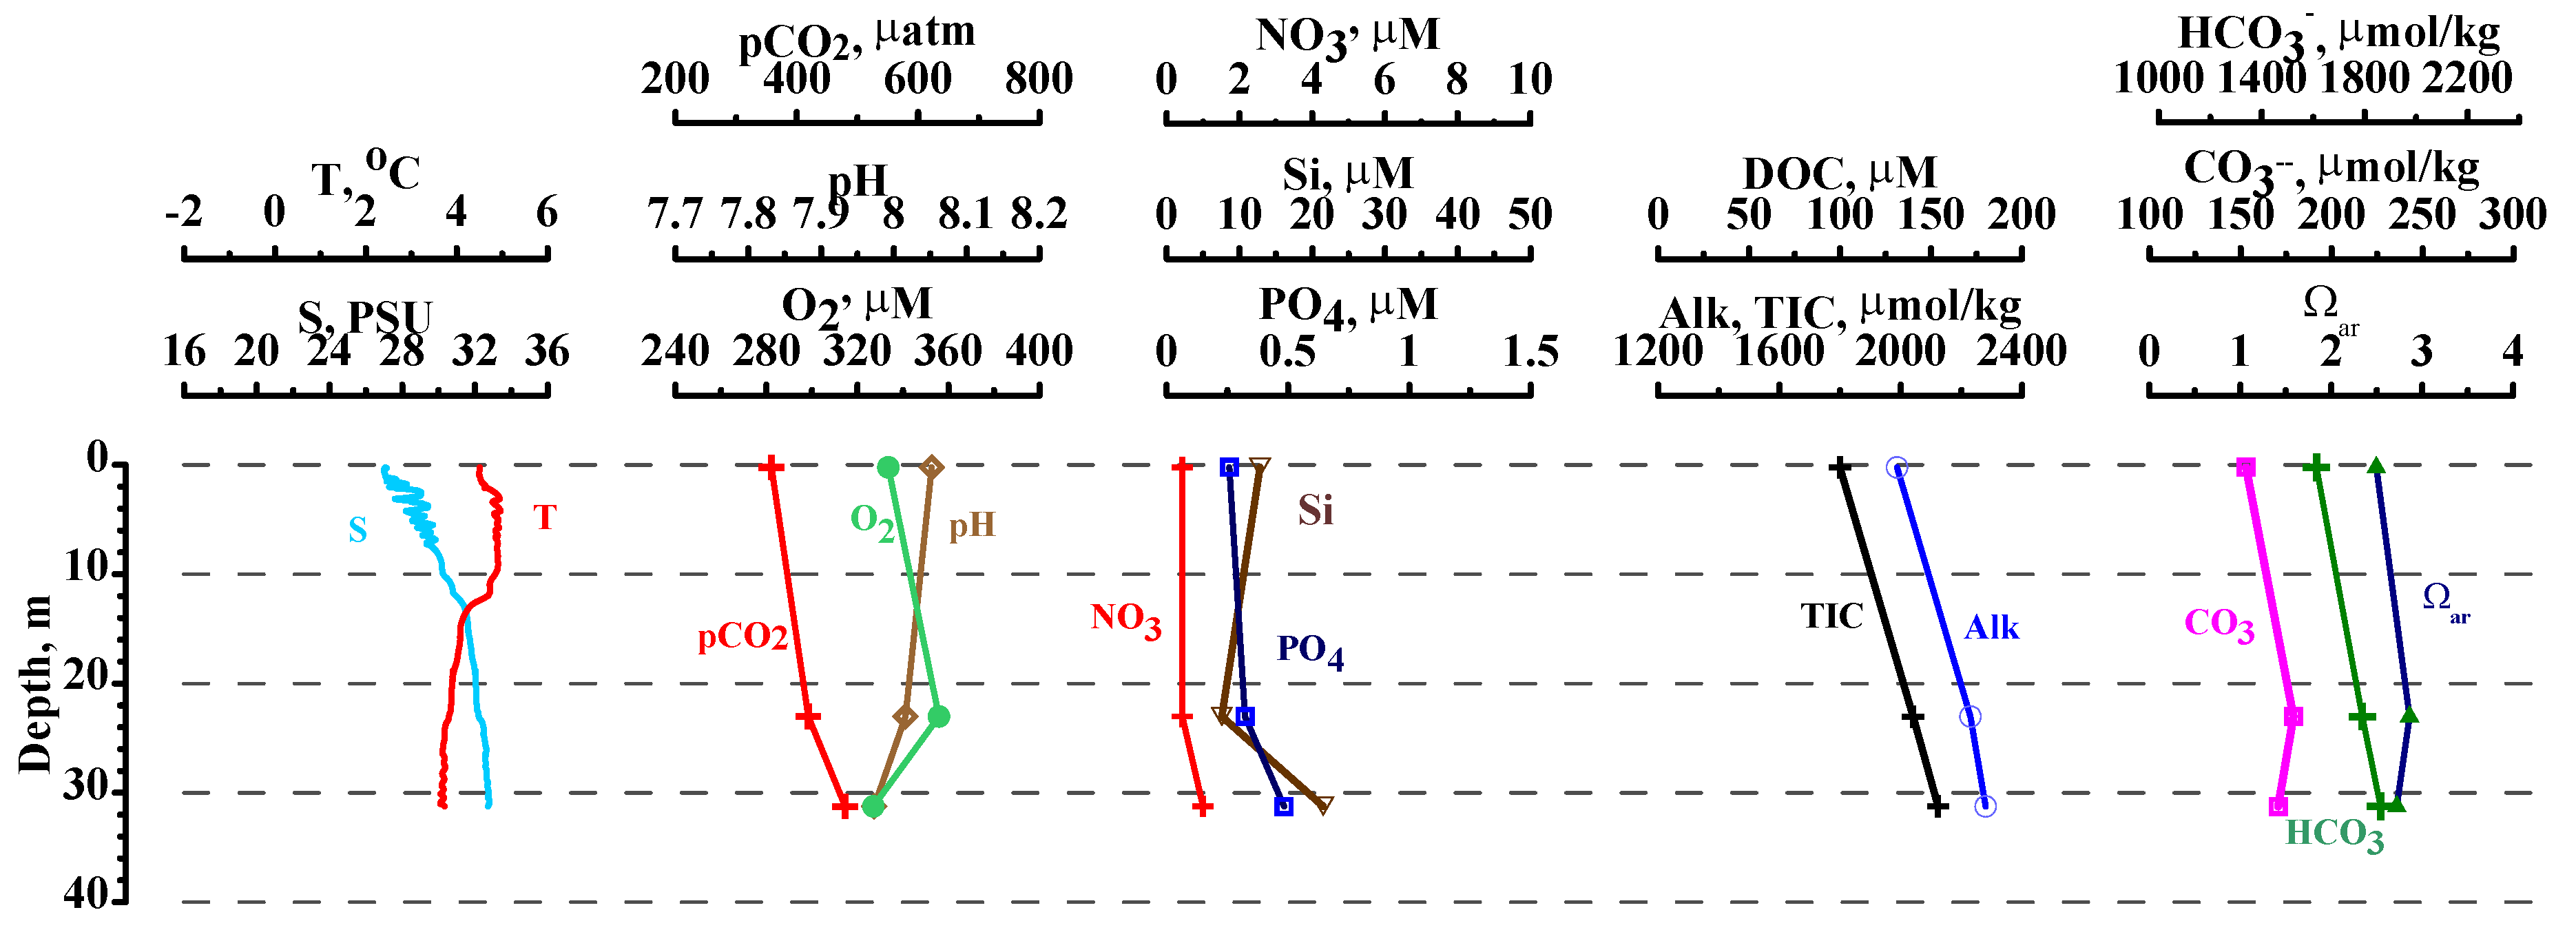
Appendix A.1.4. Summer expedition, September 2011


| Site # | Layer cm | Temp. °C | Alk µM | PO4 µM | Si µM | NO3 + NO2 µM | DIC µM | DOC µM | Hg Total ng/L | MeHg ng/L |
|---|---|---|---|---|---|---|---|---|---|---|
| TM-1 | ||||||||||
| 0–18 | −3.23 | 503.7 | 0.26 | 12.5 | 2.2 | 383.33 | 59.17 | 0.8 | 0.01 | |
| 18–36 | −1.67 | 374.1 | 0.23 | 9.7 | 1.5 | 286.67 | 65 | |||
| 36–52 | −1.24 | 378.9 | 0.26 | 12.2 | 1.6 | 280 | 60.83 | |||
| TM-2 | ||||||||||
| 0–10 | −3.85 | 259.1 | 0.13 | 4.4 | 0.8 | 154.17 | 31.67 | 0.7 | 0.01 | |
| 10–20 | −2.11 | 338.5 | 0.16 | 4.6 | 1.2 | 234.17 | 100 | |||
| 20–30 | −1.96 | 407.9 | 0.23 | 6.9 | 1.6 | 316.67 | 108.33 |
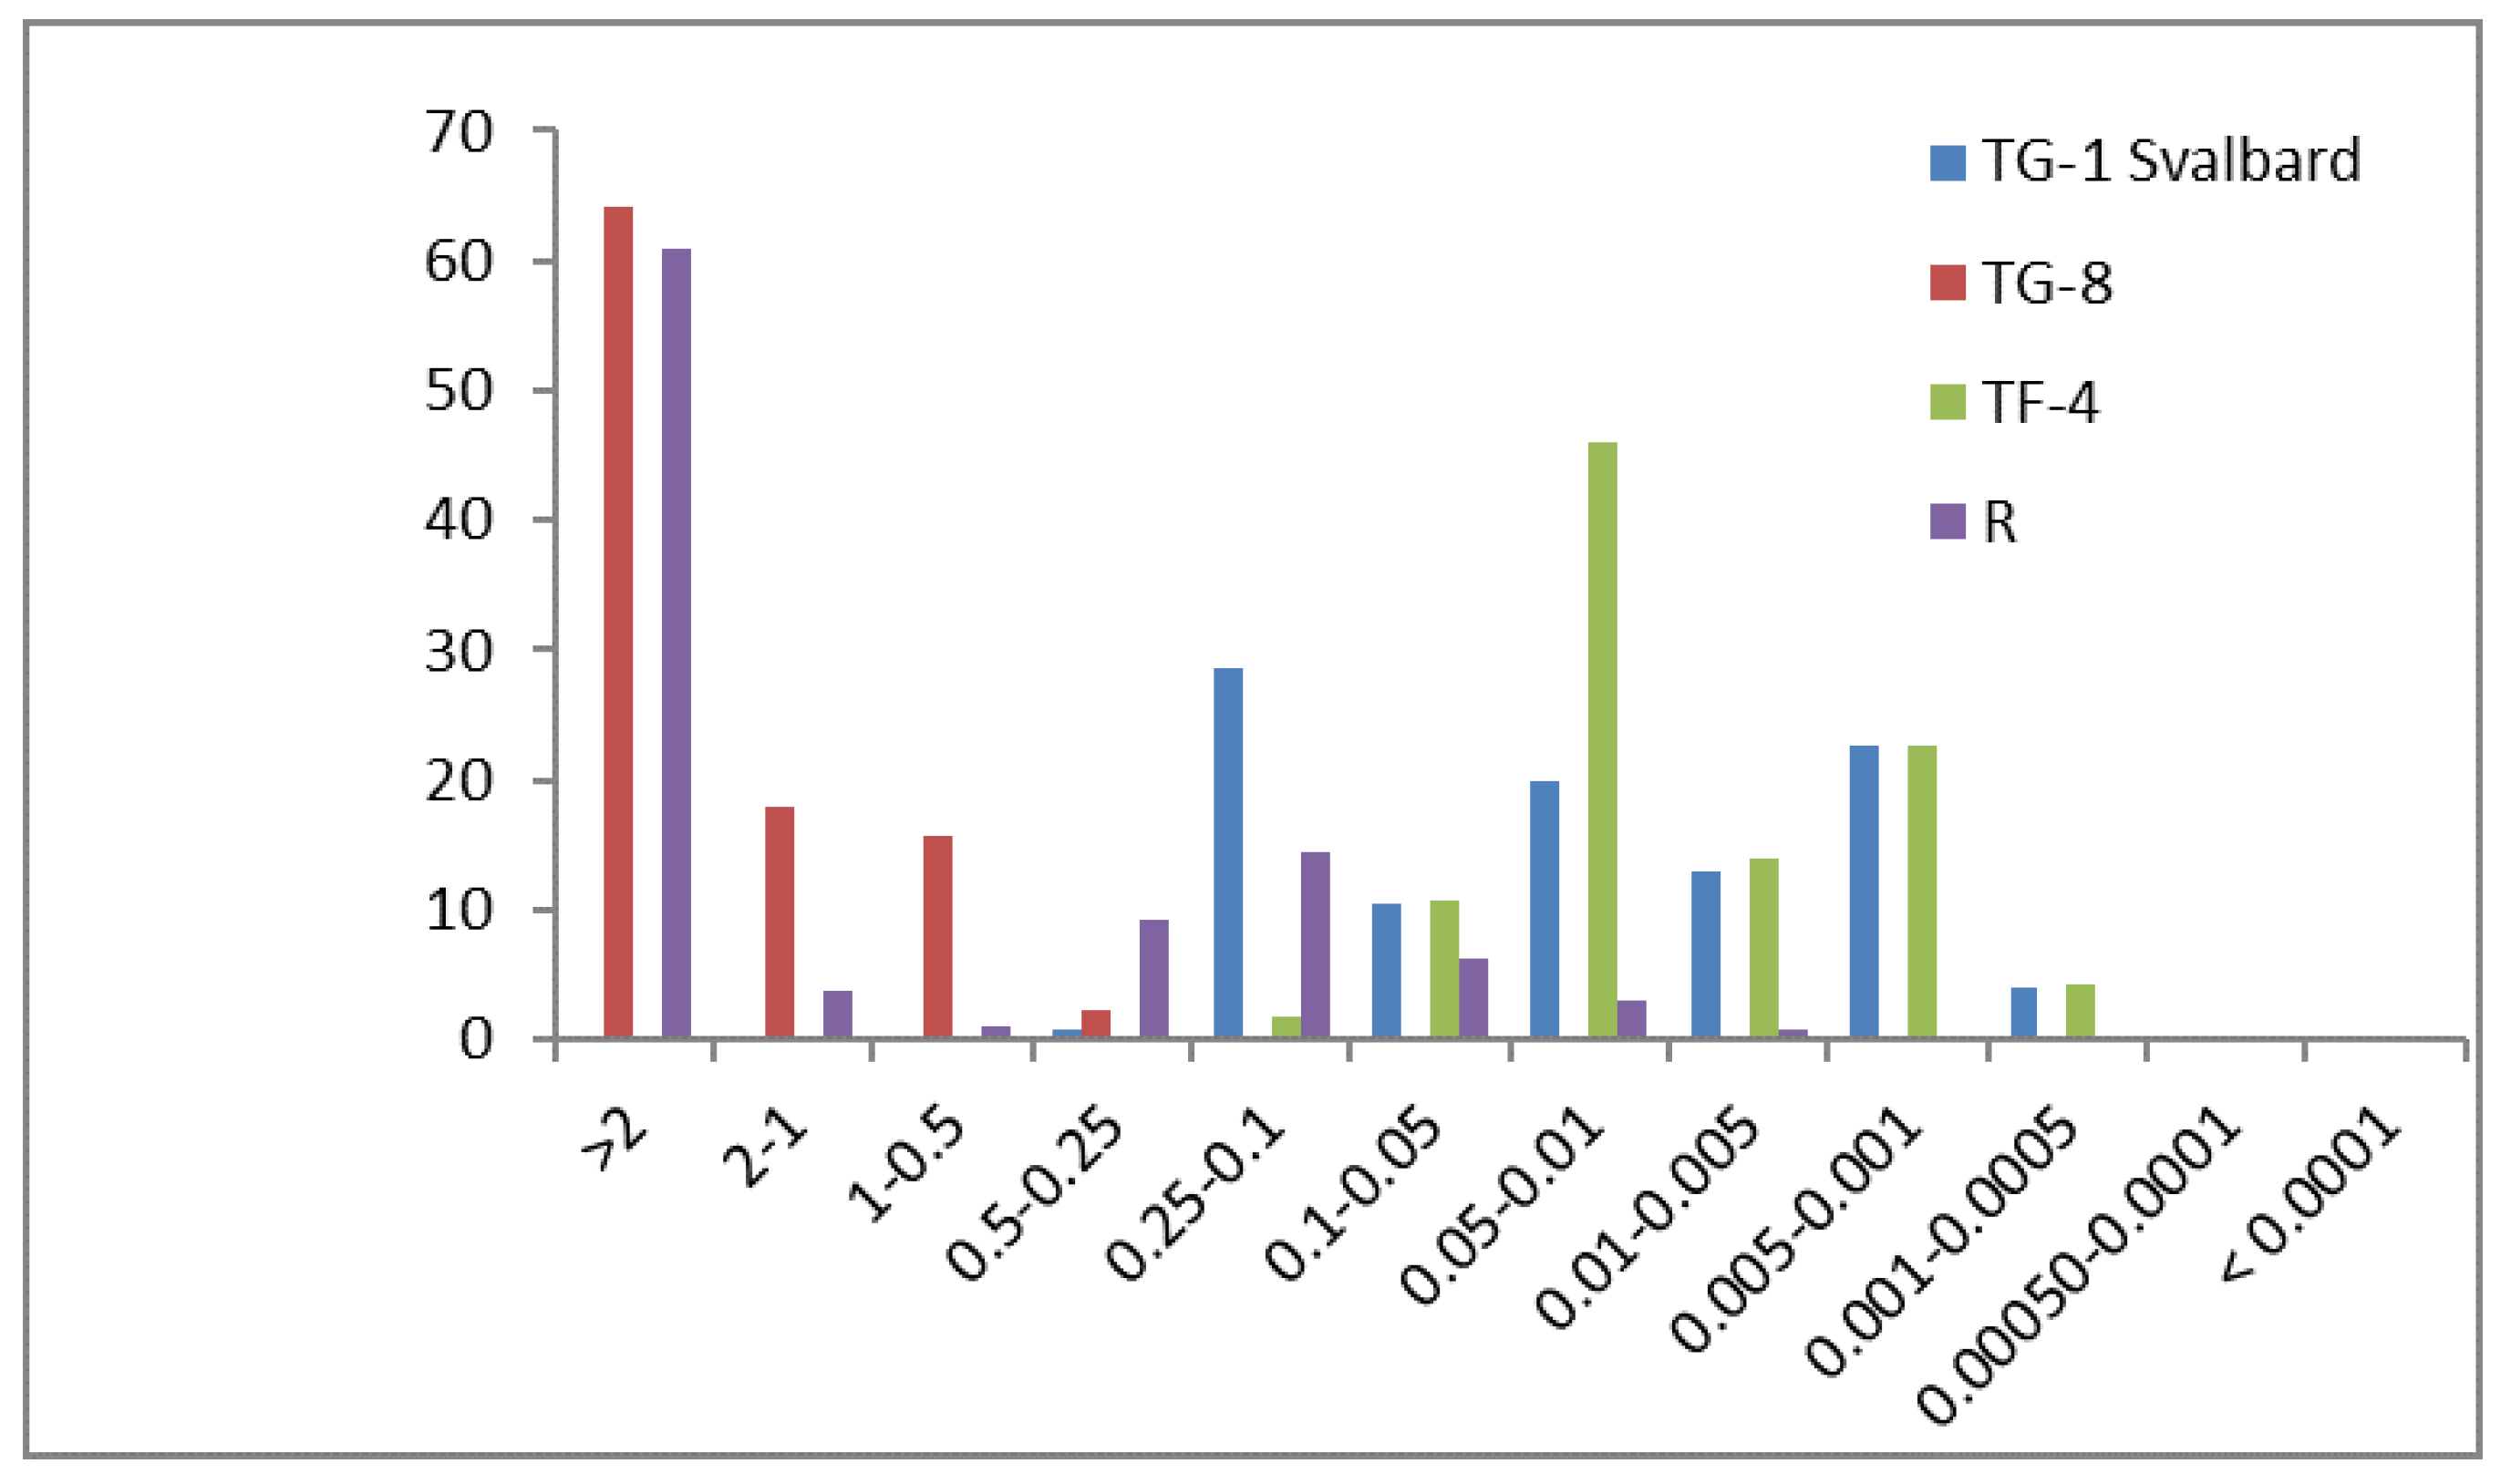
| Station | Grain Size Composition % | Shepard Class | |||
|---|---|---|---|---|---|
| Psephite | Sand | Silt | Clay | ||
| TG-1 | 0 | 29.54 | 30.53 | 39.94 | Sand/silt/clay |
| TF-4 | 0 | 1.85 | 56.94 | 41.21 | Clayey silt |
| TG-8 | 82.15 | 17.84 | 0 | 0.00 | Sandy psephite |
| R | 64.69 | 24.79 | 9.40 | 1.12 | Sandy psephite |

| Sample_ID | Depth | NH4 (µM) | P-PO4 (µM) | NO2 + NO3 (µM) | DOC (µM) | Si (µM) | TIC, µM | Alk, µM |
|---|---|---|---|---|---|---|---|---|
| TG-1 | 80 | 139 | 3.55 | 1.43 | 8318.07 | 199.36 | ||
| TF-4 | 51 | 0 | 1.29 | 17.13 | 5703.58 | 238.52 | ||
| TG-8 | 0 | 172 | 22.60 | 46.40 | 899.25 | 142.40 | 10.8 | 1.5 |
| H | 111 | 4.84 | 5.00 | 8301.42 | 206.48 |
| Sample_ID | Matrix | pH In Situ | P-PO4 (µM) | NO2 + NO3 (µM) | DOC (µM) | Si (µM) |
|---|---|---|---|---|---|---|
| TGSI | Seawater ice | 6.54 | 0.45 | 2.00 | 8.33 | 3.56 |
| TGSN | Snow | 8.12 | 0.19 | 0.29 | 17.49 | 8.19 |
| TGFI | Fresh water ice | 8.12 | 0.10 | 0.21 | 10.82 | 2.85 |
| TGGI | Glacier ice | 7.53 | 0.03 | 0.21 | 18.32 | 1.28 |
| Parameter | Total Carbon (TC) % | Total Inorganic Carbon (TIC) % | Total Organic Carbon (TOC) % | |
|---|---|---|---|---|
| Samples | ||||
| TG-1 | 12.06.2017 | 4.42 | 3.49 | 0.93 |
| TF-4 | 14.06.2017 | 5.27 | 5.03 | 0.24 |
| TG-8 | 14.06.2017 | 0.53 | 0.08 | 0.45 |
| R | 12.06.2017 | 8.76 | 9.20 | <0.1 |
| Parameters/Expeditions | 19 February 2011 | 17–19 March 2014 | 11–17 June 2017 | 17–18 June 2015 | 6 September 2011 | |
|---|---|---|---|---|---|---|
| O2 | glacier | 353.1 ± 3.7 | 359.3 ± 27.8 | 392.4 | 357.4 ± 28.4 | 366.2 |
| outer fjord | 350.3 | 331.7 ± 4.8 | 393.2 | 369.2 | 333.6 | |
| pH | glacier | 7.75 ± 0.01 | 8.18 ± 0.02 | 8.46 | 8.39 ± 0.02 | 8.33 |
| outer fjord | 7.76 | 8.2 ± 0.01 | 8.37 | 8.5 | 8.3 | |
| Alk | glacier | 2352 ± 5 | 2353 ± 17 | 1475 | 1956 ± 346 | 1757 |
| outer fjord | 2345 | 2384 ± 7 | 2238 | 2225 | 1988 | |
| PO4 | glacier | 0.49 ± 0.07 | 0.83 ± 0.04 | 0.16 | 0.18 ± 0.02 | 1.03 |
| outer fjord | 0.55 | 0.84 ± 0.0 | 0.26 | 0.16 | 0.26 | |
| NO3 | glacier | 6.76 ± 0.49 | 9.24 ± 0.11 | 1.21 | 0.82 ± 0.45 | 1.29 |
| outer fjord | 7.29 | 9.43 ± 0.1 | 0.14 | 0.14 | 0.43 | |
| Si | glacier | 10.23 ± 3.12 | 15.31 ± 8.24 | 18.87 | 4.04 ± 1.97 | 46.93 |
| outer fjord | 6.04 | 10.52 ± 0.13 | 3.1 | 2.64 | 12.82 | |
| TIC | glacier | 2156 ± 10 | 2223 ± 22 | 1387 | 1763 ± 312 | 1592 |
| outer fjord | 2166.67 | 2247 ± 12 | 2026 | 2010 | 1799 | |
| DOC | glacier | 60.0 ± 11.2 | 75.8 | 133.3 ± 47.1 | ||
| outer fjord | 60.4 ± 0.6 | 80.8 | 100.0 | |||
| Ωar | glacier | 1.31 ± 0.02 | 1.52 ± 0.06 | 1.8 ± 0.48 | 1.4 | |
| outer fjord | 1.35 | 1.61 ± 0.03 | 2.81 | 1.77 | ||
| Parameters/Expeditions | 19 February 2011 | 17–19 March 2014 | 11–17 June 2017 | 17–18 June 2015 | 6 September 2011 | |
|---|---|---|---|---|---|---|
| O2 | glacier | 347.8 ± 3.4 | 348.1 ± 9.0 | 323.05 | 328.2 ± 6.1 | 320.8 |
| outer fjord | 354.7 | 302.8 ± 62.9 | 360.2 ± 36.8 | 341.6 | 327.0 | |
| pH | glacier | 7.74 ± 0.01 | 8.21 ± 0.04 | 8.24 | 8.21 ± 0.07 | 8.24 |
| outer fjord | 7.76 | 8.21 ± 0.0 | 8.32 ± 0.11 | 8.34 | 8.22 | |
| Alk | glacier | 2344 ± 16 | 2374. ± 8. | 2323 | 2361 ± 42 | 2279. |
| outer fjord | 2343 | 2369. ± 0.9 | 2302. ± 22.7 | 2356.1 | 2279.9 | |
| PO4 | glacier | 0.53 ± 0.02 | 1.1 ± 0.58 | 0.84 | 0.94 ± 0.14 | 0.55 |
| outer fjord | 0.52 | 0.94 ± 0.0 | 0.5 ± 0.27 | 0.52 | 0.48 | |
| NO3 | glacier | 7.0 ± 0.07 | 9.37 ± 0.37 | 7.49 | 6.36 ± 4.14 | 1.14 |
| outer fjord | 6.86 | 9.61 ± 0.05 | 2.19 ± 2.94 | 4.14 | 1.0 | |
| Si | glacier | 6.35 ± 1.16 | 20.92 ± 21.05 | 8.9 | 14.34 ± 7.0 | 23.96 |
| outer fjord | 5.96 | 12.34 ± 0.18 | 3.99 ± 2.77 | 5.46 | 21.5 | |
| TIC | glacier | 2156 ± 13 | 2246 ± 1.8 | 2203. | 2216 ± 34 | 2144 |
| outer fjord | 2175 | 2252 ± 2 | 1809 ± 500. | 2211 | 2123 | |
| DOC | glacier | 58.8 ± 7.3 | 74.1 | 101.3 ± 33.6 | ||
| outer fjord | 62.5 | 53.3 ± 46.3 | 108.3 | |||
| Ωar | glacier | 1.3 ± 0.04 | 1.5 ± 0.34 | 1.58 ± 0.21 | 2.1 | |
| outer fjord | 1.34 | 1.66 ± 0.0 | 2.06 | 1.91 | ||
| Date | St.№ | Latitude | Longitude | Parameters | Media | ||||||||||||
|---|---|---|---|---|---|---|---|---|---|---|---|---|---|---|---|---|---|
| T and S | Nutrients | Carbonate System | Trace Metals | Seawater | River Water | Sea ice Cores | Drifting Sea ice | River Ice | Glacial Ice | Snow | Sea sediments | River Bed sediments | Abrasive Cliff | ||||
| 19 February 2011 | T4 | 78.45325 | 17.34700 | X | X | X | X | ||||||||||
| 19 February 2011 | T5 | 78.44022 | 17.40878 | X | X | X | X | ||||||||||
| 19 February 2011 | T1 | 78.44415 | 17.36887 | X | X | X | X | ||||||||||
| 19 February 2011 | T7 | 78.39082 | 16.87540 | X | X | X | X | ||||||||||
| 06 September 2011 | TS1 | 78.44392 | 17.36030 | X | X | X | X | ||||||||||
| 06 September 2011 | TS2 | 78.42430 | 17.18807 | X | X | X | X | ||||||||||
| 17/03/2014 | TM1 | 78.44622 | 17.37732 | X | X | X | X | X | |||||||||
| 17 March 2014 | TM2 | 78.42933 | 17.28628 | X | X | X | X | X | |||||||||
| 18 March 2014 | TM3 | 78.43598 | 17.33338 | X | X | X | X | X | |||||||||
| 19 March 2014 | TM4 | 78.37632 | 16.84408 | X | X | X | X | X | |||||||||
| 19 March 2014 | TM5 | 78.37537 | 16.78647 | X | X | X | X | ||||||||||
| 17 June 2015 | TJ1 | 78.43347 | 17.23838 | X | X | X | X | X | |||||||||
| 17 June 2015 | TJ2 | 78.43752 | 17.17472 | X | X | X | X | X | |||||||||
| 17 June 2015 | TJ3 | 78.40668 | 17.08752 | X | X | X | X | X | |||||||||
| 12 June 2017 | TG1 | 78.40668 | 17.09198 | X | X | X | X | X | X | ||||||||
| 14 June 2017 | TF4 | 78.43581 | 17.29440 | X | X | X | X | X | X | ||||||||
| 13 June 2017 | R | 78.42172 | 17.05333 | X | X | X | X | X | X | ||||||||
| 12 June 2017 | TGSI | 78.42172 | 17.05333 | X | X | X | X | ||||||||||
| 12 June 2017 | TGSN | 78.42172 | 17.05333 | X | X | X | X | ||||||||||
| 12 June 2017 | TGFI | 78.42172 | 17.0533 | X | X | X | X | ||||||||||
| 12 June 2017 | TGGI | 78.43483 | 17.29747 | X | X | X | X | ||||||||||
| 13 June 2017 | H | 78.24030 | 15.55513 | X | X | ||||||||||||
References
- IASC. 2020 State of Arctic Science Report; The International Arctic Science Committee: Akureyri, Iceland, 2020. [Google Scholar]
- IPCC. Climate Change 2014: Synthesis Report. Contribution of Working Groups I, II and III to the Fifth; IPCC: Geneva, Switzerland, 2014. [Google Scholar]
- Overpeck, J.; Hughen, K.; Hardy, D.; Bradley, R.; Case, R.; Douglas, M.; Finney, B.; Gajewski, K.; Jacoby, G.; Jennings, A.; et al. Arctic environmental change of the last four centuries. Science 1997, 278, 1251–1256. [Google Scholar] [CrossRef] [Green Version]
- Overland, J.E.; Wang, M.; Salo, S. The recent Arctic warm period. Tellus Ser. A Dyn. Meteorol. Oceanogr. 2008, 60 A, 589–597. [Google Scholar] [CrossRef]
- Stroeve, J.; Serreze, M.; Drobot, S.; Gearheard, S.; Holland, M.; Maslanik, J.; Meier, W.; Scambos, T. Arctic sea ice extent plummets in 2007. Eos 2008, 89, 13–14. [Google Scholar] [CrossRef]
- Min, S.K.; Zhang, X.; Zwiers, F. Human-induced Arctic moistening. Science 2008, 320, 518–520. [Google Scholar] [CrossRef] [PubMed]
- McClelland, J.W.; Déry, S.J.; Peterson, B.J.; Holmes, R.M.; Wood, E.F. A pan-arctic evaluation of changes in river discharge during the latter half of the 20th century. Geophys. Res. Lett. 2006, 33, L06715. [Google Scholar] [CrossRef] [Green Version]
- Bellerby, R.G.J.; Olsen, A.; Furevik, T.; Anderson, L.G. Response of the surface ocean CO2 system in the Nordic seas and northern North Atlantic to climate change. In The Nordic Seas: An Integrated Perspectiv: Oceanography, Climatology, Biogeochemistry, and Modeling; American Geophysical Union: Washington, DC, USA, 2005; Volume 158, pp. 189–197. ISBN 978-0-87590-423-8. [Google Scholar]
- AMAP. Snow, Water, Ice and Permafrost in the Arctic (SWIPA); Arctic Monitoring and Assessment Programme: Oslo, Norway, 2017. [Google Scholar]
- Hoegh-Guldberg, O.; Mumby, P.J.; Hooten, A.J.; Steneck, R.S.; Greenfield, P.; Gomez, E.; Harvell, C.D.; Sale, P.F.; Edwards, A.J.; Caldeira, K.; et al. Coral reefs under rapid climate change and ocean acidification. Science 2007, 318, 1737–1742. [Google Scholar] [CrossRef] [PubMed] [Green Version]
- Steinacher, M.; Joos, F.; Frölicher, T.L.; Plattner, G.K.; Doney, S.C. Imminent ocean acidification in the Arctic projected with the NCAR global coupled carbon cycle-climate model. Biogeosciences 2009, 6, 515–533. [Google Scholar] [CrossRef] [Green Version]
- Semiletov, I.; Pipko, I.; Gustafsson, Ö.; Anderson, L.G.; Sergienko, V.; Pugach, S.; Dudarev, O.; Charkin, A.; Gukov, A.; Bröder, L.; et al. Acidification of East Siberian Arctic Shelf waters through addition of freshwater and terrestrial carbon. Nat. Geosci. 2016, 9, 361–365. [Google Scholar] [CrossRef]
- Bellerby, R.G.J.; Schulz, K.G.; Riebesell, U.; Neill, C.; Nondal, G.; Heegaard, E.; Johannessen, T.; Brown, K.R. Marine ecosystem community carbon and nutrient uptake stoichiometry under varying ocean acidification during the PeECE III experiment. Biogeosciences 2008, 5, 1517–1527. [Google Scholar] [CrossRef] [Green Version]
- Semiletov, I.P.; Pipko, I.I.; Repina, I.; Shakhova, N.E. Carbonate chemistry dynamics and carbon dioxide fluxes across the atmosphere—ice—water interfaces in the Arctic Ocean: Pacific sector of the Arctic. J. Mar. Syst. 2007, 66, 204–226. [Google Scholar] [CrossRef]
- Semiletov, I.P.; Shakhova, N.E.; Sergienko, V.I. On carbon transport and fate in the East Siberian Arctic land—shelf—atmosphere system. Environ. Res. Lett. 2012, 7, 015201. [Google Scholar] [CrossRef]
- Shakhova, N.; Semiletov, I.; Chuvilin, E. Understanding the permafrost–hydrate system and associated methane releases in the east siberian arctic shelf. Geosciences 2019, 9, 251. [Google Scholar] [CrossRef] [Green Version]
- Tesi, T.; Muschitiello, F.; Smittenberg, R.H.; Jakobsson, M.; Vonk, J.E.; Hill, P.; Andersson, A.; Kirchner, N.; Noormets, R.; Dudarev, O.; et al. Massive remobilization of permafrost carbon during post-glacial warming. Nat. Commun. 2016, 7, 13653. [Google Scholar] [CrossRef] [PubMed] [Green Version]
- Vonk, J.E.; Sánchez-García, L.; van Dongen, B.E.; Alling, V.; Kosmach, D.; Charkin, A.; Semiletov, I.P.; Dudarev, O.V.; Shakhova, N.; Roos, P.; et al. Activation of old carbon by erosion of coastal and subsea permafrost in Arctic Siberia. Nature 2012, 489, 137–140. [Google Scholar] [CrossRef]
- Pogojeva, M.; Yakushev, E.; Ilinskaya, A.; Polukhin, A.; Braaten, H.; Kristiansen, T. Experimental study of the influence of thawing permafrost on the chemical properties of sea water. Russ. J. Earth Sci. 2018, 18, 2–7. [Google Scholar] [CrossRef] [Green Version]
- Hagen, J.O.; Liestøl, O.; Roland, E.; Jørgensen, T. Glacier atlas of Svalbard and Jan Mayen; Norsk Polarinstitutt Meddelelser: Oslo, Norway, 1993; p. 144. [Google Scholar]
- Kohler, J.; James, T.D.; Murray, T.; Nuth, C.; Brandt, O.; Barrand, N.E.; Aas, H.F.; Luckman, A. Acceleration in thinning rate on west- ern Svalbard glaciers. Geophys. Res. Lett. 2007, 34. [Google Scholar] [CrossRef] [Green Version]
- Nuth, C.; Moholdt, G.; Kohler, J.; Hagen, J.O.; Kääb, A. Svalbard glacier elevation changes and contribution to sea level rise. J. Geophys. Res 2010, 115. [Google Scholar] [CrossRef] [Green Version]
- Moholdt, G.; Hagen, J.O.; Eiken, T.; Schuler, T.V. Geometric changes and mass balance of the Austfonna ice cap, Svalbard. Cryosphere 2010, 4, 21–34. [Google Scholar] [CrossRef] [Green Version]
- Polyakov, I.V.; Pnyushkov, A.V.; Alkire, M.B.; Ashik, I.M.; Baumann, T.M.; Carmack, E.C.; Goszczko, I.; Guthrie, J.; Ivanov, V.V.; Kanzow, T.; et al. Greater role for Atlantic inflows on sea-ice loss in the Eurasian Basin of the Arctic Ocean. Science 2017, 356, 285–291. [Google Scholar] [CrossRef] [Green Version]
- Fransson, A.; Chierici, M.; Nomura, D.; Granskog, M.A.; Kristiansen, S.; Martma, T.; Nehrke, G. Effect of glacial drainage water on the CO2 system and ocean acidification state in an Arctic tidewater-glacier fjord during two contrasting years. J. Geophys. Res. C Ocean. 2015, 120, 2413–2429. [Google Scholar] [CrossRef] [Green Version]
- Nilsen, F.; Cottier, F.R.; Skogseth, R.; Mattson, S. Fjord–shelf exchanges controlled by ice and brine production: The interannual variation of Atlantic Water in Isfjorden, Svalbard. Cont. Shelf Res. 2008, 28, 1838–1853. [Google Scholar] [CrossRef]
- McGovern, M.; Pavlov, A.K.; Deininger, A.; Granskog, M.A.; Leu, E.; Søreide, J.E.; Poste, A.E. Terrestrial Inputs Drive Seasonality in Organic Matter and Nutrient Biogeochemistry in a High Arctic Fjord System (Isfjorden, Svalbard). Front. Mar. Sci. 2020, 7, 747. [Google Scholar] [CrossRef]
- Yakushev, E.V.; Makkaveev, P.N.; Polukhin, A.A.; Protsenko, E.A.; Stepanova, S.V.; Khlebopashev, P.V.; Yakubov, S.K.; Staalstrøm, A.; Norli, M. Hydrochemical studies in coastal waters of the Spitsbergen Archipelago in 2014–2015. Oceanology 2016, 56, 763. [Google Scholar] [CrossRef]
- Polukhin, A.; Yakushev, E.; Makkaveev, P.; Protsenko, E.; Yakubov, S.; Stepanova, S.; Khlebopashev, P.; Norli, M.; Braaten, H.; Introduction, I. Influence of melting glaciers on hydrocemical structure of coastal ecosystem of Western Spitsbergen. In Proceedings of the XXVI International Shore Conference "Managing Risks to Coastal Regions and Communities in a Changing World", St. Petersburg, Russia, 22–27 August 2016. [Google Scholar]
- Welty, E.Z.; Bartholomaus, T.C.; Liu, Y.; Riikilä, T.I.; Zwinger, T.; Timonen, J.; Moore, J.C.; Åström, J.A.; Vallot, D.; Schäfer, M.; et al. Termini of calving glaciers as self-organised critical systems. Nat. Geosci. 2014, 7, 874–878. [Google Scholar] [CrossRef]
- Marchenko, A.; Morozov, E.; Muzylev, S. Measurements of sea-ice flexural stiffness by pressure characteristics of flexural-gravity waves. Ann. Glaciol. 2013, 54, 51–60. [Google Scholar] [CrossRef] [Green Version]
- Hansen, H.P.; Koroleff, F. Determination of nutrients. In Methods of Seawater Analysis, 3rd Completely Revised and Extended Edition; Wiley: Hoboken, NJ, USA, 2007; pp. 159–228. ISBN 9783527613984. [Google Scholar]
- Dickson, A.G.; Goyet, C. Handbook of methods for the analysis of the various parameters of the carbon dioxide system in sea water. DOE Handb. 1992, 1994, 22. [Google Scholar]
- Dickson, A.G.; Sabine, C.L.; Christian, J.R. Guide to Best Practices for Ocean CO2 Measurements; PICES Special Publication 3, IOCCP Report No. 8; North Pacific Marine Science Organization: Sidney, BC, Canada, 2007. [Google Scholar]
- Yakushev, E.; Sørensen, K. On seasonal changes of the carbonate system in the Barents Sea Observations and modeling.pdf. Mar. Biol. Res. 2013, 822–830. [Google Scholar] [CrossRef]
- Lewis, E.; Wallace, D. Program developed for CO2 system calculations, Carbon Dioxide Information Analysis Center, managed by Lockheed Martin Energy Research Corporation for the US Department of Energy; NOAA: Asheville, NC, USA, 1998.
- Gundersen, C.B.; Kaste, Ø.; Sample, J.; Fredrik, H.; Braaten, V.; Selvik, J.R.; Hjermann, D.Ø.; Norling, M.D.; Guerrero Calidonio, J.-L. The Norwegian River Monitoring Programme–Water Quality Status and Trends 2017; Norwegian Institute for Water Research: Oslo, Norway, 2018. [Google Scholar]
- Mintrop, L.; Pérez, F.F.; González-Dávila, M.; Santana-Casiano, J.M.; Körtzinger, A. Alkalinity determination by potentiometry: Intercalibration using three different methods. Ciencias Mar. 2000, 26, 23–37. [Google Scholar] [CrossRef] [Green Version]
- Van Heuven, S.; Pierrot, D.; Rae, J.W.B.; Lewis, E.; Wallace, D.W.R. MATLAB Program Developed for CO2 System Calculations; Carbon Dioxide Information Analysis Center Oak Ridge National. Laboratory, U.S. Dept of Energy: Oak Ridge, TN, USA, 2011. [CrossRef]
- Chierici, M.; Fransson, A. Calcium carbonate saturation in the surface water of the Arctic Ocean: Undersaturation in freshwater influenced shelves. Biogeosciences 2009, 6, 2421–2431. [Google Scholar] [CrossRef] [Green Version]
- Flink, A.E.; Noormets, R.; Kirchner, N.; Benn, D.I.; Luckman, A.; Lovell, H. The evolution of a submarine landform record following recent and multiple surges of Tunabreen glacier, Svalbard. Quat. Sci. Rev. 2015, 37–50. [Google Scholar] [CrossRef] [Green Version]
- Canfield, D.E.; Kristensen, E.; Thamdrup, B. Aquatic geomicrobiology. Adv. Mar. Biol. 2005, 48, 1–599. [Google Scholar] [CrossRef]
- Yakushev, E.V.; Protsenko, E.A.; Bruggeman, J.; Wallhead, P.; Pakhomova, S.V.; Yakubov, S.K.; Bellerby, R.G.J.; Couture, R.-M. Bottom RedOx Model (BROM v.1.1): A coupled benthic-pelagic model for simulation of water and sediment biogeochemistry. Geosci. Model Dev. 2017, 10, 453–482. [Google Scholar] [CrossRef] [Green Version]
- Marchenko, A.; Shestov, A.; Karulin, E.; Morozov, E.; Karulina, M.; Bogorodsky, P.; Muzylev, S.; Onishchenko, D.; Makshtas, A. Field studies of sea water and ice properties in Svalbard fjords. In Proceedings of the International Conference on Port and Ocean Engineering under Arctic Conditions, Montreal, QC, Canada, 10–14 July 2011; pp. 120–132. [Google Scholar]
- Chierici, M.; Vernet, M.; Fransson, A.; Børsheim, K.Y. Net community production and carbon exchange from winter to summer in the Atlantic water inflow to the Arctic Ocean. Front. Mar. Sci. 2019, 6, 528. [Google Scholar] [CrossRef] [Green Version]
- Halbach, L.; Vihtakari, M.; Duarte, P.; Everett, A.; Granskog, M.A.; Hop, H.; Kauko, H.M.; Kristiansen, S.; Myhre, P.I.; Pavlov, A.K.; et al. Tidewater glaciers and bedrock characteristics control the phytoplankton growth environment in an Arctic fjord. Front. Mar. Sci. 2019, 6, 254. [Google Scholar] [CrossRef]
- Meire, L.; Mortensen, J.; Rysgaard, S.; Bendtsen, J.; Boone, W.; Meire, P.; Meysman, F.J.R. Spring bloom dynamics in a subarctic fjord influenced by tidewater outlet glaciers (Godthåbsfjord, SW Greenland). J. Geophys. Res. Biogeosci. 2016, 121, 1581–1592. [Google Scholar] [CrossRef] [Green Version]
- Hopwood, M.J.; Carroll, D.; Dunse, T.; Hodson, A.; Holding, J.M.; Iriarte, J.L.; Ribeiro, S.; Achterberg, E.P.; Cantoni, C.; Carlson, D.F.; et al. Review article: How does glacier discharge affect marine biogeochemistry and primary production in the Arctic? Cryosphere 2020, 14, 1347–1383. [Google Scholar] [CrossRef] [Green Version]
- Reiner Vonnahme, T.; Persson, E.; Dietrich, U.; Hejdukova, E.; Dybwad, C.; Elster, J.; Chierici, M.; Gradinger, R. Early spring subglacial discharge plumes fuel under-ice primary production at a Svalbard tidewater glacier. Cryosphere 2021, 15, 2083–2107. [Google Scholar] [CrossRef]
- Lydersen, C.; Assmy, P.; Falk-Petersen, S.; Kohler, J.; Kovacs, K.M.; Reigstad, M.; Steen, H.; Strøm, H.; Sundfjord, A.; Varpe, Ø.; et al. The importance of tidewater glaciers for marine mammals and seabirds in Svalbard. J. Mar. Syst. 2014, 129, 452–471. [Google Scholar] [CrossRef]
- Hagen, J.O.; Kohler, J.; Melvold, K.; Winther, J. Glaciers in Svalbard: Mass balance, runoff and freshwater flux. Polar Res. 2003, 22, 145–159. [Google Scholar] [CrossRef] [Green Version]
- Luckmann, A.; Benn, D.I.; Cottier, F.; Bevan, S.; Nilsen, F.; Inall, M. Calving rates at tidewater glaciers vary strongly with oceantemperature. Nat.Comm. 2015, 6, 1–7. [Google Scholar] [CrossRef] [Green Version]
- Makkaveev, P.N.; Polukhin, A.A.; Khlebopashev, P.V. The surface runoff of nutrients from the coasts of Blagopoluchiya bay of the Novaya Zemlya Archipelago. Oceanology 2013, 53, 539–546. [Google Scholar] [CrossRef]
- Gaston, T.F.; Schlacher, T.A.; Connolly, R.M. Flood discharges of a small river into open coastal waters: Plume traits and material fate. Estuar. Coast. Shelf Sci. 2006, 69, 4–9. [Google Scholar] [CrossRef]
- Zavialov, P.O.; Makkaveev, P.N.; Konovalov, B.V.; Osadchiev, A.A.; Khlebopashev, P.V.; Pelevin, V.V.; Grabovskiy, A.B.; Izhitskiy, A.S.; Goncharenko, I.V.; Soloviev, D.M.; et al. Hydrophysical and hydrochemical characteristics of the sea areas adjacent to the estuaries of small rivers if the Russian coast of the Black Sea. Oceanology 2014, 265–280. [Google Scholar] [CrossRef]
- Torsvik, T.; Albretsen, J.; Sundfjord, A.; Kohler, J.; Sandvik, A.D.; Skarghamar, J.; Lindbäck, K.; Everett, A. Impact of tidewater glacier retreat on the fjord system: Modeling present and future circulation in Kongsfjorden, Svalbard. Estuar. Coast. Shelf Sci. 2019, 220, 152–165. [Google Scholar] [CrossRef]
- Błaszczyk, M.; Ignatiuk, D.; Uszczyk, A.; Cielecka-Nowak, K.; Grabiec, M.; Jania, J.A.; Moskalik, M.; Walczowski, W. Freshwater input to the Arctic fjord Hornsund (Svalbard). Polar Res. 2019, 38, 3506. [Google Scholar] [CrossRef]
- Fraser, N.J.; Skogseth, R.; Nilsen, F.; Inall, M.E. Circulation and exchange in abroad Arctic fjord using glider-based observations. Polar Res. 2018, 37. [Google Scholar] [CrossRef] [Green Version]
- Adakudlu, M.; Andresen, J.; Bakke, J.; Beldring, S.; Benestad, R.; Bilt, W.; Bogen, J.; Borstad, C.; Breili, K.; Breivik, Ø.; et al. Climate in Svalbard 2100—A Knowledge Base for Climate Adaptation; Norwegian Environment Agency: Trondheim, Norway, 2019. [Google Scholar]
- Van Pelt, W.J.J.; Pohjola, V.A.; Reijmer, C.H. The changing impact of snow conditions and refreezing on the mass balance of an idealized Svalbard Glacier. Front. Earth Sci. 2019. [Google Scholar] [CrossRef]
- Pogojeva, M.P.; Yakushev, E.V.; Petrov, I.N.; Yaeski, E.A. Experimental study of the permafrost thawing effect on the content of nutrients and heavy metals in seawater during abrasion destruction of the Arctic coast. Arct. Ecol. Econ. 2021, 11, 67–75. [Google Scholar] [CrossRef]


Publisher’s Note: MDPI stays neutral with regard to jurisdictional claims in published maps and institutional affiliations. |
© 2022 by the authors. Licensee MDPI, Basel, Switzerland. This article is an open access article distributed under the terms and conditions of the Creative Commons Attribution (CC BY) license (https://creativecommons.org/licenses/by/4.0/).
Share and Cite
Pogojeva, M.; Polukhin, A.; Makkaveev, P.; Staalstrøm, A.; Berezina, A.; Yakushev, E. Arctic Inshore Biogeochemical Regime Influenced by Coastal Runoff and Glacial Melting (Case Study for the Templefjord, Spitsbergen). Geosciences 2022, 12, 44. https://0-doi-org.brum.beds.ac.uk/10.3390/geosciences12010044
Pogojeva M, Polukhin A, Makkaveev P, Staalstrøm A, Berezina A, Yakushev E. Arctic Inshore Biogeochemical Regime Influenced by Coastal Runoff and Glacial Melting (Case Study for the Templefjord, Spitsbergen). Geosciences. 2022; 12(1):44. https://0-doi-org.brum.beds.ac.uk/10.3390/geosciences12010044
Chicago/Turabian StylePogojeva, Maria, Alexander Polukhin, Petr Makkaveev, André Staalstrøm, Anfisa Berezina, and Evgeniy Yakushev. 2022. "Arctic Inshore Biogeochemical Regime Influenced by Coastal Runoff and Glacial Melting (Case Study for the Templefjord, Spitsbergen)" Geosciences 12, no. 1: 44. https://0-doi-org.brum.beds.ac.uk/10.3390/geosciences12010044